Article

Effects of Reynolds Number on the Energy Conversion and Near-Wake Dynamics of a High Solidity Vertical-Axis Cross-Flow Turbine

Center for Ocean Renewable Energy, University of New Hampshire, 24 Colovos Rd., Durham, NH 03824, USA
*
Author to whom correspondence should be addressed.
Energies 2016, 9(2), 73; https://doi.org/10.3390/en9020073
Submission received: 1 November 2015 / Revised: 14 January 2016 / Accepted: 15 January 2016 / Published: 26 January 2016
(This article belongs to the Special Issue Wind Turbine 2015)

Abstract

:
Experiments were performed with a large laboratory-scale high solidity cross-flow turbine to investigate Reynolds number effects on performance and wake characteristics and to establish scale thresholds for physical and numerical modeling of individual devices and arrays. It was demonstrated that the performance of the cross-flow turbine becomes essentially R e -independent at a Reynolds number based on the rotor diameter R e D 10 6 or an approximate average Reynolds number based on the blade chord length R e c 2 × 10 5 . A simple model that calculates the peak torque coefficient from static foil data and cross-flow turbine kinematics was shown to be a reasonable predictor for Reynolds number dependence of an actual cross-flow turbine operating under dynamic conditions. Mean velocity and turbulence measurements in the near-wake showed subtle differences over the range of R e investigated. However, when transport terms for the streamwise momentum and mean kinetic energy were calculated, a similar R e threshold was revealed. These results imply that physical model studies of cross-flow turbines should achieve R e D 10 6 to properly approximate both the performance and wake dynamics of full-scale devices and arrays.

Graphical Abstract

1. Introduction

Scaled physical models are often used in science and engineering to approximate real-world systems. The principle of dynamic similarity allows for geometrically-scaled systems to be dynamically identical if certain nondimensional physical parameters are matched. In the case of fluid systems, the most important nondimensional parameter is often the Reynolds number, R e , which quantifies the importance of inertial forces over viscous forces on the flow physics [1]: R e = U l / ν , where U and l are characteristic velocity and length scales, respectively, and ν is the fluid kinematic viscosity. The other common dynamical scale, for systems with a free surface, is the Froude number F r = U / g l , where g is the gravitational acceleration. Matching both the Froude and Reynolds number is not possible for a scaled model in a given fluid, which is illustrated by the relation R e = l 3 / 2 g 1 / 2 F r / ν , since R e scales linearly with l, or the geometric scale. In general, the geometric scale of a physical model is not necessarily the same as its dynamical scale. As such, hereafter, we will use the word “scale” to refer to this dynamical scale or the Reynolds number and assume the Froude number is small enough to be negligible.
With regards to wind and marine hydrokinetic (MHK) turbines, scaled physical models are used to validate predictive numerical models, predict full-scale performance of individual turbines and design or investigate arrays of devices. Scaled models have the benefit of being significantly less expensive; however, a key question is whether or not an acceptable scale mismatch exists. Similarly, it is questionable whether numerical models validated with physical model data obtained orders of magnitude away from prototype scale should be considered validated at all. An example of the errors that can result from the extrapolation of small-scale experiments can be found in [2].
The performance and wake characteristics of cross-flow (often vertical-axis) turbines (CFTs) depend on turbine solidity, blade profile (lift/drag, dynamic stall at reduced frequency of turbine rotation, symmetry, thickness, camber), blade pitch, number of blades, strut drag, operational parameters, such as tip speed ratio, and on the Reynolds number [3]. Note that an average blade chord Reynolds number, R e c , avg λ U c / ν , can be expressed in terms of tip speed ratio λ = ω R / U , where U is the free stream velocity, c is the blade chord length, ν is the fluid kinematic viscosity, ω is the rotor’s angular velocity, and R is the rotor radius. The value of λ at which a turbine reaches peak performance in general decreases with turbine solidity N c / ( π D ) [4], which allows for the use of a simpler Reynolds number based on turbine diameter R e D = U D / ν .
Solidity often directly correlates with the chord-to-radius ratio c / R . Rotors with c / R 0 . 1 are considered to have high solidity [5], for which so-called flow curvature or virtual camber effects become significant [6]. These effects arise from the blade sections’ circular paths and can complicate the comparison with the behavior of an airfoil in a linear flow.
Blackwell et al. [7] investigated the effects of Reynolds number on the performance of a 2 m diameter Darrieus vertical-axis cross-flow wind turbine with NACA 0012 blades. By varying wind tunnel speed, the turbine was made to operate at an approximately constant blade chord Reynolds number R e c ranging from 1 × 10 5 to 3 × 10 5 . In this regime, the turbine power coefficient C P was shown to be sensitive to R e c , with sensitivity diminishing at the higher Reynolds numbers, especially for turbines of lower solidity ( N c / R , where N is the number of blades and R is the turbine’s maximum radius). More recently, Polagye and Cavagnaro [8] observed significant Reynolds number sensitivity for a high solidity helical cross-flow turbine, and Bravo et al. [9] observed the power coefficient of a straight-bladed vertical-axis wind turbine (VAWT) to become Reynolds number independent at R e c 4 × 10 5 . Bachant and Wosnik [10] observed Reynolds number independence of the power coefficient at the optimal tip speed ratio for a high solidity cross-flow turbine at R e D 10 6 or R e c , avg 2 × 10 5 .
The wake of a 2D cross-flow turbine in the dynamic stall regime has been studied via laser Doppler velocimetry by Brochier et al. [11] and in 3D with particle image velocimetry (PIV) by Fujisawa and Shibuya [12]. However, both of these studies were performed at very low Reynolds numbers: R e D = 10 4 and 10 3 , respectively. Tescione et al. [13] studied the wake of a vertical-axis wind turbine at its optimal tip speed ratio in a wind tunnel using stereo PIV at an approximate blade chord Reynolds number R e c = 1 . 7 × 10 5 ; very close to the R e -independence criteria reported in [10], though it was not confirmed if this was indeed a R e -independent state. The two lower R e experiments tended to focus on the effects of dynamic stall, whereas the higher R e experiment mostly concerned the mean velocity and tip vortex effects. Whereas the value of these studies was in elucidating the complex wake dynamics of cross-flow turbines, they also motivated the more systematic investigation of scale effects undertaken here.
Scale effects on axial-flow or horizontal-axis wind turbines are better understood, and investigators have methods for compensating. Krogstad and Adaramola [14] observed Reynolds number independence of the performance of a 0.9 m diameter axial-flow turbine rotor at R e D 5 × 10 5 in wind tunnel tests. Their turbine blades had an S826 profile along their entire span, a profile chosen for its R e -independence. Walker et al. [15] similarly chose a NACA 63-618 foil for their axial-flow turbine tests in a towing tank, which were performed at a mid-span Reynolds number R e c = 4 × 10 5 . McTavish et al. [16] showed how the near-wake expansion for an axial-flow rotor is increased at higher Reynolds numbers, concluding that physical models should be designed with R e -independence in mind if they are to be run at low R e . It is uncertain, however, if these methods work equally well for cross-flow turbines.
When designing or studying arrays, it is common to use very small (geometrically) scaled devices [17,18]. It is therefore important to realize the limitations of evaluating both the power output of turbines and the wake recovery when the Reynolds number is very far from full scale. Sometimes, the models used are not turbines, but wake-generating objects, e.g., porous disks, that are meant to replicate the wakes of real turbines [19]. In this case, it is of interest to determine at what Reynolds number one might be able to realistically study wake flows in an array and also to evaluate the effectiveness of a wake generator. In other words, a wake generator may do a fine job simulating a scaled turbine, but how well can it simulate a full-scale device? Note that for a porous disk, the Reynolds number of interest is based on diameter, since it is the scaling of the far-wake dynamics that matters.
Vertical-axis wind turbine array field experiments have revealed that improved wake recovery allows for closer spacing when compared to conventional axial-flow propeller-type turbines [20,21]. It was observed experimentally that a high solidity vertical-axis cross-flow turbine’s near-wake produces a unique vertical mean velocity field, generated by blade tip vortex shedding, the advection by which is the largest contributor to streamwise momentum and energy transport or recovery [22]. In this study, we seek to replicate those same momentum and energy balance considerations at multiple Reynolds numbers, to examine the implications on how scaled, i.e., low Reynolds number experiments, may be used to study flows in turbine arrays.

Modes of Reynolds Number Dependence

It is of interest to examine how Reynolds number scaling affects both the blade loading, i.e., turbine performance, and the near-wake. Typically, static airfoil data show that the static stall angle increases with blade chord Reynolds number R e c [23]. A review of Reynolds number effects on airfoil behavior is presented in [24]. In general, airfoil performance, often characterized by the profile’s lift-to-drag ratio, is enhanced as the boundary layer on the foil transitions to turbulence closer to the leading edge, which enables it to advance further downstream against the adverse pressure gradient on the suction side, delaying separation to higher angles of attack. For smooth airfoils, this transition can cause a dramatic increase in foil performance at a blade chord Reynolds number on the order of 10 5 [25]. Note that there is a distinct lack of highly reliable data for airfoils in this transitional regime and below. An evaluation of the various databases relevant to cross-flow turbines is presented in [26].
Static foil performance does not tell the whole story for a cross-flow turbine. The azimuthal, and therefore, temporal, variation of α in a cross-flow turbine implies dynamic loading, encountering dynamic stall for tip speed ratios near and below those of maximum rotor torque [3]. Bousman [27] states that dynamic stall is relatively insensitive to Reynolds number for R e = 1 . 0 × 10 5 to 2 . 5 × 10 5 , judging from measurements on a pitching VR-7 foil in a wind and water tunnel, since the loading is dominated by vortex shedding. However, Singleton and Yeager Jr. [28] state that the effect of Reynolds number on dynamic stall remains an unsolved question.
Despite lower lift on the blades at lower R e , we expect stronger tip vortex shedding [29]. As mentioned previously, the dynamic stall vortex shedding is not expected to be highly sensitive to Reynolds number, though a larger separation bubble at lower R e may induce higher levels of turbulence as shed vortices become unstable and break down.
Chamorro et al. [30] showed that turbulence statistics in an horizontal-axis or axial-flow wind turbine wake became R e -independent at R e D 1 × 10 5 and that mean velocity profiles became R e -independent slightly earlier at R e D 5 × 10 4 . Note that in this study, the tip chord Reynolds number was not reported, but is estimated to be R e c 4 × 10 4 at R e D = 1 × 10 5 . It is therefore our objective to observe similar scaling relationships for a cross-flow turbine near-wake.

2. Experimental Setup

Experiments were performed in a turbine test bed specifically designed for cross-flow turbines. The test bed was integrated as part of the University of New Hampshire (UNH) tow tank, which is a 36 m-long facility with a 3.66 m-wide and 2.44 m-deep cross-section. The turbine model used in this study was the UNH Reference Vertical Axis Turbine (RVAT), which was designed to be a generic case for numerical model testing, similar to the Sandia National Labs/U.S. Department of Energy Reference Model 2 (RM2) River Turbine [31], but with a higher solidity or blade chord-to-radius ratio.
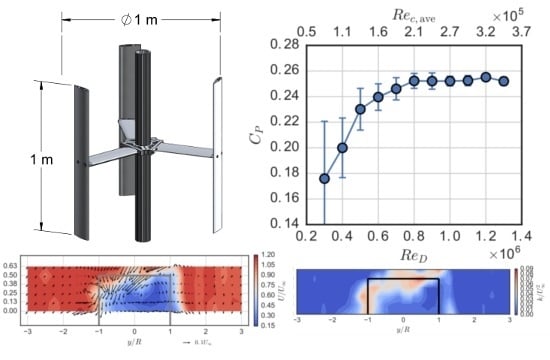
The UNH-RVAT turbine has three blades made from NACA 0020 profiles with a 0.14 m chord. The blades are mounted at mid-chord w.r.t. the turbine axis, and the turbine has a height (blade span) of 1 m and a diameter of 1 m; cf. Figure 1. The blockage ratio produced by the rotor’s frontal area is 11%, which we decided not to correct for, as reliable methods are not yet agreed upon for CFTs [32]. As such, blockage should be taken into account when using these data for model validation, i.e., the experimental domain should be mimicked. The rotor has a relatively high solidity N c / ( π D ) = 0 . 13 and a large chord-to-radius ratio c / R = 0 . 28 . A CAD model of the turbine is available from [33].
Figure 1. University of New Hampshire Reference Vertical Axis Turbine (UNH-RVAT) turbine model. Turbine blades and struts made from NACA 0020 profiles with 0.14 m chord. Note that the upper and lower mounting flanges have been excluded, as these were included in the tare drag measurements.
Energies 09 00073 g001
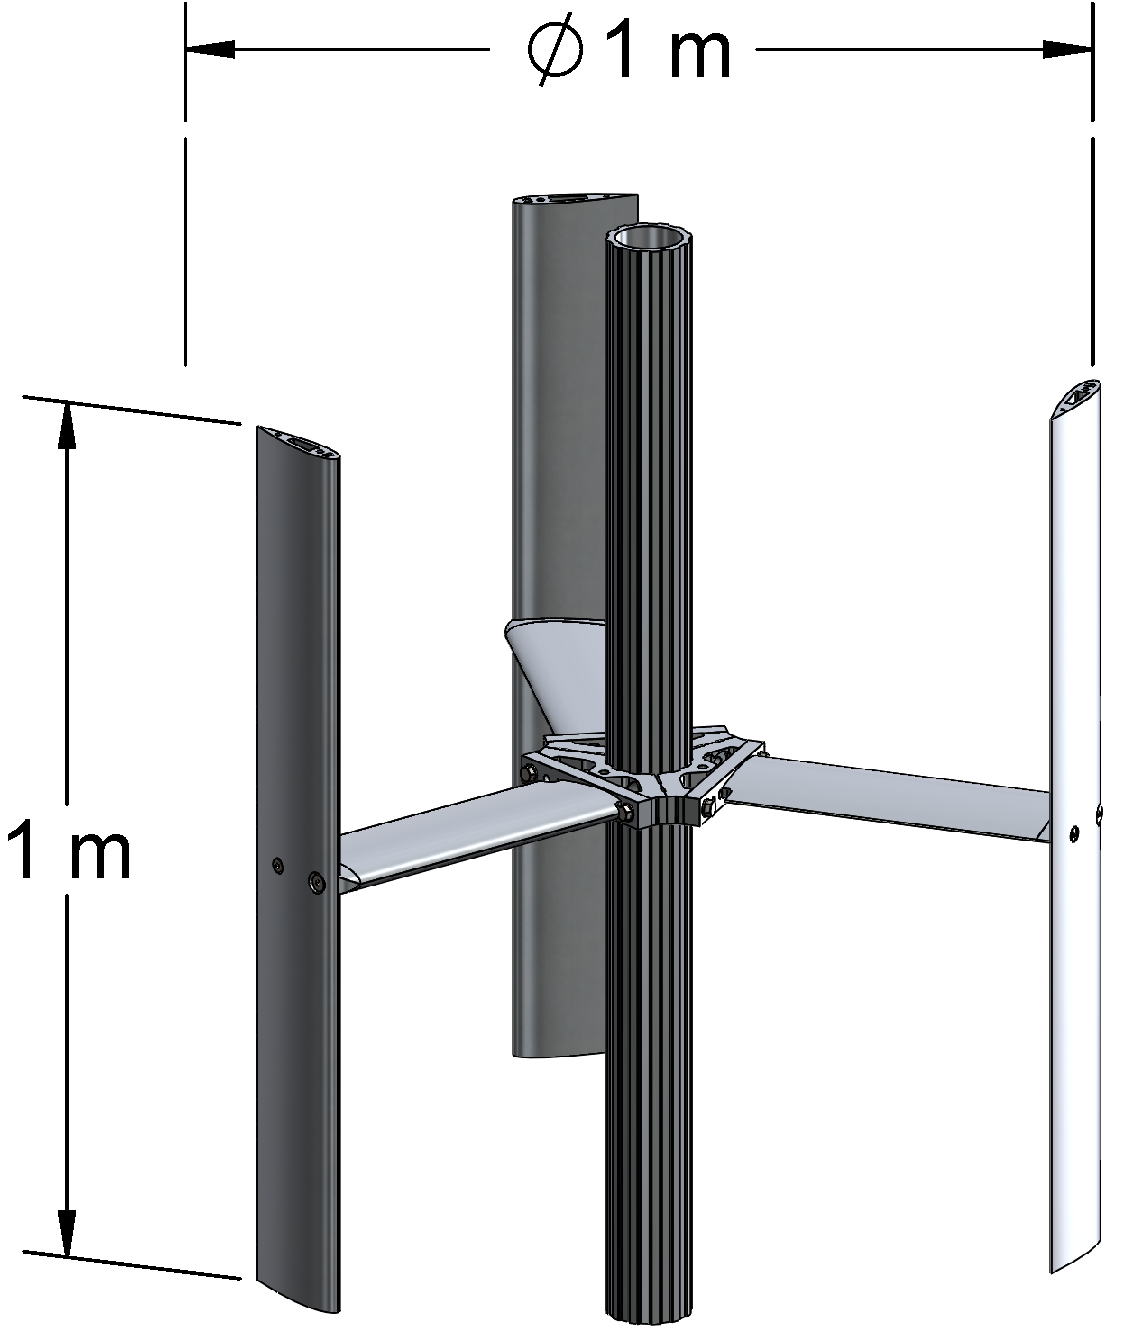
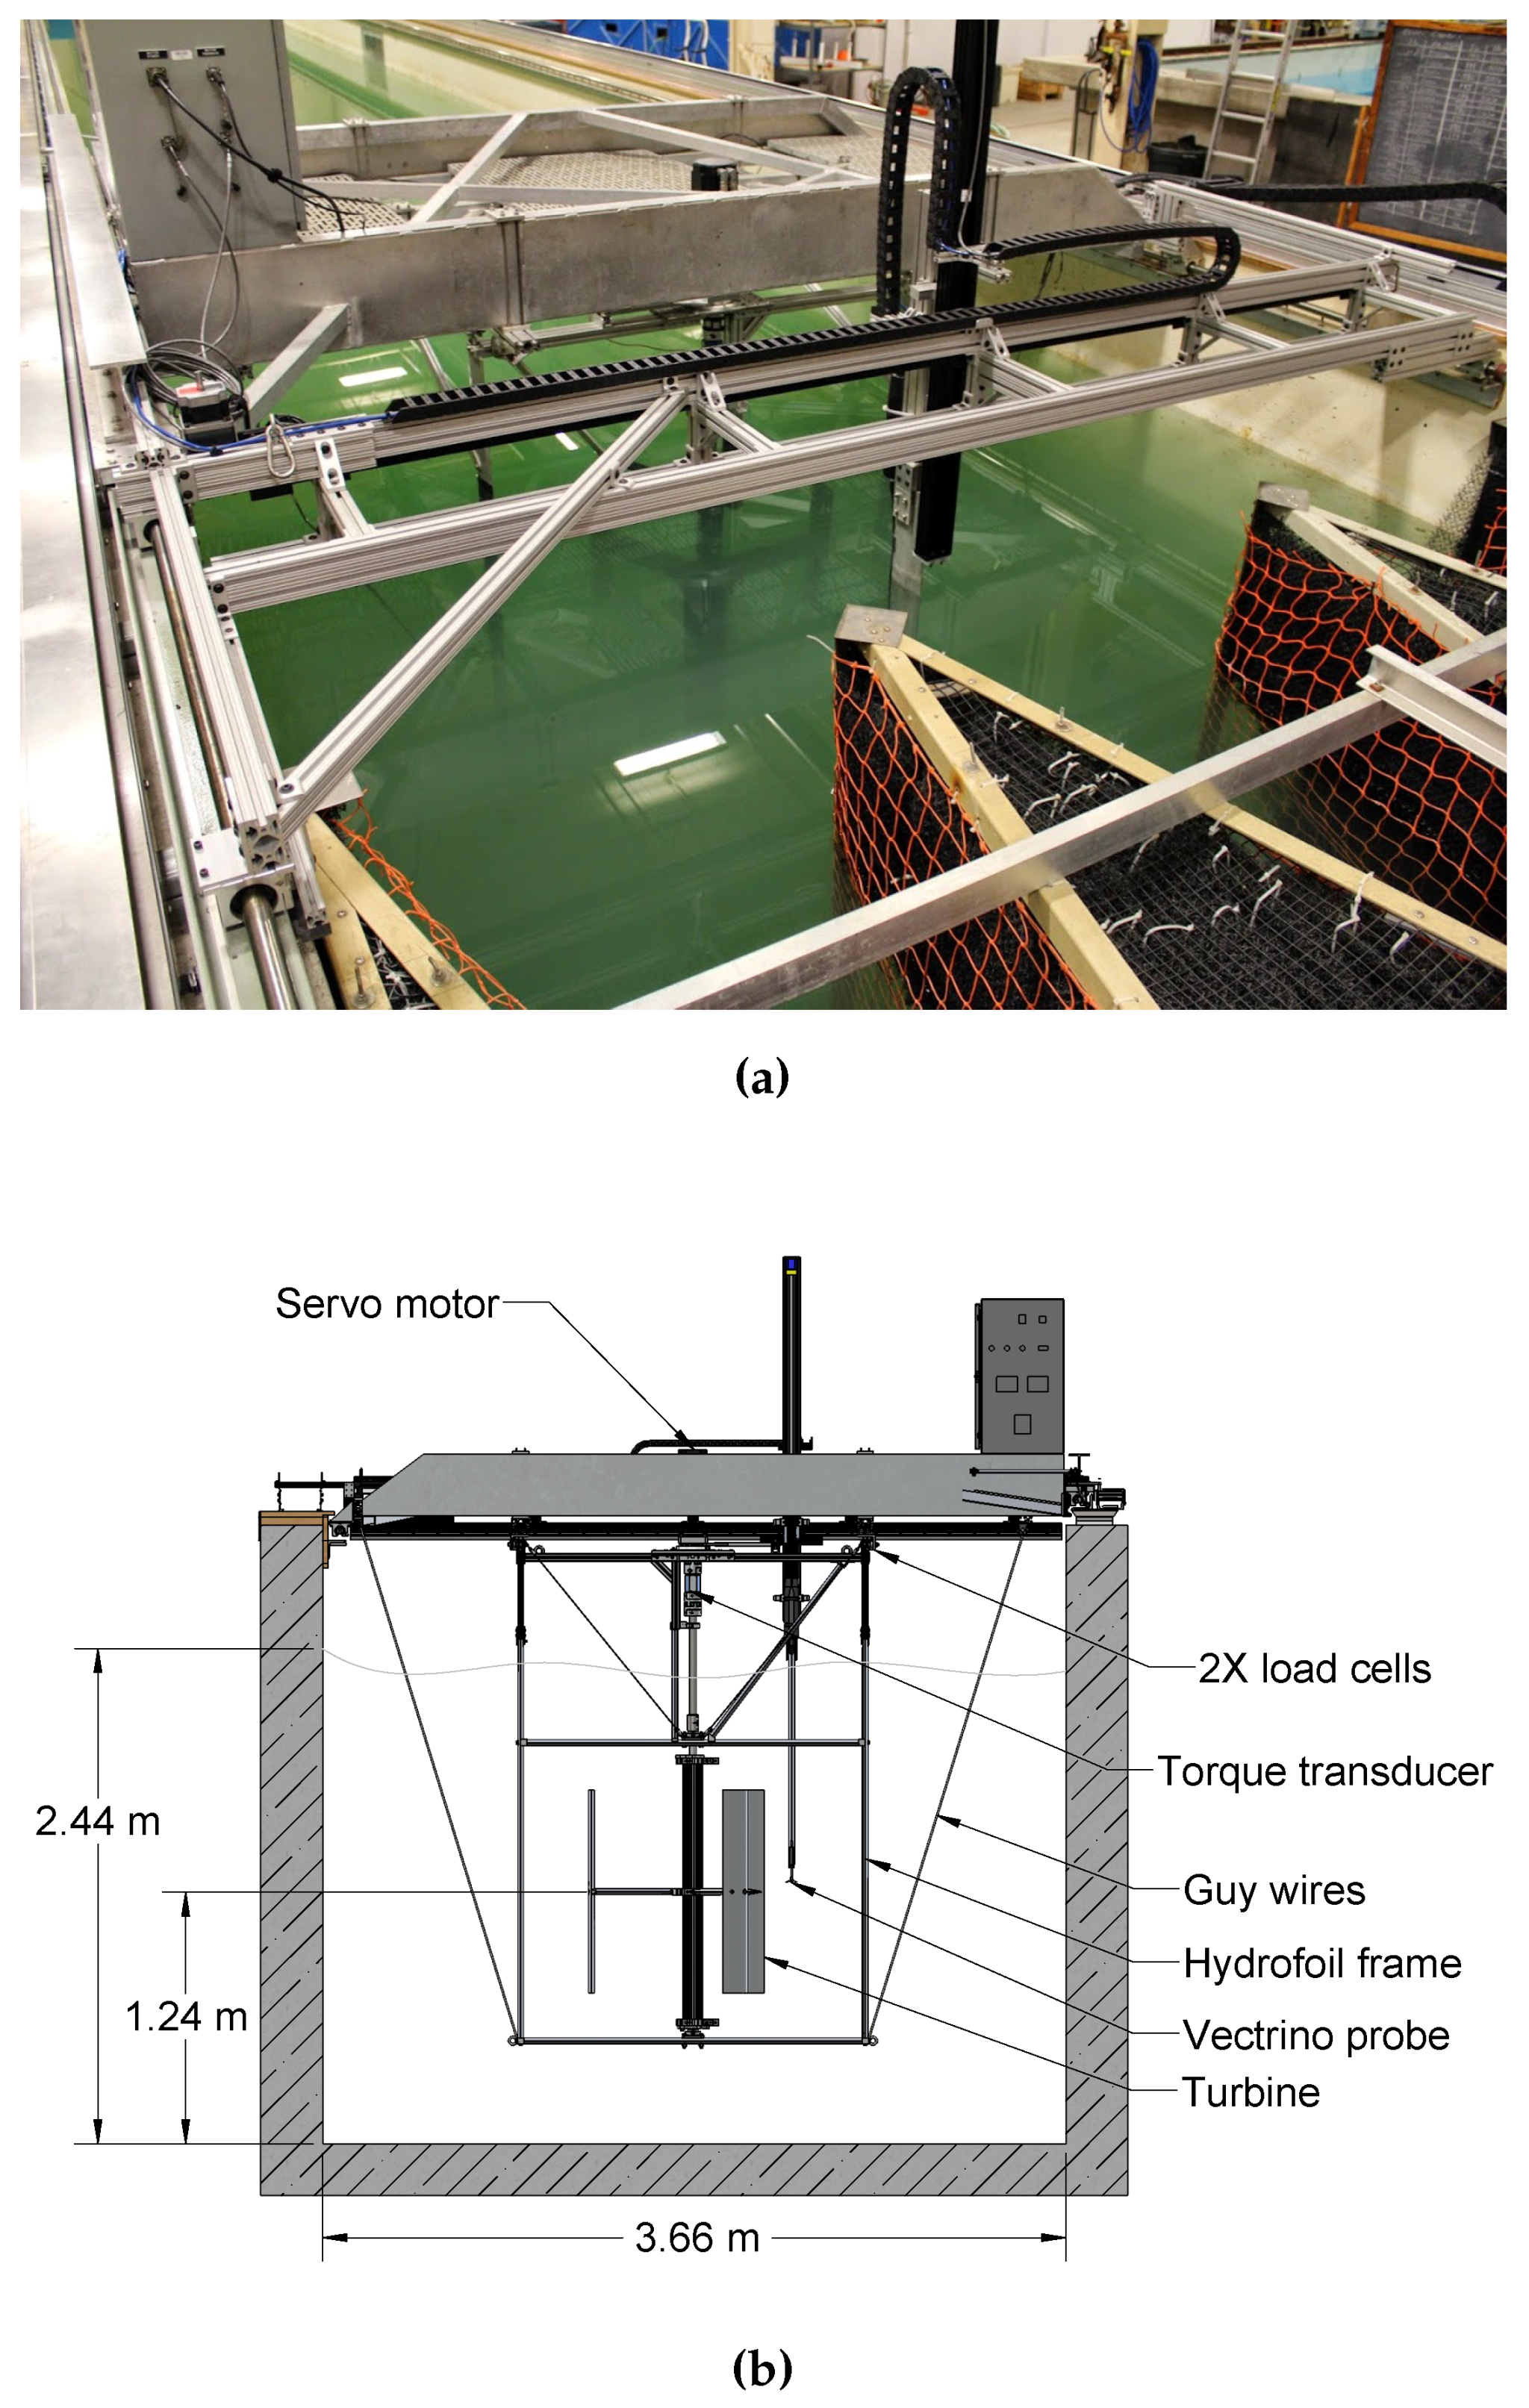
The turbine was mounted in a frame constructed from NACA 0020 sections, shown in Figure 2. The turbine shaft ran up through the water surface, coupled to a Kollmorgen AKM permanent magnet servo motor (Kollmorgen, Radford, VA, USA) with a 20:1 gearbox, providing precise control over shaft angular velocity. This servo was controlled by the tow tank’s main motion controller for high synchronization with the carriage motion, thereby giving precise measurement and control of the tip speed ratio. An Interface T8 200 Nm capacity rotary torque transducer (Interface, Scottsdale, AZ, USA) was installed inline between the servo and the turbine, and the servo was also mounted on a slewing ring bearing, which allowed a redundant measurement of torque via an arm and load cell used to counteract the turbine moment. The frame was mounted to the carriage via linear guides, such that the total streamwise drag force was transferred to a pair of Sentran ZB3 500 pound-force capacity S-beam load cells (Sentran, Santa Ana, CA, USA), providing the rotor drag measurements, after a separately measured tare drag was subtracted in post-processing. Similarly, a tare torque was measured by rotating the turbine shaft in air. Turbine angular and tow carriage linear position were measured using quadrature encoder signals, with 10 5 counts-per-rev for the turbine and 10 μm resolution for the carriage position. These signals, along with the torque and drag signals, were sampled at 2 kHz.
Wake velocity was measured using a Nortek Vectrino+ acoustic Doppler velocimeter (ADV) (Nortek AS, Rud, Norway), which has an approximately 6 mm diameter sampling volume and sampled at 200 Hz. The probe was mounted on an automated positioning system, also controlled by the tow tank’s main motion controller. The ADV and data acquisition systems’ sampling times were synchronized by triggering the start of data acquisition via a pulse sent from the motion controller. Additional details of the turbine and experimental setup are described in [22].
Figure 2. Experimental setup photo (a) and drawing (b): turbine test bed installed in the UNH tow tank.
Energies 09 00073 g002

2.1. Test Plan

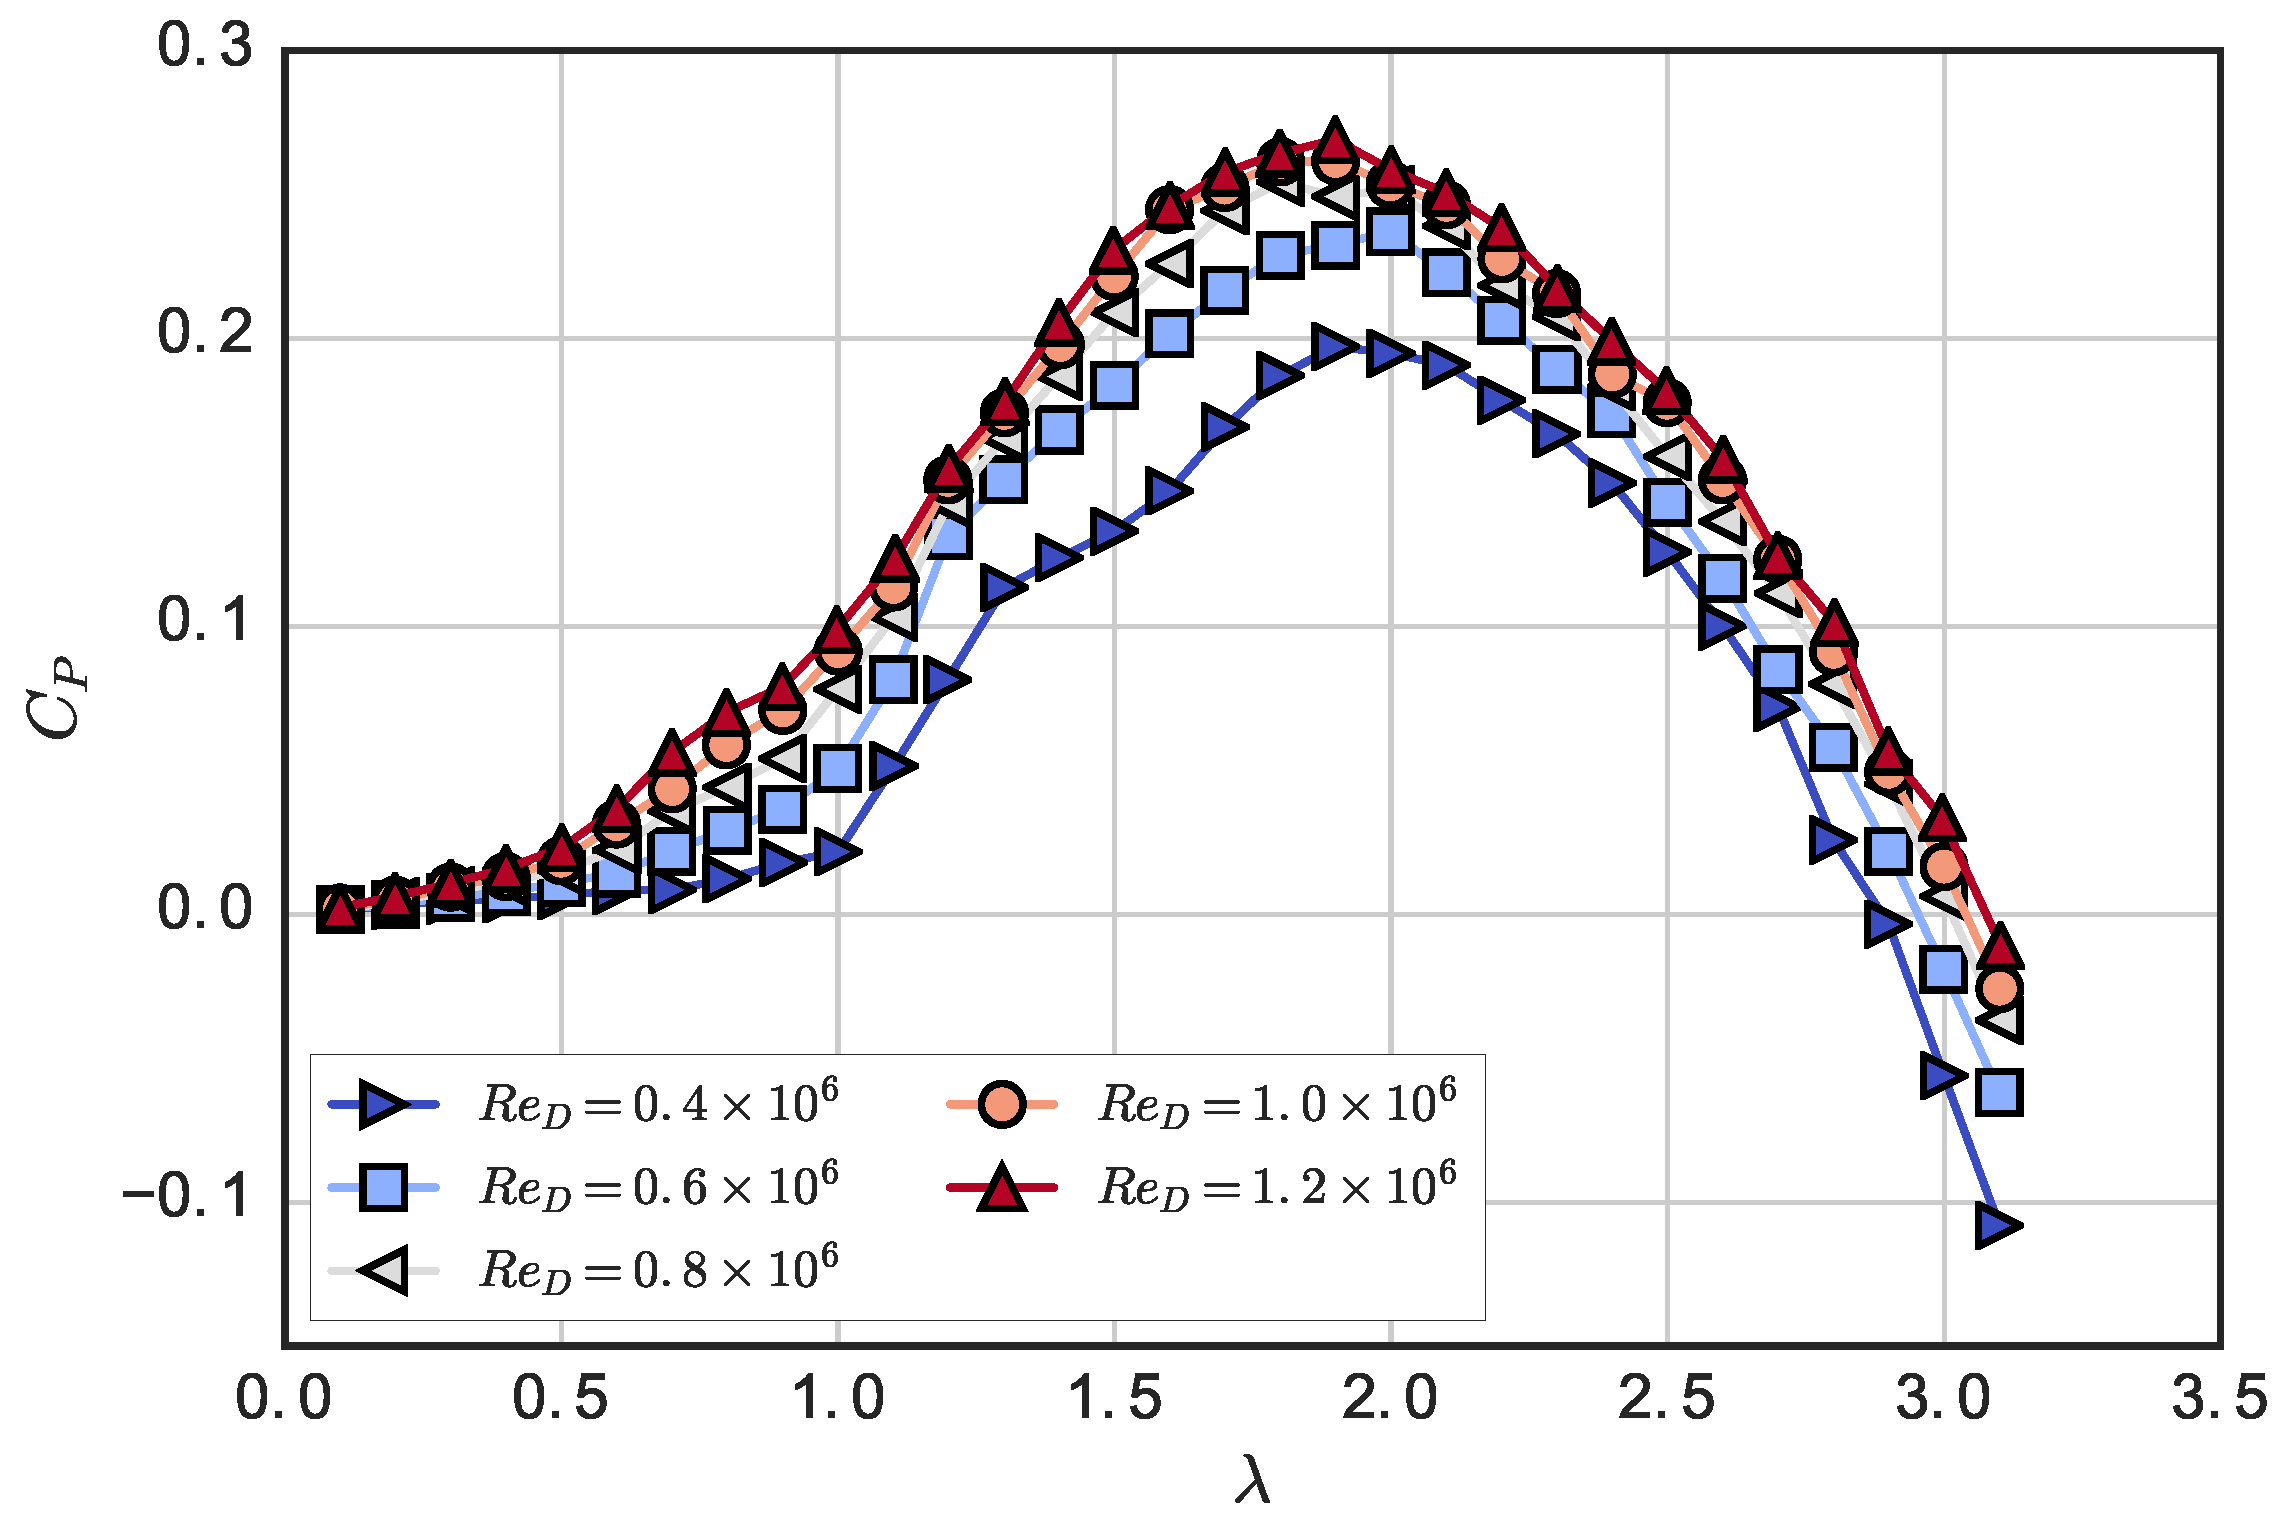
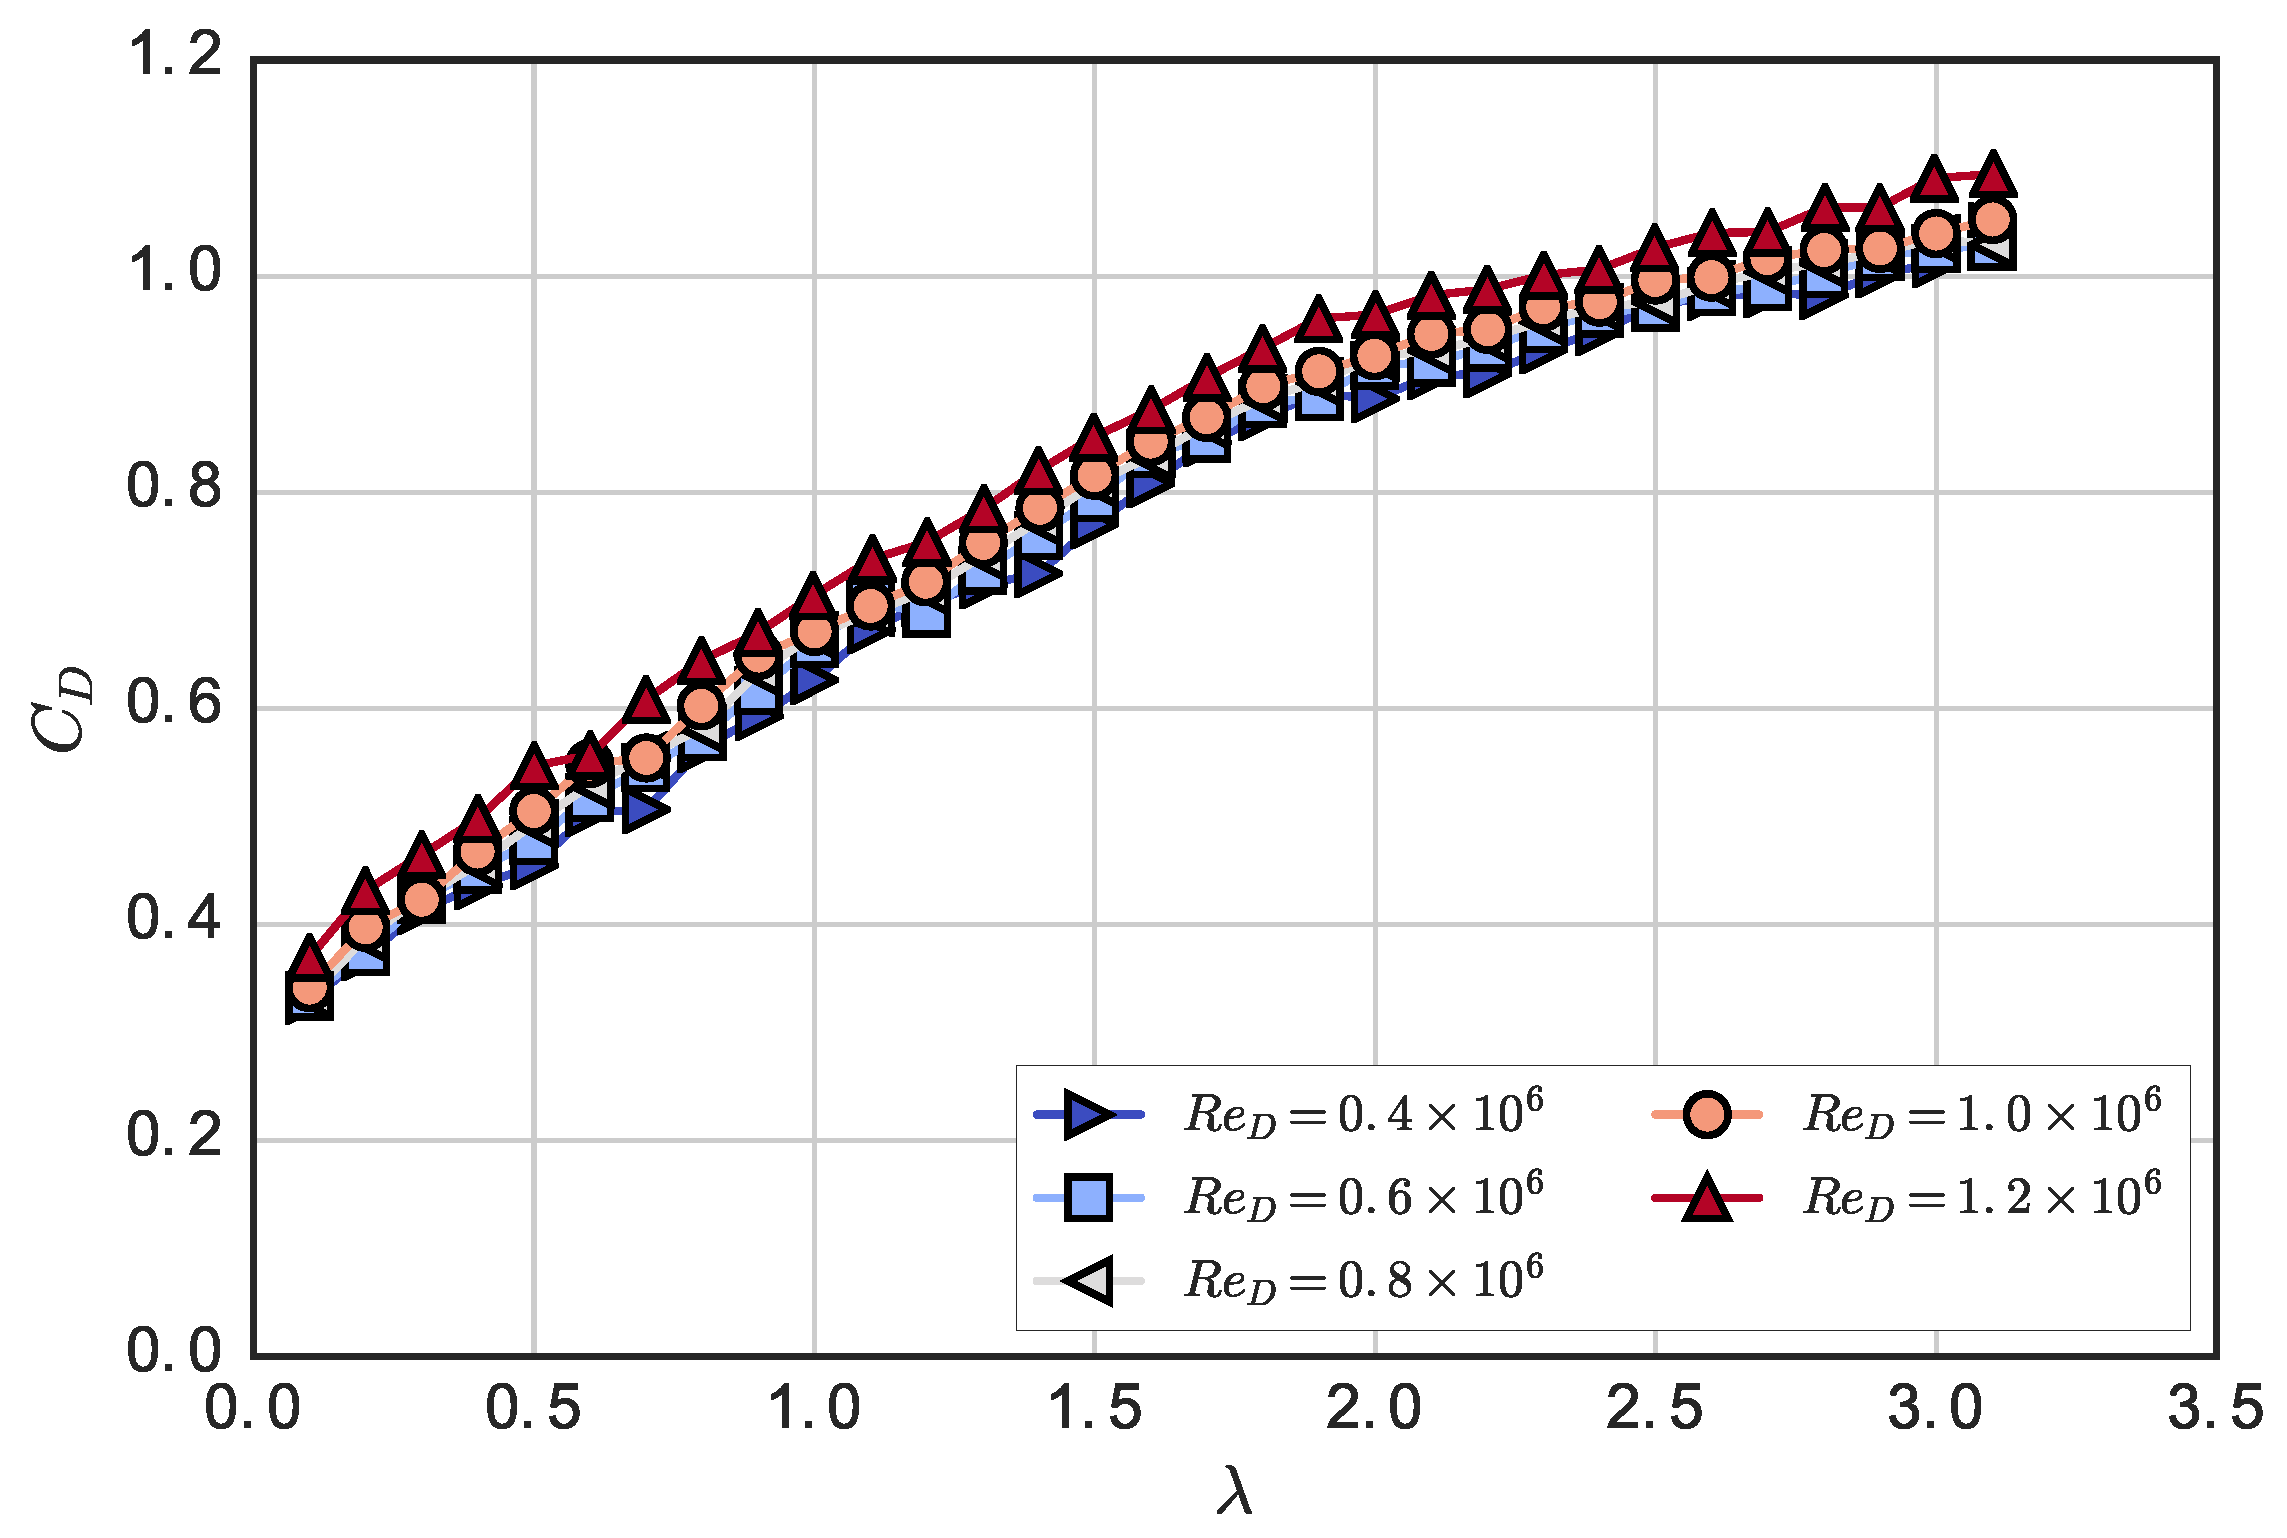
Approximately 1500 tows were conducted for the study reported here; each tow was used for a single data point on either a performance curve or wake map. Each performance curve consisted of 31 tows, where during each tow, the mean turbine tip speed ratio was held constant, ranging from 0.1 to 3.1 in 0.1 increments. Full performance curve data were acquired for tow speeds from 0.4 to 1.2 m/s in 0.2 m/s increments, for which the turbine diameter and approximate blade chord Reynolds number are presented in Table 1. Performance was also measured for λ = 1 . 9 at tow speeds [ 0 . 3 , 0 . 5 , 0 . 7 , 0 . 9 , 1 . 1 , 1 . 3 ] m/s for two tows each.
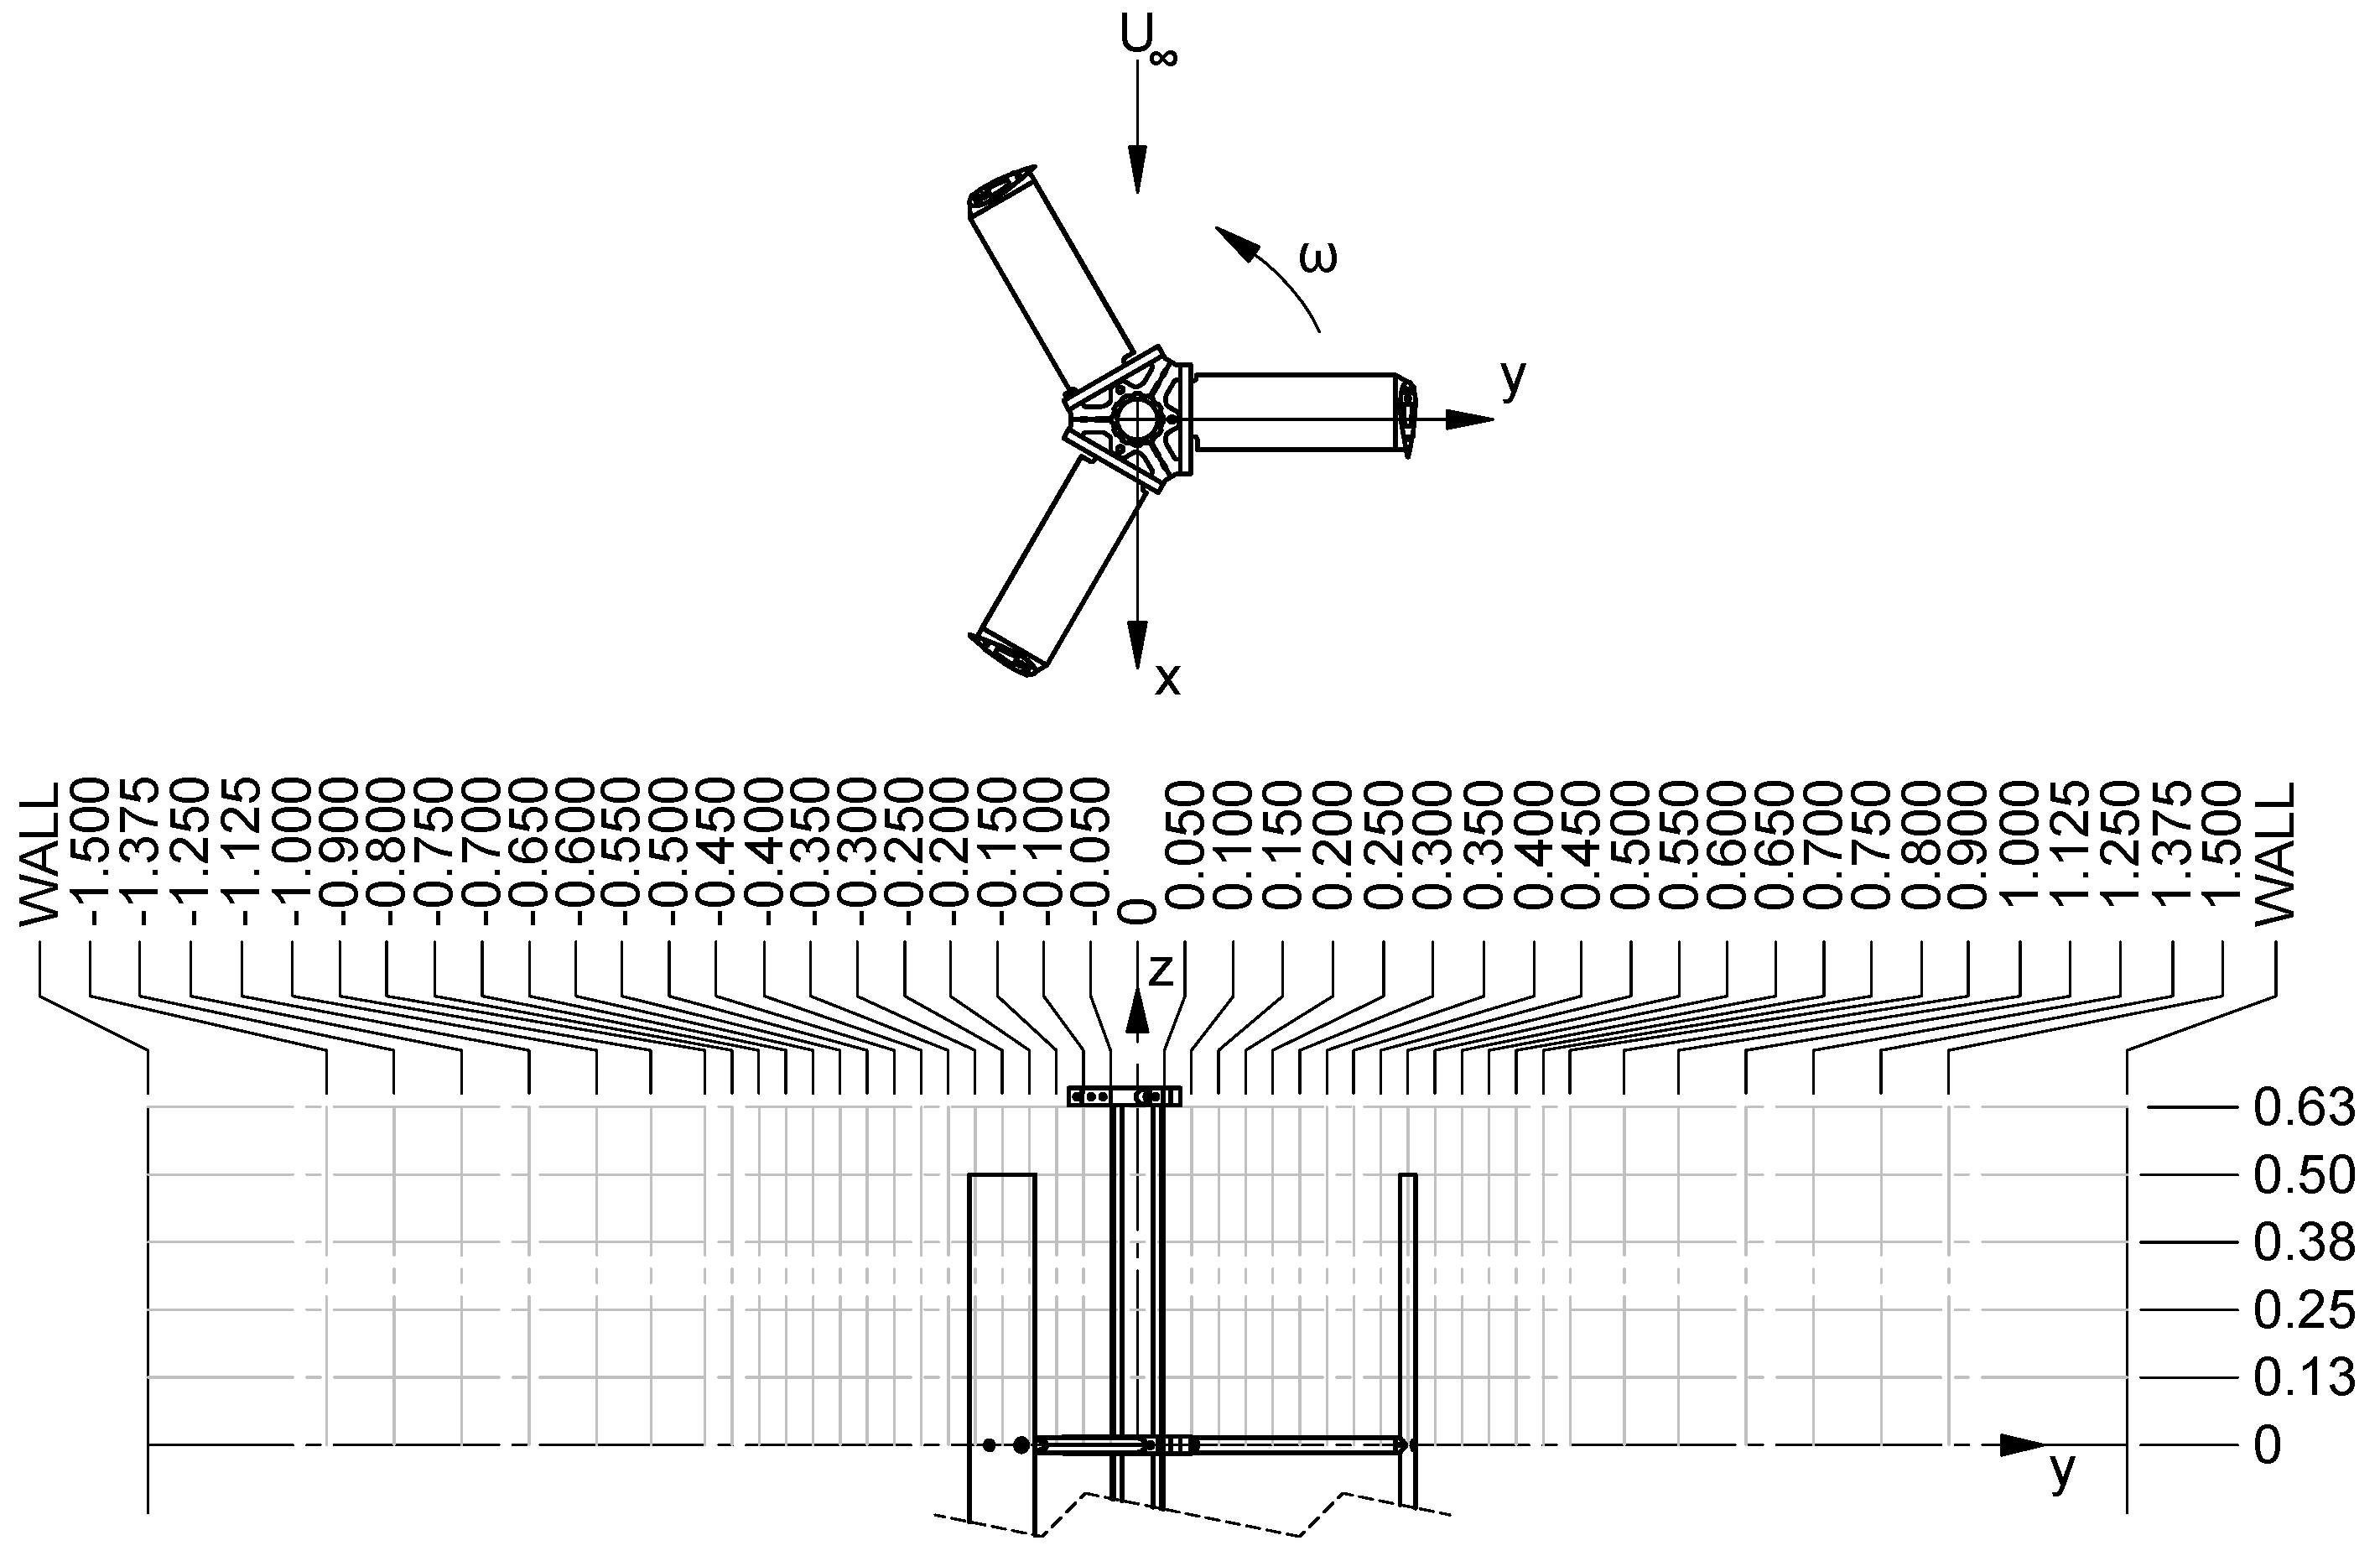
Each wake map was generated by positioning the ADV, which measured three components of velocity at a 200 Hz sampling frequency, at 270 different locations, varied in the cross-stream and vertical directions at one turbine diameter downstream ( x / D = 1 ). These locations had vertical coordinates from the turbine centerline up to z / H = 0 . 625 , ranging in the cross-stream direction y / R = ± 3 . These locations are shown in Figure 3.
Table 1. Turbine diameter and approximate blade chord Reynolds numbers for the tow speeds used in the experiment.
Tow Speed (m/s) Re D Re c , ave ( λ = 1 . 9 )
0.3 0 . 3 × 10 6 0 . 8 × 10 5
0.4 0 . 4 × 10 6 1 . 1 × 10 5
0.5 0 . 5 × 10 6 1 . 3 × 10 5
0.6 0 . 6 × 10 6 1 . 6 × 10 5
0.7 0 . 7 × 10 6 1 . 9 × 10 5
0.8 0 . 8 × 10 6 2 . 1 × 10 5
0.9 0 . 9 × 10 6 2 . 4 × 10 5
1.0 1 . 0 × 10 6 2 . 7 × 10 5
1.1 1 . 1 × 10 6 2 . 9 × 10 5
1.2 1 . 2 × 10 6 3 . 2 × 10 5
1.3 1 . 3 × 10 6 3 . 4 × 10 5
Figure 3. Wake measurement coordinate system and locations. Dimensions are in meters.
Energies 09 00073 g003

2.2. Data Processing

From each set of tows, a standard time interval was set, which allowed the turbine performance and wake to reach a quasi-periodic state. Each run was analyzed to compute statistics over this interval, truncating the end slightly to achieve an integer number of blade passages. Turbine shaft angular velocity and tow carriage speed were calculated using a second order central differencing scheme on the respective position measurements. Power and drag coefficients were calculated as instantaneous quantities using the carriage speed as the free stream velocity.
Wake velocity data were filtered for spurious “spikes” by removing data points 8 standard deviations, or 0.9 m/s, from the mean. The experimental data and code for processing and visualization are available from [34].

2.3. Uncertainty Analysis

Uncertainty was considered from a combination of systematic and random errors. The random error was inferred from the sample standard deviation (on a per-revolution basis) and the systematic error from the sensor calibrations or datasheets. Combining both sources of error, along with their propagation into quantities derived from multiple measurements, followed the procedures outlined in Coleman and Steele [35], described below.
An expanded uncertainty interval with 95% confidence was computed for C P , C D , and mean wake velocities:
U 95 = t 95 u c ,
where t 95 is the value from the Student t-distribution for a 95% confidence interval and u c is the combined standard uncertainty. Combined standard uncertainty for a given quantity X is calculated by:
u X 2 = s X ¯ 2 + b X 2 ,
where s X ¯ is the sample standard deviation of the mean per turbine revolution, and b X is the systematic uncertainty, computed by:
b X 2 = i = 1 J X x i 2 b x i 2 ,
where x i is a primitive quantity used to calculate X (e.g., T, ω, and U for calculating C P ), and b x i is the primitive quantity’s systematic uncertainty, estimated as half the value listed on the sensor manufacturer’s documentation.
Selecting t 95 requires an estimate for degrees of freedom ν X , which was obtained using the Welch–Satterthwaite formula:
ν X = s X 2 + k = 1 M b k 2 2 s X 4 / ν s X + k = 1 M b k 4 / ν b k ,
where ν s X is the number of degrees of freedom associated with s X and ν b k is the number of degrees of freedom associated with b k . ν s X is assumed to be ( N - 1 ) , where N is the number of independent samples (or turbine revolutions). ν b k was estimated as:
ν b k = 1 2 Δ b k b k - 2 ,
where the quantity in parentheses is the relative uncertainty of b k , assumed to be 0.25.
For the Reynolds number dependence of turbine performance, error bars are included on the plots. Expanded uncertainty estimates for mean wake velocities (averaged over all runs) are listed in Table 2.
Table 2. Average expanded uncertainty estimates (with 95% confidence) for mean velocity measurements at each tow speed.
U (m/s)U (m/s)V (m/s)W (m/s)
0 . 4 1 × 10 - 2 7 × 10 - 3 6 × 10 - 3
0 . 6 1 × 10 - 2 8 × 10 - 3 8 × 10 - 3
0 . 8 2 × 10 - 2 1 × 10 - 2 1 × 10 - 2
1 . 0 2 × 10 - 2 1 × 10 - 2 1 × 10 - 2
1 . 2 2 × 10 - 2 1 × 10 - 2 1 × 10 - 2

3. Results and Discussion

3.1. Performance

Complete power and rotor drag (also known as thrust) coefficient curves for various Reynolds numbers are plotted in Figure 4 and Figure 5, respectively. In general, maximum C P increases with Reynolds number. The power coefficient curves also show a slight downward shift in the optimal tip speed ratio (peak performance) with increasing Reynolds number, from about λ 2.0 to 1.9. This is caused by the stall delay from a more turbulent boundary layer on the blade suction side. There is essentially no change in the shape of the drag coefficient curves, merely a slight upward shift in C D with increasing R e .
Figure 4. Mean power coefficient curves plotted for multiple Reynolds numbers.
Energies 09 00073 g004
Figure 5. Mean rotor drag coefficient curves plotted for multiple Reynolds numbers.
Energies 09 00073 g005
Mean power and drag coefficients at λ = 1 . 9 are plotted versus the Reynolds number in Figure 6. Note that the large error bars for C P at low R e are dominated by systematic error estimates for the torque transducer, since torque values are at the lower end of its measurement range. However, the uncertainty due to random error or repeatability remains relatively low. There is a drastic improvement in C P with increasing Reynolds number at the lower end of the R e range. The power coefficient then becomes essentially R e -independent at R e D = 0 . 8 × 10 6 , which corresponds to an approximate average blade chord Reynolds number R e c , ave = 2 . 1 × 10 5 . This threshold is consistent with the behavior of the blade boundary layer transitioning from laminar to turbulent, thereby promoting either the suppression or reattachment of the laminar separation bubble [24].
Figure 6. UNH-RVAT measured mean power (a) and drag (b) coefficients at λ = 1 . 9 plotted versus the Reynolds number. Error bars indicate expanded uncertainty estimates for 95% confidence, which for C P is dominated by systematic error estimates from the torque transducer operating at the lower end of its measurement range.
Energies 09 00073 g006
The behavior of the mean rotor drag coefficient C D is similar, though the changes are less dramatic. This is likely due to cross-flow turbine geometry, where increases in blade drag at lower R e somewhat offset the reduction in lift, causing the total streamwise force to vary less than the rotor torque. The tendency for C D to continue increasing with R e may also include the effects of an increasing Froude number (from faster tow speeds), which increases free surface deformation and wave drag during towing without increasing flow through the turbine.

Relation to Static Foil Characteristics

To help understand, and possibly predict, the R e -sensitivity on turbine performance, a series of static foil coefficient datasets were computed with the viscous panel method code XFOIL [36], a commonly-used tool for airfoil analysis, e.g., [15,37], implemented as part of the open source turbine design software QBlade [38]. Simulations were run for an angle of attack range of 0 to 40 , in increments of 0.5 . Solver parameters used were 100 panels, a fixed speed, zero Mach number, NCrit = 9 (default e n transition criteria parameter for an average wind tunnel) and no forced boundary layer transition. Characteristics were computed for the approximate average blade chord Reynolds numbers encountered in the tow tank experiments.
To investigate the effects of the blades’ “virtual camber” due to their circular path [6], the XFOIL calculations were performed for 20% thick foils with 0% (NACA 0020), 2% (NACA 2520), and 4% (NACA 4520) camber about their half-chord location. A 4% camber approximates the maximum distance between the blade chord line and path for the UNH-RVAT, and the 2% camber takes into account the reduction in virtual flow curvature from the non-curved inflow velocity by dividing by the tip speed ratio λ = 1 . 9 .
Results from the XFOIL calculations for the airfoil profiles are shown in Figure 7, where values of the maximum lift coefficient C l max , minimum drag coefficient C d min , and maximum lift-to-drag ratio are normalized (to visualize relative differences in scaling between the foils) and plotted versus R e c . In general, larger camber is associated with decreased foil performance at lower Reynolds number. The data and processing code for these calculations is available from [39].
Figure 7. Normalized maximum lift coefficient (a), drag coefficient (b), and lift-to-drag ratio (c) computed by XFOIL at various R e c for each profile.
Energies 09 00073 g007
In conjunction with the cross-flow turbine blade kinematics, the foil coefficients were used to approximate turbine performance by calculating the peak torque coefficient on the upstream half of the blade path. The turbine torque coefficient C T can be related to the blade section chordwise force coefficient C c by:
C T = C c c 2 R | U rel | 2 U 2 ,
where the blade section chordwise force coefficient (for zero preset pitch) is given by:
C c = C l sin α - C d cos α .
The relative blade velocity U rel was calculated by vector addition of the free stream velocity and the opposite of the blade tangential velocity. Note that this neglects any induction, i.e., slowing of the free stream by the turbine forces, which would be present in a momentum/streamtube model. Since the goal of this approach was not to predict absolute performance, but rather to gain insight into relative changes with R e , this method was deemed acceptable, as it is extremely simple and fast to compute.
Values for the blade angle of attack, relative velocity, and torque coefficient are plotted in Figure 8 for the upstream half of rotation of the turbine. The effects of static stall are clearly present in the torque coefficient plot, and by the time the angle of attack has decreased below the static stall angle, the relative velocity is so low that there is not much contribution to the torque coefficient.
Figure 8. Geometric angle of attack (a), relative velocity (b), and torque coefficient (c) calculated with a NACA 0020 foil operating at λ = 1 . 9 .
Energies 09 00073 g008
Results for the normalized peak torque coefficient for each foil are plotted versus R e c in Figure 9. It is interesting that the convergence of C T max with increasing Reynolds number is more dramatic than any of the common foil performance characteristics plotted in Figure 7, meaning that the cross-flow turbine’s unique kinematics must be taken into account when attempting to predict the effect of transitional Reynolds numbers on turbine performance.
From the peak torque coefficient metric plotted in Figure 9, the Reynolds number independence is achieved at lower values and more dramatically. We see that the trend of the (non-cambered) NACA 0020 curve matches almost perfectly up to R e c 2 . 1 × 10 5 , but then continues to increase slowly and linearly with R e . This is not matched by the experimental data, which at higher R e looks more like the cambered foil results. Though this method does not provide absolute predictions of turbine performance, it predicts the transitional Reynolds number regime for cross-flow turbine performance using only 2D static airfoil characteristics, i.e., the Reynolds number scaling of the peak C T computed this way behaves much like that of the measured turbine performance.
Figure 9. Reynolds number dependence of the normalized peak torque coefficient calculated from static foil coefficients and blade kinematics, compared to experimental data from a cross-flow turbine. Note that the experimental data represents the mean torque coefficient, not the maximum.
Energies 09 00073 g009

3.2. Wake Characteristics

The near-wake of this turbine at x / D = 1 , λ = 1 . 9 , along with momentum and kinetic energy balances at a R e D = 1 . 0 × 10 6 were discussed in [22]. Similar data were taken for the experiment here, and the results for the mean velocity field and turbulence kinetic energy calculated from wake maps of 270 individual measurements (tows) are shown in Figure 10 and Figure 11, respectively, looking upstream towards the turbine. With respect to the mean velocity field, we see asymmetry and a mean vortex structure created by blade tip vortex shedding. The effects of the tip vortices are also seen in the turbulence kinetic energy measurements, along with turbulence generated by the blades undergoing dynamic stall on the - y side of the turbine.
These same wake maps were measured for R e D = 0 . 4 × 10 6 , 0 . 6 × 10 6 , 0 . 8 × 10 6 , and 1 . 2 × 10 6 . Qualitatively, these look very similar, so they have not been plotted here, though profiles at z / H = 0 . 0 are compared in Figure 12 to illustrate the subtlety of the differences at different R e . We will instead compare and contrast the wake behavior by examining spectra and wake transport terms in the equations that govern the downstream evolution of mean momentum and kinetic energy.
Figure 10. Mean velocity field at x / D = 1 , λ = 1 . 9 , and R e D = 1 . 0 × 10 6 .
Energies 09 00073 g010
Figure 11. Turbulence kinetic energy at x / D = 1 , λ = 1 . 9 , and R e D = 1 . 0 × 10 6 .
Energies 09 00073 g011
Figure 12. Mean streamwise velocity (a) and turbulence kinetic energy (b) profiles at z / H = 0 . 0 . Turbine diameter Reynolds number R e D is indicated by the legend.
Energies 09 00073 g012

3.2.1. Dominant Timescales and Turbulence Spectra

Spectra of the cross-stream velocity normalized by the free stream were computed using a fast Fourier transform-based method, applying a Hanning window and averaging over four adjacent frequency bands to decrease confidence intervals. These spectra are plotted in Figure 13 for regions on either side of the turbine. On the - y side of the turbine, there is broadband turbulence produced by blade stall, and on the + y side, there is a clear peak in the spectra caused by the blade passage. We see that on both sides, there is higher spectral energy at lower Reynolds numbers. On the + y side of the turbine, we notice higher spectral energy at the blade passage frequency’s first harmonic, or 6 f turbine . This is likely due to the blade’s shed vorticity being less stable at higher R e .
Figure 13. Cross-stream velocity (normalized by U ) spectra at z / H = 0 . 25 , y / R = - 1 . 0 ( - 0 . 5 m in Figure 3) (a) and y / R = 1 . 5 ( + 0 . 75 m in Figure 3) (b). Dashed vertical lines indicate [ 1 , 3 , 6 , 9 ] times the turbine rotational frequency. Shaded regions indicate 95% confidence intervals assuming a χ 2 distribution.
Energies 09 00073 g013

3.2.2. Transport of Mean Momentum and Kinetic Energy

The relative importance of various physical processes on mean streamwise momentum and kinetic energy transport/recovery in the streamwise direction were assessed by examining the governing equations rearranged to isolate the streamwise partial derivative ( / x ) for the quantities of interest [22], i.e., momentum:
U x = 1 U [ - V U y - W U z - 1 ρ P x - x u u ¯ - y u v ¯ - z u w ¯ + ν 2 U x 2 + 2 U y 2 + 2 U z 2 ] ,
and mean kinetic energy:
K x = 1 U [ - V K y y - adv . - W K z z - adv . - 1 ρ x j P U i δ i j + x j 2 ν U i S i j - 1 2 x j u i u j ¯ U i Turb . trans . + u i u j ¯ U i x j k - prod . - 2 ν S i j S i j Mean diss . ] ,
where advection is abbreviated by “adv.,” turbulent transport by “turb. trans.,” production by “prod.,” and dissipation by “diss.”
Note that Equations (8) and (9) only differ from the typical forms of the mean momentum and mean kinetic energy equations by a factor of 1 / U , but importantly, the other convective terms ( U / y , U / z , and K / y , K / z ) are moved to the right-hand sides of the equations to illustrate with what sign they add to the streamwise recovery of streamwise momentum or mean kinetic energy.
Results from the terms that can be computed from the experimental data (i.e., excluding / x ) from the right-hand sides of Equations (8) and (9) are plotted in Figure 14 and Figure 15, respectively. Derivatives were computed using a second order finite difference scheme, with central differencing for interior points and inward facing schemes for the boundaries. A weighted average for each term was then calculated based on the grid spacing. We note that similar to [22], the vertical advection at this point in the wake is the dominant contributor to positive wake recovery, caused by the unique vortex pattern created by the blade tips and blade wakes.
Figure 14. Normalized streamwise momentum transport quantities computed as weighted averages from Equation (8).
Energies 09 00073 g014
Figure 15. Normalized mean kinetic energy transport quantities computed as weighted averages based on Equation (9), omitting the non-measured streamwise derivatives. Note that directions of the turbulent transport terms refer to the directions of their partial derivatives.
Energies 09 00073 g015
We see that in general, levels of turbulent transport are slightly lower at larger Reynolds numbers. The viscous diffusion and dissipation, though still three orders of magnitude smaller than the other terms, do increase at low Reynolds numbers, which is consistent with the physical meaning of the Reynolds number itself. From these results, one might expect that the viscous effects will become significant to the wake dynamics as the Reynolds number is decreased below R e D 10 4 .
Transport due to cross-stream advection appears to become more negative at higher R e . This could be a consequence of increasing free surface deformation (higher F r ), which then decreases the effective flow cross-sectional area downstream of the turbine, forcing more flow to accelerate around the sides of the turbine. Note that we also observe slightly higher drag coefficients at higher R e (potentially for the same reason), which also helps explain larger negative values of cross-stream advection.
The totals for all of the wake transport terms calculated in Figure 14 and Figure 15 are plotted in Figure 16. We see that in general, the wake transport of both mean streamwise momentum and kinetic energy is enhanced at lower Reynolds numbers and levels off consistent with the behavior of the turbine power coefficient. This is an important consideration if studying sub-scale models of turbine arrays, where increased levels of wake recovery could motivate different ideal array configurations when compared to full-scale turbines if the scale model Reynolds number is too low.
Figure 16. Normalized transport totals from Figure 14 (streamwise momentum, U) and Figure 15 (mean kinetic energy, K) plotted versus the Reynolds number.
Energies 09 00073 g016

4. Conclusions

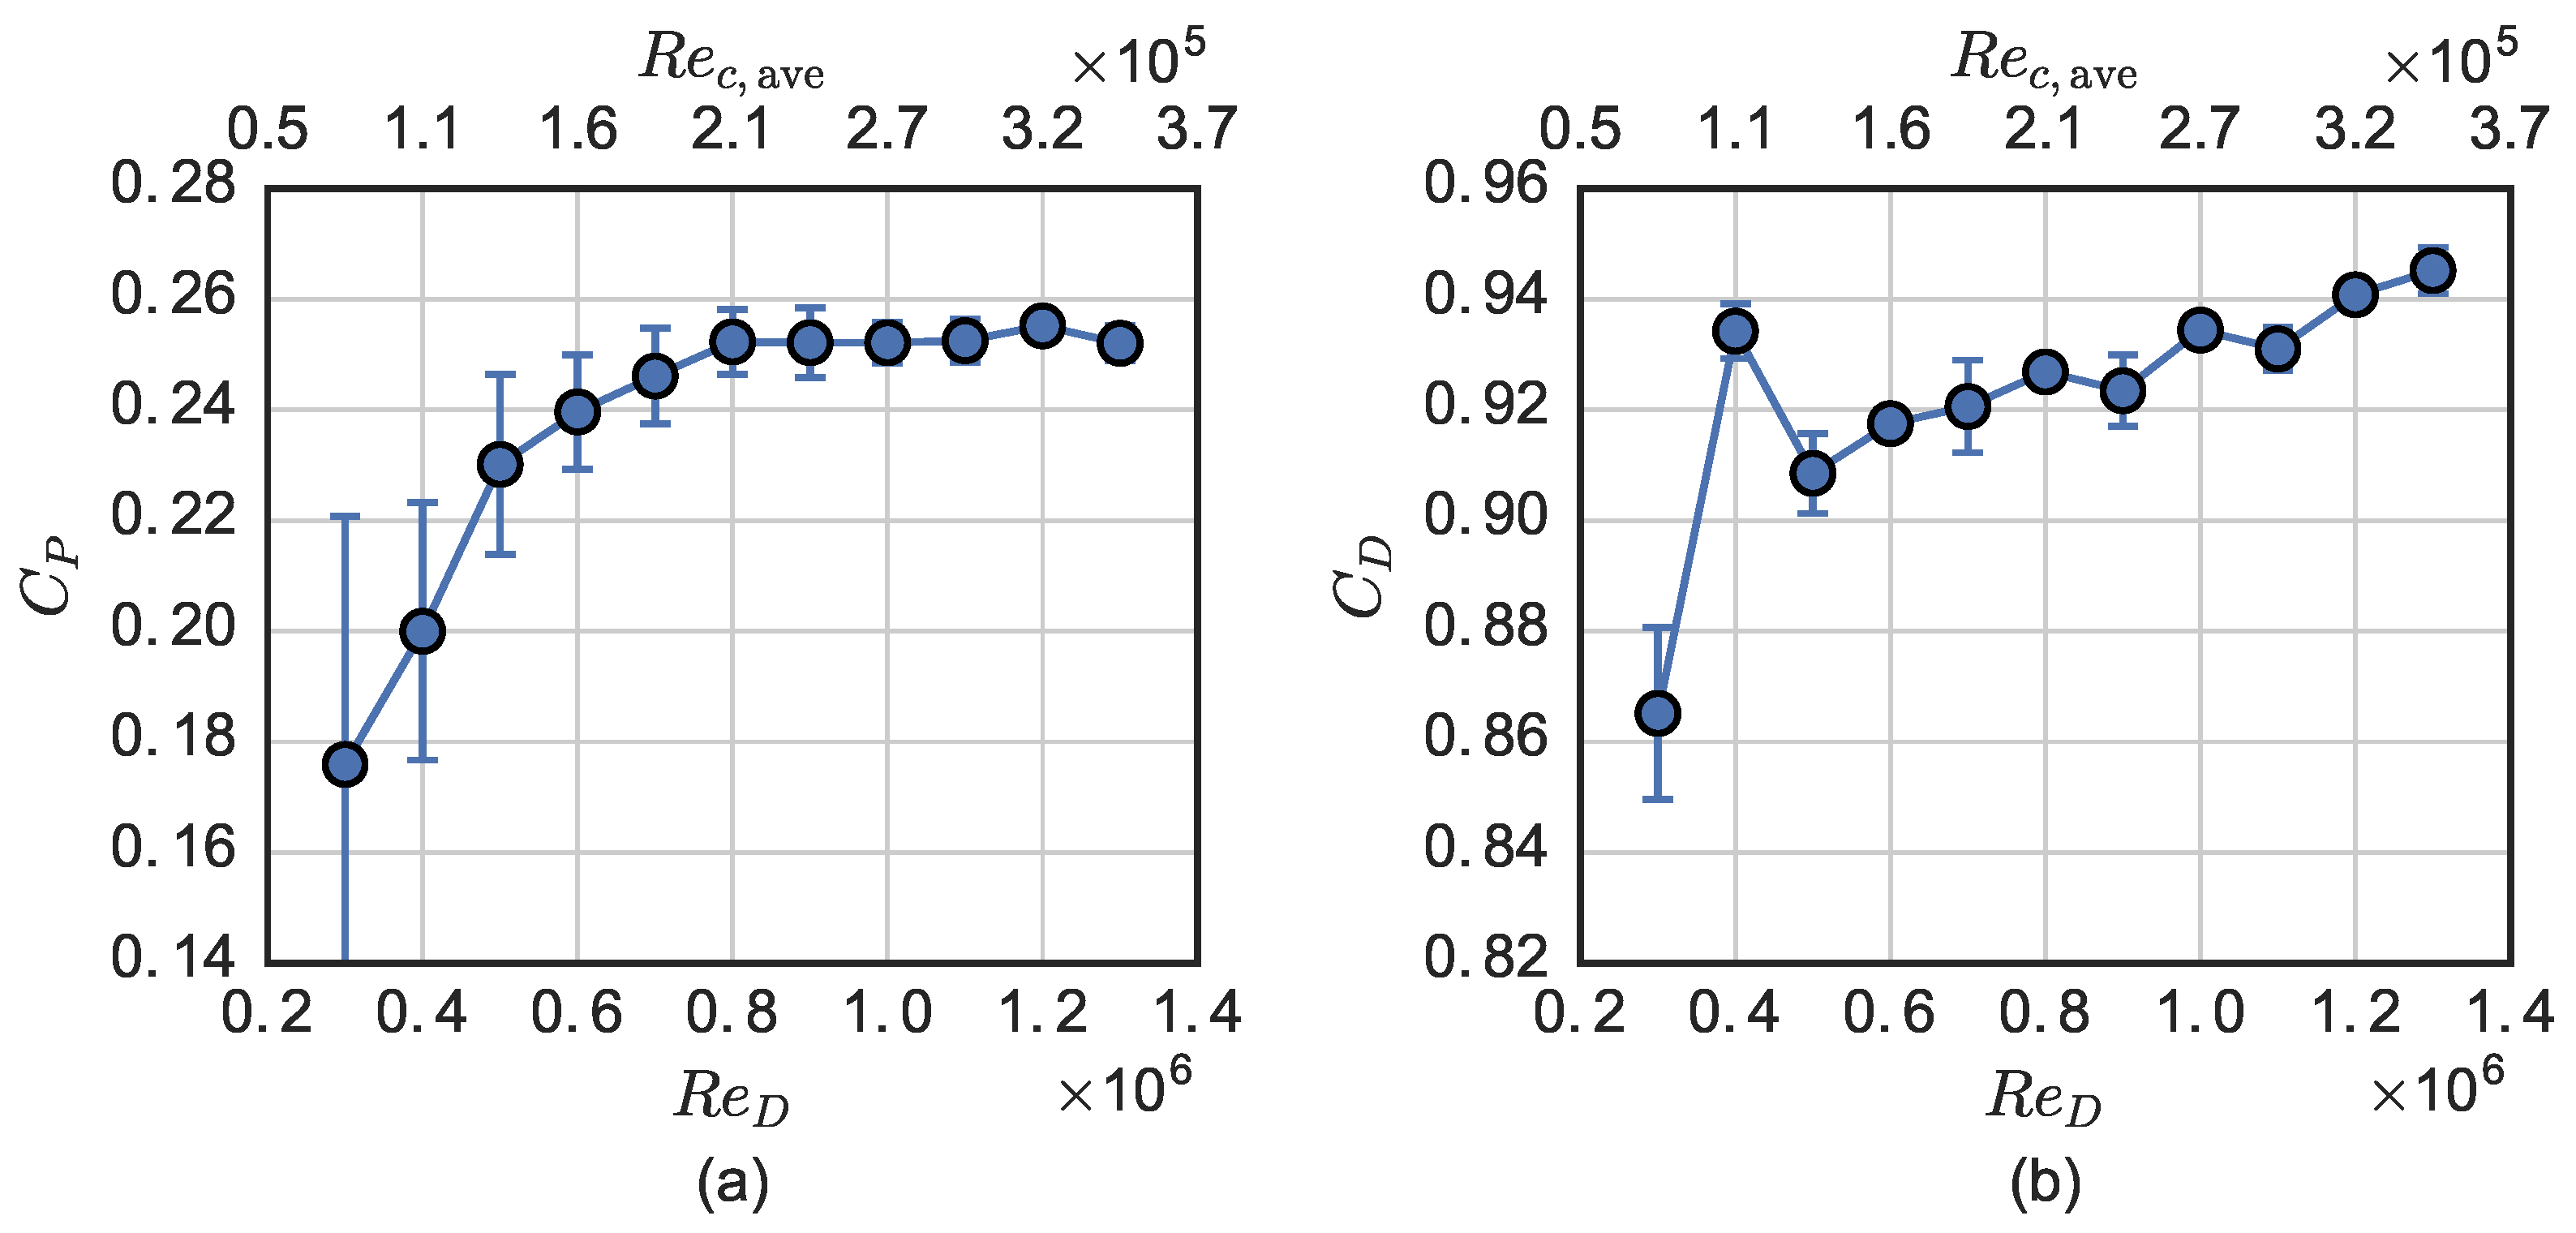
In this study, it was demonstrated that the performance of a high solidity ( c / R = 0 . 28 ) cross-flow turbine becomes essentially R e -independent at a Reynolds number based on the turbine diameter R e D 10 6 or an approximate Reynolds number based on the blade chord R e c 2 × 10 5 . The power coefficient values on the left-hand side of the C P -λ curve are reduced more than those on the right-hand side at low R e due to deeper stalling. The R e -independent threshold corresponds to that at which the foil suction surface boundary layer becomes turbulent before having to recover static pressure against the adverse pressure gradient, highlighted in [24,25,40].
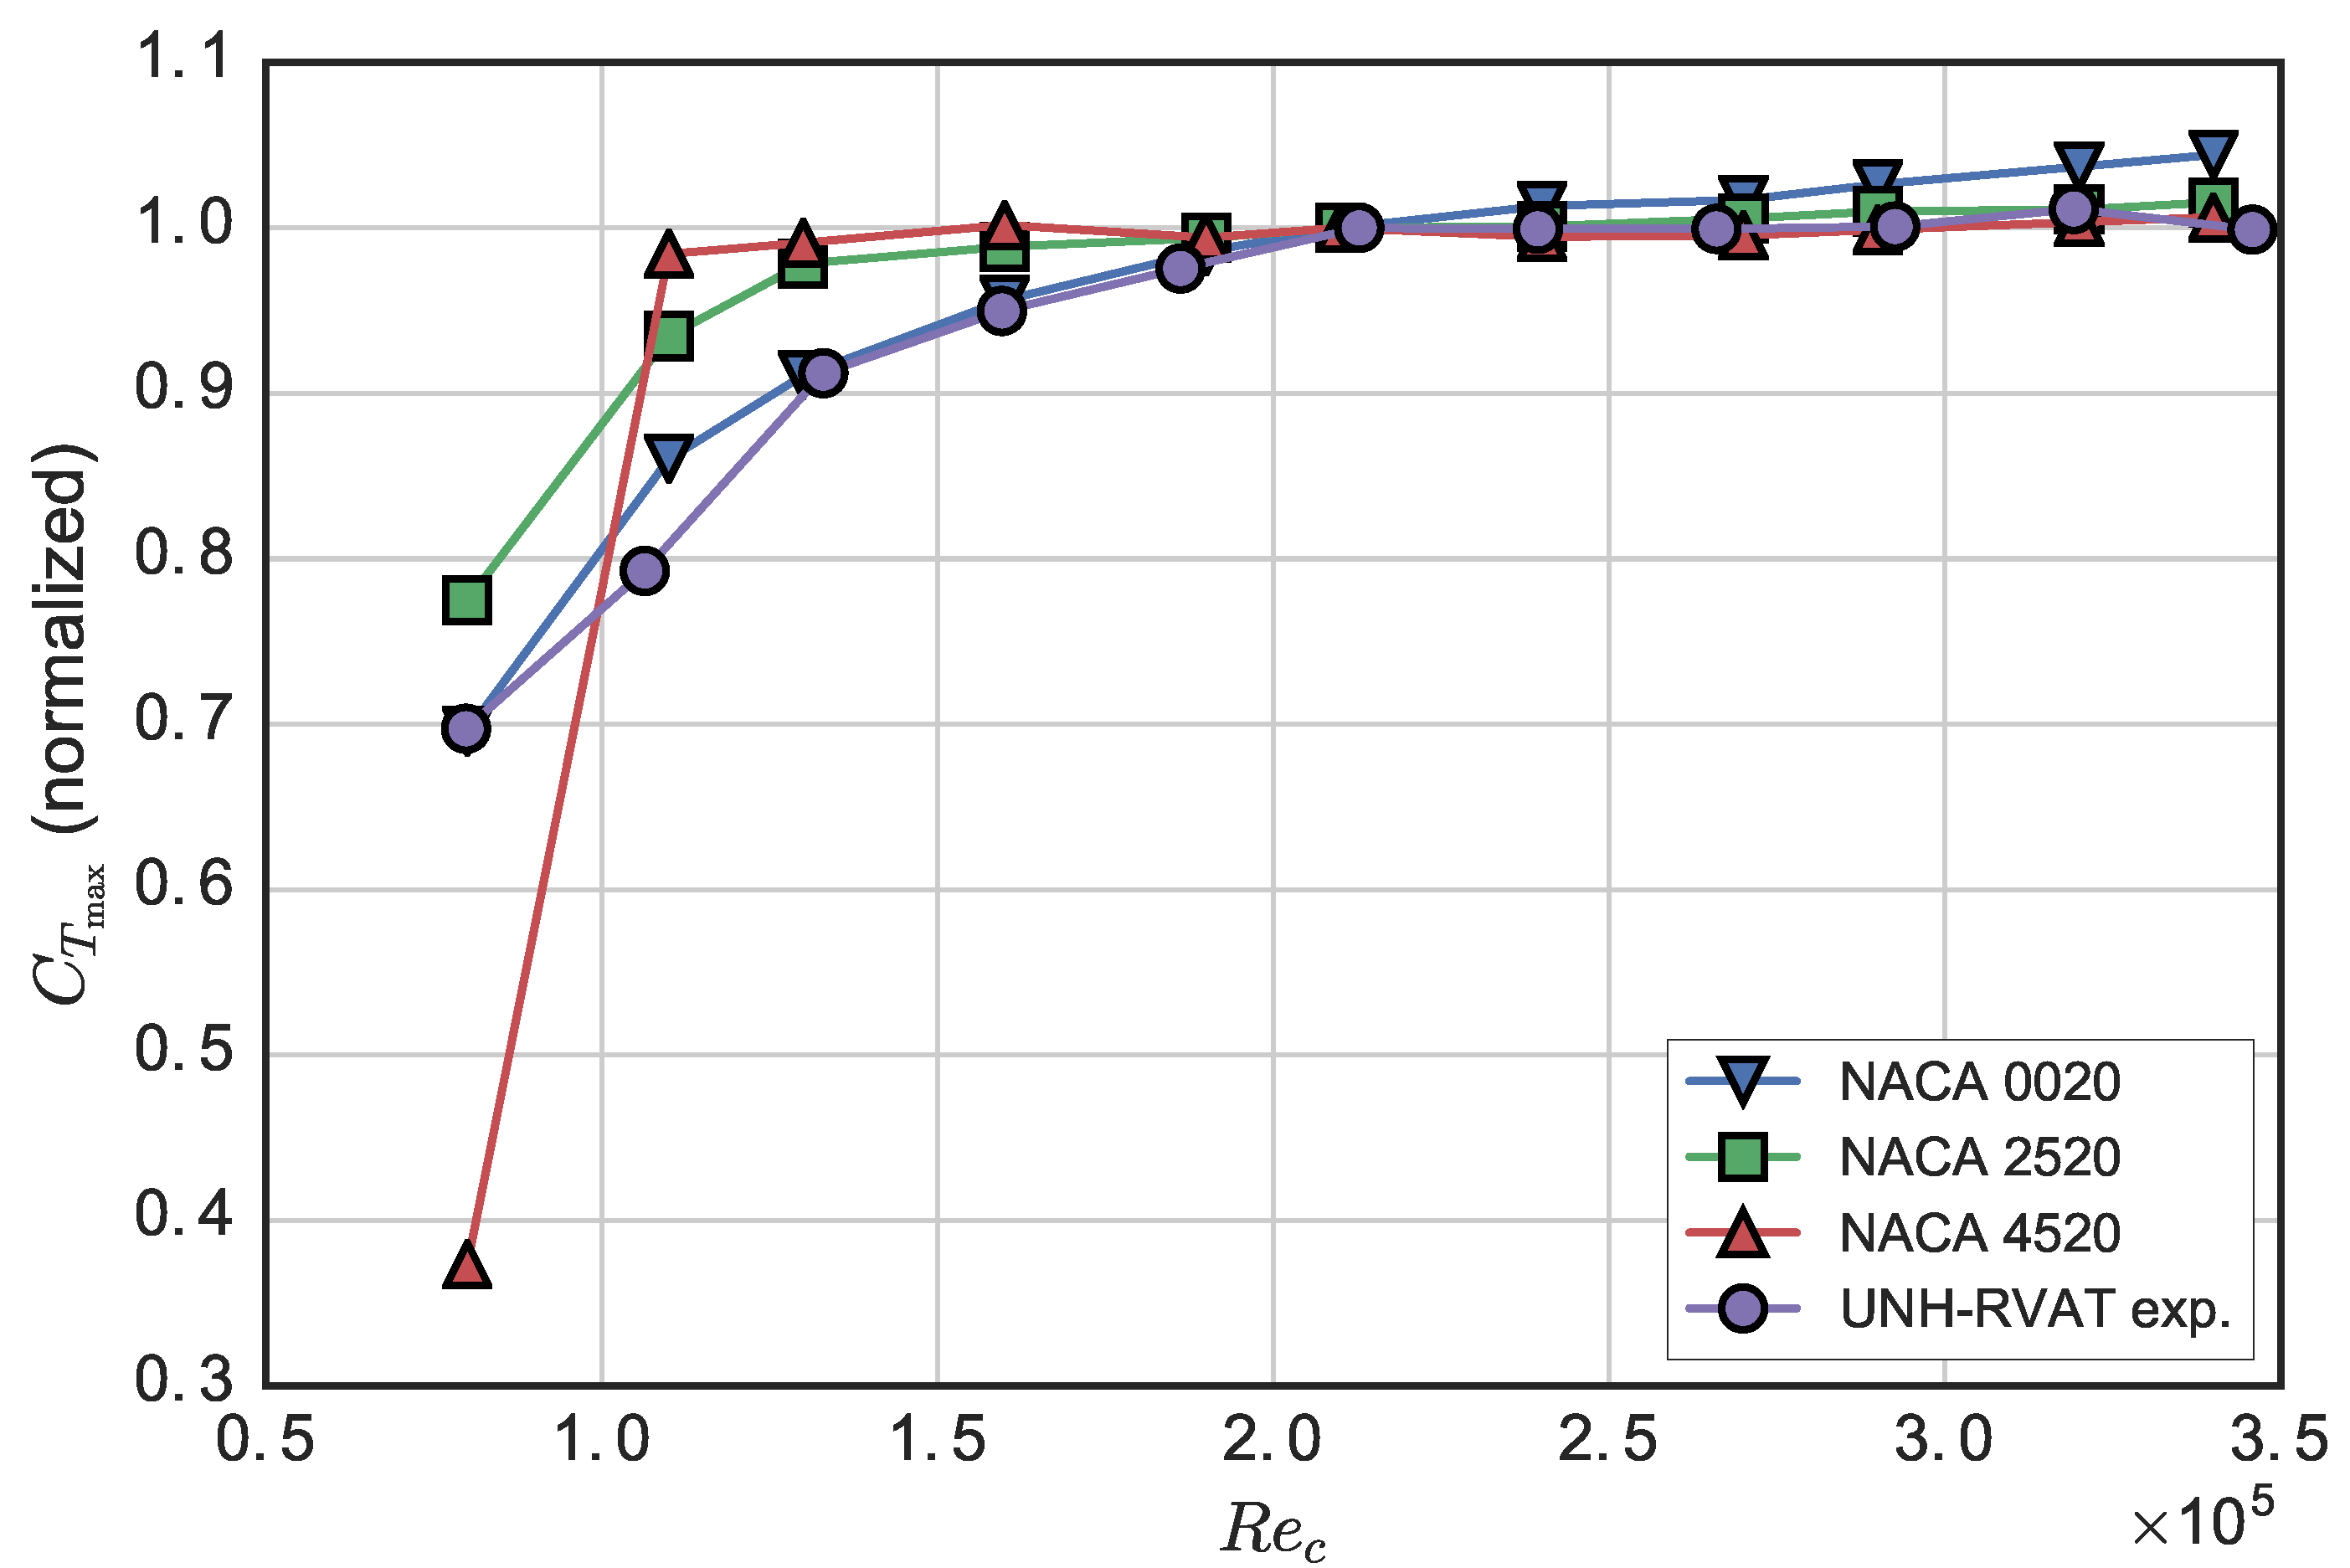
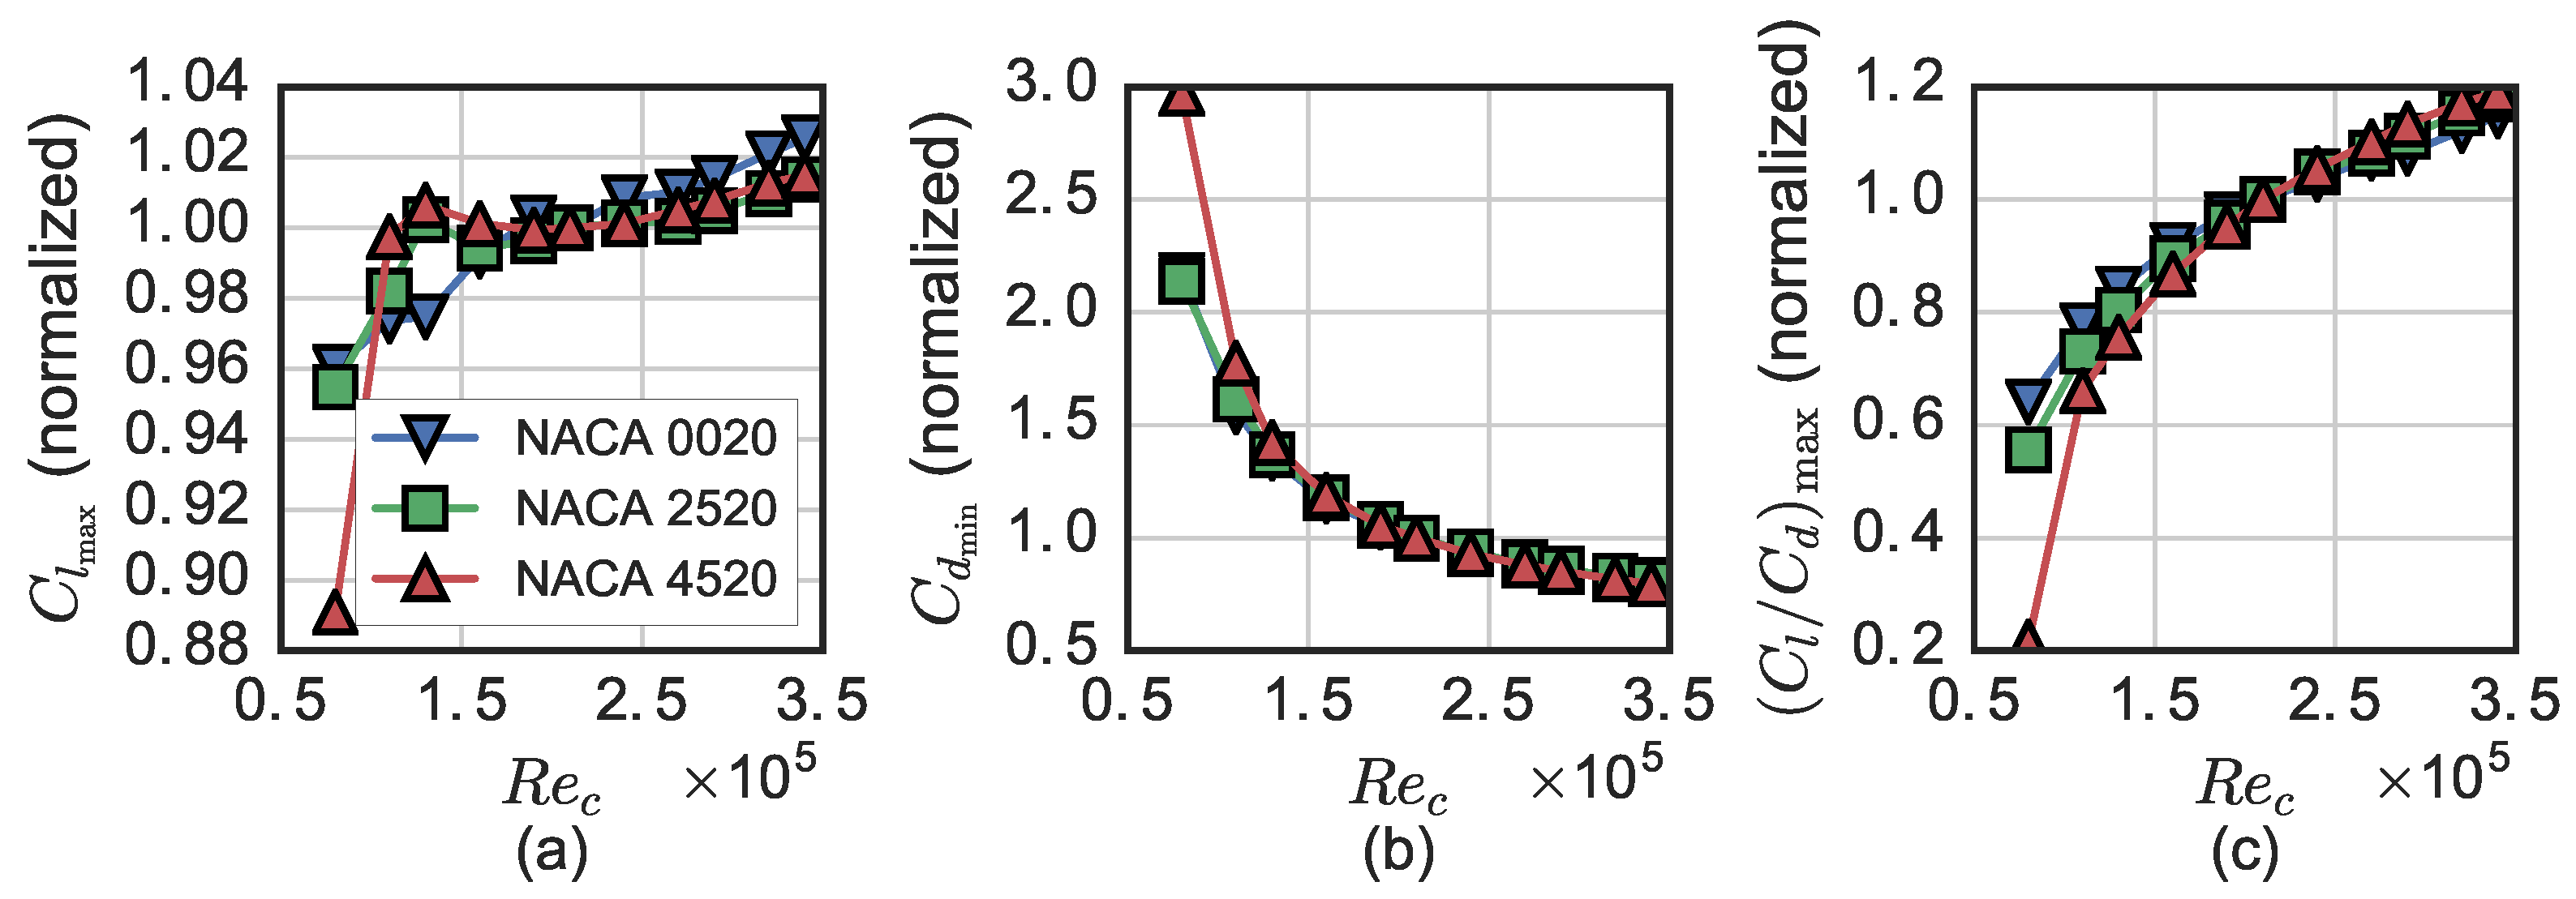
We propose a method for predicting the Reynolds number dependence of a cross-flow turbine using static airfoil characteristics and turbine blade kinematics:
  • Acquire static lift and drag coefficient data for the desired blade profile.
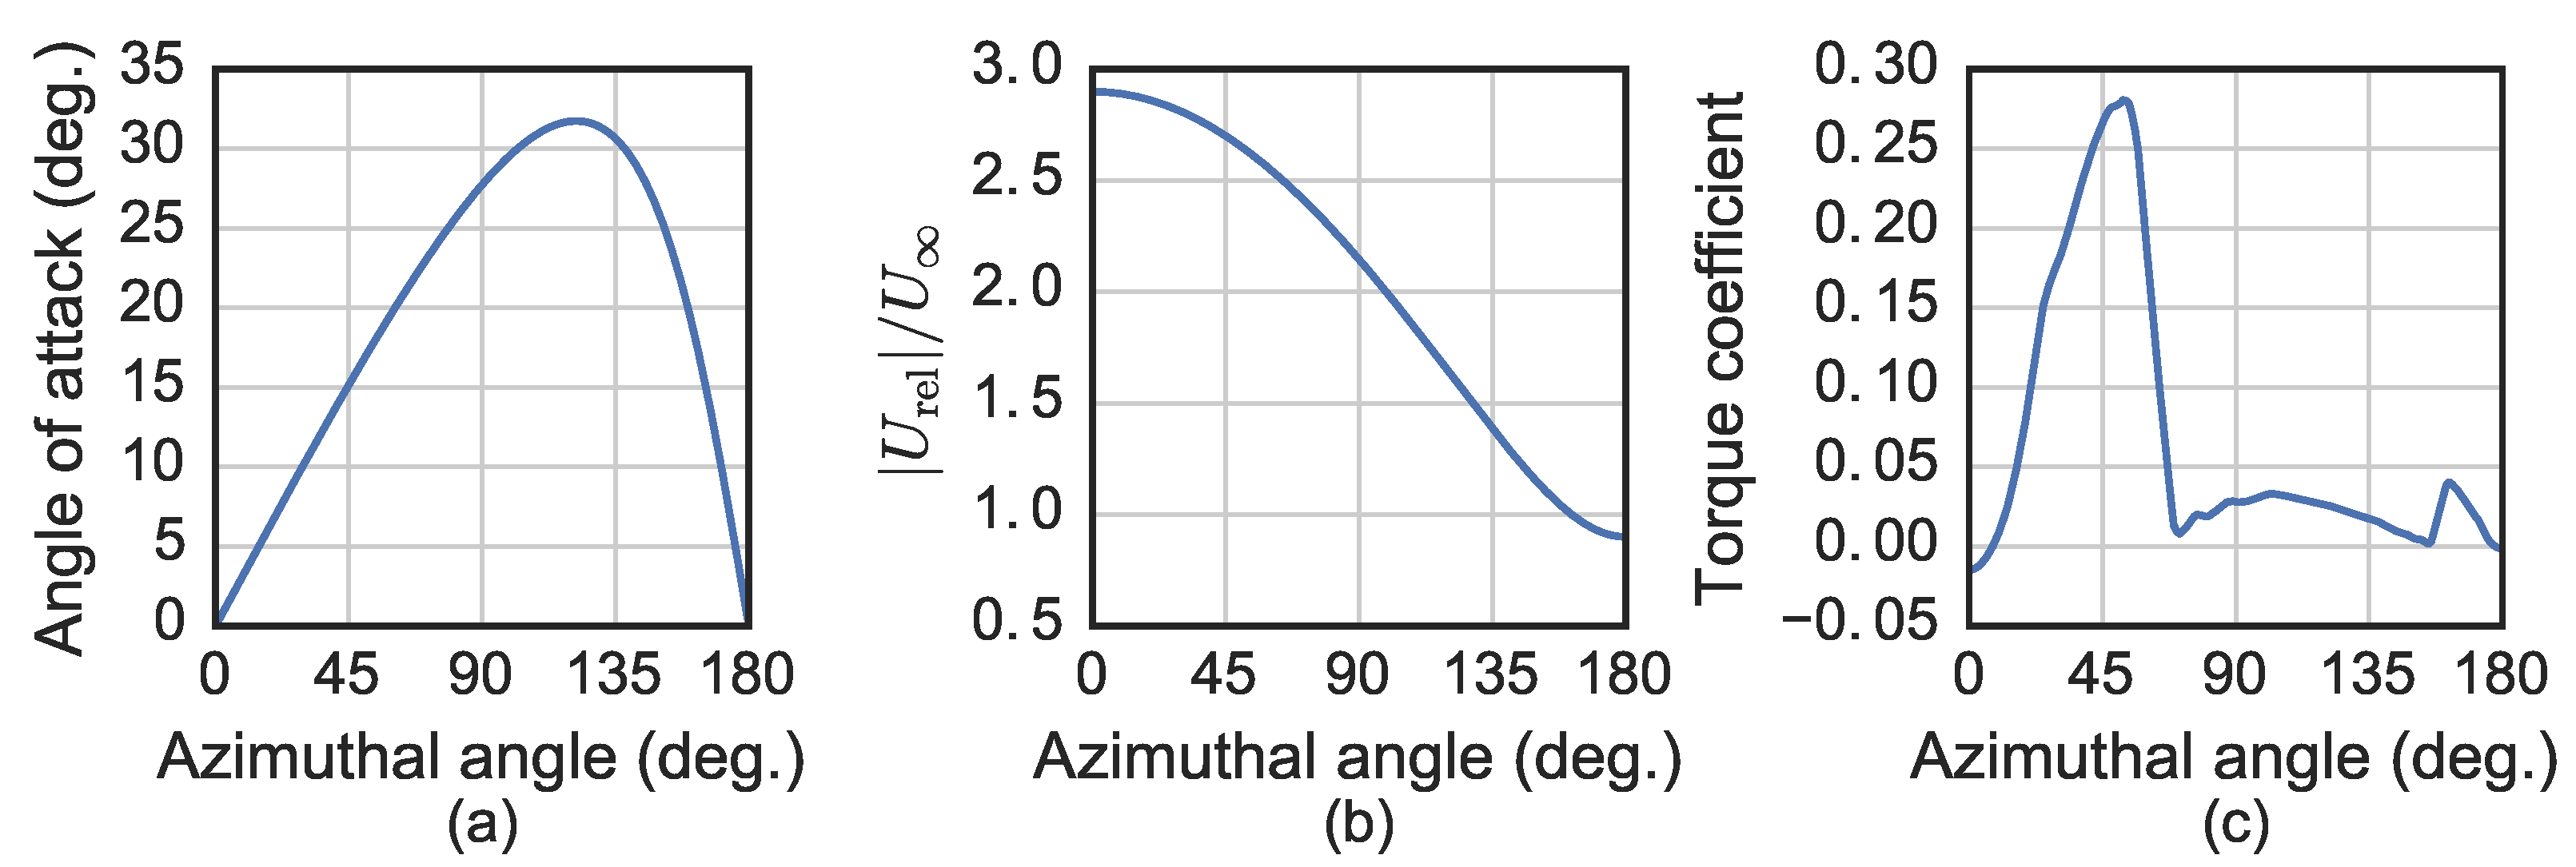
  • For azimuthal angles of 0 to 180 degrees and a given tip speed ratio, calculate the geometric angle of attack and relative velocity magnitude from the blade and undisturbed free stream velocity (taken as unity) vectors.
  • With arrays of geometric angle of attack and relative velocity magnitude, calculate the blade chordwise force and then the rotor torque coefficient from Equations (6) and (7), respectively.
  • Extract the maximum value of C T , and repeat this process for static foil data at multiple R e .
It was shown that the peak torque coefficient computed this way shows similar Reynolds number sensitivity as the experimental results for an actual turbine, making it a better predictor than conventional quantifications of airfoil performance, e.g., the lift-to-drag ratio. Note that this method is not restricted to standard symmetrical NACA foils, though those evaluated here with higher camber were more sensitive at lower R e , but had smaller slopes in the linear regime.
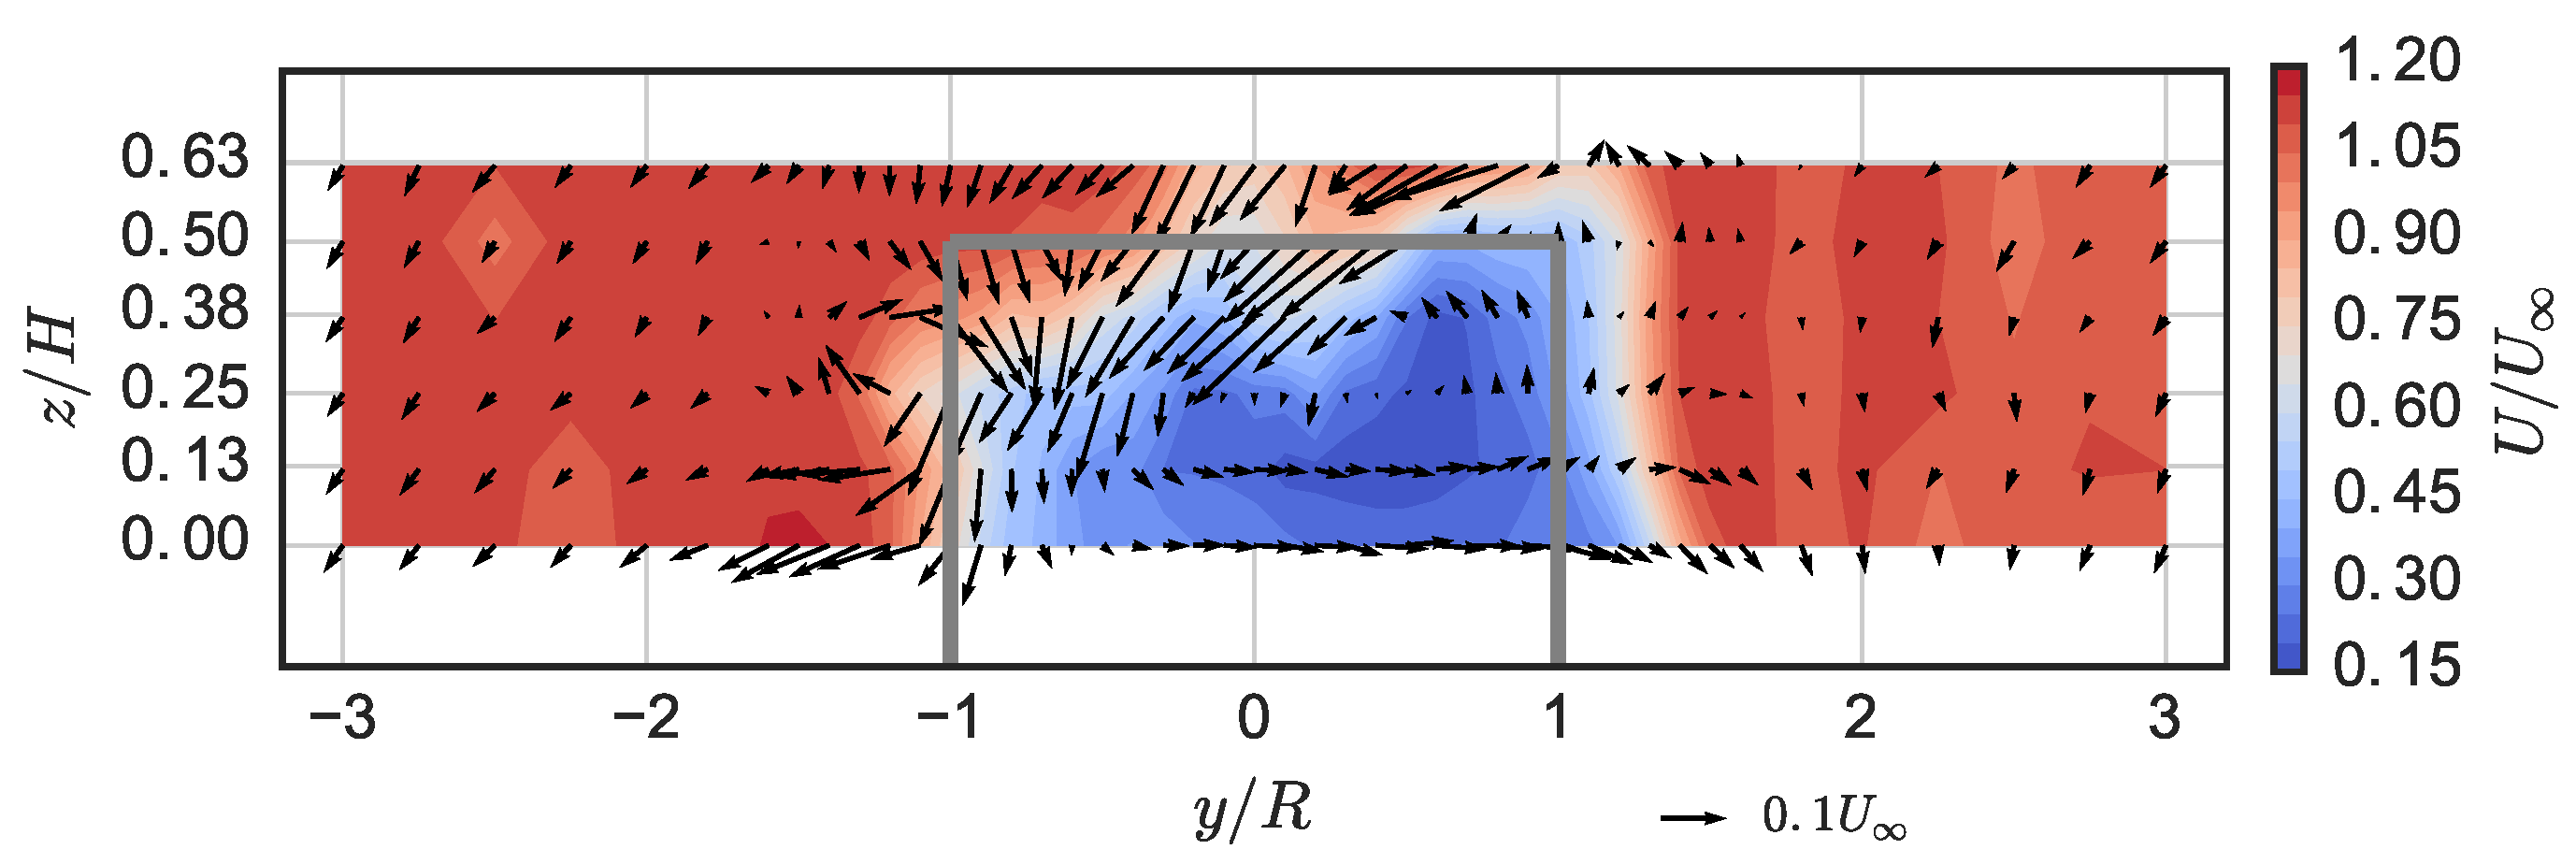
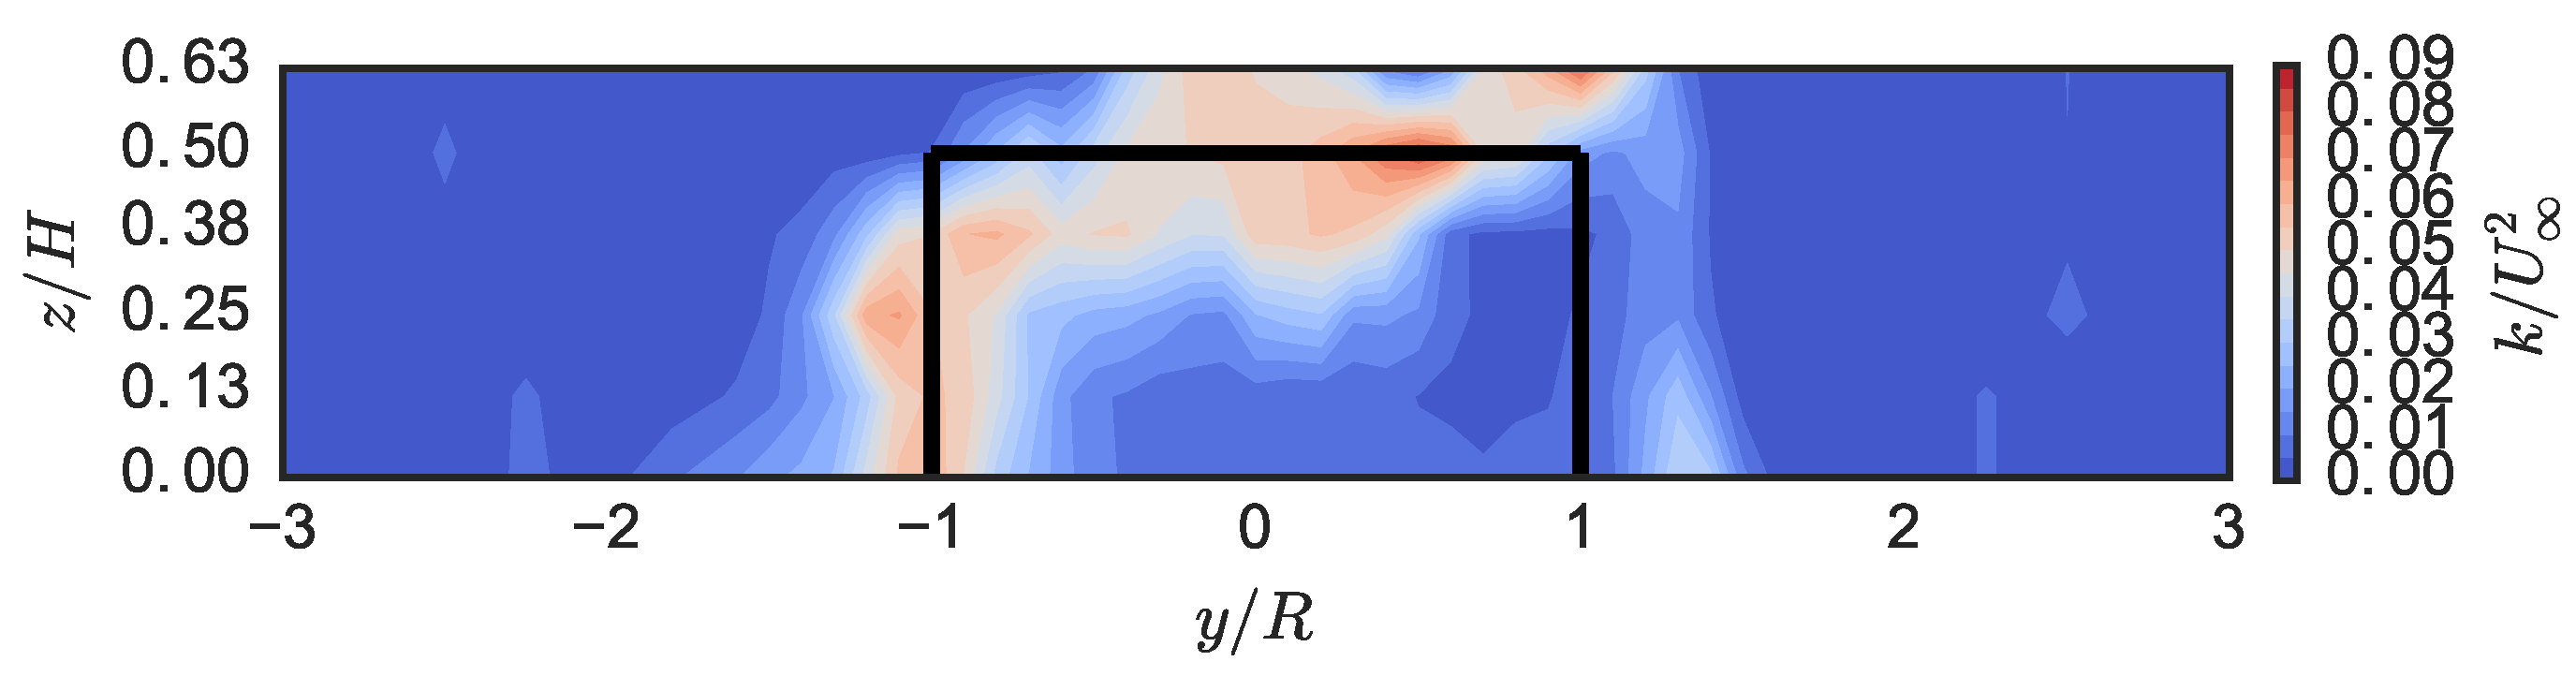
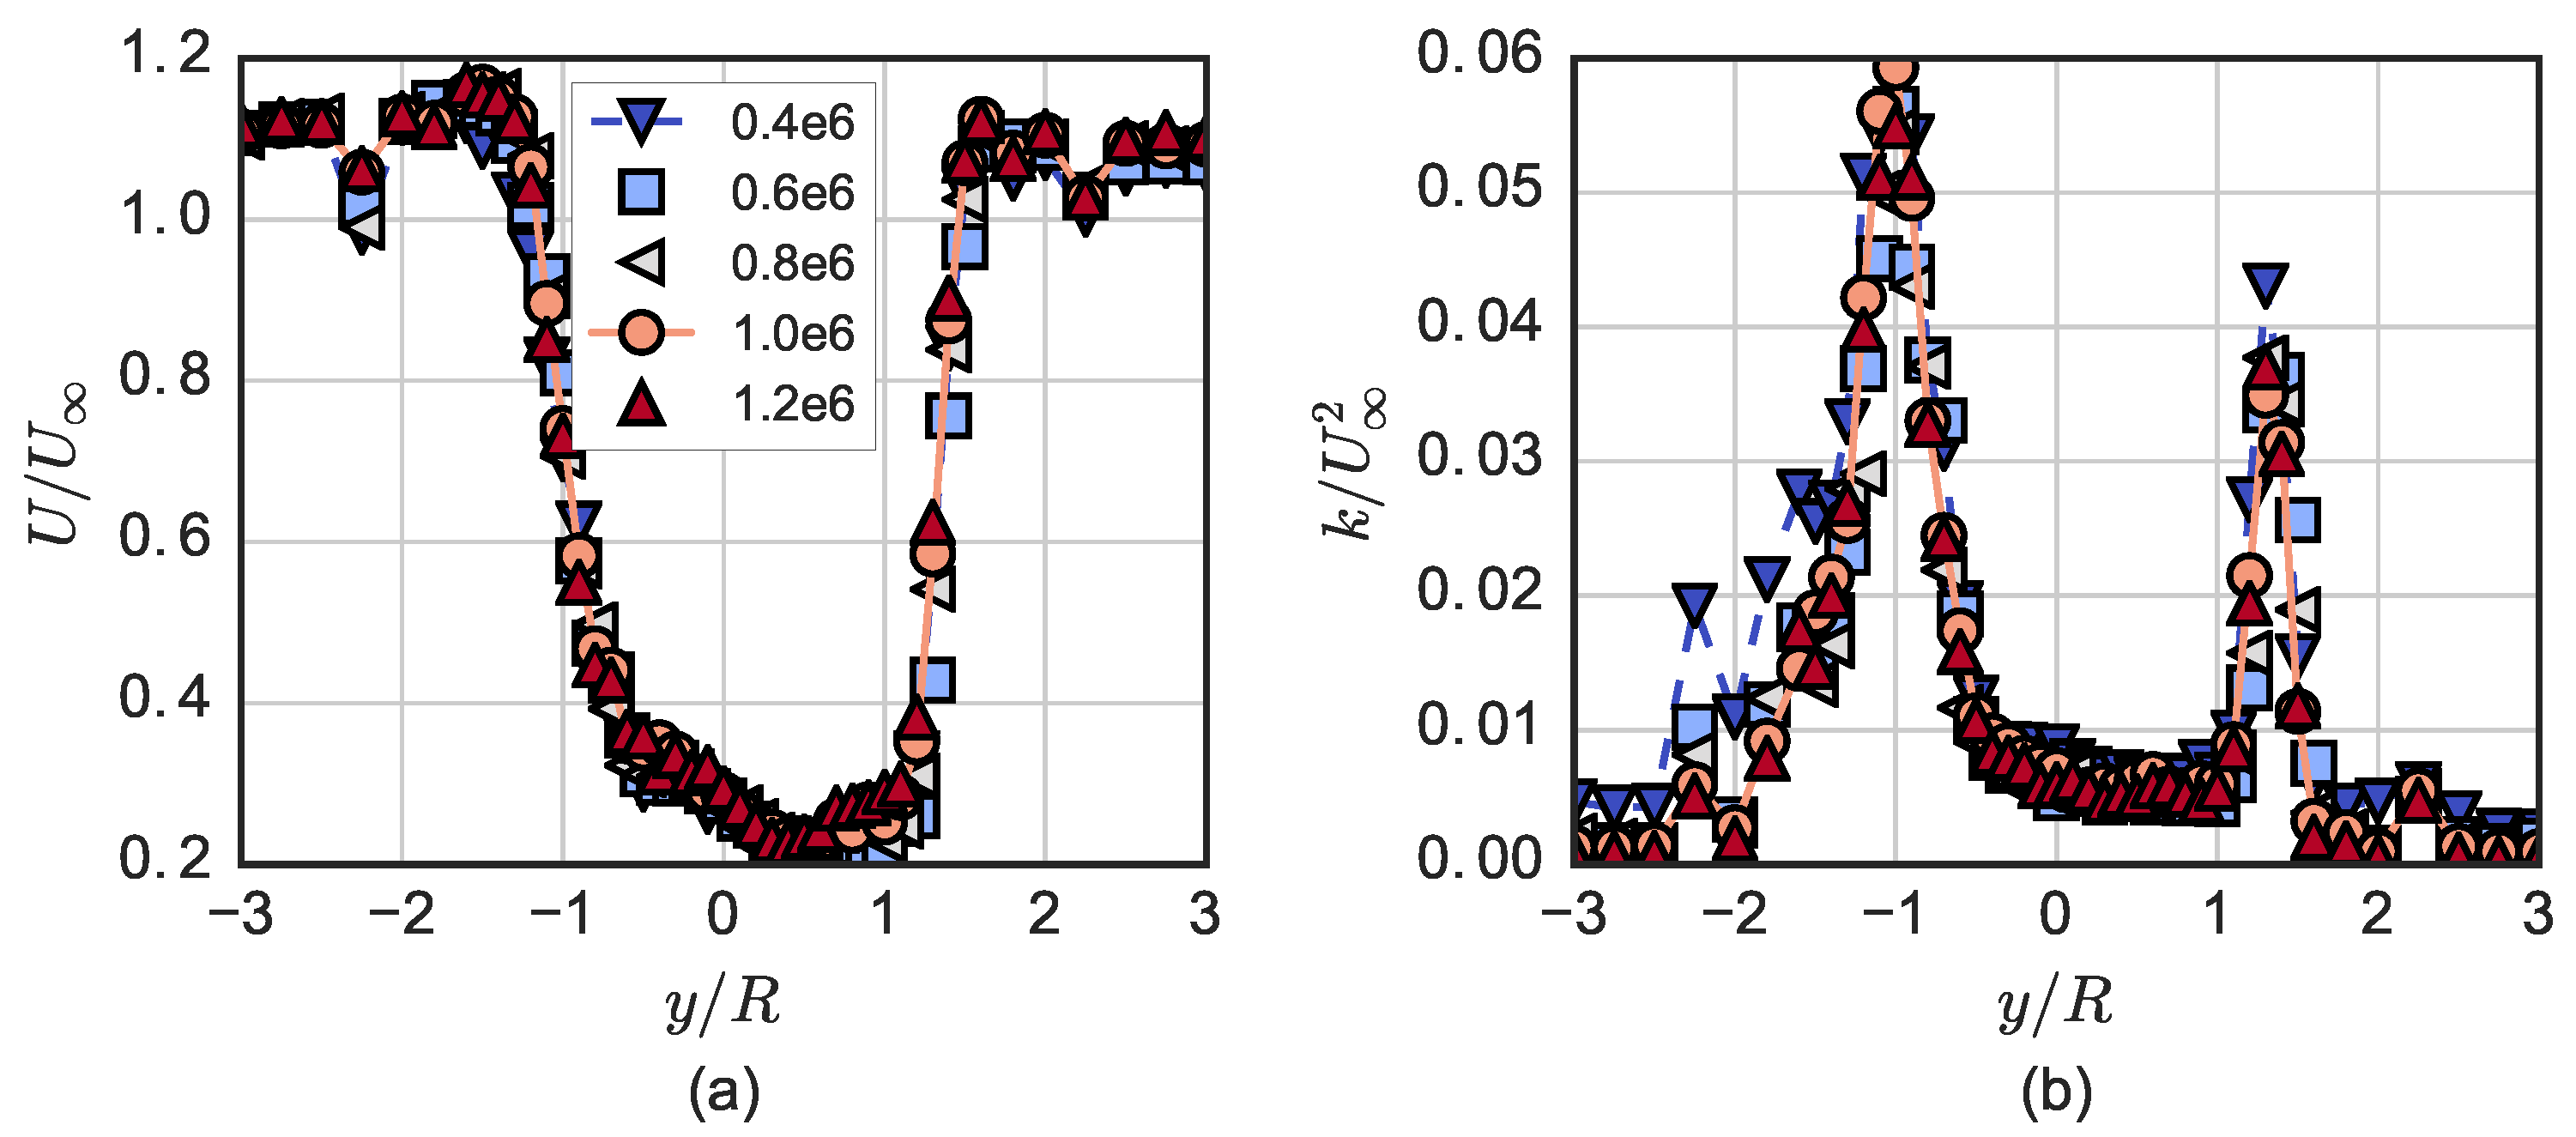
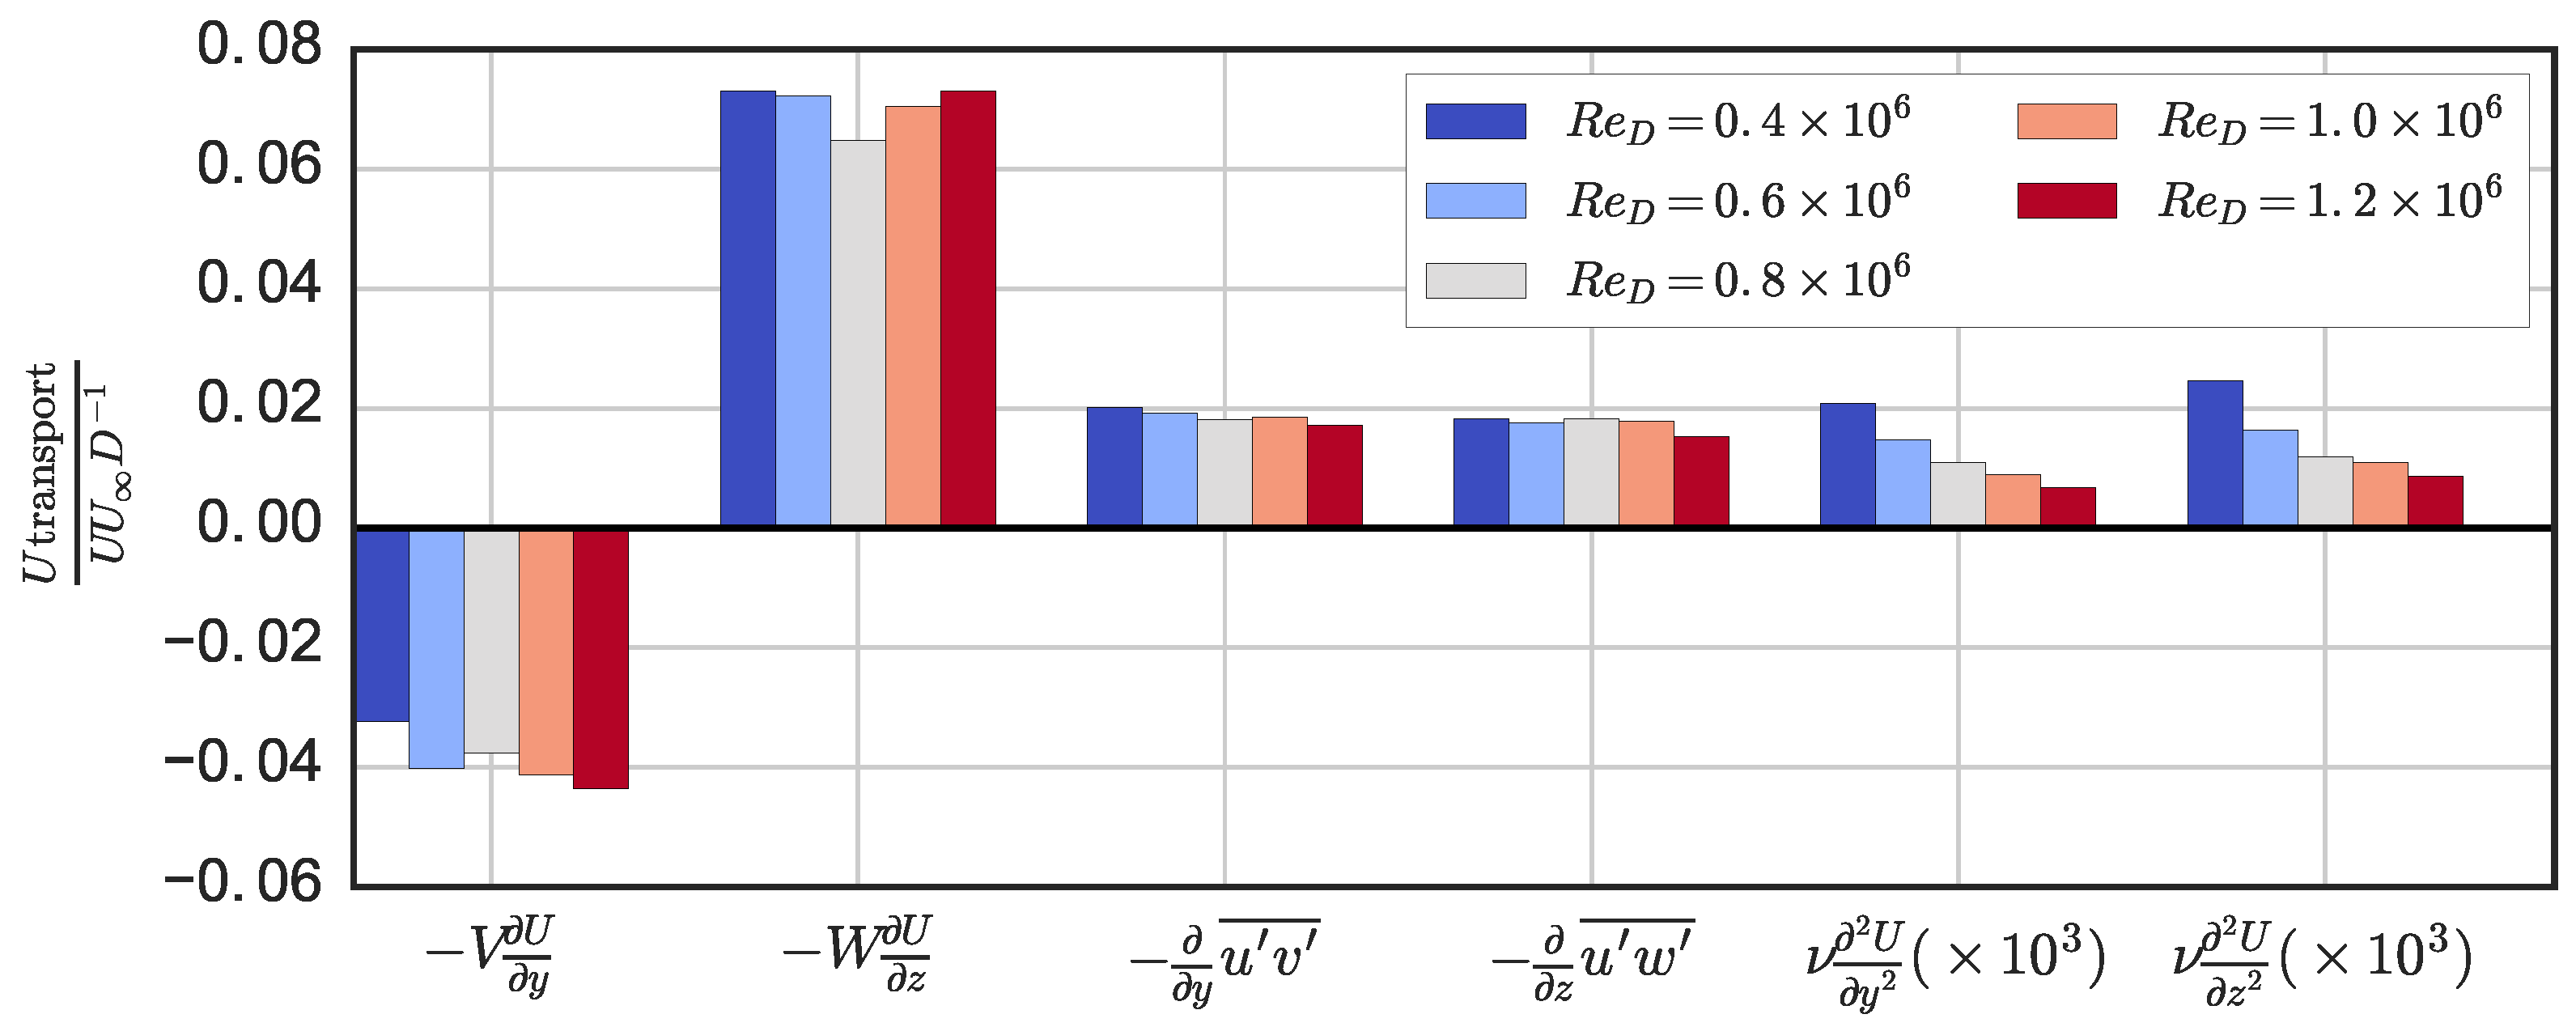
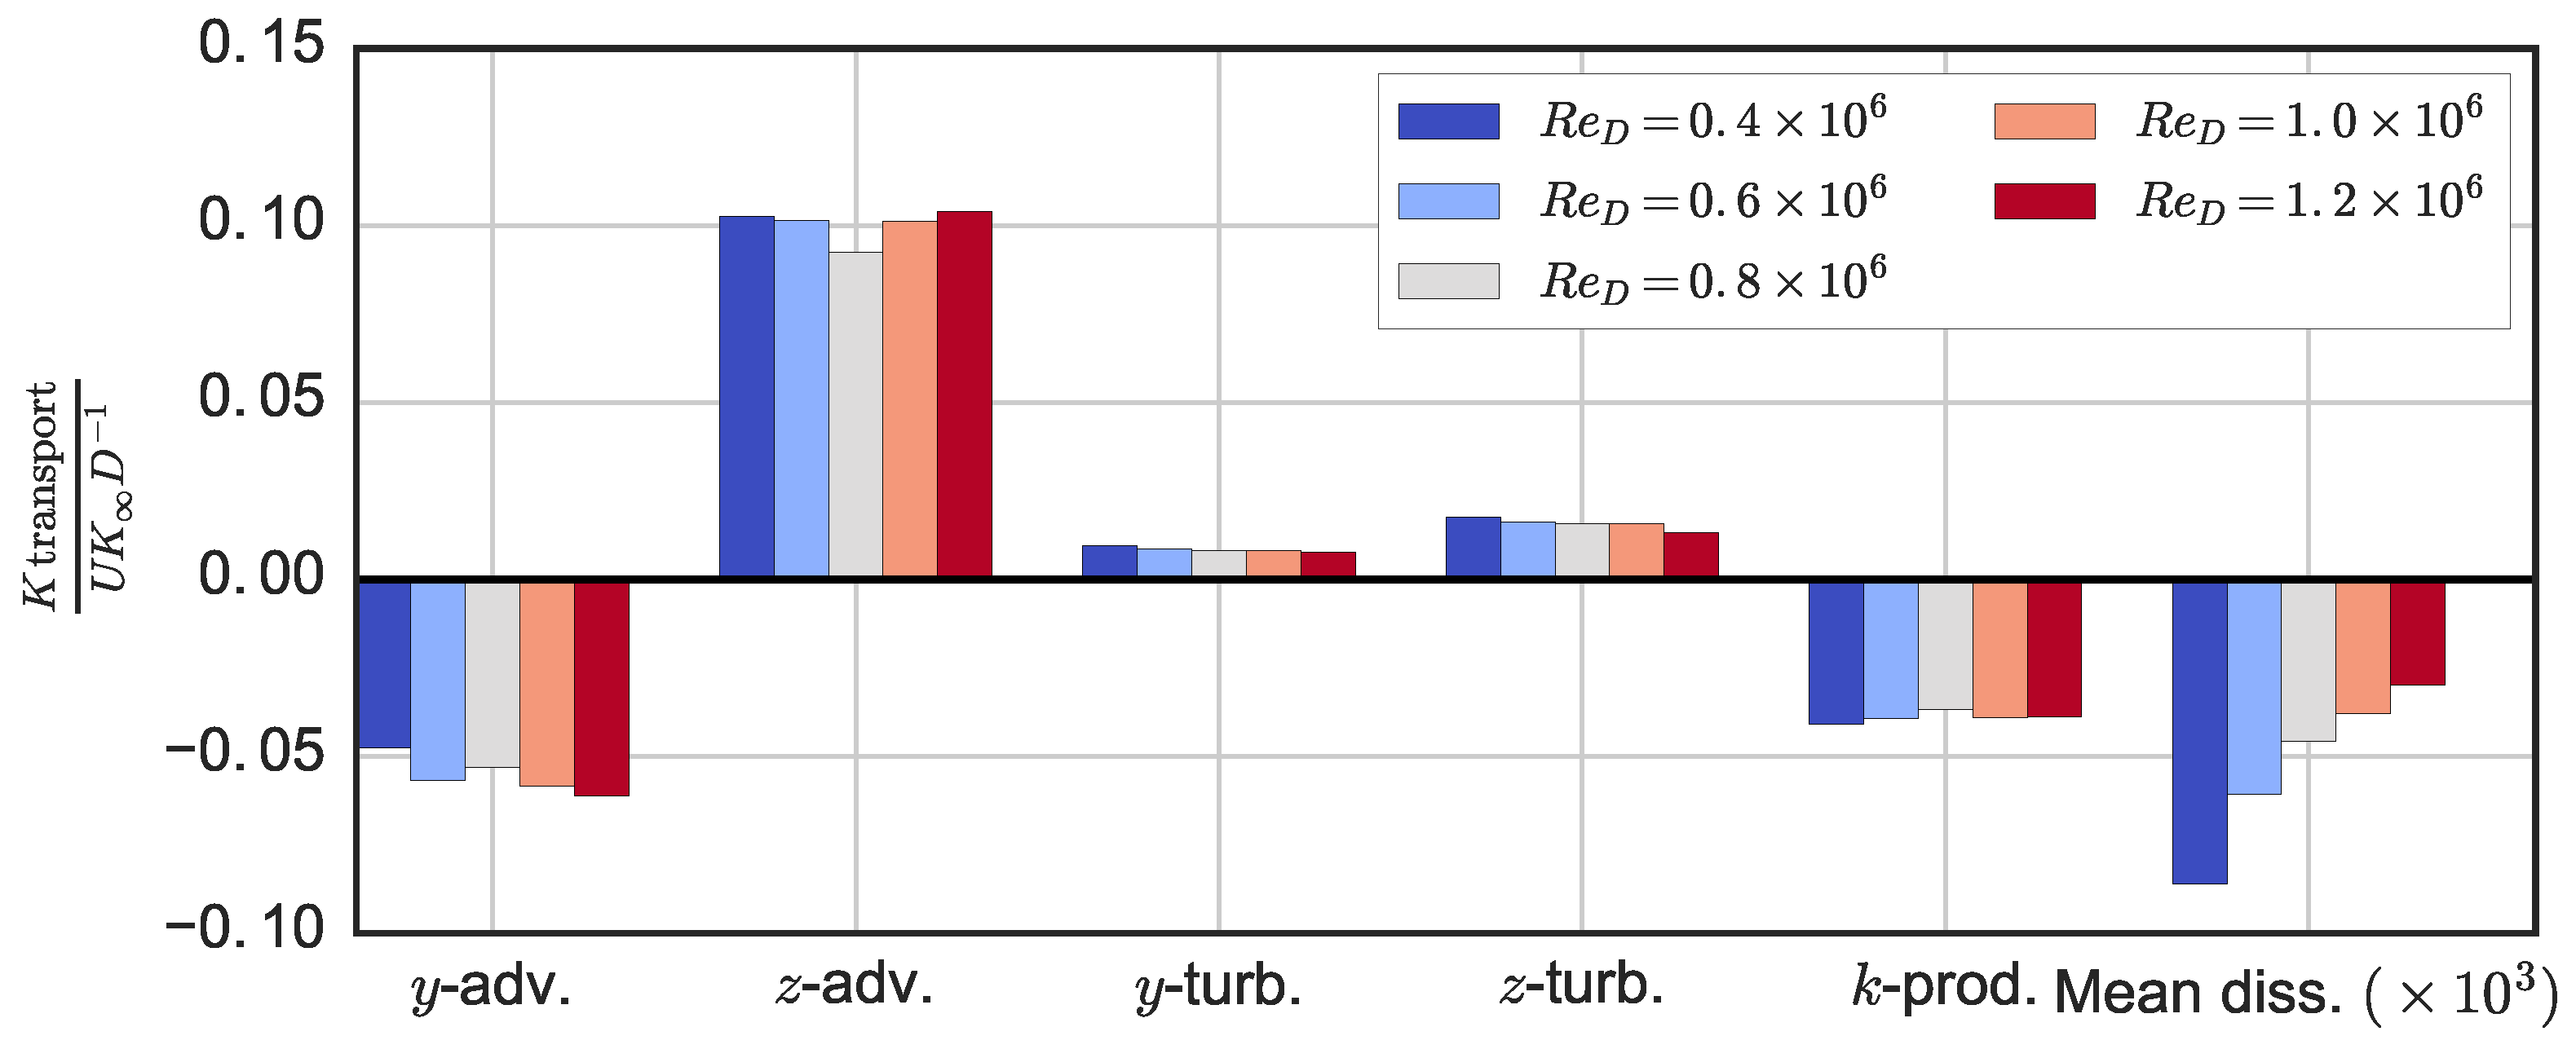
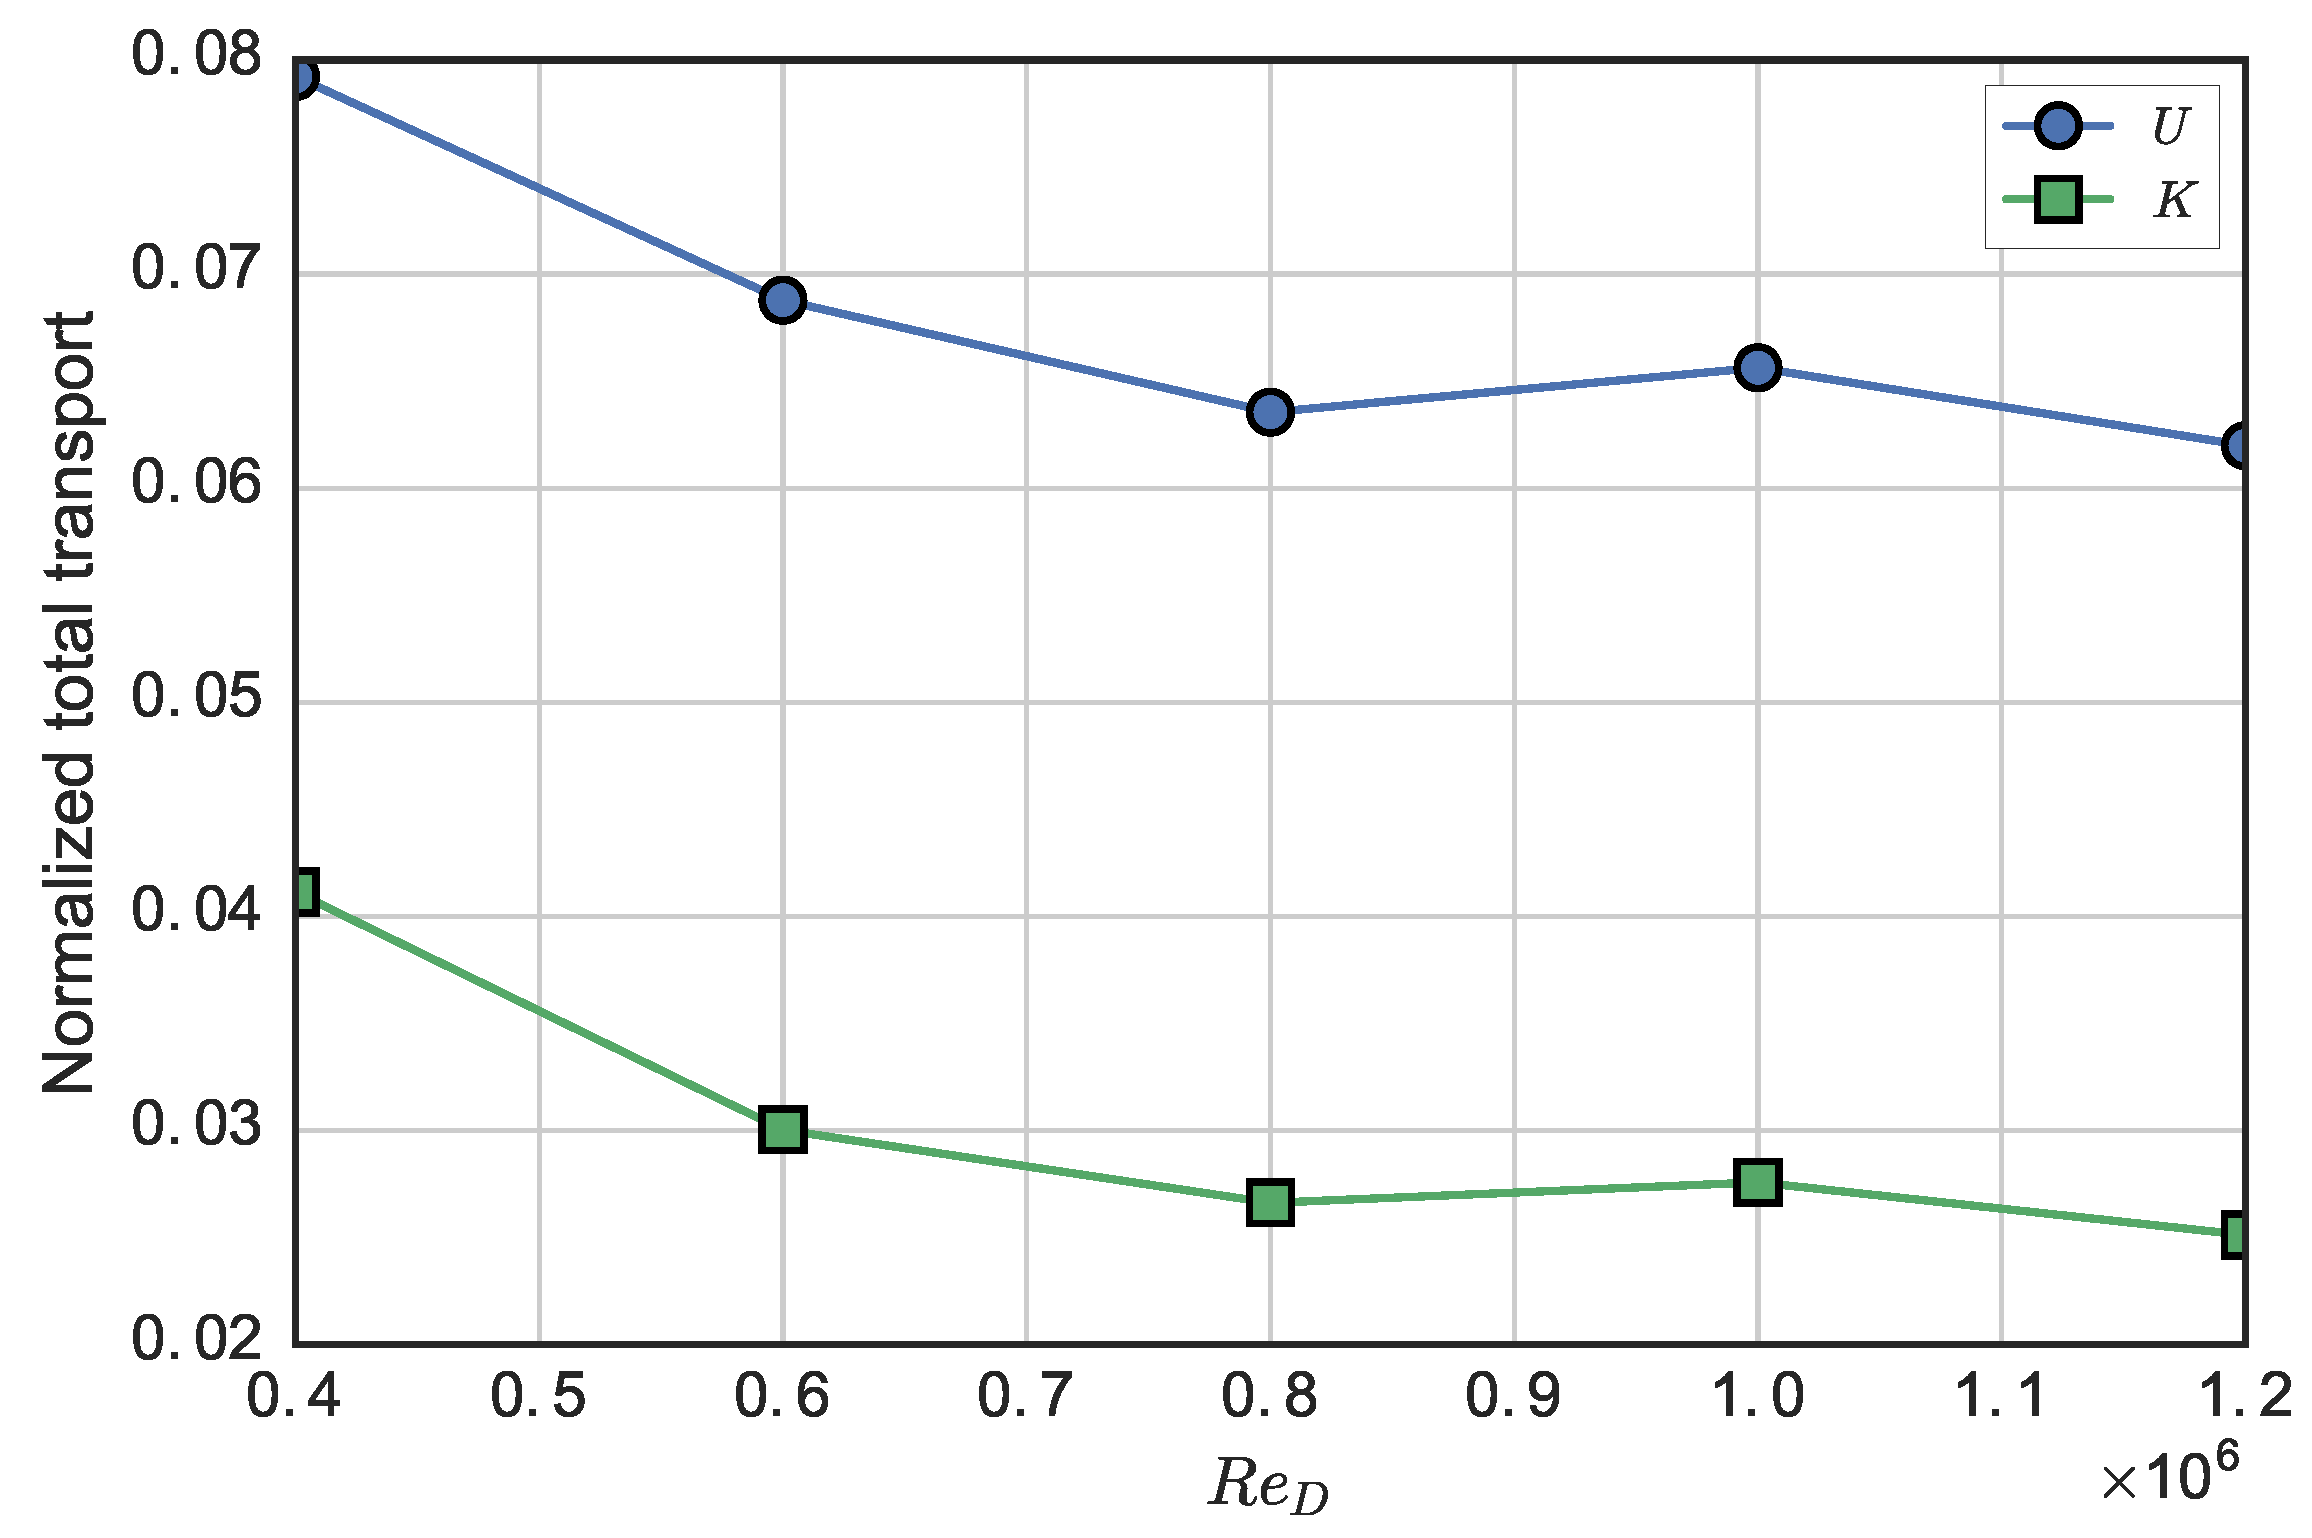
In the near-wake of the turbine, we observed lower levels of turbulence with increasing Reynolds number, along with lower levels of turbulent transport with respect to mean streamwise momentum and mean kinetic energy recovery in the streamwise direction. Vertical advection, the largest transport mechanism measured, showed little R e -dependence, whereas the negative effects of cross-stream advection were enhanced at high R e , which may be due to larger free surface deformation effectively reducing the near-wake’s cross-sectional area. Despite being orders of magnitude smaller than other transport processes, viscous diffusion increased rapidly with decreasing R e and is expected to become significant to the wake dynamics around R e D 10 4 . Overall, the total wake transport measured leveled off at essentially the same Reynolds number that the performance did: R e D 0 . 8 × 10 6 .
From these results, we recommend that physical model tests of cross-flow turbines be performed at R e D 10 6 or greater to provide reasonable predictions of full-scale performance. This threshold also applies to the validation of predictive engineering models, especially for high-fidelity CFD models where the boundary layer is to be resolved, since transition to turbulence plays an important role in overall blade loading. Note that in our case, blockage, though reasonably low, may be increasing flow through the turbine compared to a free case, which could mean R e thresholds for free flows could be slightly higher, though a reliable blockage correction algorithm has not yet been agreed upon for CFTs [32].
If using scaled physical models to predict array performance, where turbine power output is measured, it may also be important to keep all turbines in the regime where the power coefficient varies linearly to avoid exaggerated power deficiencies for downstream turbines, despite similarities in wake characteristics. Results here also suggest that low Reynolds number physical model studies of turbine arrays may see exaggerated levels of wake recovery, leading to inadequate or inappropriate spacing or layouts.

Acknowledgments

The authors would like to acknowledge funding through a National Science Foundation CAREER award (principal investigator Martin Wosnik, NSF 1150797, Energy for Sustainability, program manager Gregory L. Rorrer), a grant through the Leslie S. Hubbard Marine Program Endowment to purchase acoustic flow measurement instrumentation, and a grant for laboratory infrastructure upgrades through the U.S. Department of Energy.

Author Contributions

Peter Bachant conducted the experiments and analyzed the data. Both authors contributed equally to the writing and editing of the manuscript.

Conflicts of Interest

The authors declare no conflict of interest.

References

  1. Acheson, D. Elementary Fluid Dynamics; Oxford University Press: Oxford, UK, 1990. [Google Scholar]
  2. Baker, C.; Brockie, N. Wind tunnel tests to obtain train aerodynamic drag coefficients: Reynolds number and ground simulation effects. J. Wind Eng. Ind. Aerodyn. 1991, 38, 23–28. [Google Scholar] [CrossRef]
  3. Paraschivoiu, I. Wind Turbine Design with Emphasis on Darrieus Concept, 1st ed.; Polytechnic International: Montreal, QC, Canada, 2002. [Google Scholar]
  4. Templin, R.J. Aerodynamic Performance Theory for the NRC Vertical Axis Wind Turbine; Technical Report LTR-LA-160; National Research Council Canada: Ottawa, ON, Canada, 1974. [Google Scholar]
  5. Fiedler, A.J.; Tullis, S. Blade offset and pitch effects on a high solidity vertical axis wind turbine. Wind Eng. 2009, 33, 237–246. [Google Scholar] [CrossRef]
  6. Migliore, P.G.; Wolfe, W.P.; Fanucci, J.B. Flow curvature effects on darrieus turbine blade aerodynamics. J. Energy 1980, 4, 49–55. [Google Scholar] [CrossRef]
  7. Blackwell, B.; Sheldahl, R.; Feltz, L. Wind Tunnel Performance Data for the Darrieus Wind Turbine with NACA 0012 Blades; Report SAND76-0130; Sandia National Laboratories: Albuquerque, NM, USA, 1976. [Google Scholar]
  8. Polagye, B.L.; Cavagnaro, R.J.; Niblick, A.L. Micropower from tidal turbines. In Proceedings of the ASME Fluids Engineering Division Summer Meeting, Incline Village, NV, USA, 7–11 July 2013.
  9. Bravo, R.; Tullis, S.; Ziada, S. Performance testing of a small vertical-axis wind turbine. In Proceedings of the 21st Canadian Congress of Applied Mechanics CANCAM, Toronto, ON, Canada, 3–7 June 2007.
  10. Bachant, P.; Wosnik, M. Reynolds number dependence of cross-flow turbine performance and near-wake characteristics. In Proceedings of the 2nd Marine Energy Technology Symposium METS2014, Seattle, WA, USA, 15–18 April 2014.
  11. Brochier, G.; Fraunie, P.; Beguier, C.; Paraschivoiu, I. Water channel experiments of dynamic stall on darrieus wind turbine blades. AIAA J. Propuls. Power 1986, 2, 46–510. [Google Scholar]
  12. Fujisawa, N.; Shibuya, S. Observations of dynamic stall on Darrieus wind turbine blades. J. Wind Eng. Ind. Aerodyn. 2001, 89, 201–214. [Google Scholar] [CrossRef]
  13. Tescione, G.; Ragni, D.; He, C.; Simão Ferreira, C.J.; van Bussel, G.J.W. Near wake flow analysis of a vertical axis wind turbine by stereoscopic particle image velocimetery. Renew. Energy 2014, 70, 47–61. [Google Scholar] [CrossRef]
  14. Krogstad, P.; Adaramola, M.S. Performance and near wake measurements of a model horizontal axis wind turbine. Wind Energy 2012, 15, 743–756. [Google Scholar] [CrossRef]
  15. Walker, J.M.; Flack, K.A.; Lust, E.E.; Luznik, M.P.S.L. Experimental and numerical studies of blade roughness and fouling on marine current turbine performance. Renew. Energy 2014, 66, 257–267. [Google Scholar] [CrossRef]
  16. McTavish, S.; Feszty, D.; Nitzsche, F. Evaluating Reynolds number effects in small-scale wind turbine experiments. J. Wind Eng. Ind. Aerodyn. 2013, 120, 81–90. [Google Scholar] [CrossRef]
  17. Chamorro, L.P.; Arndt, R.E.A.; Sotiropoulos, F. Turbulent flow properties around a staggered wind farm. Bound. Layer Meteorol. 2011, 141, 349–367. [Google Scholar] [CrossRef]
  18. Chamorro, L.P.; Porte-Agel, F. Turbulent flow inside and above a wind farm: A wind-tunnel study. Energies 2011, 4, 1916–1936. [Google Scholar] [CrossRef]
  19. Goldenberg, J.; Fekete, G. Mean flow energy content of boundary layer downstream of vertical-axis wind-turbine simulators. J. Wind Eng. Ind. Aerodyn. 1983, 12, 1–14. [Google Scholar] [CrossRef]
  20. Dabiri, J. Potential order-of-magnitude enhancement of wind farm power density via counter-rotating vertical-axis wind turbine arrays. J. Renew. Sustain. Energy 2011, 3, 1–13. [Google Scholar] [CrossRef]
  21. Kinzel, M.; Mulligan, Q.; Dabiri, J.O. Energy exchange in an array of vertical-axis wind turbines. J. Turbul. 2012, 13, 1–13. [Google Scholar] [CrossRef]
  22. Bachant, P.; Wosnik, M. Characterising the near-wake of a cross-flow turbine. J. Turbul. 2015, 16, 392–410. [Google Scholar] [CrossRef]
  23. Jacobs, E.N.; Sherman, A. Airfoil Section Characteristics as Affected by Variation of the Reynolds Number; Technical Report; National Advisory Committee for Aeronautics: Langley Field, VA, USA, 1937. [Google Scholar]
  24. Lissaman, P.B.S. Low-Reynolds-number airfoils. Ann. Rev. Fluid Mech. 1983, 15, 223–239. [Google Scholar] [CrossRef]
  25. McMasters, J.H.; Henderson, M.L. Low-speed single-element airfoil synthesis. Tech. Soar. 1980, 6, 1–21. [Google Scholar]
  26. Bedon, G.; Antonini, E.G.; Betta, S.D.; Castelli, M.R.; Benini, E. Evaluation of the different aerodynamic databases for vertical axis wind turbine simulations. Renew. Sustain. Energy Rev. 2014, 40, 386–399. [Google Scholar] [CrossRef]
  27. Bousman, W.G. Evaluation of airfoil dynamic stall characteristics for maneuverability. In Proceedings of the 26th European Rotorcraft Forum, The Hague, The Netherlands, 26–29 September 2000.
  28. Singleton, J.D.; Yeager, W.T., Jr. Important scaling parameters for testing model-scale helicopter rotors. J. Aircr. 2000, 37, 396–402. [Google Scholar] [CrossRef]
  29. Yoon, H.; Hill, D.; Balachandar, S.; Adrian, R.; Ha, M. Reynolds number scaling of flow in a Rushton turbine stirred tank. Part I—Mean flow, circular jet and tip vortex scaling. Chem. Eng. Sci. 2005, 60, 3169–3183. [Google Scholar] [CrossRef]
  30. Chamorro, L.P.; Arndt, R.E.A.; Sotiropolous, F. Reynolds number dependence of turbulence statistics in the wake of wind turbines. Wind Energy 2012, 15, 733–742. [Google Scholar] [CrossRef]
  31. Neary, V.S.; Previsic, M.; Jepsen, R.A.; Lawson, M.J.; Yu, Y.H.; Copping, A.E.; Fontaine, A.A.; Hallett, K.C.; Murray, D.K. Methodology for Design and Economic Analysis of Marine Energy Conversion (MEC) Technologies; Technical Report SAND2014-9040; Sandia National Laboratories: Albuquerque, NM, USA, 2014. [Google Scholar]
  32. Cavagnaro, R.; Polagye, B. An evaluation of blockage corrections for a helical cross-flow turbine. In Proceedings of the 3rd Oxford Tidal Energy Workshop, Oxford, UK, 7–8 April 2014.
  33. Bachant, P.; Wosnik, M. UNH-RVAT CAD Models. Figshare. Available online: http://dx.doi.org/10.6084/m9.figshare.1062009 (accessed on 20 June 2014).
  34. Bachant, P.; Wosnik, M. UNH-RVAT Reynolds Number Dependence Experiment: Reduced Dataset and Processing Code. Figshare. Available online: http://dx.doi.org/10.6084/m9.figshare.1286960 (accessed on 22 January 2016).
  35. Coleman, H.W.; Steele, W.G. Experimentation, Validation, and Uncertainty Analysis for Engineers, 3rd ed.; John Wiley & Sons: Hoboken, NJ, USA, 2009. [Google Scholar]
  36. Drela, M. XFOIL: An Analysis and Design System for Low Reynolds Number Airfoils. In Low Reynolds Number Aerodynamics; Lecture Notes in Engineering; Springer Verlag: Berlin, Germany, 1989; Volume 54. [Google Scholar]
  37. Castelli, M.R.; Garbo, F.; Benini, E. Numerical investigation of laminar to turbulent boundary layer transition on a NACA 0012 airfoil for vertical-axis wind turbine applications. Wind Eng. 2011, 35, 661–686. [Google Scholar] [CrossRef]
  38. Marten, D.; Wendler, J.; Pechlivanoglou, G.; Nayeri, C.; Paschereit, C. QBlade: An open source tool for design and simulation of horizontal and vertical axis wind turbines. Int. J. Emerg. Technol. Adv. Eng. 2013, 3, 264–269. [Google Scholar]
  39. Bachant, P.; Wosnik, M. NACA XX20 XFOIL Coefficients. Zenodo. Available online: http://dx.doi.org/10.5281/zenodo.45099 (accessed on 22 January 2016).
  40. Carmichael, B.H. Low Reynolds Number Airfoil Survey Volume I; Technical Report; National Aeronautics and Space Administration: Capistrano Beach, CA, USA, 1981.

