4.1. Influence Rules of DG Integration
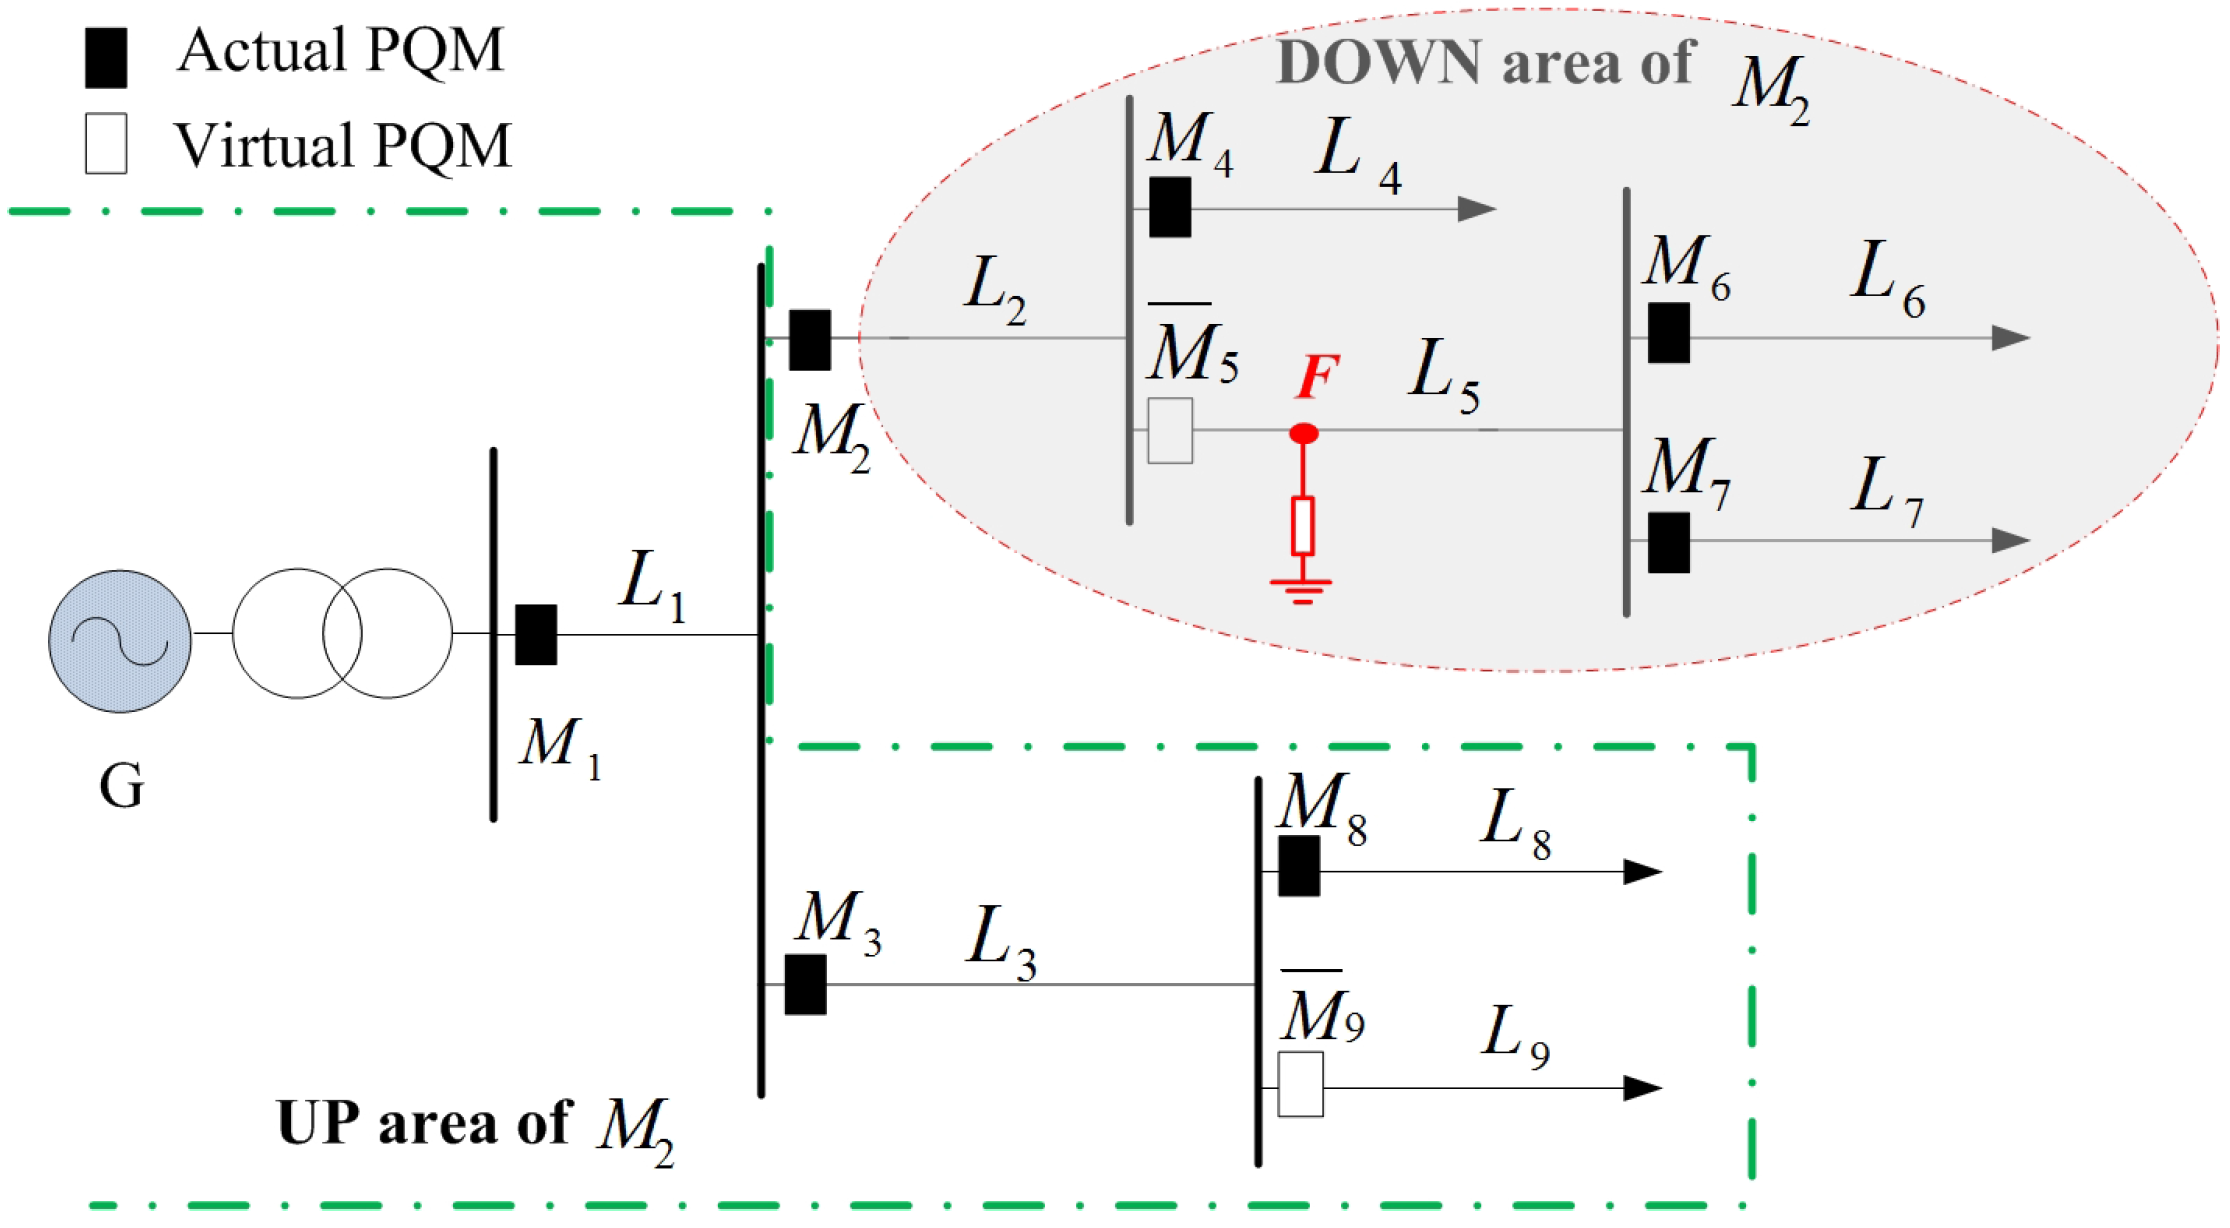
To analyze the general influence of the DG integration, we first transform the grid shown in
Figure 1 to a scalable topology as shown in
Figure 8. The partial networks
represent any sub-networks with tree structure, which makes this model scalable for grids with radial structure. Moreover, we assume that one DG is connected to the grid at
and a voltage-sag event
F takes place at
.
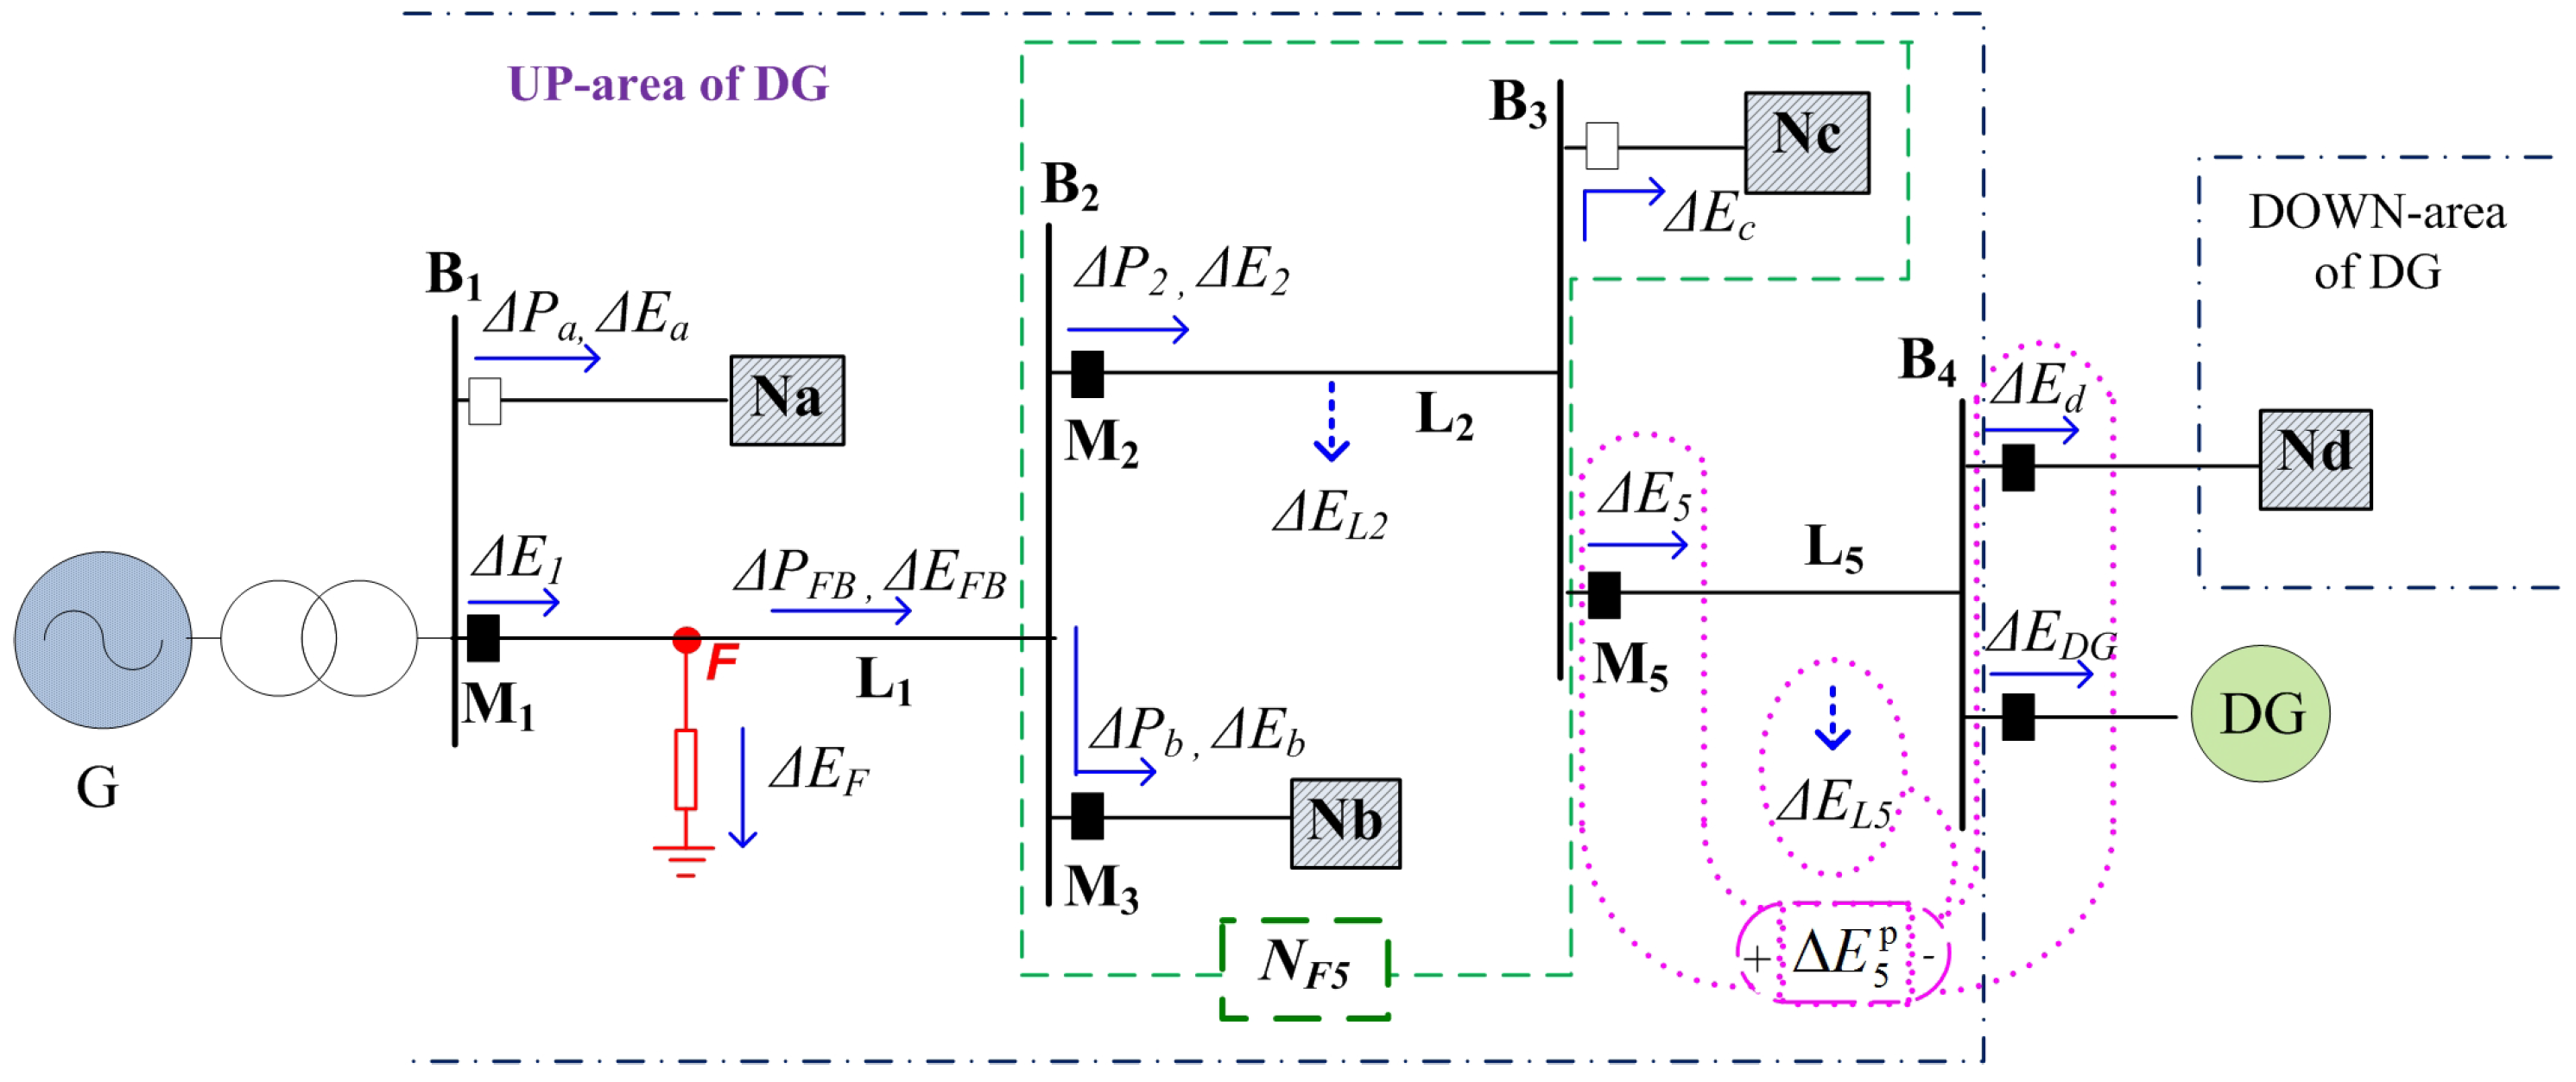
In
Figure 8, we introduced the following notions: (1)
denotes the path from arbitrary component A to B in the grid; (2)
is the link between G and DG, i.e.,
; (3)
is the link between DG and TVDS, i.e.,
; (4)
is the bus connected to TVDS at the side of DG; and (5)
is the current-dividing network that includes all the partial networks and lines between
and
. In addition,
and
are the DP and DE values at
,
and
are the voltage variations at
F and bus
in
Figure 8 during the voltage-sag event,
is the DE value at TVDS,
and
are the DP and DE values transmitted from TVDS to
, and
and
are the DP and DE values absorbed by
.
For the scalable topology shown in
Figure 8, we can further distinguish it into different scenarios:
Scenario 1: F is on , is on , , and .
Scenario 2: F is on , is on , but and .
Scenario 3: F is on , but is not on .
Scenario 4: F is not on , and F is on the branch of in the UP-area of DG.
Scenario 5: F is not on , and F is in the DOWN-area of DG.
(1) Scenario 1 and Scenario 2
In Scenario 1 and 2, since voltage sag is an energy-absorbing disturbance, we have
,
and
. The power flow at
could be positive or negative for the DG integration. But in either situation, we have
,
,
and
. Based on the energy conservation law at
, we can obtain
and
. Given that
is actually
, two cases of the DP and DE algorithms of direction-judgment at
can be deduced as:
The direction-judgment at
will be incorrect if
or
. The same observation applies for the result obtained at
, and two possible direction-judgments at
can be obtained according to the components of
shown in
Figure 8. The direction-judgment at
will be wrong if
or
.
The scalable topology shown in
Figure 8 can represent arbitrary distribution grid with a tree topology and single-DG integration. Subsequently, we can conclude the first influence rule of DG integration in direction-judgment as follows:
First influence rule: the direction-judgment at is wrong and should be reversed if the TVDS is on , is on , and for DP signal or for DE signal.
In the following discussion of Scenario 3 to 5, we will use the DE algorithm as an example to analyze the influence of DG integration for the direction-judgment.
(2) Scenario 3
In Scenario 3, there exist
,
,
,
, and
when the voltage-sag occurs at
F. Considering the effect of voltage stability of the DG integration, there also exist
,
,
and
, where
,
,
and
are the variable values of voltage at the buses
,
,
and
if there has no DG integration, respectively. Except for the PQMs on
, the variations of the DE values of the PQMs in the UP-area of TVDS (e.g.,
,
), on the branch of
(e.g.,
,
) and in the DOWN-area of DG (e.g.,
), can be summarized as:
where
,
,
,
and
are the variations of the DE values at
,
,
,
and
if there has no DG integration, respectively.
In
Figure 8, the given TVDS (i.e.,
F) is in the UP-area of
,
,
and
, while in the DOWN-area of
. Therefore, the results of direction-judgment at all the PQMs except for those are on
are correct in this scenario, but only their disturbance intensities could be affected.
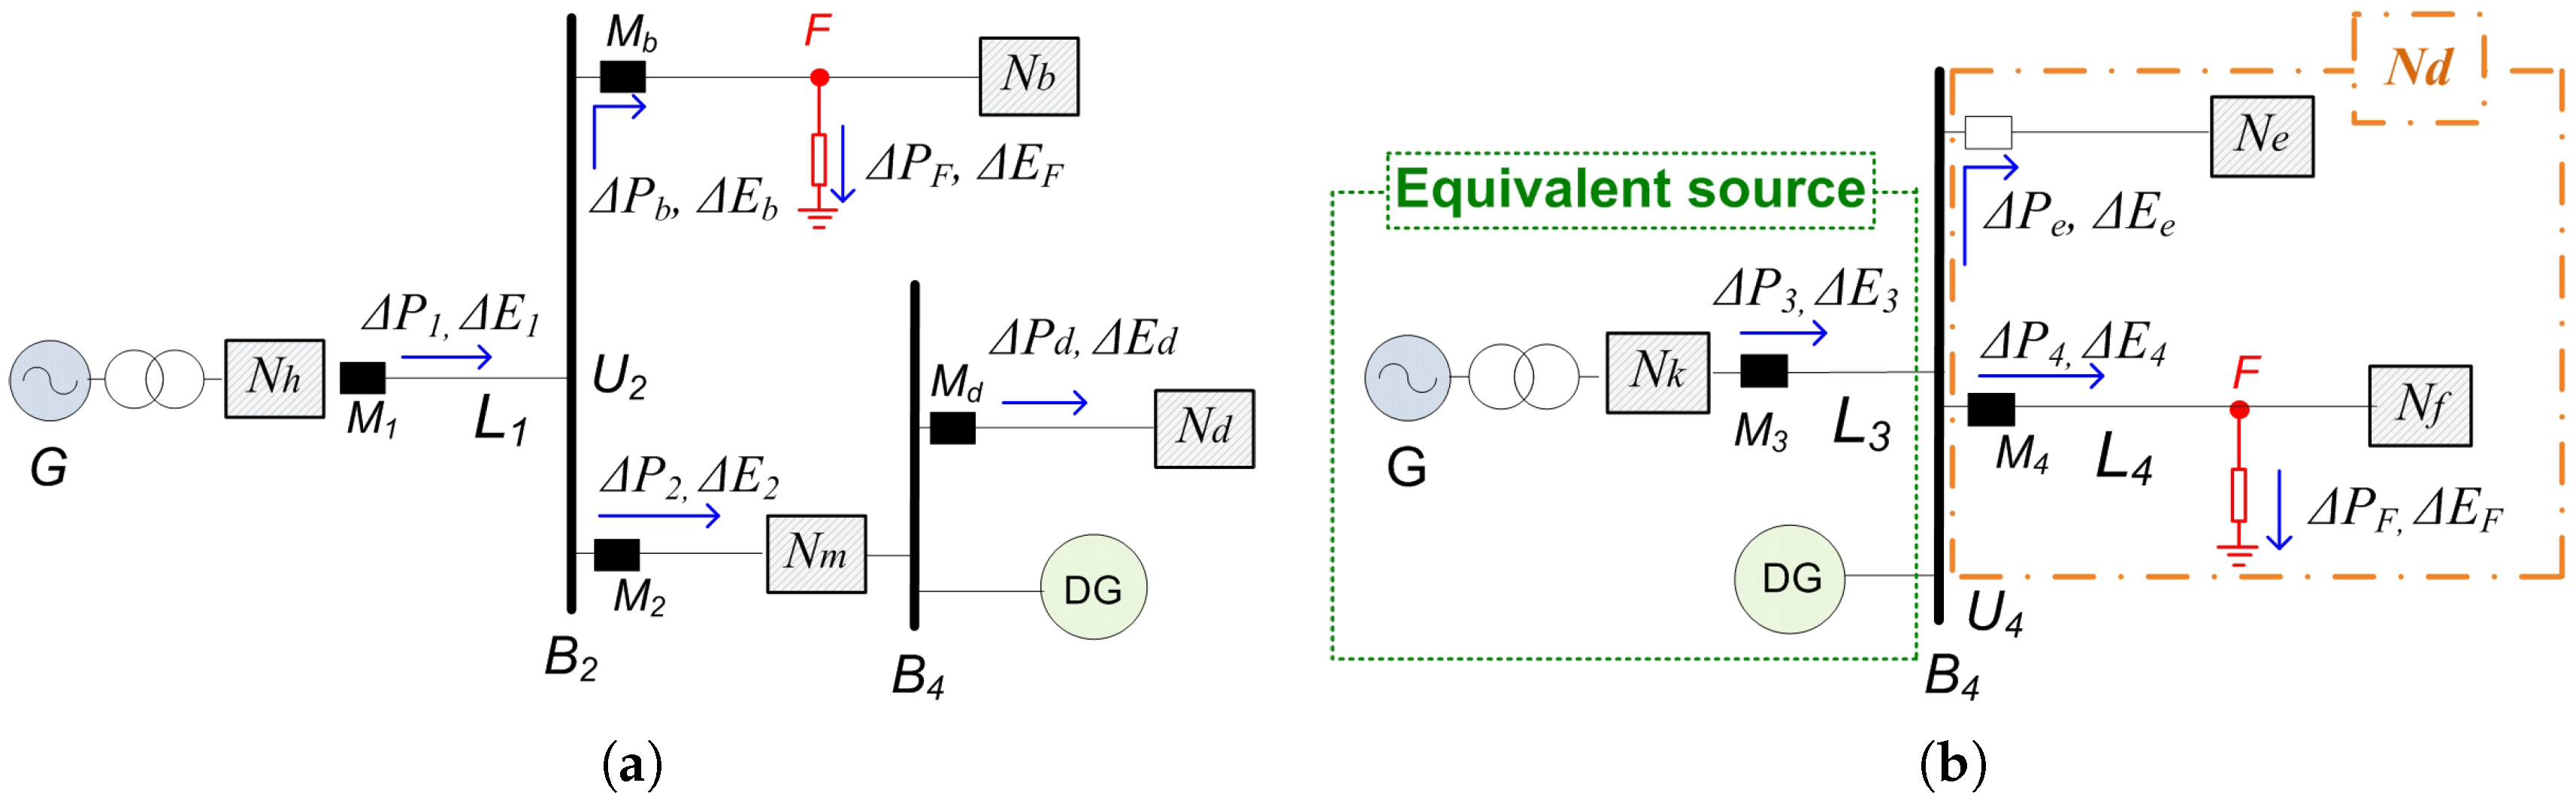
(3) Scenario 4 and Scenario 5
In Scenario 4, the simplified scalable topology of
Figure 8 is shown in
Figure 9a, where we have
,
and
when the voltage-sag occurs at
F. Considering the effect of voltage stability of the DG integration, there also exist
and
. The variations of the DE values at the PQMs in this scenario are:
where
,
are the variations of the DE values at
and
if there has no DG integration, respectively.
In
Figure 9a, the given TVDS (i.e.,
F) is in the UP-area of
and
, while in the DOWN-area of
and
. Therefore, the results of direction-judgment at all the PQMs are correct in this scenario, but the disturbance intensities could be affected.
In Scenario 5, the simplified scalable topology is shown in
Figure 9b. The partial network
is expanded to two sub-networks (i.e.,
and
), and G and DG can be regarded as one equivalent source. Similarly, we have
. The variations of the DE values at the PQMs in this scenario can be deduced as:
where
,
are the variations of the DE values at
and
if there has no DG integration, respectively.
In
Figure 9b, the given TVDS (i.e.,
F) is in the UP-area of
and the DOWN-area of
and
. Therefore, the results of direction-judgment at all the PQMs are correct in this scenario, but the disturbance intensities could be affected.
Combining the analyses of Scenario 2, Scenario 3, Scenario 4, and Scenario 5, we can derive the second influence rule of DG integration in direction-judgment:
Second influence rule: in cases other than state in the first rule, only the intensity of transient voltage disturbance is influenced by the DG integration; the signs of the direction-judgments remain unaffected.
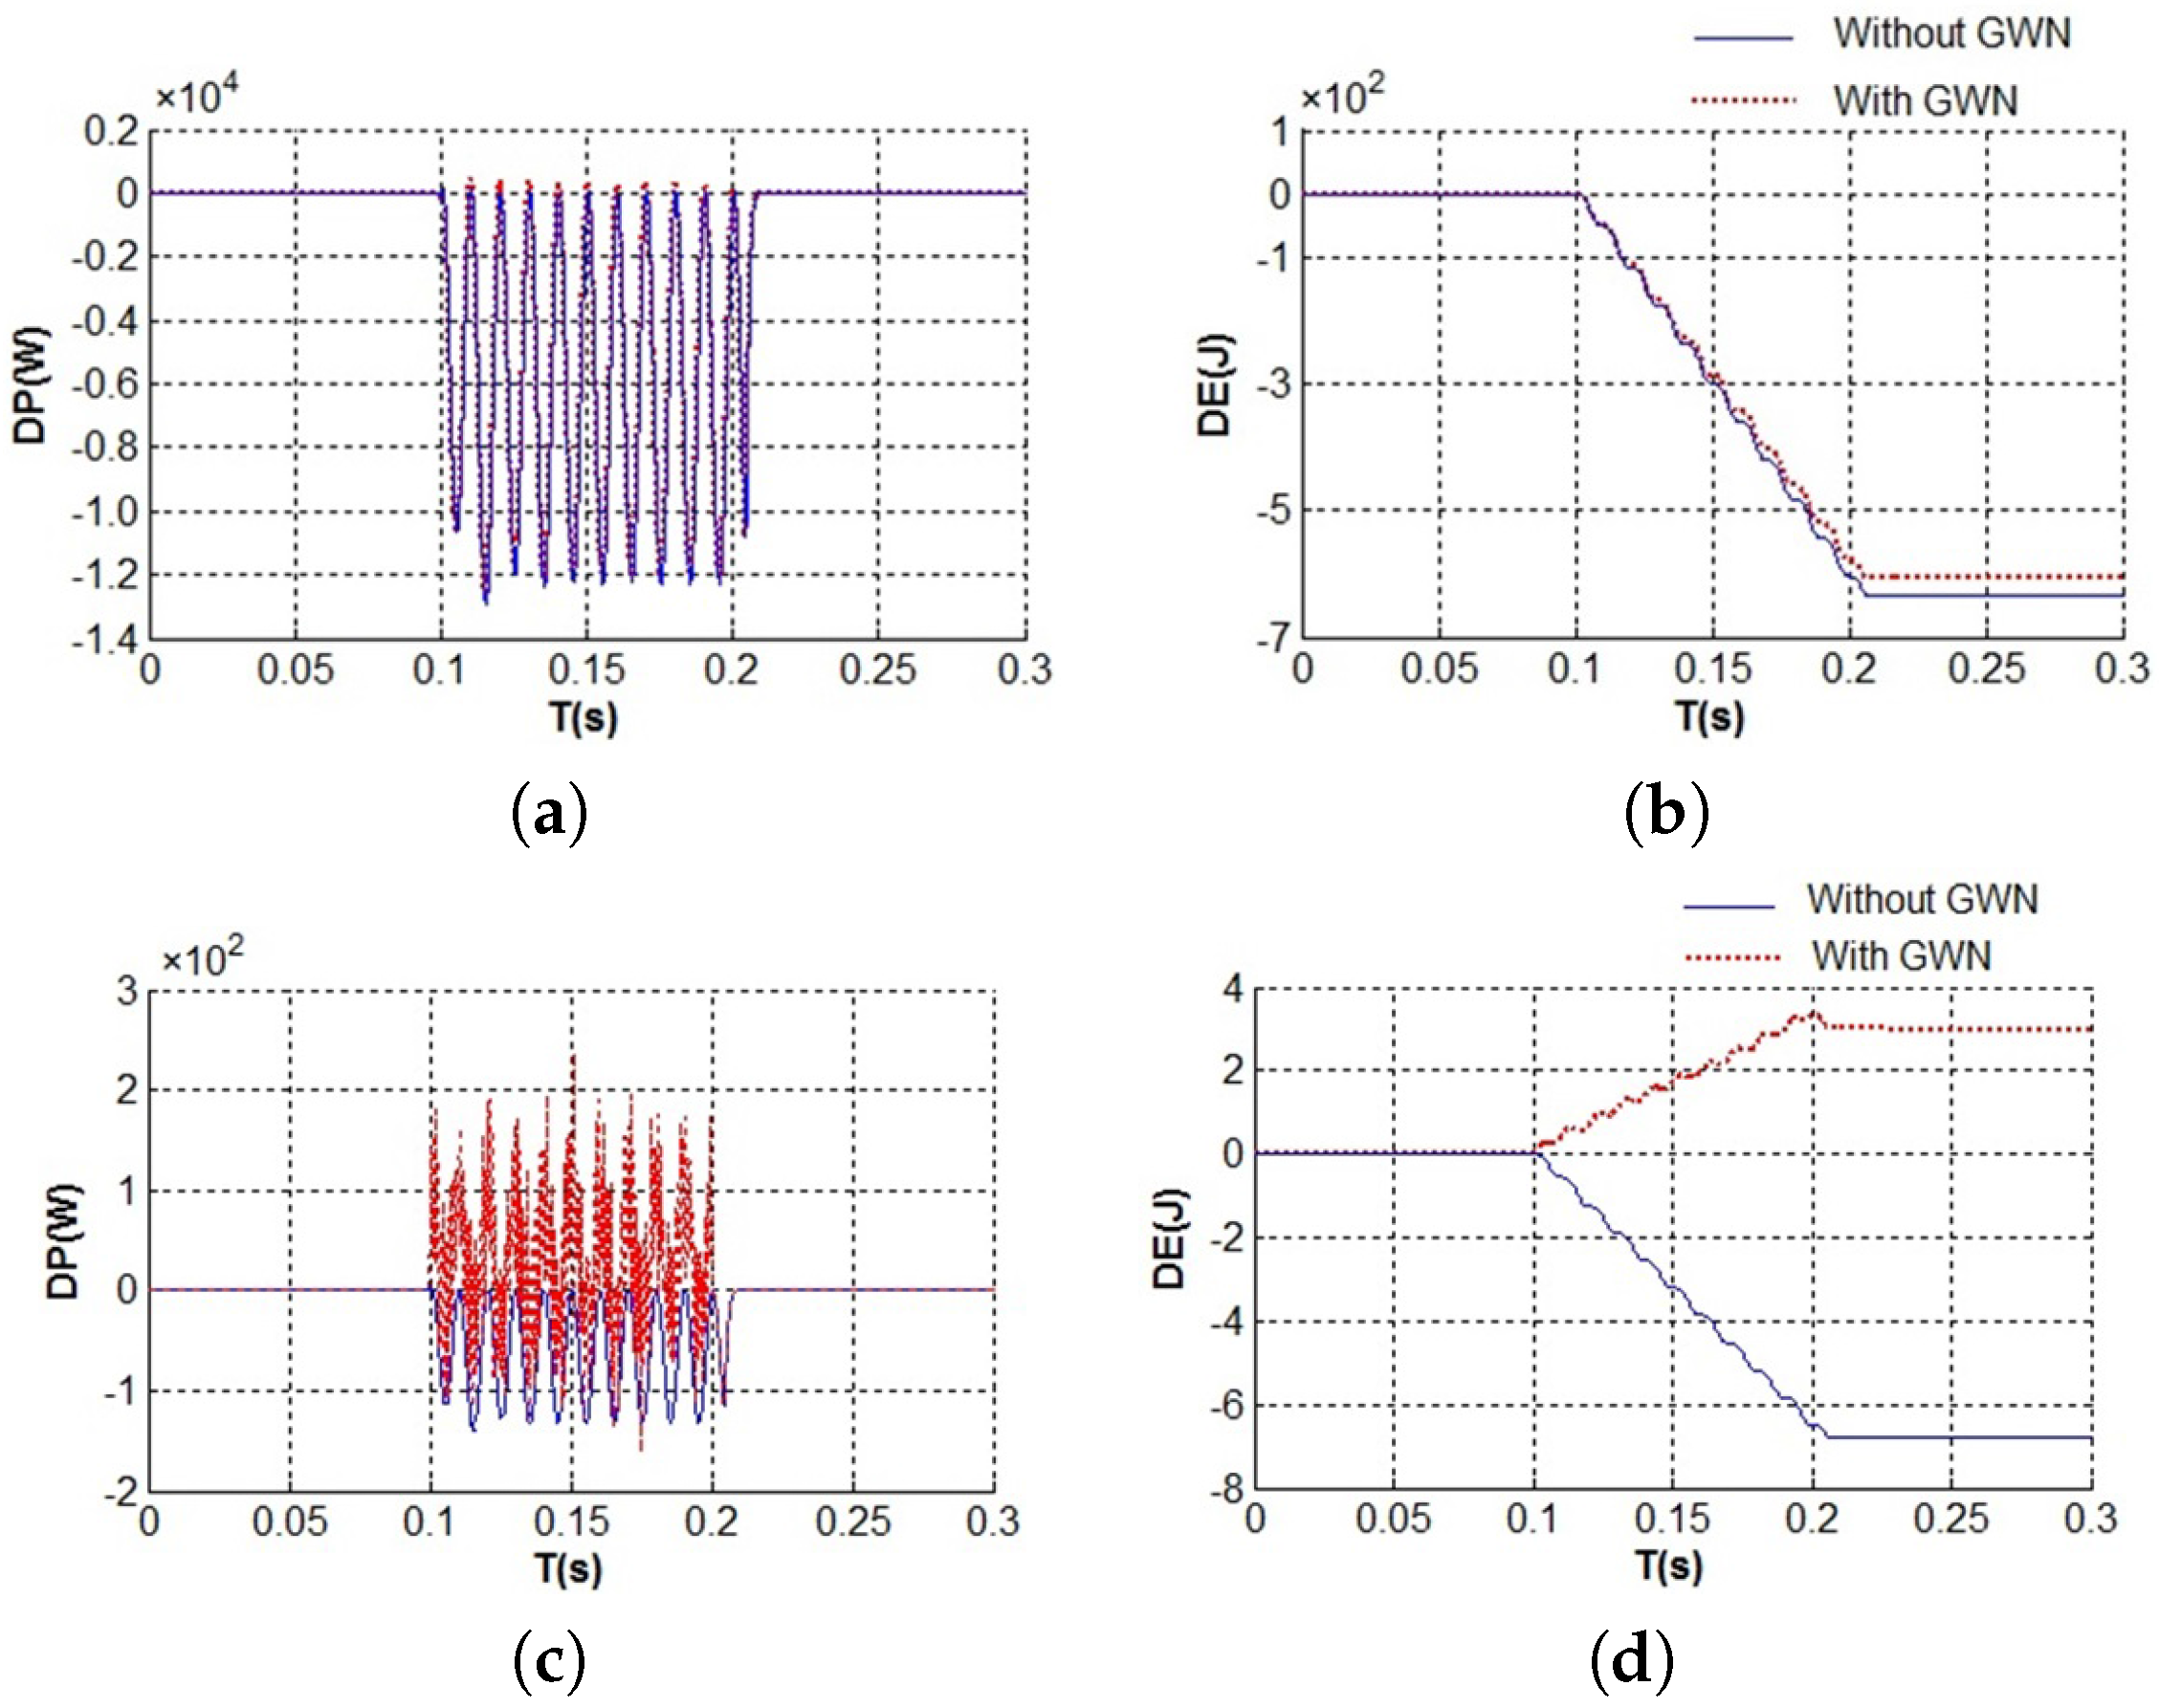
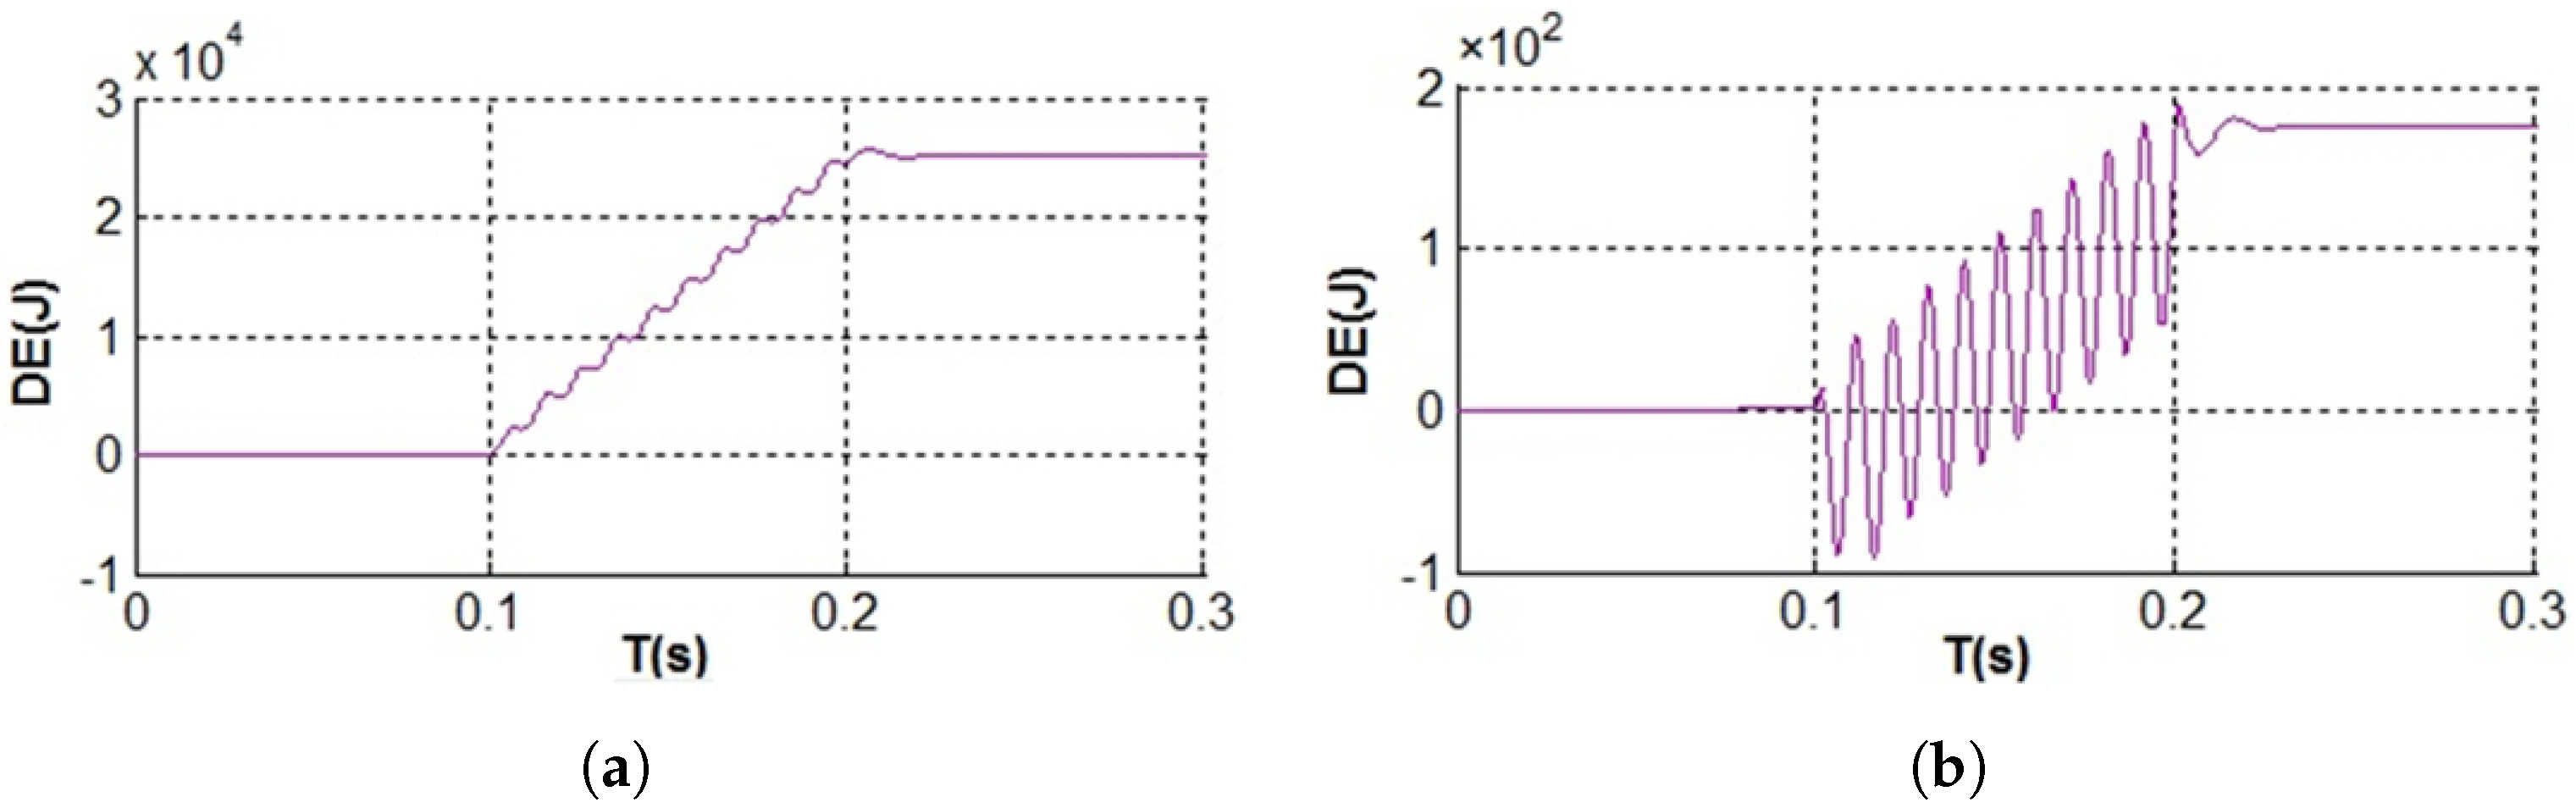
Based on the above analysis, comprehensive simulation tests of the disturbance signals have been carried out to validate the two influence rules.
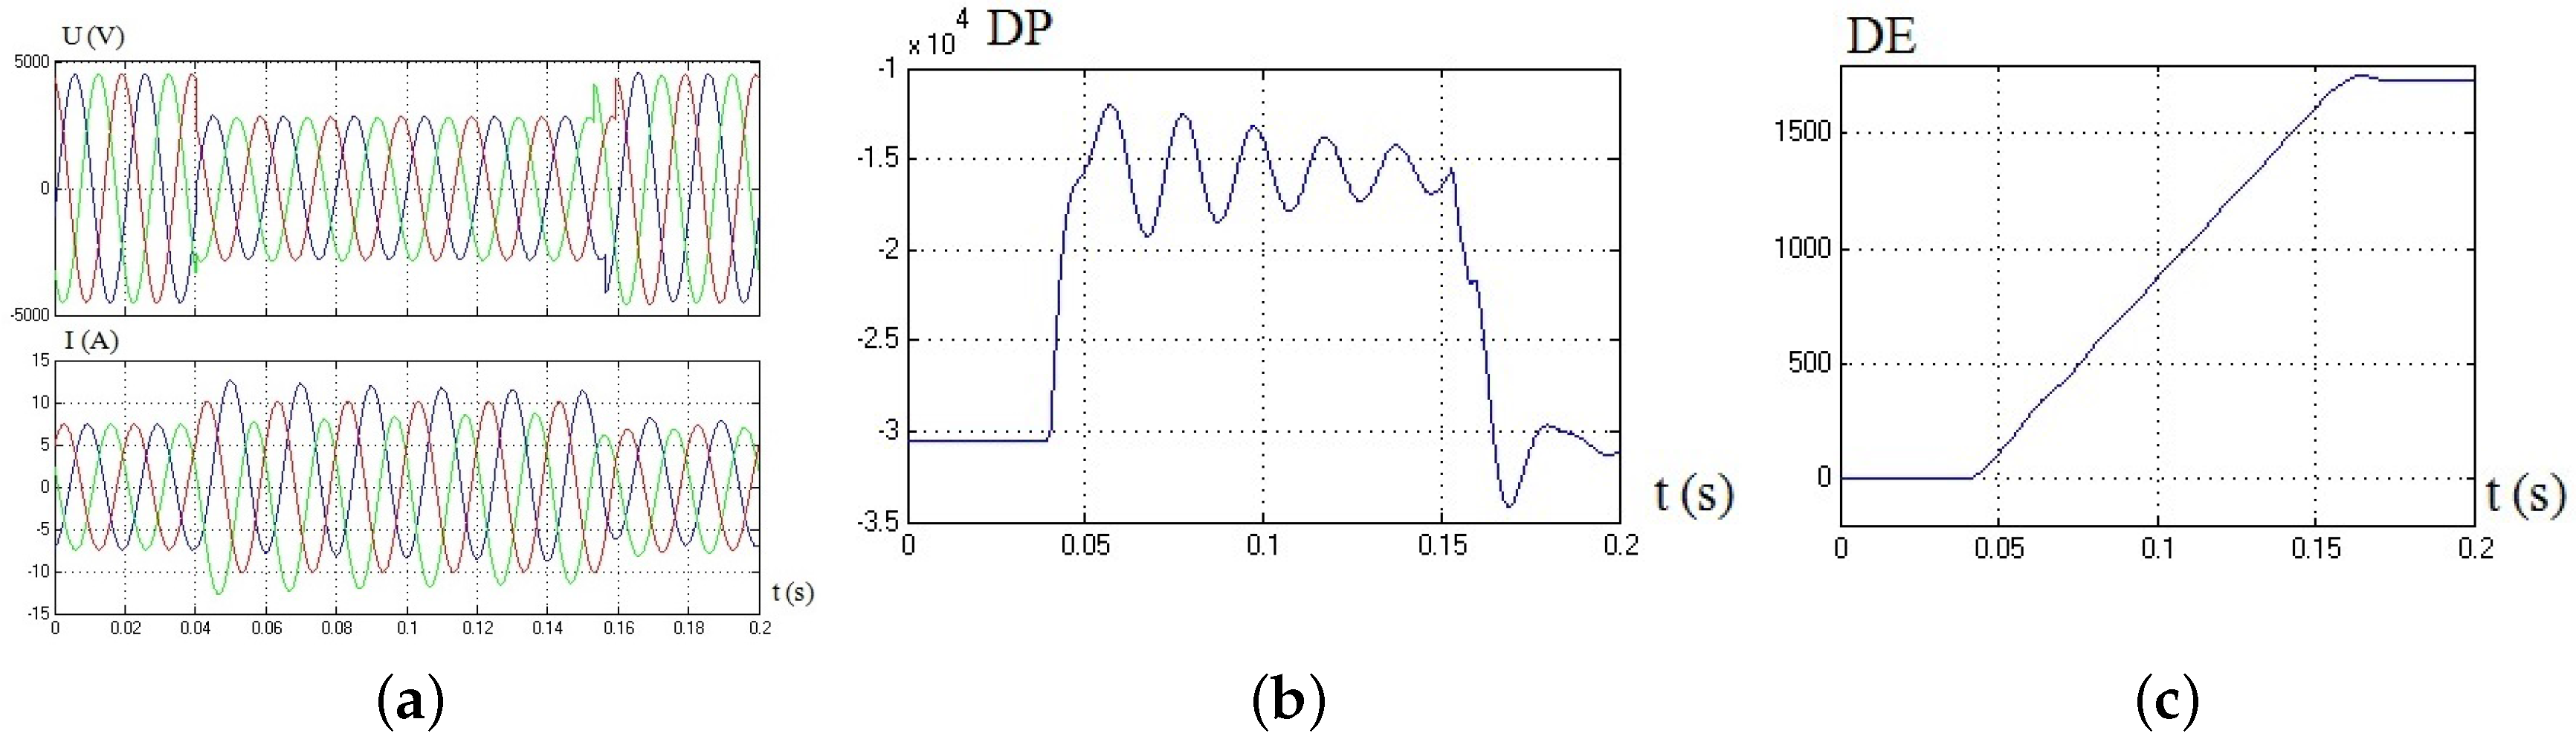
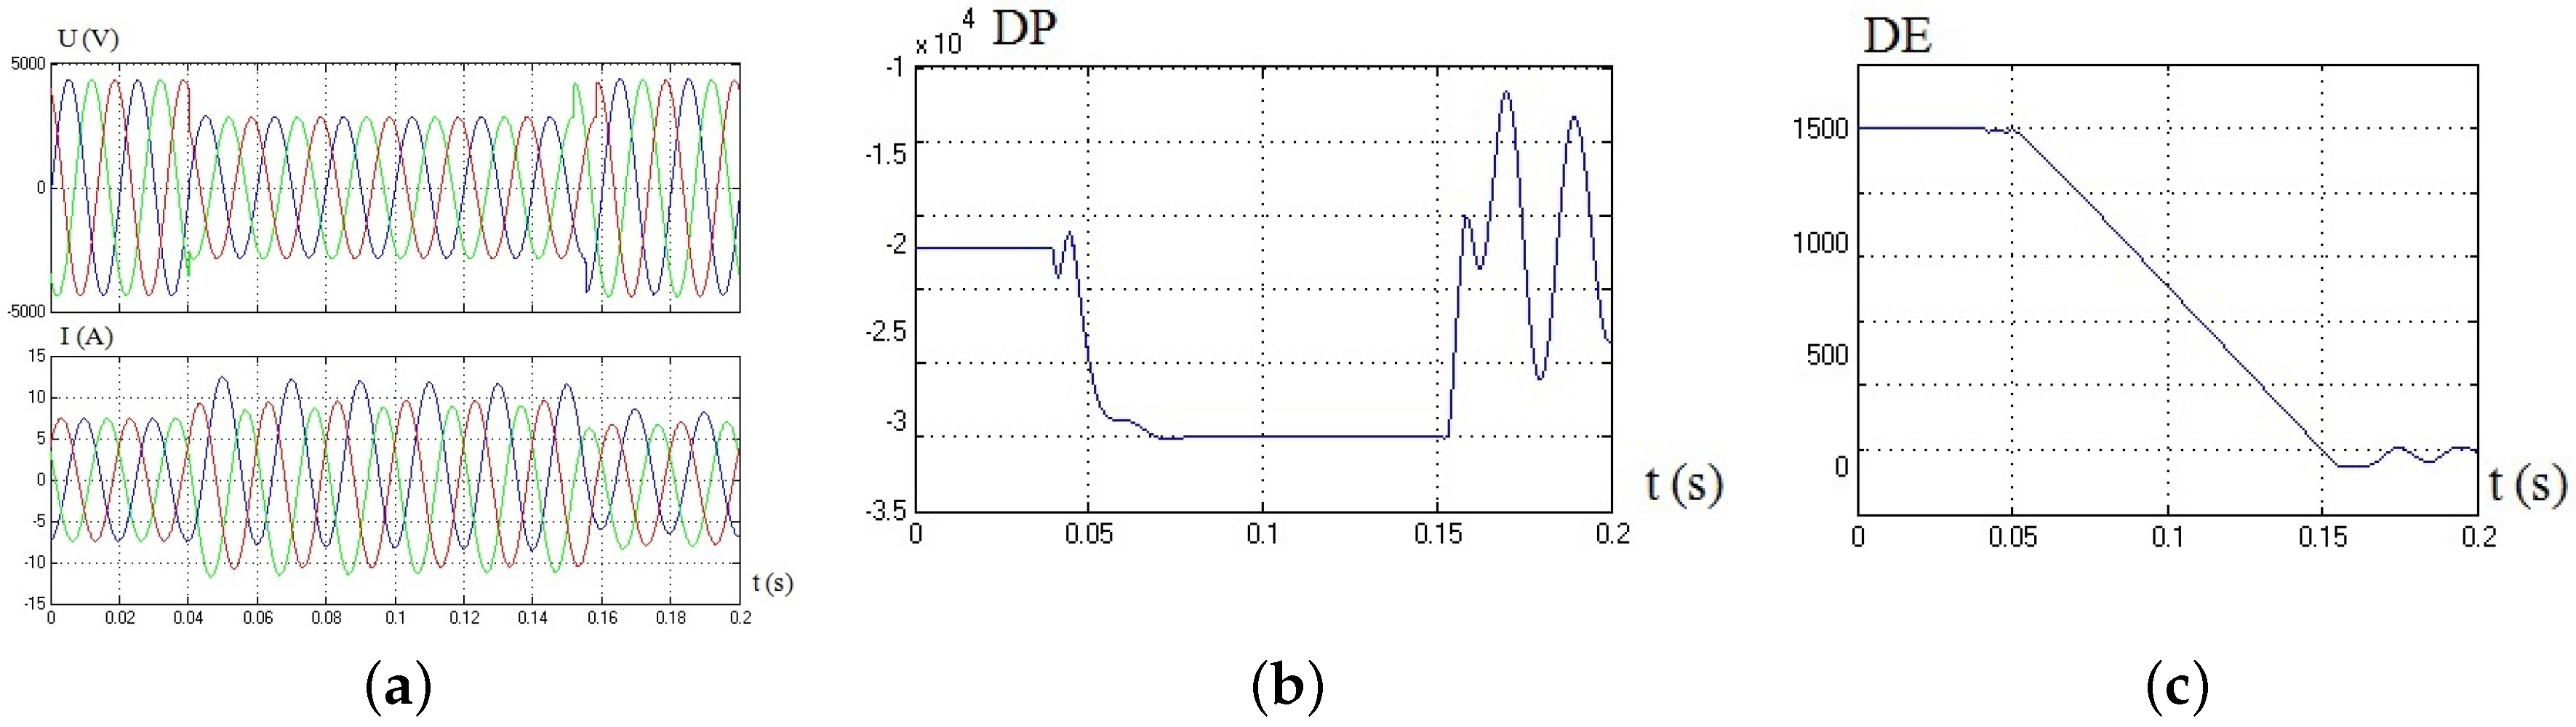
Figure 10 and
Figure 11 illustrate the comparative case studies of Scenario 1. It has been demonstrated that the reversal of the direction-judgments agrees with the first influence rule of DG integration. As the other scenarios will not result in direction misjudgment, the figures of the disturbance signals are not shown herein.
Case 1: F is on , is on , and .
Case 2: same F and as Case 1 without DG integration.
It should be noted that a distribution grid with a circular topology or multiple DGs integration are more challenging due to the direction change of the power flow and the identification of the related links. While the proposed method is robust to different internal structures of the tree-like distribution grid and positions of the DG connected, further investigations should be conducted for more dynamic topology and DG configurations in practice.


