Article

Systematic Assessment of Carbon Emissions from Renewable Energy Access to Improve Rural Livelihoods

1
Department of Environmental Policy, CEP Imperial College London, London SW7 2AZ, UK
2
Departmento de Energía y Tecnologías Ambientales, Universidad Central de Las Villas, Santa Clara, Cuba
3
Department of Materials & Centre for Plastic Electronics, Imperial College London, London SW7 2AZ, UK
4
Departamento de Electrónica, Universidad Politécnica de Cartagena, Campus Muralla del Mar, 30202 Cartagena, Spain
5
Facultad de Ciencias Administrativas y Económicas, Universidad Icesi, Calle 18 No. 122-135, 760042 Cali, Colombia
*
Authors to whom correspondence should be addressed.
Energies 2016, 9(12), 1086; https://doi.org/10.3390/en9121086
Submission received: 30 August 2016 / Revised: 4 December 2016 / Accepted: 8 December 2016 / Published: 19 December 2016

Abstract

:
One way of increasing access to electricity for impoverished unconnected areas without adding significant amounts of CO2 to the atmosphere is by promoting renewable energy technologies. However, decision-makers rarely, if ever, take into account the level of in-built energy requirements and consequential CO2 emissions found in renewable energy, particularly photovoltaic cells and related equipment, which have been widely disseminated in developing countries. The deployment of solar panels worldwide has mostly relied on silicon crystalline cell modules, despite the fact that less polluting material—in particular, thin film and organic cells—offers comparatively distinct technical, environmental and cost advantages characteristics. A major scientific challenge has thus been the design of a single decision-making approach to assess local and global climate change-related impacts as well as the socio-economic effects of low-carbon technology. The article focuses on the functions of the multi-criteria-based tool SURE-DSS and environmental impact analysis focused on greenhouse gases (GHG) emissions balance to inform the selection of technologies in terms of their impact on livelihoods and CO2eq. emissions. An application in a remote rural community in Cuba is discussed. The results of this study show that while PV silicon (c-Si), thin film (CdTe) and organic solar cells may each equally meet the demands of the community and enhance people’s livelihoods, their effect on the global environment varies.

1. Introduction

Access to energy is a fundamental component of development because it contributes to gross domestic product (GDP) and improves the Human Development Index (HDI) [1,2,3]. Increasing access to modern clean energy services is essential to raising living standards and attaining the eight Millennium Development Goals [4,5,6]. Greater access to modern electricity, preferably from renewable sources, is necessary to meet the challenges associated with both the adaptation and mitigation of climate change [7].
Since the 1970s, the release of greenhouse gases (GHG) from energy generation has grown more quickly than that from other sectors, i.e., over 145% compared to 120% in the transport sector [8]. While developing countries have historically contributed small amounts of atmospheric GHGs, since 2004 their emissions have increased significantly and now exceed those originating in the developed economies. Projections indicate that by 2030 the annual average emissions will increase by 2.6 per cent in developing countries compared to only 0.8 percent in developed countries [9]. CO2 makes up about 75 per cent of all GHG emissions [9]. It is thus paradoxical that substantial numbers of people in developing countries still lack access to electricity—i.e., 1.3 billion worldwide, 85 per cent of whom live in rural areas [10].
The use of renewable energy technologies addresses three contemporary concerns simultaneously, i.e., economic growth and positive impact on livelihoods; local environmental protection; and the saving of global CO2 emissions which would otherwise be released if fossil fuel sources were used instead. As to the local environment, while the addition of modern energy can facilitate development, it may, however, also have negative impacts or drain scarce financial resources, both of which could be mitigated if technology solutions were selected more carefully [11]. Solar Home Systems (SHS) in particular are able to generate enough electricity to increase people’s survival rates by powering medical facilities, improving living conditions and protecting the natural surroundings and global atmosphere. Yet, policy and other decision-making processes to roll out solar systems worldwide, including in less developed regions, has mostly overlooked the CO2 emissions that manufacturing, transport and decommissioning contribute throughout their lifetime.
The range of existing approaches to promoting energy for the poor is such that tools are either overly qualitative and geographically oriented on, e.g., households, enterprise and communities [12,13], or focus on large regions [14] whose capacity to match the technology to users’ needs, demands, resources, and decision-makers’ priorities is limited. In addition, only a few studies have investigated the environmental impact of increasing the supply of clean energy technology for poor populations in developing countries [15,16,17] but also in developed countries, such as UK [18]. To tackle the knowledge gap in the assessment of CO2 footprints when promoting energy access, SURE-DSS employs life-cycle analysis (LCA) to estimate energy consumed and the amount of CO2 emitted prior to any installation of SHS. The article explains why this type of footprints analysis is necessary, and discusses how to undertake it without compromising or interfering with the main objective to uphold energy access to improve sustainable livelihoods in developing countries. First-hand information from a rural community in Cuba with no access to on-grid electricity has been used to test the model [15,16].
The SURE-Decision Support System is a tool to assist decision-makers promote energy access in poor areas of developing countries. The tool matches needs and demands to suitable energy technologies. It aspires to promote sustainability, improved livelihoods, local and global environmental protection, and equity. However, the SURE-DSS was not working out the global environmental impact of increasing the supply of clean energy technology to poor populations in developing countries. This article reports on the new function of SURE-DSS to calculate previously unaccounted for CO2 emissions from renewable energy technology.

2. Methodology of Life Cycle Analysis and Multi-Criteria Assessment Applied to Energy Alternatives in Rural Livelihoods

2.1. Life Cycle Analysis of Solar Home Systems

Electricity produced from solar home systems often enables valuable services such as the pumping of potable water, refrigeration of food and medicine, provision of additional hours of light to prolong day-time activities, and to power radio, television and mobile phones. Solar home systems (SHS) have been piloted and advanced in rural communities in developing countries [19,20,21]. Implementation is, however, still limited and there is room to significantly upscale installation. Small stand-alone SHSs merit a significant share in the deployment of future energy solutions where there is no competing modern energy source available, especially in remote locations. SHS generate electricity without detrimental environmental effects. Yet, SHS consume considerable quantities of energy and generate varying degrees of air pollution during their manufacture, transportation and disposal. There are, therefore, sufficient reasons to take into account the in-built embedded energy in SHS intended to promote local socio-economic and environmental sustainability.
Life cycle analysis (LCA) evaluates environmental impacts of products and services and has been used to examine often overlooked carbon-related aspects of energy systems; most notably, it has been applied to photovoltaic technology (for silicon [22,23,24,25,26]; thin film [27,28]; and organic technologies, [29,30]). LCA keeps track of different components and identifies the most energy intensive and environmentally costly materials, and production processes, installation, maintenance and decommissioning. When using LCA to compare PV grid-connected systems with non-renewable sources, the former’s lower global warming emissions make it a favourable technology (based on average southern European insolation levels, solar energy technology can generate between 21 to 37 grams of CO2eq. emissions per kWh of electricity. In comparison, coal produces 900 grs, combined gas cycle generates 439 grs, and nuclear 40 grs CO2eq. emissions per kWh respectively; see [22,25,26]). LCA offers the advantage of being able to evaluate more than one factor at a time. Early work on maximization of supply and reliability of energy systems also measured efficiency, economic cost and environmental impact [31,32,33]. This study does not apply a full LCA to evaluate every possible category of impact. Instead, a set of relevant criteria has been selected to focus on environmental impact analysis in terms of avoided greenhouse gases (GHG), as described in the following subsections.

2.2. Criteria of the Life Cycle Analysis

The nine LCA criteria used to assess silicon, thin film and organic solar energy cells are: I. energy efficiency; II. embedded energy; III. energy pay-back time; IV. avoided emissions; V. real lifetime; VI. balance of system; VII. cost of energy system; VIII. system dependability; and IX. decommissioning. They are briefly described below; details regarding their calculation and parameters are provided in the Supplementary Materials.
I. Energy efficiency is the efficiency for energy conversion from a renewable (or fossil) source into practical work. For photovoltaic technology is defined as the power conversion efficiency (PCE, the ratio of power delivered by a solar module to the incident solar irradiance on the active area of the module) under standard conditions (1 kW/m2 at AM1.5 spectra, with cell temperature 25 °C and wind less than 1 m/s).
II. Embedded energy is the total amount of energy required to manufacture, transport, install, operate, and decommission the energy system. For SHS, this fluctuates between 45 and 56 GJ/kWp. The amount of embedded energy in solar systems depends on technical aspects and system boundaries, such as, for example, whether the decommissioning of batteries and panels includes their recycling [22,26,34,35,36,37,38,39,40]. Research has demonstrated that the embedded energy in organic solar cells is relatively high, at 56.02 GJ/kWp for 5% power conversion efficiency and 28.01 GJ/kWp if 10% power conversion efficiency is assumed [29]. For example, the embedded energy of dye-sensitized solar cells (DSSCs) is about 100–280 kWh per square metre of active solar cell area and the related CO2 emissions have been calculated at 19 g to 47 g CO2eq. per kWh of energy produced under different insolation levels, efficiency and lifetime [41]. In summary, the lower this figure, the lower the level of embedded pollution.
III. Energy pay-back time (EPBT) describes how long it takes a solar panel or solar system to generate the same amount of energy that was required to manufacture, transport and install it and perhaps also to decommission and recycle it. The shorter the period, the more recommended is the technology. Solar energy systems require between 4 to 7 years to generate the same amount of energy that was employed for their creation; this period is significantly shorter than the expected technical life of the systems, which is 20 to 25 years [23,24,34,36,37,38,39].
IV. Avoided emissions implies the total CO2eq. (when referred to CO2 emissions, the unit used is CO2 “equivalent”, which takes into account emissions of other Green House Gases and quantifies its impact in units’ equivalent to CO2) that could be saved if electricity were generated by cleaner alternatives to fossil fuels. The avoided emission in relation to PV systems is, by and large, a measure dependent on location, because its calculation relies on physical indicators such as irradiance, average temperature, and energy mix of a particular region or country where the SHS is installed. Moreover, the embedded energy of the solar modules (see II above) is taken into consideration. For example, if a PV system replaces a diesel generator, the avoided emission is 1.27 kg of CO2eq./kW [23]. When electricity from PV panels is used instead of electricity from the national grids in the USA, the avoided emissions have been calculated as 0.522 kgCO2eq./kWh, but it is 0.900 kgCO2eq./kWh in Cuba [42,43]. The energy mix represents, for each country, all the electricity systems and their anticipated associated CO2 emissions.
V. Real lifetime refers to the expected number of years that a PV system may remain in working order. The real life-time of SHS stated in any manufacturer’s guarantee is usually at least 25. If no technical failures had been reported, PV panels may generate electricity beyond the guaranteed lifetime. Whereas the life-time of SHS is considered primarily a technical concern, the effective operational life-time period (i.e., the operation ratio of solar systems) is often cut short by non-technical location-dependent factors. For example, regular maintenance, commercial networks that guarantee access to spare parts, socio-economic conditions such as education and social organization, and government supportive regulations and markets to enable access and equipment upkeep. System dependability (see VIII. below) is used to also achieve a deeper understanding of system lifetime and failure because it encompasses parameters such as user’s attitude and satisfaction, as well as maintenance routines [33,42,43].
VI. Balance of system (BoS) refers to the additional parts that accompany a SHS and are necessary to achieve greater efficiency: the battery that stores power, the charger regulator, and the inverter if AC electricity is used. The embedded energy and CO2 emissions from BoS can be substantial and therefore it is included in any LCA. The energy requirements of inverters for a 3 kWp residential PV system have been estimated at 0.5 MWhth (i.e., 0.17 MWhth/kWp) [22]. Alsema (2000a) and Rydh & Sanden, (2005a, 2005b) [40,44,45] suggest values of 1 MJ/Wel (0.277 MWhth/kWel) for inverters and charge regulators. It has been estimated that the power requirements of poor households range between 500 W and 1500 W [46,47]. The SURE-DSS model discussed in this article uses the highest values to calculate the energy pay-back time of BoS required for typical Solar Home Systems. The costs associated with BoS vary according to the purpose of installation, e.g., whether it is roof-top, building-integrated, or a ground-based design; country of installation; and technical characteristics such as size, surface area, and module efficiency. By 2013, the price of BoS for roof-top systems was between €1.1 to €0.9/Wp. It has been estimated that this will reduce further, to €0.75/Wp by 2020, and to less than €0.5/Wp by 2030 [48]. A particular feature of BoS is that its cost is calculated independently of the rest of the SHS. For example, replacement of the power storage batteries—which, have the shortest lifetime of all the systems components—necessitates additional costs. Also, to a large degree, the choice of device varies, depending on the user. Cost reductions for BoS correlate with increased efficiency and reduced size of solar modules. The SURE-DSS model employs the BoS standard approved by the European Commission in 1998 [49,50], which has an emission factor of 66g CO2eq./Wh for both batteries [51] and charge regulators [52]. Also, as SHS may employ small inverters to feed alternative current (AC) appliances, the embedded energy for a 500W inverter is used and the values are drawn on the Ecoinvent Database (2012) [53] (Table 1).
VII. Levelized cost of electricity represents the price per kWh of delivered electricity throughout the entire lifetime of the solar panel system; the levelized cost of electricity (LCOE) compares this value with the market costs to generate this energy. For example, in order to compete with electricity from fossil fuels, energy generation from PV should cost less than US$0.50 per Wp per installed solar panel; yet, the cost is still significantly higher at US$1.30/Wp to US$1/Wp [54]. Cost comparisons between small stand-alone solar installations and other off-grid energy systems, such as diesel generators—widely used in rural areas—have favoured photovoltaic panels [49,55].
Most cost projections for solar technology have focused on silicon-based solar panels and results indicate that prices will continue to decrease at historic rates [56,57]. Chinese manufacturers, such as SunTech, YingLi Solar, Trina Solar, are close to achieving a market low of between €1/Wp, and €0.75/Wp by 2025, and if BoS costs were included, the price would range from €2.5/Wp for small stand-alone systems to €1.5/Wp for grid connected systems larger than 100 kWp [58].
If the LCOE of thin film and organic cells were to be taken into consideration, additional advantages might well emerge in favour of solar energy solutions because solar thin film technologies require significantly less material and energy than conventional crystalline silicon modules. Future cost reduction of amorphous silicon (a-Si:H), cadmium telluride (CdTe) and copper indium diselenide (CIS) is forecast as the technology advances [27,40,57]. Other thin film cells have been priced similarly, ranging from €0.9 to €1.1/Wp. Yet, lower prices, of between €0.6 and €0.7/Wp, have been obtained in 2016 for both a-Si:H and microcrystalline-Si modules, with efficiencies of 10% and 11% respectively. Thin film technologies have virtually attained the efficiency target set by the European Photovoltaic Technology Platform of above 10% with associated production costs below 0.7 €/Wp on rigid substrates [48,58]; The corresponding targets for flexible substrates are 10% and €0.6/Wp respectively. Intensive R&D, low-cost and high-volume production of thin-film PV modules are required to achieve €0.5/Wp by 2025 [48,58]. A main challenge facing thin film technologies is up-scaling global production capacity. Japan, the USA and Europe already deploy advanced thin film R&D infrastructure, with factory facilities, and generation via this means is forecast to reach 10 GWp/year and 13.3 GWp/year by 2017 [48].
The prospects for improved efficiency, cost and production of organic solar technologies—including dye-sensitized solar (DSSC) [59] and fully organic—were predicted more than two decades ago [60,61,62,63,64]. A remarkable 10.6% efficiency high has been achieved for organic tandem cells [65]; and over 20% on a new family of cells based on organic perovskites [65,66]. However, the stability of the manufactured cells remains limited and lifetimes are still well below those of Si-cells. Prices ranging between €0.5/Wp and €0.1/Wp by 2020 have been predicted for 1 GWp production scale, [67,68]. An organic solar cells in a lighting project in Africa has been demonstrated. Although the cost of the organic solar cells and hybrid technologies has not been compared to that of other off-grid systems, initial estimates of photovoltaic power conversion also promise cost reductions [68].
The LCOE of organic solar cells at €0.19/kWh to €0.50kWh is significantly lower than that of silicon cells. A hybrid tandem technology with a potential 20% efficiency and a cost of $0.50 per Wp could significantly reduce the LCOE [69].
VIII. System dependability (SD). With the exception of cost, the factors discussed above are location-dependent, which means that elements such as where the solar systems are manufactured, where to and how they are transported, and the energy mix and level of CO2 emissions at the country of installation are all important. SD ultimately affects the amount of embedded energy, avoided emissions, and pay-back-time of any PV installation. For example, the intensity of natural radiance and the average daily temperature at a particular location affect the capacity of solar panels to generate energy per surface of installed unit. Location is crucial in determining the total energy produced by a PV system during its lifetime. Moreover, non-technical factors relating to SHS such as users’ behaviour, views and expectations can be equally sensitive to geographical location (see V. Real lifetime above). Assessment of system dependability aims to achieve a better understanding of system failure and point to ways to extend the systems’ real lifetime to their technical limit [33,42]. Lastly:
IX. Decommissioning is the process whereby the equipment that is left behind at the end of the systems operational life is disposed of. Recycling PV modules could save two thirds of the energy expended in their assembly [70]; while battery recycling plays a positive role in terms of reducing the environmental impact of standalone solar systems [71]. Advances have been made in the recycling of crystalline silicon and thin film modules. However, only preliminary results are available regarding the treatment of the aluminium and glass found in thin film and organic modules. Organic polymers, nanoparticles and other electrodes (Ca/Al) contained in the systems are not currently recycled but deposited in landfills [35,72].
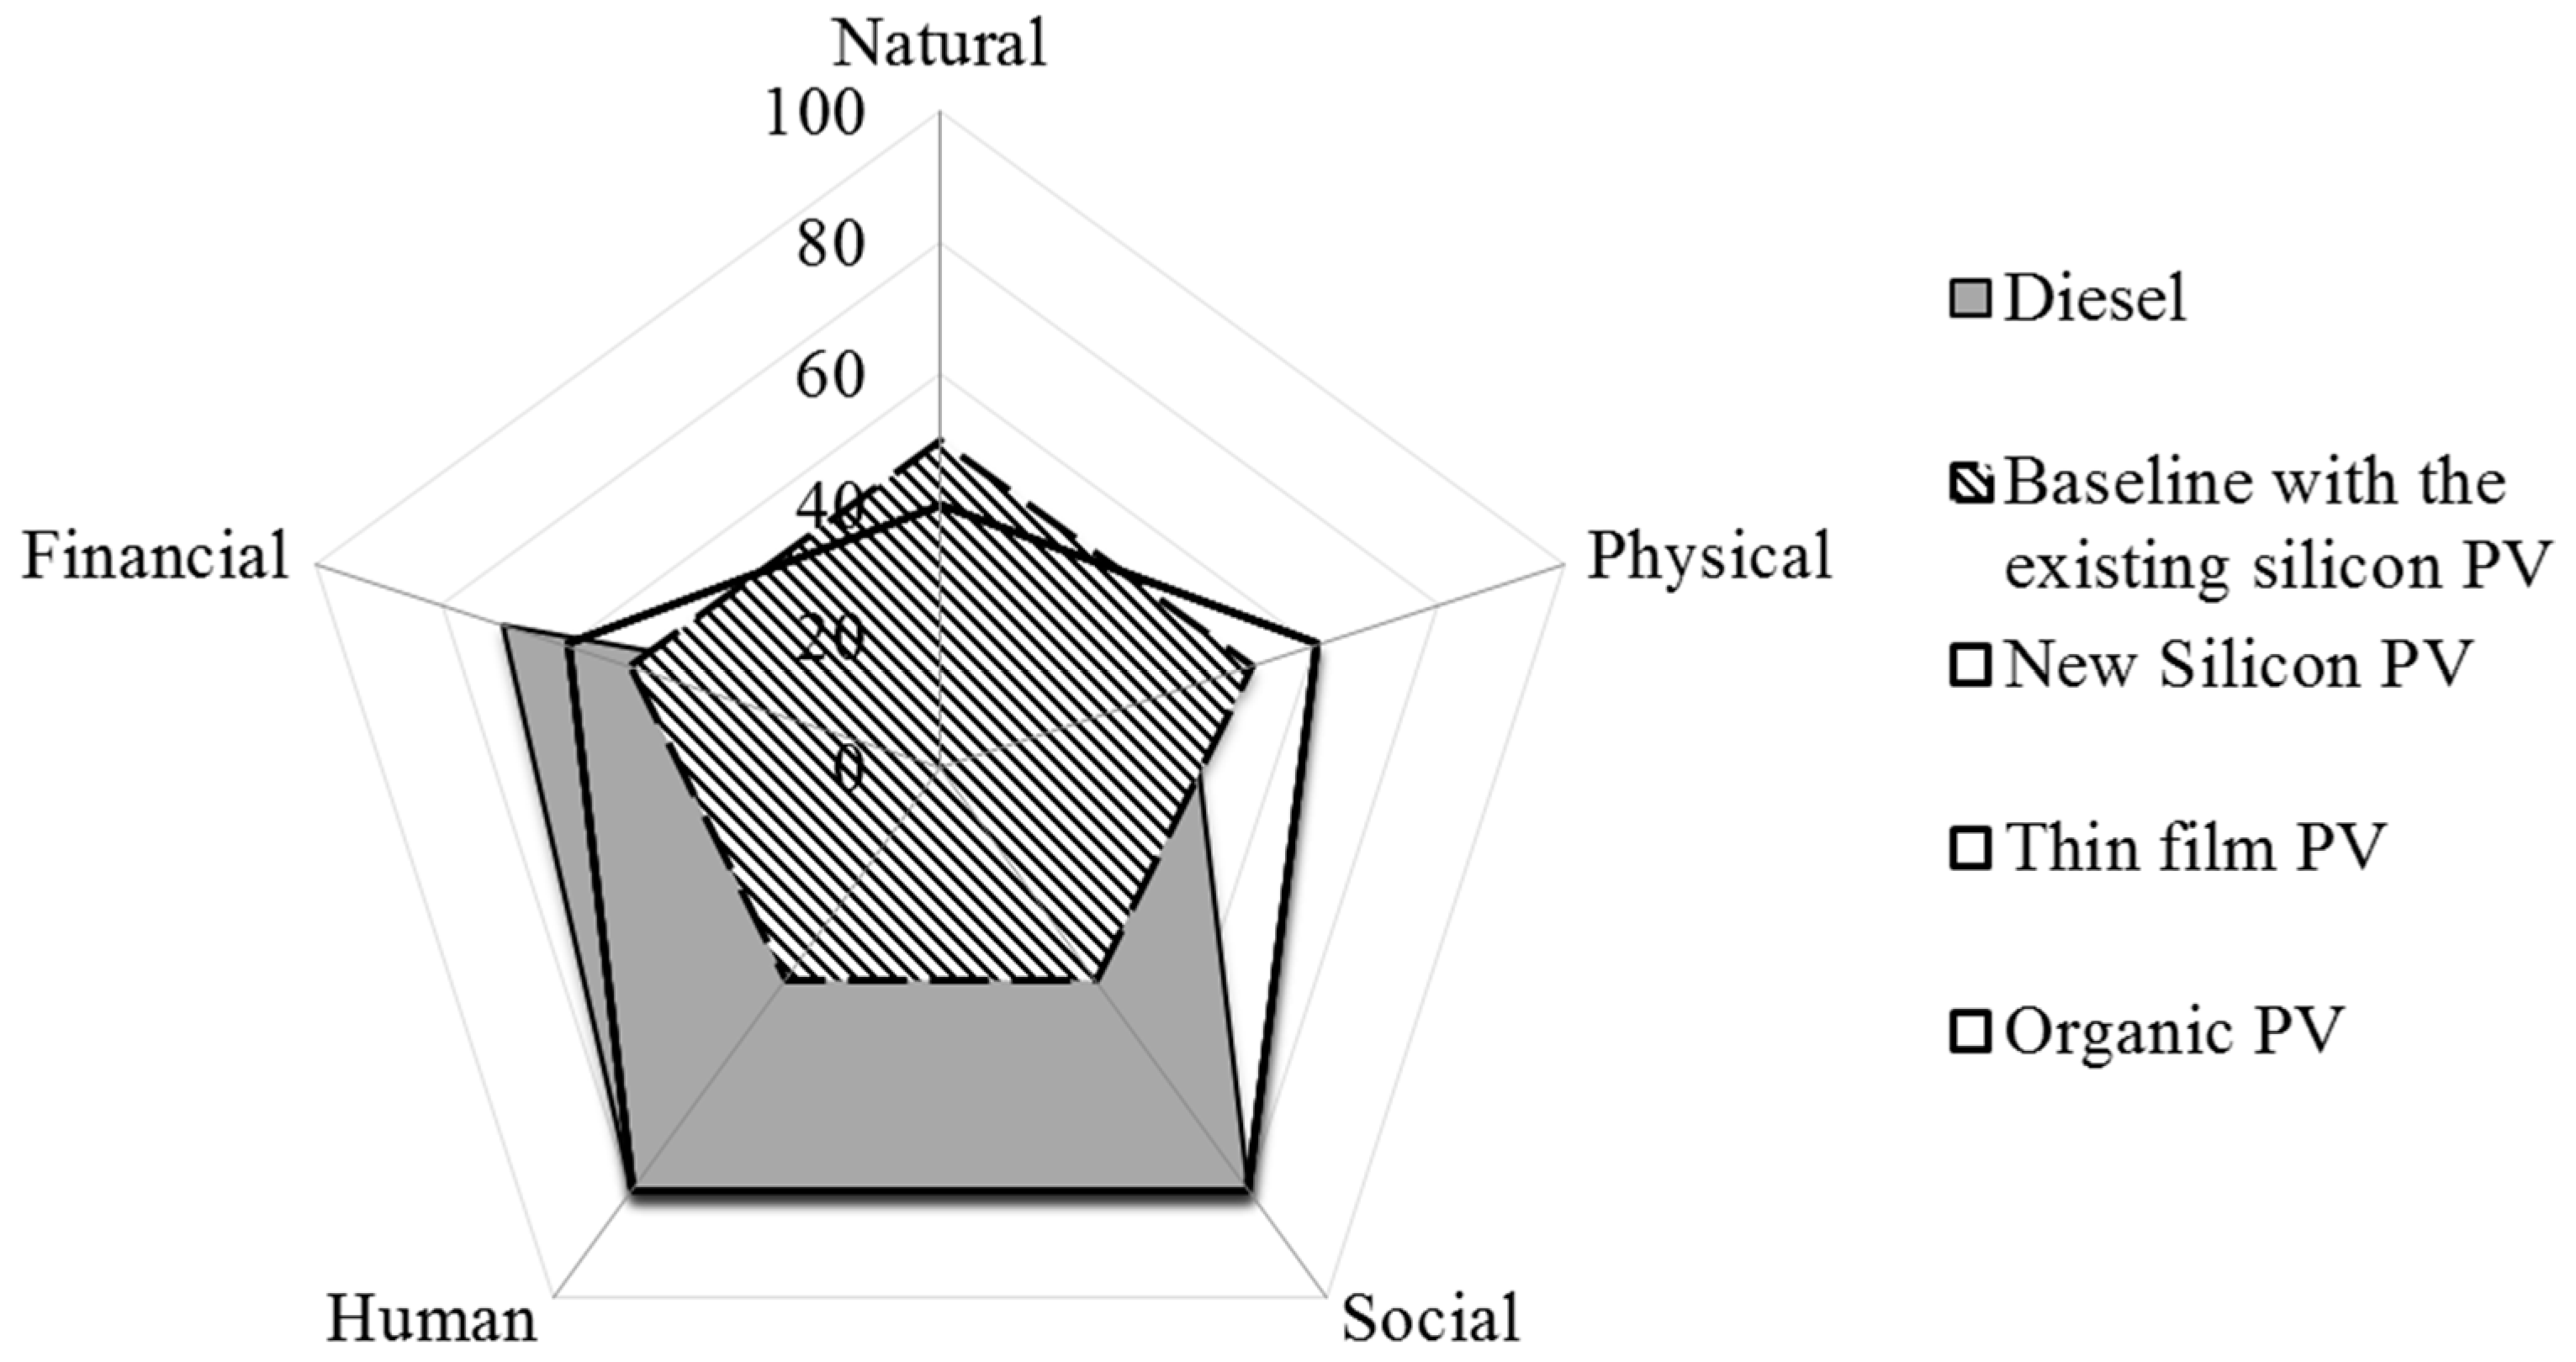
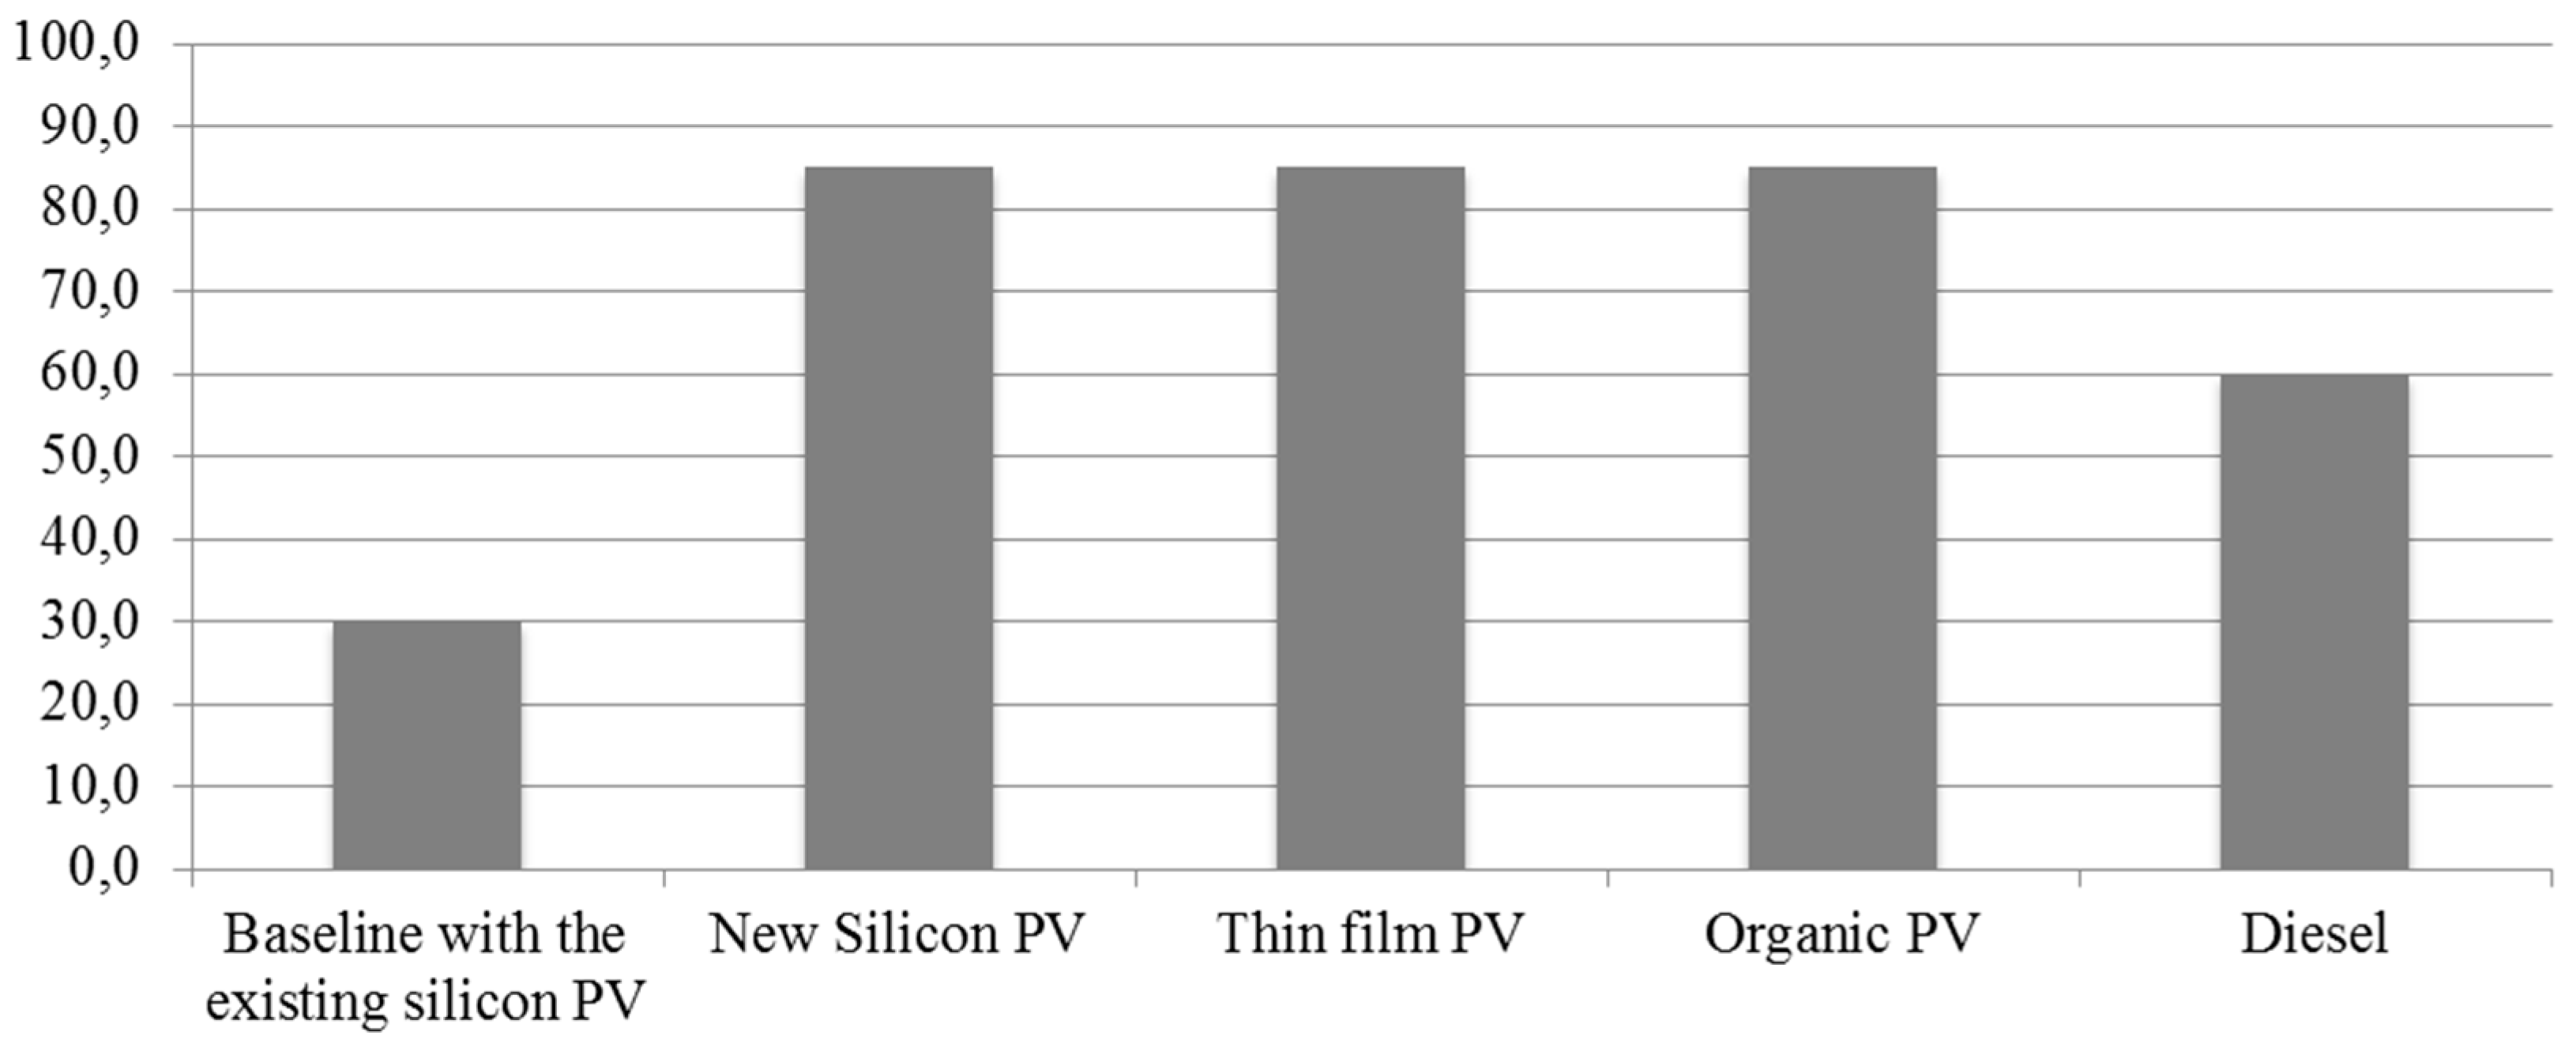
Energy supply to the poor in developing countries could potentially be increased through solar energy installations. So far, the silicon solar cell type has dominated the provision of solar energy in poor regions. The proposed systematic assessment seeks to assist decision-makers to also take into account the overall levels of CO2 in the technology when they plan to increase energy access in developing countries.

2.3. Approach to Estimate the Socio-Economic Impact, Energy Requirements, and Global CO2 Emissions of Solar Home Systems (SHS)

The functions performed by SURE-DSS fall into three main categories: (i) it identifies the extent of livelihoods capitals available to communities, creates a resource baseline, and generates a set of potential energy solutions that takes into account such a baseline; (ii) it captures the demands and priorities of both local beneficiaries and decision-makers, and itemizes the bearing of each pre-selected energy technology on five livelihoods capitals (social, human, financial, natural, physical). Finally; (iii) SURE calculates the global environmental impact and mitigation potential of pre-selected energy technologies using life-cycle analysis as its main approach [16,17,73]. This section discusses the mathematical approaches to assess the impact of solar photovoltaic home systems on the local community and natural surroundings, and on global CO2 emissions.

2.3.1. The Resource Baseline and Pre-Selection of Energy Technologies

In order to both, facilitate the selection of energy technologies to promote energy access which have an impact on livelihoods, and proceed with the calculation of the global CO2 footprints of those renewable energy technologies, the SURE-Decision Support System works on the principle that populations have access to, or own, a certain amount of resources or capitals, namely: physical (e.g., infrastructure such as houses, roads, schools, energy installations); financial (e.g., wages, savings, access to credit, remittances); natural (e.g., water, land, flora, wind, sun irradiance, organic waste, landscape); social (e.g., friendship networks and affiliation to political organizations); and human (education, health, skills) see e.g., [74,75,76]. It follows that the robustness of a community’s livelihoods depends on access to or ownership of each and all five capitals. The contribution of SURE has been to quantitatively calculate the available five capitals as well as assessing the potential impact that the supply of additional energy would have on them. Drawing on the “full-energy menu”—e.g., solar, biogas, diesel generation, micro-hydro, wind power, hybrid options, and national grid—SURE models and compares the impacts of such a set of energy technology alternatives on the community’s baseline.
The selection of appropriate energy technology based on their impact on the above five livelihood capitals represents a multi-criteria decision making problem. This type of problem seeks to assess the performance of a predefined set of energy alternatives in the light of various criteria of different nature, and recommend the technology with higher scores. A set of criteria or attributes, i.e., the five livelihood capitals (and the factors that define each one) and a set of various alternative energy technologies have been defined. In order to assess the performance of the energy options in the light of the chosen factors of the five capitals, data from a community in a developing country has been collected. Because the criteria and attributes of the livelihoods capitals have different units of measure their performance has been scaled, or normalized, to compare and also aggregate results. Finally, the different performances or impacts of the technology alternatives have been totaled and to generate an overall score. SURE-DSS employs the multi-criteria approach known as compromise programming [77,78] because it enable to aggregate the impacts of the energy alternatives across all capitals and recommend best performing technologies. The alternative with the largest score will be recommended.
SURE-DSS draws on a standardised non-dimensional metric to calculate the extent to which these pre-selected energy technology alternatives Ai (Ai, i = 1,…, n) may bring about changes to the livelihoods capitals, Cj (Cj(Ai), j = 1, 2,…, 5), see Equation (1):
C j ( A i ) = 1 1 + e α j X j ( A i ) ,    ( j = 1 , ... , 5 ; i = 1 , ... , n )
where Cj(Ai) represents the overall impact of the i-th energy technology alternative (Ai, i = 1,…, n) on capital j, j = 1, 2,…, 5, (1 = physical; 2 =financial; 3 = natural; 4 = social; and 5 = human); Cj(Ai) takes values between 0 to 100 and indicates how the energy option i impacts capital j (“0” is for the least desirable effect; “100” indicates the most aspired to effect of i on capital j); Xj represents the group of factors that constitutes each capital j (e.g., for natural capital, the factors refer to amount of water, land, wind, sun irradiance, organic waste available). Hence, Xj(Ai) represents the effects of the i-th energy alternative on the factors of corresponding capital j. Finally, αj is an arithmetic mean function that normalises the various types of impacts from the i-th energy technology option across all five livelihoods capitals j Xj(Ai) in a common scale so that the different impact may be compared see, [16,73].
Hence, Equation (1) is the first step in solving the multicriteria problem set by the selection of technology to increase energy access. It scales and aggregates the performance of each energy alternative across the various factors that constitute each capital, and facilitates the comparison of impacts across the five livelihood capitals. The outcome of this procedure is a payoff matrix where each energy alternative is assessed against each of the five capitals (see Table 2 below and Ref. [17]).
The next section shows the procedure employed in SURE to aggregate the various impacts of each energy alternative across all capitals.

2.3.2. Selection of Energy Technology for Livelihoods Improvement

Following a pre-selection stage where a choice is made between different energy alternatives according to available resources and the characteristics of the technologies, the most relevant solution is recommended that takes into account the demands and priorities of future beneficiaries and decision-makers. Equation (2) indicate the aggregation procedure of the expected impact of the energy alternative Ai across all five capitals. It measures the gap between the expected impacts due to each implemented energy alternative Ai on the five capitals and a hypothetical or “ideal” state of development for the community (whereby the five livelihoods capitals have been fully developed = 100). Having calculated all the gaps, the approach recommends the most satisfactory energy technology solution as the closest to the ideal or hypothetical state of development [73].
M i n { D P ( A i ) = ( j = 1 5 W j p | C j , r e f C j ( A i ) C j , r e f C j , m i n | p ) 1 / p , i = 1 , ... , n ; 1 p }
where Dp(Ai) is the gap between the ideal state and the value resulting from modelling the implementation of the i-th energy alternative (Ai); Cj(Ai) is the expected impact of the energy alternative i on asset j; Cj,ref is the ideal value of asset j (Cj,ref = 1); Cj,min is the lowest possible value given to asset j (Cj,min = 0, a total depletion of the asset); Wj represents the relative weight factor of importance assigned to asset j; and p is a distance parameter that reflects the attitude of the decision-maker regarding deviations from the ideal state of development (typical values for p are 1 and 2) [16,73].
Finally, SURE-DSS assists decision-makers in assigning the values to the weight factors of the capitals (Wj). It does so by calculating three features of the payoff matrix: the interdependence among the five capitals, the entropy within each capital, and the chances to select unsatisfactory energy solutions [74]. Further, the scores of the sensitivity analysis of the photovoltaic technologies which the system has selected indicates that these scores are almost fully independent from the sets of the selected weights, confirming the proposed best solutions for the supply of energy. For details of the sensitivity analysis performed for this study, see Table S2 and Figure S1 in the Supplementary Materials.

2.3.3. Energy for Sustainable Livelihoods and Global Emission Mitigation

While Equations (1) and (2) above ascertain the most suitable energy technologies to achieve optimal developmental impact on poor local livelihoods, Equations (S1)–(S8) (shown in the Supplementary Materials) go on to appraise the selected technologies from the perspective of global environmental impact. With a focus on solar home systems, when calculating the improvement to livelihoods and the local natural environment in developing countries, the proposed advanced operation calculates the amounts of consumed energy and CO2 emissions hidden in the solar systems. To account such concealed energy and CO2, the SURE-DSS processes information drawing on life cycle analysis.
The parameters related to LCA described above assess the global environmental impact of producing, transporting, and installing solar home systems. They address energy pay-back time, embedded energy, energy return factor and avoided emissions criteria, whose detailed calculation is provided in the Supplementary Materials. Additionally, this section has discussed the systematic model proposed to assist decision-makers in analysing local and global impacts of photovoltaic technologies for improving livelihoods in poor areas of developing countries. The approach is applied to the case study presented in the next section.

2.3.4. Case Study: Las Calabazas, Cuba

The approach described above has been tested in a small rural community, Las Calabazas, in Villa Clara province, Cuba. Administratively, Las Calabazas is part of the municipality of Manicaragua, in the mountain range of Guamuhay at the Escambray Sierra National Park. Las Calabazas is characterised by extended periods of drought and high temperatures, particularly in recent decades, as a result of changes in the global climate. Its population size and geographical features match the Cuban government’s definition of dispersed and isolated rural community. The closest settlement is found only 5 km away, Guinia with 4688 inhabitants; while the nearest town, Manicaragua with 22,266 inhabitants, is 20 km distant. The municipality administers an area of 1063 km2 with a population density of 67.8 inhabitant per km2.
In 2012, a structured household questionnaire was distributed to all 12 households which were then in Las Calabazas. The survey gathered information on the availability of energy, access to financial, social, human, natural and physical resources, and uncovered the priorities and demands of the population (37 inhabitants). To complement the information from the questionnaire, semi-structured interviews were undertaken with the president of the municipal government council of Manicaragua, and the manager of the hydro-electricity company for the province of Villa Clara.
The country’s energy mix and its related CO2 emissions data for calculating the amount of avoided CO2 emissions from prospective solar energy installations in Las Calabazas have been drawn from the national statistical data [79].

3. Results: Renewable Energy for Livelihoods Improvement and Reduction of CO2 Emissions

This section presents the results about renewable energy for livelihoods improvement and global CO2 mitigation and examines the prospect of developing solar technology at Las Calabazas by looking into: (i) its baseline; (ii) livelihoods and energy priorities; and (iii) energy for livelihoods and global emissions mitigation.

3.1. Baseline Resources and Energy

The financial capital owned by the population of Las Calabazas was notably small and unemployment, especially among women, was high. Working on coffee plantations and in forest management were the main sources of income. Seemingly, the government had no plans to improve or increase the current capabilities of Las Calabazas [79,80]. Moreover, the physical infrastructure of the community was minimal. It consisted of 12 houses made of durable materials; a one-room primary school; a small video game room, which was also used for communal activities; a cold drinks stall; and a communal warehouse. The only road to Guinía was in a state of serious despair. Although the national grid was only 4 km away, the houses were not connected. The only modern source of electricity were two small silicon photovoltaic systems, deploying 0.5 kW power capacity and without battery supply. These two roof panels provided electricity to the video games room and primary school building. Persistent drought over recent years had affected the landscape, which showed signs of desertification with low wind speeds. Interviewees reported that the natural resources in the area were gradually dwindling. Soil stress and water scarcity were reducing crop yield and people were clearly distressed by the situation. The area is nonetheless endowed with abundant solar radiation which makes it suitable for producing solar energy—as evidenced seen by the presence of the two small photovoltaic panels.
Human resources were found to be relatively high according to education indicators. A large proportion (64.8%) of the surveyed residents had completed primary school; about one quarter of the population (24.3%) had attended secondary school; and, remarkably, technical training was reported by 5%. Overall, women had slightly lower levels of education. The findings match the typical pattern of higher educational levels among rural populations in the province of Villa Clara when compared to national levels. Given the low financial and infrastructure indicators and substantial environmental degradation in this part of the Escambray Mountains, such higher educational levels are noteworthy. In summary, the baseline points at relatively pronounced poverty and, with the exception of solar radiance, limited availability of natural resources, particularly water. Human capital was nonetheless high as a consequence of unexpectedly high education levels.

3.2. Solar Energy for Improving Livelihoods: Demands for Energy and Technologies

An additional 5.4 kW of installed capacity would be required to provide the services demanded by the 12 households. Five different energy technology scenarios were modelled to provide electricity in Las Calabazas: the current two silicon photovoltaic modules; additional photovoltaic silicon systems; thin-film panels; organic solar panels with batteries for energy storage; and a diesel generator (Table 1).
An interesting situation is revealed in relation to connection to the national grid. Because it is only 4 km away from Las Calabazas, potentially connection could have been an appropriate solution. However, extending the grid was impossible due to the impenetrable mountainous terrain where the community is situated and consequent prohibitive costs of the necessary engineering work [79].
Equation (1) was applied to calculate the scores of the impact of the technologies on the livelihoods capitals; it uses technical input obtained from local technicians, the literature as well as data collected during field visits. The larger the score that a technology obtains, the more positive the impact on the capital. Note that local impacts of all photovoltaic technologies are the same for all capitals, with the exception of the existing photovoltaic systems that have a much more limited capacity for energy production (Table 2).
Compared to the diesel generator, new solar installation in Las Calabazas entails fewer benefits for financial capital due to the technology’s high investment costs and the need for a technician to maintain the panels and replace batteries. The diesel solution implies greater operational costs and it, too, requires a technician to operate and repair the machinery. The existing two photovoltaic systems on their own do not contribute significantly to physical and financial capitals because they are unable to meet the community’s energy demand and so impede business ideas (Figure 1).
The community improves social and human capacities due to increased energy availability. More hours of light means that inhabitants can perform individual and collective activities such as studying, lighting health facilities, as well as lighting streets and communal buildings allowing for extra socialising at night hours. Such benefits are expected to arise from either the current diesel generator or the photovoltaic technologies as the latter counts with batteries for energy storage.
Finally, if a diesel generator were installed, it would be particularly damaging to the natural environment due to CO2 emissions, any potential accidental splits of oils into the groundwater reserves or river, and to noise. The photovoltaic technologies can have minor local impacts on the natural environment while the main major impact is associated with visual damage to the landscape due to the number of panels.
Thus, overall analysis of local impacts of the various energy technologies shows that the best alternatives to meet the energy demand of Las Calabazas would be photovoltaic technologies, because these represent the largest positive impacts on the community’s livelihoods capitals (Figure 2). Equation (2) was employed to calculate the overall score for all the alternatives with p = 1, which represents a simple weighted average function.
The high scores obtained for PV point to the appropriateness of solar technology for this rural community. If this option were installed on house roofs, it would eliminate the need to purchase fossil fuels—which would be necessary if a diesel generator solution were selected. As a result, financial resources as well as damage to the local air quality and disruptive noise from the generator could be avoided. Inevitably, however, necessary maintenance and battery replacement costs will impact negatively on the financial assets of the community. Additional financing would thus be required to replace batteries for storage of solar power. There is a positive trade-off in that the anticipated reduction in financial capital would be compensated for by improvements accruing to the other four livelihoods capitals. In addition, the initial investment capital required to develop solar systems in such communities is high and the beneficiaries themselves cannot afford to pay for it. The government or Cuban NGOs such as Cubasolar [81], or international aid organizations, are the ideal institutions to fund, or find the funds, to cover these high initial costs [80]. A further benefit, installation and operation of the solar systems at Las Calabazas could generate up to five new employment opportunities.
The foreseeable effect of solar energy installations on human capital here is thus considerable. Installation of any of the three varieties of PV would improve livelihoods. Moreover, residents would gain technical skills by learning how to use and maintain PV systems at their own homes. Further, it would bring the community together in order to transport and install the solar panels (i.e., enhance social capital). The installation of additional solar panels would further promote social cohesion and willingness to participate in social networks due to the reported practice by PV users of meeting up and discussing how best to maintain the devices, and collectively purchase spare parts and replace the battery. Such willingness to interact socially is an important feature of Cuban society [79].
Adding solar energy installations to this community would not exhaust the local natural resources or damage its environment. The landscape would be slightly altered due to the presence of solar panels on people’s roofs. Special care would have to be taken to ensure correct battery maintenance and disposal, which might otherwise result in leaks of toxic compounds. The addition of solar energy installations to every household would increase the present scanty physical infrastructure revealed by the baseline analysis.

3.3. Solar Energy for Sustainable Livelihoods and a Cleaner Global Environment: Life-Cycle Analysis

The proposed systematic model refines the technology selection process for Las Calabaza in Cuba by also identifying which of the three types of solar photovoltaic cells has optimum global emissions mitigation potential. As discussed, if silicon, thin-film and organic solar cells were installed in poor areas, their impact on the livelihoods of people would be identical—despite their different technical specifications. This sub section shows, however, that these technical differences are important where global environmental assessment is carried out. Modelling the life cycle of solar home systems with SURE-DSS enables tracing of the energy and CO2 pollution of local SHS. It does so by highlighting the energy pay-back time (EPBT), embedded energy and avoided CO2eq. emissions of each potential installation. In order to calculate these parameters for silicon, thin-film and organic technologies, the model takes into account the size of the systems. Table 3 shows the input data needed in order to calculate the global impact of the three types of solar photovoltaic cells.
SURE-DSS assesses system dependability (SD) by addressing irradiance and distance from manufacturing facilities to place of installation, in addition to the CO2 emissions at the country of origin/or installation.
The amount of CO2 emissions per kWh produced of energy (primary or electricity) in eight different countries was compared; also solar insolation for those countries is compared so as to put the solar technology option in a wider context. The third highest irradiance levels are to be found in Cuba, where also large amounts of CO2 emissions from electricity generation are generated. SURE takes into account that type of geographical difference gives different results in terms of environmental impacts depending on the site/place of installation (Table 4).
The total installed capacity of 5.4 kWp is generated by several Solar Home Systems (SHS) (see above). The panels must be bought at and transported to Las Calabazas from the country of manufacture. In order to choose the least polluting equipment as per LCA it is necessary to take into consideration that avoided CO2 varies according to both the type of solar cells selected and their country of origin and manufacture (Table 5). The largest difference in the levels of avoided CO2 emissions between the various types of solar panels is relatively small, at 5.3%.
Cuba makes an ideal case for the installation of SHS due to high insolation levels in most of the island and the presence of a highly polluting electricity generation mix—with 755 g CO2/kWhel. Installation of SHS would therefore avoid consumption of electricity from the grid; this saving of electricity can be calculated through the avoided emissions (Table 5).
Contrary to what might be expected—that is, if panels were manufactured in Cuba (i.e., avoided CO2 emissions would be greatest because the distance travelled to transport the devices is shorter)—the photovoltaic technology that saves the largest CO2 emissions is manufactured in Germany. This is because avoided emissions are calculated by taking into account the country of manufacture and the country of installation in terms of the emissions generated during manufacture and transportation [84]. The small variation among the four countries arises from the amount of embedded emissions found in the solar devices, that is, the parameter that takes into account the energy mix of the country where the panels have been manufactured and the transporting distances from each place to Las Calabazas. The solar system that exhibits the greatest global mitigation features by saving the most emissions for supplying the SHS to Las Calabazas would come from Germany-Cuba, which avoids 133.44 tonnes of CO2 during the system’s lifetime.
Of the three types of solar cells, organic PV emerges as the optimum technology for Las Calabazas (Table 5) since it exhibits the lowest EPBT, highest ERF, and largest amount of avoided emissions during its lifetime. There is nonetheless a drawback because the surface needed to install 5.4 kWp of organic PV is considerably greater—87.6 m2—than that required to install the same nominal power using silicon-PV and CdTe-PV—24.33 m2 and 31.28 m2 respectively. Besides, organic modules need to be replaced more often because their lifetime is shorter. Yet, even taking into account all these factors, the calculations still favour organic cells.
The second best PV technology is thin-film (CdTe) PV. The environmental impacts are slightly lower than Silicon PV, but the system requires some larger surfaces, too.
By applying the global emissions mitigation analysis, differentiation within the cluster of PV alternatives is revealed. The more environmentally friendly means of electricity production, is the organic cell, followed by thin film technology. The two approaches without over conventional crystalline silicon technology when an aggregate of three global environmental parameters is considered. The importance of the geographic origin of the panels—for the three PV technologies—is evident (see Table 6) although the impact is small, it is due to the difference in the embedded emissions during the module’s manufacture arising from the different energy mix of each country. The impact of transport of the PV systems from the location of manufacture to the location of installation was also taken into account, assuming different countries of origin for the equipment: China, Europe, USA and local manufacture in Cuba, and final installation and operation in Las Calabazas, Cuba.

4. Discussion

The SURE-DSS systematic tool to assess both, the local and global impacts of solar (photovoltaic) home systems, is useful to support policy, investment and other decision-makers in evaluating the impact that additional energy access intended to alleviate poverty and protect the natural surroundings of the poor in developing countries. The capacity to assess, select and promote appropriate energy solutions to improve livelihoods and protect local and global environment is enhanced by the addition of the SURE-DSS multi-criteria approach and tool. The model supports the computation of life-cycle analysis indicators to account for contemporary avoided emissions and, importantly, historical CO2 emissions which date back to the manufacture and transportation processes.
By focusing on pay-back time, embedded energy, energy return factor and avoided emissions, the tool determines the CO2 mitigation potential of solar technologies that are used for sustainable development—contributing to international efforts to mitigate emissions and combat climate change—and identifies which of silicone, thin film or organic cell has the greatest chance of achieving cleaner energy and a higher socio-economic impact for poverty reduction. To find out optimum energy arrangements for rural communities, SURE-DSS utilises a large amount of technical data already contained in the system, identifies primary technical and non-technical information, and operates a computing program and multi-criteria approach [16]. A main contribution of the SURE modelling approach is that it identifies, in quantitative terms, potential energy supply changes to reduce the gap between a current, often deprived, socio-economic situation, and improved livelihoods (as per beneficiaries’ demands and decision-makers’ priorities).
The SURE model can provide evidence that generating additional electricity is worthwhile if it is aimed at improving the livelihoods of the poor and that, to contribute to global emissions mitigation, it works to select the least contaminating low carbon technologies such as solar home systems. The analytical design and evidence presented in this article relating local and global environmental impact of solar technologies for home use strengthen, rather than question, any plan to increase the supply of electricity to poorest regions in the developing countries. While the approach of the systematic tool assumes that increasing solar installations will positively affect the socio-economic and environmental conditions of poor populations—as discussed above—it also highlights the likely global environmental impact of such additions. The systemic tool contributes to the process of decision-making by offering information and solutions and by calculating CO2 emissions savings. Yet, while calculating the amount of emissions that can be saved by generating electricity for the poor from renewable sources is not, per se, a totally novel procedure, the systematic tool is innovative in that it also brings to light their embedded energy and pay-back time.
SURE-DSS is an optimization tool that takes into consideration local resource availability, users’ demands and environmental impact at most points of the SHS’s life, including power generation. The addition of SHS to all households in Las Calabazas will benefit social and human capitals because solar panels enable additional light hours that can be used for economic, educational or leisure purposes. There is now potential for the SURE-DSS combined analysis of livelihoods resources, energy demand and supply and life cycle analysis designed for photovoltaic technologies to be developed and applied to other renewable energy technologies. The inbuilt flexibility of the computational program SURE-DSS enables assessment of different technologies as well as comparison of energy technologies for more precise selection.
In the light of foreseeable expansion of solar energy installation in developing countries, particularly in rural areas where access to the grid is difficult or not available, the comprehensive technical and non-technical analysis of sustainability applied to different types of solar technology is more useful than assuming that all solar panels are, or should be, made of silicon crystalline cells. Bringing together the analysis of global mitigation and livelihoods impact of solar technology is a step forward in supporting both decision-makers and prospective beneficiaries in poor areas. Moreover, because the poorest in less developed countries are the most exposed to the malign effects for climate change, any measure to avoid further global warming is to be welcomed. There is, thus, vested interest of national governments in developing countries to reach emission reduction targets [11]. The SURE systematic tool has a role to play in assisting governments to comply with international mitigation targets. SURE approach provides useful information for stakeholders and facilitates decision-making, but a full analysis of impacts on a large community and even more in a broader area (a full municipality, a department or even a country) should be addressed using alternative approaches, such as system dynamics or “systems thinking” as proposed by Gonzalez et al. [85].
This article has demonstrated how the model addresses equally concerns over poverty, sustainable development, global climate change, and low-carbon society. The SURE-DSS could be used by policy decision-makers who aim at increasing the rate of electrification among the poor. The model offers the option to choose the least polluting renewable energy technology for small rural communities, as long as the impact on poverty reduction is equally achieved. In Cuba, the choice of the specific solar home system for Las Calabazas will contribute towards improving livelihoods, reducing national CO2 emissions, and increasing renewable energy technology’s share of the country’s energy mix. In view of developing countries having a greater say in the definition of a post-Kyoto agreement, the SURE systematic tool can assist governments to gather and process information that is in line with national and international aspirations.

5. Conclusions

The article has explored and explained the technical capacity and functionality of the SURE-Decision Support System. This tool provides information to stakeholders to promote appropriate and effective energy development in poor areas by assessing local sustainable livelihoods and global environmental impact from such development. It has been demonstrated that energy access to the poor in less developed countries need not jeopardize climate emissions goals as long as global carbon emissions are also monitored. The integration of the life-cycle analysis categories of embedded energy and pay-back time—in addition to saved CO2 emissions—significantly widened the global environmental analysis the SURE-DSS is able to perform. Life cycle analysis is a valuable tool which enables assessment of a broad range of impacts, e.g., human toxicity, soil contamination and resources depletion. Notwithstanding that these impacts could affect the health of local populations, and thus their livelihoods, this study has focused on the environmental bearings of energy technologies. The exclusive attention on the impact of greenhouse gas emissions, via CO2eq. balance, to calculate the global impact of solar technologies on the atmosphere has enabled a detailed and solid addition to the SURE-DSS.
The findings discussed in this article show that, the apparently conflicting objectives of increasing energy supply while also controlling global CO2 emissions can be overcome by using a systematic and combined approach accomplished by the SURE-DSS methodology which evaluates the best option for rural energy supply and evaluates the amount of historical CO2 and saved emissions of the optimal solutions for improving livelihoods.
The livelihoods impact analysis demonstrated that, while silicon, thin film or organic solar modules could all equally meet the community’s electrification demands by a photovoltaic system, not all would equally affect the global environment since the organic photovoltaic technology will avoid most emissions. Selecting appropriate energy technology is just the beginning of a progression towards sustainable poverty reduction and enhancement of economic livelihoods prospects. The IPCC (2001; 2008; 2014) [7] estimated, and later confirmed, that without near-term introduction of supportive and effective policy actions by government, energy related greenhouse gases (GHG) emissions—mainly from fossil fuel combustion—are projected to rise by over 50% by 2030. As a result, governments committed to reducing poverty are also compelled to give increased attention to CO2 emissions. Based on a study of solar technologies, this article provides decision-makers with robust evidence which supports the addition of energy supply to improving livelihoods while also reducing global emissions. The multi-criteria systems approach discussed in this study is necessary at a time when the controversy over developing countries generating additional energy, and the repositioning of developing countries as world largest emitters of CO2 may still deviate attention from the need to enhance energy access to reduce poverty.

Supplementary Materials

Supplementary Materials can be found at www.mdpi.com/1996-1073/9/12/1086/s1.

Acknowledgments

Thanks are due to UK DFID for funding the initial and developmental stages of the systematic approach (2001–2006); the Renewable Energy Foundation 2007–2010; and the British Council and DFID DELPHE 2008-2012. We would like to acknowledge financial support from the Spanish Government, Grant ENE2013-48816-C5-3-R, including FEDER funds and Fundación Séneca (Región de Murcia), Grant 19882-GERM-15. Lucía Serrano is also grateful to Fundación Séneca for postdoctoral Grant No. 19759/PD/15. Special thanks are extended to Bhampavika Wangvitayakun from Imperial College London for careful reading of the manuscript and contribution to its final edition.

Author Contributions

Judith A. Cherni and Felipe Henao developed the SURE approach, Lucía Serrano and Antonio Urbina added global LCA analysis, Raúl Olalde Font collected data in Cuba; Lucía Serrano, Antonio Urbina and Judith A. Cherni wrote the paper. All authors applied SURE to data for the case study and revised and contributed to the final version of the article.

Conflicts of Interest

The authors declare no conflict of interest. The founding sponsors had no role in the design of the study; in the collection, analyses, or interpretation of data; in the writing of the manuscript, and in the decision to publish the results.

References

  1. World Bank. The World Bank Annual Report 2005. Available online: http://siteresources.worldbank.org/INTANNREP2K5/Resources/51563_English.pdf (accessed on 30 August 2016).
  2. Niu, S.; Jia, Y.; Wang, W.; He, R.; Hu, L.; Liu, Y. Electricity consumption and human development level: A comparative analysis based on panel data for 50 countries. Int. J. Electr. Power Energy Syst. 2013, 53, 338–347. [Google Scholar] [CrossRef]
  3. Niu, S.W.; Zhang, X.; Zhao, C.S.; Niu, Y.Z. Variations in energy consumption and survival status between rural and urban households: A case study of the Western Loess Plateau. China Energy Policy 2012, 49, 515–527. [Google Scholar] [CrossRef]
  4. Activities of Member Organizations and Partners of UN-Energy in Support of “2014–2024 United Nations Decade of Sustainable Energy for All”. Available online: http://www.un-energy.org/sites/default/files/share/une/activities_un-energy_members_for_the_decade_report.pdf (accessed on 30 August 2016).
  5. United Nations Development Programme. Energy as a Tool for Sustainable Development; United Nations Development Programme: New York, NY, USA, 1999. [Google Scholar]
  6. Millennium Development Goals. Available online: http://alws.s3.amazonaws.com/New%20ALWS%20Web%20Site/Discover%20More/Schools/Mozambique/Millennium%20Development%20Goals.pdf (accessed on 30 August 2016).
  7. AGECC—United Nations Secretary-General’s Advisory Group of Energy and Climate Change, 2010. Energy for a Sustainable Future. Available online: http://www.un.org/wcm/webdav/site/climatechange/shared/Documents/AGECC%20summary%20report[1].pdf (accessed on 30 August 2016).
  8. International Panel on Climate Change (IPCC). Reports on “Impacts, Adaptation and Vulnerability” (Working group II), and “Mitigation of Climate Change” (Working Group III). 2014. Available online: http://ipcc-wg2.gov/AR5/ (accessed on 1 October 2014). [Google Scholar]
  9. International Energy Outlook—Energy Information Administration (EIA). Greenhouse Gases, Climate Change, and Energy. Official Energy Statistics for the U.S. Government: Energy Information Administration Brochures. 2014. Available online: http://www.eia.gov/forecasts/ieo/ (accessed on 20 September 2014). [Google Scholar]
  10. International Energy Agency (IEA). How the Energy Sector Can Deliver on a Climate Agreement in Copenhagen. Special Early Excerpt of the World Energy Outlook 2009 for the Bangkok UNFCC Meeting. 2009. Available online: http://www.worldenergyoutlook.org/ (accessed on 30 August 2016).
  11. International Energy Agency (IEA). Energy for All: Financing Access for the Poor. 2011. Available online: http://www.iea.org/papers/2011/weo2011_energy_for_all.pdf (accessed on 30 August 2016).
  12. Cherni, J.A.; Kalas, N. A multi-criteria decision-support approach to sustainable rural energy in developing countries. In Handbook on Decision Making. Vol 1: Techniques and Applications; Lakhmi, C.J., Lim, C.P., Eds.; Springer: Berlin/Heidelberg, Germany, 2010. [Google Scholar]
  13. Poor People’s Energy Outlook. 2010. Available online: https://cleanenergysolutions.org/resources/poor-peoples-energy-outlook-2010 (accessed on 30 August 2016).
  14. Poor People’s Energy Outlook. 2012. Available online: http://policy.practicalaction.org/policy-themes/energy/poor-peoples-energy-outlook/poor-peoples-energy-outlook-2012 (accessed on 30 August 2016).
  15. Markal, Leap and Homer—Long-range Energy Alternatives Planning System (LEAP) (2006) User Guide. Boston, Stockholm Environment Institute (SEI). Available online: http://www.sei.se/programmes/climate-a-energy/projects/189-leap-long-range-energy-alternatives-planning-system.html (accessed on 30 August 2016).
  16. Brent, A.C.; Kruger, W.J.L. Systems analyses and the sustainable transfer of renewable energy technologies: A focus on remote areas of Africa. Energy Policy 2009, 34, 1774–1781. [Google Scholar] [CrossRef]
  17. Cherni, J.A.; Dyner, I.; Henao, F.; Jaramillo, P.; Smith, R.; Olalde-Font, R. Energy supply for sustainable rural livelihoods. A multi-criteria decision-support system. Energy Policy 2007, 35, 1493–1504. [Google Scholar] [CrossRef]
  18. Shmelev, S.E.; van den Bergh, J.C.J.M. Optimal diversity of renewable energy alternatives under multiple criteria: An application to the UK. Renew. Sustain. Energy Rev. 2016, 60, 679–691. [Google Scholar] [CrossRef]
  19. Forsyth, T. Critical Political Ecology; Routledge: Abingdon, UK, 2003. [Google Scholar]
  20. NuRa. Nuon Raps Utility: Powering Opportunity. 2009. Available online: http://www.nura.co.za (accessed on 30 August 2016).
  21. Chowdhury, S.A.; Mourshed, M.; Kabir, S.M.R.; Islam, M.; Morshed, T.; Khan, M.R.; Patwary, M.N. Technical appraisal of solar home systems in Bangladesh: A field investigation. Renew. Energy 2011, 36, 772–778. [Google Scholar] [CrossRef] [Green Version]
  22. Best, S. Remote Access: Expanding Energy Provision in Rural Argentina through Public-Private Partnerships and Renewable Energy; A Case Study of the PERMER Programme; IIED: London, UK, 2011. [Google Scholar]
  23. Alsema, E.A. Energy Pay-Back Time and CO2 emissions of PV Systems. Prog. Photovolt. Res. Appl. 2000, 8, 17–25. [Google Scholar] [CrossRef]
  24. Alsema, E.A. Environmental Life Cycle Assessment of Solar Home Systems; Report NWS-E-2000-15; Department of Science, Technology and Society, Utrecht University: Utrecht, The Netherlands, 2000. [Google Scholar]
  25. Alsema, E.A.; Nieuwlaar, E. Energy viability of photovoltaic systems. Energy Policy 2000, 28, 999–1010. [Google Scholar] [CrossRef]
  26. Fhtenakis, V.; Alsema, E. Photovoltaics energy payback times, greenhouse gas emissions and external costs: 2004–Early 2005. Prog. Photovolt. Res. Appl. 2006, 14, 275–280. [Google Scholar] [CrossRef]
  27. Fhtenakis, V.; Kim, H.C.; Alsema, E. Emissions from photovoltaic life cycles. Environ. Sci. Technol. 2008, 42, 2168–2174. [Google Scholar] [CrossRef]
  28. Raugei, M.; Bargigli, S.; Ulgiati, S. Life cycle assessment and energy pay-back time of advanced photovoltaic modules: CdTe and CIS compared to poly-Si. Energy 2007, 32, 1310–1318. [Google Scholar] [CrossRef]
  29. Roes, A.L.; Alsema, E.A.; Blok, K.; Patel, M.K. Ex-ante environmental and economic evaluation of polymer photovoltaics. Prog. Photovolt. Res. Appl. 2009, 17, 372–393. [Google Scholar] [CrossRef]
  30. Garcia-Valverde, R.; Cherni, J.; Urbina, A. Life cycle analysis of organic photovoltaic technologies. Prog. Photovolt. Res. Appl. 2010, 18, 535–558. [Google Scholar] [CrossRef]
  31. Espinosa, N.; García-Valverde, R.; Urbina, A.; Krebs, F.C. A life cycle analysis of polymer solar cell modules prepared using roll-to-roll methods under ambient conditions. Sol. Energy Mater. Solar Cells 2011, 95, 1293–1302. [Google Scholar] [CrossRef]
  32. Lorenzo, E. Photovoltaic rural electrification. Prog. Photovolt. Res. Appl. 1997, 95, 3–27. [Google Scholar] [CrossRef]
  33. Watt, M.; Johnson, A.; Ellis, M.; Outhred, H. Life-cycle air emissions from PV power systems. Prog. Photovolt. Res. Appl. 1998, 6, 127–136. [Google Scholar] [CrossRef]
  34. Díaz, P.; Egido, M.A.; Nieuwenhout, F. Dependability analysis of stand-alone photovoltaic systems. Prog. Photovolt. Res. Appl. 2007, 15, 245–264. [Google Scholar] [CrossRef]
  35. Jungbluth, N. Life cycle assessment of crystalline photovoltaics in the Swiss ecoinvent database. Prog. Photovolt. Res. Appl. 2005, 13, 429–446. [Google Scholar] [CrossRef]
  36. McDonald, N.C.; Pearce, J.M. Producer responsibility and recycling solar photovoltaic modules. Energy Policy 2010, 38, 7041–7047. [Google Scholar] [CrossRef]
  37. Kato, K.; Murata, A.; Sakuta, K. An evaluation on the life cycle of photovoltaic energy system considering production energy of off-grade silicon. Sol. Energy Mater. Sol. Cells 1997, 47, 95–100. [Google Scholar] [CrossRef]
  38. Knapp, K.; Jester, T. Empirical investigation of the energy payback time for photovoltaic modules. Sol. Energy 2001, 71, 165–172. [Google Scholar] [CrossRef]
  39. Krauter, S.; Ruther, R. Considerations for the calculation of greenhouse gas reduction by photovoltaic solar energy. Renew. Energy 2004, 29, 345–355. [Google Scholar] [CrossRef]
  40. Emmott, C.J.M.; Urbina, A.; Nelson, J. Environmental and economic assessment of ITO-free electrodes for organic solar cells. Sol. Energy Mater. Sol. Cells 2012, 97, 14–21. [Google Scholar] [CrossRef]
  41. Kato, K.; Hibino, T.; Komoto, K.; Ihara, S.; Yamamoto, S.; Fujihara, H. A life-cycle analysis on thin-film CdS/CdTe PV modules. Sol. Energy Mater. Sol. Cells 2001, 67, 279–287. [Google Scholar] [CrossRef]
  42. Greijer, H.; Karlson, L.; Lindquist, S.E.; Hagfeldt, A. Environmental aspects of electricity generation from a nanocrystalline dye sensitized solar cell system. Renew. Energy 2001, 23, 27–39. [Google Scholar] [CrossRef]
  43. Nieuwenhout, F.D.J.; van Dijk, A.; Lasschuit, P.E.; van Roekel, G.; van Dijk, V.A.P.; Hirsch, D.; Wade, H. Experience with solar home systems in developing countries: A review. Prog. Photovolt. Res. Appl. 2001, 9, 455–474. [Google Scholar] [CrossRef]
  44. Caamaño, E.; Lorenzo, E.; Zilles, R. Quality control of wide collections of PV modules: Lessons learned from the IES experience. Prog. Photovolt. Res. Appl. 1999, 7, 137–149. [Google Scholar] [CrossRef]
  45. Rydh, C.; Sanden, B. Energy analysis of batteries in photovoltaic systems. Part I: Performance and energy requirements. Energy Conver. Manag. 2005, 46, 1957–1979. [Google Scholar] [CrossRef]
  46. Rydh, C.; Sanden, B. Energy analysis of batteries in Photovoltaic systems. Part II: Energy return factor and overall battery efficiencies. Energy Conver. Manag. 2005, 46, 1980–2000. [Google Scholar] [CrossRef]
  47. Mulugetta, Y.; Doig, A.; Dunnet, S.; Jackson, T.; Khennas, S.; Rai, K. Energy for Rural Livelihoods; ITDG Publisher: West Yorkshire, UK, 2005. [Google Scholar]
  48. Morante, F.; Zilles, R. Electric Consumption in SHSs in rural communities of Brazil and Peru and recommendations for sizing. Prog. Photovolt. Res. Appl. 2008, 16, 171–179. [Google Scholar] [CrossRef]
  49. EPIA, European Photovoltaic Industry Association. Global Market Outlook for Photovoltaics 2014–2018. Report, June 2014. ISBN 9789082228403. 2014. Available online: www.epia.org (accessed on 30 August 2016).
  50. Egido, M.A.; Lorenzo, E.; Narvarte, L. Universal technical standard for solar home systems. Prog. Photovolt. Res. Appl. 1998, 6, 315–324. [Google Scholar] [CrossRef]
  51. Egido, M.A.; Lorenzo, E.; Narvarte, L. Universal Technical Standard for Solar Home Systems; Official Publication of the European Communities; European Commission (DGVIII): Brussels, Belgium, 1999. [Google Scholar]
  52. Sullivan, J.L.; Gaines, L. Status of life cycle inventories for batteries. Energy Conver. Manag. 2012, 58, 134–148. [Google Scholar] [CrossRef]
  53. Posorski, R.; Bussmann, M.; Menke, C. Does the use of Solar Home Systems (SHS) contribute to climate protection? Renew. Energy 2003, 28, 1061–1080. [Google Scholar] [CrossRef]
  54. Swiss Ecoinvent Database, Technoparkstrasse 1, 8005 Zurich, Switzerland. Available online: http://www.ecoinvent.org/ (accessed on 30 August 2016).
  55. Powell, D.M.; Winkler, M.T.; Choi, H.J.; Simmons, C.B.; Needleman, D.B.; Buonassisi, T. Crystalline silicon photovoltaics: A cost analysis framework for determining technology pathways to reach base load electricity costs. Energy Environ. Sci. 2012, 5, 5874–5883. [Google Scholar] [CrossRef]
  56. Kolhe, M.; Kolhe, S.; Joshi, J.C. Economic viability of stand-alone solar photovoltaic system in comparison with diesel-powered system for India. Energy Econ. 2002, 24, 155–165. [Google Scholar] [CrossRef]
  57. Luque, A. Photovoltaic market and costs forecast based on a demand elasticity model. Prog. Photovolt. Res. Appl. 2001, 9, 303–312. [Google Scholar] [CrossRef]
  58. Van Sark, W.G.H.M.; Alsema, E.A.; Junginger, H.M.; de Moor, H.H.C.; Schaeffer, G.J. Accuracy of progress ratios determined from experience curves: The case of crystalline silicon photovoltaic module technology development. Prog. Photovolt. Res. Appl. 2008, 16, 441–453. [Google Scholar] [CrossRef]
  59. EPVTP 2011: European Photovoltaic Technology Platform. A Strategic Research Agenda for Photovoltaic Solar Energy Technology. European Community, Belgium. Available online: http://www.eupvplatform.org/publications/strategic-research-agenda-implementation-plan.html#c2783 (accessed on 30 August 2016).
  60. Grätzel, M. Photoelectrochemical cells. Nature 2001, 414, 338–344. [Google Scholar] [CrossRef] [PubMed]
  61. Sariciftci, N.S.; Braun, D.; Zhang, C.; Srdanov, V.I.; Heeger, A.J.; Stucky, G.; Wudl, F. Semiconducting polymer-buckminsterfullerene heterojunctions: Diodes, photodiodes, and photovoltaic cells. Appl. Phys. Lett. 1993, 62, 585–587. [Google Scholar] [CrossRef]
  62. Yu, G.; Gao, J.; Hummelen, J.C.; Wudl, F.; Heeger, A.J. Polymer photovoltaic cells: Enhanced Efficiencies via a network of Internal donor-acceptor Heterojunctions. Science 1995, 270, 1789–1792. [Google Scholar] [CrossRef]
  63. Halls, J.J.M.; Walsh, C.A.; Greenham, N.C.; Marseglia, E.A.; Friend, R.H.; Moratti, S.C.; Holmes, A.B. Efficient photodiodes from interpenetrating polymer networks. Nature 1995, 376, 498–500. [Google Scholar] [CrossRef]
  64. Brabec, C.J.; Sariciftci, N.S.; Hummelen, J.H. Plastic solar cells. Adv. Funct. Mater. 2001, 11, 15–26. [Google Scholar] [CrossRef]
  65. You, J.; Dou, L.; Yoshimura, K.; Kato, T.; Ohya, K.; Moriarty, T.; Emery, K.; Chen, C.C.; Gao, J.; Li, G. A polymer tandem solar cell with 10.6% power conversion efficiency. Nat. Commun. 2013, 4, 1446. [Google Scholar] [CrossRef] [PubMed]
  66. Burschka, J.; Pellet, N.; Moon, S.J.; Humphry-Baker, R.; Gao, P.; Nazeeruddin, M.K.; Grätzel, M. Sequential deposition as a route to high-performance perovskite-sensitized solar cells. Nature 2013, 499, 316–319. [Google Scholar] [CrossRef] [PubMed]
  67. Liu, M.; Johnston, M.B.; Snaith, H.J. Efficient planar heterojunction perovskite solar cells by vapour deposition. Nature 2013, 501, 395–398. [Google Scholar] [CrossRef] [PubMed]
  68. Brabec, C.J.; Dyakonov, V.; Scherf, V. Socio economic impacts of low cost PV technologies. In Organic Photovoltaics: Materials, Device Physics and Manufacturing Technologies; Wiley-VCH: Hoboken, NJ, USA, 2008. [Google Scholar]
  69. Azzopardi, B.; Emmott, C.J.M.; Urbina, A.; Krebs, F.C.; Mutale, J.; Nelson, J. Economic assessment of solar electricity production from organic-based photovoltaic modules in a domestic environment. Energy Environ. Sci. 2011, 4, 3741–3753. [Google Scholar] [CrossRef]
  70. Beiley, Z.M.; McGehee, M.D. Modeling low cost hybrid tandem photovoltaics with the potential for efficiencies exceeding 20%. Energy Environ. Sci. 2012, 5, 9173–9179. [Google Scholar] [CrossRef]
  71. Muller, A.; Wambach, K.; Alsema, E. Life Cycle Analysis of a Solar Module Recycling Process; Cambridge University Press: London, UK, 2015. [Google Scholar]
  72. Salomone, R. An eco-balance of a recycling plant for spent lead-acid batteries. Environ. Manag. 2005, 35, 206–219. [Google Scholar] [CrossRef] [PubMed]
  73. Bombach, E.; Muller, A.; Wambach, K.; Roverl, I. Recycling of solar cells and modules—Recent improvements. In Proceedings of the 20th European Photovoltaic Solar Energy Conference, Barcelona, Spain, 6–10 June 2005.
  74. Henao, F.; Cherni, J.A.; Jaramillo, P.; Dyner, I. A multi-criteria approach to sustainable energy supply for the rural poor. Eur. J. Oper. Res. 2012, 218, 801–809. [Google Scholar] [CrossRef]
  75. Sustainable Rural Livelihoods: Practical Concepts of the 21st Century. Available online: http://www.ids.ac.uk/publication/sustainable-rural-livelihoods-practical-concepts-for-the-21st-century.
  76. Ashley, C.; Carney, D. Sustainable Livelihoods: Lessons from Early Experience; Department for International Development (DFID): London, UK, 1999.
  77. Ellis, F. Rural Livelihoods and Diversity in Developing Countries; Oxford University Press: Oxford, UK, 2000. [Google Scholar]
  78. Zeleny, M. Multiple Criteria Decision Making; McGraw-Hill: New York, NY, USA, 1982. [Google Scholar]
  79. ONE. Anuario Estadístico. Cuba. 2013. Available online: http://www.one.cu/aed2013/26Villa%20Clara/Municipios/13%20Manicaragua/esp/20080618_tabla_cuadro.htm (accessed on 30 August 2016).
  80. Osvaldo, R.G.; President of the Municipal Government Council of Manicaragua, Manicaragua, Villa Clara, Cuba. Personal communication, 2012.
  81. Wilfredo, L.H.; Manager of the Hydro-Electricity Company for the province of Villa Clara, Santa Clara, Villa Clara, Cuba. Personal communication, 2012.
  82. CubaSolar: Red Cubana de Apoyo a la Energía Solar. Available online: http://www.cubasolar.cu/.
  83. International Energy Agency (IEA). CO2 Emissions from Fuel Combustion—HIGHLIGHTS; IEA: Paris, France, 2012. [Google Scholar]
  84. Serrano-Luján, L.; Espinosa, N.; Abad, J.; Urbina, A. The greenest decision on photovoltaic system allocation. Renew. Energy 2017, 101, 1348–1356. [Google Scholar] [CrossRef]
  85. González, A.M.; Sandoval, H.; Acosta, P.; Henao, F. On the acceptance and sustainability of renewable energy projects—A systems thinking perspective. Sustainability 2016, 8, 1171. [Google Scholar] [CrossRef]
Figure 1. Local impact of solar energy technologies, and diesel on livelihoods capital, Las Calabazas, Cuba, 2012.
Energies 09 01086 g001
Figure 2. The EE Index (see Table 3), or multicriteria score, of five energy alternatives on overall livelihoods capitals, Las Calabazas, Cuba, 2012.
Energies 09 01086 g002
Table 1. Technical features of energy technologies, Las Calabazas, Cuba, 2012.
TechnologyEfficiency %Expected Lifespan (years)Capacity kWp
Current Silicon PV18201
New Silicon PV18305.4
Thin-film PV14305.4
Organic PV5305.4
Diesel generator70105.4
Table 2. Multicriteria payoff matrix: impact of energy technologies on sustainable livelihoods capitals (Energy Impact Index, EEI) * to assess overall technology appropriateness, Las Calabazas, Cuba, 2012.
Sustainable Livelihoods CapitalsEnergy Technology Options
Baseline with the Existing Silicon PVNew Silicon PVThin Film PVOrganic PVDiesel
Natural5040404010
Physical5060606040
Social4080808080
Human4080808080
Financial5060606070
* For EEI, see [16]; technology appropriateness has been normalized to 100. It is assumed that the greater the score, the more appropriate the technology.
Table 3. Technical input values to assess global environmental impact of photovoltaic installations for improving livelihoods.
PV TechnologyPower Conversion Efficiency (%)Embedded Energy (GJ/kW)Weight (kg/m2)Lifetime (years)
New Silicon PV1850.518.9130
Organic PV 517.60.330
Thin-film PV1414.311.630
1 As explained above, organic photovoltaic technologies have achieved more than 10% efficiency in the laboratory and on small modules. Large size modules can reach efficiencies of between 3% and 6%. The systematic model employs efficiency of 5% for organic PV modules.
Table 4. CO2 per kWh of produced primary energy (electricity) and insolation levels in selected countries, 2012.
Countryg CO2/kWh (from Primary Energy)Insolation (kWh/m2/year) see [82]g CO2/kWh (from Electricity Generation) see [83]
Cuba4142050755
China East2821733742
China West2822646742
Spain8191666298
Denmark168969302
UK2651105449
Colombia, North521551175
Colombia, South521003175
Dominican Republic8222144590
Sources: Cuba Solar [82]; IEA (2012) [83].
Table 5. Potential avoided CO2 emissions of a 5.4 kWp SHS installation in Cuba, by country of manufacture.
Country of Manufacture Avoided Emissions (tons CO2eq.) by Type of Solar Cell
SiliconThin-FilmOrganic
Cuba116.54120.64122.09
China115.90120.28121.93
Germany117.62121.09122.38
USA117.40122.32121.02
Table 6. Mitigation potential of three types of solar cells for a 5.4 kWp SHS for Las Calabazas, Cuba.
Global CO2 Mitigation IndicatorsPV Technologies
SiliconThin-FilmOrganic
EPBT Energy pay-back time (years)1.830.840.49
ERF Energy Return factor 10.9123.8840.75

