1. Introduction
As modern society’s appetite for energy appears insatiable, two fundamental issues are challenging the current energy generation-consumption model, namely sustainability and energy security. Natural reserves are fast depleting, and energy demand is soaring; undoubtedly due to industrialisation and population growth. While exploration of new deposits (hydrocarbon) is a possibility, it is certainly not sustainable [
1]. This has given rise to new global initiatives aimed at (i) improving energy efficiency and (ii) exploring more renewable uptake. Providing energy management techniques with a view toward improving efficiency is the main focus of this paper.
Amongst the smart grid domains, the Home Area Network (HAN) is perhaps of most interest to consumers. This is first because it controls the operation of in-home appliances, and secondly, it offers an environment for voluntary curtailment or scheduling of in-home loads [
2]. Lastly, the HAN empowers consumers to become active stakeholders in the energy market through an emerging concept known as prosuming. In terms of load reduction, consumers are motivated by various incentives either to reduce usage at peak periods and achieve some savings when the tariff is high or enjoy peak time rebates offered by the utility.
As the deployment of Distributed Energy Resources (DERs) becomes commonplace, sophisticated monitoring and control capabilities are actively required within the home to optimise energy consumption in a bid to improve comfort and satisfaction levels without compromising safety. These capabilities can be realised through the integration of everyday appliances [
3], Distributed Generating Systems (DGS) and Distributed Storage Systems (DSS) with a control unit; also known as the Home Energy Management System (HEMS) controller. The role of the HEMS controller is to monitor and coordinate the operations of the loads and DERs in the most efficient ways [
4,
5].
It has been shown in [
6,
7,
8] that the integration of in-home controllable loads with HEMS could potentially result in significant fiscal savings. By dynamically controlling the behaviour of smart appliances to adapt to the grid conditions and market dynamics, additional benefits, such as sustainability and operational efficiency, on the utility side can be achieved; this is generally referred to as Demand Side Management (DSM). The authors in [
9,
10] also opined that the awareness of energy consumption could improve efficiency by as much as 12%–15% in some cases. While many of the existing HEMS solutions are retrofits, some rely on proprietary techniques to transmit the control messages required to trigger a change in operational states of domestic appliances or provide low-level visibility of energy consumption.
As the drive toward energy efficiency gained prominence and many Energy Management System (EMSs) were released into the market, it became necessary to develop communication standards for connecting smart devices in the home. However, since networks built on such standards are expected to promote efficiency, the processes and protocols associated with the communication standards are themselves expected to be energy efficient. This is why many current implementations of EMSs are based on LoWPAN (IEEE-802.15.4). In this paper, we refer to 6LoPLC as the power line equivalent of 6LoWPAN.
Taking into account the electrical properties of various cables, the authors in [
11] developed a power line channel based on Transmission Line Theory (TLT) on a similar framework to NS-3. These result in a power line module that can be integrated and run within the NS-3 environment. Using this Power Line Communication (PLC) module, we create a model of the 6LoPLC-enabled HEMS network that uses the same characteristics as implemented in Hanadu (Hanadu is a registered technology of Xsilon Ltd. (patent under grant)) evaluation hardware. To cater to the low data rate of HEMS applications, an adaptation layer is included in the model.
The contribution of this paper is three-fold as follows: (i) development of a representative network model that runs 6LoPLC; (ii) exploitation of low-rate PLC solutions for the HEMS application, which is especially useful for hard-to-reach areas or where a wireless solution is not feasible; and (iii) evaluation of 6LoPLC in various use-cases and system conditions, using the developed network model. The significance of the results in this work is that although the evaluation is carried out with three units of hardware (developed as part of the Innovate-UK funded project), knowledge of larger networks, obtained from simulation results, can help improve system tolerance.
The rest of this paper is organised as follows. The motivation and related work are discussed in
Section 2, whereas
Section 3 describes the Hanadu evaluation kits and the resultant network used in this study.
Section 4 presents the simulation environment used, while our results are discussed in
Section 5. Finally, the key conclusions are highlighted in
Section 6.
2. Motivation and Related Work
The role of the HEMS controller is to monitor and optimise energy consumption in the home. While home users justifiably continue to acquire more devices, insufficient attention is paid to energy consumption arising from the use of those appliances. Interestingly, homes account for a significant percentage of energy consumption; hence, efficiency in the home could result in far-reaching benefits on the main grid. To underscore this, in the U.S. for instance, buildings consume 40% of available energy [
12], and a similar trend exists in the U.K., where residential dwellings alone are responsible for 26.7% of consumption [
4]. Clearly, the home must be included in the overarching energy management strategy to achieve the much-needed security and sustainability objectives of the smart grid [
13,
14]. At the heart of such an intelligent system is a pervasive, low-cost, low-rate communication system.
Like other control networks, the design philosophy behind HEMS is that in-home smart appliances add more value when they are integrated and function as a network, than autonomous deployment of individual entities. The resulting network is as resilient as the underlying communication technology enabling it. In terms of communications for HEMS, the forerunners are mostly wireless technologies, for instance Wi-Fi [
15,
16,
17], ZigBee [
18,
19] and Bluetooth [
20]. However, similar to other communication systems, these wireless technologies have limitations. For example, signal propagation issues, such as limited range and physical barriers constraints, including Line of Sight (LOS) requirements, are known to inhibit channel performance. Although research in home networking is growing, the main enabling standards for interconnecting devices in the HAN are IEEE 1905.1 and International Telecommunication Union’s Telecommunication standardization sector specification for Gigabit home networking (ITU-T G.hn). These standards can deliver data rates from several Mbps up to 1 Gbps [
21]. Hence, they are more suitable for broadband applications.
In the quest to find a suitable communication system for HEMS applications, PLC has been considered in some studies [
19,
22,
23]. However, the focus of those studies was to facilitate the exchange of control and monitoring information between the electrical loads and the management system over power lines. Exploitation of low-rate, low-power PLC for monitoring and control was not considered. Furthermore, the HomePlug Green PHY standard was developed for smart home and home automation generally over power lines. To reduce cost and power consumption, it was developed to support only the Quadrature Phase Shift Keying (QPSK) modulation scheme [
24].
All communication technologies have their strengths and weaknesses; however, this work is not a direct comparison between PLC-based systems and other techniques. Therefore, rather than debate the merits or otherwise of LoWPAN for HEMS applications, this paper accepts the substantial work already done in that area and extends some of its capabilities into PLC networks. This should inspire a new wave of complimentary or alternate low-rate communication systems for HEMS applications. For example, wireless communication in buildings with metallic walls, cellars and underground structures can be severely challenging and often results in blind spots (locations where the wireless signal is weak or absent). PLC is specifically suitable for such situations and generally appealing for HEMS, because not only is it pervasive in most homes, but also it provides the scalability and availability needed by HEMS applications.
In HEMS, ZigBee is one of the widely-deployed low-power communication technologies, with solutions such as SEP 1.x and SEP 2.0 available on the market. Of course, there are use-cases where ZigBee is arguably preferred above others (e.g., battery thermostats, gas metering and water metering); there are also HEMS applications where the PLC equivalent is more appropriate (e.g., power sensing, load control, Plug-in Electric Vehicles (PEV) management, DGS/DSS management, etc.). Thus, it is desirable to have alternative solutions for environments with a strong diversity of appliances or multi-dwelling units in which a single wireless solution may not meet the system reliability requirement. One of the contributions of this work is to exploit such diversity and provide a low-power PLC system.
PLC has evolved in the last decade in terms of standardisation [
25,
26] and applications [
27,
28]. With use-cases in many areas ranging from the smart grid to home networking, untapped potentials still exist for constrained networks. This paper explores an experimental adaptation of IPv6 over LoWPAN (6LoWPAN) features in PLC networks for monitoring and control applications within the HEMS. Since impulsive noise [
29,
30] has been shown to be the most dominant inhibitor in PLC systems [
31,
32], its effects are investigated in a wide range of scenarios, such as application data size and the number of smart appliances. Lastly, we highlight the fundamental consequences of 6LoPLC in HEMS applications and the variability of performance under the influence of impulsive noise.
3. Hanadu 6LoPLC
Hanadu is a PLC technology designed by Xsilon Ltd. for connecting Internet of Things (IoT) applications in the home, such as HEMS. Following the preliminary investigations, three units of Hanadu evaluation kits were deployed with a combination of Hanadu and 6LoWPAN to deliver a 6LoPLC evaluation platform. Throughout this paper, Hanadu kits and evaluation kits shall be used interchangeably. Although, Hanadu kits employ 0–32 MHz, which is within the Broadband PLC (BPLC) spectrum, in contrast with the conventional BPLC system, it is being investigated for low-rate in-home control applications, such as smart lighting, sensing, etc. Hanadu is based on Orthogonal Frequency-Division Multiplexing (OFDM), and the tone map is such that the 32-MHz spectrum is divided into 128 sub-carriers. Each sub-carrier occupies a bandwidth of 250 kHz, such that if divided into five bands, approximately half the energy is contained in the middle band. Hence, for each carrier, the centre frequency is:
where
is the lower frequency bound and
is the upper frequency bound.
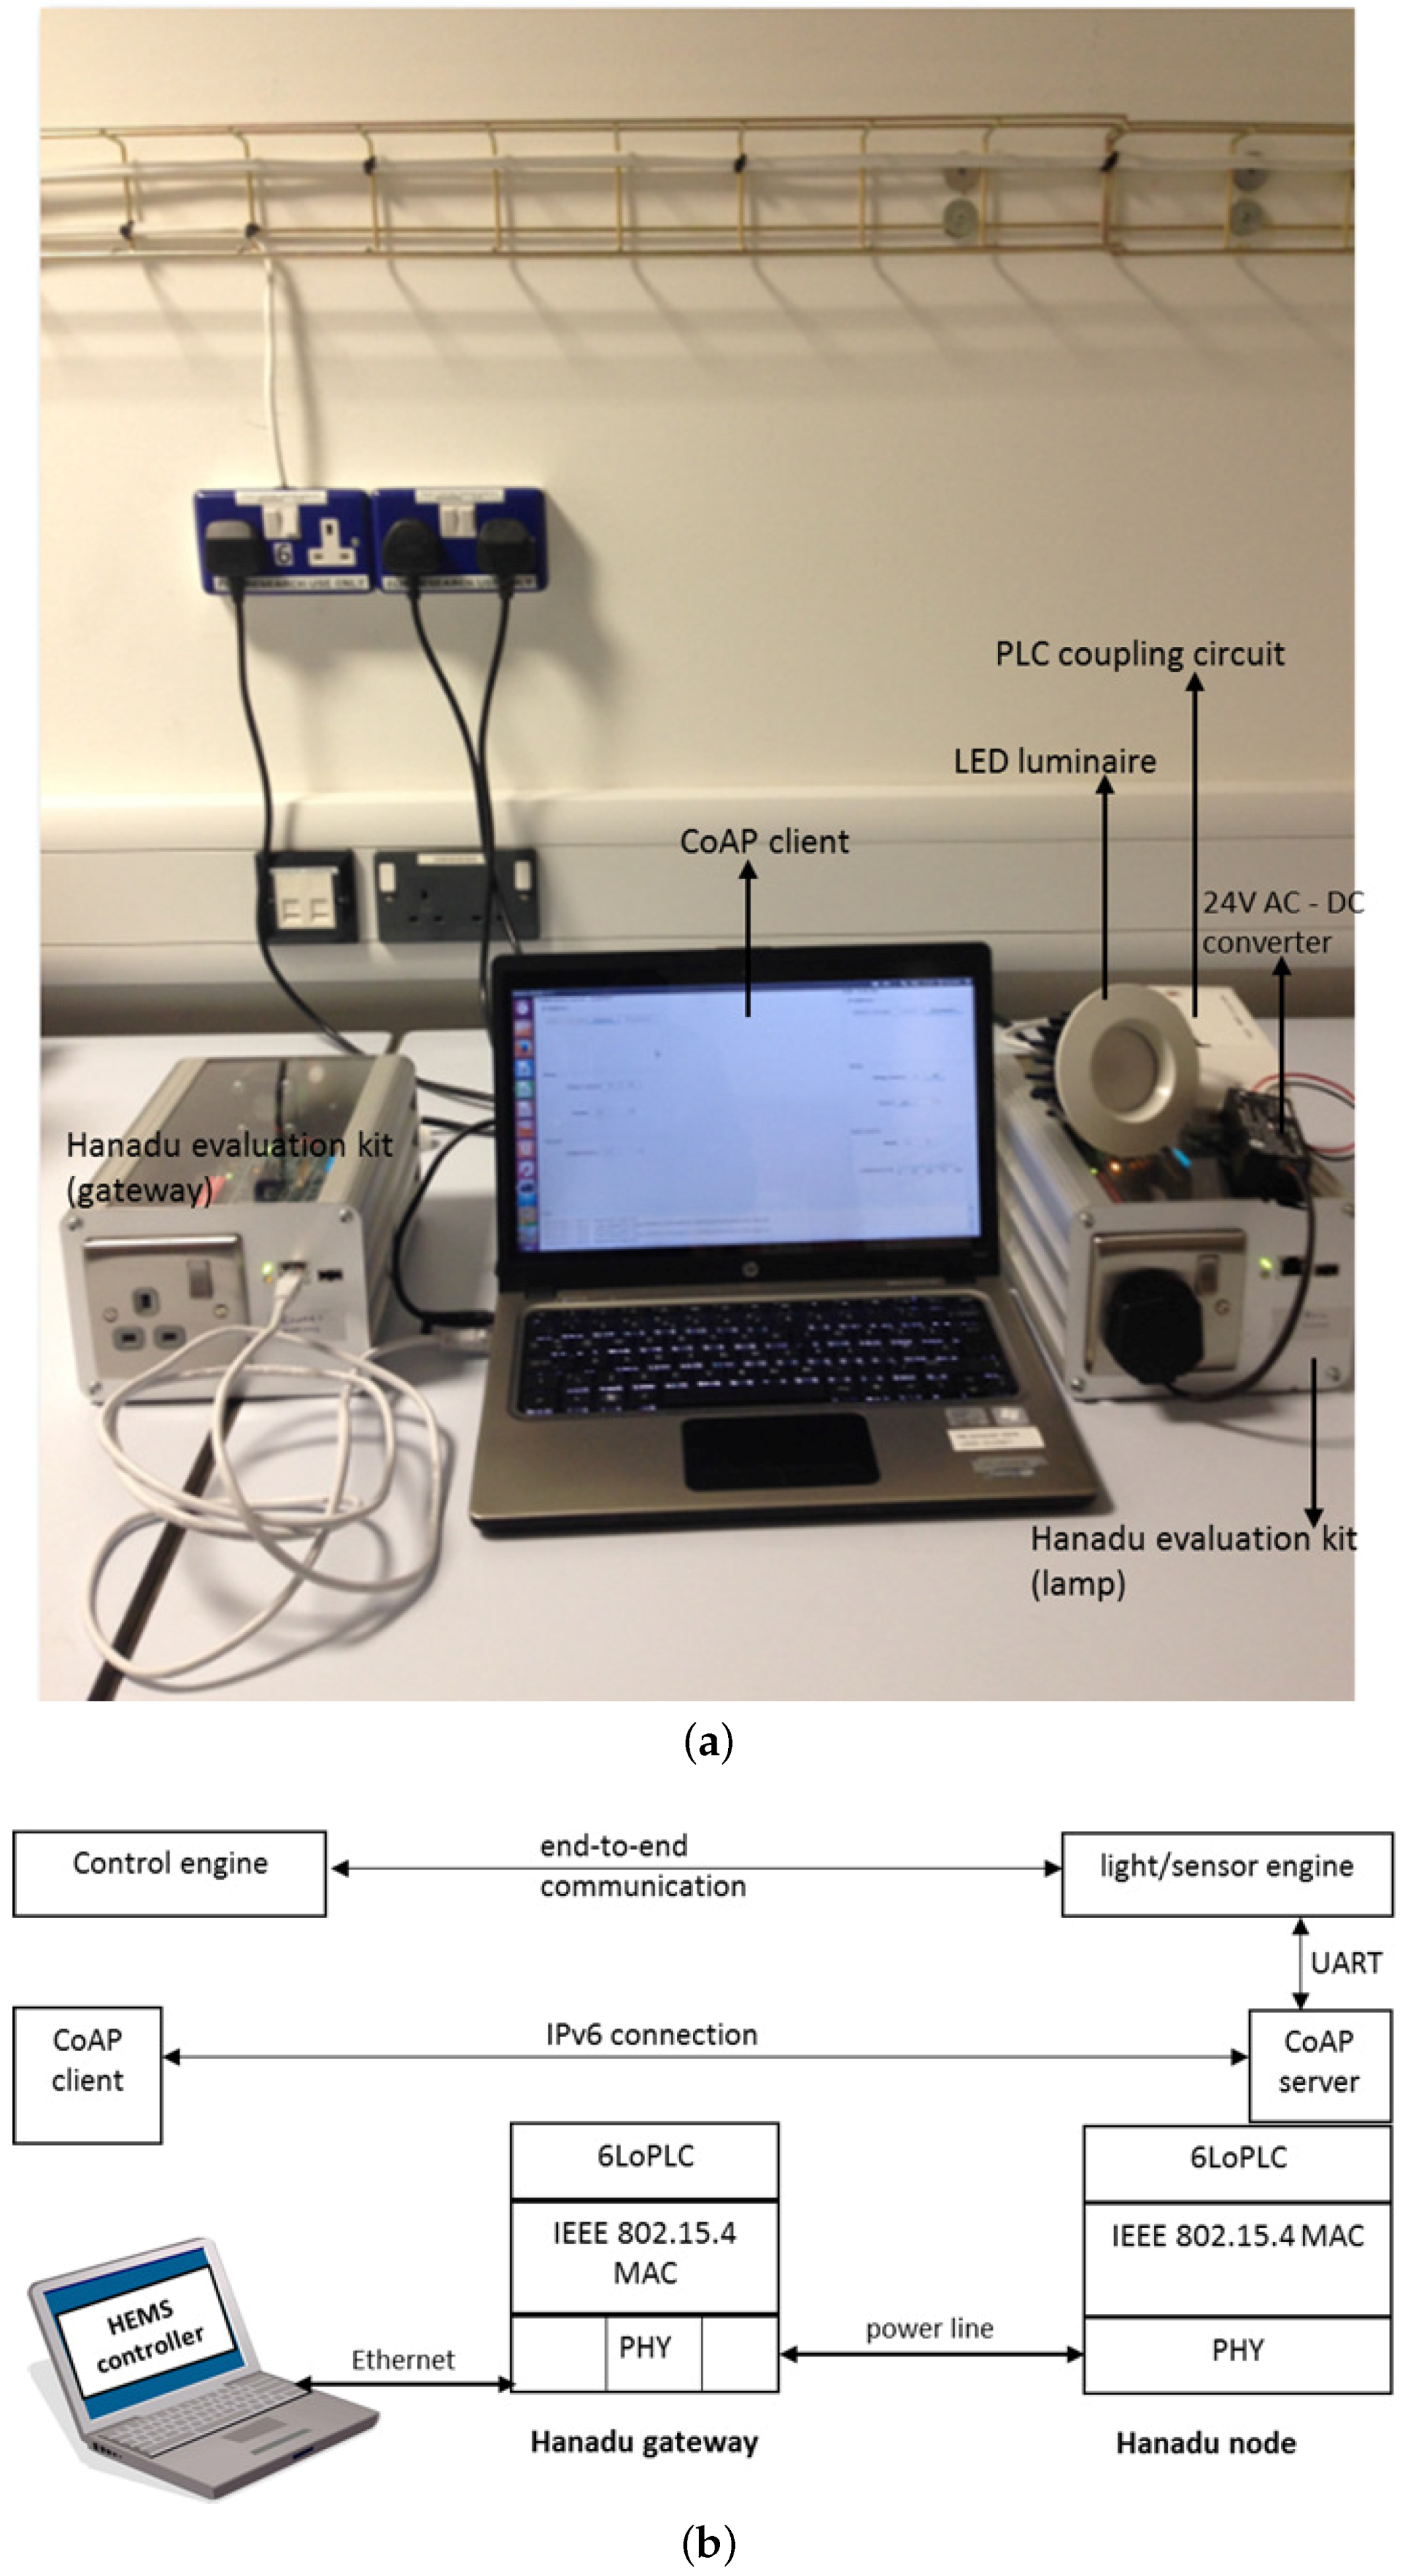
To avoid interference with nearby radio transmissions and reduce inter symbol interference, only 86 channels are utilised, notching out broadcast and amateur radio frequencies (e.g., 28–29.875 MHz). The test bed used for evaluating the 6LoPLC consists of three types of entities: lighting, communication system and application. While the lighting is made of an Light-Emitting Diode (LED) fixture powered by 24 V DC, the Hanadu 6LoPLC units provide the communication system to convey control signals from the HEMS controller to the lamp and response in the opposite direction. In terms of application, the lighting and sensing applications are based on Constrained Application Protocol (CoAP)—published by International Engineering Task Force (IETF) in Request for Comments (RFC) 7252. The architecture is such that the CoAP client is installed on the HEMS controller while the server is installed on the nodes (lamp and sensor). The CoAP client provides the mechanism for sending control commands and monitoring requests. For example, the CoAP client can request from the nodes the energy consumed by the device connected to their attached sockets and can also send the control signal to alter the luminance of the LED lamp over the power line network. In the case of the sensor, the client can request the ambient temperature from the sensor and receive temperature as part of the response. In both cases of the sensor and lamp, the CoAP server communicates with the respective engines through Universal Asynchronous Receiver/Transmitter (UART) commands, as shown in
Figure 1b. Therefore, the role of the CoAP application is to provide an embedded web interface to interactively send control signals and receive measurements from the nodes. A simple setup of the Hanadu 6LoPLC test bench is shown in
Figure 1.
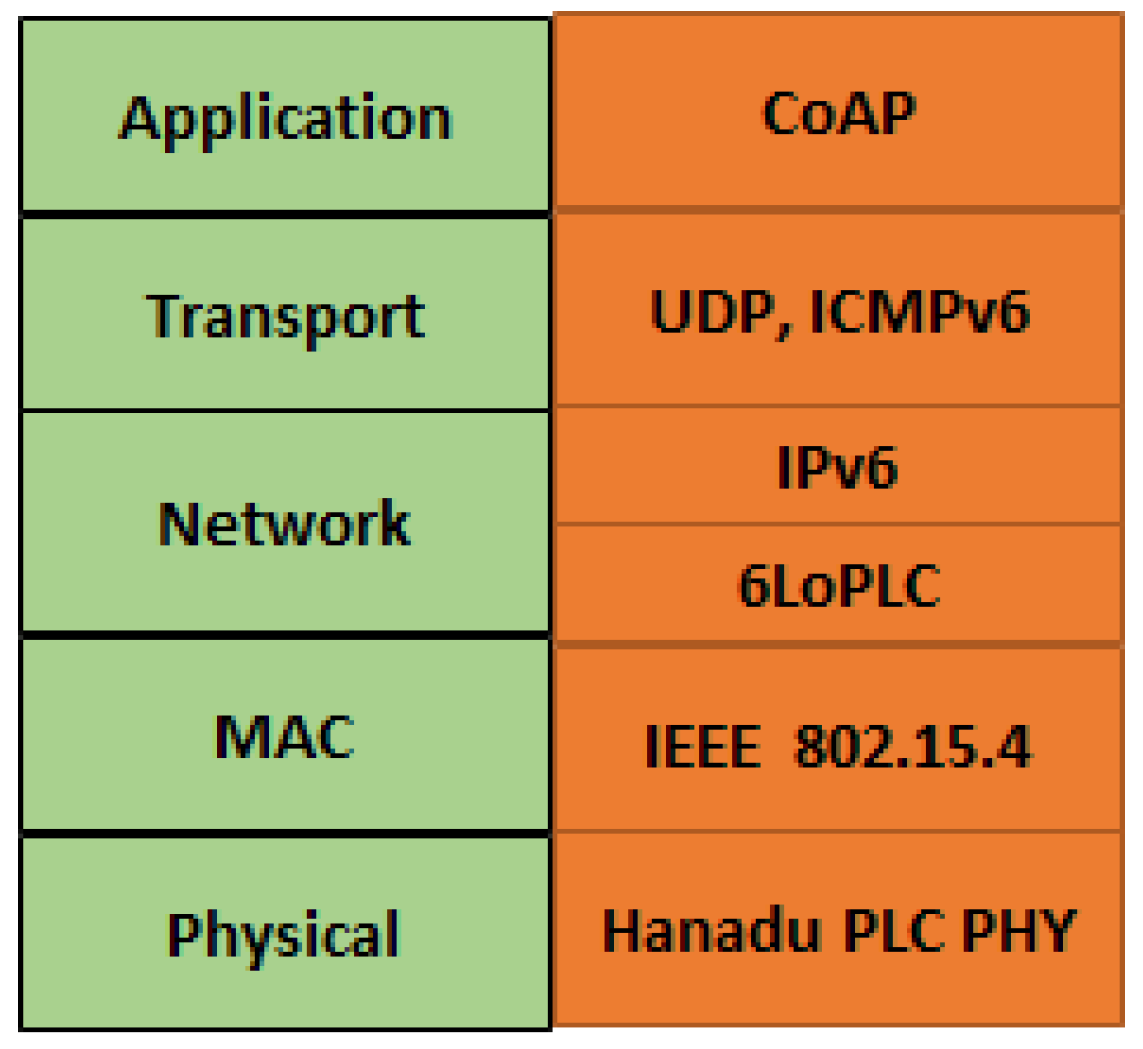
The protocol mapping between Transmission Control Protocol (TCP)/Internet Protocol (IP) suite and the implemented model, which includes 6LoPLC as the adaptation layer in accordance with RFC 2460 [
33], is illustrated in
Figure 2.
As seen in
Figure 2, with reference to LoWPAN (802.15.4), Hanadu retains the 802.15.4 Media Access Control (MAC) sublayer and replaces the PHY with the 2–30-MHz power line PHY, thus transforming it into a PLC system.
The CoAP was developed by IETF for resource-constrained nodes and networks (RFC 7251), such as the sensor and lamp with a low-rate discussed in this paper. Due to the high communication overhead associated with Hypertext Transfer Protocol (HTTP), CoAP was developed to offer web services similar to HTTP, but with lower overhead by employing an asynchronous message exchange that relies on a data-oriented transport protocol. The Hanadu evaluation kits and simulations are based on User Datagram Protocol (UDP), since CoAP natively supports it. In terms of use-cases, CoAP was intended for smart energy, building automation and control applications, which are in line with this study.
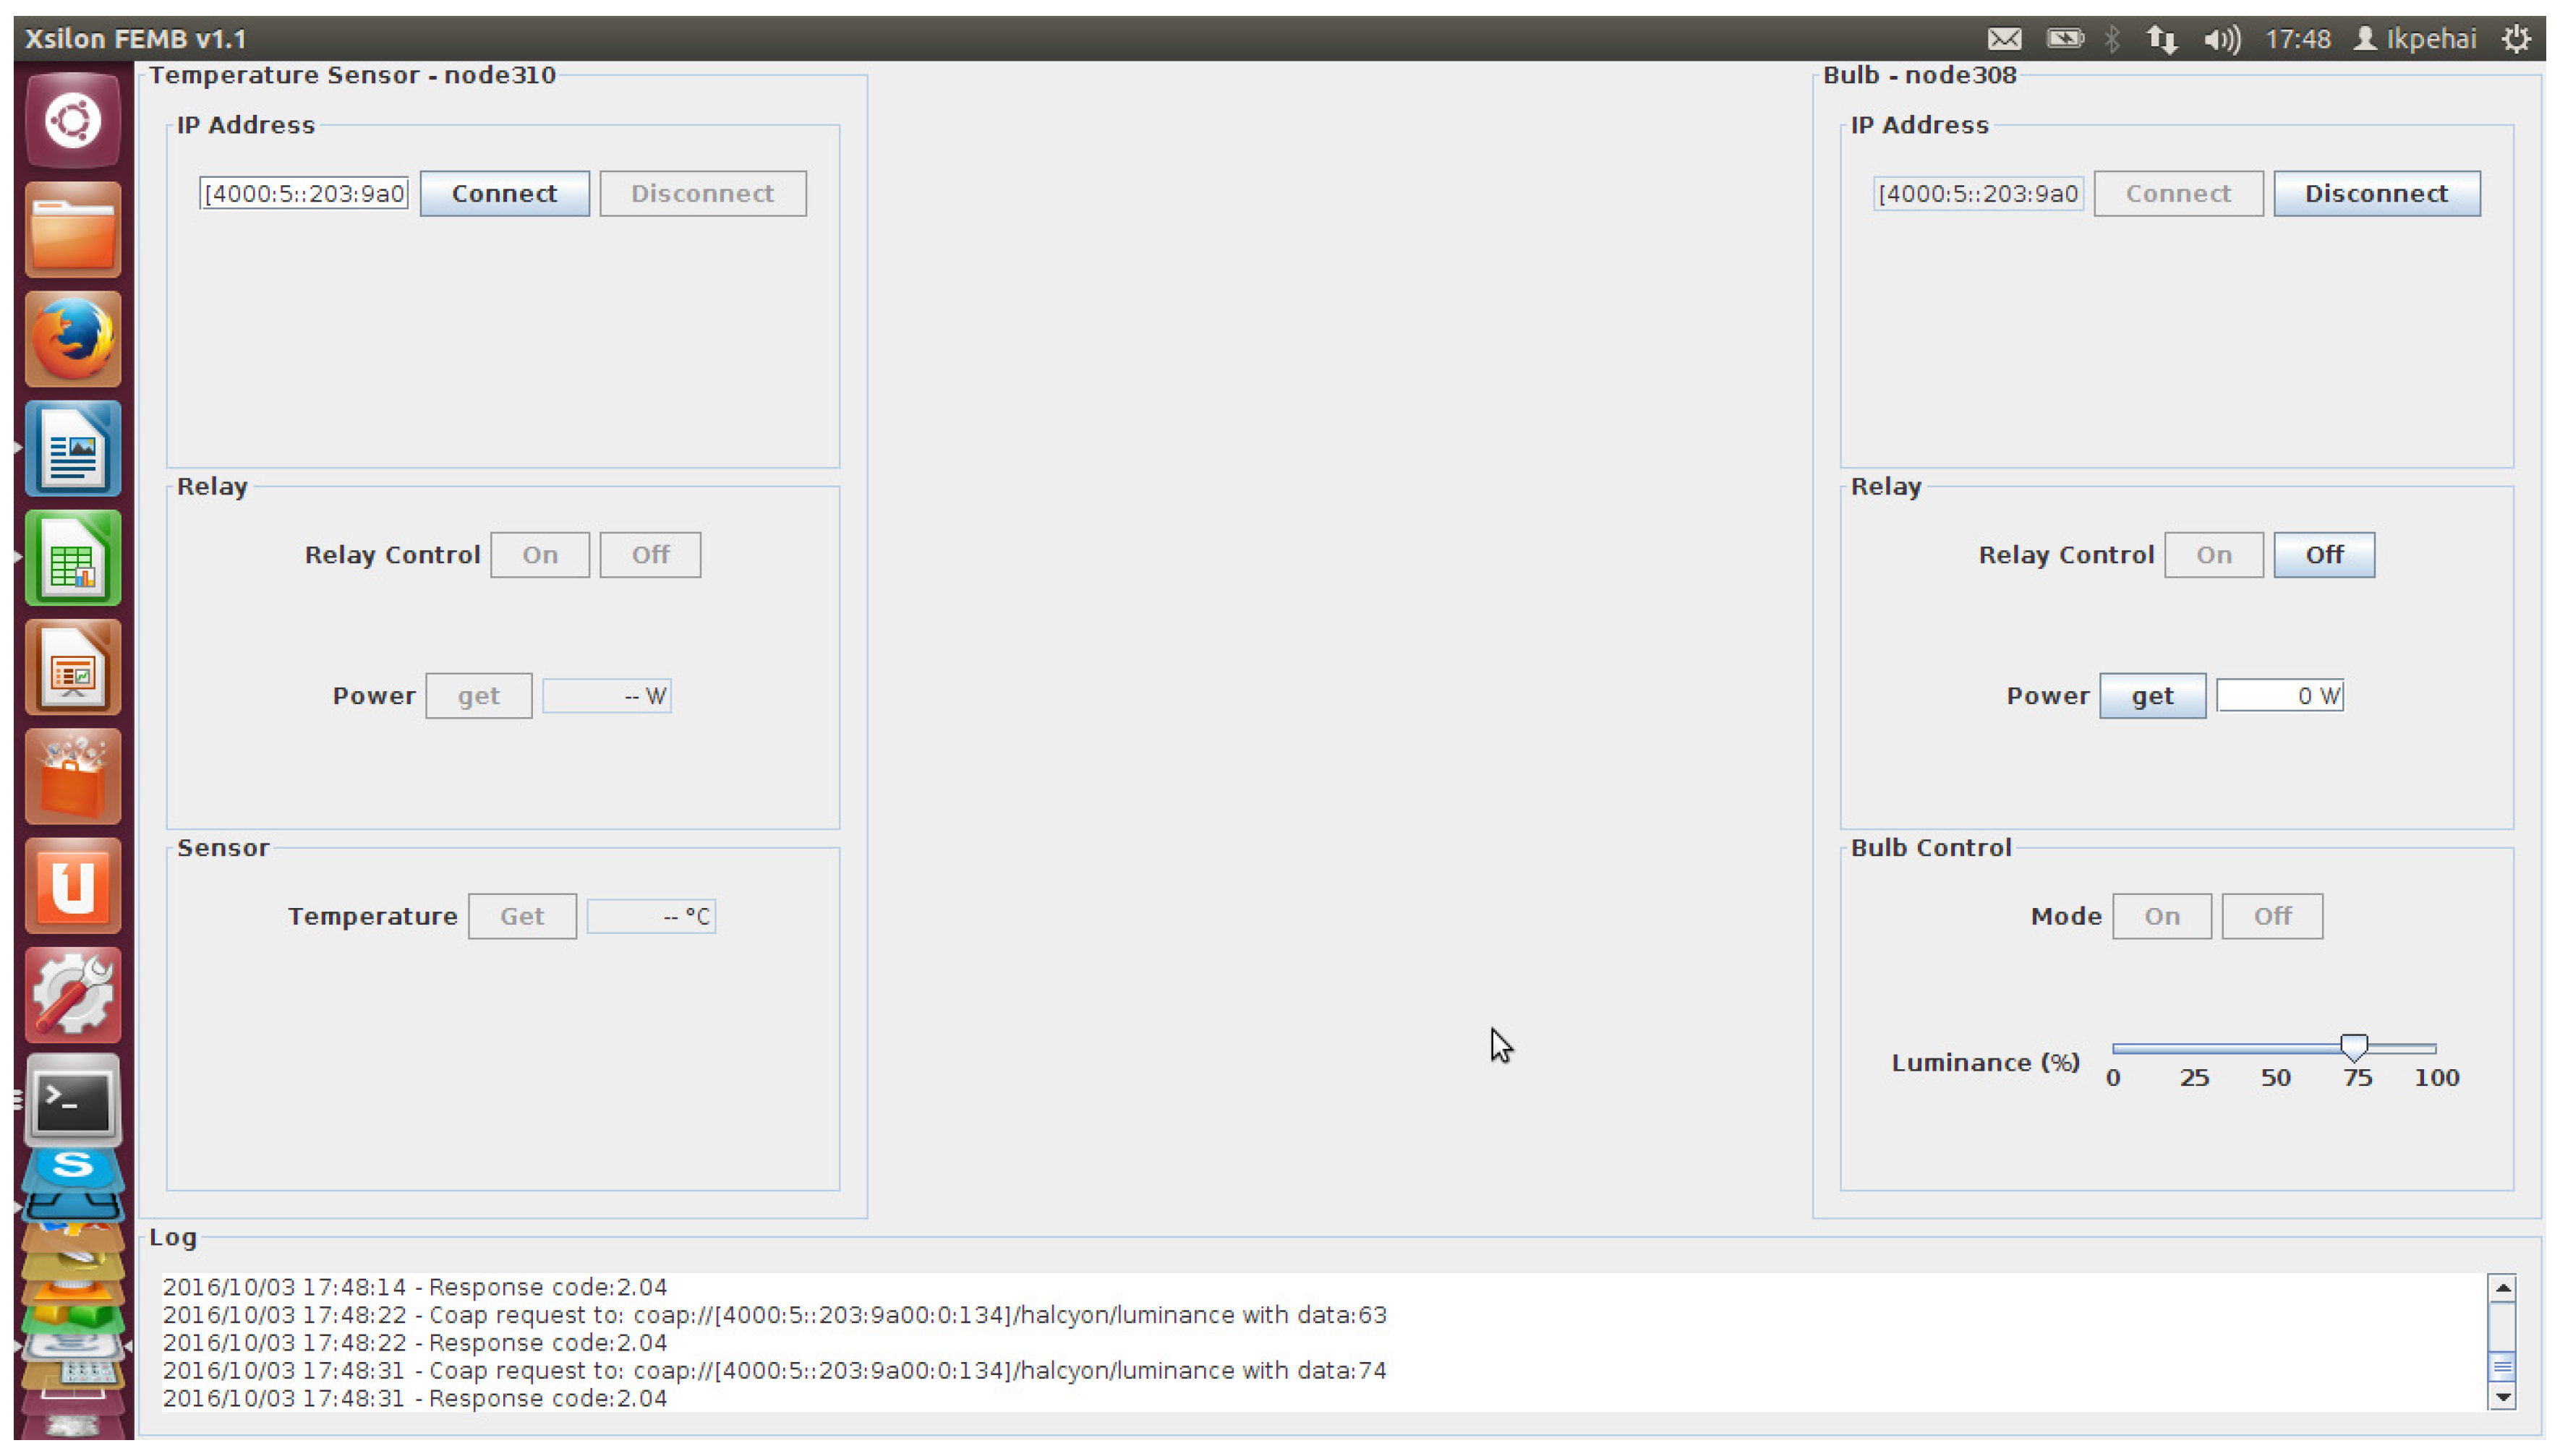
As seen in
Figure 3, the system log shows the time-stamped message about communication activities between the HEMS controller and the lamp. For example, the log shows that a control command is used to increase the luminance of the lamp to 74%; such low-level information is useful for system maintenance and support.
4. Simulation Setup
In this work, three units of evaluation hardware are available, which limits the number of applications and network configurations that can be studied. The main objective of the simulation is therefore to provide a valid platform for examining diverse scenarios in terms of channel, application and network.
4.1. Model Description
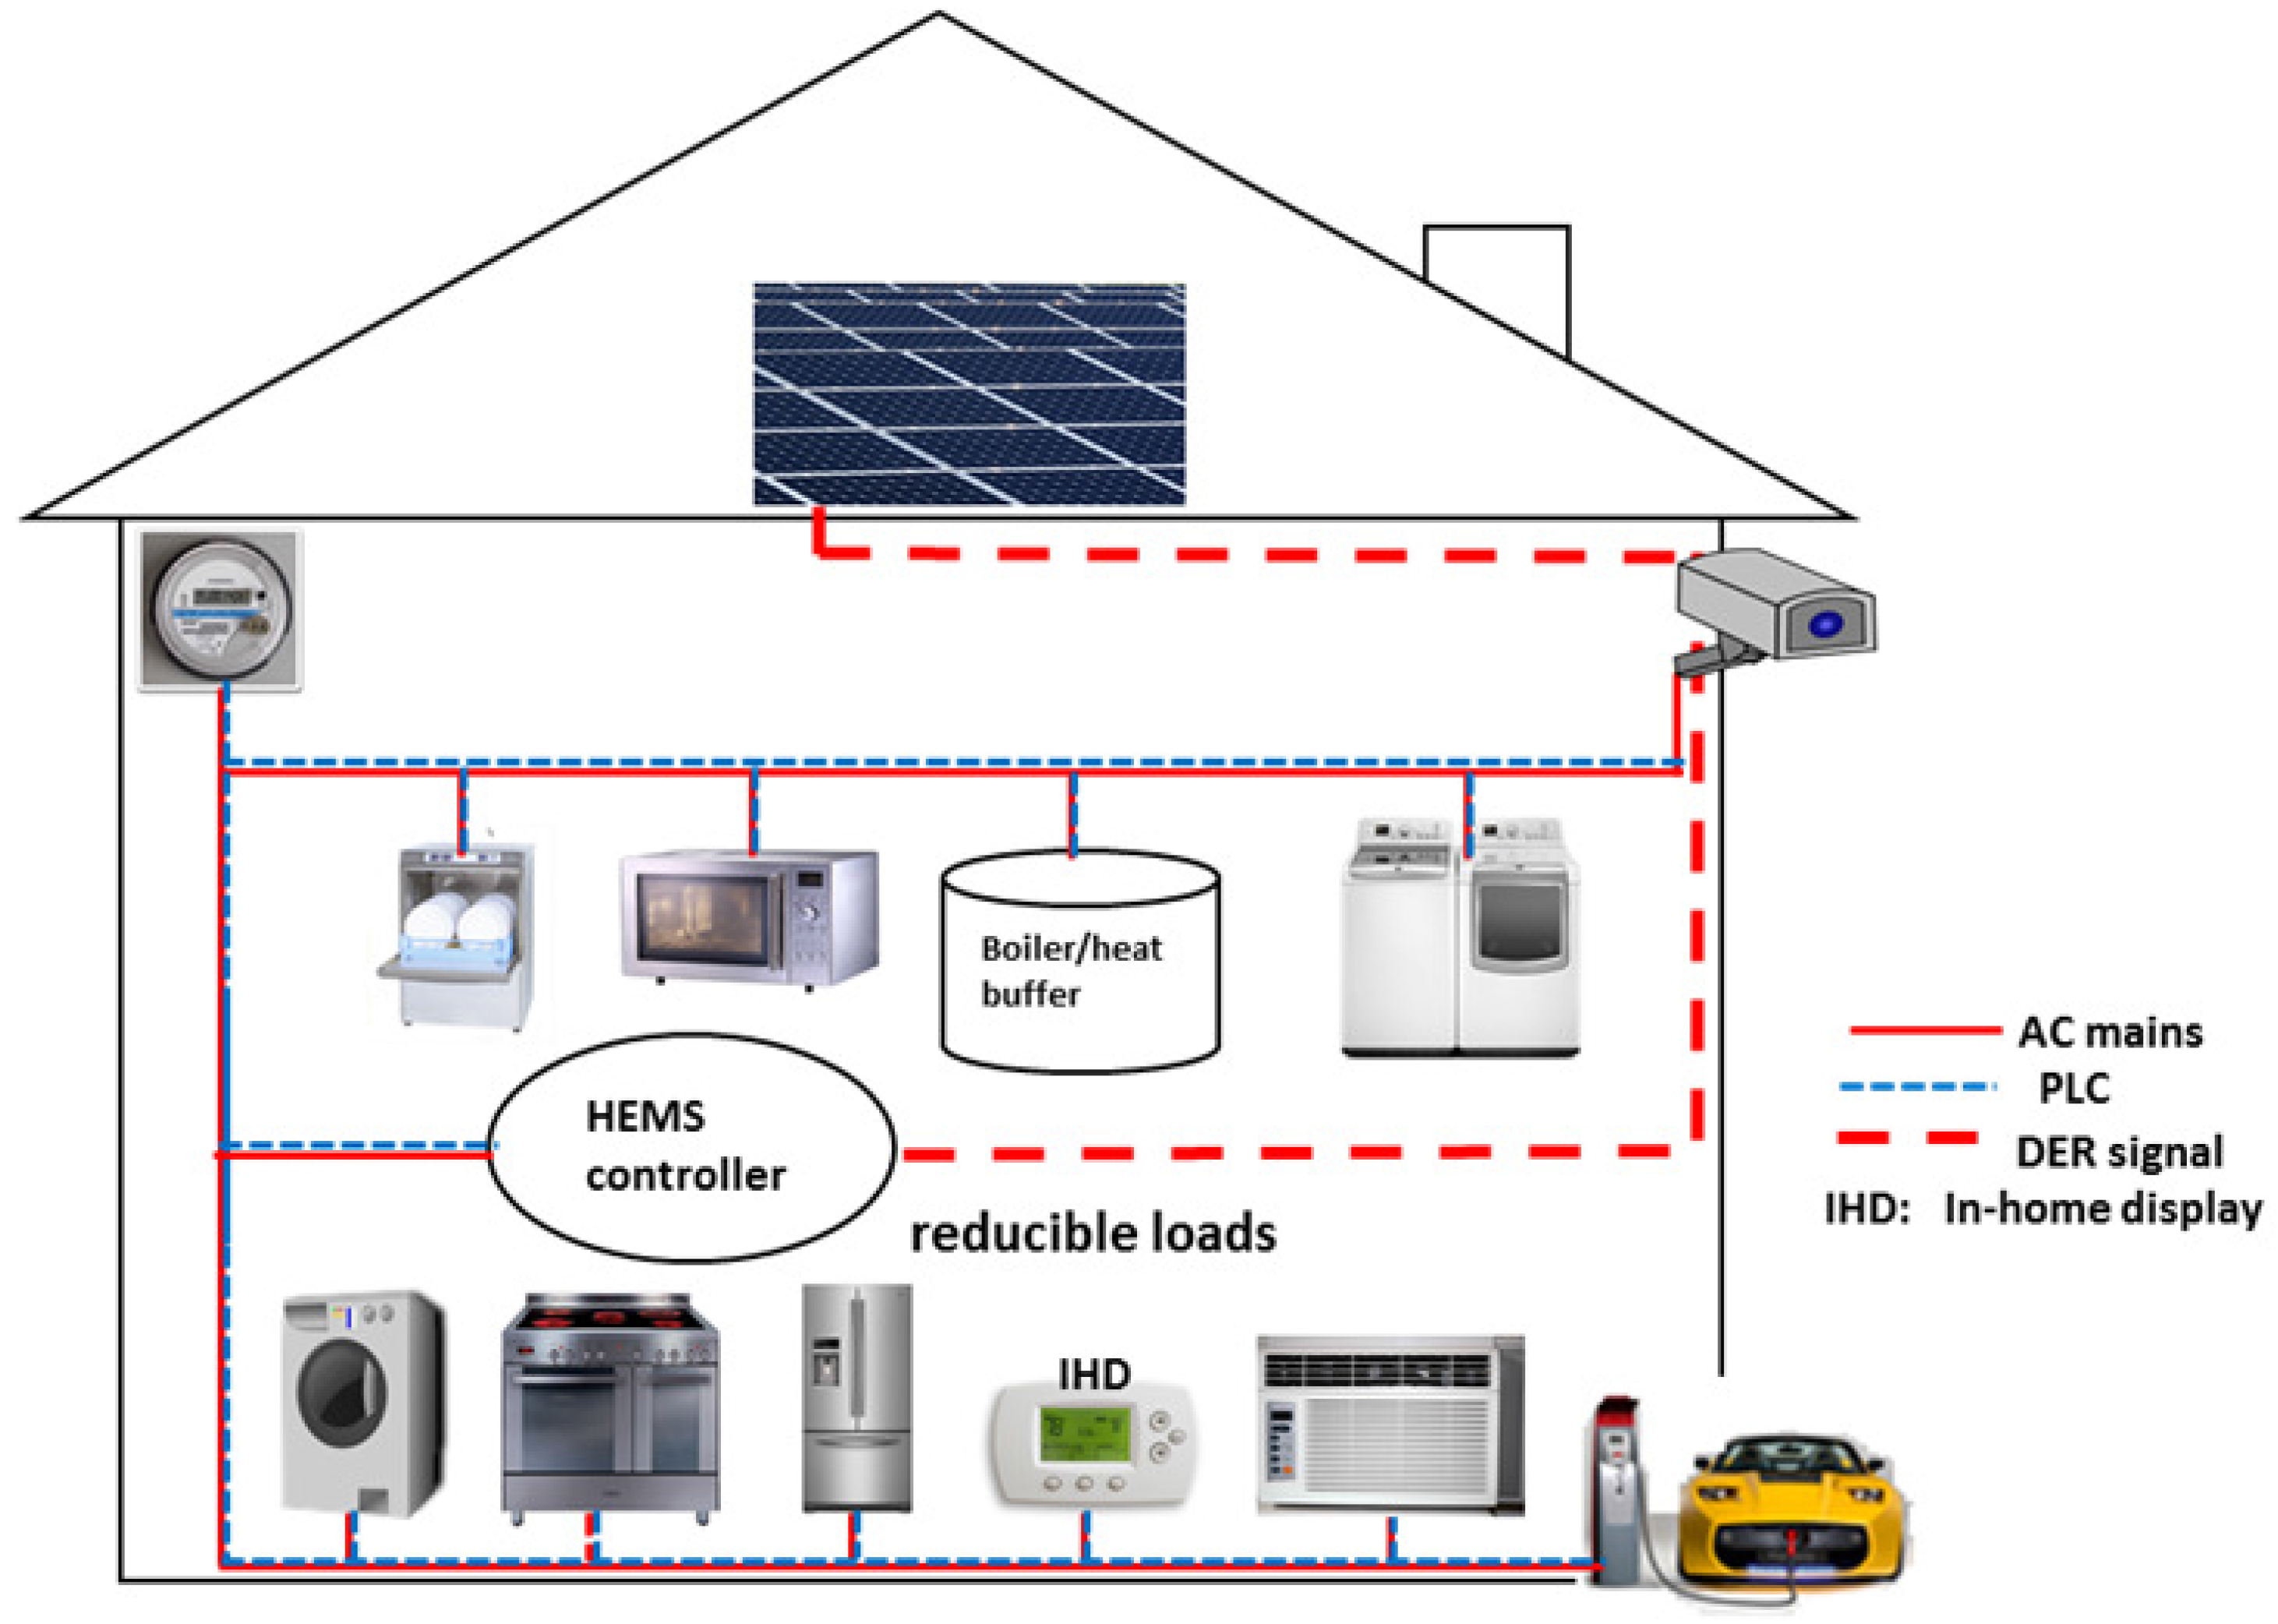
This section describes the HEMS models employed in this paper as illustrated in
Figure 4. The figure shows a connected home in which the HEMS controller monitors and controls the local loads over the power lines. According to IETF RFC 2460 (pp. 23–24), the IPv6 specification requires that every link provides an Maximum Transmission Unit (MTU) of 1280 bytes or more. However, in the event that a link cannot convey a full IPv6 packet in a single piece, fragmentation and reassembly mechanisms must be provided at a layer below IPv6.
A simulation approach similar to [
34] is employed, but with some modifications. Rather than MATLAB and OMNeT++ utilised in [
34], we combine MATLAB (R2014a) with NS-3 (Version 21). NS-3 is a discrete-event network simulator packaged as C++ libraries for public use. As the mainstream NS-3 is devoid of the PLC module, we adopt the PLC module provided in [
11] as described in
Section 1. This power line channel model is based on TLT. Although the provided PLC module supports BPLC and NPLC, the BPLC spectrum is employed in this study. The power line is a time-, frequency- and location-variant channel [
35]. Accordingly, impedance can be fixed, time dependent and/or frequency dependent. For simplicity, we employ fixed line impedance for the duration of monitoring and control events.
IP is generally attractive in service-oriented networks such as HEMS because: (i) it aids the integration of existing appliances; (ii) it renders the overlaying network non-disruptive during architecture change; (iii) it is agnostic of the low layers’ protocols; this helps to seamlessly integrate a variety of link layer technologies, and finally, it eliminates the use of the application gateway to translate across protocols, which promotes convergence and reduces the cost of installation.
With IPv6 and User Datagram Protocol (UDP) as the network and transport layer protocols, respectively, the communication between the gateway and nodes is based on the client/server architecture, such that the CoAP client is installed on the HEMS controller and the server on the node (sensor or lamp). For example, to obtain the temperature, the HEMS controller sends a CoAP request to the CoAP server embedded in the sensor. The CoAP server then encodes the measured temperature into a CoAP message and returns it as the response to the controller.
The test bed employed in this work was set up in a controlled environment such that the temperature polling and control signalling are triggered manually. These are necessary to allow deep visibility into system behaviour. In reality, temperature sensing would be automated based on a predefined schedule, while control would be on-demand. Although multicasting will be more beneficial in some HEMS applications (such as temperature sensing) such that a CoAP server monitors its attached sensor and sends out observations to all connected CoAP clients over IPv6 multicast, as group communication for CoAP (RFC 7390) is still experimental and has not attained RFC status, all communications in the simulation and test bed are based on unicast.
With NS-3, upper layer protocols (IP, transport, application) can run on top of the PHY/MAC provided in the PLC module to investigate complete PLC networks. However, since the devices under evaluation are intended for low-rate application, an adaptation layer is included in the system model. As with the Hanadu kits, the adaptation layer is agnostic of the underlying PHY and MAC layers. It is designed to support any standard lower layer protocols. The 6LoWPAN was developed for constrained wireless networks to support an MTU size of 127 bytes at the MAC layer; hence, a complete IPv6 packet of 1280 bytes cannot fit into a single LoWPAN frame. In order to meet the IPv6 minimum MTU requirement and facilitate two-way communication with conventional IPv6-capable networks, IETF developed RFC 4944 [
36] for transmission of IPv6 packets over IEEE 802.15.4 networks. The standard recommends an adaptation layer below the network layer for fragmentation and reassembly of frames. The realisation that IEEE 802.15.4 networks (LoWPANs) share certain PHY/MAC characteristics with PLC renders them attractive to be adapted for low-power, low-rate communication over power lines.
At PHY, OFDM with Differential Binary Phase Shift Keying (DBPSK) is employed. As this work is experimental in nature, first, we emulate the HEMS in NS-3 and investigate the network performance for the given values of impulsive and background noise. The Signal to Noise Ratio (SNR) obtained is then fed into MATLAB to evaluate the Bit Error Rate (BER) performance as a function of SNR.
4.2. System Parametrisation and Packet Analysis
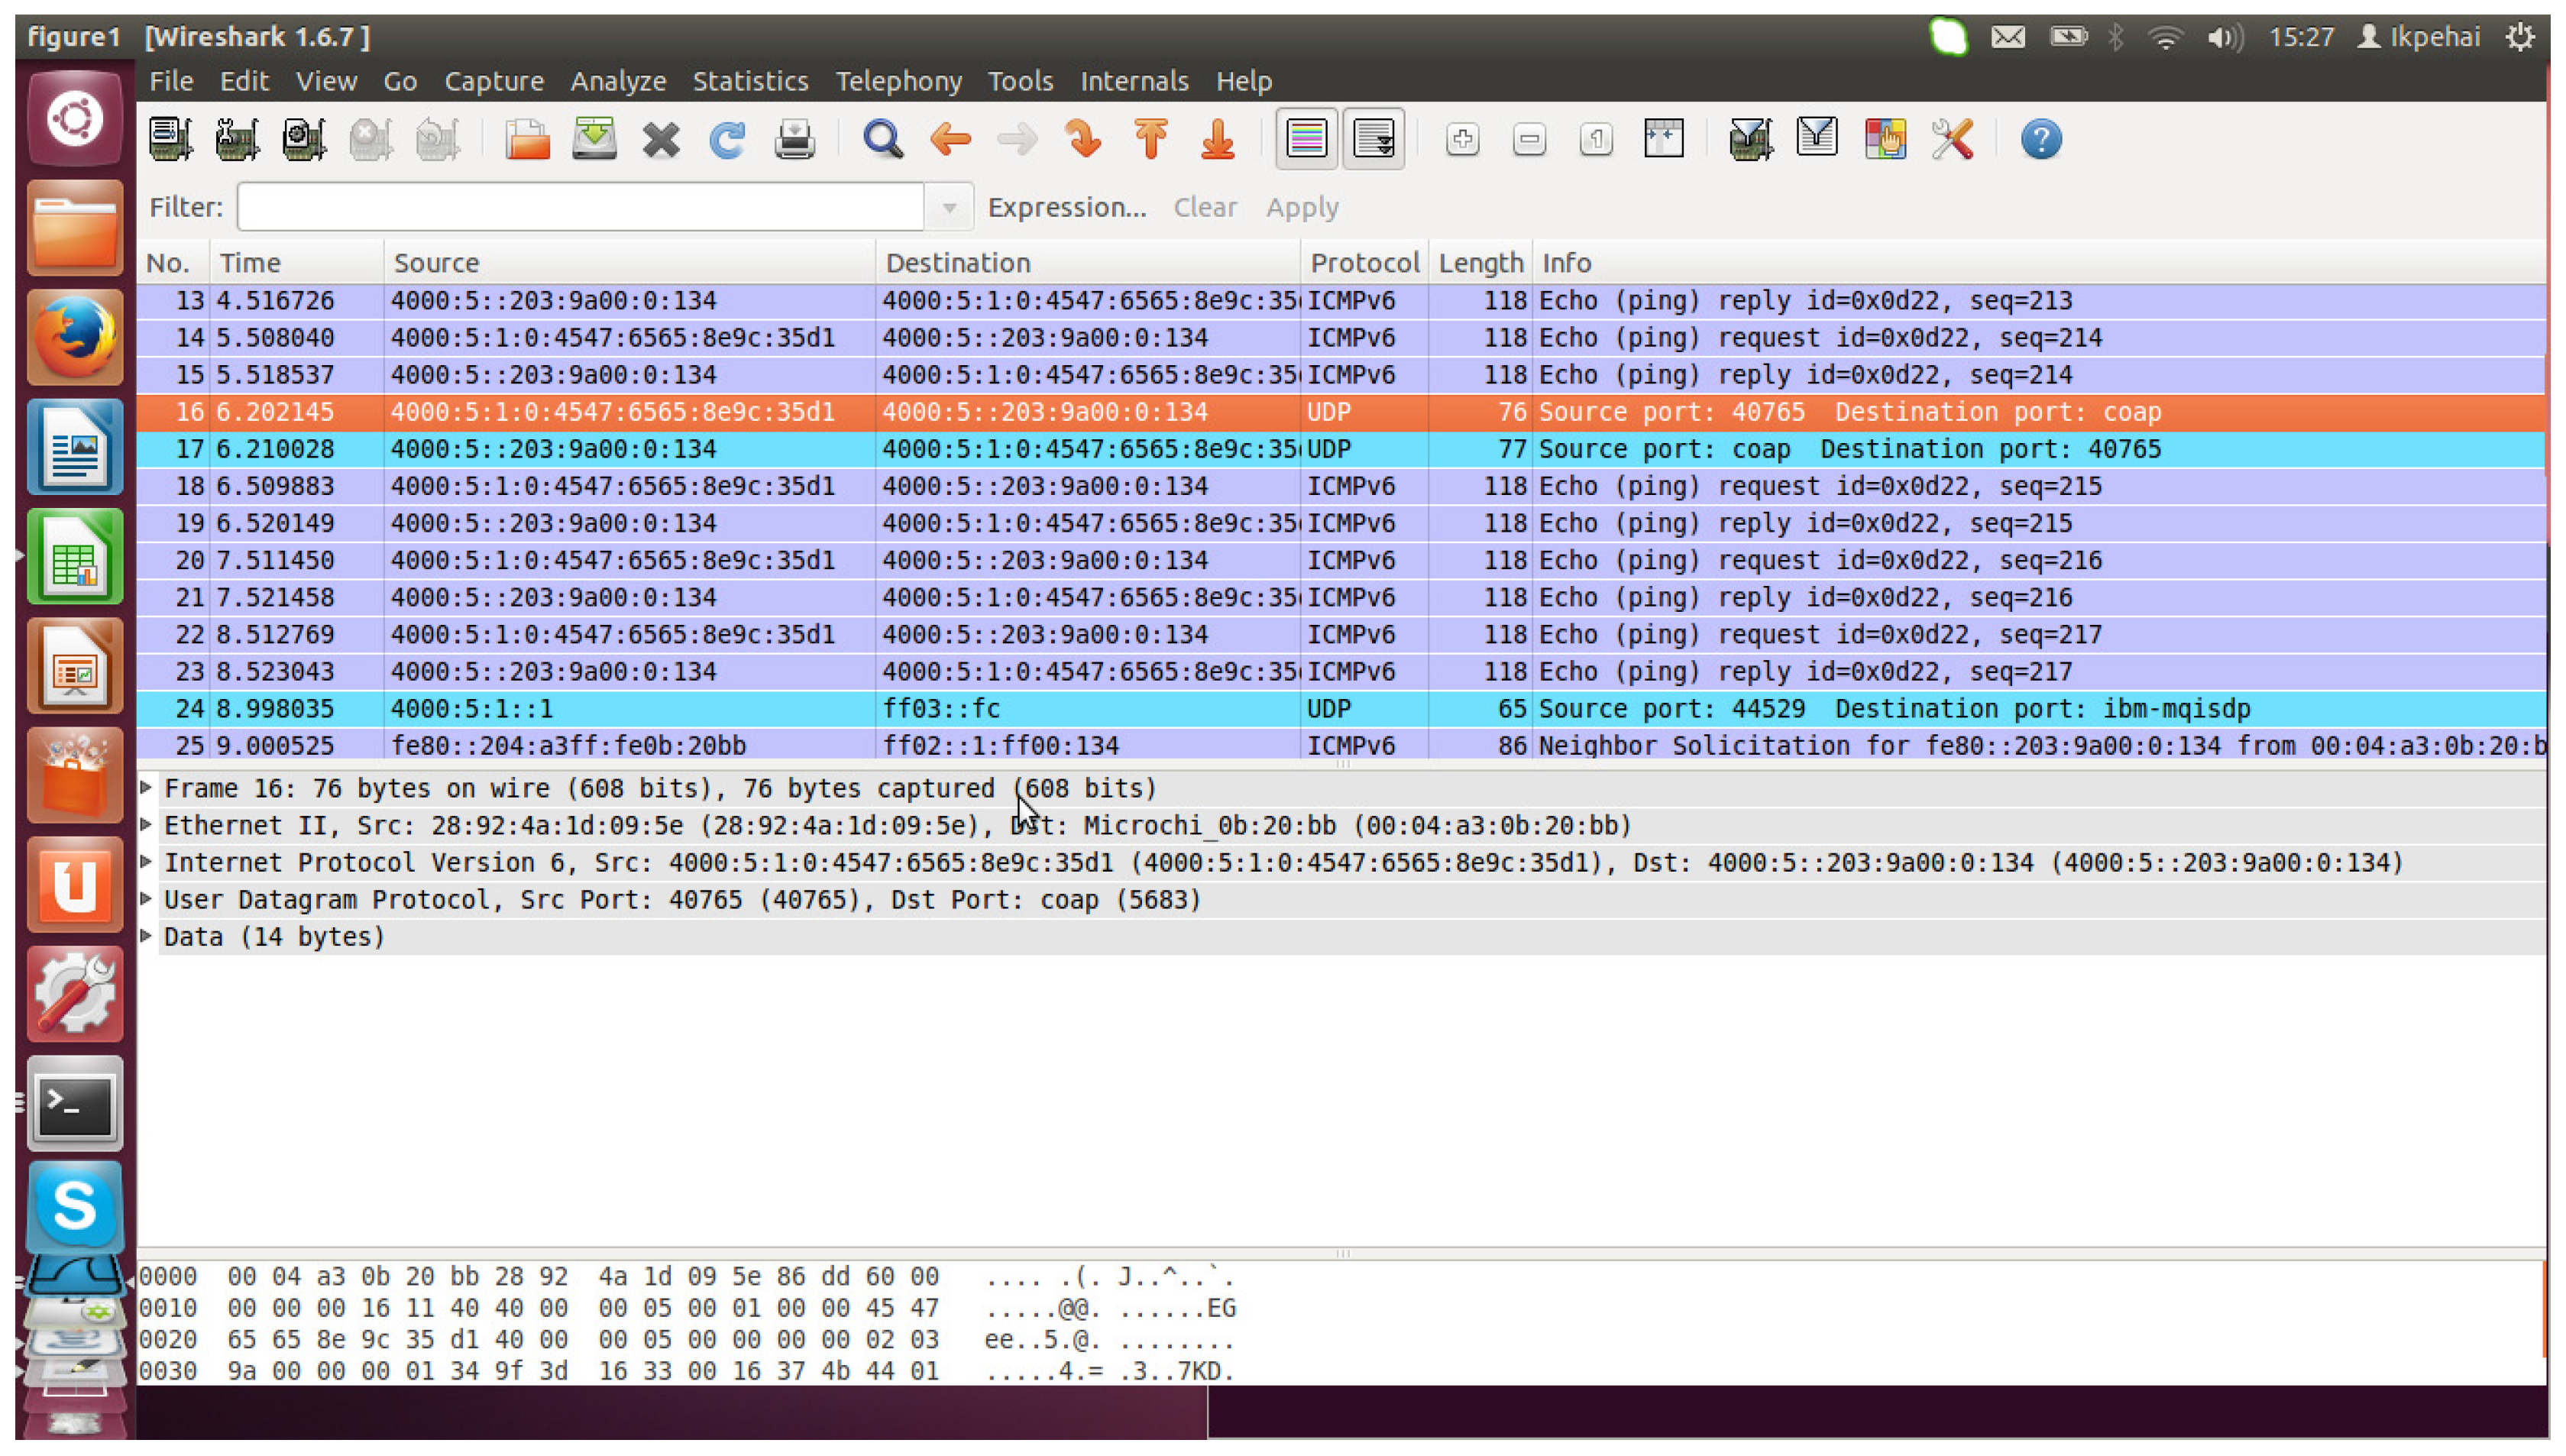
The idea of this section is to extract system parameters from the test bench and apply them to simulate HEMS applications in diverse scenarios. One Hanadu gateway (designated as the HEMS controller) and two nodes are available for this evaluation. We begin the evaluation by setting up a power line network between the controller and one of the nodes designated as the LED-lamp. In contrast with filament-based lights, the LED-lamp fixture used in this work is a full-fledged network node with a valid network properties, such as the IPv6 address; the same applies to the sensor. For experimental purposes, the lamp is deployed as the light source whose intensity is controlled over the power line network. To view the bi-directional communication, we installed Wireshark (an open source packet sniffer) on a Linux laptop and connected it to the Ethernet port of the HEMS controller to monitor the end-to-end communication. A sample of the packet analysis is presented in
Figure 5.
Figure 5 was obtained by sending a command from the controller to change the intensity of the light using the IPv6 address of the HEMS controller and the lamp as the message source and destination, respectively. The packet analysis in
Figure 5 reveals some important characteristics of the control messages and acknowledgement exchanged between the controller and the lamp. For example, based on this traffic analysis in
Figure 5, the size of control messages, the transport layer protocol, the network layer protocol, the application layer protocol and the UDP port number used during the communication were obtained. The complete parameters outlined in
Table 1 are combined with the power line channel specification to simulate the performance of HEMS application in NS-3.
It should be noted that the application data sizes in
Table 1 are payloads only. In addition to background coloured noise, impulsive noise imposes performance constraints on PLC systems. Generally, impulsive noise is generated by the operation of power electronic devices and transient switching events. For example, SCR, switching mode power supplies (in light dimmers) and DC-DC converters are known sources of impulse noise. Since diverse types of appliances are typically found in homes, the effect of impulsive noise on HEMS system is also of interest in this work.
To capture these realities, two random number generators (rngs) in NS-3 are employed to generate a random value within 1–10. Thus, in each instantiation, the first rng creates a value within 1–10 s for the impulsive noise interval, and the second rng generates values within 1–10 ms for pulse duration. Impulsive noise power of 9.91 dBm is employed as this was the peak value observed in the laboratory. Using these values, an instance of impulsive noise characterised by inter-arrival time and durations of 1–10 s and 1–10 ms, respectively, is then created to interfere with the data signal. To ensure that the results of the same scenario are consistent and reproducible, a fixed seed is used in the rng in each simulation. This is done by calling ns3::RngSeedManager::SetSeed(). The results of the simulations are presented and discussed in the next section.
5. Results and Discussion
In this section, we present and discuss the simulation results of the system under consideration. Using the parameters in
Table 1, as well as adopting 6LoPLC, extensive simulations were conducted to assess the performance of the basic HEMS applications (monitoring of temperature and lamp control) over the power line. The idea here is to use the model developed, to assess various HEMS scenarios and use-cases that cannot be easily investigated with the three units of Hanadu kits available.
5.1. Communication Delays
In order to evaluate the system performance, it is necessary to first validate the developed network model upon which subsequent investigations will be based. As with other communication networks, delay is a basic indicator of the network performance. The two types of delay considered here are illustrated in
Figure 6.
This schematic illustrates the end-to-end delay between the Hanadu gateway and the node (sensor or lamp). In general, the latency is given by:
One-way latency denotes the time taken to send a signal from the controller to a node or vice versa while the Return Trip Time (RTT) refers to the time taken to deliver the signal and receive the acknowledgement or response from the node. As seen from
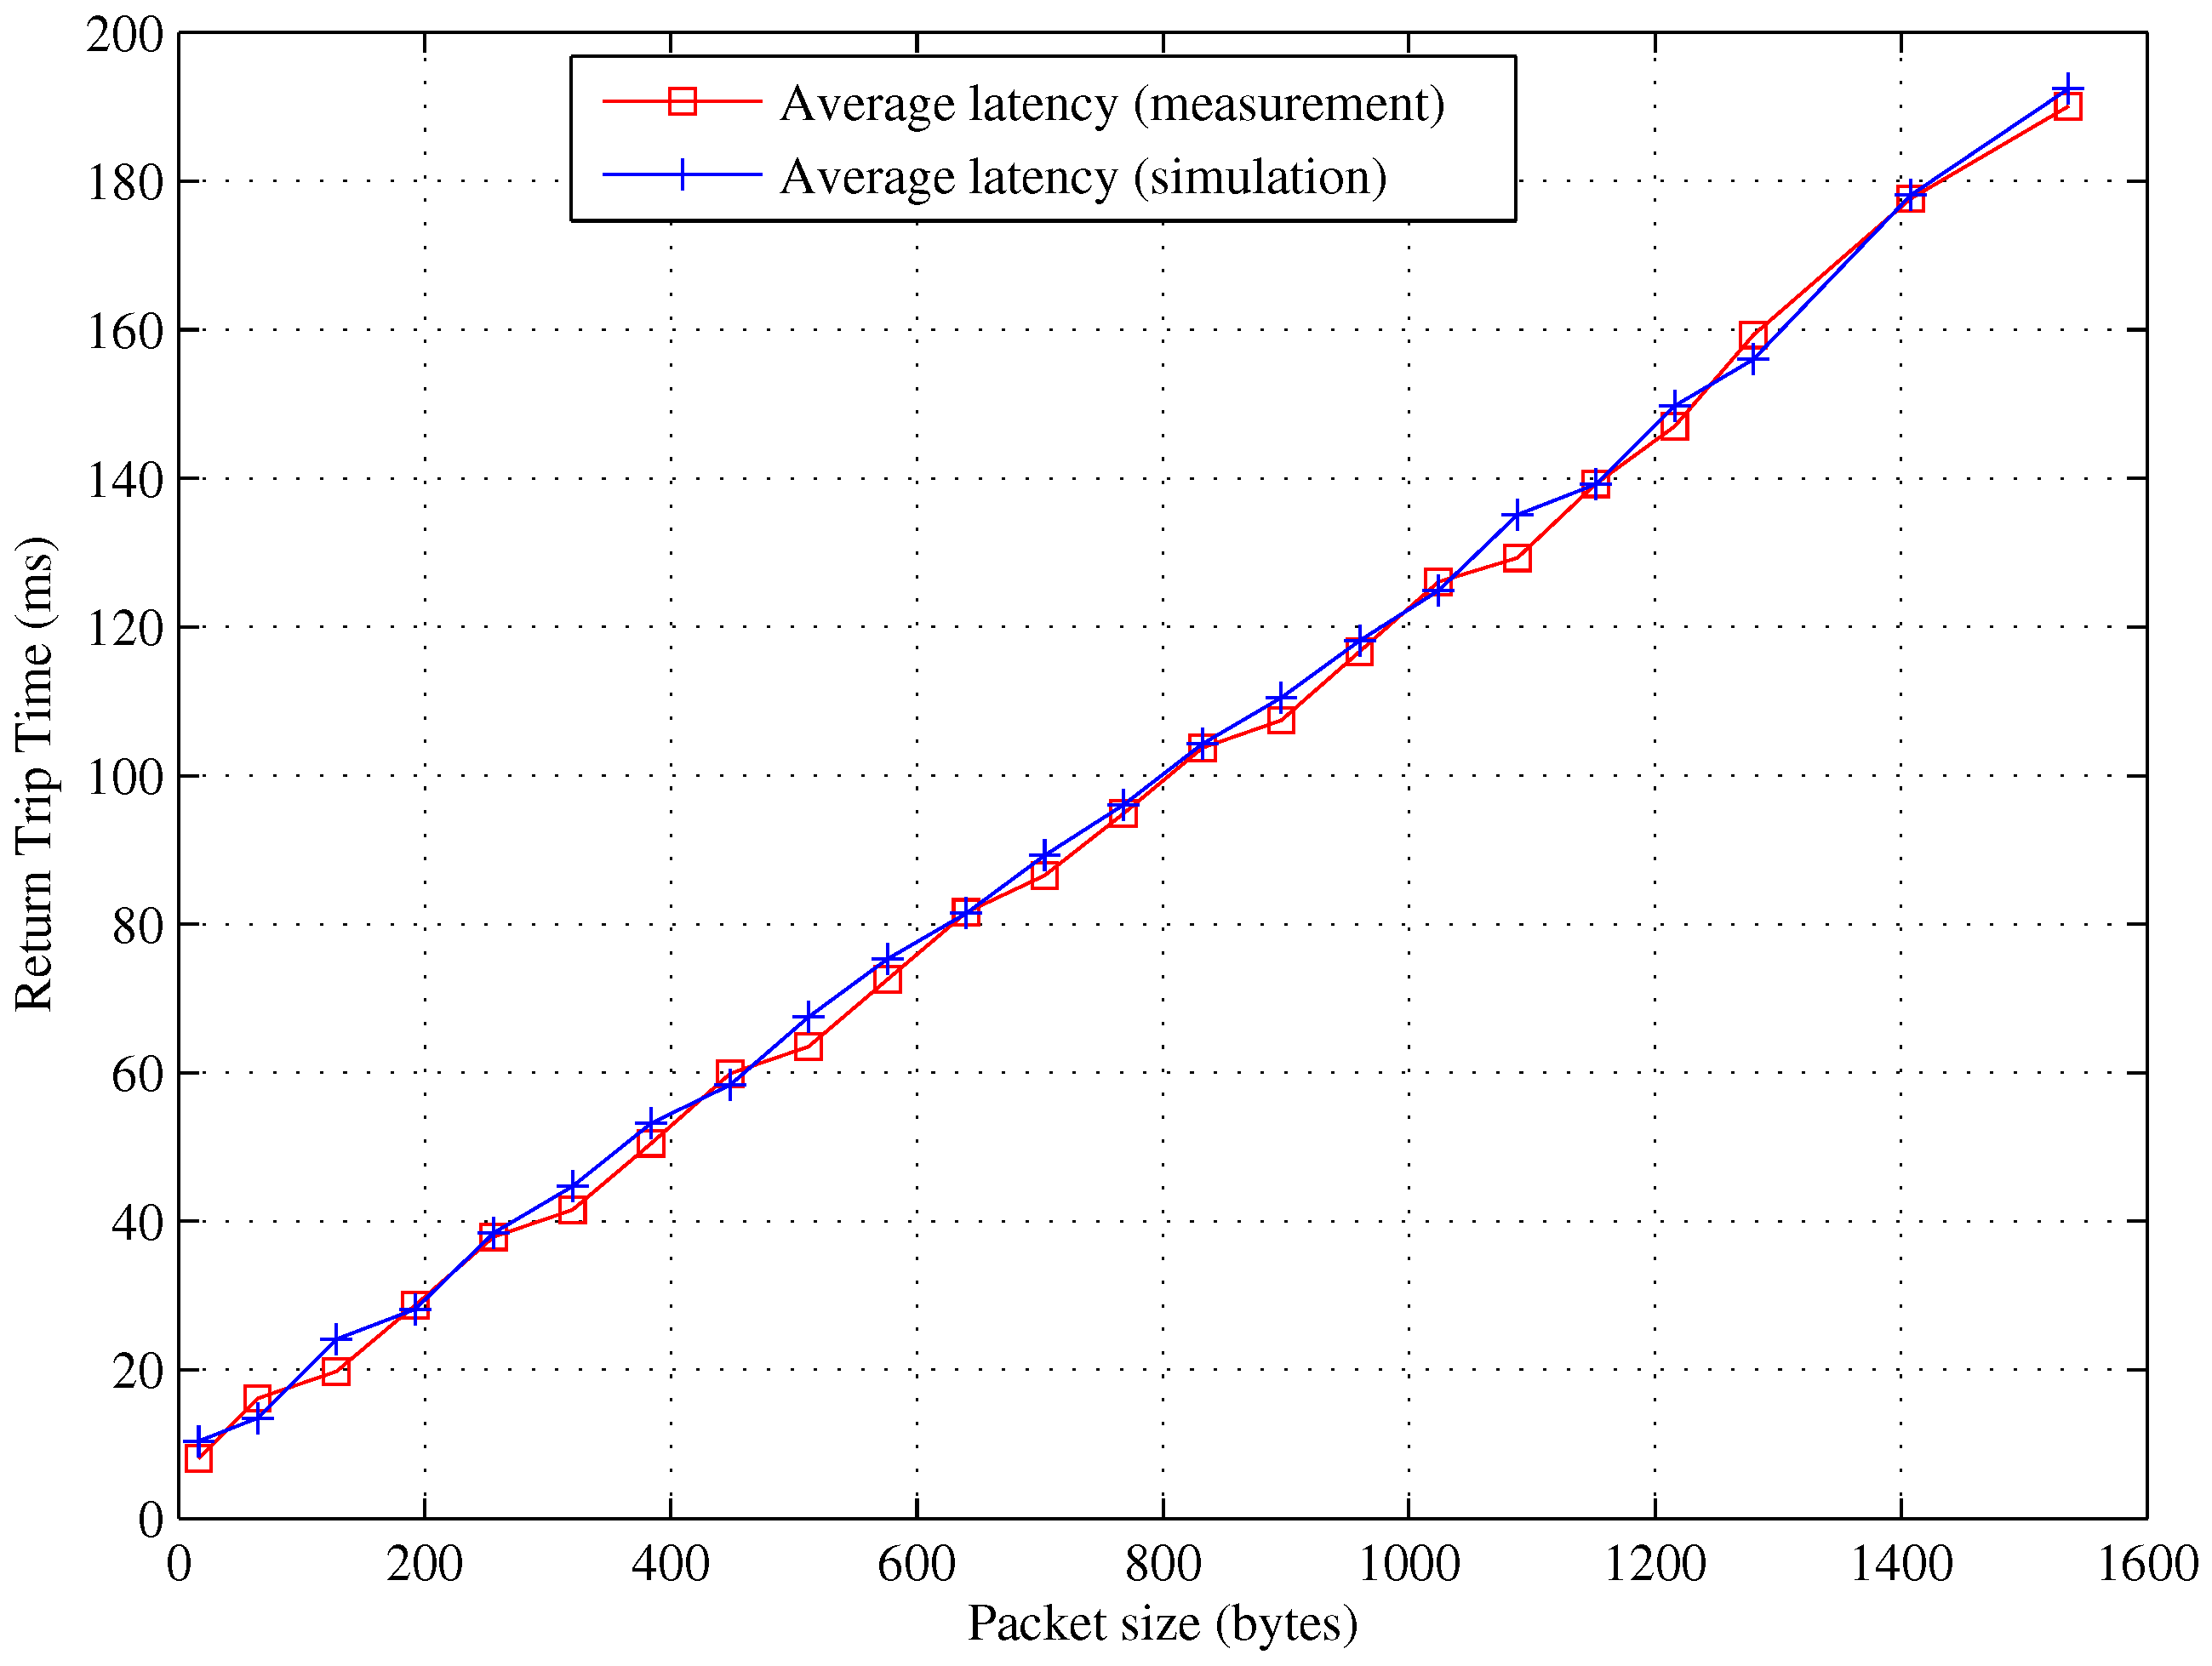
Figure 6, the network layer connection is established at the start of each session following which monitoring/control messages are exchanged. One key benefit of the simulation environment used in this work is that it provides a platform to investigate communication delay in considerably different application scenarios. Since the controller, sensor and lamp are already encoded with CoAP messages of fixed length, ping requests of various payload sizes are sent from the controller to the lamp, and the RTT in each case is measured. Thereafter, a network model is created in NS-3 to emulate the Hanadu-based 6LoPLC test bed. To ensure that the model adequately represents the investigated HEMS network, simulation results are validated with those measurements. A comparison of RTT from simulation and measurement is presented in
Figure 7.
Figure 7 shows that our model is in good agreement with the actual network. With the NS-3 model, we now investigate more complex scenarios. The significance of such an exercise is that understanding system performance in diverse scenarios and configurations can potentially provide new insights into how to meet communications Quality of Service (QoS) requirements of current and future HEMS applications, as well as improve the Quality of Experience (QoE) of the users. For instance, in
Figure 7, the steady rise in latency as the packet size increases is an indication that even with a single appliance, latency can be degraded if the data size is large.
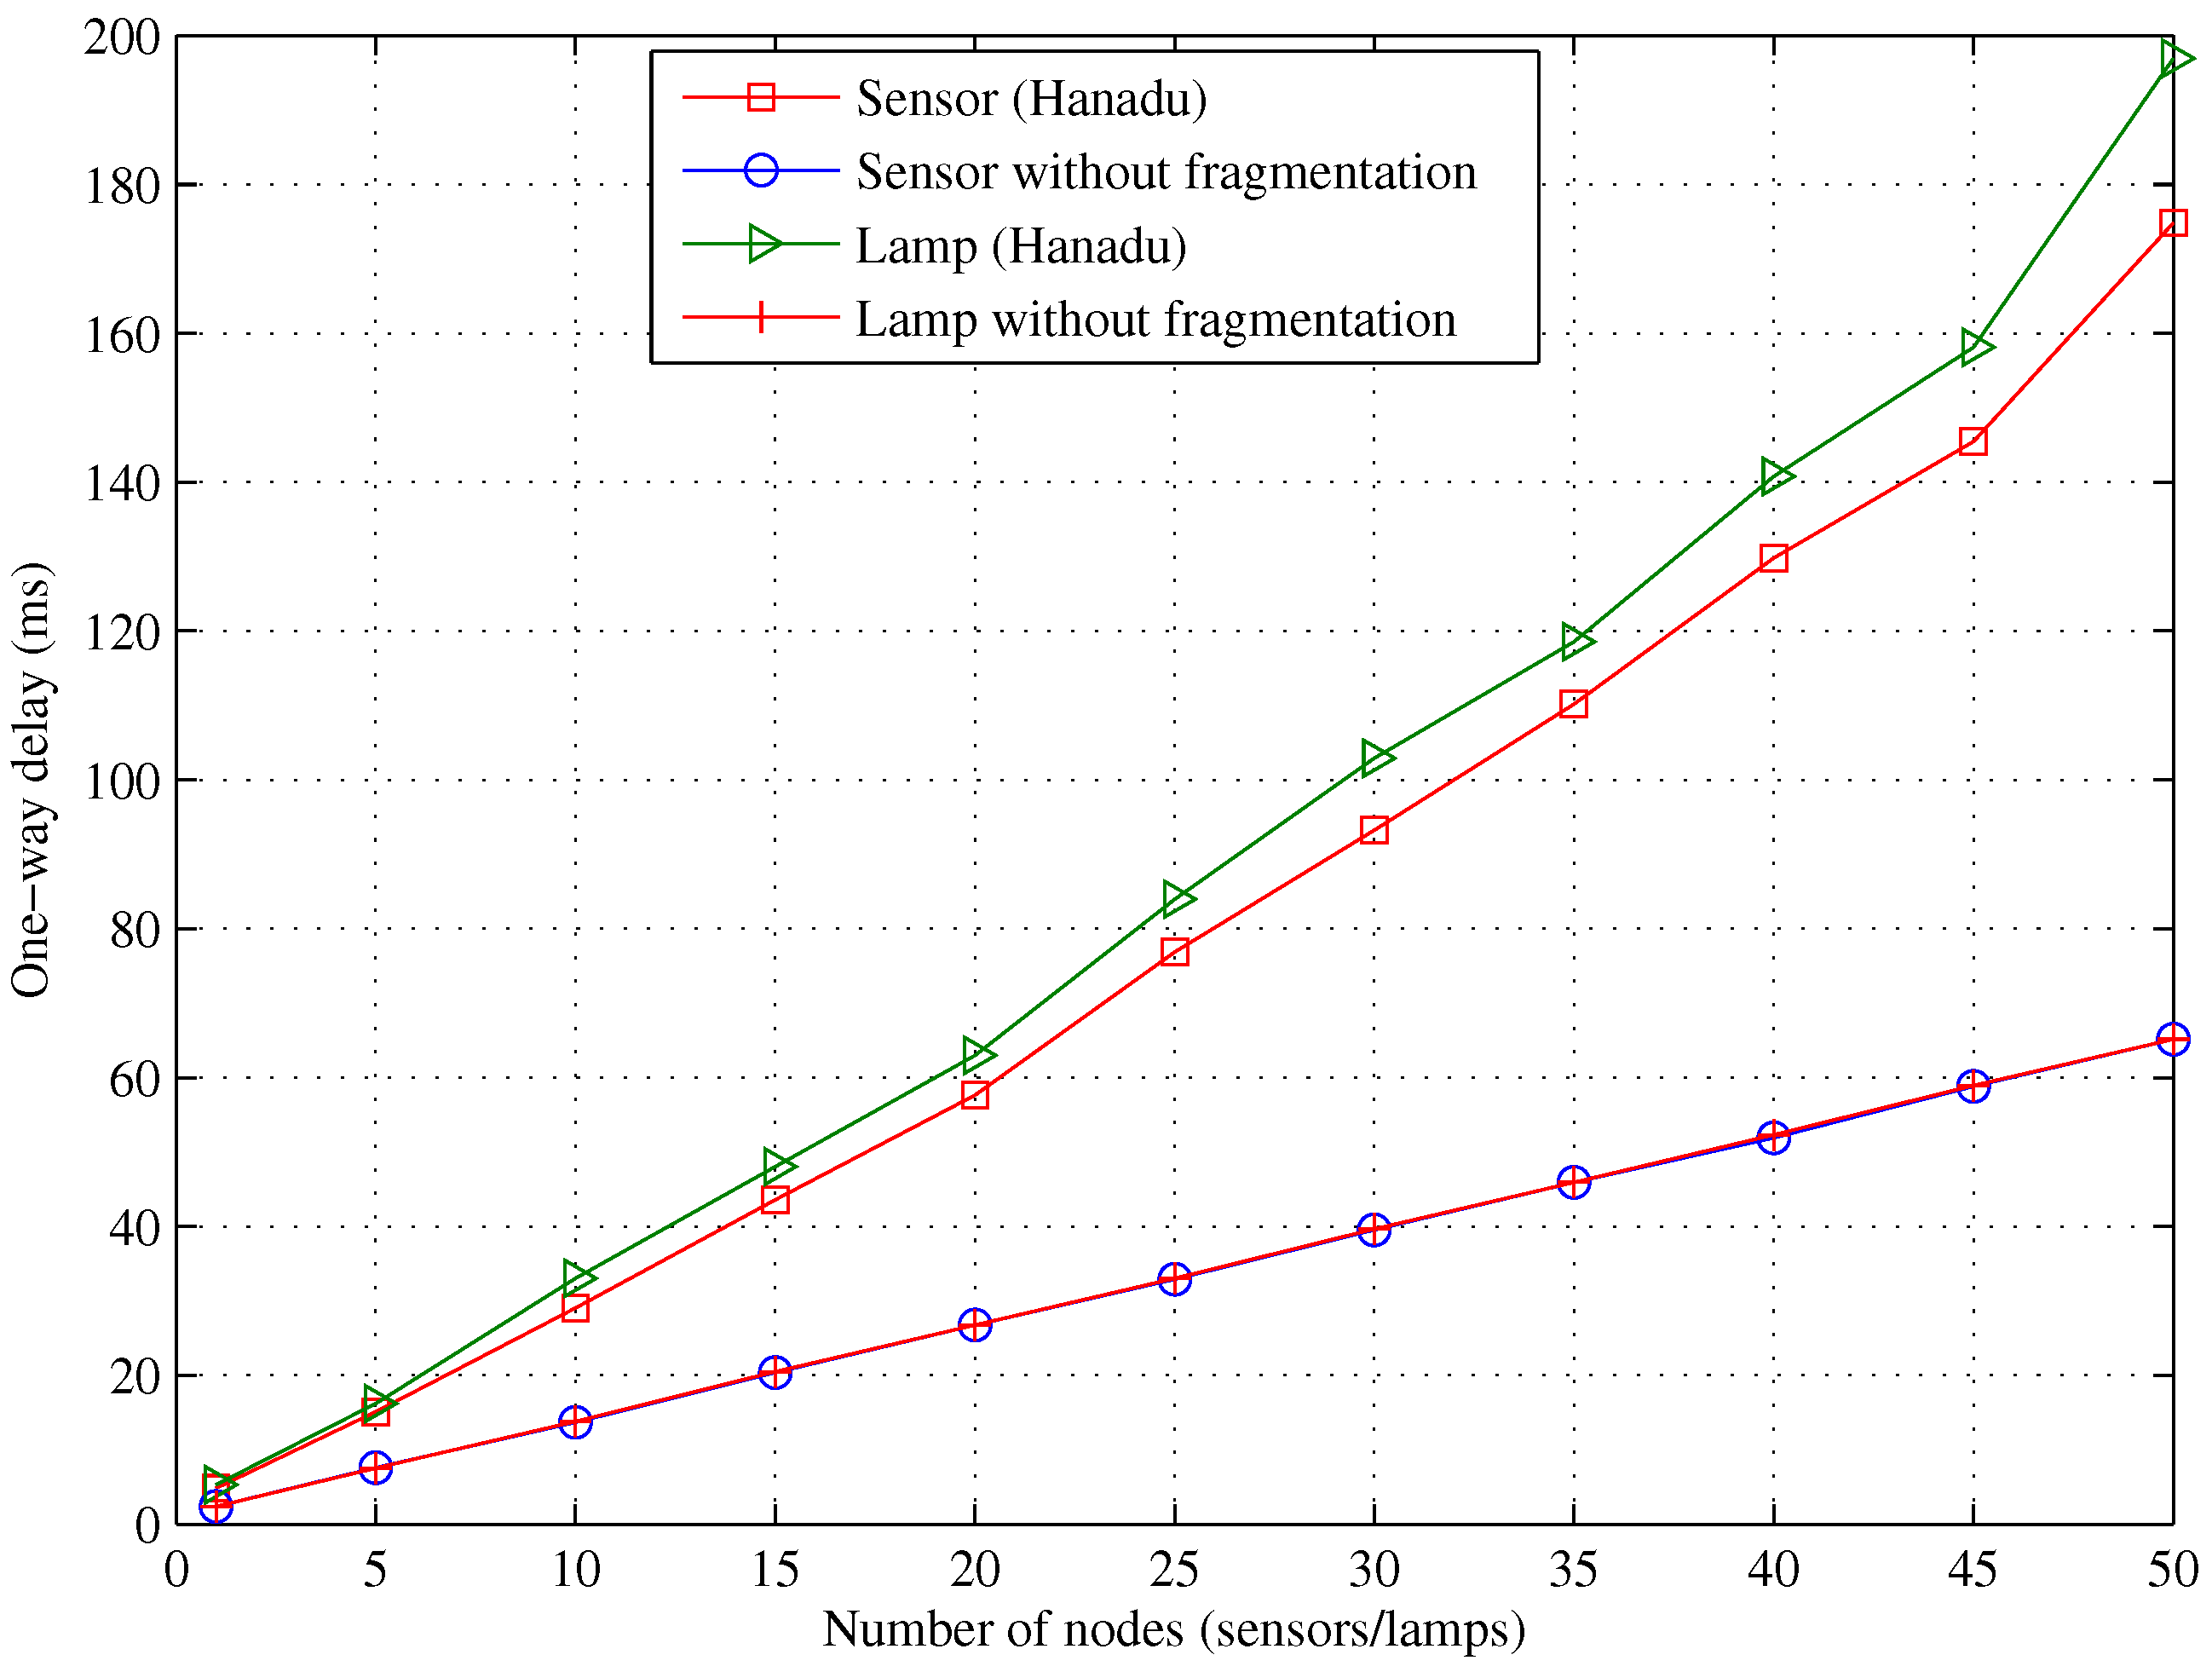
As monitoring and control operations typically involve several nodes, such as sensors, the effect of network load on the performance of the 6LoPLC system is also studied; some results of which are presented in
Figure 8.
Figure 8 presents the variation of delay with network size using 6LoPLC. The figure illustrates two cases: receipt of data (temperature) from the sensor and transmission of the control message to the lamp to increase its luminance. In each case, we study performance without fragmentation and with 6LoPLC. The main difference between these scenarios is that in the case of 6LoPLC, the MTU size of the communication medium is 127 bytes, whereas without fragmentation, the MTU size is 1280 bytes or more. These values represent the largest PDU that can be sent over the medium. In fact, without fragmentation, the minimum value of MTU is 1280 bytes, which corresponds to a full IPv6 packet. In this simulation, the payload of sensor data is 15 bytes, while that of lamp control is 30 bytes (as encoded in the CoAP message in
Table 1).
Figure 8 shows that in both monitoring and lamp control, the one-way delay increases as more home appliances are connected to the network. This is expected, as additional appliances signifies more network load, which invariably increases the end-to-end delay.
Although the adaptation layer is introduced to facilitate the low-rate communication of home appliances in HEMS, as seen in
Figure 8, there is clearly a cost for that as packets are subjected to fragmentation. One-way delay in
Figure 8 is the time taken to send a message from the HEMS controller through the Hanadu gateway to the lamp/sensor in one direction. Various network sizes ranging from 1–50 smart appliances are investigated. As seen in
Figure 8, although 6LoPLC allows us to adapt PLC for low-rate applications, such as HEMS, that comes at a price in terms of additional delay, which could be as high as 131.7512 ms in the case of lamp control signalling (gateway → lamp) and 109.6414 ms for monitoring (sensor → gateway). As seen in
Figure 1, the CoAP client is resident on a standard network node (a laptop) with full IPv6 capability. The latency performance described above is therefore logical, given that fragments received from the HEMS controller have to wait in the buffer until all bits belonging to the same flow are received before reassembly and further processes are carried out. The significance of this result is that for planning and design purposes, apart from application data size shown in
Figure 7, large number of nodes per controller can remarkably increase delay. Therefore, the network size of HEMS must be carefully chosen to ensure the latency is within acceptable limits.
5.2. Network Capacity
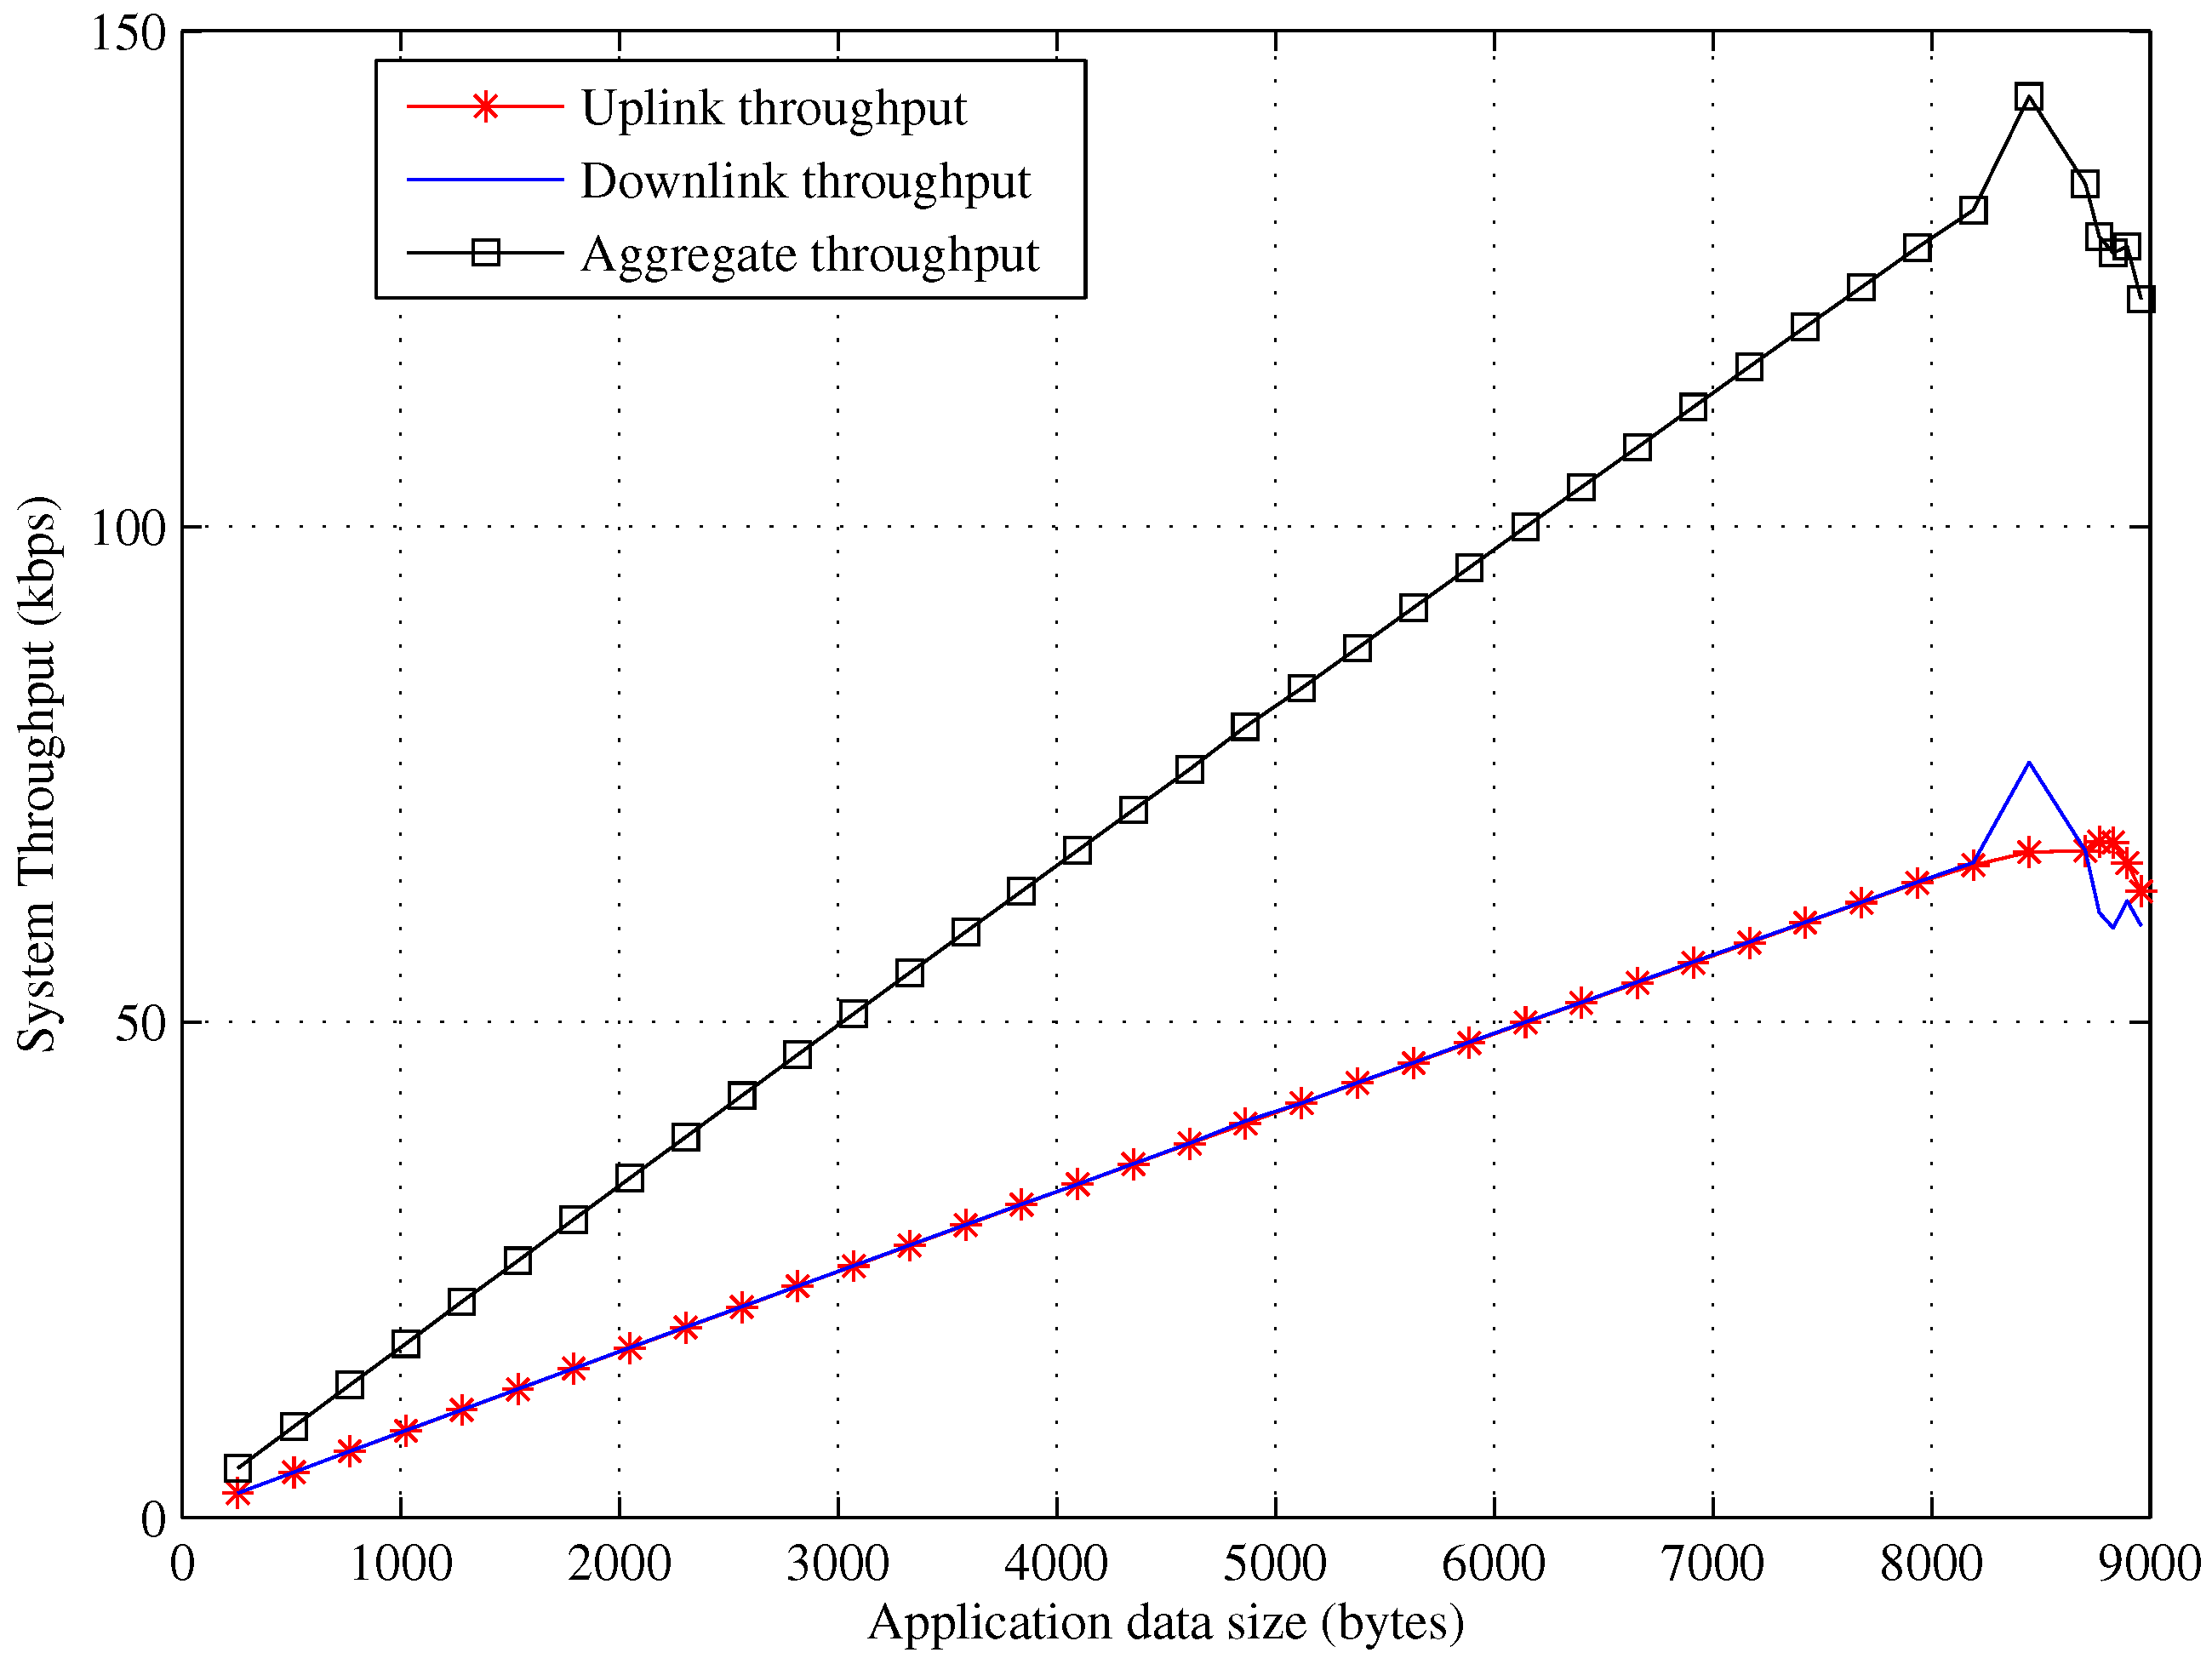
This section investigates the maximum network capacity in terms of raw throughput. The throughput measures the amount of data (sensor data, control message, luminance instruction and all communication overheads) successfully delivered over the network per unit time.
Figure 9 illustrates the variation of system throughput with data size. This simulation is based on one controller and one node.
By increasing the network load from 256–9216 bytes (steps of 256 bytes), the throughput increases until it attains its peak value and begins to drop. That upper threshold signifies the maximum achievable throughput. Although the Hanadu solution is envisioned to provide a maximum data rate of 250 kbps (assumed to be symmetric),
Figure 9 shows that the current implementation used in the test bed can only deliver a maximum of 68.198 kbps and 76.2275 kbps in uplink and downlink, respectively. As an illustration, in the 76 bytes contained in the sniffed packet (
Figure 5), data payload accounts for only 14 bytes (18.42%), and the rest is communication overhead. Since the overhead (which represents 81.52% of the message) is fixed and the payload is typically small, the current throughput is sufficient for HEMS monitoring and control applications.
5.3. Network Reliability
HEMS is generally a low-rate system, but a minimum reliability of 99% [
37] is required to ensure that monitoring information from the sensor and control message is delivered as needed. We investigate network reliability in terms of PDR with various packet sizes and different network configurations. PDR here is defined as the ratio of the received packets to the transmitted packets. A packet is deemed to have been received when all of its bits have been delivered to the destination service engine. This stateful approach ensures that the next layer processes only complete packets. The result is presented in
Figure 10.
As seen in
Figure 10, all of the network sizes favour small application data. From the design point of view and based on the system configuration employed in this work, we can also infer that in a HEMS comprised of 50 smart appliances, in order to guarantee at least 99% packet delivery, the size of the payload in the message exchanged between the nodes and controller must be 64 bytes or less. This is because as packet size increases and more appliances are connected to the HEMS network, the contention for network resources also increases, and more packets are fragmented, all of which result in lower PDR. Hence, larger data sizes tend to result in higher throughput (
Figure 9), but this often comes at the expense of lower reliability, as seen in
Figure 10.
5.4. Effects of Impulsive Noise
It was observed in
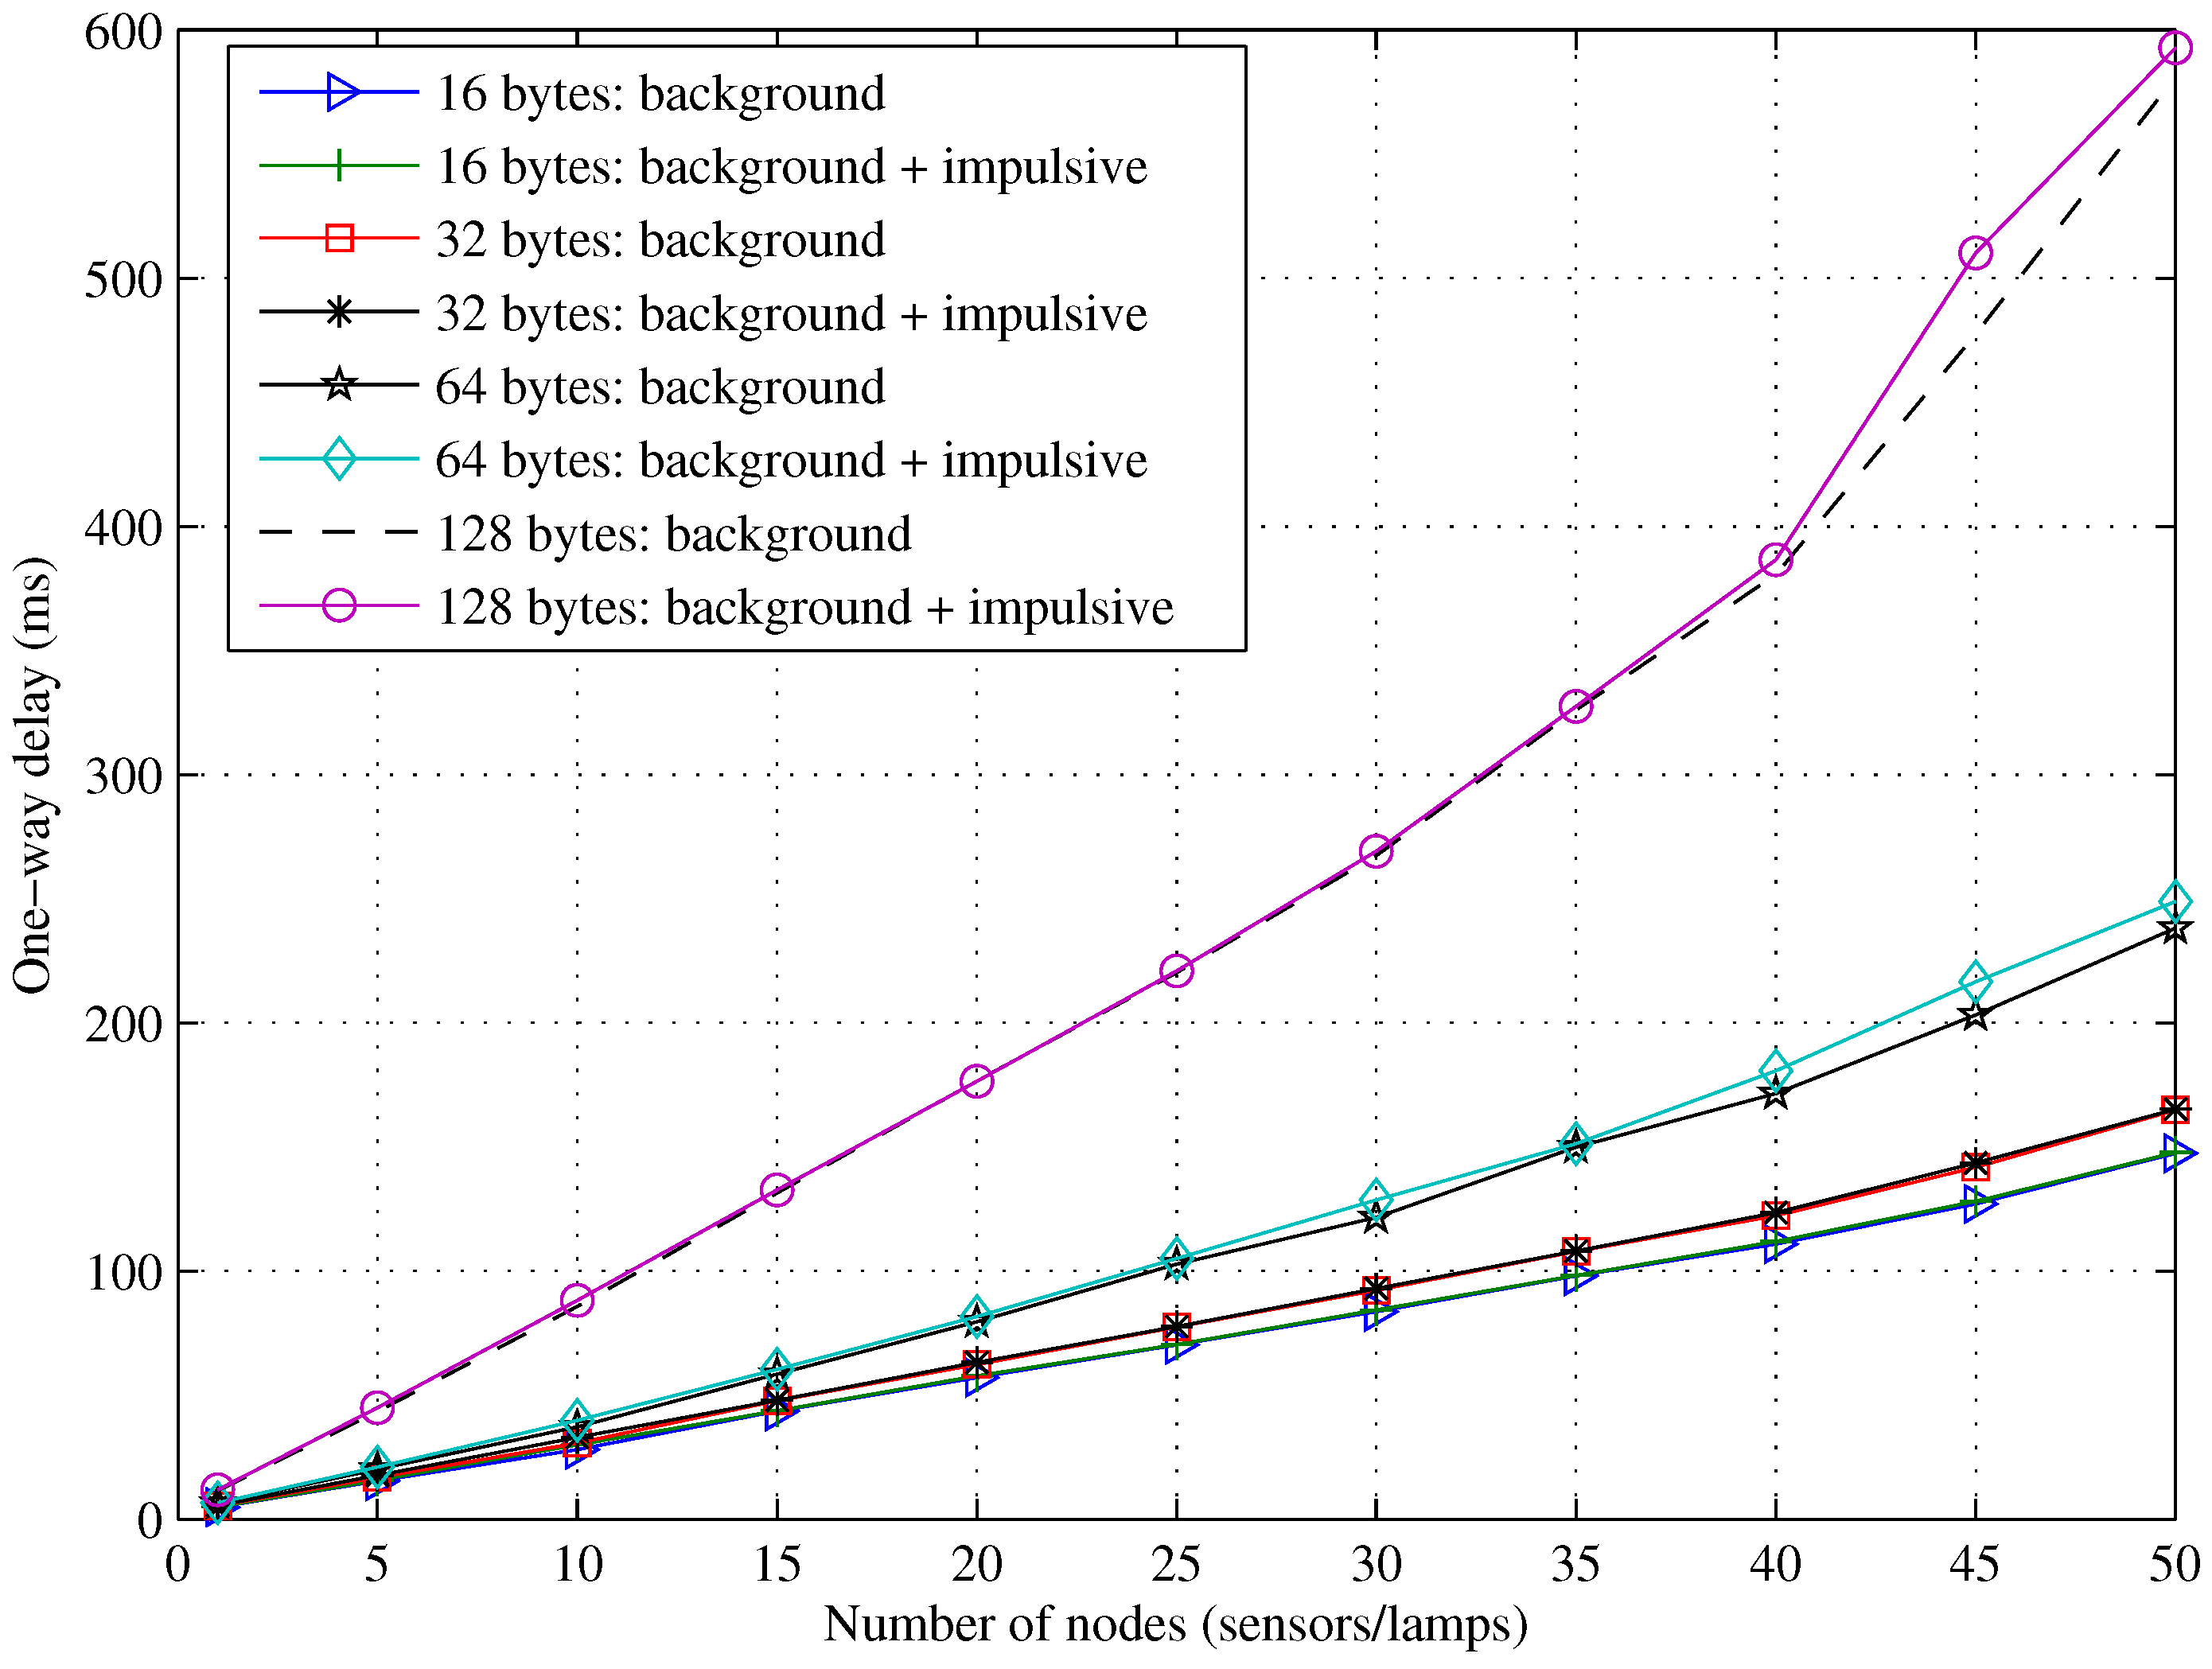
Section 5.3 that in a network of 50 nodes, application size must not exceed 64 bytes to guarantee at least 99% packet delivery. Using the same network configuration here, we investigate the effect of impulsive noise on the HEMS application performance using an application size ranging from 16–128 bytes. By varying the number of appliances on the HEMS network, we highlight the impacts of background and impulsive noise on the one-way delay. The delay here is the time taken to deliver a request from the controller to the node. By simulating different packet sizes, we cover both monitoring and control types of traffic. The result is presented in
Figure 11.
Although it is generally known that impulsive noise degrades PLC system performance, two key observations can be derived from
Figure 11: (i) impulsive noise degrades the latency performance of the HEMS, regardless of the application size; (ii) larger application data are more susceptible to degradation, for example in the case of the 128-byte and 16-byte data sizes, the degradation in latency is as high as 32.759 ms and 1.8977 ms, respectively, in terms of additional delay caused by impulsive noise. These occur because as impulsive noise degrades the power line channel, more transmit power is needed to guarantee consistent error-free transmission. In the absence of higher transmit power, the price to pay is higher latency.
5.5. Power Line Channel Performance
This section discusses the BER performance of the power line channel employed in the current Hanadu kits. Two scenarios are considered: (i) the BER of different modulation schemes; and (ii) the effects of impulsive noise on BER.
Figure 12 compares BER performance for different modulation schemes with only coloured background noise. From the communications requirements outlined in [
37], the HEMS application requires 99.0%–99.99% reliability, which translates to a BER of 10
−3 (median). This is the typical BER needed to guarantee the QoS of HEMS application traffic. Generally, differential Phase Shift Keying (PSK) schemes allow non-coherent detection. Hence, phase-tracking circuits are not required at the receivers, which consequently reduces the design and implementation complexities, as well as the cost. The current Hanadu is based on DBPSK, and as seen in
Figure 12, with coloured background noise alone, the current Hanadu requires an SNR of 7.8150 dB to achieve a BER of 10
−3. It can also be seen that, to guarantee 99.99% reliability, SNRs of 10.4164 dB, 12.8197 dB and 18.5068 dB are required by Quadrature PSK (QPSK), Differential QPSK (DQPSK) and Differential 8-PSK (D8PSK) respectively. Therefore, compared with QPSK-based systems, such as HomePlug Green PHY, this result shows that a 2.6014 dB power saving can be achieved by employing DBPSK. Although DQPSK and D8PSK can offer higher rates, employing them will potentially undermine the energy efficiency of the system. Since HEMS applications typically require a low data rate, which has been satisfied by DBPSK, such a trade-off is not necessary. The effects of impulsive noise on BER are illustrated for various impulsive noise probabilities in
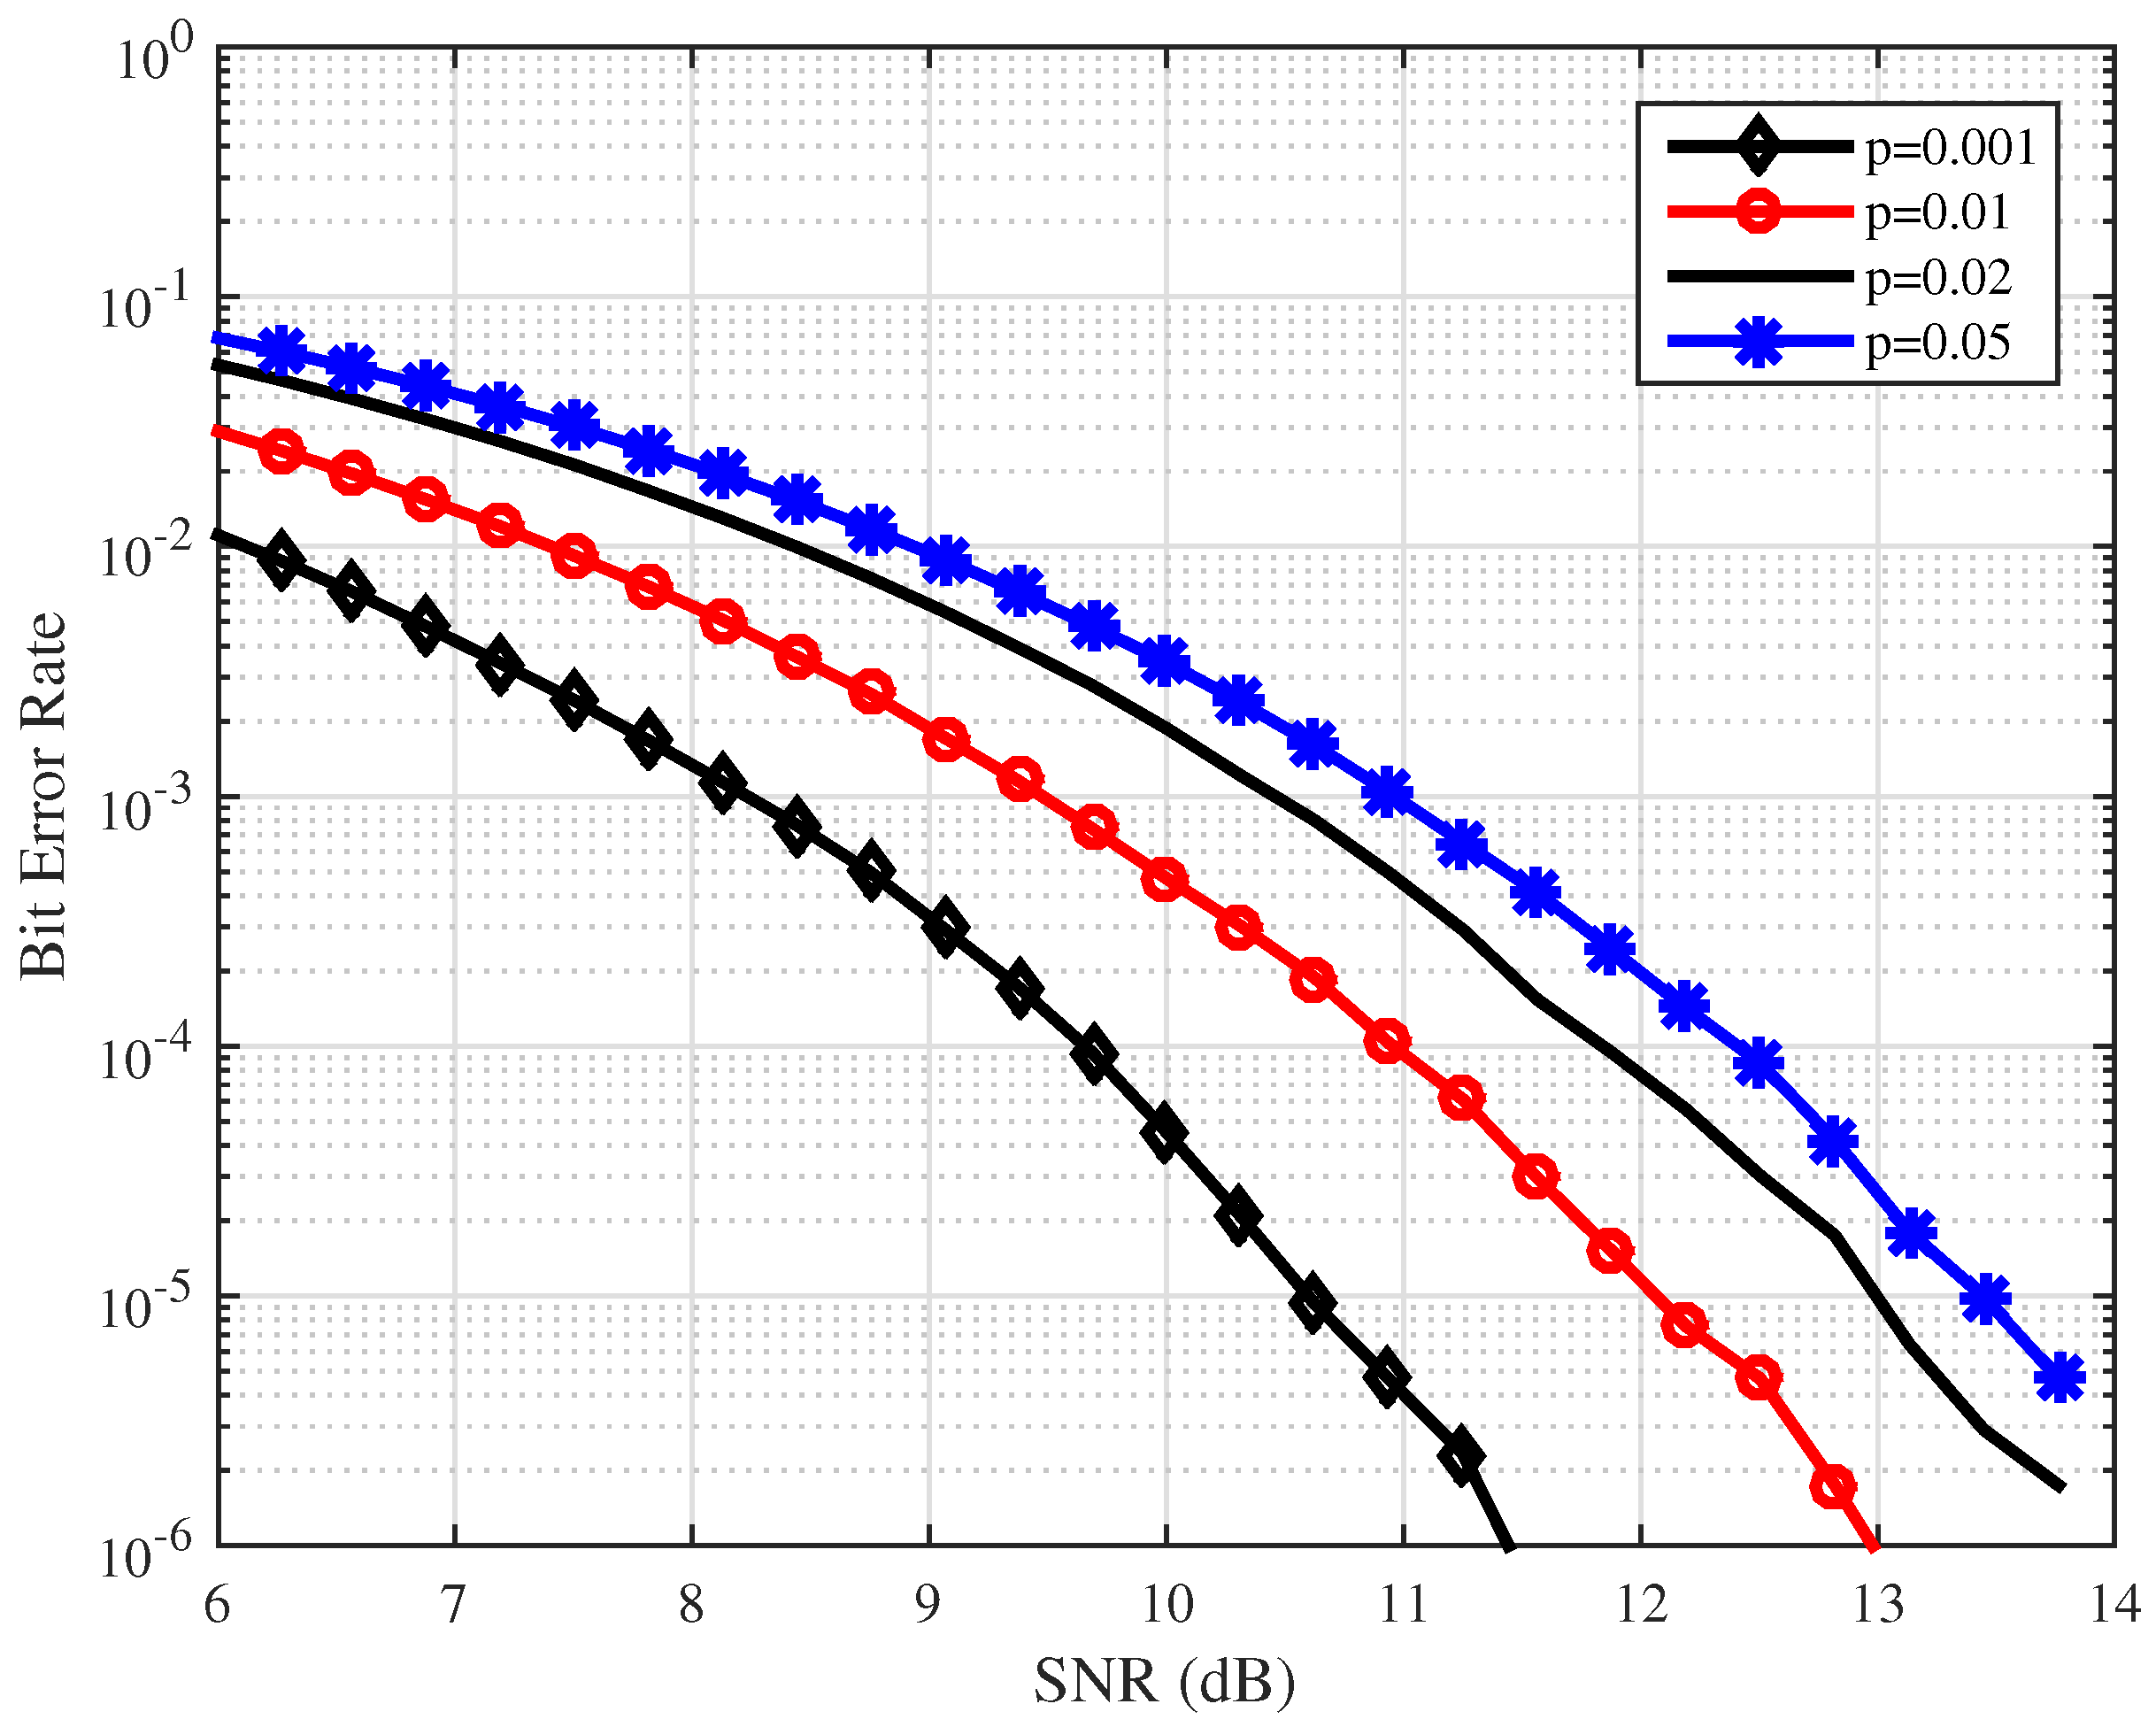
Figure 13.
Figure 13 shows the BER when the coloured background and impulsive noise are present, where
p represents the probability of the appearance of impulsive noise. The figure illustrates BER performance with impulsive noise probabilities of 0.001, 0.01, 0.02 and 0.05. These values signify that impulsive noise occurs 0.1%, 1%, 2% and 5% of the time. As seen in the figure, to achieve the same BER of 10
−3 with
p = 0.001, the SNR requirement increased to 8.1266 dB for the current Hanadu, meaning that an additional 0.3116 dB of transmit power are needed in the current kits to combat the effect of impulsive noise. Another inference from
Figure 13 is that for higher probabilities of impulsive noise, higher power levels are required at the transmitter. For example, with a probability of 0.05, an SNR of 10.9381 dB is required to achieve a BER of 10
−3, translating to an additional 2.8115 dB, compared with the probability of 0.001.
6. Conclusions
An empirical assessment of 6LoPLC for HEMS has been presented in this paper. A model was developed in NS-3 and validated with measurement results from Hanadu 6LoPLC evaluation kits. It was shown that 6LoPLC could introduce additional one-way delay, as high as 131.7512 ms to control and 108.8314 ms to monitoring applications. Based on the parameters employed in this work, in order to guarantee 99% minimum system reliability, it was shown that the application data must not exceed 64 bytes. These results could provide some useful insights for system designers and application developers. The results also reveal that with the current system configurations, latencies of 238.117 ms and 248.959 ms are achievable for monitoring and control applications, respectively, provided the data size is 64 bytes or less. Finally, it was shown that, with the CoAP payload of 128 bytes, impulsive noise can further degrade the latency by an additional 32.759 ms.
We further showed that larger application data sizes are more affected by impulsive noise and 6LoPLC fragmentation/reassembly processes. Beyond HEMS, the model presented in this paper is also feasible for smart grid applications and other cyber-physical systems where high reliability and low cost are of higher priority than high throughput. Future work in this area will include system optimisation and miniaturisation of the hardware.
Acknowledgments
This research has been carried out within the “Smart In-Building Micro Grid for Energy Management” project funded by EPSRC (EP/M506758/1) and supported by Innovate UK (Innovate UK Project 101836) . The authors would also like to thank Bryan Lawrence and Majd Zoorob, both of Photonstar Technology Ltd., for their collaboration during the project. The views and conclusions contained in this paper are those of the authors and should not be interpreted as necessarily representing the official policies, either expressed or implied, of the Innovate UK or EPSRC.
Author Contributions
Bamidele Adebisi and Augustine Ikpehai conceived the idea and performed initial system analysis. Augustine Ikpehai developed the models (NS-3 and MATLAB). All of the authors contributed, reviewed and commented on the manuscript. All of the authors have read and approved the final manuscript.
Conflicts of Interest
The authors declare no conflict of interest.
Abbreviations
| 6LoWPAN | IPv6 over LoWPAN |
| BER | Bit Error Rate |
| BPLC | Broadband PLC |
| CoAP | Constrained Application Protocol |
| DBPSK | Differential Binary Phase Shift Keying |
| DC | Direct Current |
| DERs | Distributed Energy Resources |
| DGS | Distributed Generating Systems |
| DSM | Demand Side Management |
| DSS | Distributed Storage Systems |
| EMSs | Energy Management Systems |
| HAN | Home Area Network |
| HEMS | Home Energy Management System |
| HTTP | Hypertext Transfer Protocol |
| IETF | Internet Engineering Task Force |
| IP | Internet Protocol |
| LED | Light-Emitting Diode |
| LOS | Line of Sight |
| MAC | Media Access Control layer |
| MTU | Maximum Transmission Unit |
| OFDM | Orthogonal Frequency-Division Multiplexing |
| PDR | Packet Delivery Ratio |
| PDU | Protocol Data Unit |
| PEV | Plug-in Electric Vehicle |
| PHY | Physical layer |
| PLC | Power Line Communication |
| PSD | Power Spectral Density |
| QoE | Quality of Experience |
| QoS | Quality of Service |
| QPSK | Quadrature Phase Shift Keying |
| RFC | Request for Comments |
| rng | random number generator |
| RTT | Return Trip Time |
| SCR | Silicon Controlled Rectifier |
| SEP | Smart Energy Profile |
| SNR | Signal to Noise Ratio |
| TCP | Transmission Control Protocol |
| TLT | Transmission Line Theory |
| UART | Universal Asynchronous Receiver/Transmitter |
| UDP | User Datagram Protocol |
| Wi-Fi | Wireless Fidelity |
References
- Mendes, T.D.; Godina, R.; Rodrigues, E.M.; Matias, J.C.; Catalão, J.P. Smart home communication technologies and applications: Wireless protocol assessment for home area network resources. Energies 2015, 8, 7279–7311. [Google Scholar] [CrossRef]
- Ikpehai, A.; Adebisi, B.; Rabie, K.M. Broadband PLC for Clustered Advanced Metering Infrastructure (AMI) Architecture. Energies 2016, 9, 569. [Google Scholar] [CrossRef]
- Lobaccaro, G.; Carlucci, S.; Löfström, E. A Review of Systems and Technologies for Smart Homes and Smart Grids. Energies 2016, 9, 348. [Google Scholar] [CrossRef]
- D’Alessandro, S.; Tonello, A.M.; Monacchi, A.; Elmenreich, W. Home energy management systems: Design guidelines for the communication infrastructure. In Proceedings of the IEEE International Energy Conference (ENERGYCON), Dubrovnik, Croatia, 13–16 May 2014; IEEE: New York, NY, USA, 2014; pp. 805–812. [Google Scholar]
- Andreadou, N.; Guardiola, M.O.; Fulli, G. Telecommunication Technologies for Smart Grid Projects with Focus on Smart Metering Applications. Energies 2016, 9, 375. [Google Scholar] [CrossRef]
- Nguyen, H.T.; Nguyen, D.; Le, L.B. Home energy management with generic thermal dynamics and user temperature preference. In Proceedings of the IEEE International Conference on International Smart Grid Communications (SmartGridComm), Vancouver, BC, Canada, 21–24 October 2013; IEEE: New York, NY, USA, 2013; pp. 552–557. [Google Scholar]
- Beaudin, M.; Zareipour, H. Home energy management systems: A review of modelling and complexity. Renew. Sustain. Energy Rev. 2015, 45, 318–335. [Google Scholar] [CrossRef]
- Miceli, R. Energy management and smart grids. Energies 2013, 6, 2262–2290. [Google Scholar] [CrossRef] [Green Version]
- Haidine, A.; Adebisi, B.; Treytl, A.; Pille, H.; Honary, B.; Portnoy, A. High-speed narrowband PLC in Smart Grid landscape—State-of-the-art. In Proceedings of the IEEE International Symposium on Power Line Communications and Its Applications (ISPLC), Udine, Italy, 3–6 April 2011; IEEE: New York, NY, USA, 2011; pp. 468–473. [Google Scholar]
- Thomas, B.L.; Cook, D.J. Activity-Aware Energy-Efficient Automation of Smart Buildings. Energies 2016, 9, 624. [Google Scholar] [CrossRef]
- Aalamifar, F.; Schlögl, A.; Harris, D.; Lampe, L. Modelling power line communication using network simulator-3. In Proceedings of the 2013 IEEE Global Communications Conference (GLOBECOM), Atlanta, GA, USA, 9–13 December 2013; IEEE: New York, NY, USA, 2013; pp. 2969–2974. [Google Scholar]
- Hertzog, C. How ’Transactive Energy’ Helps Buildings Strengthen the Grid. Available online: https://www.greenbiz.com/blog/2013/06/04/transactive-energy-helps-buildings-strengthen-grid (accessed on 30 September 2016).
- Ikpehai, A.; Adebisi, B. Home energy management system over low-power narrowband PLC. In Proceedings of the 10th International Symposium on Communication Systems, Networks and Digital Signal Processing (CSNDSP), Prague, Czech Republic, 20–22 July 2016; IEEE: New York, NY, USA, 2016; pp. 1–6. [Google Scholar]
- National Institute of Standards and Technology. Building Integration with Smart Grid. Available online: http://www.nist.gov/el/smartgrid/bisgrid.cfm (accessed on 30 September 2016).
- Saha, A.; Kuzlu, M.; Pipattanasomporn, M. Demonstration of a home energy management system with smart thermostat control. In Proceedings of the 2013 IEEE PES Innovative Smart Grid Technologies (ISGT), Washington, DC, USA, 24–27 February 2013; IEEE: New York, NY, USA, 2013; pp. 1–8. [Google Scholar]
- ElShafee, A.; Hamed, K.A. Design and implementation of a WIFI based home automation system. World Acad. Sci. Eng. Technol. 2012, 68, 2177–2180. [Google Scholar]
- Hu, Q.; Li, F. Hardware design of smart home energy management system with dynamic price response. IEEE Trans. Smart Grid 2013, 4, 1878–1887. [Google Scholar] [CrossRef]
- Kuzlu, M.; Pipattanasomporn, M.; Rahman, S. Hardware demonstration of a home energy management system for demand response applications. IEEE Trans. Smart Grid 2012, 3, 1704–1711. [Google Scholar] [CrossRef]
- Han, J.; Choi, C.S.; Park, W.K.; Lee, I.; Kim, S.H. Smart home energy management system including renewable energy based on ZigBee and PLC. IEEE Trans. Consum. Electron. 2014, 60, 198–202. [Google Scholar] [CrossRef]
- Collotta, M.; Pau, G. A solution based on bluetooth low energy for smart home energy management. Energies 2015, 8, 11916–11938. [Google Scholar] [CrossRef]
- Gacanin, H.; Adebisi, B.; Ligata, A. Energy-efficient multiple-domain bidirectional scheme for G. hn applications. Int. J. Commun. Syst. 2015. [Google Scholar] [CrossRef]
- Han, J.; Choi, C.S.; Park, W.K.; Lee, I.; Kim, S.H. PLC-based photovoltaic system management for smart home energy management system. IEEE Trans. Consum. Electron. 2014, 60, 184–189. [Google Scholar] [CrossRef]
- Son, Y.S.; Pulkkinen, T.; Moon, K.D.; Kim, C. Home energy management system based on power line communication. IEEE Trans. Consum. Electron. 2010, 56, 1380–1386. [Google Scholar] [CrossRef]
- HomePlug. The Standard for In-Home Smart Grid Powerline Communications: An Application and Technology Overview; HomePlug Green PHY 1.1; HomePlug Powerline Alliance Inc.: San Ramon, CA, USA, 2012. [Google Scholar]
- Cano, C.; Pittolo, A.; Malone, D.; Lampe, L.; Tonello, A.M.; Dabak, A. State-of-the-art in Power Line Communications: From the Applications to the Medium. IEEE J. Sel. Areas Commun. 2016, 34, 1935–1952. [Google Scholar] [CrossRef]
- Galli, S.; Logvinov, O. Recent developments in the standardization of power line communications within the IEEE. IEEE Commun. Mag. 2008, 46, 64–71. [Google Scholar] [CrossRef]
- Adebisi, B.; Treytl, A.; Haidine, A.; Portnoy, A.; Shan, R.U.; Lund, D.; Pille, H.; Honary, B. IP-centric high rate narrowband PLC for smart grid applications. IEEE Commun. Mag. 2011, 49, 46–54. [Google Scholar] [CrossRef]
- Adebisi, B.; Khalid, A.; Tsado, Y.; Honary, B. Narrowband PLC channel modelling for smart grid applications. In Proceedings of the 2014 9th International Symposium on Communication Systems, Networks & Digital Signal Processing (CSNDSP), Manchester, UK, 23–25 July 2014; IEEE: New York, NY, USA, 2014; pp. 67–72. [Google Scholar]
- Zimmermann, M.; Dostert, K. Analysis and modeling of impulsive noise in broad-band powerline communications. IEEE Trans. Electromagn. Compat. 2002, 44, 249–258. [Google Scholar] [CrossRef]
- Di Bert, L.; Caldera, P.; Schwingshackl, D.; Tonello, A.M. On noise modeling for power line communications. In Proceedings of the 2011 IEEE International Symposium on Power Line Communications and Its Applications (ISPLC), Udine, Italy, 3–6 April 2011; IEEE: New York, NY, USA, 2011; pp. 283–288. [Google Scholar]
- Rabie, K.M.; Adebisi, B.; Salem, A. Improving energy efficiency in dual-hop cooperative PLC relaying systems. In Proceedings of the 2016 IEEE International Symposium on Power Line Communications and its Applications (ISPLC), Bottrop, Germany, 29 March–1 April 2016; pp. 196–200.
- Rabie, K.M.; Alsusa, E. Quantized peak-based impulsive noise blanking in power-line communications. IEEE Trans. Power Deliv. 2014, 29, 1630–1638. [Google Scholar] [CrossRef]
- Internet Engineering Task Force. Internet Protocol, Version 6 (IPV6) Specification. IETF RFC 2460. Available online: https://tools.ietf.org/html/rfc2460 (accessed on 12 September 2016).
- Matanza, J.; Kiliccote, S.; Alexandres, S.; Rodríguez-Morcillo, C. Simulation of low-voltage narrow-band power line communication networks to propagate OpenADR signals. J. Commun. Netw. 2015, 17, 656–664. [Google Scholar] [CrossRef]
- Rozman, M.; Ikpehai, A.; Adebisi, B.; Rabie, K.M. Channel characterisation of cooperative relaying power line communication systems. In Proceedings of the 2016 10th International Symposium on Communication Systems, Networks and Digital Signal Processing (CSNDSP), Prague, Czech Republic, 20–22 July 2016; IEEE: New York, NY, USA, 2016; pp. 1–5. [Google Scholar]
- Internet Engineering Task Force. Transmission of IPv6 Packets over IEEE 802.15.4 Networks. IETF RFC 4944. Available online: https://tools.ietf.org/html/rfc4944 (accessed on 12 September 2016).
- Ikpehai, A.; Adebisi, B. 6LoPLC for smart grid applications. In Proceedings of the International Symposium on Power Line Communications and Its Applications (ISPLC), Austin, TX, USA, 29–31 March 2015; IEEE: New York, NY, USA, 2015; pp. 211–215. [Google Scholar]
© 2016 by the authors; licensee MDPI, Basel, Switzerland. This article is an open access article distributed under the terms and conditions of the Creative Commons Attribution (CC-BY) license (http://creativecommons.org/licenses/by/4.0/).


