
Life Cycle Assessment of Horse Manure Treatment


1
Department of Building, Energy and Environmental Engineering, Faculty of Engineering and Sustainable Development, University of Gävle, Kungsbäcksvägen 47, SE-801 76 Gävle, Sweden
2
SP Technical Research Institute of Sweden, Box 857, SE-501 15 Borås, Sweden
3
School of Business, Society and Engineering, University of Mälardalen, Högskoleplan 1, SE-721 23 Västerås, Sweden
*
Author to whom correspondence should be addressed.
Energies 2016, 9(12), 1011; https://doi.org/10.3390/en9121011
Submission received: 19 September 2016
/
Revised: 16 November 2016
/
Accepted: 21 November 2016
/
Published: 30 November 2016
(This article belongs to the Special Issue Energy and Waste Management)
Abstract
:Horse manure consists of feces, urine, and varying amounts of various bedding materials. The management of horse manure causes environmental problems when emissions occur during the decomposition of organic material, in addition to nutrients not being recycled. The interest in horse manure undergoing anaerobic digestion and thereby producing biogas has increased with an increasing interest in biogas as a renewable fuel. This study aims to highlight the environmental impact of different treatment options for horse manure from a system perspective. The treatment methods investigated are: (1) unmanaged composting; (2) managed composting; (3) large-scale incineration in a waste-fired combined heat and power (CHP) plant; (4) drying and small-scale combustion; and (5) liquid anaerobic digestion with thermal pre-treatment. Following significant data uncertainty in the survey, the results are only indicative. No clear conclusions can be drawn regarding any preference in treatment methods, with the exception of their climate impact, for which anaerobic digestion is preferred. The overall conclusion is that more research is needed to ensure the quality of future surveys, thus an overall research effort from horse management to waste management.
1. Introduction
Horse manure contains both energy and valuable plant nutrients such as phosphorus and nitrogen as well as humus-forming substances that can enrich the soil. Previous reviews [1,2] of horse keeping and horse manure as a feedstock for anaerobic digestion illustrate both the benefits and disadvantages of current management practices and the use of anaerobic digestion. However, horse manure management can be turned from a waste management problem to a renewable energy resource. If current composting practice is substituted with anaerobic digestion to produce biogas, and/or combustion to provide electricity and heat, three environmental benefits are gained:
- (1)
- Emissions from conventional management, in which the manure is piled and stored, or spontaneously composted or decomposed, are avoided.
- (2)
- Anaerobic digestion of manure produces biogas that can be utilized to generate electricity and/or heat or, after upgrading (purification and pressure increase), as vehicle fuel. Thereby emissions from fossil fuels are reduced. Alternatively, combustion of manure can generate electricity and/or heat and replace other fuels.
- (3)
- Following the digestion process, the resulting digestate can be used in agriculture, thereby replacing chemical fertilizer and providing additional environmental benefits in terms of soil improvement.
Being a lignocellulosic material, horse manure is suitable for composting [3,4], which is recommended on farms where horse manure is used as a biofertilizer on agricultural land [5]. Due to a high proportion of bedding material, spontaneous degradation in horse manure is slow [6]. Horse dung without bedding could be composted in one month but the content of bedding slows down the composting process [4]. Managed composts use aeration and mixing to accelerate the composting process, e.g., using a drum composter [7].
Anaerobic digestion of horse manure in farm-scale liquid anaerobic biogas plants was reported in Olsson et al. [8] where horse manure was co-digested with liquid cattle manure. Horse manure energy performance is lower than that of cattle manure, which is also shown in Kalia and Singh [9] but the abovementioned studies show that horse manure contributes added energy potential to existing biogas plants in periods with a low amount of cattle manure [8] and to some extent (20%) can substitute cattle manure with only a minor reduction in gas production [9]. Anaerobic digestion involves some challenges when it comes to solid impurities like sand, gravel, and horse shoes disturbing agitators and pumps used in liquid-anaerobic digestion (L-AD). Fibrous material such as spent straw or wood shavings creates scum layers that are detrimental to gas generation [9,10]. According to previous research, dry fermentation (solid state anaerobic digestion) may be more convenient than wet digestion for lignocellulosic material [11], but so far fairly little is known about how horse manure performs in full-scale dry fermentation [2].
For optimal performance, horse manure should be digested fresh and storage should be avoided due to the energy lost in aerobic processes [12]. Horse manure as a fuel in heating plants varies considerably in usefulness depending on the type and amount of bedding, which influences the heating value, moisture content, ash content, and chemical composition. Combustion of horse manure is possible, but it is a problematic fuel in terms of practical handling and high content of nitrogen and moisture [13] and additionally plant nutrients are not recovered. A good combustion process was reported for water content not exceeding 50% [5]. Mixing horse manure with other fuels and pre-drying are both methods for improving horse manure fuel properties [12]. Based on previous literature findings [1,2], research describing the environmental impact from management and utilization of horse manure from a system perspective is lacking. The purpose of this study is to calculate and compare the environmental impact from different treatment options for horse manure using life cycle assessment (LCA).
2. Materials and Methods
The computational LCA model ORWARE (ORganic WAste REsearch) is used to evaluate the environmental impacts of waste management [14,15,16]. In ORWARE, the management of different wastes is described at an elemental level, i.e., their composition of nutrients, carbon, water and contaminants such as heavy metals, etc. The model can handle solid and liquid organic and inorganic wastes from different sources. ORWARE is built from a number of modules that describe a process or treatment. Waste with a certain composition is simulated from the point of collection, via transportation, to processing plants. The model calculates emissions to air and water, which are characterized using a state-of-the art environmental impact assessment method. The performance of the LCA complies with the relevant ISO standard [17] and the ILCD handbook [18]. More detailed information on model adjustments made in this study is given below.
2.1. Goal and Scope Definition
2.1.1. Aim and Goal
The study has the overall aim of exploring how horse manure can be turned from a waste problem to a contribution towards a sustainable society through the production of renewable energy and nutrient recycling. The goal is to describe and compare the environmental performance of anaerobic digestion, composting, and incineration of horse manure.
2.1.2. Functional Unit
The model is based on an assumption of a fixed amount of horse manure, including a pre-set percentage of bedding material, chosen due to model constraints. From this follows a functional unit defined as the treatment of 10,000 tonnes of horse dung and 5000 tonnes of woodchip bedding. This means that the reference flow is 15,000 tonnes. For comparison, a horse generates approximately 10 tonnes of manure (dung and bedding) annually [6]. This amount differs between references in the range 5–14 tonnes [10,19]. The share of bedding in horse manure is generally high, ratios of 25%–90% are mentioned in literature [10,20]. Bedding content in horse manure depends on the type of manure and 33% bedding ratio is assumed for the softwood bedding used in this analysis. The chemical composition of horse dung and softwood bedding for this study is described in Table A1 in Appendix A. Besides manure management, the following functions (output-related functional units) are included as results from the different treatments: electricity, district heating, vehicle transport and nitrogen, phosphorous and potassium (NPK)-fertilizer.
2.1.3. System Boundaries
Horse manure includes horse dung (feces and urine) and bedding. In horse keeping, different beddings are used and the impact on anaerobic digestion from different beddings was investigated in a previous study [2]. Two of the most commonly used beddings are wood shavings or woodchips, of which the latter has been chosen for this study, see Table 1 for the main characteristics.
The system is depicted in Figure 1. The core system boundaries are visualized by a dashed line and the compensatory system by a dotted line. Gray colored boxes represent different functional units. The upstream system comprised of the environmental impact from horse manure production and production of bedding material is not within the scope of this study. Included in the system boundaries are transport to the treatment plants, the treatment process, storage of biofertilizer, transport to landfill for ashes and slag, transport for spreading of digestate and long- and short-term effects in soil of usage of organic or mineral fertilizer (Table A2, Table A3, Table A4, Table A5, Table A6, Table A7, Table A8, Table A9, Table 10 and Table 11 in Appendix A).
The temporal boundary is the amount of manure generated and disposed of annually, as an assumed functional unit. Emissions from landfill during a surveyable time period (approximately 100 years) are included and the carbon sink for both slag landfill and arable land (compost and digestate) is accounted for, meaning that carbon of biological origin that is not degraded during the following 100 years is calculated with a negative value for global warming potential (GWP) (Appendix A.7). For the cultivation of crops the short- and long-term mineralization of organically bound nitrogen is included as well as the efficiency of using organic fertilizers compared to mineral fertilizers [14]. Sowing, harvesting, and crop residues are not part of the boundaries for the studied horse manure treatment system. Storage prior to horse manure treatment is assumed to be the same for all scenarios and thus not included in the systems analysis.
2.1.4. Allocation
As can be seen in Figure 1, system expansion is used in order to avoid allocation. Each of the five numbered scenarios corresponds to a treatment method that generates one or more functions in terms of energy or nutrients. These are compensated for by a background system, see more below.
2.2. Life Cycle Inventory
LCA tools model material flows and, as such, require input data on the composition of materials and the material transformation processes involved in the waste management systems being considered. The first step in building an LCA model is to make a data inventory of high quality data sources. Where reliable data cannot be established, it is necessary to make assumptions. The data was collected from peer-reviewed journal papers, technical reports, personal communication, and in some cases relies on pre-existing values in the LCA model, ORWARE.
2.2.1. Selected Technologies
General descriptions of technologies and assumptions are presented here, whereas detailed process data (Appendix A) are found in previous reports [21,22]. The technological scope of the study is current technology in L-AD, composting according to literature reviews, and large-scale incineration operated at Swedish waste incineration plants under Swedish conditions. Softwood bedding was used for the analysis as it is the most commonly used bedding material in Sweden [23].
In summary, the following systems are considered:
Anaerobic (“liquid-state”) digestion—A continuous stirred tank reactor, mesophilic temperature, which includes pretreatment (thermal hydrolysis with steam explosion), production of biogas (with subsequent upgrading to vehicle gas), and the resultant digestate (which can be used as biofertilizer).
Aerobic digestion (composting)—Transforming the manure into fertilizer through either:
- -
- Piling and storage, leading to passive aerobic decomposition (this includes “unmanaged” composting), or through;
- -
- Active mixing, aeration and turning (managed composting) with a biofilter.
Combustion (incineration)—For heat and electricity production in either:
- -
- Large-scale combined heat and power (CHP) plant. Includes landfill treatment of the resultant ash & slag.
- -
- Small scale heat boiler at, e.g., a farm.
Previous studies [2] suggest solid state anaerobic digestion as suitable for treatment of horse manure due to its high share of total solids (TS). This method is however not included due to a lack of, or poor process data on full-scale plants using horse manure. Landfill disposal is also a plausible option, but has been omitted as: (1) it is a method with poor resource recovery, at the bottom of the waste hierarchy; and (2) there is a ban on landfill disposal of combustible and organic waste in some European countries.
With the exception of passive decomposition, the management systems above can not only prevent emissions from untreated horse manure, they can also potentially offset emissions from other energy uses. For example, incineration can generate heat and electricity, and biogas can replace fossil fuels and possibly heat. Such offsetting is considered in the LCA model. Upgraded biogas is used in vehicles, replacing diesel oil with 5% fatty acid methyl esters (FAME). Digestate and compost is used for soil amendment in agriculture and replaces chemical/mineral fertilizer with respect to its content of nitrogen, phosphorous, and potassium. Heat generated from combustion is assumed to replace the combustion of biofuel. In small-scale combustion, woodchips are considered to be the alternative fuel and, for large-scale combustion, another plant in the district heating system would be affected, which in many cases would be fired with biomass when viewed from a Swedish perspective. This assumption may be crucial and will be tested in a sensitivity analysis. Generated electricity from the large-scale combustion plant will enter the Nordic electricity market for which a marginal mix comprising 90% coal and natural gas has been applied [22].
2.2.2. Flows Not Followed from Cradle to Grave
Horse manure is characterized as waste, meaning a zero burden assumption. For woodchip bedding, the upstream emissions due to forestry etc. are not included since woodchips can be seen as a by-product from saw mills where all environmental impact is allocated on the main products.
2.2.3. Data Quality
Data sources on horse manure treatment are scarce. Regarding horse manure itself, several studies have been compiled and compared and average values have been used. However, with respect to processes, often just one data source per treatment process has been found. Against this background, the LCA can be characterized as explorative and the results should be interpreted with caution.
2.3. Life Cycle Impact Assessment
Emissions are characterized using the CML 2001 baseline scenario [24]. Global warming [25], acidification [26], and eutrophication [27] have been selected as impact categories according to data availability and quality. The method as such is old, but data in the method are constantly updated on the CML website and also provided in state-of-the-art LCA tools such as SimaPro, making it one of the most used EIA methods. Another impact assessment method could have been used, but in terms of emissions many mid-point methods give similar prioritization [28].
3. Results
In Table 2, contributions to the different functional units from the five scenarios are shown.
The results are presented in two parts; the first part displays LCA results in absolute numbers for all scenarios with respect to waste management system (core system) and compensatory system and the second part displays LCA results in absolute numbers for all scenarios and processes. This section contains part one while part two is found in Appendix B. Additionally, a sensitivity analysis is included, which analyses the importance of assumptions with potential impact on the final result. An uncertainty analysis is included in the discussion. General descriptions of technologies and assumptions are presented in Section 2.2.1.
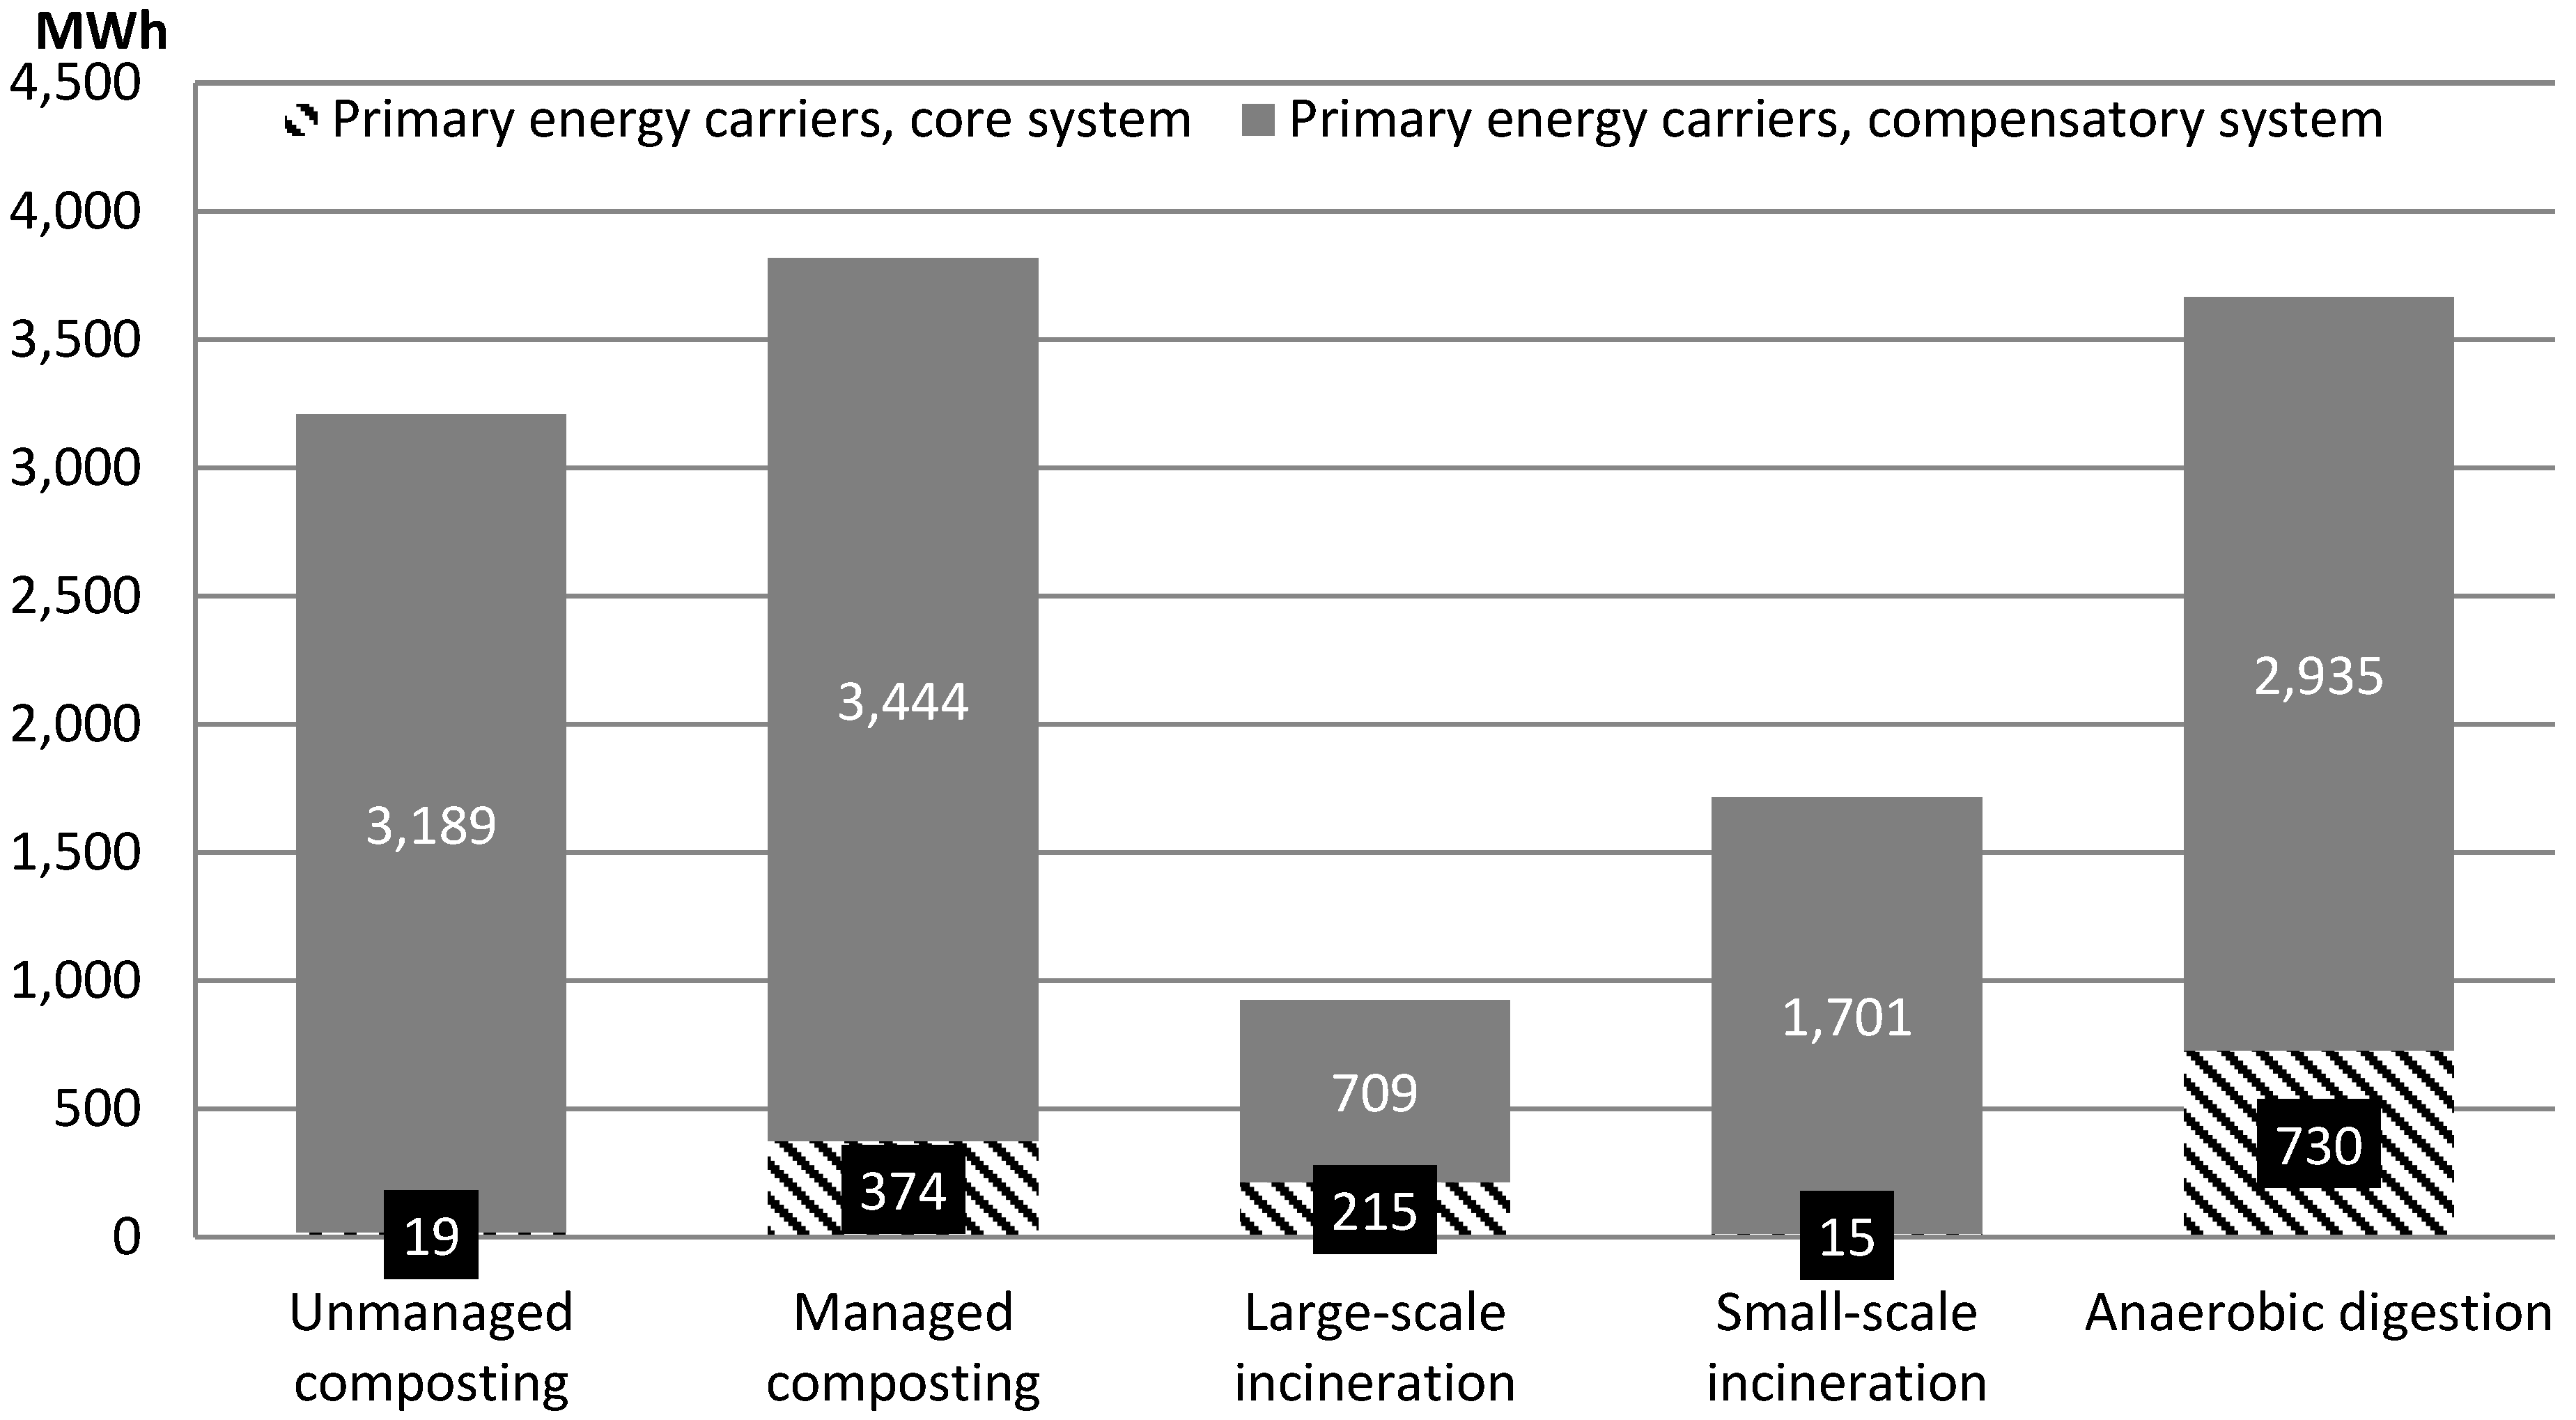
Figure 2 shows that composting and anaerobic digestion scenarios use more resources than incineration, which is related to the addition of almost 2000 MWh in the biomass-fueled compensatory district heating system. For all scenarios, the added contribution from the compensatory system is larger than from the waste management system. Compensatory electricity and vehicle fuel are of less importance and the lowest contribution comes from the production of mineral fertilizer.
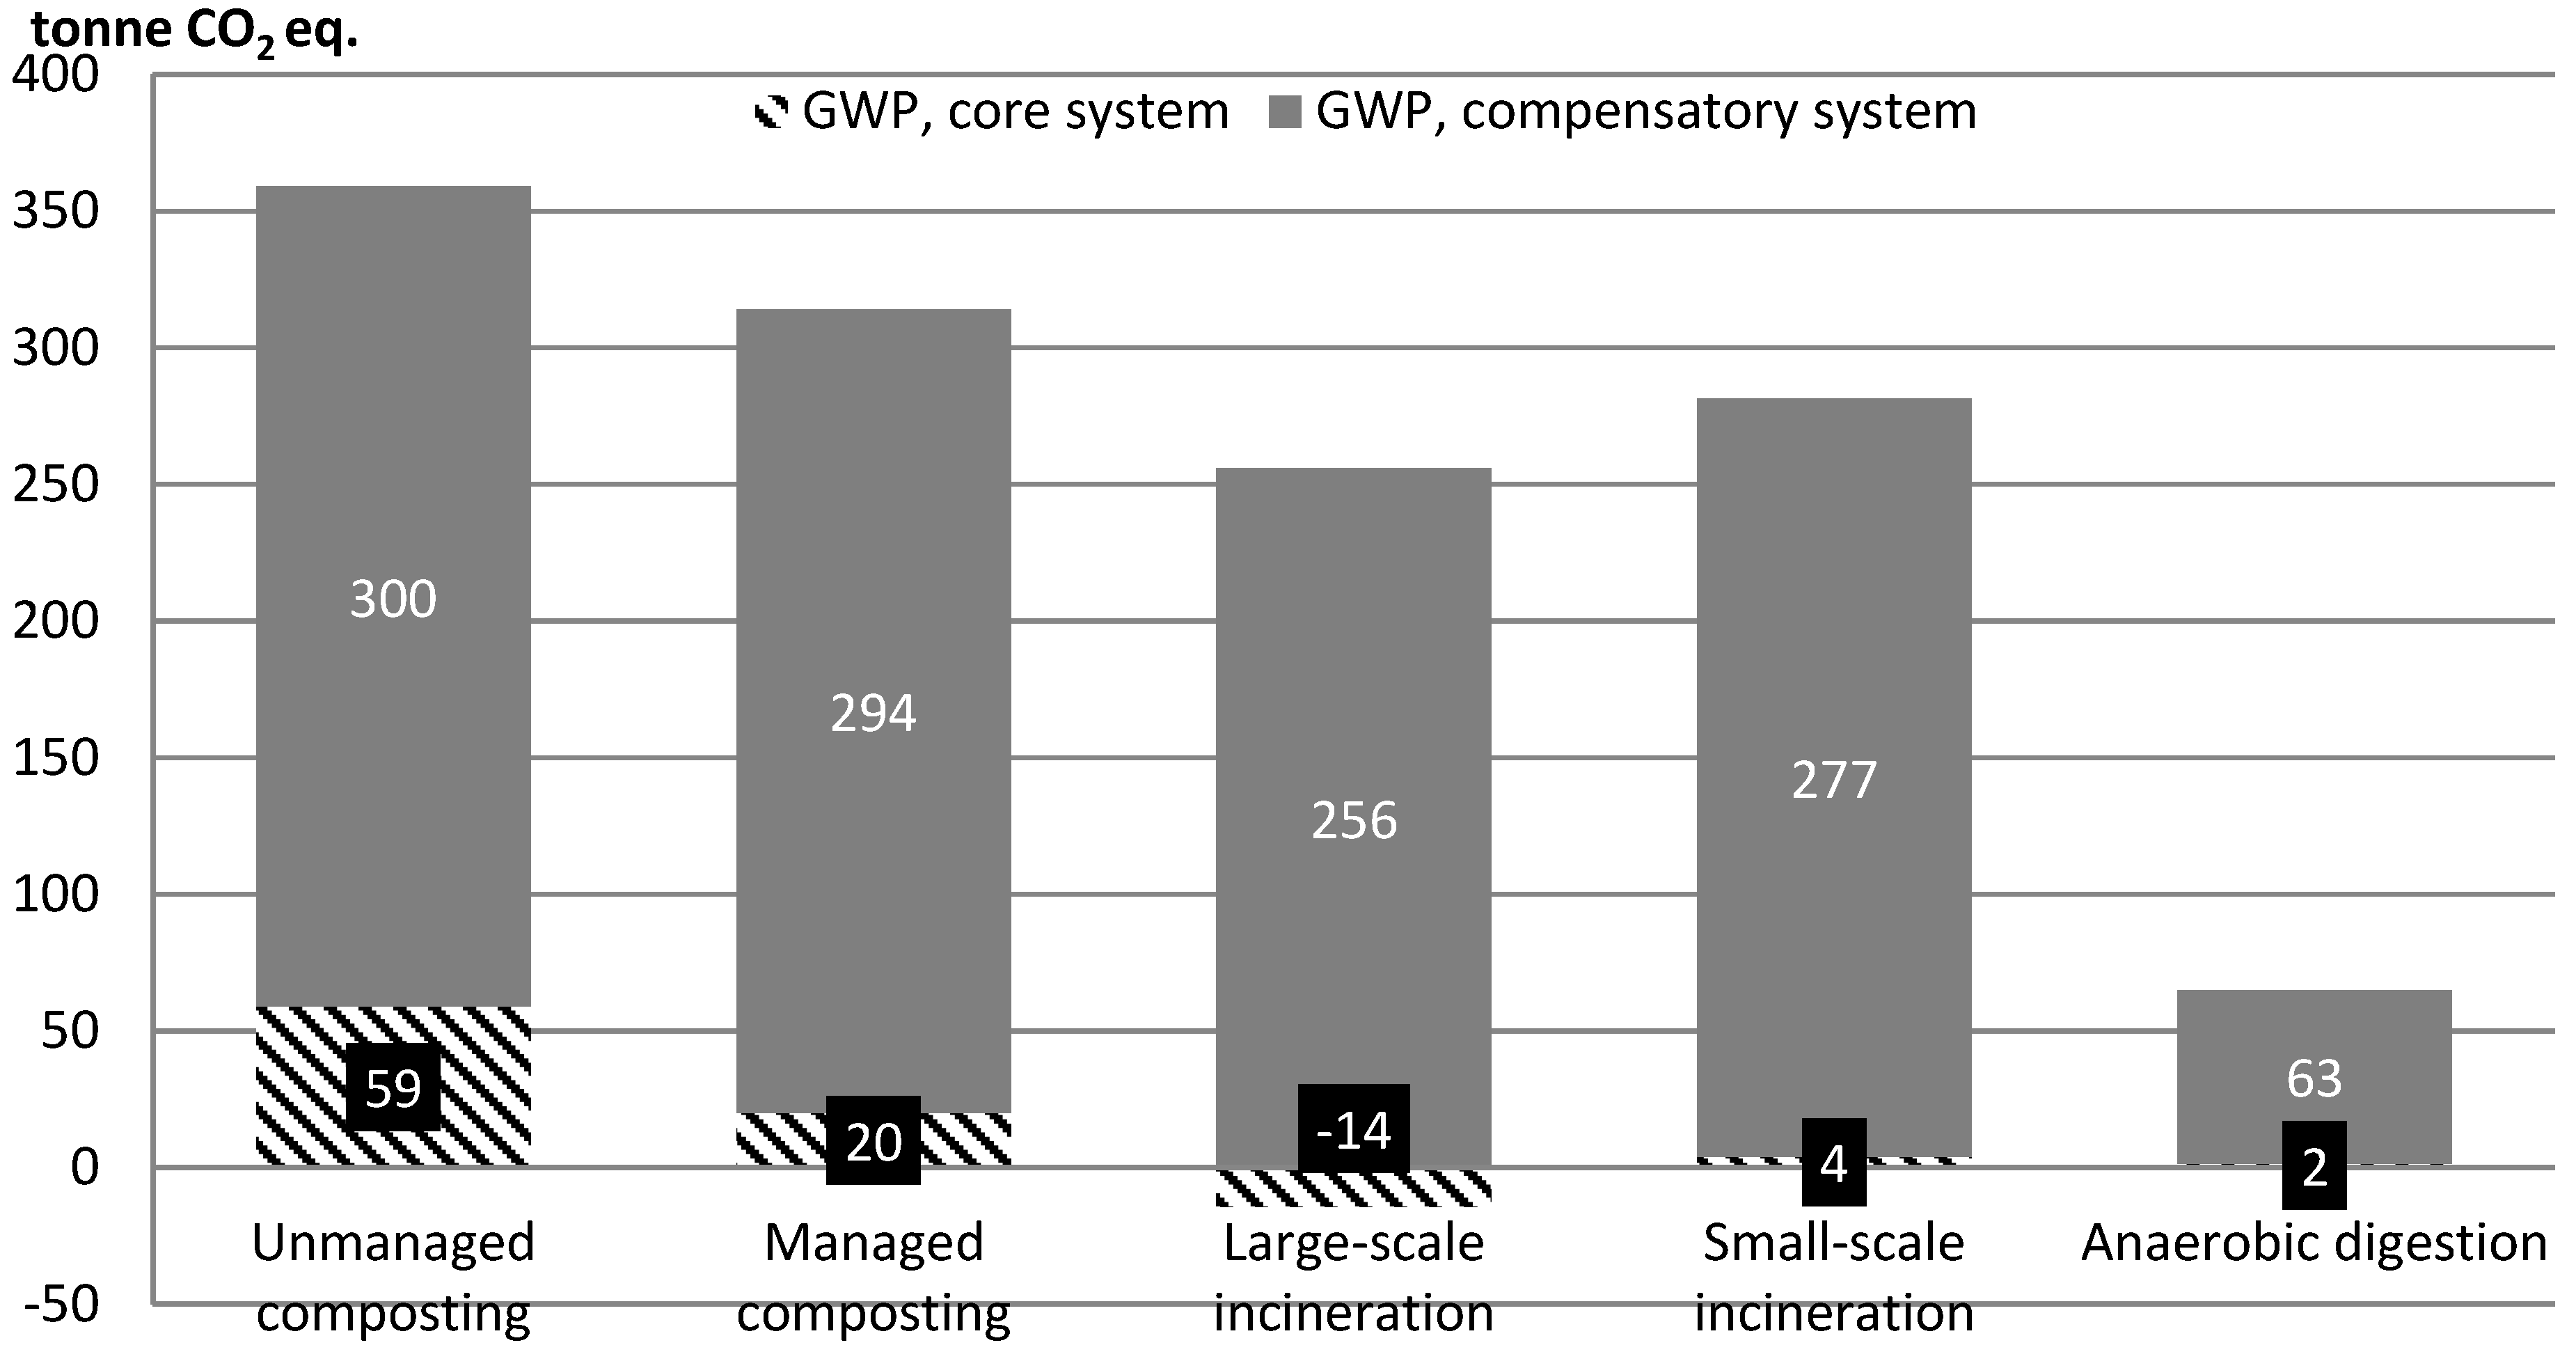
Anaerobic digestion is the most efficient method in terms of emissions of greenhouse gases (GWP) as all other methods generate emissions which are 3.5–5.5 times higher (Figure 3). This is mainly due to the relatively large savings when biogas replaces fossil fuels in vehicle transport. While CO2 emissions from the waste management system are modest due to low emissions of CO2, CH4, etc., and the effect of a carbon sink (negative emissions in the large-scale incineration scenario), such emissions are much higher for fossil vehicle fuels, adding approximately 220 tonnes for composting and incineration scenarios.
For acidification, the added contribution from the compensatory system is larger than from the waste management system for all scenarios except incineration, see Figure 4. In particular, emissions from small-scale incineration exceed the contribution from the compensatory system. Small-scale incineration gives an extremely high impact and the process data show a high release of nitrogen oxides for the drying process prior to combustion, as well as high NOx emissions due to a lack of proper reduction equipment. Anaerobic digestion is comparable to composting with approximately 3 tonnes SO2 equivalents.
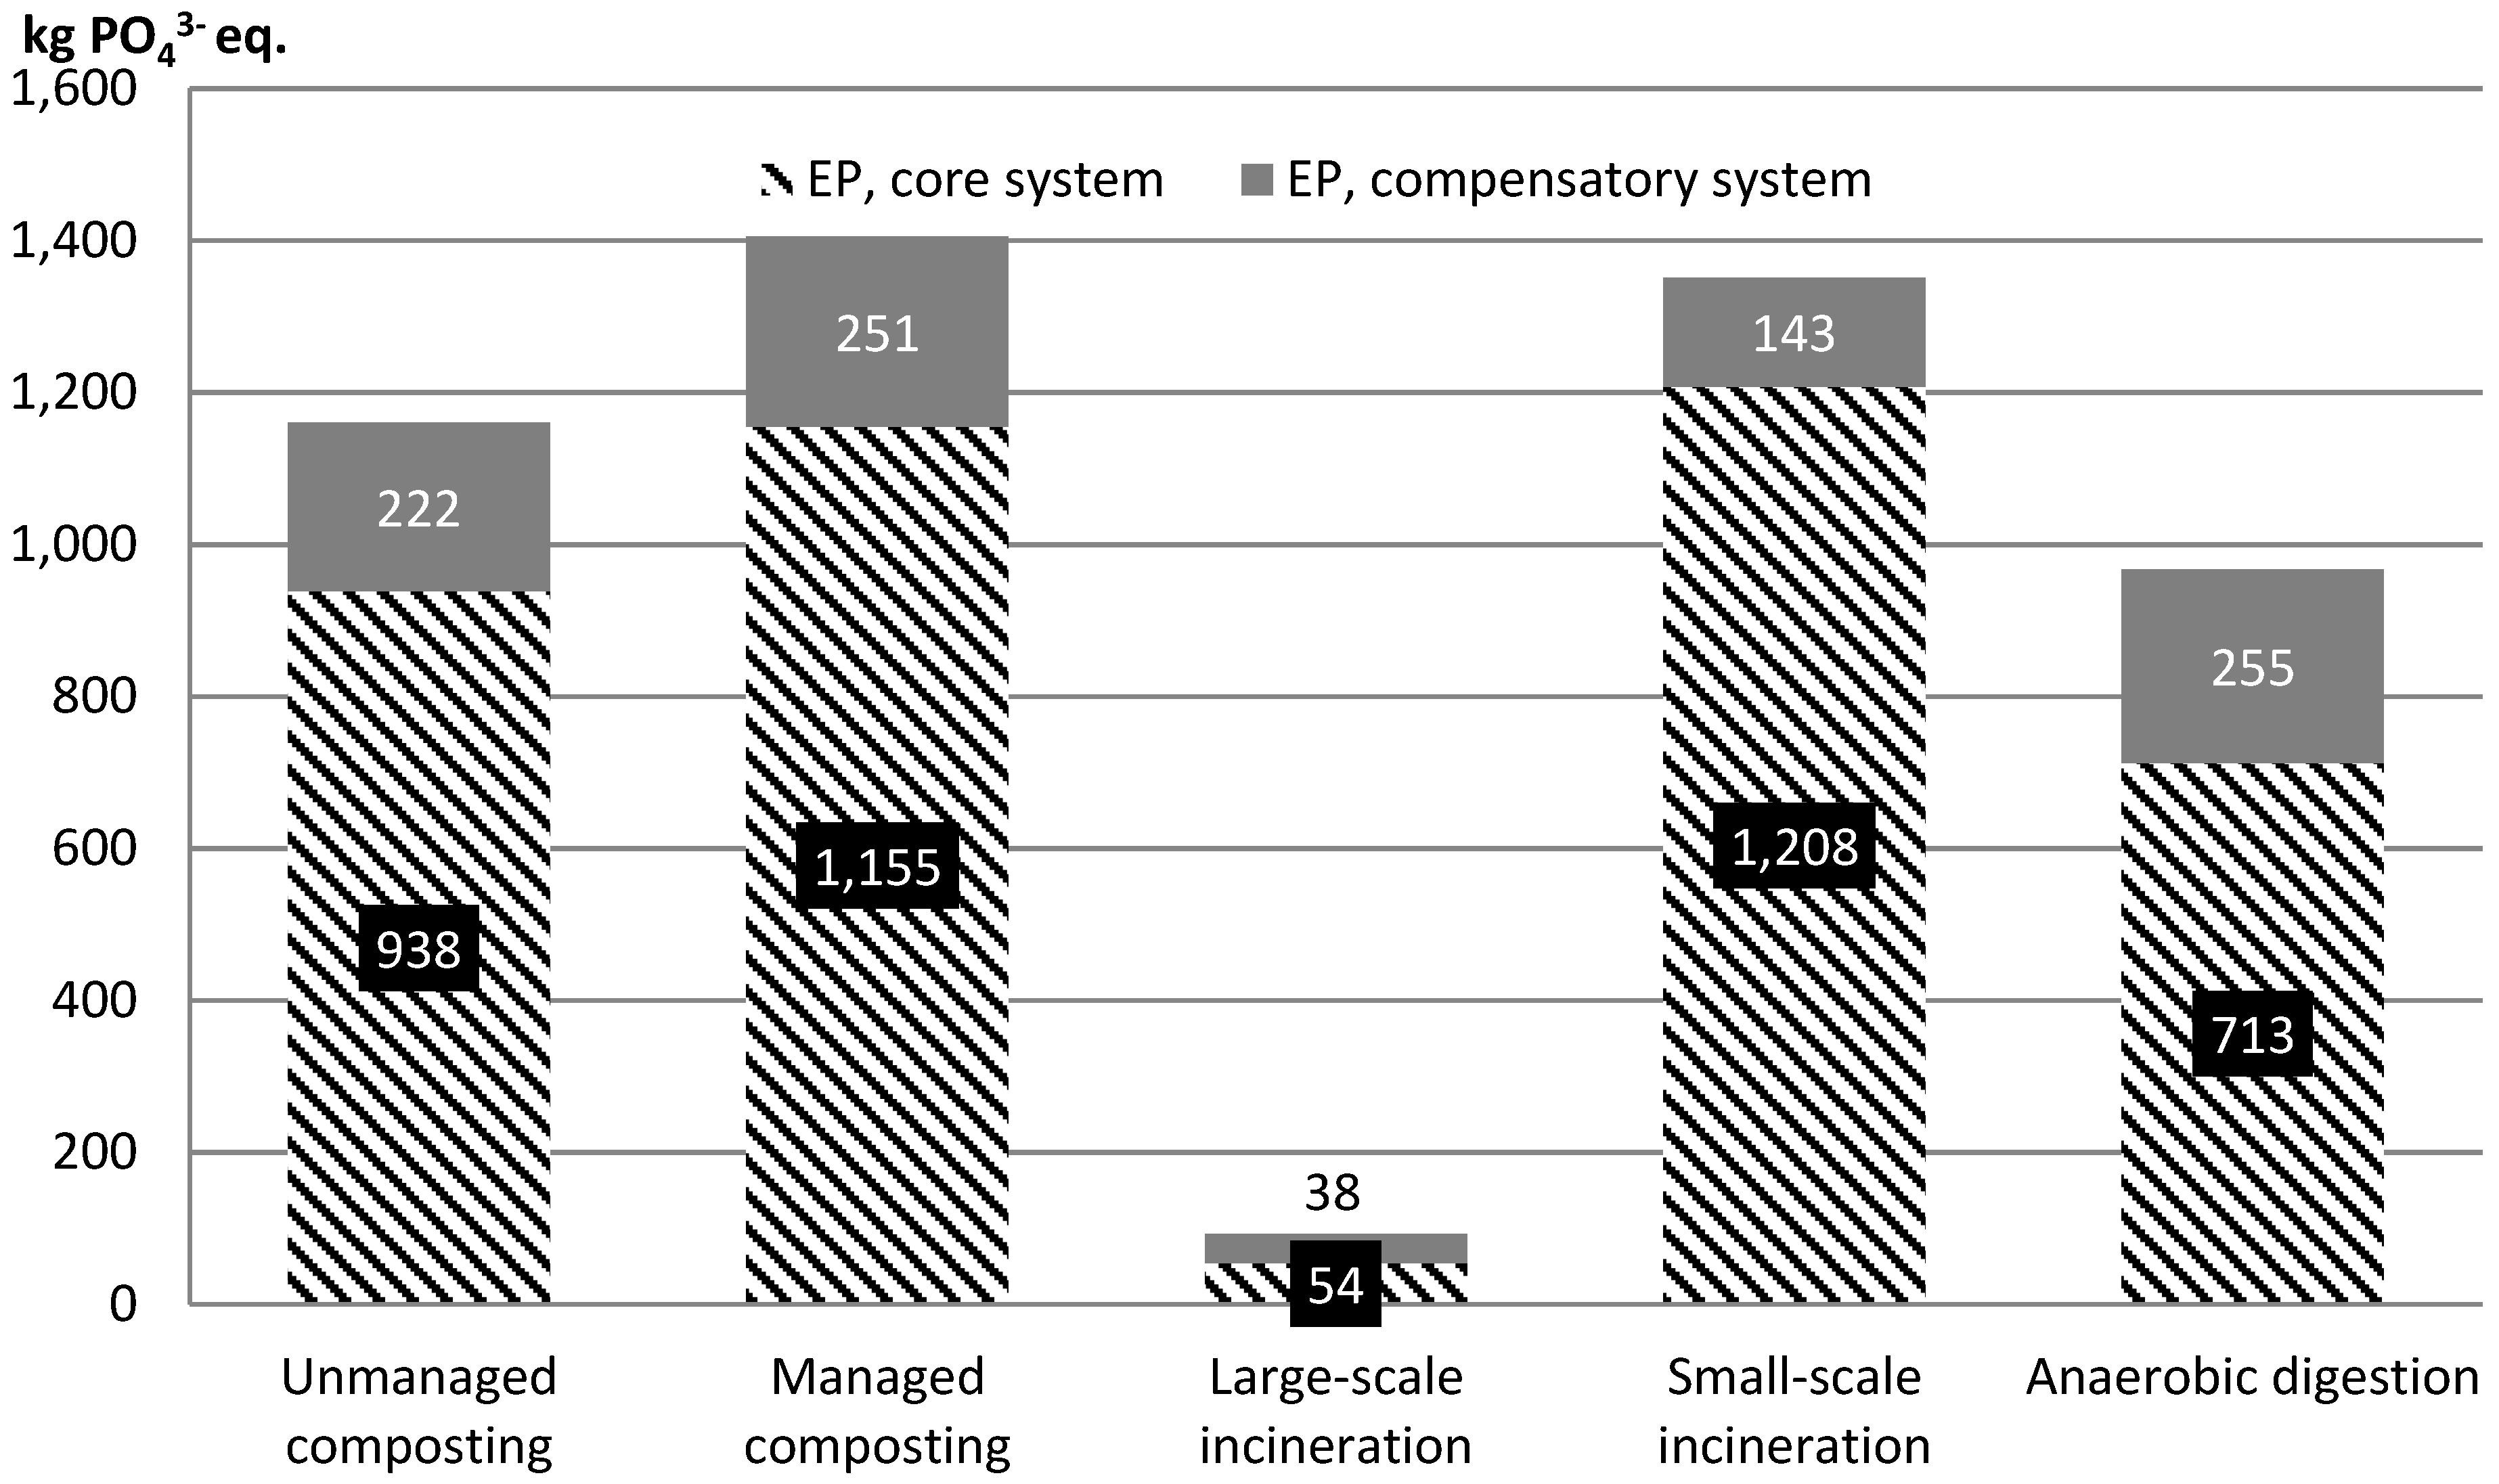
Large-scale incineration is equipped with efficient air pollution control in terms of NOx, leaving this method with extremely low eutrophication emissions (Figure 5). The second lowest is the anaerobic digestion scenario. For all treatment methods, additional emissions from the compensatory system are lower compared to internal emissions since compensatory electricity (coal condensing power) generates modest NOx emissions compared to emissions released from handling of manure, independent of the type of treatment.
The assessment also includes a sensitivity analysis where different potentially important assumptions are tested for their impact on the result and conclusions. The importance of choice of bedding material to anaerobic digestion has been shown in a previous study [2]. This study comprises two separate analyses, which are shown in Table 3.
Changing the alternative heat source from biomass (renewable) to coal, for example, would be very beneficial to the use of manure in the incineration scenarios. The compensatory heat from biomass releases 41 tonnes CO2 for 2 MWh of heat (20 tonne CO2/MWh). The difference in GWP between anaerobic digestion and large-scale incineration is 177 tonnes of CO2. If the CO2 emission factor from combustion of fuel for compensatory heat becomes approximately four times higher (177/41 = 4.3, 86 tonne CO2/MWh), the climate impact will actually be the same for the incineration and anaerobic digestion scenarios. Typical emission factors for heat from coal are considerably higher than that. Whereas a change of the alternative fuel for electricity (from fossil to renewable) will favor anaerobic digestion and composting, since the CO2 emissions from compensatory electricity (22 tonnes) then will be close to zero. This means the assessment is very sensitive to the assumed alternative heat source. The underlying explanation is two-fold: (1) the amount of heat to be replaced is much higher than the amount of electricity; and (2) in terms of energy, much more biogas (2678 GJ) is produced from anaerobic digestion (which replaces fossil fuels) than electricity (1146 GJ) generated from large-scale incineration (which also off-sets fossil fuels).
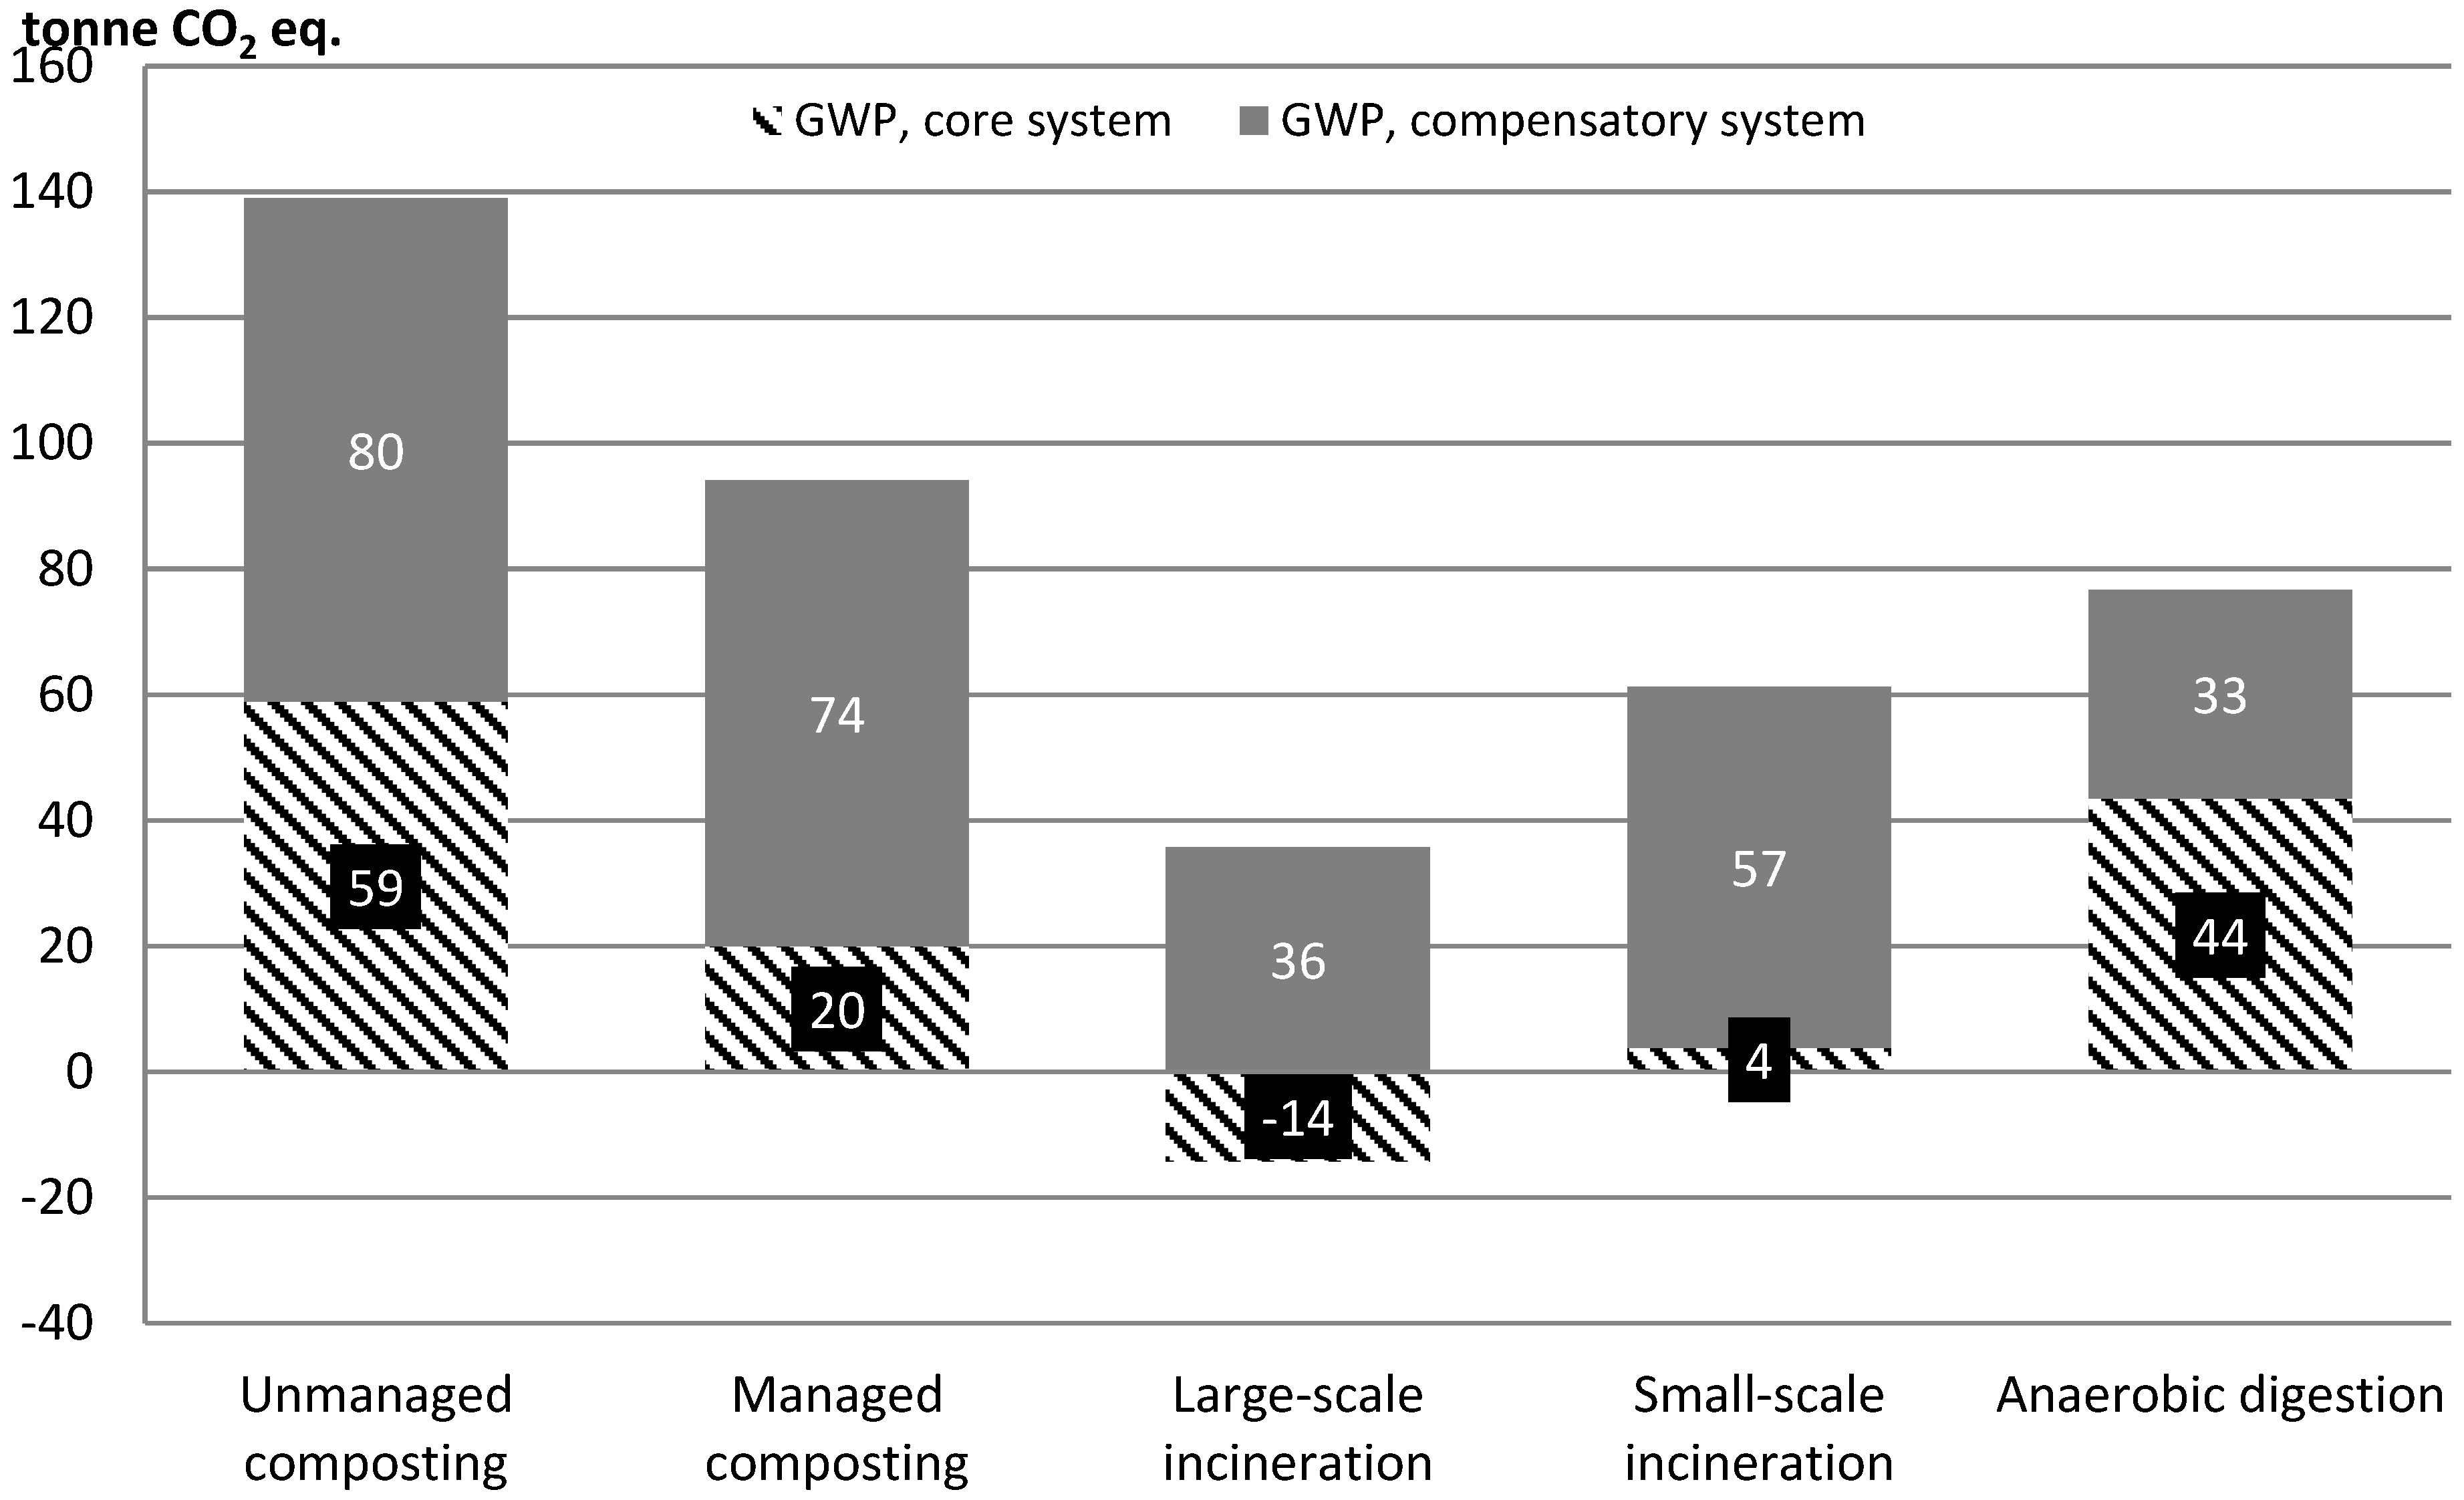
The second analysis concerns biogas offsetting where upgrading and vehicle fuel was changed to combustion of raw biogas in a gas engine producing heat and electricity. The difference in energy recovery is shown in Table 4.
The contribution from the core system is the same for all scenarios except anaerobic digestion where methane emissions from the internal combustion engine (ICE) increase the GWP. The contribution from the compensatory system is drastically decreased as compensation for vehicle fuel is no longer included. Despite this, the order of ranking between treatment alternatives is unchanged, except for anaerobic digestion now being comparable to managed composting. For anaerobic digestion, the decrease in emissions from compensatory heat and power (30 tonnes) is considerably lower than the decrease in compensatory petrol and diesel (220 tonnes). This emphasizes the importance of using biogas in the transport sector.
4. Discussion
Previously, the ORWARE model has been used for systems analysis of municipal solid waste management where data are fairly well documented. This is not the case for the treatment of horse manure. This implies that the assessment suffers from greater uncertainties than usual. Some comments on data availability and uncertainty can be made, however. Data for unmanaged composting is based on a robust sub-model for open windrow composting where processes such as leachate production and cleaning, biofilter, and compost offset have been modified based on assumptions (Table A3 in Appendix A). Data from measurements on stockpiling of horse manure would have been preferred but such data have not been found. For managed composting (drum composting) data from a fairly new report have been used [3], but these findings have not been subject to peer review. For large-scale incineration, no specific data for horse manure have been used as it is co-combusted as a minor share of the total waste volume, which does not affect parameters such as emission factors, degree of efficiency, etc. Under these circumstances the results are valid, but not in situations where these parameters are affected. Data for small-scale incineration of horse manure are very limited; only one report was found containing some process data [13]. Due to this low data availability, the data found could not be benchmarked. Some remarks on the data have been pointed out in earlier reports [21,22]. This is of course unsatisfactory, but reasonable given the novelty of this assessment.
Equally important is the question of what is not included in the assessment. For example, emissions from storage of horse manure close to stables are not included due to data insufficiency. These emissions are of course the same for all alternatives, but in order to map and explore the hotspots in the life cycle of horse manure, this may be as important as the choice of proper treatment. Storage should be covered in order to avoid methane and ammonia emissions (and the associated loss of nutrients) and precipitation, but previous investigations show that storages are often open [1]. The distance for collection and transport was assumed to be equal for all treatment methods, which of course is not the case in reality. A site-specific study would reveal any changes in conclusion due to different transport distances, but in general manure is seldom subject to long distance transport due to economic constraints. Another issue which could alter the results is if the model took account of biofertilizer and compost substituting peat with respect to organic carbon. This would benefit composting and anaerobic digestion; however, it is unclear how much. If heat from combustion of horse manure replaces heat from biomass CHP, some electricity generation will be lost due to different power-to-heat ratios for incineration and biomass combustion. This effect has not been taken into consideration.
Judging from the results, it seems that large-scale incineration is the most promising option. This is mainly due to the fact that local emissions, which contribute to acidification and eutrophication, are avoided but also due to the generation of electricity which is often important in this type of consequential LCA. The fact that incineration as CHP has these advantages over other methods of treatment are well known from similar LCAs of waste management [15] and the same conclusion seems also to apply to horse manure. It should however be noted that for climate change, anaerobic digestion is preferable, largely thanks to the carbon sink created in the recycling of nutrients. The conclusion from the sensitivity analysis is that the assessment is very sensitive to the assumptions regarding alternative heat sources and whether the biogas is used in vehicles (as is often the case in Sweden) or in heat and power generation (as in many other European countries, such as Germany and Denmark). In light of these indicative results, it would be interesting to follow up on whether the owners of waste incineration plants are interested in receiving the horse manure. If they are, is it financially viable for horse keepers? If further investigations showed that combustion in many cases would not be a realistic option, for financial or other reasons, this study suggests designing a combination system that includes a digester. In the same vein as the disposal of household waste [15], collection and transport of horse manure is of secondary importance environmentally, while it has larger, and in this case perhaps decisive, importance economically. Biogas CHP would be more competitive if made at a large scale. The sensitivity test using a small-scale gas engine for electricity generation instead of upgrading raw biogas to be used in vehicles did not improve the overall environmental performance. This suggests biogas is most environmentally competitive when used in vehicles unless heat can be recovered in CHP offsetting fossil fuels.
The environmental impact from eutrophication in the current study is slightly higher for composting (managed and unmanaged) than for anaerobic digestion. Bellino et al. [29] indicated nitrogenous emissions as more apparent in the use of horse manure for composting than in anaerobic digestion. Also, the indicated GWP results are in agreement with Bellino et al. [29], lower for anaerobic digestion than for composting. For primary energy demand, this study shows marginal differences between composting and anaerobic digestion while Bellino et al. [29] shows less energy consumption for the anaerobic digestion system compared to the composting system as a result of avoided production of electricity and heat.
It is certainly not a simple task to identify which factors are crucial to the outcome; however, it is possible to list relevant factors without grading them mutually. Such a list is found in Table 5.
5. Conclusions
Conclusions from the study’s indicative results are that anaerobic digestion is the most efficient treatment method in terms of greenhouse gases (GWP) while large-scale incineration saves both primary energy demand and emissions contributing to acidification and eutrophication, in comparison to anaerobic digestion. Primary energy is also saved in unmanaged composting and small-scale incineration and acidification potential is lower in unmanaged and managed composting compared to anaerobic digestion. The two composting treatment methods as well as small-scale incineration indicate higher emissions contributing to eutrophication, and small-scale incineration also indicates higher acidification potential compared to anaerobic digestion. The benefits of small-scale incineration are probably not fully shown due to data insufficiency. Choice of alternative heat source and biogas utilization can be decisive in the assessment.
The results are interpreted as indicative as the study suffers from data uncertainties in for example the small-scale incineration process, lacking information about electricity use and ash and slag. There is also poor validation of the biogas process in the absence of other studies on LCA of biogas from horse manure. Some key assumptions from the scenarios can play an important role for the results, e.g., the choice of softwood bedding regarded as a zero burden product in the system. The assumption that 50% of the composted material from unmanaged composting is left unutilized may contribute to the increased environmental impact.
Acknowledgments
We would like to thank Region Gävleborg who supported the project financially. Lena Fluck worked for a time in the project as an intern and graduate student and assisted in finding information about dry fermentation from German sources. We have gratefully received comments on our work from Åke Nordberg and Anders Lagerkvist. The project as a whole was subject to external examination of Serina Ahlgren at Swedish University of Agricultural Science (SLU), Department of Energy and Technology.
Author Contributions
Ola Eriksson conceived and designed the study; all authors contributed in data inventory; Ola Eriksson performed modelling and simulations; all authors analyzed the results with Ola Eriksson as the main contributor; all authors wrote the paper.
Conflicts of Interest
The authors declare no conflict of interest. The founding sponsor had no role in the design of the study; in the collection, analyses, or interpretation of data; in the writing of the manuscript, nor in the decision to publish the results.
Appendix A. Life Cycle Inventory
Appendix A.1. Horse Manure and Bedding

Table A1.
Chemical composition of horse manure and bedding. References to data are found in [22]. BOD: Biological Oxygen Demand; and COD: Chemical Oxygen Demand.
| kg/kg TS | Horse Dung | Wood Chips |
|---|---|---|
| TS ratio | 2.35 × 10⁻¹ | 8.41 × 10⁻¹ |
| C-tot-biological | 3.36 × 10⁻¹ | 5.13 × 10⁻¹ |
| C-lignin | 2.23 × 10⁻² | 1.71 × 10⁻¹ |
| C-starch & sugar | 0.00 | 0.00 |
| C-fat | 6.71 × 10⁻³ | 0.00 |
| C-protein | 1.93 × 10⁻² | 0.00 |
| BOD | 0.00 | 0.00 |
| Volatile Substance | 8.87 × 10⁻¹ | 9.06 × 10⁻¹ |
| Total Solids | 1.00 | 1.00 |
| O-tot | 3.93 × 10⁻¹ | 3.05 ×10⁻¹ |
| H-tot | 6.42 × 10⁻² | 6.40 ×10⁻² |
| H2O | 0.00 | 0.00 |
| N-tot | 1.48 × 10⁻² | 8.00 ×10⁻³ |
| NH3/NH4+-N | 8.09 × 10⁻⁴ | 0.00 |
| S-tot | 3.00 × 10⁻³ | 8.36 × 10⁻⁴ |
| P-tot | 1.24 × 10⁻³ | 2.74 × 10⁻⁴ |
| Cl-tot | 2.80 × 10⁻³ | 1.40 × 10⁻³ |
| K | 1.91 × 10⁻³ | 2.12 × 10⁻³ |
| Ca | 1.00 × 10⁻² | 9.64 × 10⁻³ |
| Pb | 1.10 × 10⁻⁶ | 1.81 × 10⁻⁵ |
| Cd | 1.00 × 10⁻⁷ | 3.41 × 10⁻⁷ |
| Hg | 1.00 × 10⁻⁸ | 2.13 × 10⁻⁷ |
| Cu | 1.40 × 10⁻⁵ | 3.43 × 10⁻⁵ |
| Cr | 4.70 × 10⁻⁶ | 3.41 × 10⁻⁵ |
| Ni | 3.10 × 10⁻⁶ | 4.17 × 10⁻⁶ |
| Zn | 5.50 × 10⁻⁵ | 4.36 × 10⁻⁴ |
| C-cellulose | 2.88 × 10⁻¹ | 3.42 × 10⁻¹ |
| Particles | 0.00 | 0.00 |
| COD | 0.00 | 0.00 |
| C-tot-fossil | 0.00 | 7.82 × 10⁻³ |
| Fe | 0.00 | 9.45 × 10⁻⁴ |
Appendix A.2. Manure Collection
| Parameter | Truck | Unit |
|---|---|---|
| Trailer | No | - |
| Distance | 15 | km |
| Max load | 12 | tonnes |
| Average load | 8 | tonnes |
| Return transport | - | - |
| Fuel consumption, full | 0.35 | L/km |
| Fuel consumption, empty | 0.20 | L/km |
Appendix A.3. Composting
Table A3.
Composting process data. References to data are found in [21]. Data on unmanaged composting are mainly from drum composting of horse manure [3]. Collected manure is assumed to be free from foreign objects such as horseshoes etc. which may disturb the process, i.e., no reject is generated. The biofilter have cleaning efficiencies for methane (50%), laughing gas (90%), and ammonia (99%).
| Parameter | Unmanaged | Managed | |
|---|---|---|---|
| Oil consumption (L/tonne) | 0 | 3.3 | |
| Compost being used (%) | 50 | 100 | |
| Used in soil production | No | Yes | |
| Biofilter | No | Yes | |
| Air emissions (%) | Laughing gas, N2O | 0.25 | 0.27 |
| Ammonia, NH3 | 10 | 2.78 | |
| Methane, CH4 | 2 | 0.86 | |
| Water emissions (%) | Nitrogen, N-tot | 0.3 | 0.01 |
| Ammonia, NH4 | 0.004 | 0.01 | |
| Nitrate, NO3 | 0.033 | 0 | |
| Phosphorus, P-tot | 0.07 | 0 | |
Appendix A.4. Incineration
Table A4.
Process data on drying of horse manure prior to combustion (%). Data from [13].
| Parameter | Value | Unit |
|---|---|---|
| Heat requirement | 0.40 | MWh/tonne |
| TS loss | 9.7 | % |
| VS loss | 11.55 | % |
| C-tot lost as CO2 | 8.54 | % |
| Oxidation of nitrogen as NOx | 30.71 | % |
| Part NH4+ to NH3 | 100 | % |
| Degree of efficiency | 95 | % |
| TS ratio dry manure | 90 | % |
| Parameter | Small Scale | Large Scale | |
|---|---|---|---|
| Degree of efficiency (%) | 80 | 95 | |
| Part to electricity (%) | 0 | 14 | |
| Part to heating (%) | 100 | 86 | |
| Electricity requirement | - | 0.20 MJ/kg | |
| Air emissions | CO | 1.1281 kg/tonne | 1.42 × 10⁻⁵ kg/MJ |
| Dioxin | - | 2.57 × 10⁻¹⁵ kg/MJ | |
| N-NH3 | - | 1.39 × 10⁻⁶ kg/MJ | |
| N-NOx | 0.8179 kg/tonne | 1.1 × 10⁻⁵ kg/MJ | |
| N-N2O | - | 2.18 × 10⁻⁷ kg/MJ | |
| S-SOx | - | 1.36 × 10⁻² kg/kg S | |
| Dust (particles) | - | 0.66 mg/MJ | |
| HCl | - | 2.12 × 10⁻⁶ kg Cl/kg CO2 | |
| Ash and slag generation | No | Yes | |
| Part C-org found in slag 1 | - | 2% | |
1 Slag subject to landfill disposal will thus add to carbon sink.
Appendix A.5. Anaerobic Digestion
Table A6.
Share of methane from carbohydrates in raw gas from anaerobic digestion (%). Benchmarking with default values for food waste, adjustment made in the validation process to meet reasonable gas production as found in literature.
| Carbohydrate | Horse Manure | Food Waste |
|---|---|---|
| Cellulose and hemicellulose | 25 | 50 |
| Lignin | 25 | 50 |
| Sugar and starch | 25 | 50 |
| Fat | 69 | 69 |
| Protein | 78 | 78 |
Appendix A.6. Transport
Table A8.
Transport data. All transportation is done with truck and trailer with max load 35 tonnes. All transports are empty on return with fuel consumption of 0.5 L/km when full and 0.35 L/km when empty. AD: anaerobic digestion; Inc.: Incineration; and stor: storage.
| Parameter | Fly Ash | Slag | Vehicle Gas | Biofertlizer 1 | Compost |
|---|---|---|---|---|---|
| From | Inc. plant | Inc. plant | Upgrading | AD plant | Comp. plant |
| To | Landfill | Landfill | Fuel pump | Remote stor. | Remote stor. |
| Distance (km) | 15 | 15 | 50 | 50 | 50 |
| Average load (tonne) | 20 | 20 | 6 | 20 | 20 |
1 Assumed to be pumpable, meaning some extra energy use for pumping. Pumping to the vehicle takes seven minutes and pumping from the vehicle takes five minutes with power 150 kW.
Appendix A.7. Application of Biofertilizer
Application of biofertilizer (digestate or compost) is modelled with losses of nitrogen using the existing ORWARE submodel. Biofertilizer is not completely degraded in one century. The model operates with the following data [30]:
- 30% of organic nitrogen and 30% of mineralized nitrogen is assumed to be available to plants;
- Emissions of laughing gas is assumed to 1.25% while 39% of the nitrogen is lost as nitrate;
- Slurry spreader is used during early autumn with harrowing within 1 h, resulting in ammonia losses of 3%;
- Compost is spread during late autumn with harrowing within 1 h, resulting in ammonia losses of 10%;
- Soil conditions are clay silt with moderate drainage conditions resulting in 55% of nitrogen losses by denitrification;
- For digestate 9% of C-org remains after 100 years (carbon sink);
- For compost 15% of C-org remains after 100 years (carbon sink).
Appendix A.8. Biogas Offsetting
Table A9.
Process data on water scrubber [31]. Clean gas is compressed to 230 bar.
| Process Parameter | Value | Unit |
|---|---|---|
| Methane slip | 0.5 | % |
| Part H2S in clean gas | 0.5 | ppm |
| Energy requirement, cleaning | 2.4 | MJ/Nm3 |
| Energy requirement, compression | 0.28 | MJ/Nm3 |
Table A10.
Data on biogas utilization. The ICE generates electricity (38%) and heat (52%) with some losses (10%).
| Parameter | Biogas Bus | Biogas Car | ICE | |
|---|---|---|---|---|
| Energy use (MJ/km) | 16.65 | 3.97 | ||
| Air emissions (mg/MJ) | CH4 | 124 | 26.62 | 430 |
| VOC | 113 | - | 4 | |
| NOx | 450 | 28.5 | 100 | |
| PM | 0.32 | 0 | - | |
| CO | - | 58.2 | 250 | |
| N2O | - | - | 20 | |
| SOx (kg S-SOx/kg S-tot) | - | - | 0.15 | |
Appendix A.9. Upstream and Compensatory System
Table A11.
Data on resource consumption and emissions for upstream (electricity and diesel) and compensatory production are from various selected references. FAME: fatty acid methyl esters.
| Part of the System | Data | Reference |
|---|---|---|
| District heating | Biofuel | [32] |
| Electricity | Marginal mix: | [33] |
| Coal power 81% | ||
| Natural gas 9% | ||
| Wind power 5% | ||
| Bio CHP 5% | ||
| Fuel for collection, transport, and replaced with biogas | Diesel with 5% FAME | [34] |
| Mineral fertilizer | NPK | [35] |
Appendix B. Detailed Results on Process Level
Appendix B.1. Primary Energy Use
| System Part | Unmanaged Composting | Managed Composting | Large-Scale Incineration | Small-Scale Incineration | Anaerobic Digestion |
|---|---|---|---|---|---|
| Manure collection | 14.1 | 14.1 | 14.1 | 14.1 | 14.1 |
| Incineration residues transport | 0.0 | 0.0 | 0.5 | 0.0 | 0.0 |
| Vehicle gas transport | 0.0 | 0.0 | 0.0 | 0.0 | 2.9 |
| Digestate and compost transport | 0.0 | 22.4 | 0.0 | 0.0 | 88.8 |
| Incineration with energy recovery | 0.0 | 0.0 | 198.8 | 0.0 | 0.0 |
| Composting | 2.0 | 330.2 | 0.0 | 0.0 | 0.0 |
| Anaerobic digestion | 0.0 | 0.0 | 0.0 | 0.0 | 267.9 |
| Biogas upgrading | 0.0 | 0.0 | 0.0 | 0.0 | 332.6 |
| Biogas buses | 0.0 | 0.0 | 0.0 | 0.0 | 0.0 |
| Biogas cars | 0.0 | 0.0 | 0.0 | 0.0 | 0.0 |
| Biofertilizer land application | 0.0 | 5.7 | 0.0 | 0.0 | 18.1 |
| Arable land | 0.0 | 0.0 | 0.0 | 0.0 | 0.0 |
| Landfill disposal | 2.2 | 0.0 | 0.9 | 0.0 | 0.0 |
| Carbon sink | 0.0 | 0.0 | 0.0 | 0.0 | 0.0 |
| Upstream energy supply | 0.7 | 1.8 | 0.7 | 0.7 | 5.2 |
| Compensatory heat | 1931.7 | 1931.7 | 0.0 | 431.4 | 1931.7 |
| Compensatory electrical power | 615.9 | 889.5 | 53.5 | 613.9 | 1003.0 |
| Compensatory vehicle fuel | 601.9 | 601.9 | 601.9 | 601.9 | 0.0 |
| Compensatory nitrogen fertilizer | 38.3 | 20.8 | 50.8 | 50.8 | 0.5 |
| Compensatory phosphorous fertilizer | 1.2 | 0.0 | 2.5 | 2.5 | 0.0 |
| Compensatory potassium fertilizer | 0.2 | 0.0 | 0.4 | 0.4 | 0.0 |
Appendix B.2. Global Warming Potential
| System Part | Unmanaged Composting | Managed Composting | Large-Scale Incineration | Small-Scale Incineration | Anaerobic Digestion |
|---|---|---|---|---|---|
| Manure collection | 3.8 | 3.8 | 3.8 | 3.8 | 3.8 |
| Incineration residues transport | 0.0 | 0.0 | 0.1 | 0.0 | 0.0 |
| Vehicle gas transport | 0.0 | 0.0 | 0.0 | 0.0 | 0.8 |
| Digestate and compost transport | 0.0 | 6.1 | 0.0 | 0.0 | 24.0 |
| Incineration with energy recovery | 0.0 | 0.0 | 13.0 | 0.0 | 0.0 |
| Composting | 155.4 | 14.5 | 0.0 | 0.0 | 0.0 |
| Anaerobic digestion | 0.0 | 0.0 | 0.0 | 0.0 | 18.4 |
| Biogas upgrading | 0.0 | 0.0 | 0.0 | 0.0 | 6.0 |
| Biogas buses | 0.0 | 0.0 | 0.0 | 0.0 | 4.1 |
| Biogas cars | 0.0 | 0.0 | 0.0 | 0.0 | 0.9 |
| Biofertilizer land application | 0.0 | 2.9 | 0.0 | 0.0 | 9.4 |
| Arable land | 10.4 | 23.5 | 0.0 | 0.0 | 9.8 |
| Landfill disposal | 38.3 | 0.0 | 0.2 | 0.0 | 0.0 |
| Carbon sink | −149.1 | −29.3 | −31.5 | 0.0 | −71.1 |
| Upstream energy supply | 0.2 | 1.2 | 0.2 | 0.2 | 0.8 |
| Compensatory heat | 40.6 | 40.6 | 0.0 | 9.1 | 40.6 |
| Compensatory electrical power | 13.8 | 19.9 | 1.2 | 13.8 | 22.5 |
| Compensatory vehicle fuel | 220.1 | 220.1 | 220.1 | 220.1 | 0.0 |
| Compensatory nitrogen fertilizer | 24.8 | 13.4 | 32.9 | 32.9 | 0.3 |
| Compensatory phosphorous fertilizer | 0.7 | 0.0 | 1.4 | 1.4 | 0.0 |
| Compensatory potassium fertilizer | 0.1 | 0.0 | 0.2 | 0.2 | 0.0 |
Appendix B.3. Acidification Potential
| System Part | Unmanaged Composting | Managed Composting | Large-Scale Incineration | Small-Scale Incineration | Anaerobic Digestion |
|---|---|---|---|---|---|
| Manure collection | 5.5 | 5.5 | 5.5 | 5.5 | 5.5 |
| Incineration residues transport | 0.0 | 0.0 | 0.2 | 0.0 | 0.0 |
| Vehicle gas transport | 0.0 | 0.0 | 0.0 | 0.0 | 1.1 |
| Digestate and compost transport | 0.0 | 8.8 | 0.0 | 0.0 | 34.8 |
| Incineration with energy recovery | 0.0 | 0.0 | 218.7 | 7239.8 | 0.0 |
| Composting | 1330.3 | 311.9 | 0.0 | 0.0 | 0.0 |
| Anaerobic digestion | 0.0 | 0.0 | 0.0 | 0.0 | 3.6 |
| Biogas upgrading | 0.0 | 0.0 | 0.0 | 0.0 | 0.0 |
| Biogas buses | 0.0 | 0.0 | 0.0 | 0.0 | 299.8 |
| Biogas cars | 0.0 | 0.0 | 0.0 | 0.0 | 19.0 |
| Biofertilizer land application | 0.0 | 15.0 | 0.0 | 0.0 | 791.5 |
| Arable land | 0.0 | 0.0 | 0.0 | 0.0 | 0.0 |
| Landfill disposal | 54.4 | 0.0 | 0.4 | 0.0 | 0.0 |
| Carbon sink | 0.0 | 0.0 | 0.0 | 0.0 | 0.0 |
| Upstream energy supply | 2.2 | 13.0 | 2.1 | 2.0 | 15.8 |
| Compensatory heat | 465.2 | 465.2 | 0.0 | 103.9 | 465.2 |
| Compensatory electrical power | 1181.0 | 1705.6 | 102.5 | 1177.2 | 1923.2 |
| Compensatory vehicle fuel | 35.5 | 35.5 | 35.5 | 35.5 | 0.0 |
| Compensatory nitrogen fertilizer | 27.6 | 15.0 | 36.6 | 36.6 | 0.3 |
| Compensatory phosphorous fertilizer | 13.6 | 0.0 | 27.2 | 27.2 | 0.0 |
| Compensatory potassium fertilizer | 1.3 | 0.0 | 2.6 | 2.6 | 0.0 |
Appendix B.4. Eutrophication Potential
| System Part | Unmanaged Composting | Managed Composting | Large-Scale Incineration | Small-Scale Incineration | Anaerobic Digestion |
|---|---|---|---|---|---|
| Manure collection | 1.5 | 1.5 | 1.5 | 1.5 | 1.5 |
| Incineration residues transport | 0.0 | 0.0 | 0.1 | 0.0 | 0.0 |
| Vehicle gas transport | 0.0 | 0.0 | 0.0 | 0.0 | 0.3 |
| Digestate and compost transport | 0.0 | 2.4 | 0.0 | 0.0 | 9.4 |
| Incineration with energy recovery | 0.0 | 0.0 | 47.6 | 1206.3 | 0.0 |
| Composting | 290.0 | 71.5 | 0.0 | 0.0 | 0.0 |
| Anaerobic digestion | 0.0 | 0.0 | 0.0 | 0.0 | 0.8 |
| Biogas upgrading | 0.0 | 0.0 | 0.0 | 0.0 | 0.0 |
| Biogas buses | 0.0 | 0.0 | 0.0 | 0.0 | 77.9 |
| Biogas cars | 0.0 | 0.0 | 0.0 | 0.0 | 4.9 |
| Biofertilizer land application | 0.0 | 3.3 | 0.0 | 0.0 | 168.6 |
| Arable land | 9.4 | 21.3 | 0.0 | 0.0 | 8.9 |
| Landfill disposal | 11.6 | 0.0 | 0.1 | 0.0 | 0.0 |
| Carbon sink | 0.0 | 0.0 | 0.0 | 0.0 | 0.0 |
| Upstream energy supply | 0.2 | 1.4 | 0.2 | 0.2 | 1.5 |
| Compensatory heat | 111.4 | 111.4 | 0.0 | 24.9 | 111.4 |
| Compensatory electrical power | 87.8 | 126.8 | 7.6 | 87.5 | 143.0 |
| Compensatory vehicle fuel | 4.1 | 4.1 | 4.1 | 4.1 | 0.0 |
| Compensatory nitrogen fertilizer | 15.7 | 8.5 | 20.8 | 20.8 | 0.2 |
| Compensatory phosphorous fertilizer | 0.7 | 0.0 | 1.3 | 1.3 | 0.0 |
| Compensatory potassium fertilizer | 0.1 | 0.0 | 0.2 | 0.2 | 0.0 |
| System Part | Unmanaged Composting | Managed Composting | Large-Scale Incineration | Small-Scale Incineration | Anaerobic Digestion |
|---|---|---|---|---|---|
| Manure collection | 0.0 | 0.0 | 0.0 | 0.0 | 0.0 |
| Incineration residues transport | 0.0 | 0.0 | 0.0 | 0.0 | 0.0 |
| Vehicle gas transport | 0.0 | 0.0 | 0.0 | 0.0 | 0.0 |
| Digestate and compost transport | 0.0 | 0.0 | 0.0 | 0.0 | 0.0 |
| Incineration with energy recovery | 0.0 | 0.0 | 0.0 | 0.0 | 0.0 |
| Composting | 8.8 | 0.1 | 0.0 | 0.0 | 0.0 |
| Anaerobic digestion | 0.0 | 0.0 | 0.0 | 0.0 | 0.0 |
| Biogas upgrading | 0.0 | 0.0 | 0.0 | 0.0 | 0.0 |
| Biogas buses | 0.0 | 0.0 | 0.0 | 0.0 | 0.0 |
| Biogas cars | 0.0 | 0.0 | 0.0 | 0.0 | 0.0 |
| Biofertilizer land application | 0.0 | 0.0 | 0.0 | 0.0 | 0.0 |
| Arable land | 466.5 | 1053.5 | 0.0 | 0.0 | 438.8 |
| Landfill disposal | 150.5 | 0.0 | 4.9 | 0.0 | 0.0 |
| Carbon sink | 0.0 | 0.0 | 0.0 | 0.0 | 0.0 |
| Upstream energy supply | 0.0 | 0.0 | 0.0 | 0.0 | 0.0 |
| Compensatory heat | 0.0 | 0.0 | 0.0 | 0.0 | 0.0 |
| Compensatory electrical power | 0.0 | 0.0 | 0.0 | 0.0 | 0.0 |
| Compensatory vehicle fuel | 0.0 | 0.0 | 0.0 | 0.0 | 0.0 |
| Compensatory nitrogen fertilizer | 0.0 | 0.0 | 0.0 | 0.0 | 0.0 |
| Compensatory phosphorous fertilizer | 2.0 | 0.0 | 4.1 | 4.1 | 0.0 |
| Compensatory potassium fertilizer | 0.2 | 0.0 | 0.4 | 0.4 | 0.0 |
References
- Hadin, Å.; Eriksson, O.; Hillman, K. A review of potential critical factors in horse keeping for anaerobic digestion of horse manure. Renew. Sustain. Energy Rev. 2016, 65, 432–442. [Google Scholar] [CrossRef]
- Hadin, Å.; Eriksson, O. Horse manure as feedstock for anaerobic digestion. Waste Manag. 2016, 56, 506–518. [Google Scholar] [CrossRef] [PubMed]
- Rodhe, L.; Niklasson, F.; Oostra, H.; Gervind, P.; Ascue, J.; Tersmeden, M.; Ringmar, A. Managed Drum Composting with Minor Climate Impact—Emissions and Heat Recovery; JTI-Swedish Institute of Agricultural and Environmental Engineering: Uppsala, Sweden, 2015. [Google Scholar]
- Airaksinen, S.; Heinonen-Tanski, H.; Heiskanen, M. Quality of different bedding materials and their influence on the compostability of horse manure. J. Equine Vet. Sci. 2001, 21, 125–130. [Google Scholar] [CrossRef]
- Lundgren, J.; Pettersson, E. Combustion of horse manure for heat production. Bioresour. Technol. 2009, 100, 3121–3126. [Google Scholar] [CrossRef] [PubMed]
- Malgeryd, J.; Persson, T. Hästgödsel: En Naturlig Resurs; Jordbruksverket: Jönköping, Sweden, 2013. (In Swedish) [Google Scholar]
- Sindhöj, E.; Rodhe, L. (Eds.) Examples of Implementing Manure Processing Technology at Farm Level; JTI-Swedish Institute of Agricultural and Environmental Engineering: Uppsala, Sweden, 2013.
- Olsson, H.; Andersson, J.; Edström, M.; Rogstrand, G.; Persson, P.; Andersson, L.; Bobeck, S.; Assarsson, A.; Benjaminsson, A.; Jansson, A. Samrötning av Hästgödsel med Nötflytgödsel; JTI-Swedish Institute of Agricultural and Environmental Engineering: Uppsala, Sweden, 2014. [Google Scholar]
- Kalia, A.K.; Singh, S. Horse dung as a partial substitute for cattle dung for operating family-size biogas plants in a hilly region. Bioresour. Technol. 1998, 64, 63–66. [Google Scholar] [CrossRef]
- Cui, Z.; Shi, J.; Li, Y. Solid-state anaerobic digestion of spent wheat straw from horse stall. Bioresour. Technol. 2011, 102, 9432–9437. [Google Scholar] [CrossRef] [PubMed]
- Böske, J.; Wirth, B.; Garlipp, F.; Mumme, J.; Van den Weghe, H. Upflow anaerobic solid-state (UASS) digestion of horse manure: Thermophilic vs. mesophilic performance. Bioresour. Technol. 2015, 175, 8–16. [Google Scholar]
- Edström, M.; Schüßler, I.; Luostarinen, S. Combustion of Manure: Manure as Fuel in a Heating Plant; Baltic Manure: Jokioinen, Finland, 2011. [Google Scholar]
- Baky, A. Life Cycle Inventory & Assessment Report: Combustion of Horse Manure with Heat Utilisation, Sweden; Baltic Manure: Jokioinen, Finland, 2013. [Google Scholar]
- Eriksson, O.; Frostell, B.; Björklund, A.; Assefa, G.; Sundqvist, J.; Granath, J.; Carlsson, M.; Baky, A.; Thyselius, L. ORWARE—A simulation tool for waste management. Resour. Conserv. Recycl. 2002, 36, 287–307. [Google Scholar] [CrossRef]
- Eriksson, O.; Frostell, B.; Björklund, A.; Assefa, G.; Sundqvist, J.-O.; Granath, J.; Carlsson Reich, M.; Baky, A.; Thyselius, L. Municipal Solid Waste Management from a Systems Perspective. J. Clean. Prod. 2005, 13, 241–252. [Google Scholar] [CrossRef]
- Gentil, E.C.; Damgaard, A.; Hauschild, M.; Finnveden, G.; Eriksson, O.; Thorneloe, S.; Kaplan, O.; Barlaz, M.; Muller, O.; Matsui, Y.; et al. Models for waste life cycle assessment: Review of technical assumptions. Waste Manag. 2010, 30, 2636–2648. [Google Scholar] [CrossRef] [PubMed]
- Environmental Management–Life Cycle Assessment–Principles and Framework; ISO 14040: 2006; International Organization for Standardization: Geneva, Switzerland, 2006.
- General Guide for Life Cycle Assessment—Detailed Guidance. In International Reference Life Cycle Data System (ILCD) Handbook, 1st ed.; EUR 24708 EN; Publications Office of the European Union: Luxembourg, 2010.
- Eskilsson, J. Gödsel och Miljö 2014. Vägledningsmaterial för Lagring och Spridning av Gödsel, Höst-och Vinterbevuxen Mark; Växt-och Miljöavdelningen, Jordbruksverket: Jönköping, Sweden, 2013. [Google Scholar]
- Steineck, S.; Svensson, L.; Tersmeden, M.; Åkerhielm, H.; Karlsson, S. Miljöanpassad Hantering av Hästgödsel, Sustainable Handling of Horse Manure; JTI-Swedish Institute of Agricultural and Environmental Engineering: Uppsala, Sweden, 2001. [Google Scholar]
- Hennessy, J.; Eriksson, O. Energy and Nutrients from Horse Manure—Life-Cycle Data Inventory of Horse Manure Management Systems in Gävleborg, Sweden; Research Report 4; University of Gävle: Gävle, Sweden, 2015. [Google Scholar]
- Eriksson, O.; Hadin, Å.; Hennessy, J.; Jonsson, D. Horse Power and Nutrients—Sustainable System Solutions for Biogas and Digestate—Explorative System Analysis with the Computer Model ORWARE; FoU-Report nr 43; University of Gävle: Gävle, Sweden, 2015. (In Swedish) [Google Scholar]
- Enhäll, J.; Nordgren, M.; Kättström, H. Hästhållning i Sverige 2010; The Swedish Board of Agriculture: Jönköping, Sweden, 2012. [Google Scholar]
- Guinée, J.B.; Gorrée, M.; Heijungs, R.; Huppes, G.; Kleijn, R.; van Oers, L.; Wegener Sleeswijk, A.; Suh, S.; Udo de Haes, H.A.; de Bruijn, H.; et al. Life Cycle Assessment an Operational Guide to the ISO Standards, Volume 1, 2 en 3; Centre of Environmental Science Leiden University: Leiden, The Netherlands, 2001. [Google Scholar]
- Intergovernmental Panel on Climate Change. Climate Change 2007: The Physical Science Basis. Contribution of Working Group I to the Fourth Assessment. Report of the Intergovernmental Panel on Climate Change; Solomon, S., Qin, D., Manning, M., Chen, Z., Marquis, M., Averyt, K.B., Tignor, M., Miller, H.L., Eds.; Cambridge University Press: Cambridge, UK; New York, NY, USA, 2007; p. 996. [Google Scholar]
- Huijbregts, M. Life Cycle Impact Assessment of Acidifying and Eutrophying Air Pollutants. Calculation of Equivalency Factors with RAINS-LCA; Interfaculty Department of Environmental Science, Faculty of Environmental Science, University of Amsterdam: Amsterdam, The Netherlands, 1999. [Google Scholar]
- Heijungs, R.; Guinée, J.; Huppes, G.; Lankreijer, R.M.; de Haes, H.A.U.; Sleeswijk, A.W.; Ansems, A.M.M.; Eggels, P.G.; van Duin, R.; de Goede, H.P. Environmental Life Cycle Assessment of Products. Guide and Backgrounds; Centre of Environmental Sciense (CML), Leiden University: Leiden, The Netherlands, 1992. [Google Scholar]
- Finnveden, G.; Hauschild, M.Z.; Ekvall, T.; Guinée, J.; Heijungs, R.; Hellweg, S.; Koehler, A.; Pennington, D.; Suh, S. Recent developments in life cycle assessment. J. Environ. Manag. 2009, 91, 1–21. [Google Scholar] [CrossRef] [PubMed]
- Bellino, R.; Affeltranger, B.; Battistini, B.; Evanno, S.; Le Pochat, S. Comparative environmental assessment of two systems of agronomic and energetic valorisation of horse manure. In Proceedings of the 2nd LCA Conference, Lille, France, 6–7 November 2012; Volume 6, p. 7.
- Holmström, D.; Bisaillon, M.; Eriksson, O.; Hellström, H.; Nilsson, K. Framtida Marknaden för Biogas Från Avfall; SP Sveriges Tekniska Forskningsinstitut: Borås, Sweden, 2013. (In Swedish) [Google Scholar]
- Kovac, E. Uppgradering av Biogas i Systemperspektiv Med avseende på Miljöpåverkan och Kostnader. Master’s Thesis, Uppsala Universitet, Uppsala, Sweden, 2013. [Google Scholar]
- Brännström-Norberg, B.; Dethlefsen, U.; Johansson, R.; Setterwall, C.; Tunbrant, S. Life Cycle Analysis of Vattenfall’s Electricity Production, Summary Report; Vattenfall AB: Vällingby, Sweden, 1996. [Google Scholar]
- Bisaillon, M.; Sundberg, J.; Haraldsson, M.; Eriksson, O. Systemstudie Avfall i Göteborg. SP Sveriges Tekniska Forskningsinstitut; SP Sveriges Tekniska Forskningsinstitut: Borås, Sweden, 2010. (In Swedish) [Google Scholar]
- Gode, J.; Martinsson, F.; Hagberg, L.; Öman, A.; Höglund, J.; Palm, D. Miljöfaktaboken 2011; Värmeforsk Service AB: Stockholm, Sweden, 2011. (In Swedish) [Google Scholar]
- Davies, J.; Haglund, C. Life Cycle Inventory (LCI) of Fertiliser Production: Fertiliser Products Used in Sweden and Western Europe; SIK-Institutet för Livsmedel och Bioteknik: Göteborg, Sweden, 1999. [Google Scholar]
Figure 1.
System under study. Numbering refers to scenario numbering.
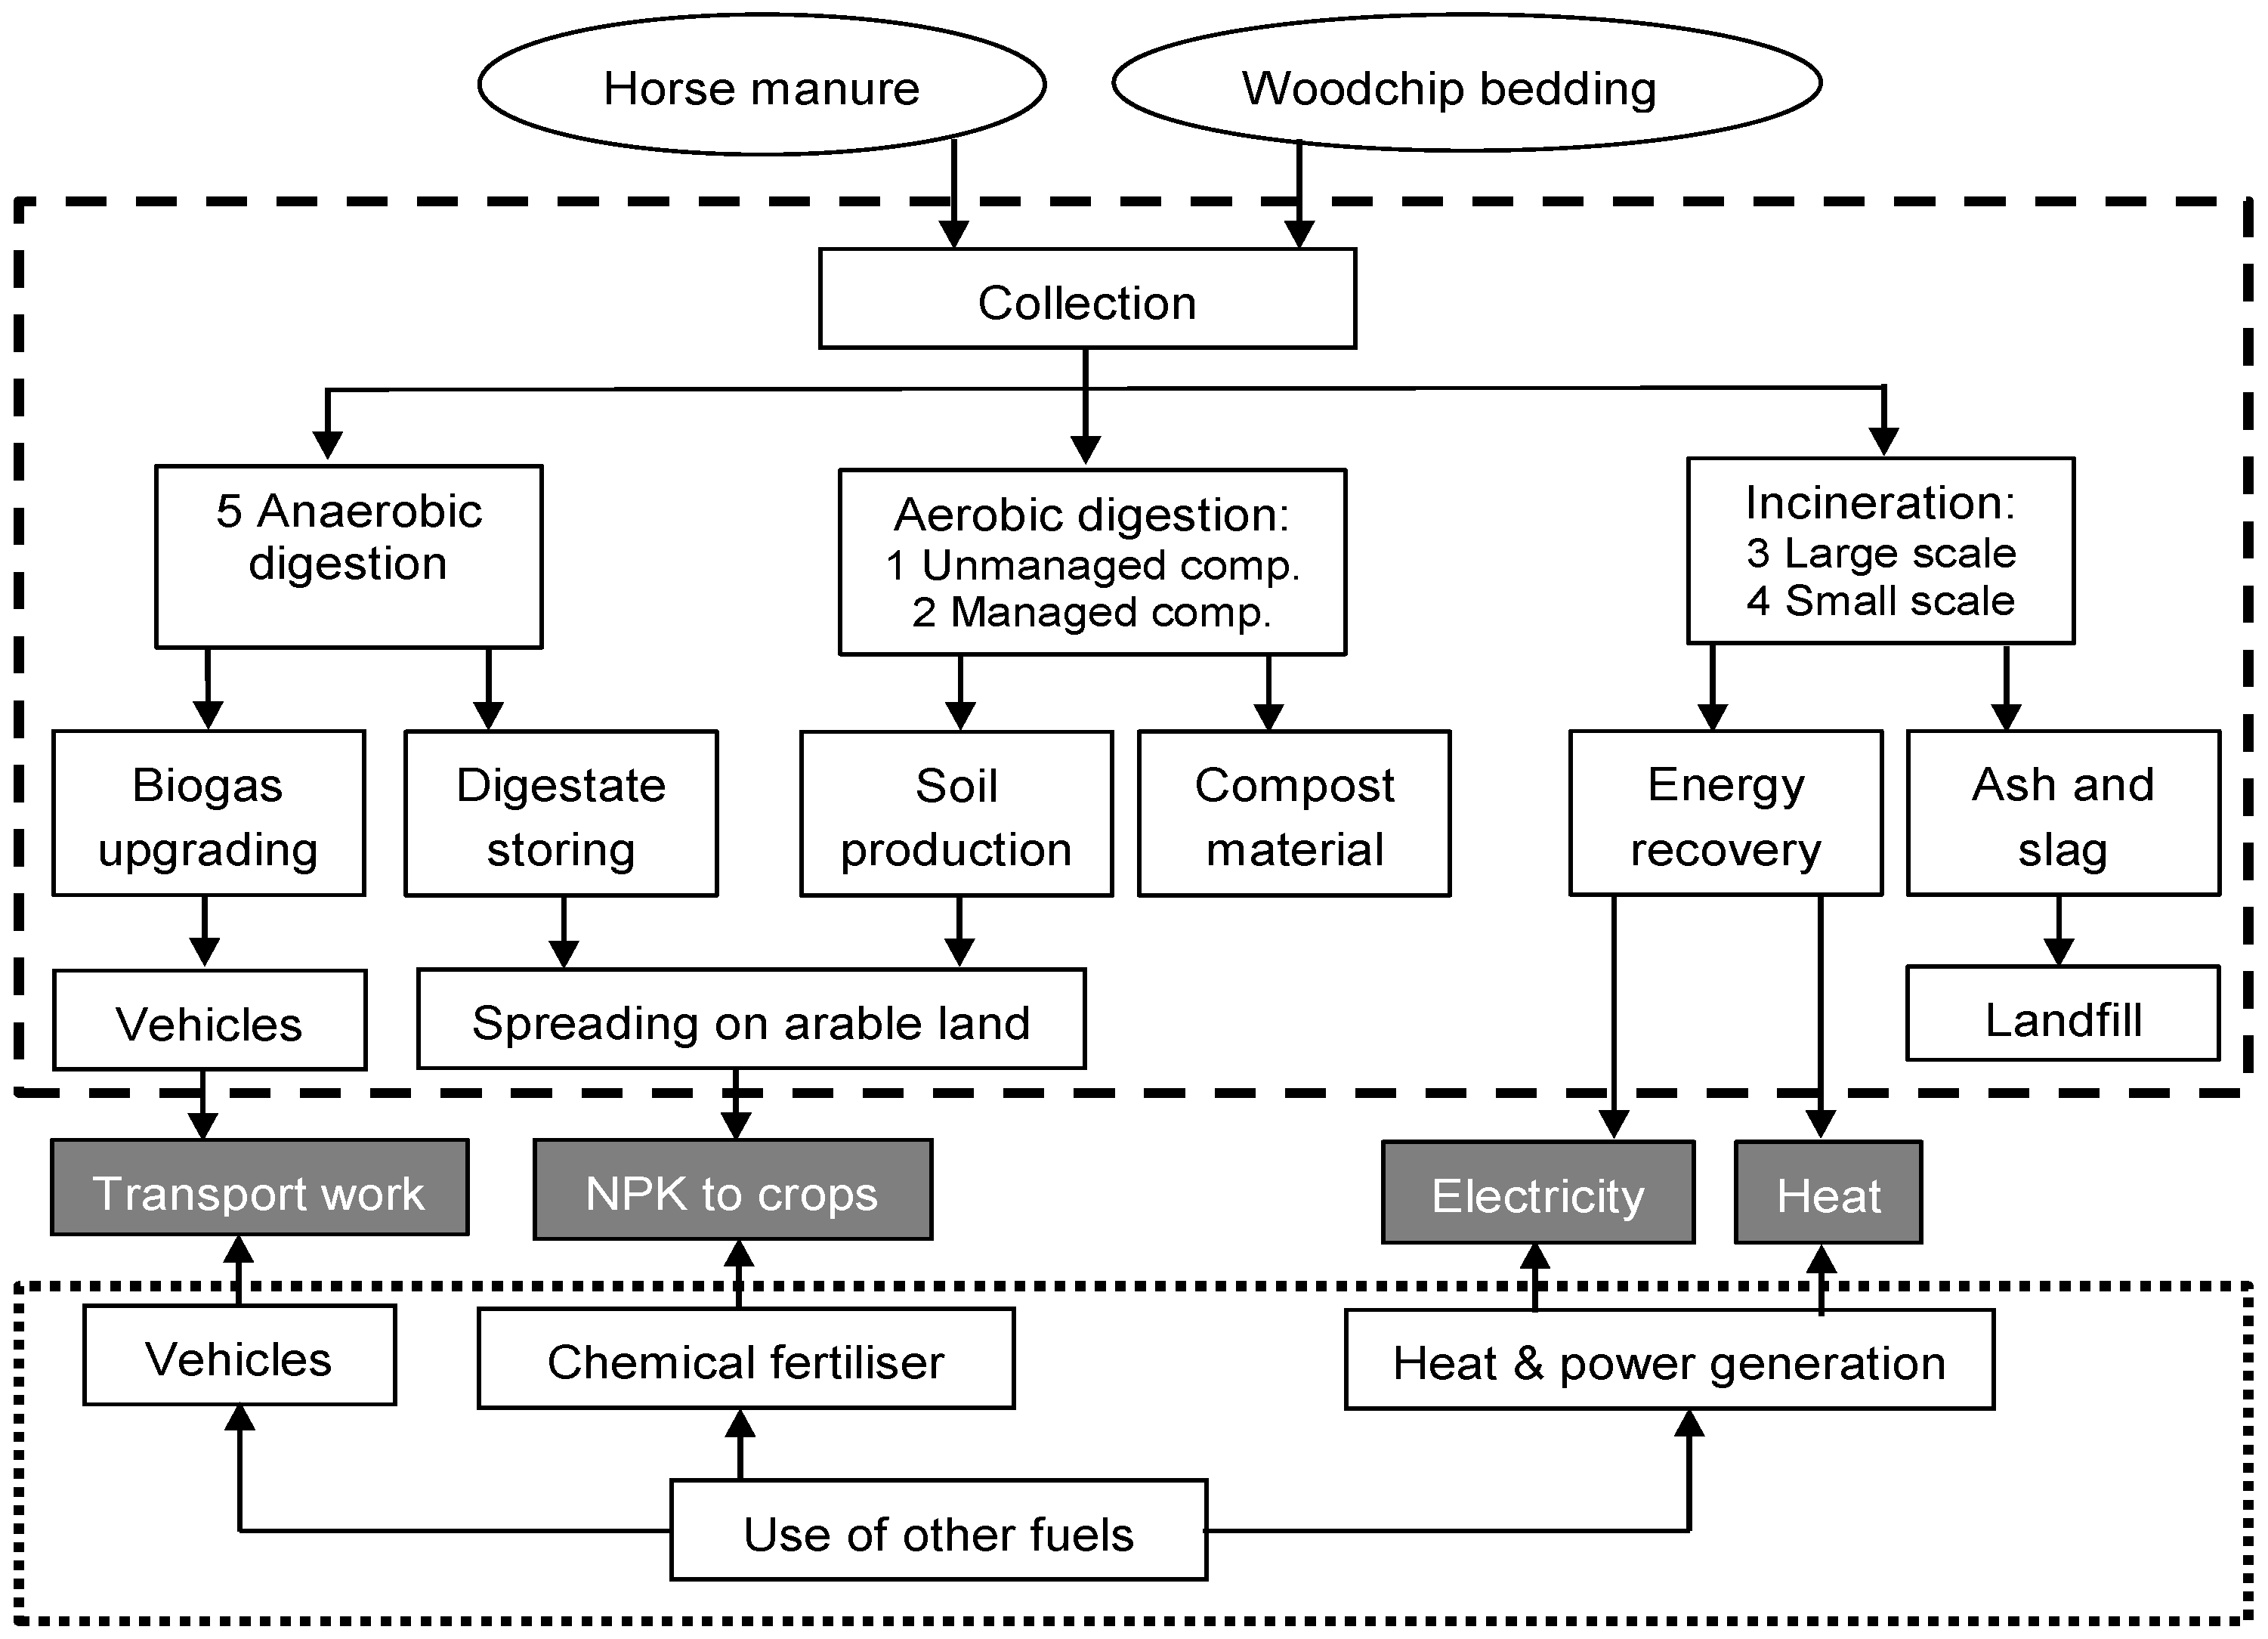
Figure 2.
Use of primary energy (CED) in simulated scenarios.

Figure 3.
Global warming potential (GWP) in simulated scenarios. eq.: equivalents.

Figure 4.
Acidification potential (AP) in simulated scenarios.

Figure 5.
Eutrophication Potential (EP) in simulated scenarios.

Figure 6.
GWP in simulated sensitivity analysis.

Table 1.
Main characteristics for manure and wood chips bedding. WW: wet weight; TS: total solids; VS: volatile solids, HHV: high heating value; and C/N: carbon to nitrogen.
| Material | TS (% WW) | VS (% TS) | HHV (MJ/kg) | C/N Ratio |
|---|---|---|---|---|
| Horse dung | 23.5 | 88.7 | 1.25 | 25 |
| Woodchips | 84.1 | 90.6 | 15.28 | 240 |
| Scenario | Unmanaged Composting | Managed Composting | Large-Scale Incineration | Small-Scale Incineration | Anaerobic Digestion |
|---|---|---|---|---|---|
| Heat (MWh) | 2.0 | 2.0 | 0 | 1.6 | 2.0 |
| Electricity (MWh) | 0.25 | 0.4 | 0.0 | 0.25 | 0.4 |
| Bus transport (Mm) | 80 | 80 | 80 | 80 | 0 |
| Car transport (Mm) | 336 | 336 | 336 | 336 | 0 |
| Nitrogen fertilizer (tonnes) | 3.4 | 1.8 | 4.5 | 4.5 | 0.0 |
| Phosphorus fertilizer (kg) | 203 | 0 | 405 | 405 | 0 |
| Potassium fertilizer (kg) | 670 | 0 | 134 | 134 | 0 |
| Parameter | Baseline | Sensitivity Analysis |
|---|---|---|
| Fuels for compensatory district heating and electricity | Heat-biomass | Heat-coal |
| Electricity-fossil | Electricity-renewable | |
| Biogas offsetting | Raw gas is upgraded and used in vehicles | Raw gas is used in an ICE for generation of electrical power |
| Source | Biogas to Vehicles (GJ) | Biogas to Heat and Power (GJ) |
|---|---|---|
| Raw gas | 2678 | 2678 |
| Vehicle gas | 2664 | - |
| Electricity | - | 1017 |
| Heat | - | 1392 |
| Losses | 14 | 268 |
Table 5.
Interesting factors to further evaluate in future Life Cycle Assessments (LCAs). CHP: combined heat and power; and HOB: heat only boiler.
| System Part | Factors |
|---|---|
| Horse manure | Amount, characteristics |
| Bedding material | Type, mixing ratio |
| Collection and transport | Amounts in relation to distance to plant |
| Pre-treatment | Drying performance (incineration) 1 |
| Pretreatment efficiency (anaerobic digestion) 2 | |
| Composting | C/N ratio; existence and performance of biofilter; leachate treatment; utilisation of compost |
| Combustion | CHP or HOB |
| Degree of efficiency | |
| Efficiency of air pollution control | |
| Anaerobic digestion | Methane emissions |
| Use of electricity | |
| Biogas utilization | Vehicle gas or heat/power |
| Upgrading technology | |
| Biofertilizer/compost utilization | TS-ratio |
| Spreading technology | |
| Soil conditions | |
| Compensatory production | Fuels for alternative heat |
| Fuels for alternative electricity |
1 How much energy is used for drying and the loss of organic material (i.e., methane potential); 2 How much energy is used in pretreatment in relation to increase in biogas production (incl. environmental impact depending on whether electricity or heat is used).
© 2016 by the authors; licensee MDPI, Basel, Switzerland. This article is an open access article distributed under the terms and conditions of the Creative Commons Attribution (CC-BY) license (http://creativecommons.org/licenses/by/4.0/).
Share and Cite
MDPI and ACS Style
Eriksson, O.; Hadin, Å.; Hennessy, J.; Jonsson, D. Life Cycle Assessment of Horse Manure Treatment. Energies 2016, 9, 1011. https://doi.org/10.3390/en9121011
AMA Style
Eriksson O, Hadin Å, Hennessy J, Jonsson D. Life Cycle Assessment of Horse Manure Treatment. Energies. 2016; 9(12):1011. https://doi.org/10.3390/en9121011
Chicago/Turabian StyleEriksson, Ola, Åsa Hadin, Jay Hennessy, and Daniel Jonsson. 2016. "Life Cycle Assessment of Horse Manure Treatment" Energies 9, no. 12: 1011. https://doi.org/10.3390/en9121011
Note that from the first issue of 2016, this journal uses article numbers instead of page numbers. See further details here.