
New Requirements of the Voltage/VAR Function for Smart Inverter in Distributed Generation Control


Abstract
:1. Introduction
2. IEC 61850 and Control of DG
3. Problem Formulation
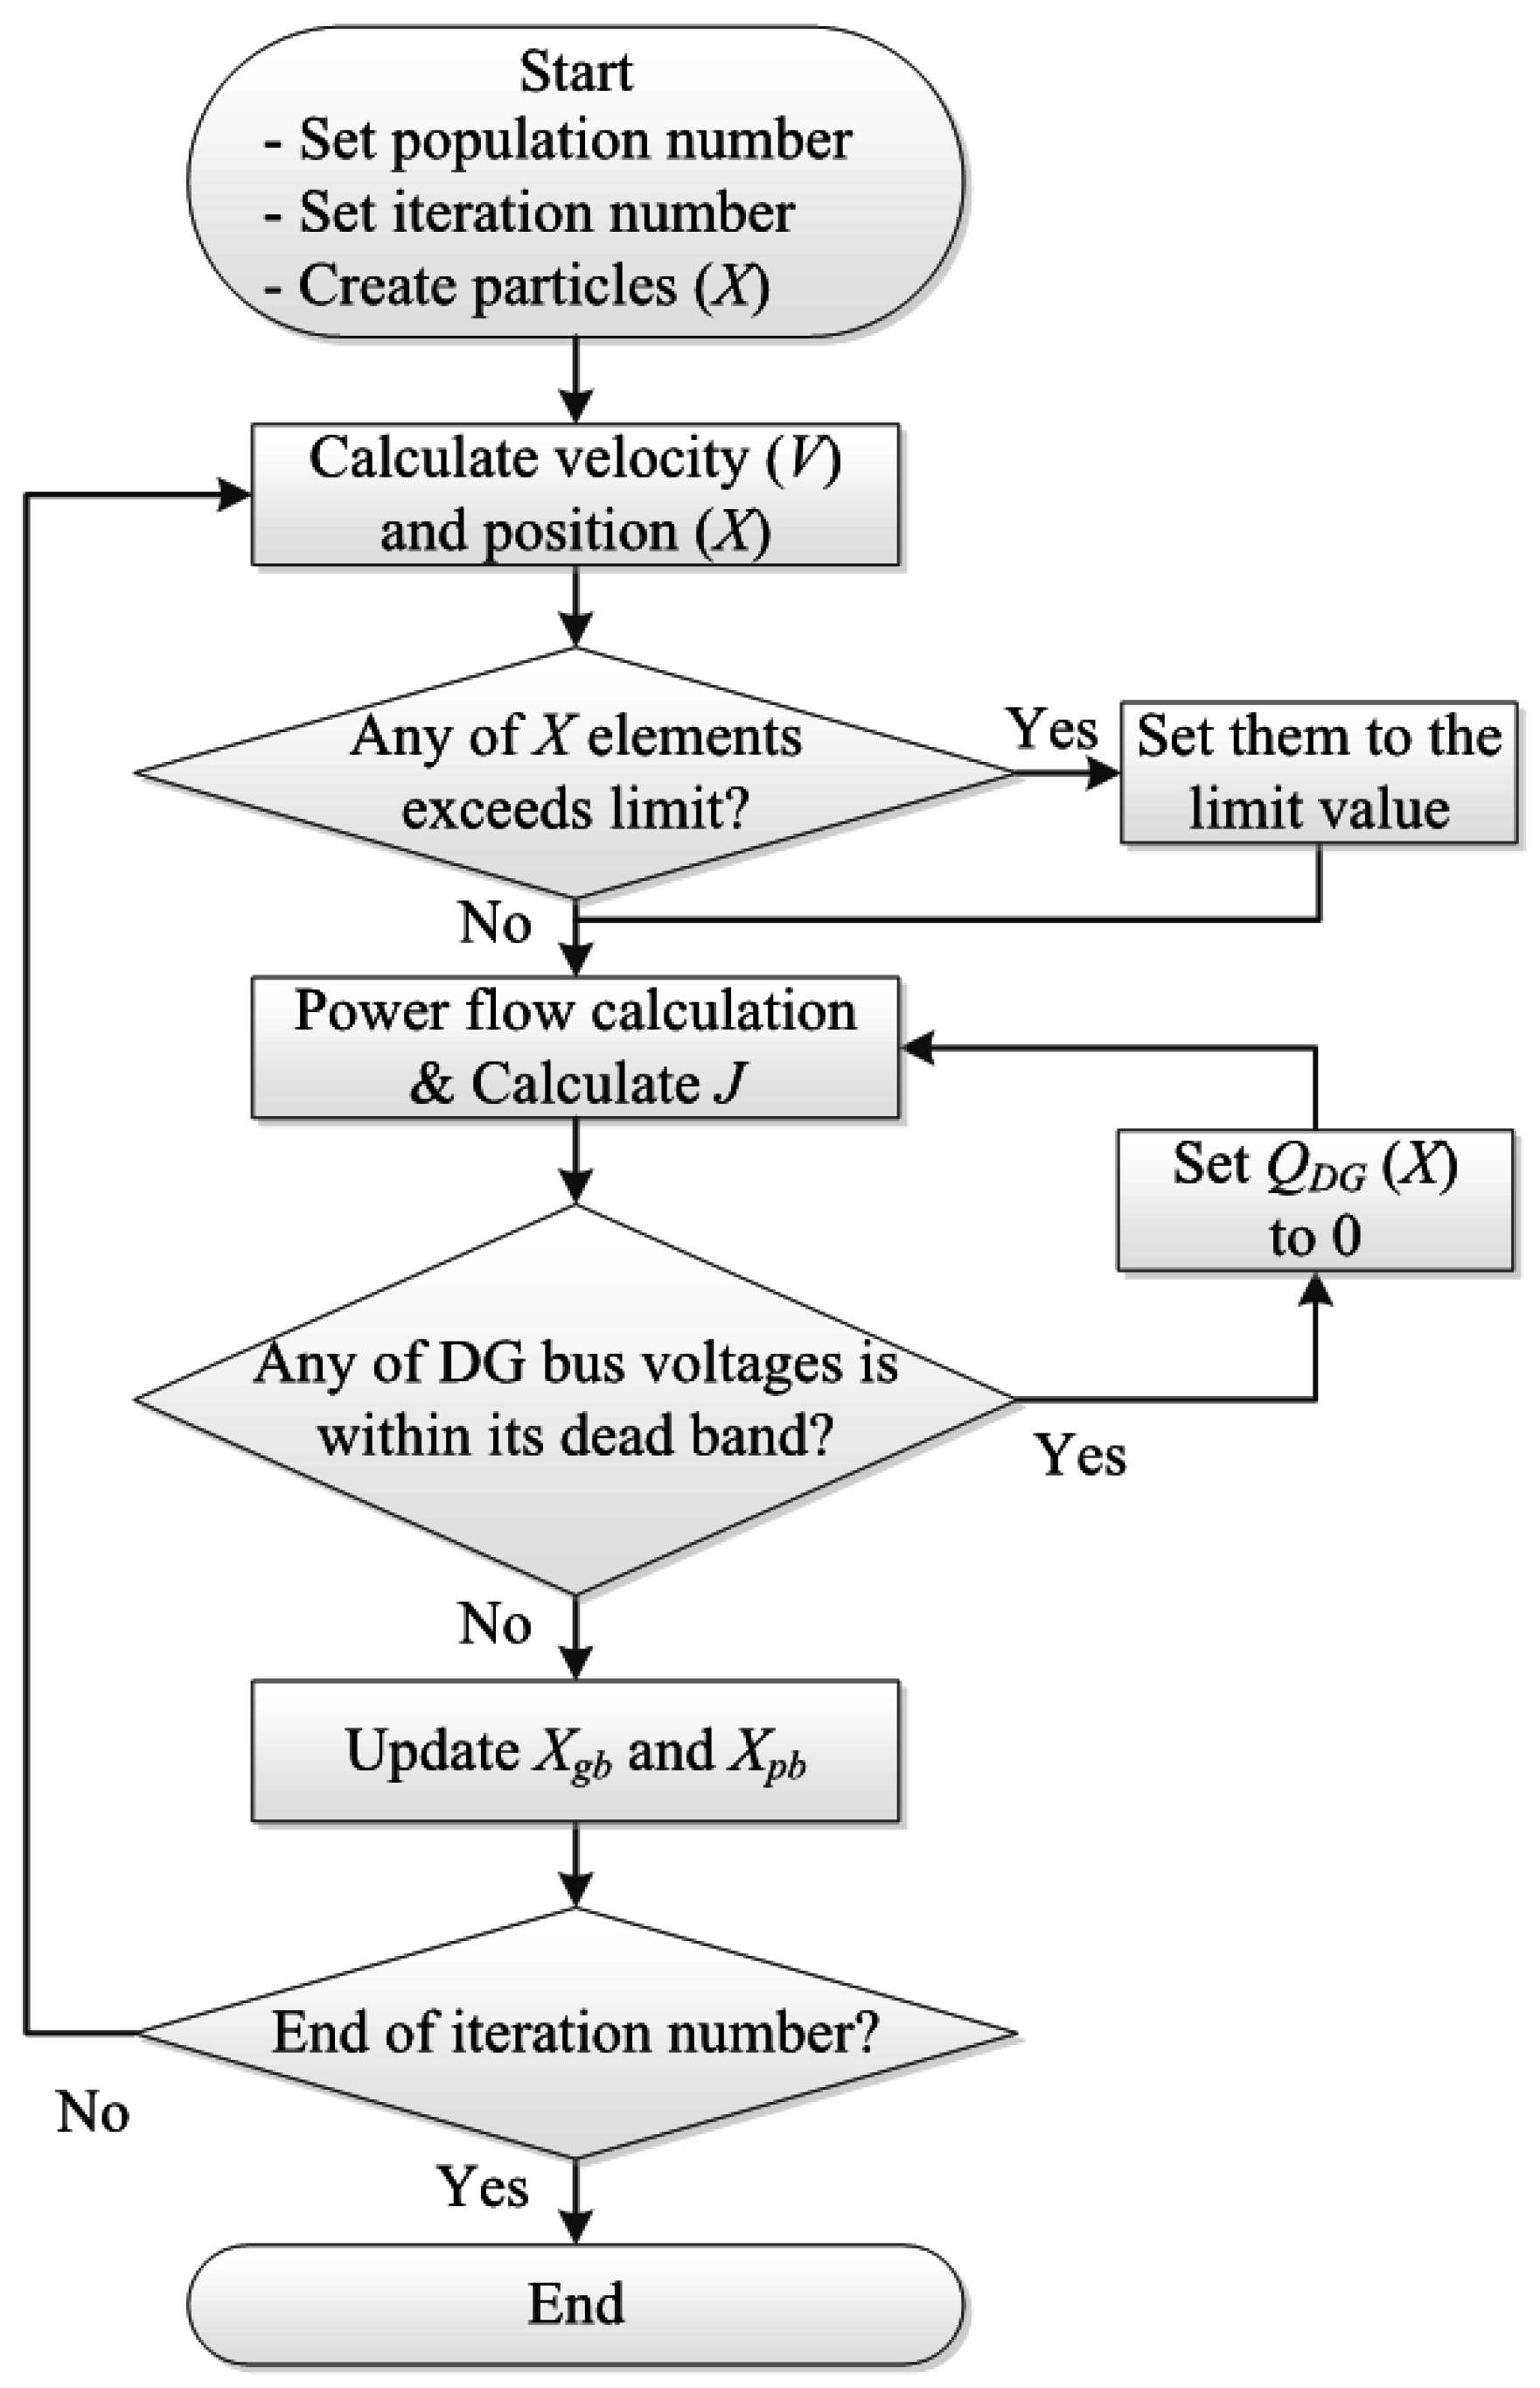
3.1. Particle Swarm Optimization (PSO)
3.2. Objective Function and Constraints
- Vmin ≤ Vj ≤ Vmax, for all buses
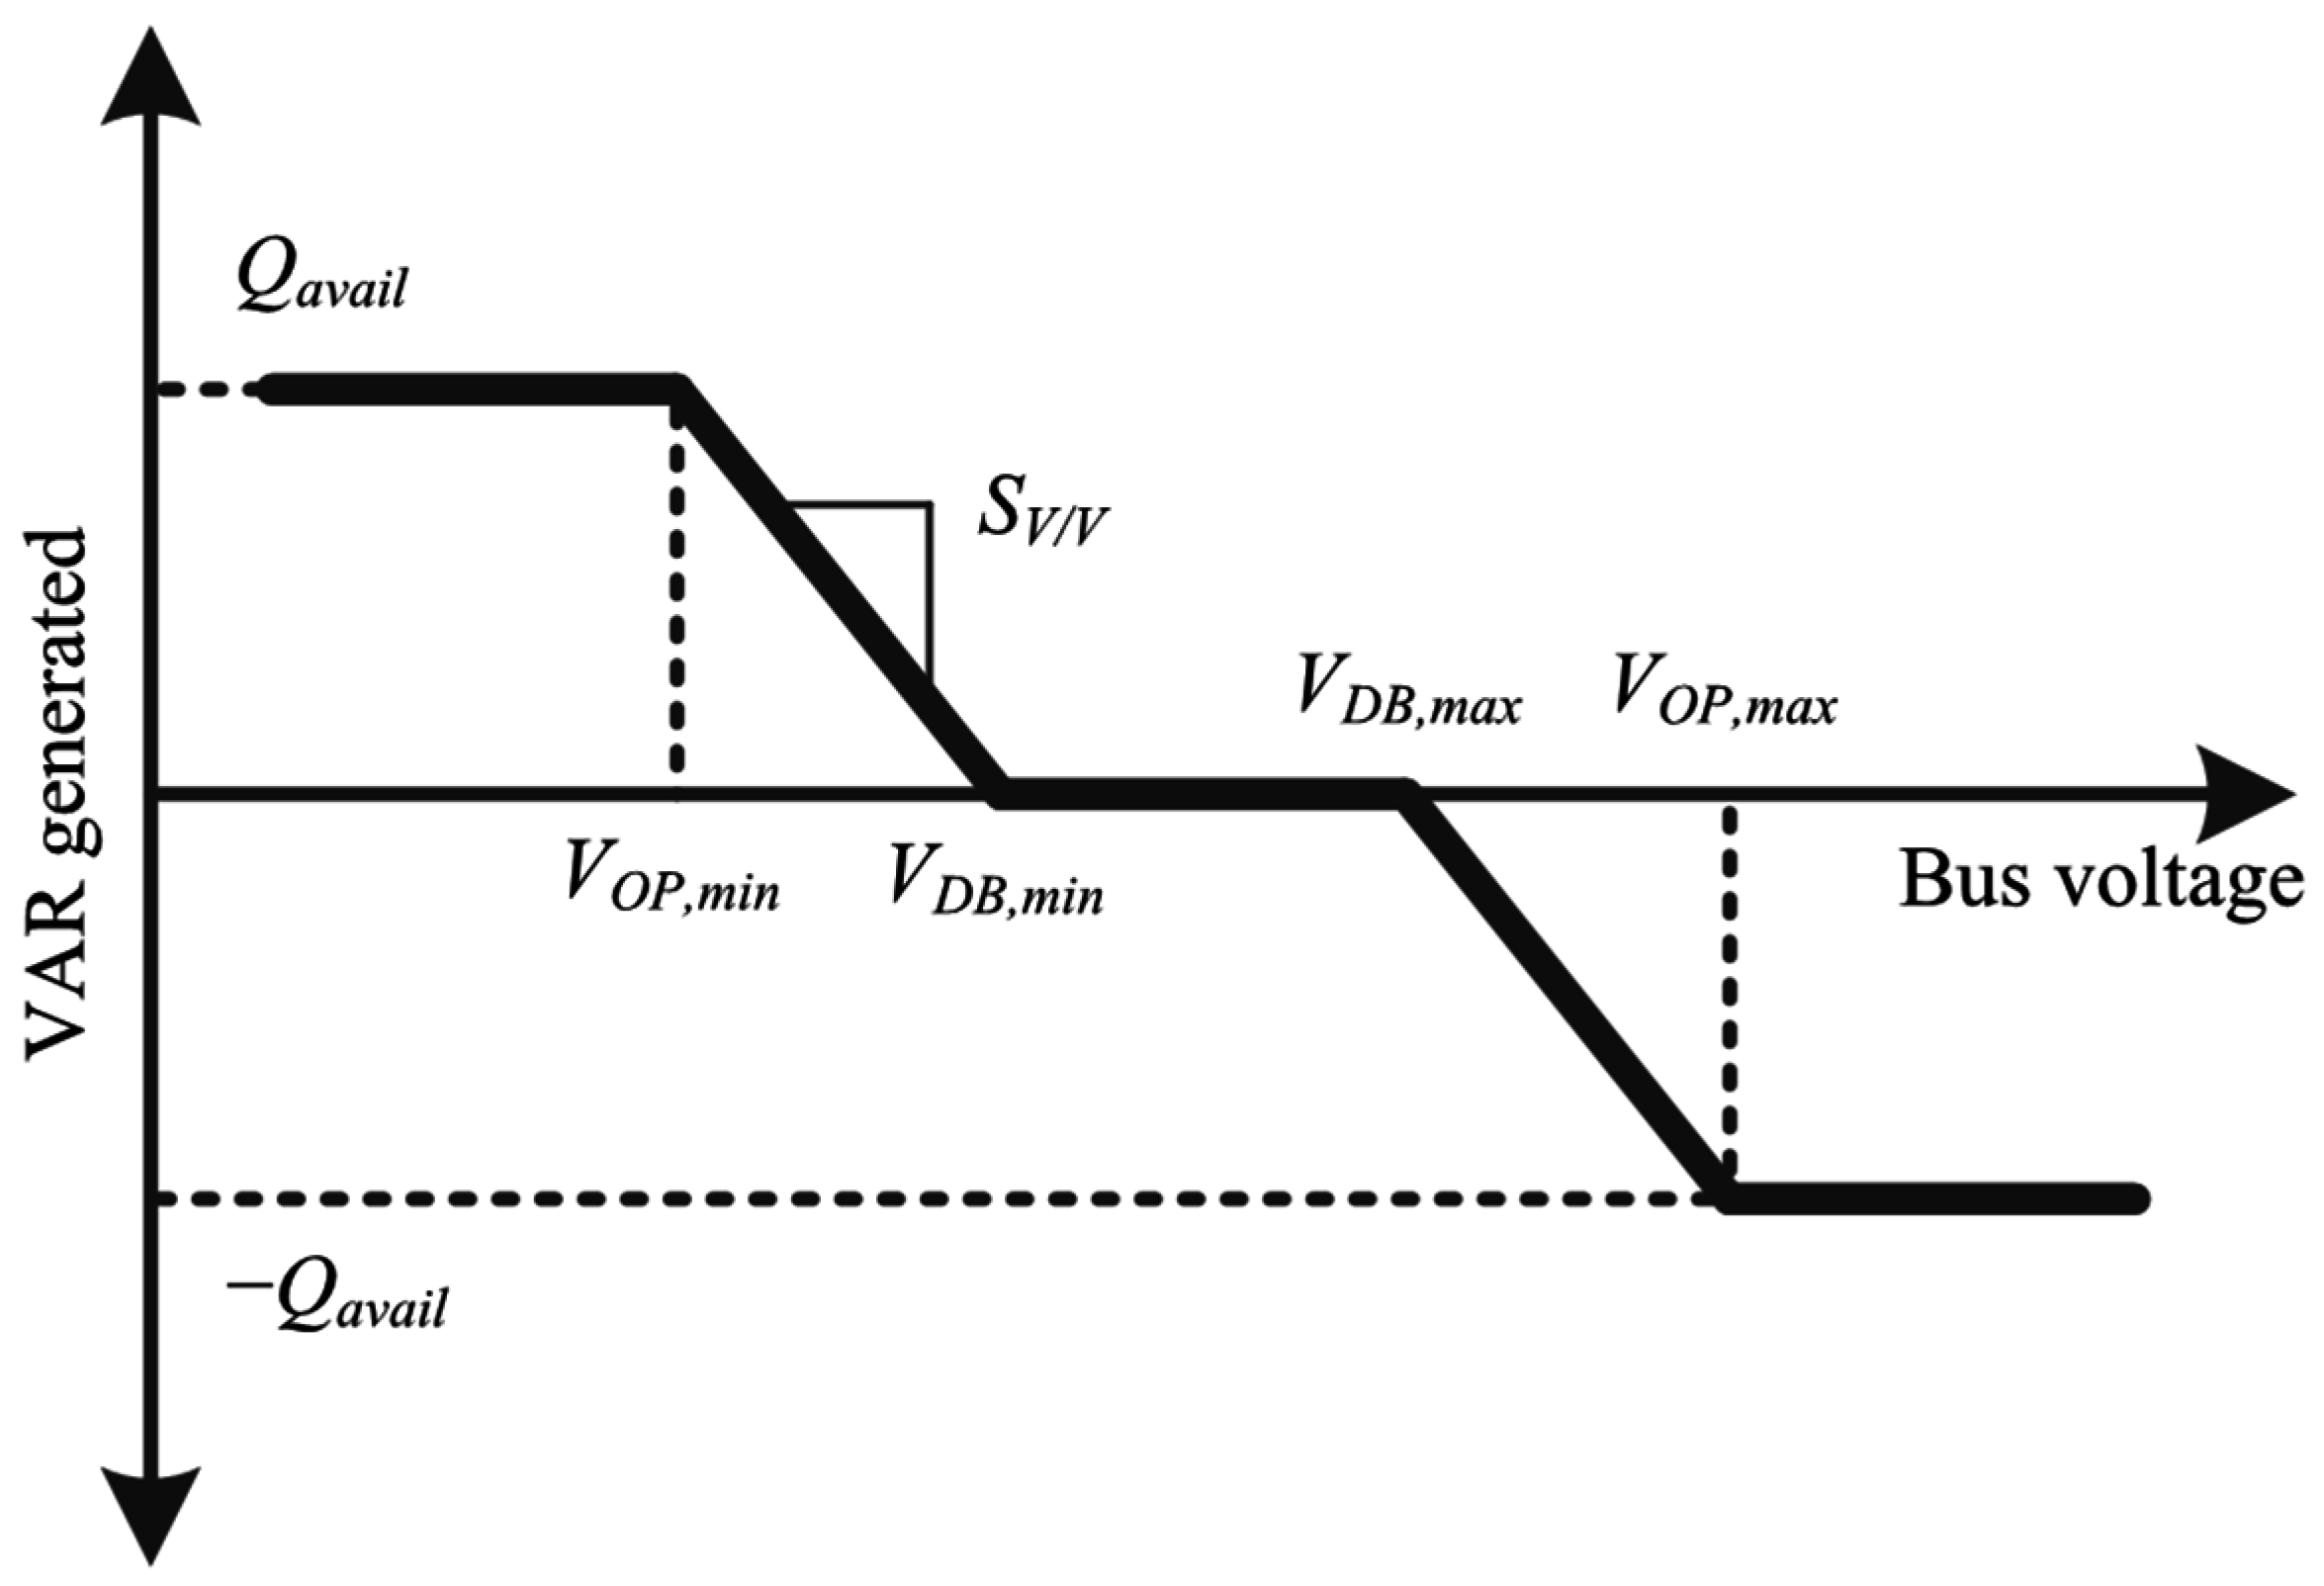
- −Qavail,DG,j ≤ QDG,j ≤ Qavail,DG,j, for all DG buses
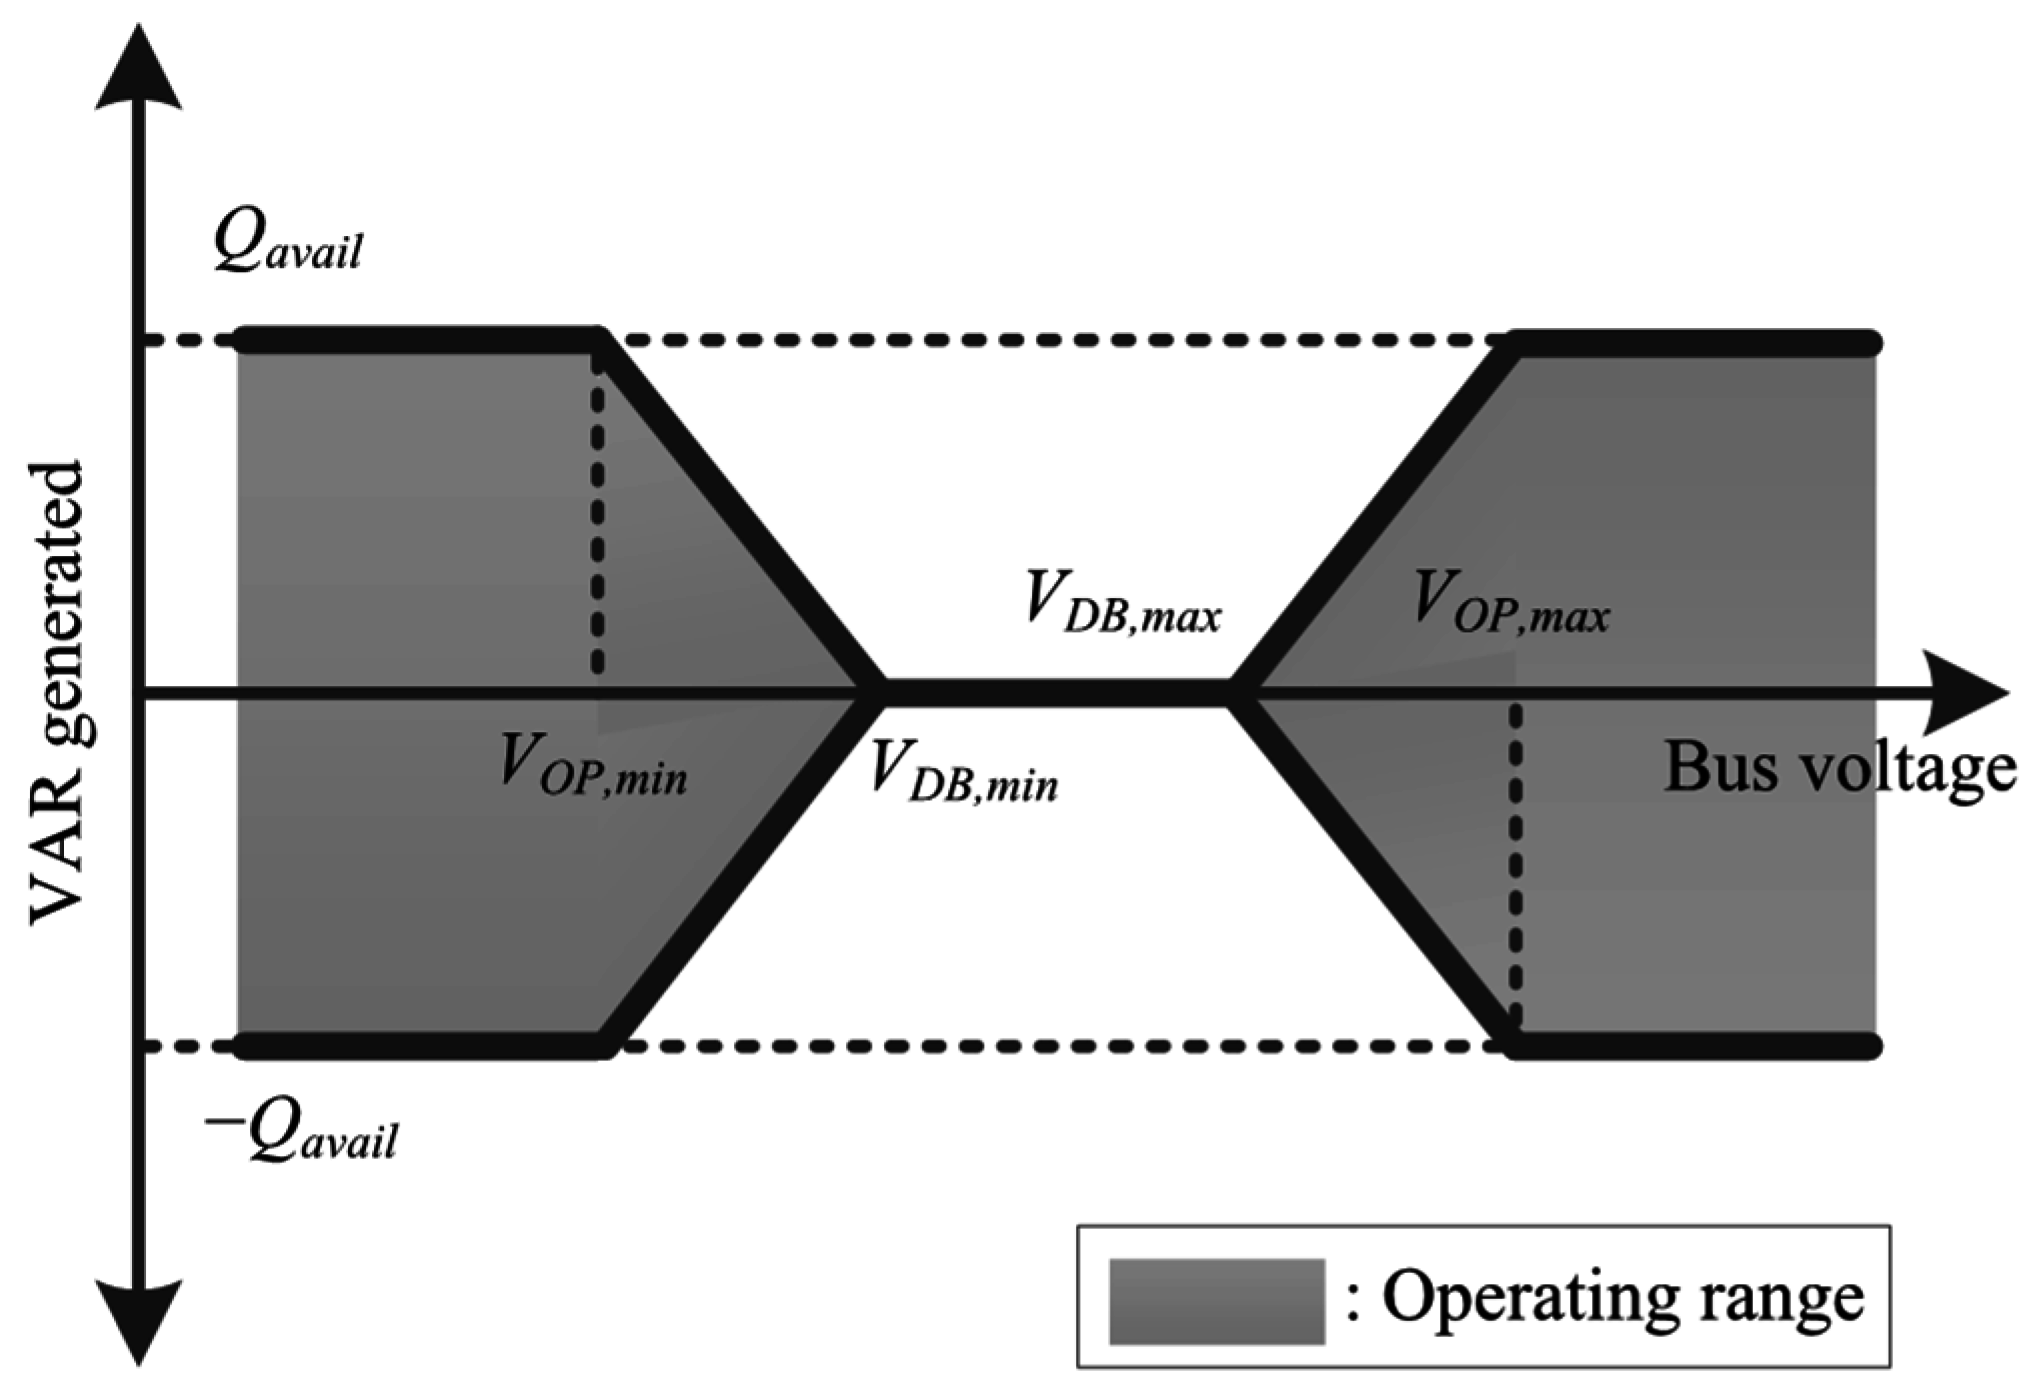
- QDG,j = 0, if VDB,min ≤ Vj ≤ VDB,max
- Pgen = Pload + Ploss
3.3. Optimization Algorithm
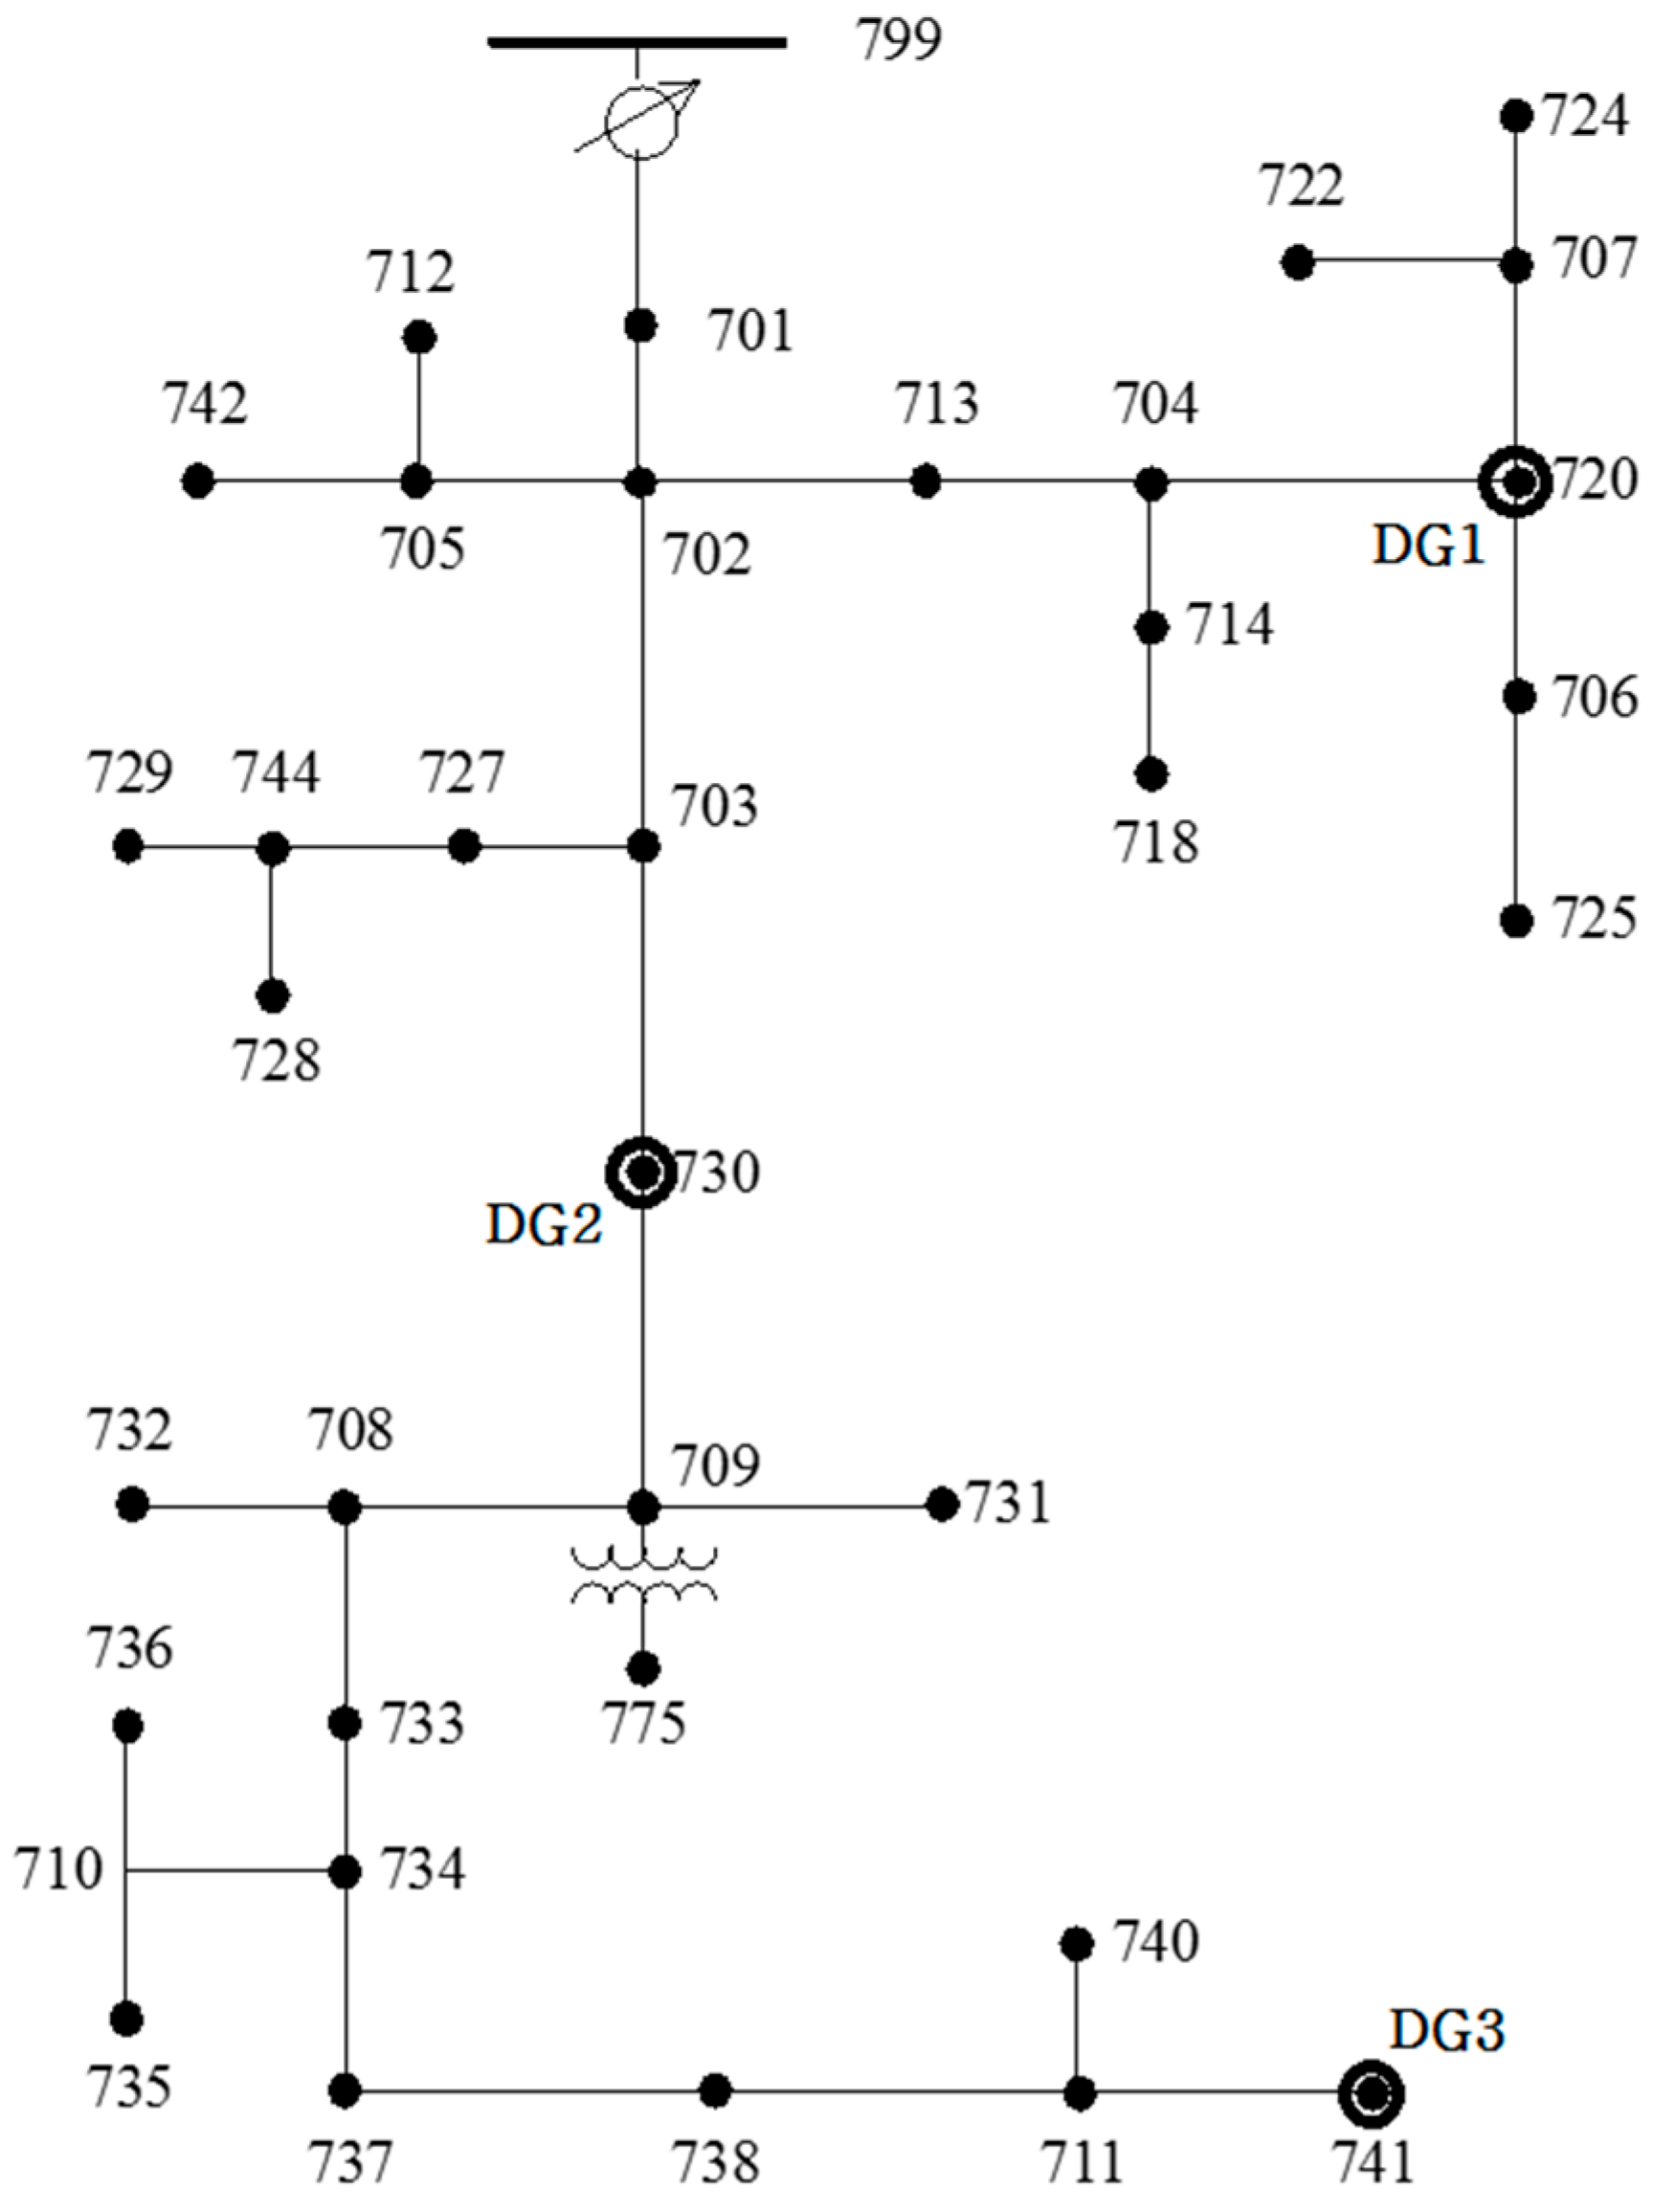
4. Case Studies and Suggestions for a New Volt/VAR Function
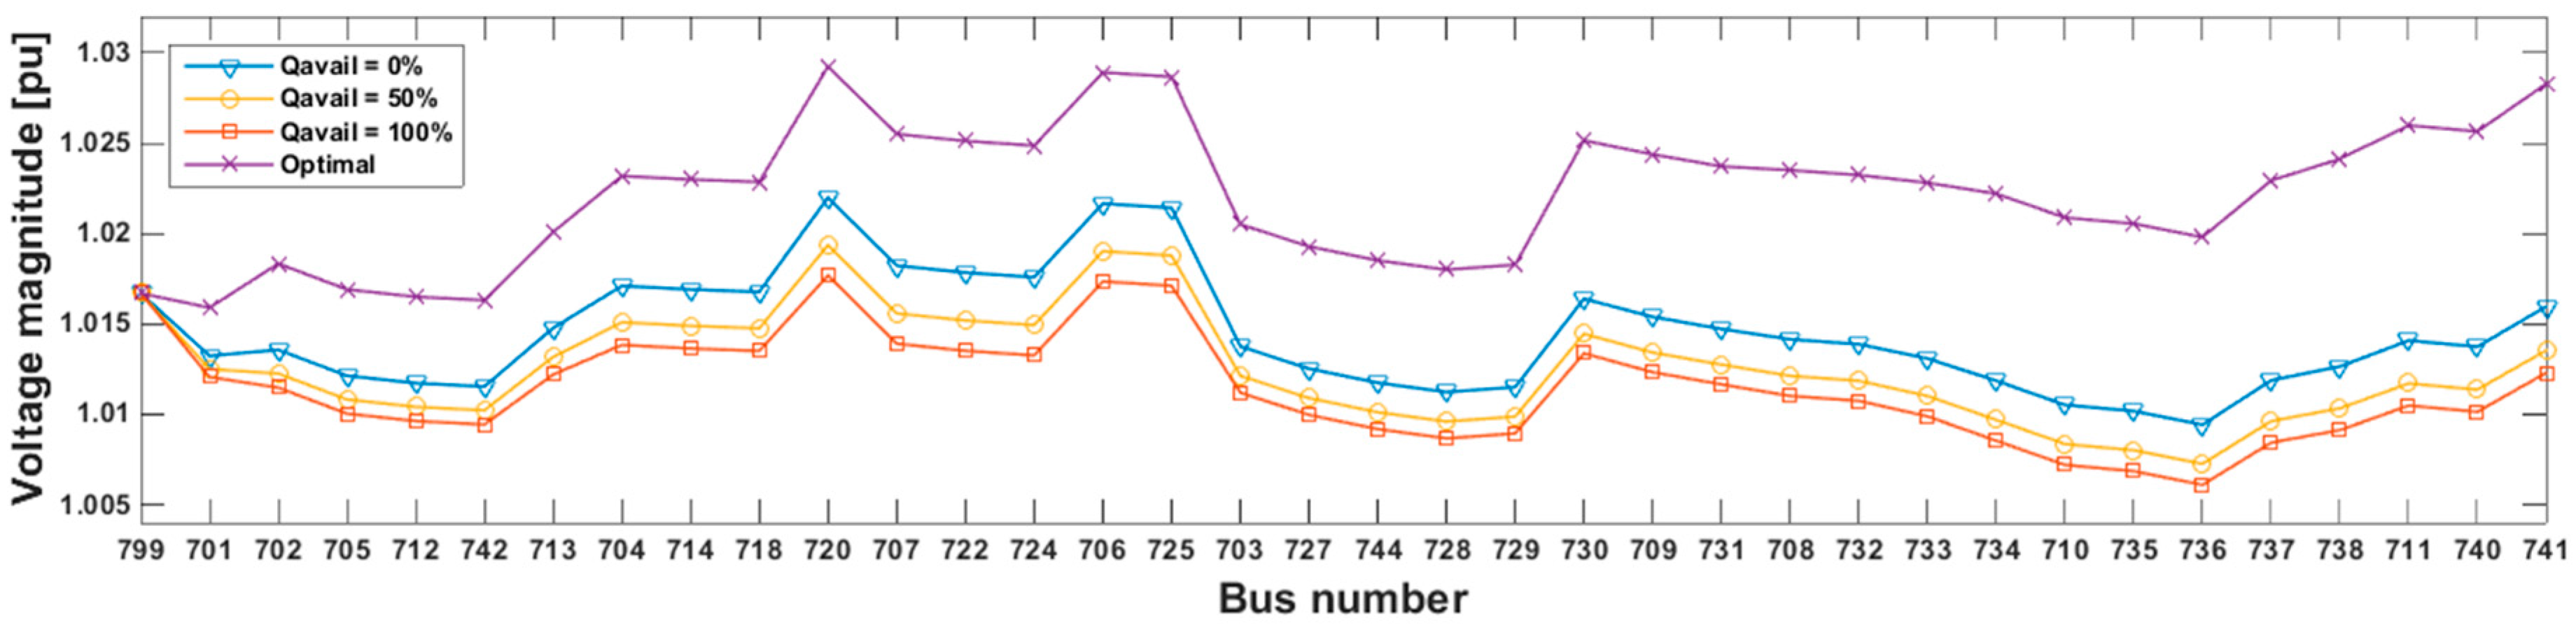
4.1. Case 1
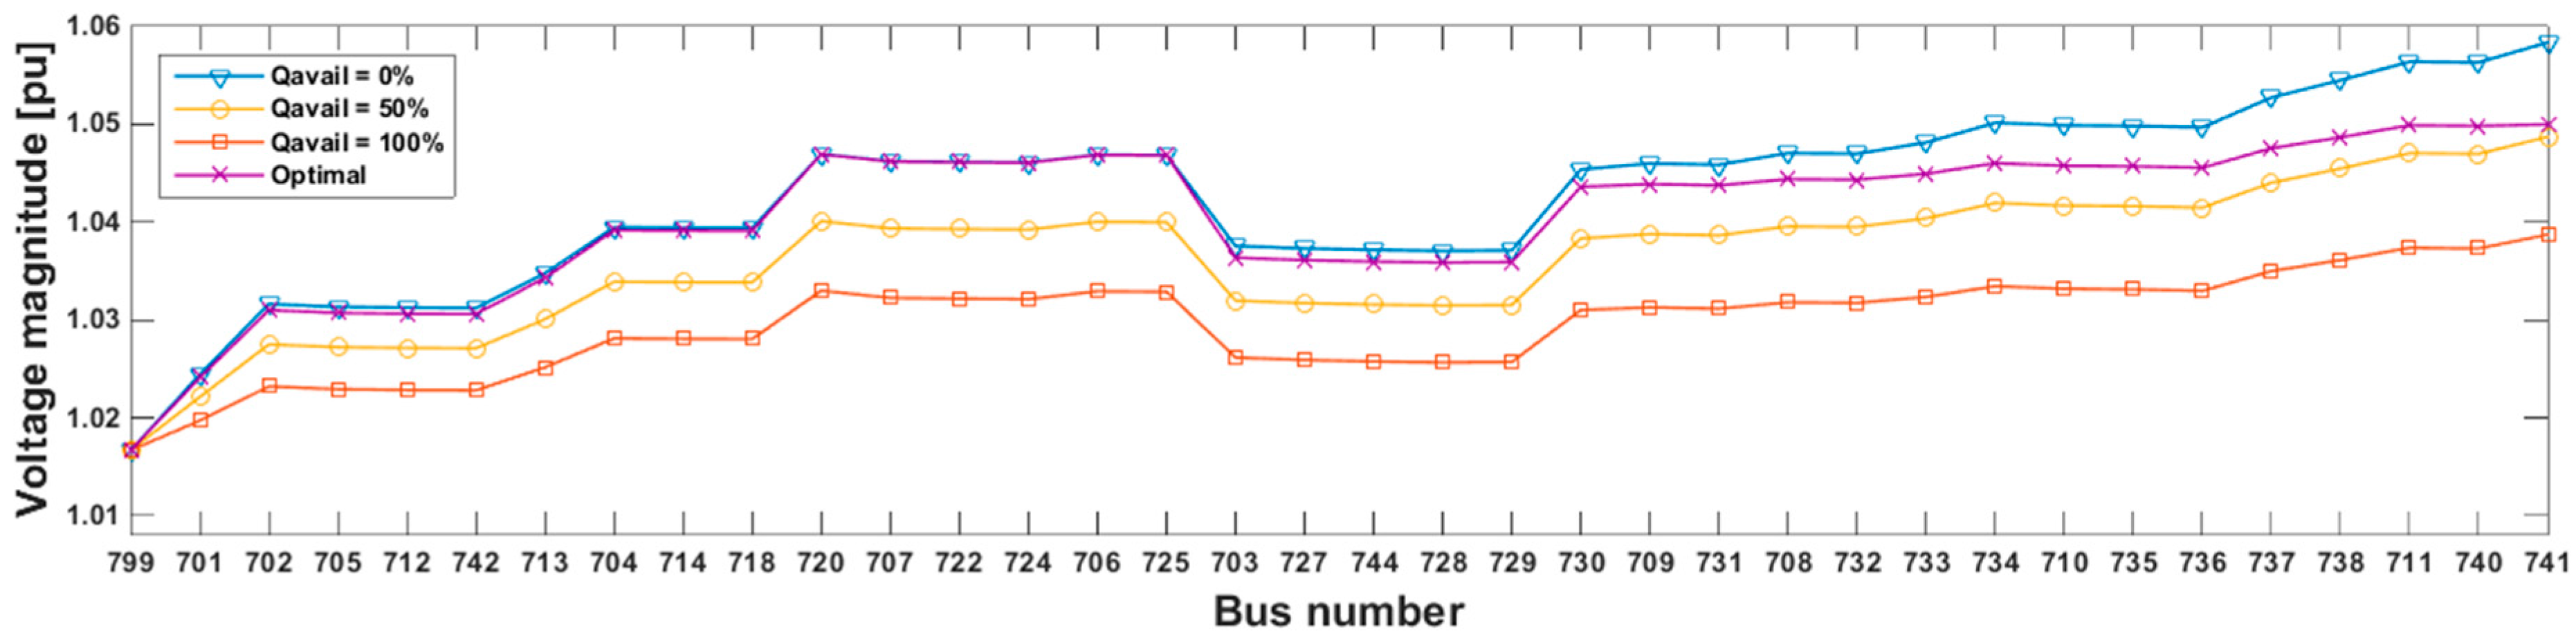
4.2. Case 2
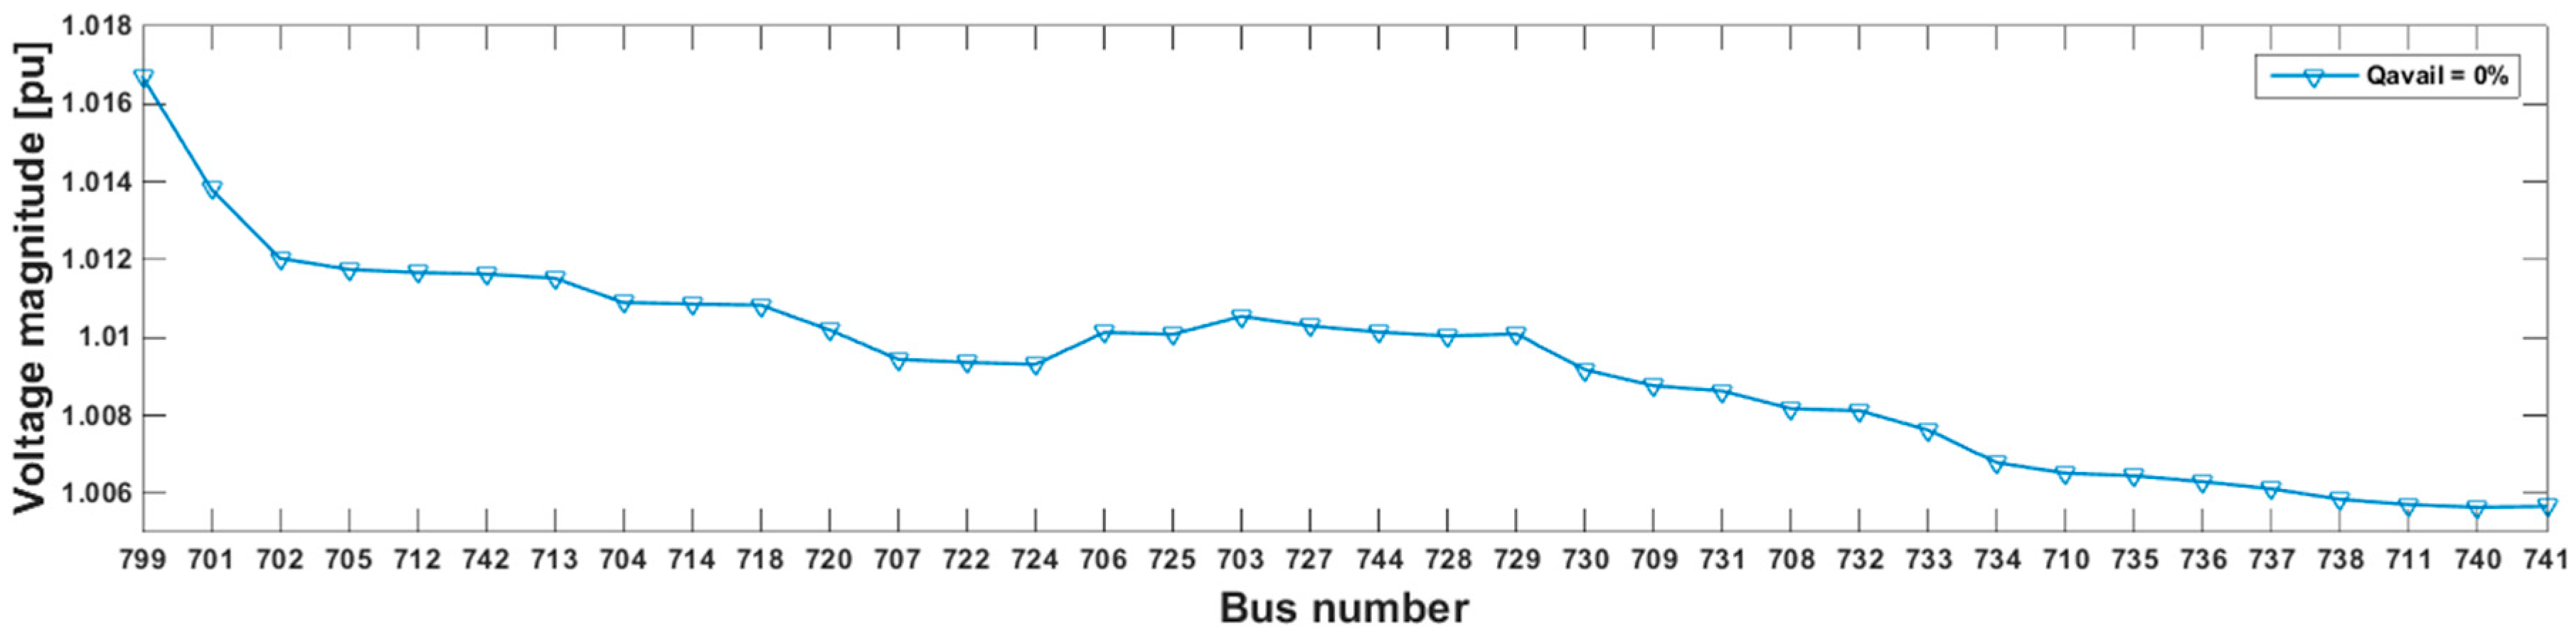
4.3. Case 3
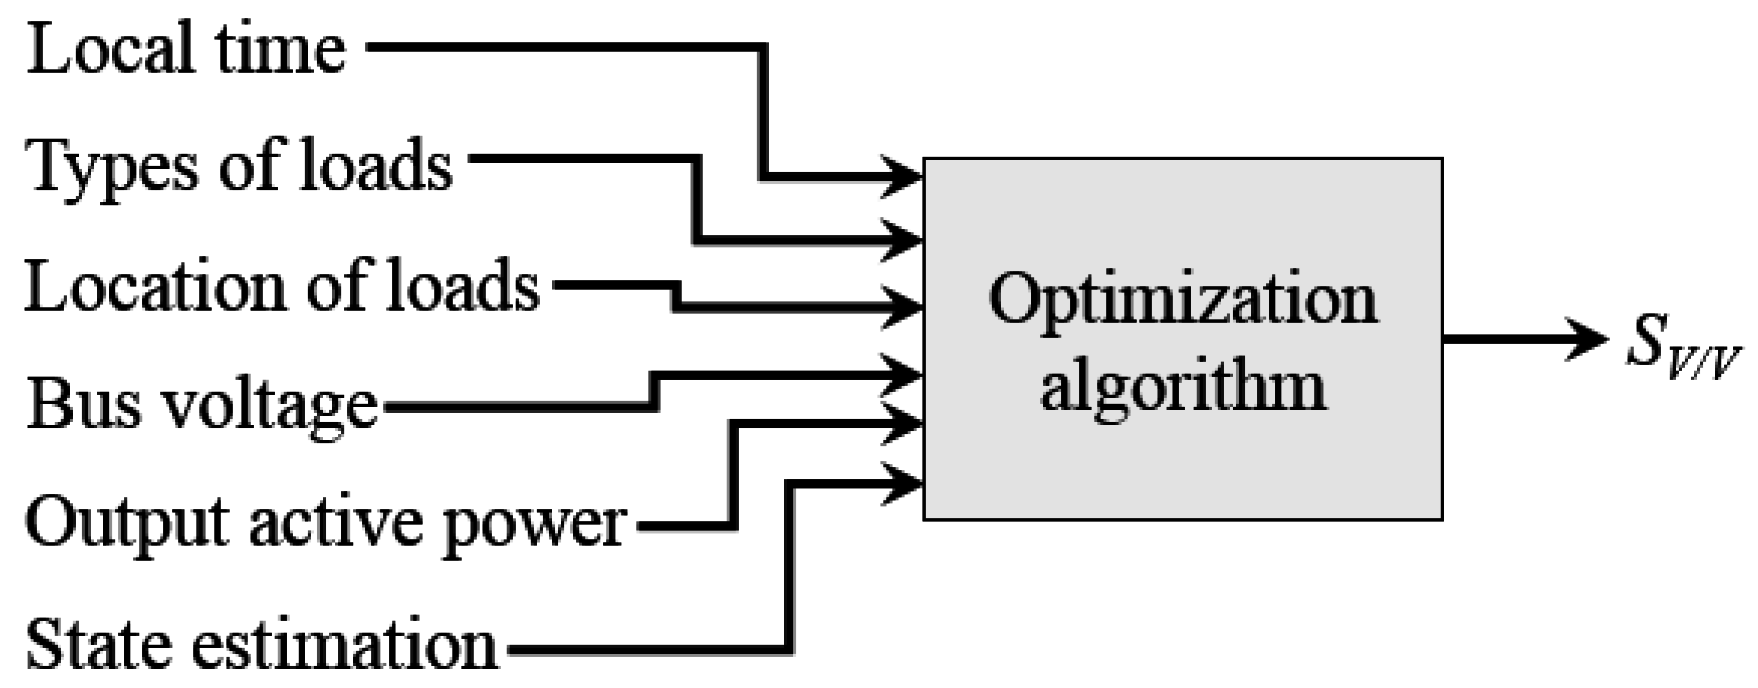
4.4. Suggestions for a New Volt/VAR Function
- Local time—Using the present local time, the present load condition can be estimated (whether it is a light or a heavy load condition).
- Types of loads—The types of loads (constant power load/constant impedance load/constant current load) affect the sign of SV/V. In practice, types of load are mixed, and hence the most dominant type of load at each bus may be used. The most dominant type of load can be determined by extracting ZIP coefficients, which stand for constant impedance Z, constant current I, constant power P loads. The expressions for active and reactive powers of the ZIP coefficients model are described as [31]:where P is the active power at operating voltage Vi, P0 is the active power at rated voltage V0, and Zp, Ip, and Pp are the ZIP coefficients for active power. As shown in Equation (10), constant impedance model depends quadratically on the voltage, and constant current load depends linearly on the voltage. The details of extracting ZIP coefficients are described in [31]. After determining the type of load at each bus as the dominant type, the power flow calculation is implemented with the determined load type.
- Locations of loads—If the constant power loads are dominant in the vicinity of DG unit, the V/V function has to be operated in order to raise the bus voltage whereas if the constant impedance loads are dominant in the vicinity of DG unit, the V/V function has to be operated in the opposite way.
- Bus voltage—The local bus voltage has to be measured to determine whether the conditions are of undervoltage or overvoltage.
- Output active power—The output active power affects the power factor as well as the bus voltage.
- State estimation—Instead of the forecasted data, the state estimation data based on measurements (voltage, power flow) is required to acquire load data since the forecasted data could introduce large uncertainties.
5. Conclusions and Future Works
Acknowledgments
Author Contributions
Conflicts of Interest
References
- Electric Power Research Institute. The Integrated Grid: Realizing the Full Value of Central and Distributed Energy Resources; Electric Power Research Institute (EPRI): Palo Alto, CA, USA, 2014. [Google Scholar]
- Electric Power Research Institute. Integrating Smart Distributed Energy Resources with Distribution Management Systems; EPRI: Palo Alto, CA, USA, 2012. [Google Scholar]
- Meibom, P.; Hilger, K.B.; Madsen, H.; Vinther, D. Energy comes together in Denmark: The key to a future fossil-free Danish power system. IEEE Power Energy Mag. 2013, 11, 46–55. [Google Scholar] [CrossRef]
- Electric Power Research Institute. Common Functions for Smart Inverters; EPRI: Palo Alto, CA, USA, 2014. [Google Scholar]
- Chung, I.-Y.; Liu, W.; Cartes, D.A.; Collins, E.G.; Moon, S. Control methods of inverter-interfaced distributed generators in a microgrid system. IEEE Trans. Ind. Appl. 2010, 46, 1078–1088. [Google Scholar] [CrossRef]
- Chowdhury, S.; Chowdhury, S.P.; Crossely, P. Microgrids and Active Distribution Networks; Institute of Engineering and Technology (IET): London, UK, 2009. [Google Scholar]
- Pudjianto, D.; Ramsay, C.; Strbac, G. Virtual power plant and system integration of distributed energy resources. IET Renew. Power Gener. 2007, 1, 10–16. [Google Scholar] [CrossRef]
- Boehme, T.; Harrison, G.P.; Wallace, A.R. Assessment of distribution network limits for non-form connection of renewable generation. IET Renew. Power Gener. 2010, 4, 64–74. [Google Scholar] [CrossRef]
- Bignucolo, F.; Caldon, R.; Prandoni, V. Radial MV networks voltage regulation with distribution management system coordinated controller. Elect. Power Syst. Res. 2008, 78, 634–645. [Google Scholar] [CrossRef]
- Hallberg, P. Active Distribution System Management—A Key Tool for the Smooth Integration of Distributed Generation; Eurelectric: Brussels, Belgium, 2013. [Google Scholar]
- Caldon, R.; Spelta, S.; Prandoni, V.; Turri, R. Co-ordinated voltage regulation in distribution networks with embedded generation. In Proceedings of the 18th International Conference and Exhibition on Electricity Distribution, Turin, Italy, 6–9 June 2005; pp. 1–4.
- Viawan, F.A.; Karlsson, D. Voltage and reactive power control in system with synchronous machine-based distributed generation. IEEE Trans. Power Deliv. 2008, 23, 1079–1087. [Google Scholar] [CrossRef]
- Navigant. Dynamic Volt/VAR Control Architectures; Navigant: Boulder, CO, USA, 2014. [Google Scholar]
- Saadeh, O. DER Management Systems 2014: Technology, Deployments and Market Size; Green Tech Media (GTM): Boston, MA, USA, 2014. [Google Scholar]
- Rogers, K.M.; Klump, R.; Khurana, H.; Aquino-Lugo, A.A.; Overbye, T.J. An authenticated control framework for distributed voltage support on the smart grid. IEEE Trans. Smart Grid 2010, 1, 40–47. [Google Scholar] [CrossRef]
- Miret, J.; Camacho, A.; Castilla, M.; de Vicuña, L.G.; Matas, J. Control scheme with voltage support capability for distributed generation inverters under voltage sags. IEEE Trans. Power Electron. 2013, 28, 5252–5262. [Google Scholar] [CrossRef]
- Delfino, F.; Procopio, R.; Rossi, M.; Ronda, G. Integration of large-size photovoltaic systems into the distribution grids: A p-q chart approach to assess reactive support capability. IET Renew. Power Gener. 2010, 4, 329–340. [Google Scholar] [CrossRef]
- Barr, J.; Majumder, R. Integration of distributed generation in the Volt/VAR management system for active distribution networks. IEEE Trans. Smart Grid 2015, 6, 576–586. [Google Scholar] [CrossRef]
- International Electrotechnical Commission. Communication Networks and Systems for Power Utility Automation; IEC 61850; IEC: Geneva, Switzerland, 2013. [Google Scholar]
- International Electrotechnical Commission. Communication Networks and Systems for Power Utility Automation—Part 7-420: Basic Communication Structure; IEC 61850-7-420; IEC: Geneva, Switzerland, 2013. [Google Scholar]
- International Electrotechnical Commission. Communication Networks and Systems for Power Utility Automation—Part 90-7: Object Models for Power Converters in Distributed Energy Resources (DER) Systems; IEC/TR 61850-90-7; IEC: Geneva, Switzerland, 2013. [Google Scholar]
- Kryonidis, G.C.; Demoulias, C.S.; Papagiannis, G.K. A nearly decentralized voltage regulation algorithm for loss minimization in radial MV networks with high DG penetration. IEEE Trans. Sustain. Energy 2016, 7, 1430–1439. [Google Scholar] [CrossRef]
- Mahmoud, K.; Yorino, N.; Ahmed, A. Optimal distributed generation allocation in distribution system for loss minimization. IEEE Trans. Power Syst. 2016, 31, 960–969. [Google Scholar] [CrossRef]
- Rao, R.S.; Ravindra, K.; Satish, K.; Narasimham, S.V.L. Power loss minimization in distribution system using network reconfiguration in the presence of distributed generation. IEEE Trans. Power Syst. 2013, 28, 317–325. [Google Scholar] [CrossRef]
- Atwa, Y.M.; El-Saadany, E.F.; Salama, M.M.A.; Seethapathy, R. Optimal renewable resources mix for distribution system energy loss minimization. IEEE Trans. Power Syst. 2010, 25, 360–370. [Google Scholar] [CrossRef]
- Valle, Y.; Venayagamoorthy, G.; Mohagheghi, S.; Hernandez, J.; Harley, R. Particle swarm optimization: Basic concepts, variants and applications in power systems. IEEE Trans. Evol. Comput. 2008, 12, 171–195. [Google Scholar] [CrossRef]
- Bergen, A.R.; Vittal, V. Power Systems Analysis, 2nd ed.; Prentice Hall: Upper Saddle River, NJ, USA, 2006. [Google Scholar]
- Kundur, P. Power System Stability and Control; McGraw-Hill: New York, NY, USA, 2006. [Google Scholar]
- Distribution System Analysis Subcommittee. Available online: http://ewh.ieee.org/soc/pes/dsacom/testfeeders/ (accessed on 16 February 2016).
- Puret, C. MV Public Distribution Networks throughout the World; Schneider Electric Cahier Technique: Rueil-Malmaison, France, 1992. [Google Scholar]
- Bokhari, A.; Alkan, A.; Dogan, R.; Diaz-Aguiló, M.; de León, F.; Czarkowski, D.; Zabar, Z.; Birenbaum, L.; Noel, A.; Uosef, R.E. Experimental Determination of the ZIP coefficients for modern residential, commercial, and industrial loads. IEEE Trans. Power Deliv. 2014, 29, 1372–1381. [Google Scholar] [CrossRef]


| Bus Number | Heavy Load Condition | Light Load Condition | ||
|---|---|---|---|---|
| Active Power (MW) | Reactive Power (MVAR) | Active Power (MW) | Reactive Power (MVAR) | |
| 701 | 0.6300 | 0.3150 | 0.1260 | 0.0630 |
| 712 | 0.0850 | 0.0400 | 0.0170 | 0.0080 |
| 713 | 0.0850 | 0.0400 | 0.0170 | 0.0080 |
| 714 | 0.0378 | 0.0180 | 0.0075 | 0.0036 |
| 718 | 0.0850 | 0.0400 | 0.0170 | 0.0080 |
| 720 | 0.0850 | 0.0400 | 0.0170 | 0.0080 |
| 722 | 0.1608 | 0.0800 | 0.0322 | 0.0160 |
| 724 | 0.0420 | 0.0210 | 0.0084 | 0.0042 |
| 725 | 0.0420 | 0.0210 | 0.0084 | 0.0042 |
| 727 | 0.0420 | 0.0210 | 0.0084 | 0.0042 |
| 728 | 0.1260 | 0.0630 | 0.0252 | 0.0126 |
| 729 | 0.0420 | 0.0210 | 0.0084 | 0.0042 |
| 730 | 0.0850 | 0.0400 | 0.0170 | 0.0080 |
| 731 | 0.0850 | 0.0400 | 0.0170 | 0.0080 |
| 732 | 0.0420 | 0.0210 | 0.0084 | 0.0042 |
| 733 | 0.0850 | 0.0400 | 0.0170 | 0.0080 |
| 734 | 0.0420 | 0.0210 | 0.0084 | 0.0042 |
| 735 | 0.0850 | 0.0400 | 0.0170 | 0.0080 |
| 736 | 0.0420 | 0.0210 | 0.0084 | 0.0042 |
| 737 | 0.1400 | 0.0700 | 0.0280 | 0.0140 |
| 738 | 0.1260 | 0.0620 | 0.0252 | 0.0124 |
| 740 | 0.0850 | 0.0400 | 0.0170 | 0.0080 |
| 741 | 0.0420 | 0.0210 | 0.0084 | 0.0042 |
| 742 | 0.0930 | 0.0441 | 0.0186 | 0.0088 |
| 744 | 0.0420 | 0.0210 | 0.0084 | 0.0042 |
| Total | 2.457 | 1.201 | 0.4913 | 0.2402 |
| Bus Number | Impedance (pu) | ||
|---|---|---|---|
| From | To | Resistance | Reactance |
| 799 | 701 | 0.004473 | 0.002951 |
| 701 | 702 | 0.003770 | 0.002364 |
| 702 | 705 | 0.006928 | 0.002570 |
| 705 | 712 | 0.004156 | 0.001542 |
| 705 | 742 | 0.005540 | 0.002057 |
| 702 | 713 | 0.003849 | 0.002002 |
| 713 | 704 | 0.005557 | 0.002892 |
| 704 | 714 | 0.001385 | 0.000514 |
| 714 | 718 | 0.001385 | 0.000514 |
| 704 | 720 | 0.008551 | 0.004449 |
| 720 | 707 | 0.015931 | 0.005913 |
| 707 | 722 | 0.002078 | 0.000771 |
| 707 | 724 | 0.013158 | 0.004885 |
| 720 | 706 | 0.006416 | 0.003336 |
| 706 | 725 | 0.004850 | 0.001800 |
| 702 | 703 | 0.005184 | 0.003251 |
| 703 | 727 | 0.004156 | 0.001542 |
| 727 | 744 | 0.002993 | 0.001557 |
| 744 | 728 | 0.003463 | 0.001285 |
| 744 | 729 | 0.004850 | 0.001800 |
| 703 | 730 | 0.006416 | 0.003336 |
| 730 | 709 | 0.002138 | 0.001112 |
| 709 | 731 | 0.006416 | 0.003336 |
| 709 | 708 | 0.003421 | 0.001780 |
| 708 | 732 | 0.005540 | 0.002056 |
| 708 | 733 | 0.003421 | 0.001780 |
| 733 | 734 | 0.005987 | 0.003115 |
| 734 | 710 | 0.009007 | 0.003343 |
| 710 | 735 | 0.003463 | 0.001285 |
| 710 | 736 | 0.022165 | 0.008226 |
| 734 | 737 | 0.006842 | 0.003559 |
| 737 | 738 | 0.004276 | 0.002225 |
| 738 | 711 | 0.004276 | 0.002225 |
| 711 | 740 | 0.003463 | 0.001285 |
| 711 | 741 | 0.004276 | 0.002225 |
| DG Bus Number | Qavail | ||
|---|---|---|---|
| Case 1 | Case 2 | Case 3 | |
| 720 | −46.41% | −5.63% | - |
| 730 | −88.21% | −12.96% | - |
| 741 | −71.26 | 50% | - |
| Method | Line loss (kW) | ||
|---|---|---|---|
| Case 1 | Case 2 | Case 3 | |
| Qavail = 0% | 29.6 | 69.5 | 3.1 |
| Qavail = 50% | 37.2 | 84.0 | - |
| Qavail = 100% | 42.5 | 117.7 | - |
| Optimal | 16.2 | 74.3 | - |
© 2016 by the authors; licensee MDPI, Basel, Switzerland. This article is an open access article distributed under the terms and conditions of the Creative Commons Attribution (CC-BY) license (http://creativecommons.org/licenses/by/4.0/).
Share and Cite
Kim, Y.-S.; Kim, G.-H.; Lee, J.-D.; Cho, C. New Requirements of the Voltage/VAR Function for Smart Inverter in Distributed Generation Control. Energies 2016, 9, 929. https://doi.org/10.3390/en9110929
Kim Y-S, Kim G-H, Lee J-D, Cho C. New Requirements of the Voltage/VAR Function for Smart Inverter in Distributed Generation Control. Energies. 2016; 9(11):929. https://doi.org/10.3390/en9110929
Chicago/Turabian StyleKim, Yun-Su, Gyeong-Hun Kim, Jae-Duck Lee, and Changhee Cho. 2016. "New Requirements of the Voltage/VAR Function for Smart Inverter in Distributed Generation Control" Energies 9, no. 11: 929. https://doi.org/10.3390/en9110929