1. Introduction
Generating electricity using photovoltaic (PV) solar energy modules is getting more popular due to recent advances in PV-cells and power condition circuitries. The ratio between produced power from the PV systems and their cost is also declining as a result of those technological developments. Power electronic converters (PECs), e.g., DC/DC and DC/AC inverters, are widely used in solar PV applications. However, PV solar systems face a number of failures, which cause concerns related to their reliability and availability, and have negative effects on customers’ satisfaction. Alam et al. [
1] listed ground faults, line-to-line faults, hot spot formation, polarity mismatch, bypass diode failures, and dust/soil formation, as the major failures in PV systems. DeGraaff et al. [
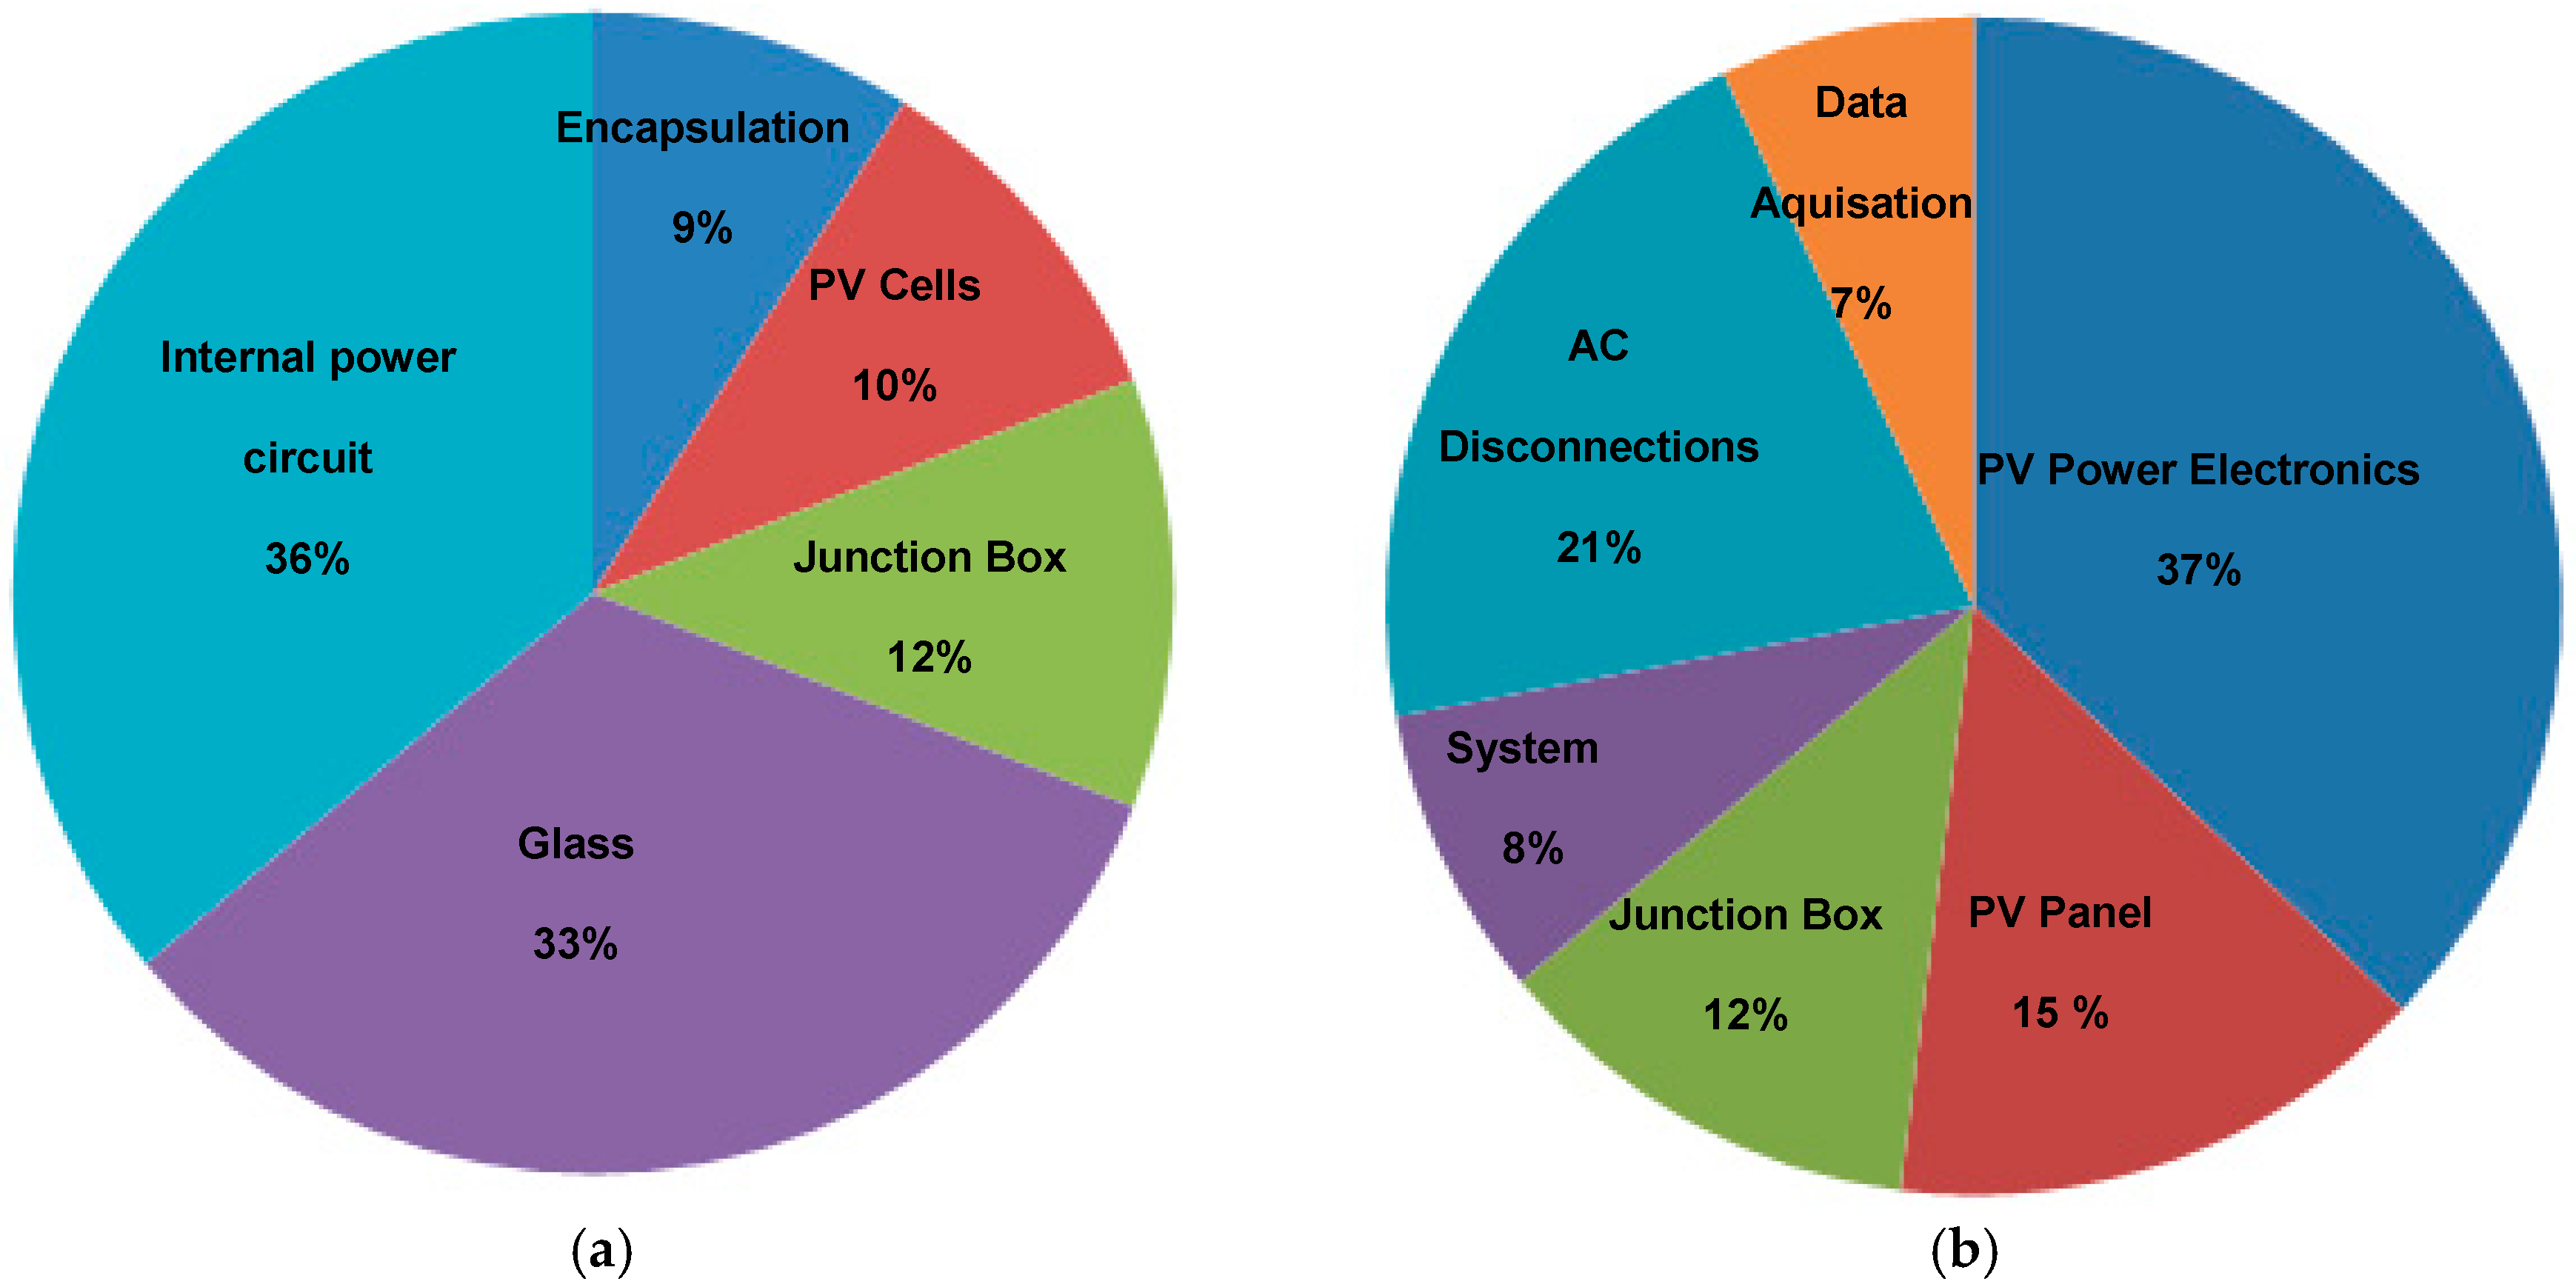
2] presented failure distribution in a PV system, over a period of 8 years. They found the highest failure rate (36%) comes from the internal electrical circuit, which includes the power electronic components, followed by junction box and cables (12%), burn marks on cells (10%), and encapsulated failure (9%) as shown in
Figure 1a. Among possible failure causes of PECs in PV installations and maintenance stated by Tsoutsos et al. [
3] are wrong positioning, where they are directly exposed to the sunlight which causes temperature fluctuations, insufficient ventilation, placement at a long distance from the PV array combiner/junction box, and installation on or near a combustible surface. A similar study proposed by Moore and Post [
4] also stated that PEC components are responsible of 37% of unscheduled maintenance which is 10% higher than the combined total of the junction box (12%) and PV panel itself (15%), as shown in
Figure 1b [
4].
Hence, about ~40% of failures in PV solar systems are caused by power electronic devices and thus rigorous analysis on the PECs lifetime is timely needed. Physics of failure approach is one method that deals with the impact of materials, defects and stress on power electronic devices [
5].
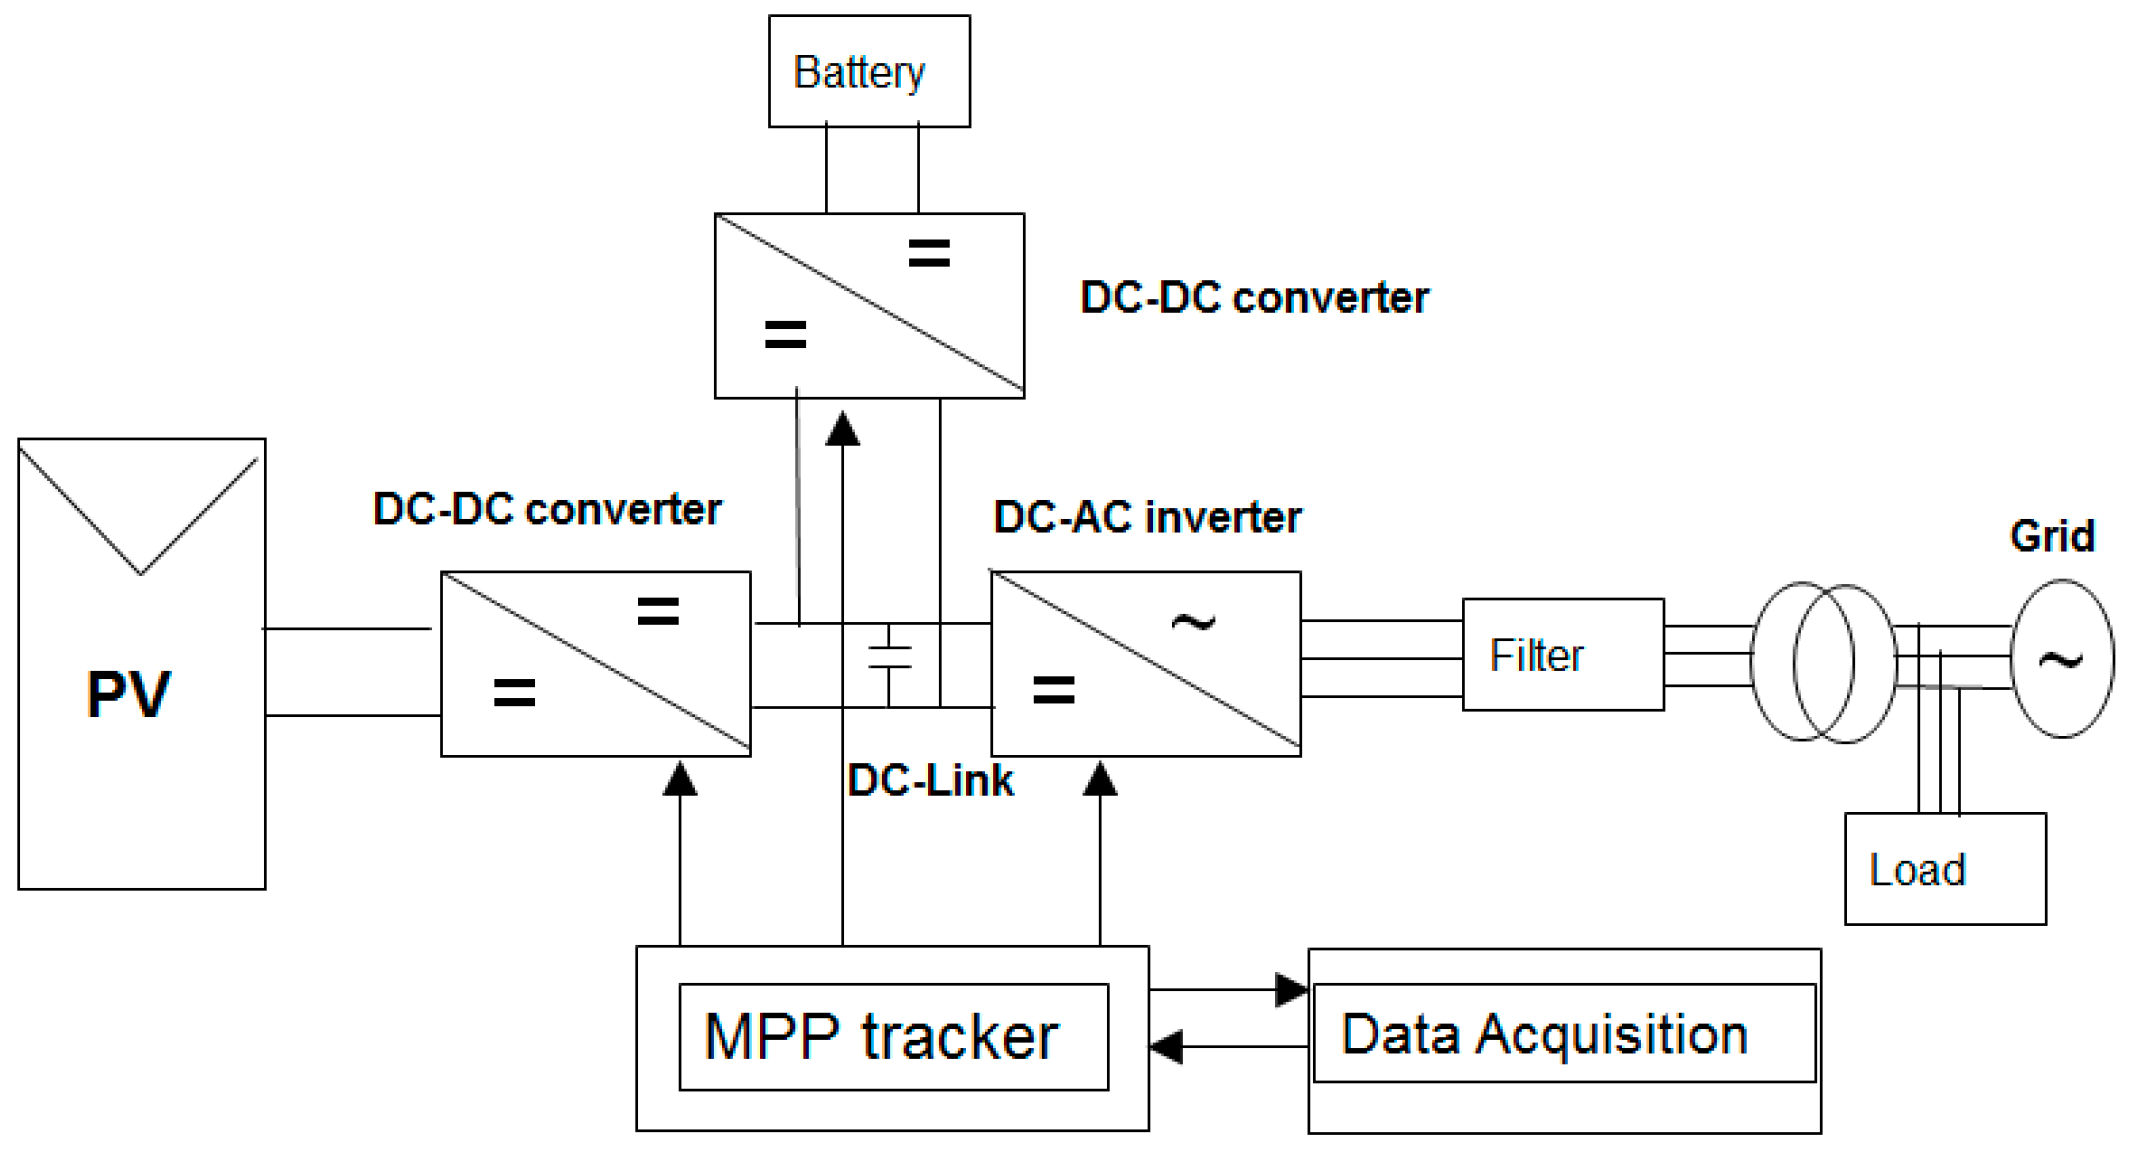
PECs governed by mathematical algorithms are embedded in solar energy applications to ensure extracting the available maximum power under different operating condition as shown in
Figure 2. Those algorithms are known as power management algorithms (PMAs) or maximum power point tracking (MPPT) algorithms that are established via a number of methodological approaches.
Perturb and observe (P&O) [
6] and incremental conductance (IC) [
7] are the most popular PMAs used. A large amount of research work has been devoted to improving the efficiency, tracking speed and accuracy of those algorithms. Zhang et al. [
8] developed the MPPT method which uses a sliding mode strategy by controlling duty cycle of a buck converter and improved efficiency by 5%. Liu et al. [
9] compared the conventional P&O method with an improved version and 93% efficiency was achieved while for the conventional one this value was 72%. Houssamo et al. [
10] presented experimental comparison between P&O and IC algorithms for maximizing the output power from a PV. Algorithms were also compared in terms of voltage ripples, dynamic responses and experimental tracking factor (TF) [
11,
12]. Azevedo et al. [
13] studied the effects of the improvements on both algorithms such as adjustment of the sampling rate, perturbation size, etc. Ishaque et al. [
14] stated that the IC method is slightly better since it gives 98.5% MPPT efficiency compared to 98.3% of P&O, based on a study conducted on a MPPT converter attached to a PV array simulator. It was also observed that the performance of IC is highly dependent on its step size, especially at low insolation levels. Dash et al. [
15] proposed that although the P&O algorithm is easier to implement, IC is more accurate under rapidly changing irradiance conditions. The DSP controller feature of the dSPACE real time interface (RTI) system is widely used in the literature for implementing MPPT algorithms and to provide duty cycle control signal for PECs employed within PV systems. For instance, Mahdi et al. [
16] implemented an improved P&O algorithm to ensure optimal operating points of a PV system using a dSPACE DSP controller. Mathematical equations which describe the nonlinear characteristics of a PV panel to design a MPPT can also be implemented by using dSPACE as presented in [
17]. Graditi et al. [
18,
19] presented energy performances and reliability evaluation of converters [
20]. A longer lifetime inverter for PV AC modules was also studied in [
21]. However, in the literature, to the best knowledge of the authors of this article, no comparative study has been presented about the electro-thermal effects of the MPPT algorithms on the DC/DC converters employed within PV systems, although the temperature influence and importance of the electro-thermal design were mentioned in [
22,
23] and an improved thermal profile for PV inverters was assessed by power limit control method within the P&O method in [
24,
25]. Most of the studies focused on comparing the tracking efficiency, signal ripple, speed response, sensitivity to environmental conditions, and ease of hardware and software implementation and converter suitability among MPPT methods. However, the lifetime of the DC/DC converter which operates the MPPT has a vital effect on the reliability of solar PV applications. The operating principles of each MPPT algorithm also differ from each other. This produces different power loss profiles which cause dissimilar operating temperature amplitude and fluctuations for PECs. Therefore, it is essential to explore the operational difference characteristics for reliability assessment among MPPT algorithms.
This work investigates the effects of IC and P&O PMAs on the thermal stresses and reliability of PEC modules. It starts by implementing PV model, the associated MPPT algorithms and a realistic electro-thermal model of a power electronic module’s switching component (insulated gate bipolar transistor, IGBT) in
Section 2. Experimental setup and DC-DC boost converter real time temperature monitoring interfaced with dSPACE are demonstrated in
Section 3.
Section 4 presents the electro-thermal performance and reliability comparison of PECs under the IC and P&O algorithms. Power electronics modules lifetime analysis and effects under both algorithms are discussed in
Section 5. A broad discussion on the simulated and experimental results was presented in
Section 6 and Conclusions are summarized in the final section.
In order to extend existing studies in literature, an electro-thermal model of the PEC was implemented. Temperature variations of IGBT were determined when IC and P&O algorithms were applied as MPPT method and these profiles were used in reliability models for lifetime consumption estimation.
2. Photovoltaic Solar System Modelling and Characteristic
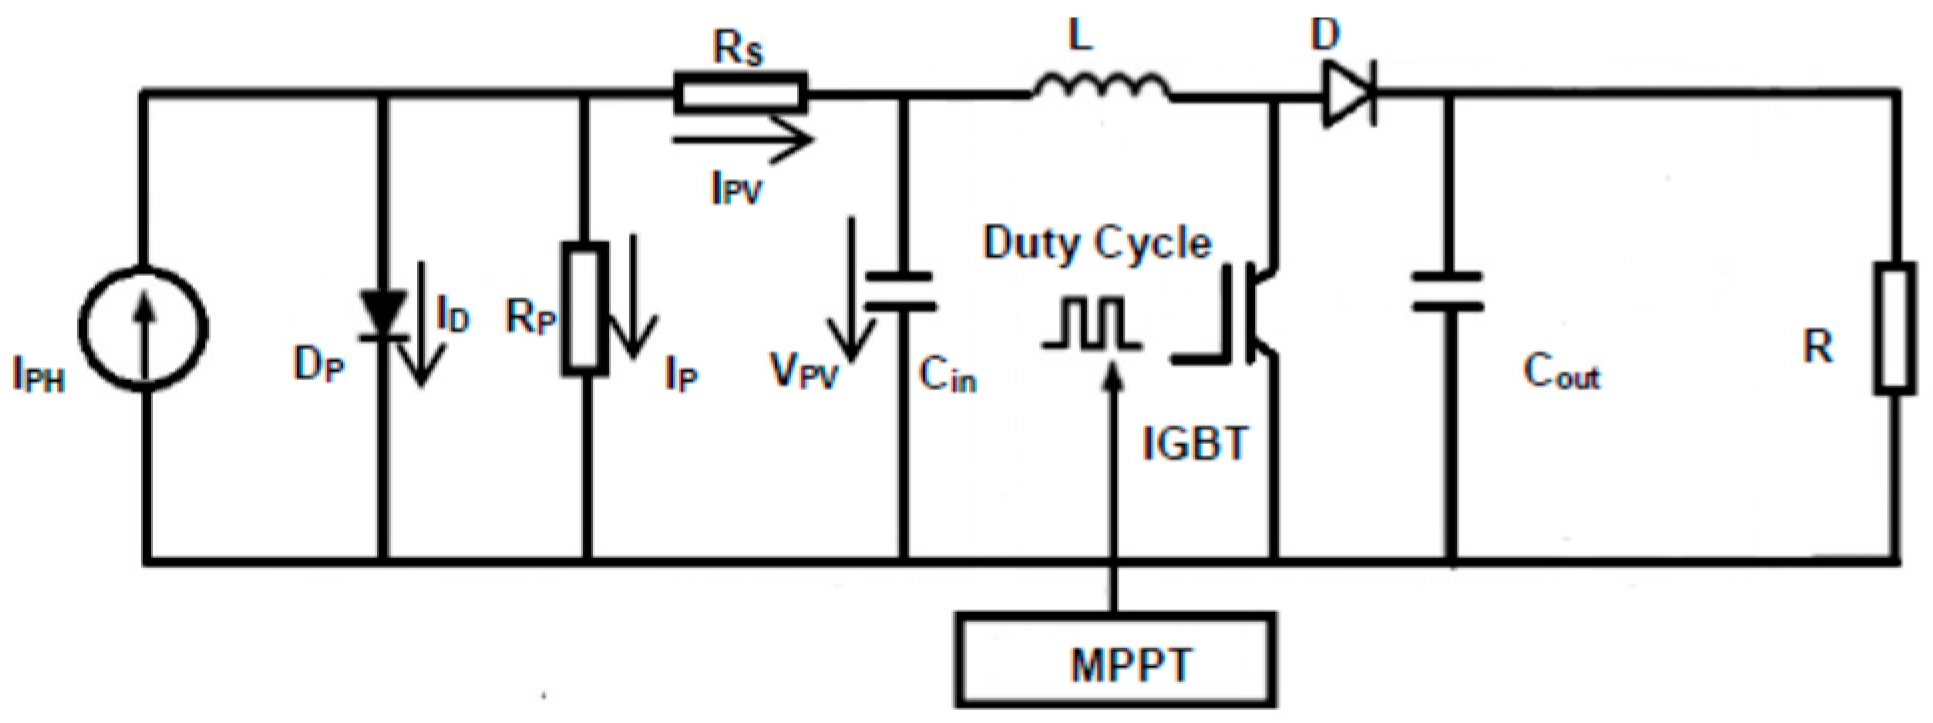
The PV solar cell internal photocurrent,
IPH, within PV cell equivalent circuit is shown in
Figure 3 along with the boost converter for MPPT application purposes.
A parallel diode,
DP, internal series and parallel resistances (
RS and
RP) can also be seen in this circuit along with total current and voltage
IPV and
VPV, respectively. Total current,
IPV, can be represented with respect to diode,
ID and parallel resistance currents,
IP as in Equations (1) and (2):
where
I0 is the total diffusion current,
VPV is the output voltage,
q is the charge of one electron,
Tc is the solar cell temperature,
k is the Boltzmann constant and
A is junction perfection factor which determines the diode deviation from the ideal p-n junction. For deriving the numerical model of a PV module, Equation (2) can be rearranged to Equation (3):
where for
np cells in parallel and
ns cells in series the
and
. Compared to the
Rs, the value of
Rp has little impact on the output characteristics of PV cells. Hence, by neglecting the
Rp, PV voltage,
VPV, is represented as a function of the current,
IPV [
12], as:
The characteristic of the PV module used in this work is listed in
Table 1 [
26,
27]. Based on Equations (1)–(4), electrical model of this component was implemented by using MATLAB/Simulink.
2.1. Power Management Algorithms
P&O and IC algorithms were implemented for MPPT purposes in MATLAB/Simulink. The maximum power point, expression,
PPV,mpp, can be described in Equation (5):
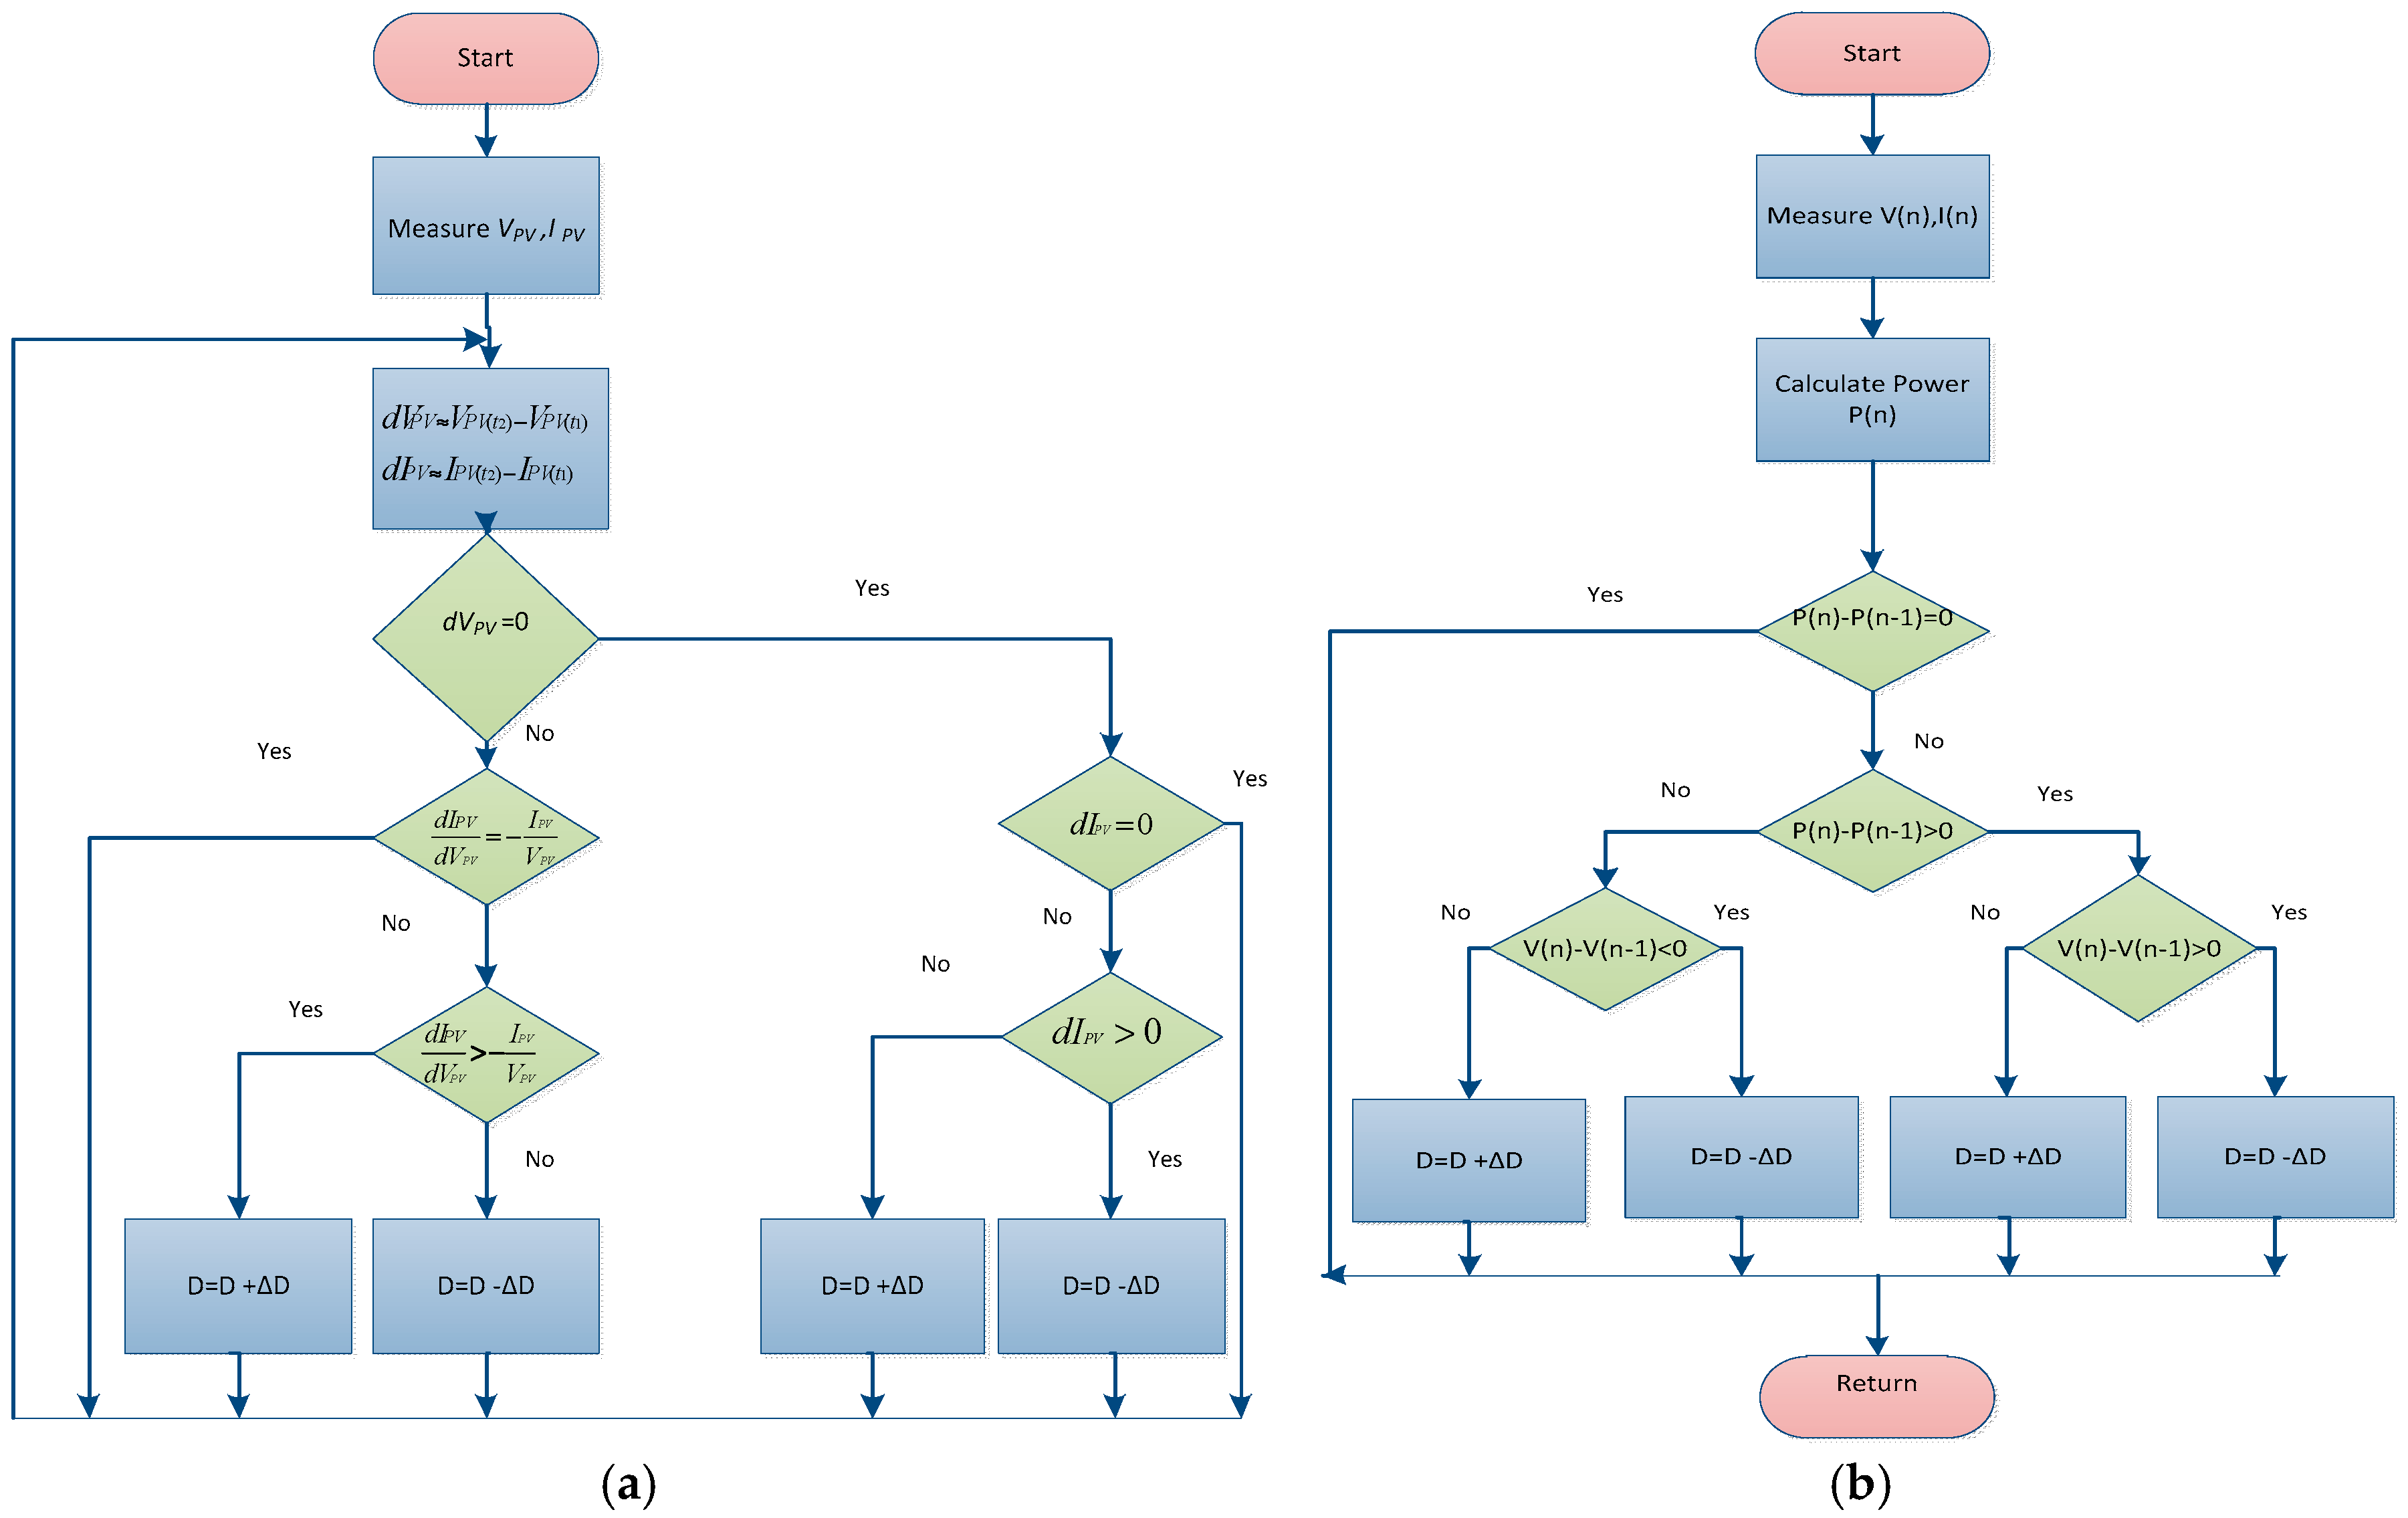
2.1.1. Incremental Conductance Maximum Power Point Tracking Algorithm
IC MPPT method is based on the derivative of the power with respect to the voltage at
P-
V curve which is equivalent to zero at the maximum power point. Hence, by comparing the instantaneous conductance (
Ipv/Vpv) with incremental one
(∆
Ipv/∆
Vpv) the maximum power point is tracked based on the sign of the ∆
Ppv/∆
Vpv and varying the operating voltage. A flowchart of IC methods can be seen in
Figure 4a.
The maximum power point of solar PV module can be defined as:
From Equation (7), operating points of the PV module with respect to IC algorithm can be written as:
where the module is operated at MPP and the
Vpv should be held as it is:
where the
Vpv should be increased by applying constant steps to reach
Vpv,mpp:
where the
Vpv should be controlled by applying constant steps to be reduced until
Vpv,mpp.
2.1.2. Perturb & Observe Maximum Power Point Tracking Algorithm
The perturb & observe (P&O) MPPT algorithm is derived by producing disturbances to either instantaneous current or voltage which was used as a reference in this study. By changing the solar panel voltage in a small amouns, the system
I-
V operating point and hence
P-
V characteristics are changed. However, changes in the amount of power can either be positive or negative. In the case that it is positive disturbance should follow the same direction until the MPP is approached. Otherwise, perturbation direction should be changed to prevent moving further away from MPP. The step size of the disturbance can be decreased when it is closer to MPP to avoid large oscillations. A flowchart of the P&O method can be seen in
Figure 4b.
2.2. Maximum Power Point Tracking Tracking Efficiency
The MPPT tracking efficiency (
effMPPT) is the ratio between the extracted and available power during each operating condition sequence. It can be derived into Equation (11):
where
VPV(t) and
IPV(t) are the instantaneous PV voltage and current,
PPVmpp(t) is the available maximum power and
T is the period of the experimental data.
The efficiency of the MPPT was obtained for both the P&O and IC account simultaneously in order to evaluate its effects on the thermal profiles of the switching devices and to provide a detailed comparison.
2.3. Electro Thermal Model of Boost Converter within Maximum Power Point Tracking
Boost DC/DC converter was used for matching the MPP of the PV module at any irradiance and temperature level along with an MPPT control, PWM block and a load. Operating point of the PV module is changed by the duty cycle of the switching element (IGBT) according to MPPT algorithms to reach the single value of maximum power point duty cycle,
DMPP. Operating of boost converter occurs in ON and OFF stages in period of
T. During the ON stage, for
DT seconds, the IGBT is closed which results in an increase of the inductor current. The current flow through the IGBT generate conduction losses when the device is in full conduction. These losses are also in direct relationship with the duty cycle. Thermal cycling on this component results in deformation and eventual failures, which account for around 60% of overall PEC runaways. Therefore, only an electro-thermal model of this device was implemented. During OFF stage, the accumulated energy transfers into the capacitor and load resistance through the flyback diode. At this stage, no heat losses occur. For both stages, circuit equivalences of the converter, when coupled with PV module, can be written as:
Equation (12) can be simplified to derive the relationship between input/output voltage as:
Two types of energy losses occur during operation of IGBT; first, switching energy losses,
ESW, occur, over one period of switching processes due to drastic change in current /voltage across the device when the device is transitioning from the blocking state to the conducting state and vice-versa. They are divided into Turn-On and Turn-Off losses,
EON and
EOFF, for the IGBT. They can be expressed as a function of collector current
ICE, collector-emitter saturation voltage
VCE and junction temperature
TJ as shown in Equation (14):
Hence, the switching power losses,
PSW, are:
where
fsw is the switching frequency. Second, conduction power loss,
PCON, for a single device is:
3. Experimental Setup
A boost converter was constructed with specified component ratings listed in
Table 2, namely with an iron-core type inductor, a fast recovery diode and two input and output capacitors.
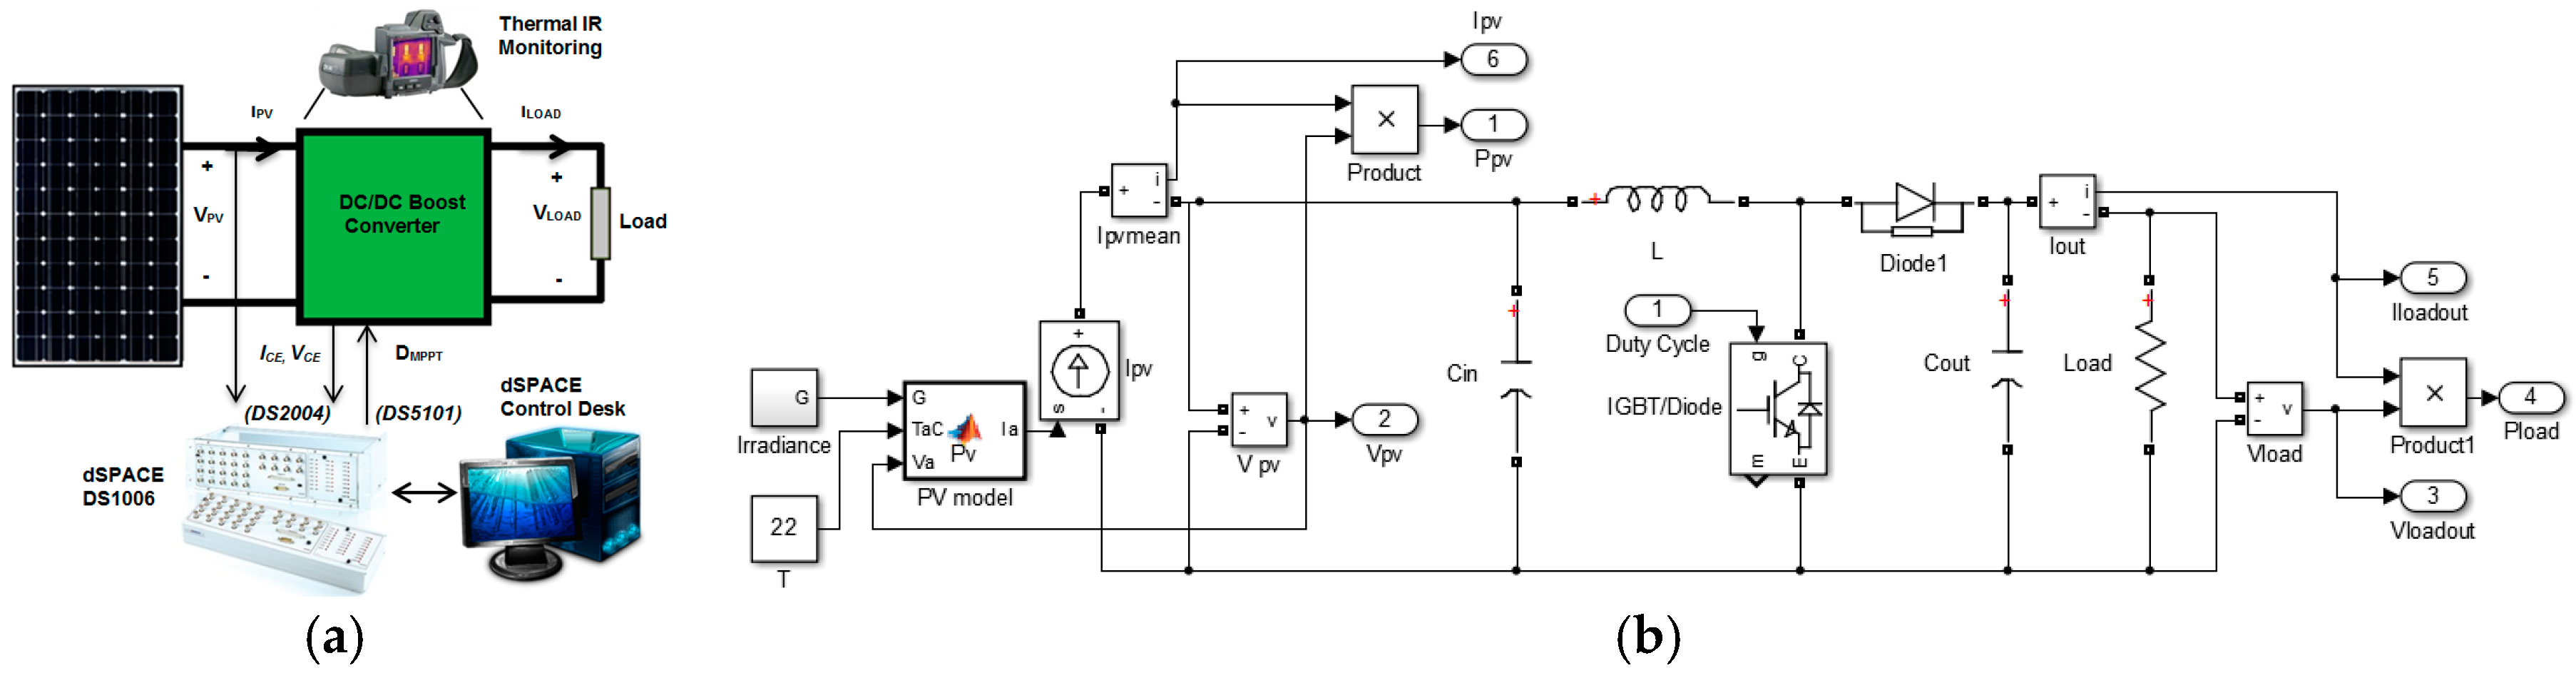
MPPT algorithms were individually implemented using Simulink and integrated with dSPACE through the control desk. Gate signals generated through MPPT blocks were provided through a DS5101 digital to analogue converter card. Due to gate requirements, gate drivers were used to reach sufficient power level. In order to isolate low power switching signal from dSPACE board and high power converter circuit, a driver circuit has been designed using HP403 opt coupler. Then the isolated gate signal is inverted by a TD351 IGBT driver in the driving circuit. This is also required in order to provide the driving signal with sufficient current and voltage level (≈15 V) to appropriately turn on and turn off the IGBT. Collector current,
Ice, and PV current,
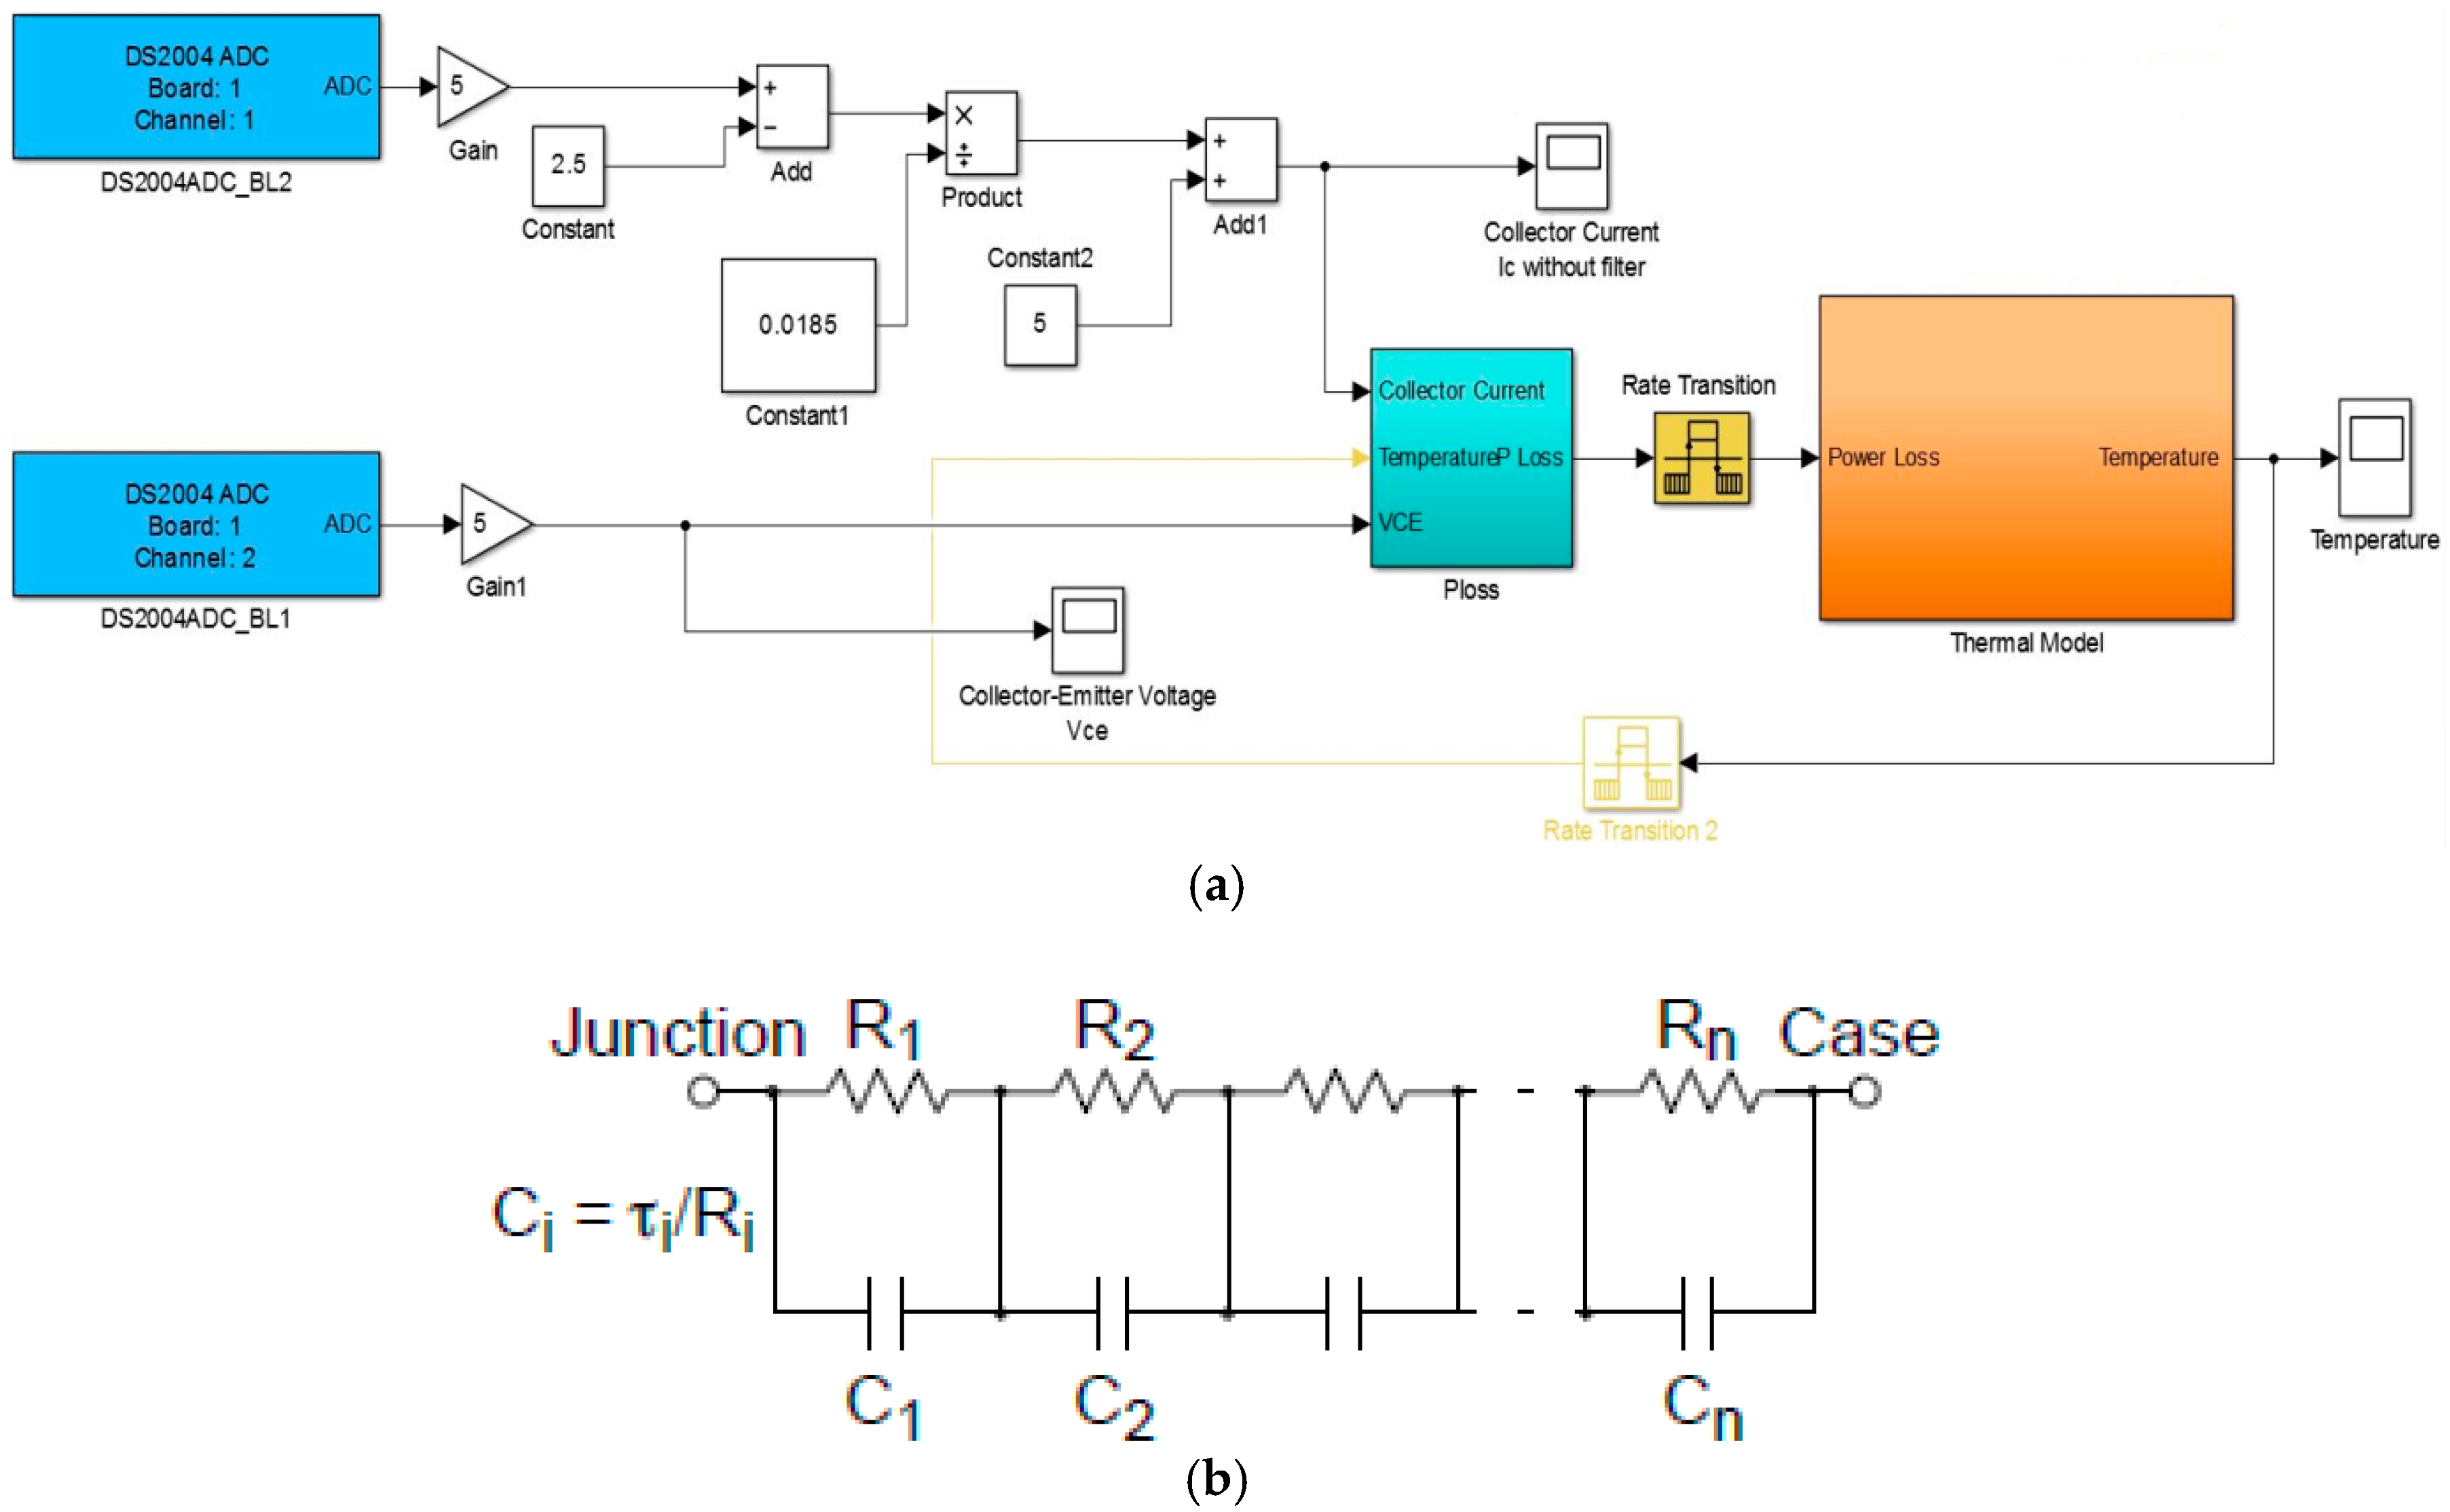
IPV, were monitored by current transducers, LA 25-NP, and were inserted dSPACE RTI through DS2004ADC as power loss and MPPT algorithm model inputs. PV and collector to emitter voltages,
VPV and
Vce were also measured for operating within same blocks as current signals. The schematic diagram of the experimental set up is shown in
Figure 5a and the Simulink model of the boost converter embedded with the PV model is presented in
Figure 5b.
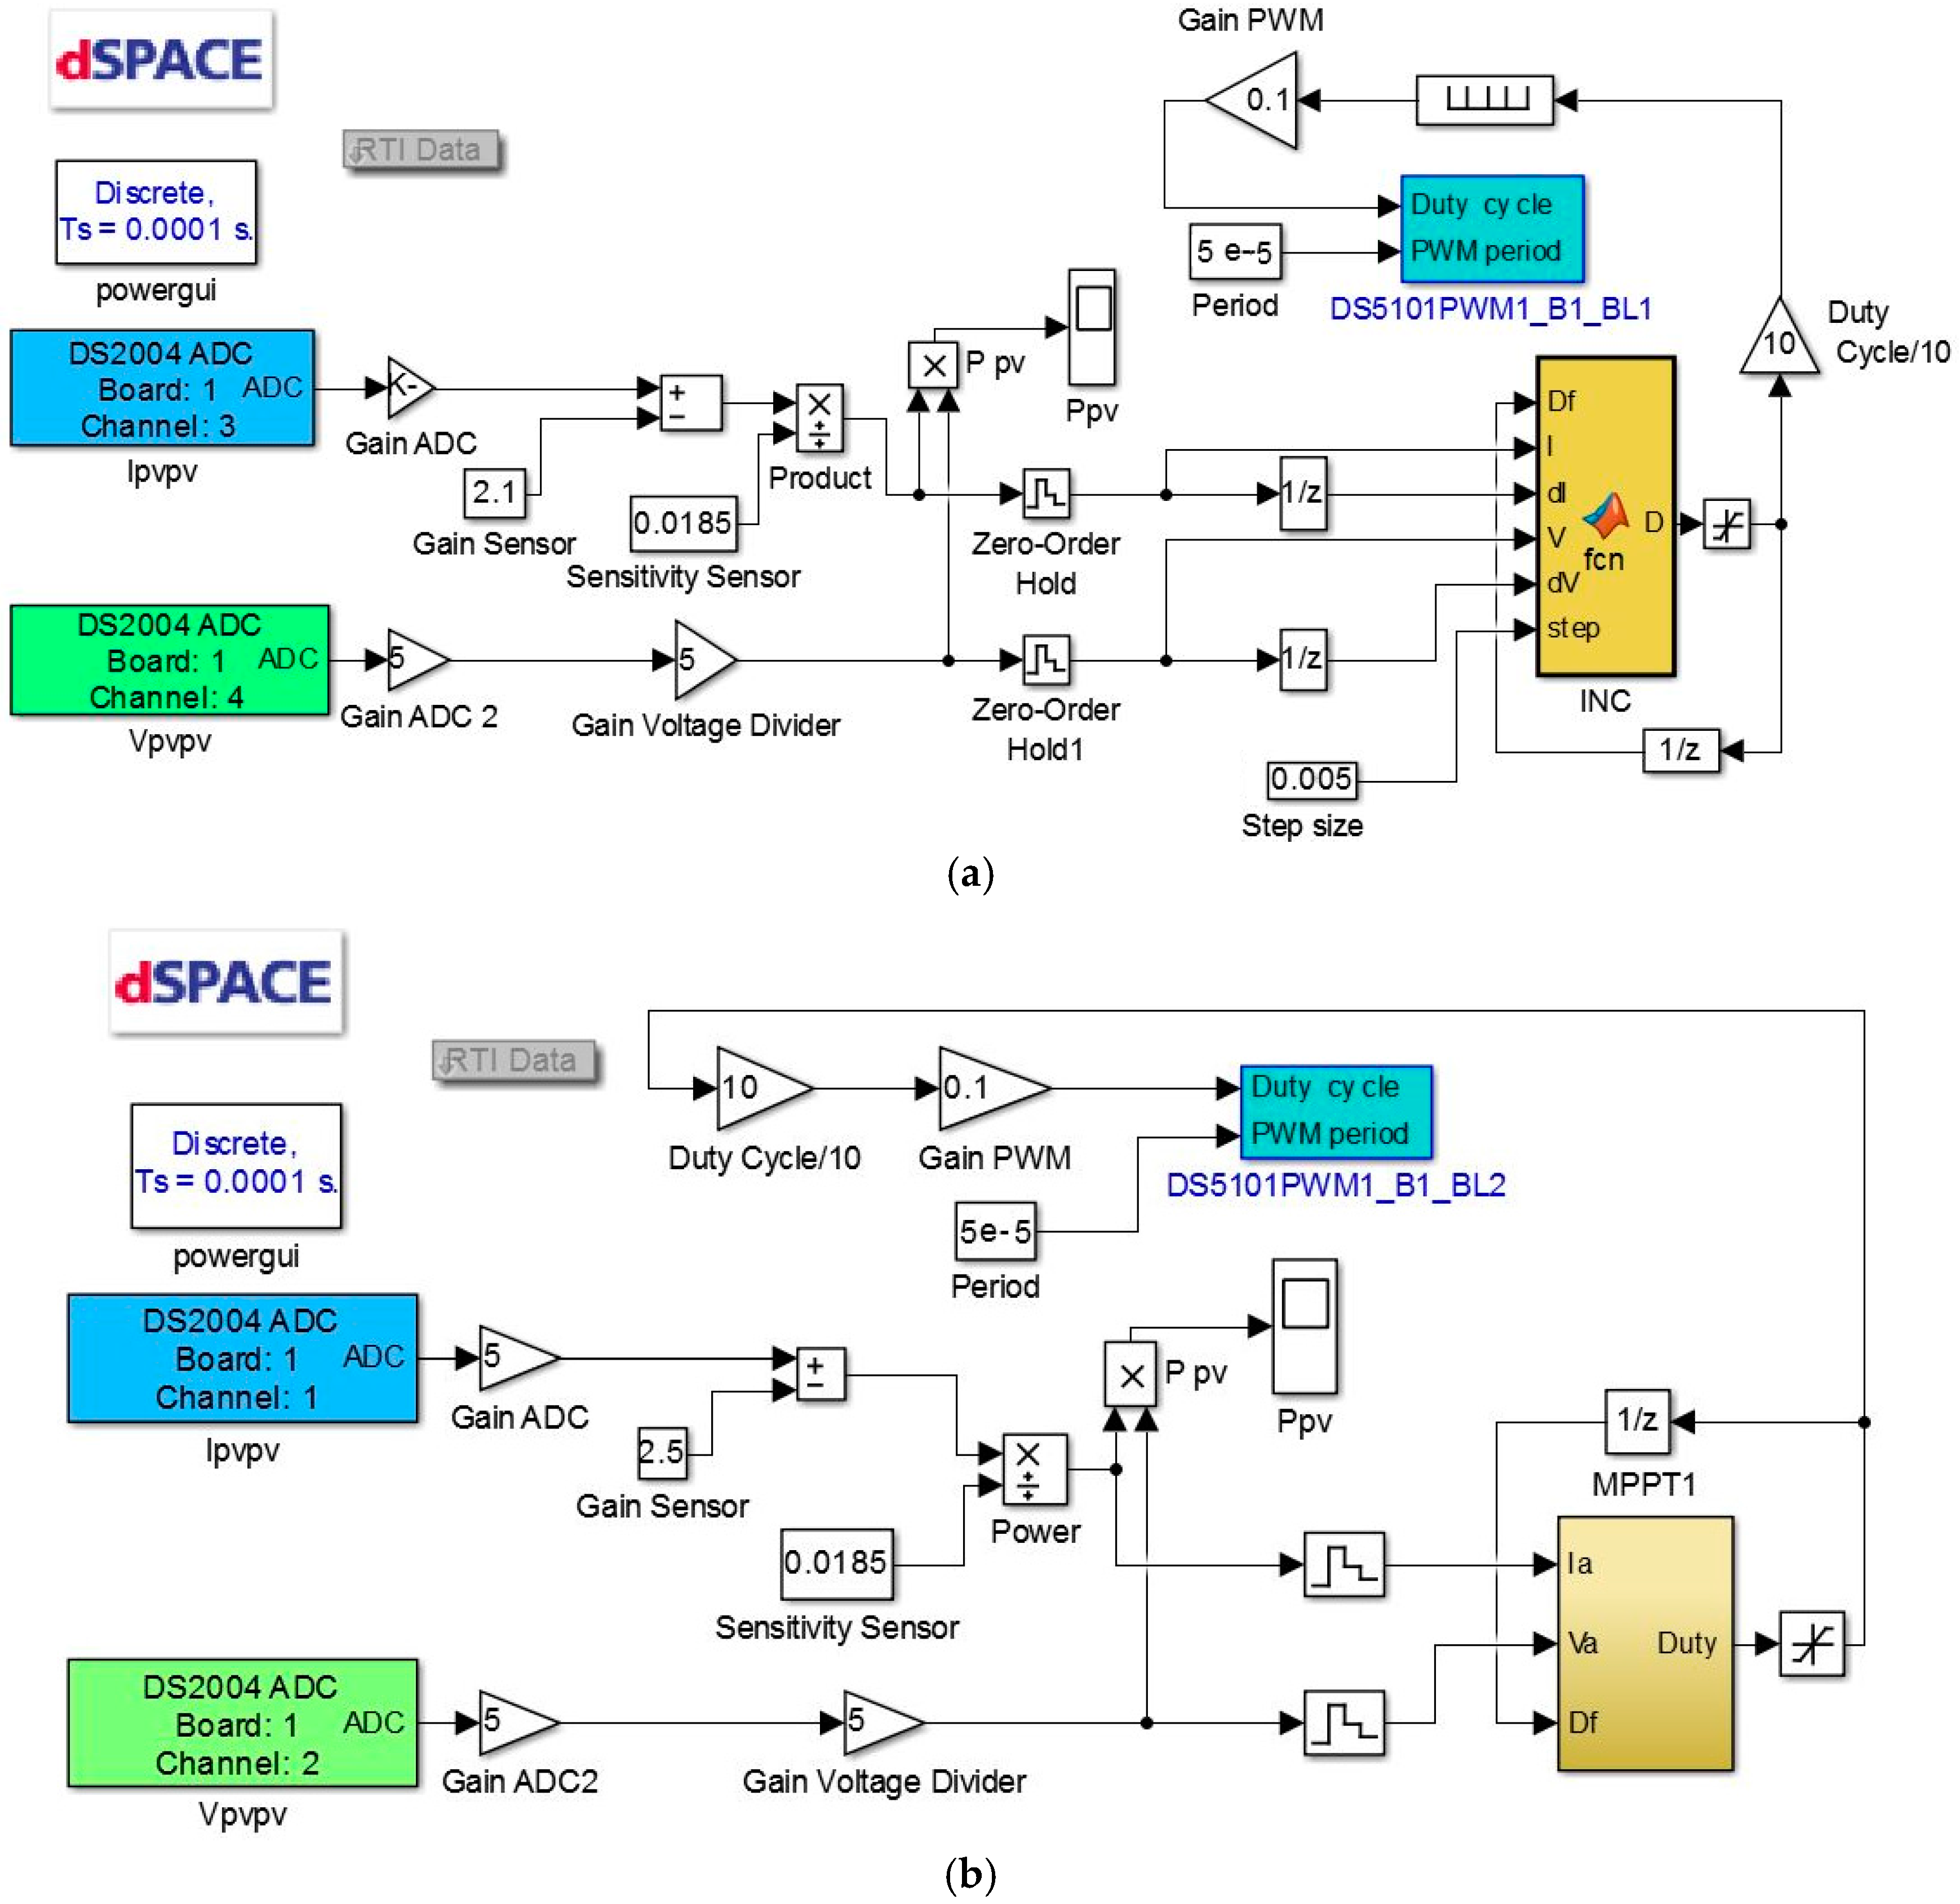
Implemented IC and P&O algorithms within Simulink and dSPACE are shown in
Figure 6. The MPPT could have been implemented by sensing the PV current and voltage to calculate the instantaneous power. Then, by comparing it with the available power, the duty cycle of the converter could be adjusted using PI controllers, multiple loops or hysteresis controllers. However, different MPPT algorithms could require different tuning parameters for a specific controller type; hence, a fair comparison between P&O and IC algorithms themselves would not be established in terms their effect on the lifetime consumption of the converters. Therefore, the control method was directly computed in the MPPT algorithms to update the duty cycle of the converters. This method is also known as the direct duty cycle MPPT. It is also advantageous since it eliminates the controller tuning and decreases the computation time efforts [
18]. The perturbation step size has significant effect on the energy efficiency especially under dynamic weather conditions. As the perturbation step size gets larger, the efficiency improves but it causes oscillations around MPP and during low irradiance level changes. Inversely, the low perturbation step size decreases the oscillations but provides low efficiencies during high irradiance level changes. In other words, this parameter plays a key role for balancing efficiency and the fluctuations around MPP. In this work, it was selected as 0.005 for both methods as a result of several tests.
Lookup tables were used to interpolate previously estimated switching energy loss profiles during switching operation. Real time power loss profiles were monitored by multiplication of these losses with the switching frequency. Then, total power loss was calculated over one switching period, in each step time as a function of collector current, Ice, collector to emitter voltage Vce and temperature by addition of switching and conduction losses.
Total power losses were then used as input to heat source within thermal model, as shown in
Figure 7a. Thermal resistance
Rth and capacitance
Cth for each individual of Foster equivalent thermal network, as shown in
Figure 7b, were extracted by curve fitting using least square method. The equivalence of foster thermal [
28] network is defined in Equation (17) as:
where
P is the heat source. Temperature,
Tj, of each layer was represented for heating source. By applying forward rectangular Euler’s rule, thermal equation in
z-domain is [
28]:
Using Simulink blocks, mathematical equivalent model was implemented in thermal block. Estimated temperature is then fed back into power loss model for continuous monitoring [
29].
5. Lifetime Comparison Analysis
Lifetime analysis for power electronic devices can be evaluated by using Weibull statistics [
34]. Devices under test are examined for determining the number of cycles to failure [
35]. Reliability of the PECs mostly depends on the associated switching elements (IGBTs), since they are the most easily damaged components [
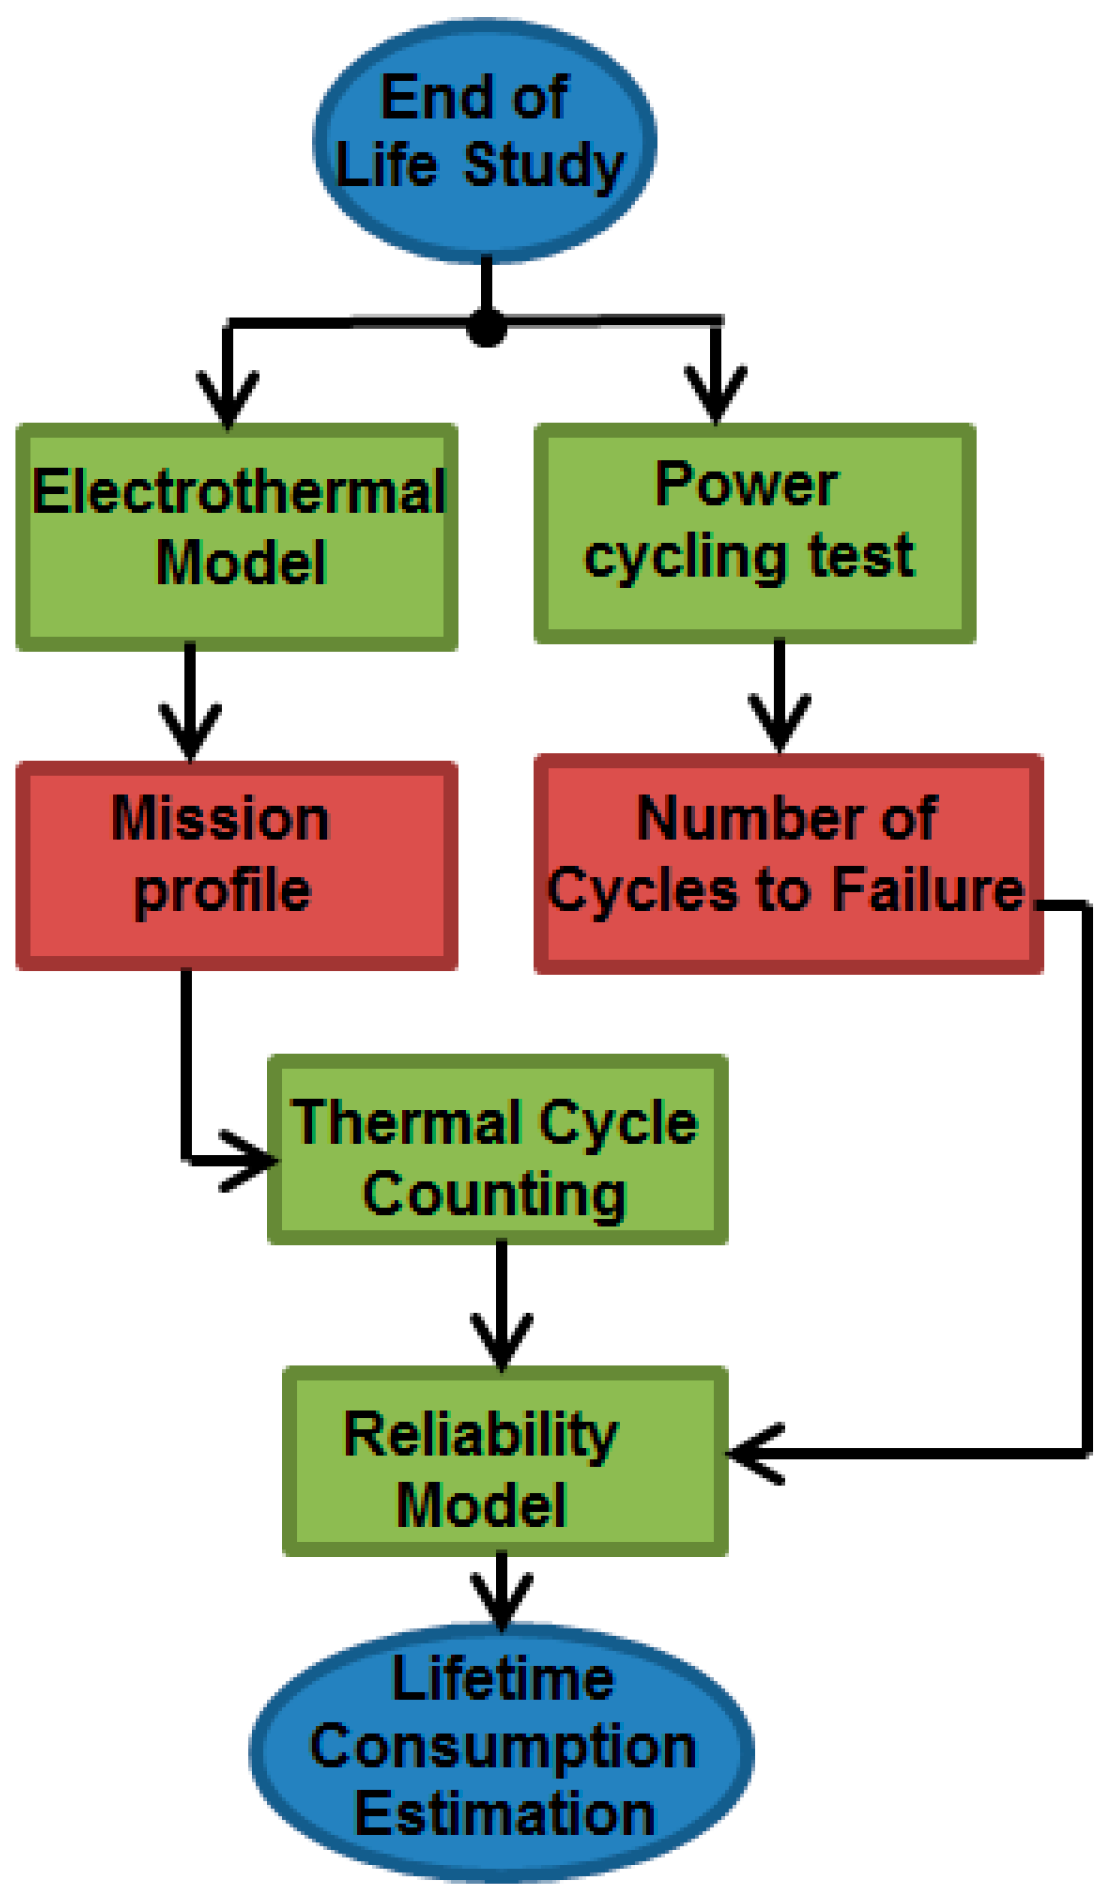
36]. The failure occurs due to the thermo-mechanical stress caused by different thermal expansion characteristics of materials among the IGBT package during temperature changes. The failure mechanisms of these devices are related to the cycling load of the module. Therefore, temperature profile of the IGBT was considered for estimating power cycling lifetime in terms of mean and cycling temperature. A schematic of the lifetime consumption study is shown in
Figure 17.
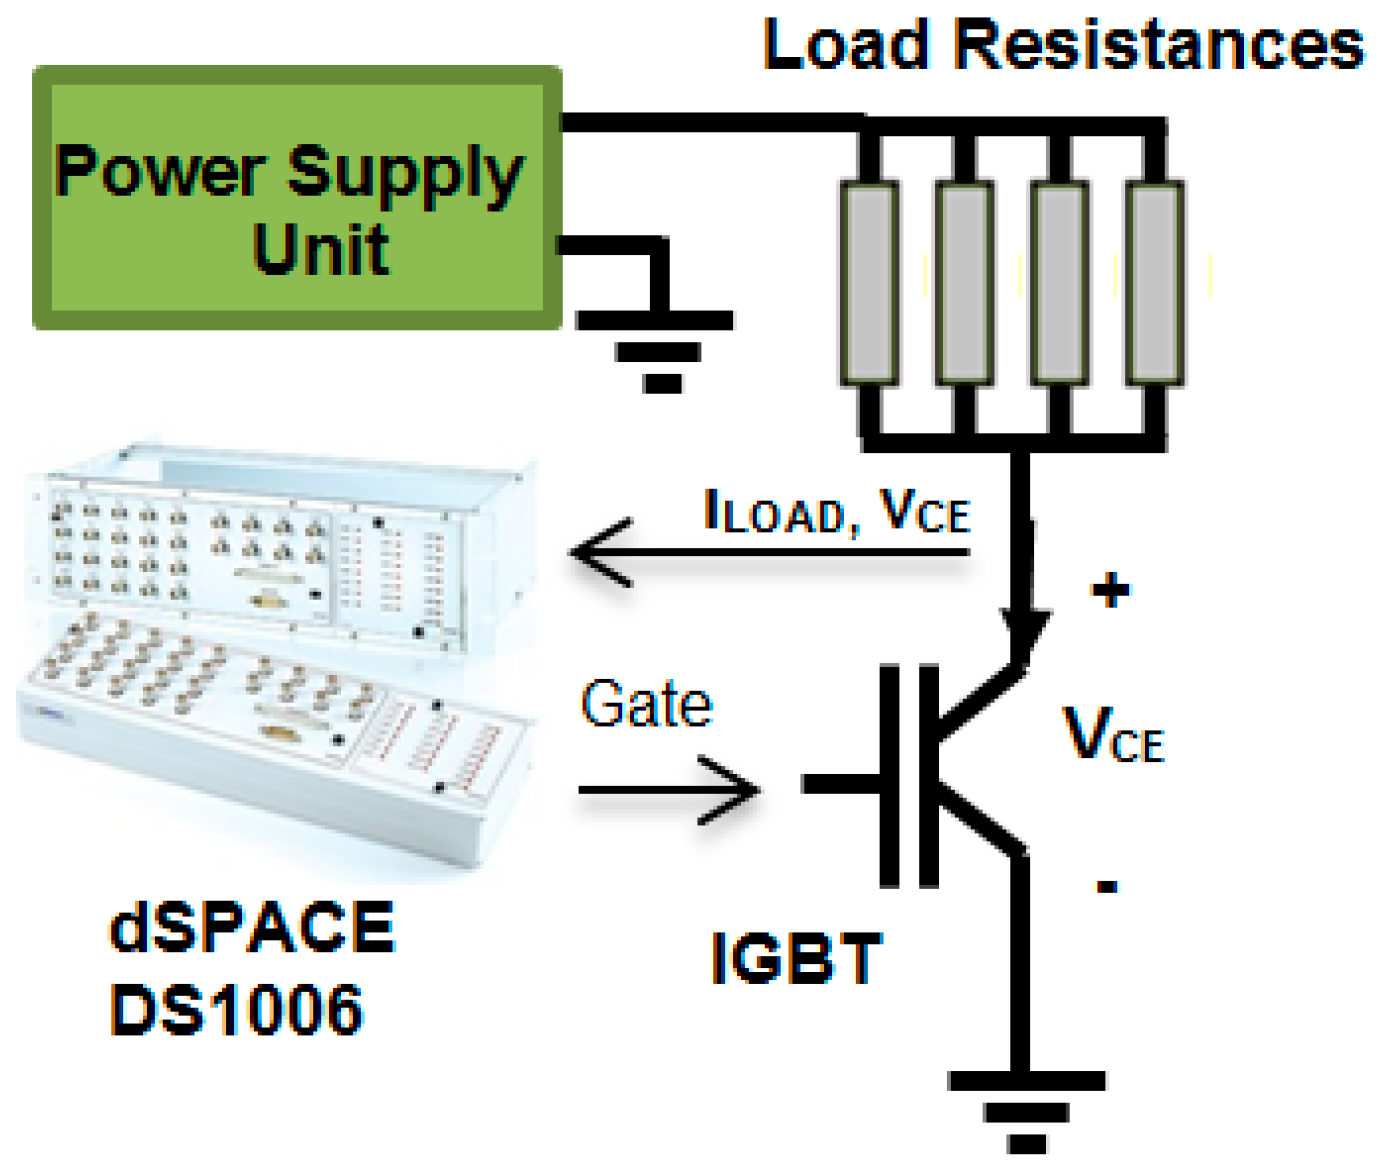
Initially, number of cycles to failure was obtained by an accelerated power cycling test. Then a temperature load history is collected; a cycle-counting algorithm is then performed to calculate number of thermal cycle across accumulation time and the cumulative number of thermal cycles are summed and compared with referenced thermal cycle to failure to lifetime. The implemented test circuit for reliability tests can be seen in
Figure 18. The gate signal duration was provided through dSPACE to turn on and off the device. Load current was conducted through power supply unit for generating temperature swing.
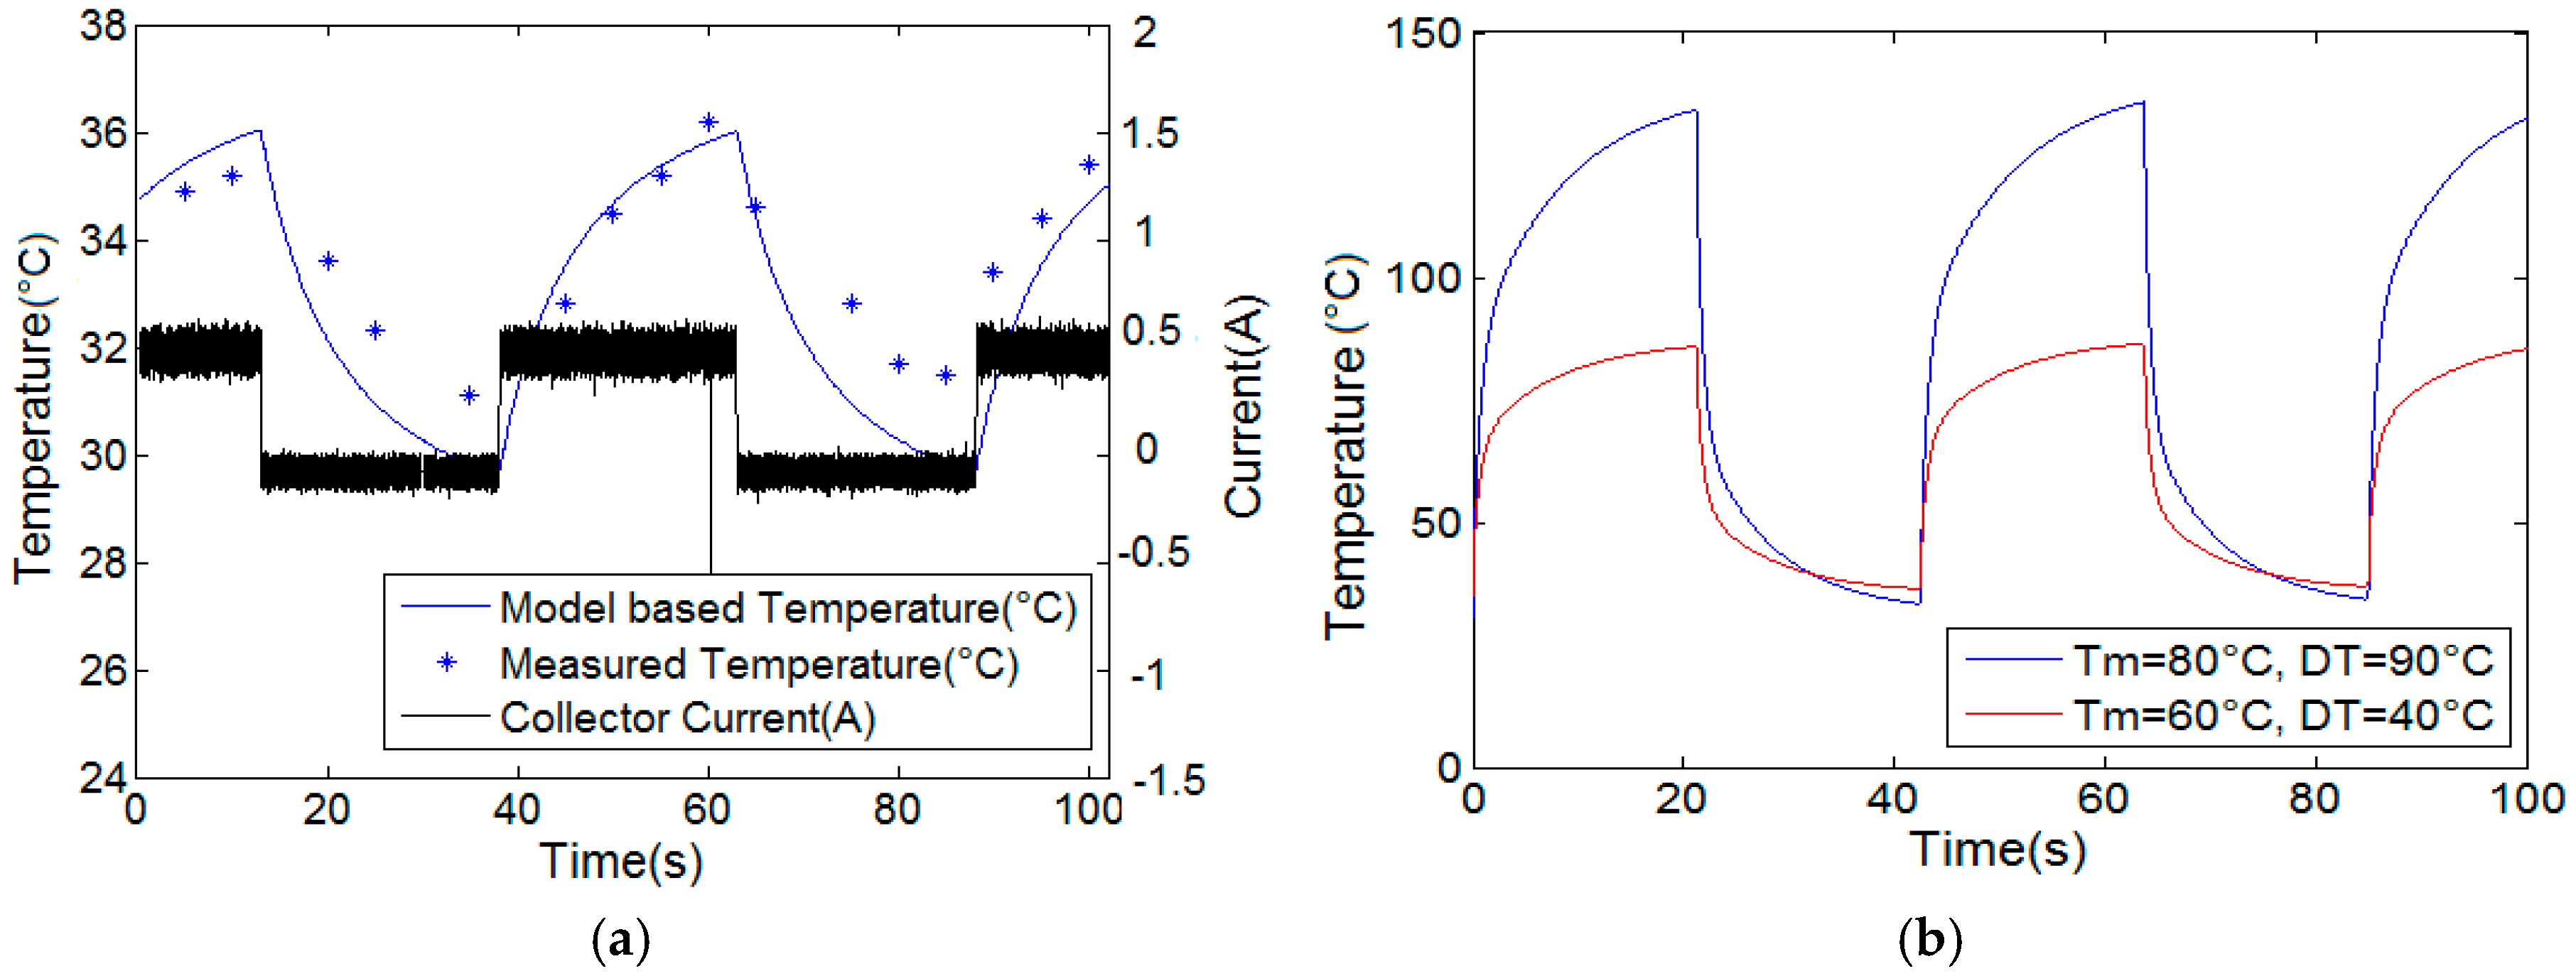
Modelled and measured temperatures are shown in
Figure 19a with respect to device current. A total of four different test conditions were applied for the failure test. Model-based data is shown in
Figure 19b when the temperature swing (∆
T) was adjusted as 90 °C and 40 °C with average temperatures (
Tm) of 80 °C and 60°C, respectively.
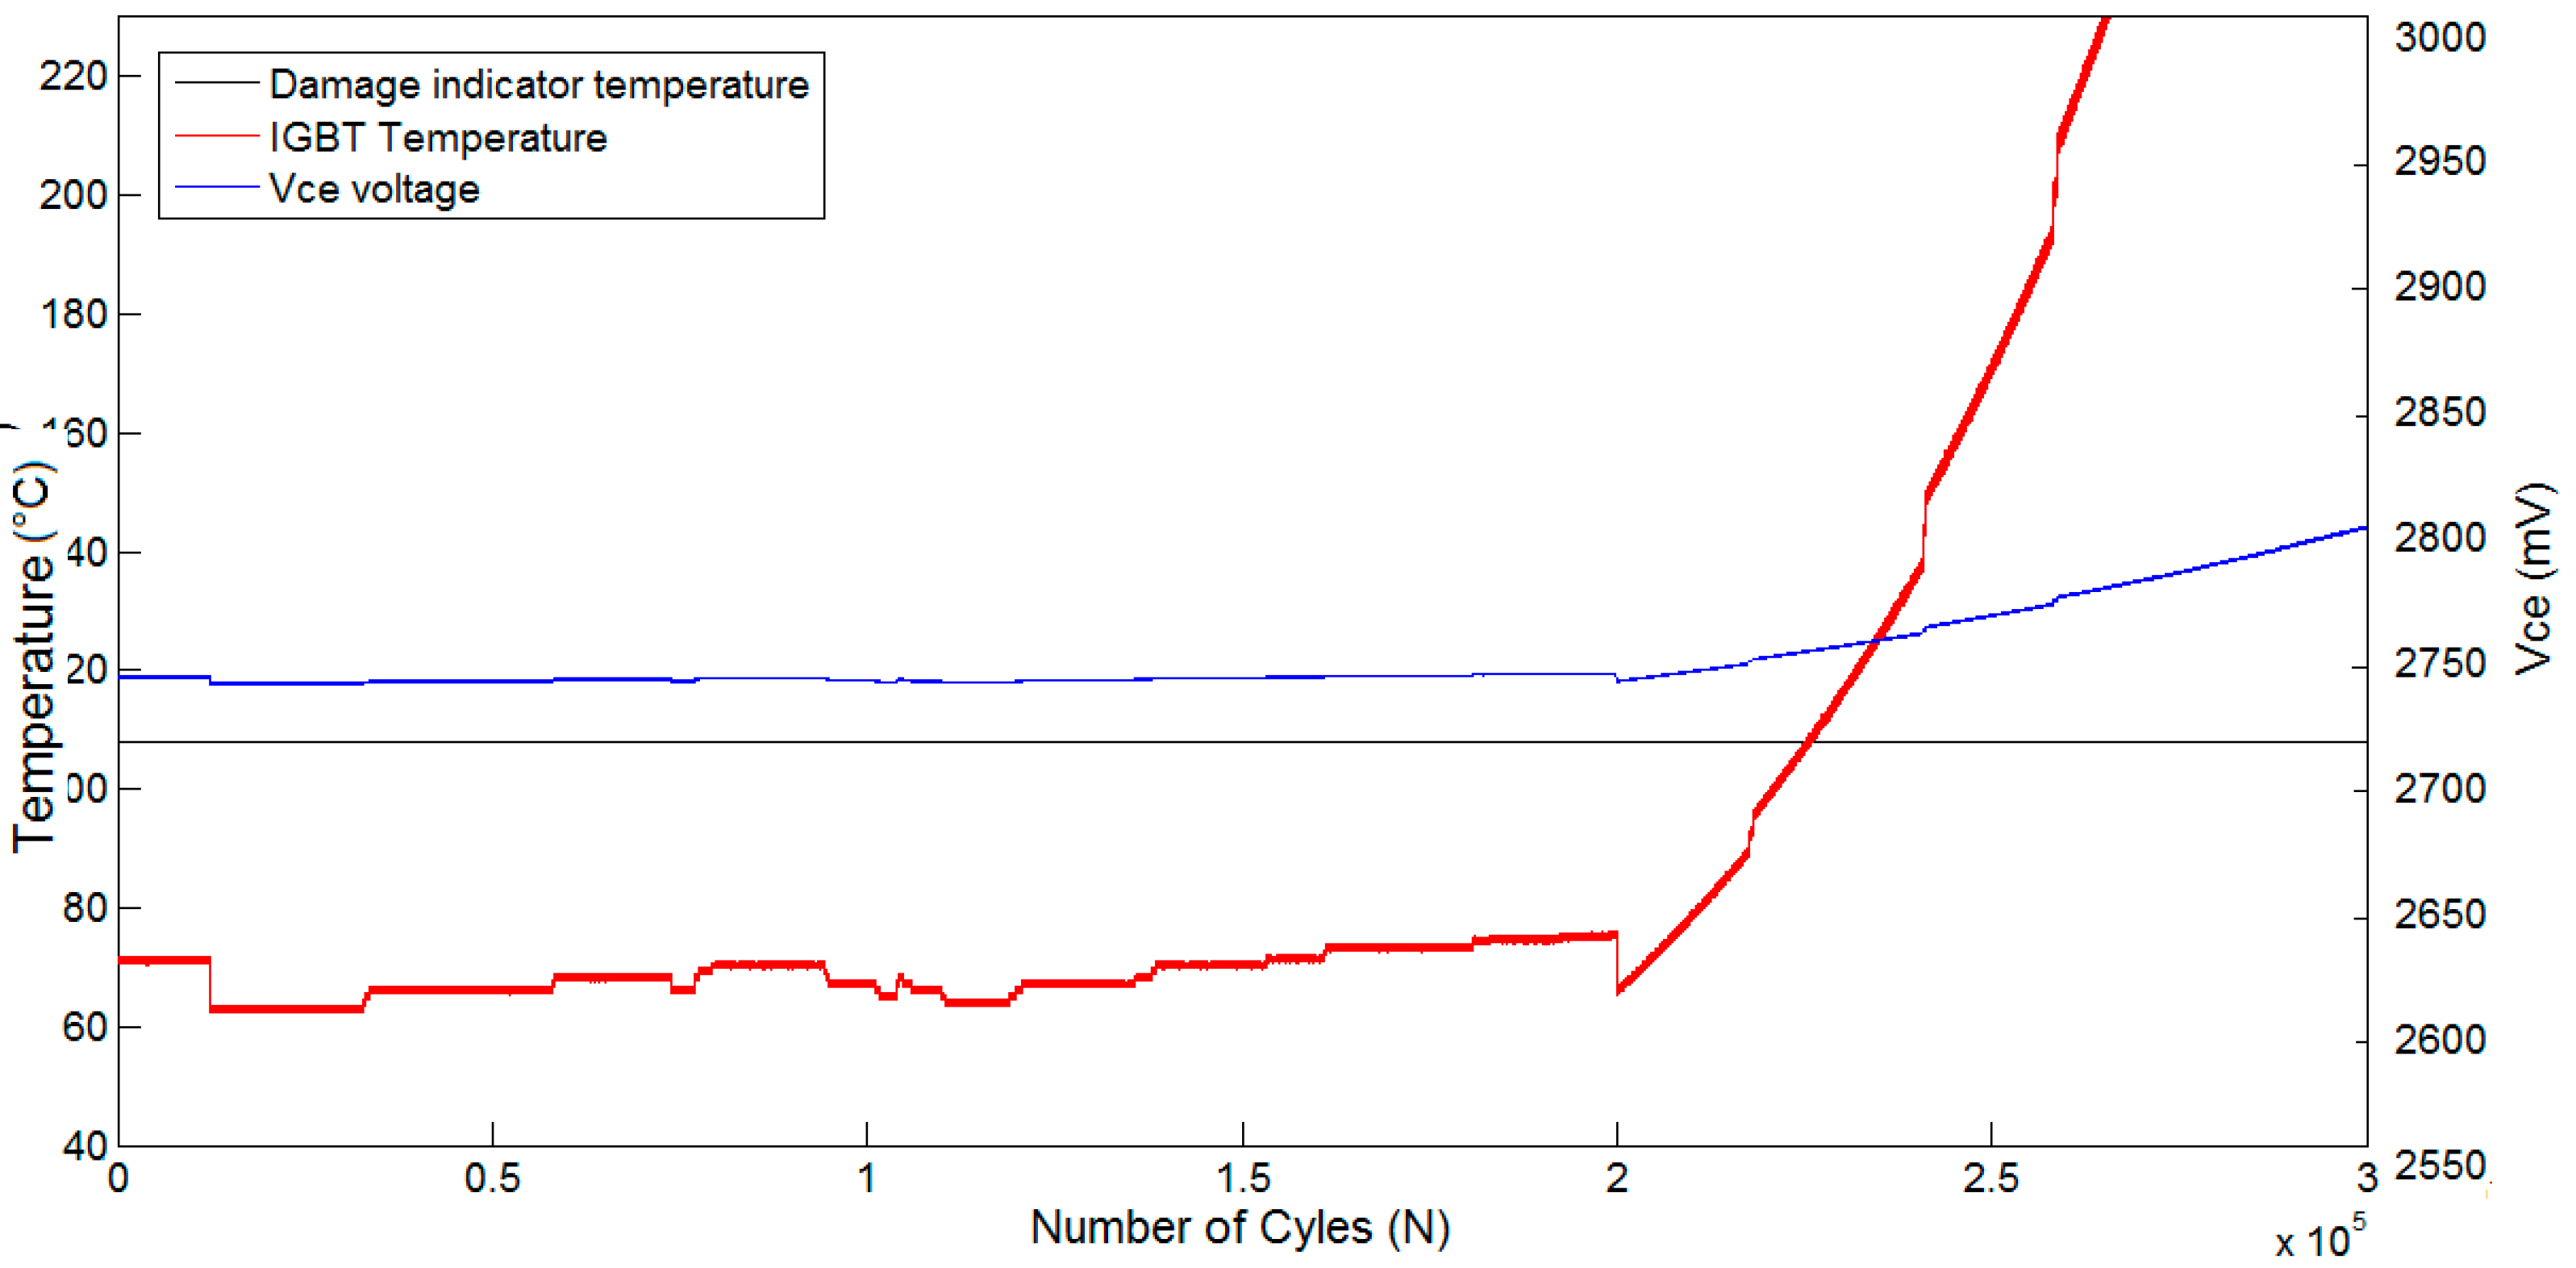
The thermal resistance increment is commonly due to the solder fatigue and the on-state voltage increment is caused by the wire bond lift off [
37]. Hence, device temperature and the forward voltage of the IGBT were monitored during the test, as shown in
Figure 20. The mean temperature was 60 °C and temperature variation was 90 °C. Failure criteria were defined as 25% increase of the temperature. Voltage across the device was no longer constant after 190,000 cycles and more than 30% increase was detected in the device temperature after 225,000 cycles. This was considered as indication of failure.
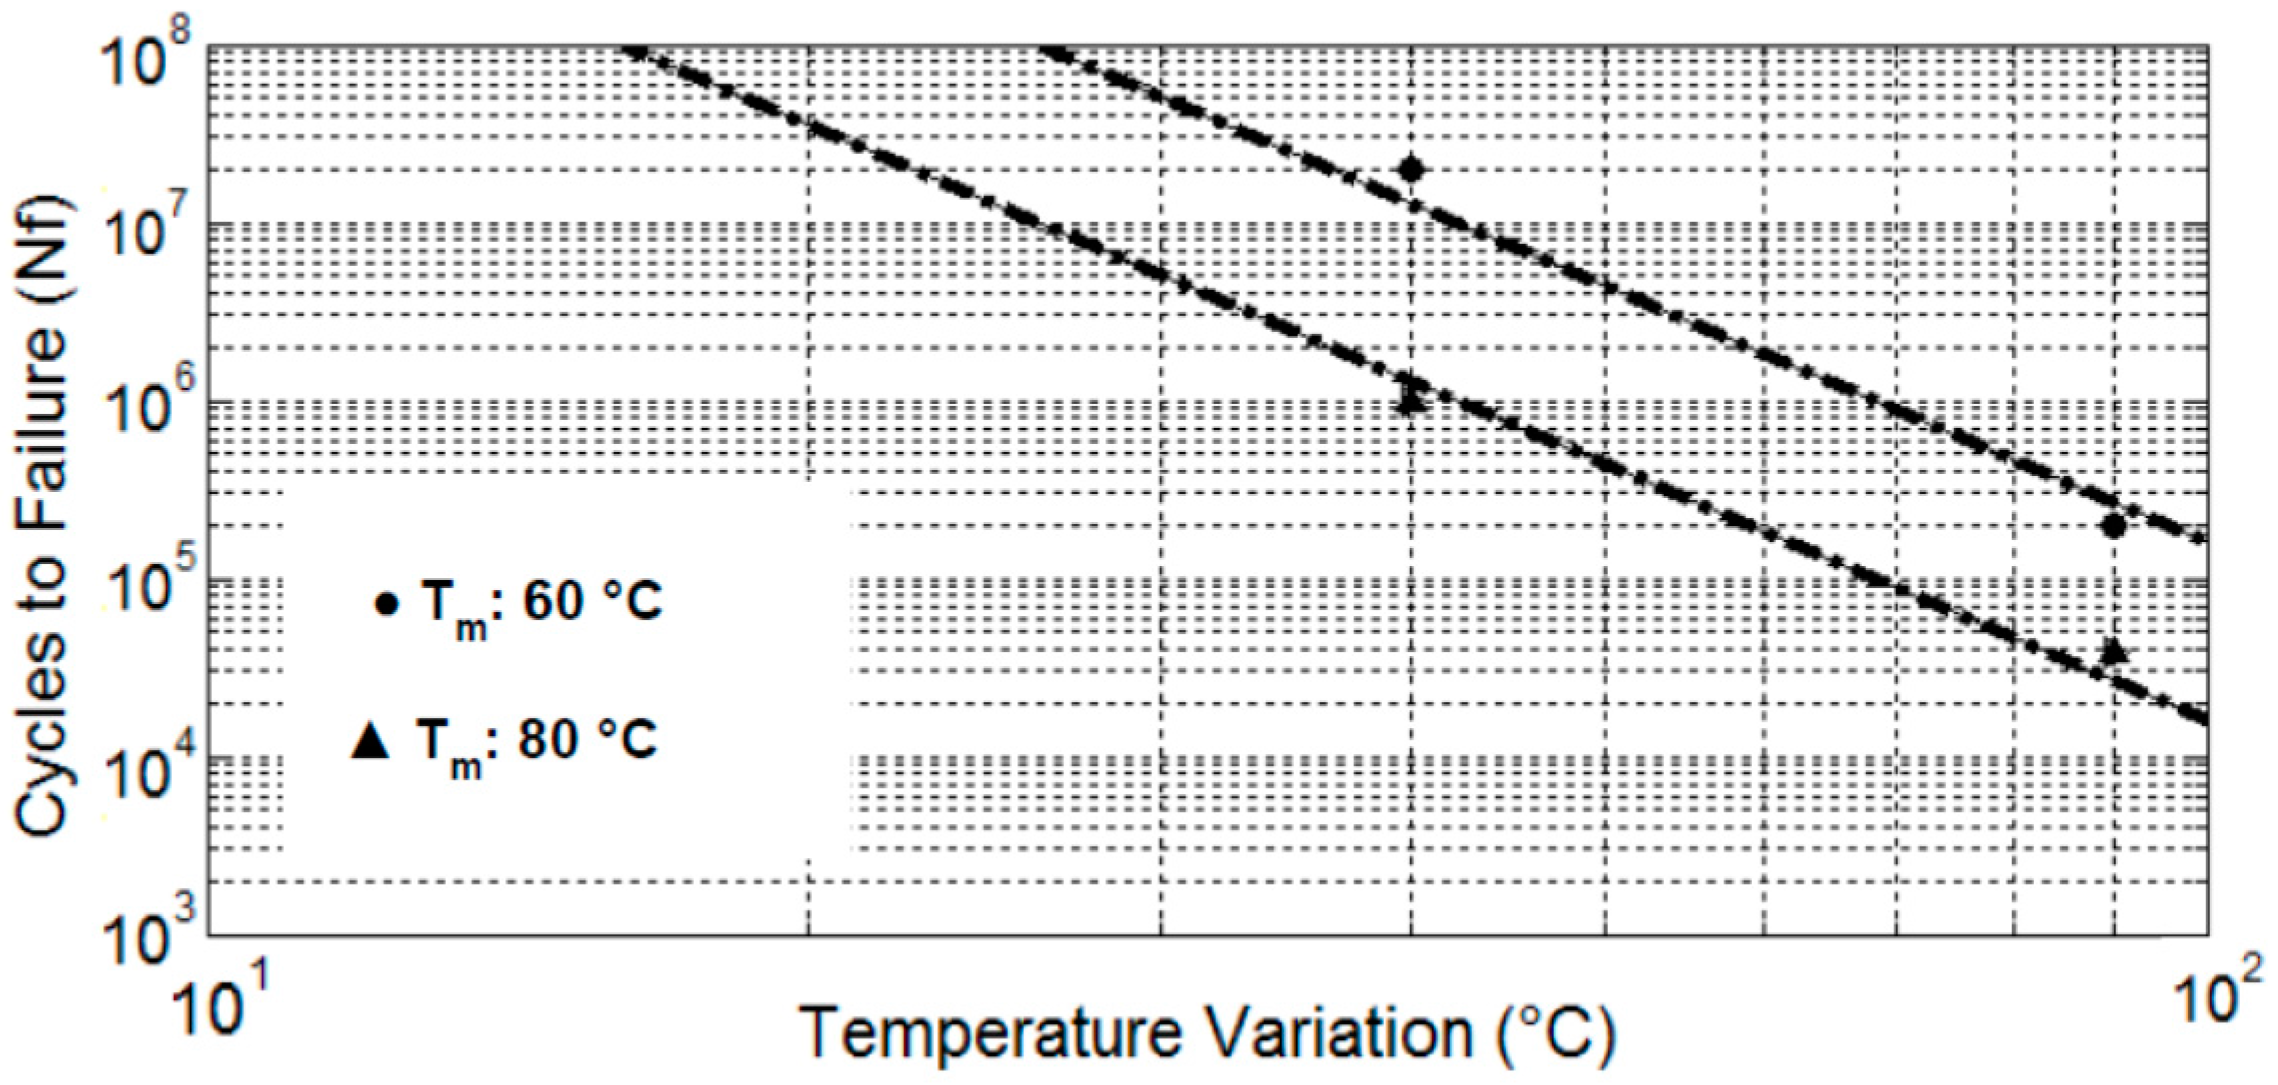
A modified Coffin-Manson-Arrhenius lifetime model [
37] was used to define cycle to failure data as a function of mean temperature,
Tm and temperature variation, ∆
T as expressed in Equation (19):
where
Nf is expected number of cycles to failure,
kb is Boltzman constant, 1.38 × 10
−23 J·K
−1,
Ea is the activation energy, 1.3 × 10
−19 J,
A and α are the constants, 610 and −5, respectively, which are fitted by the least squares method. The lifetime curves as a function of temperature variation with respect to number of cycles to failure are presented in
Figure 21.
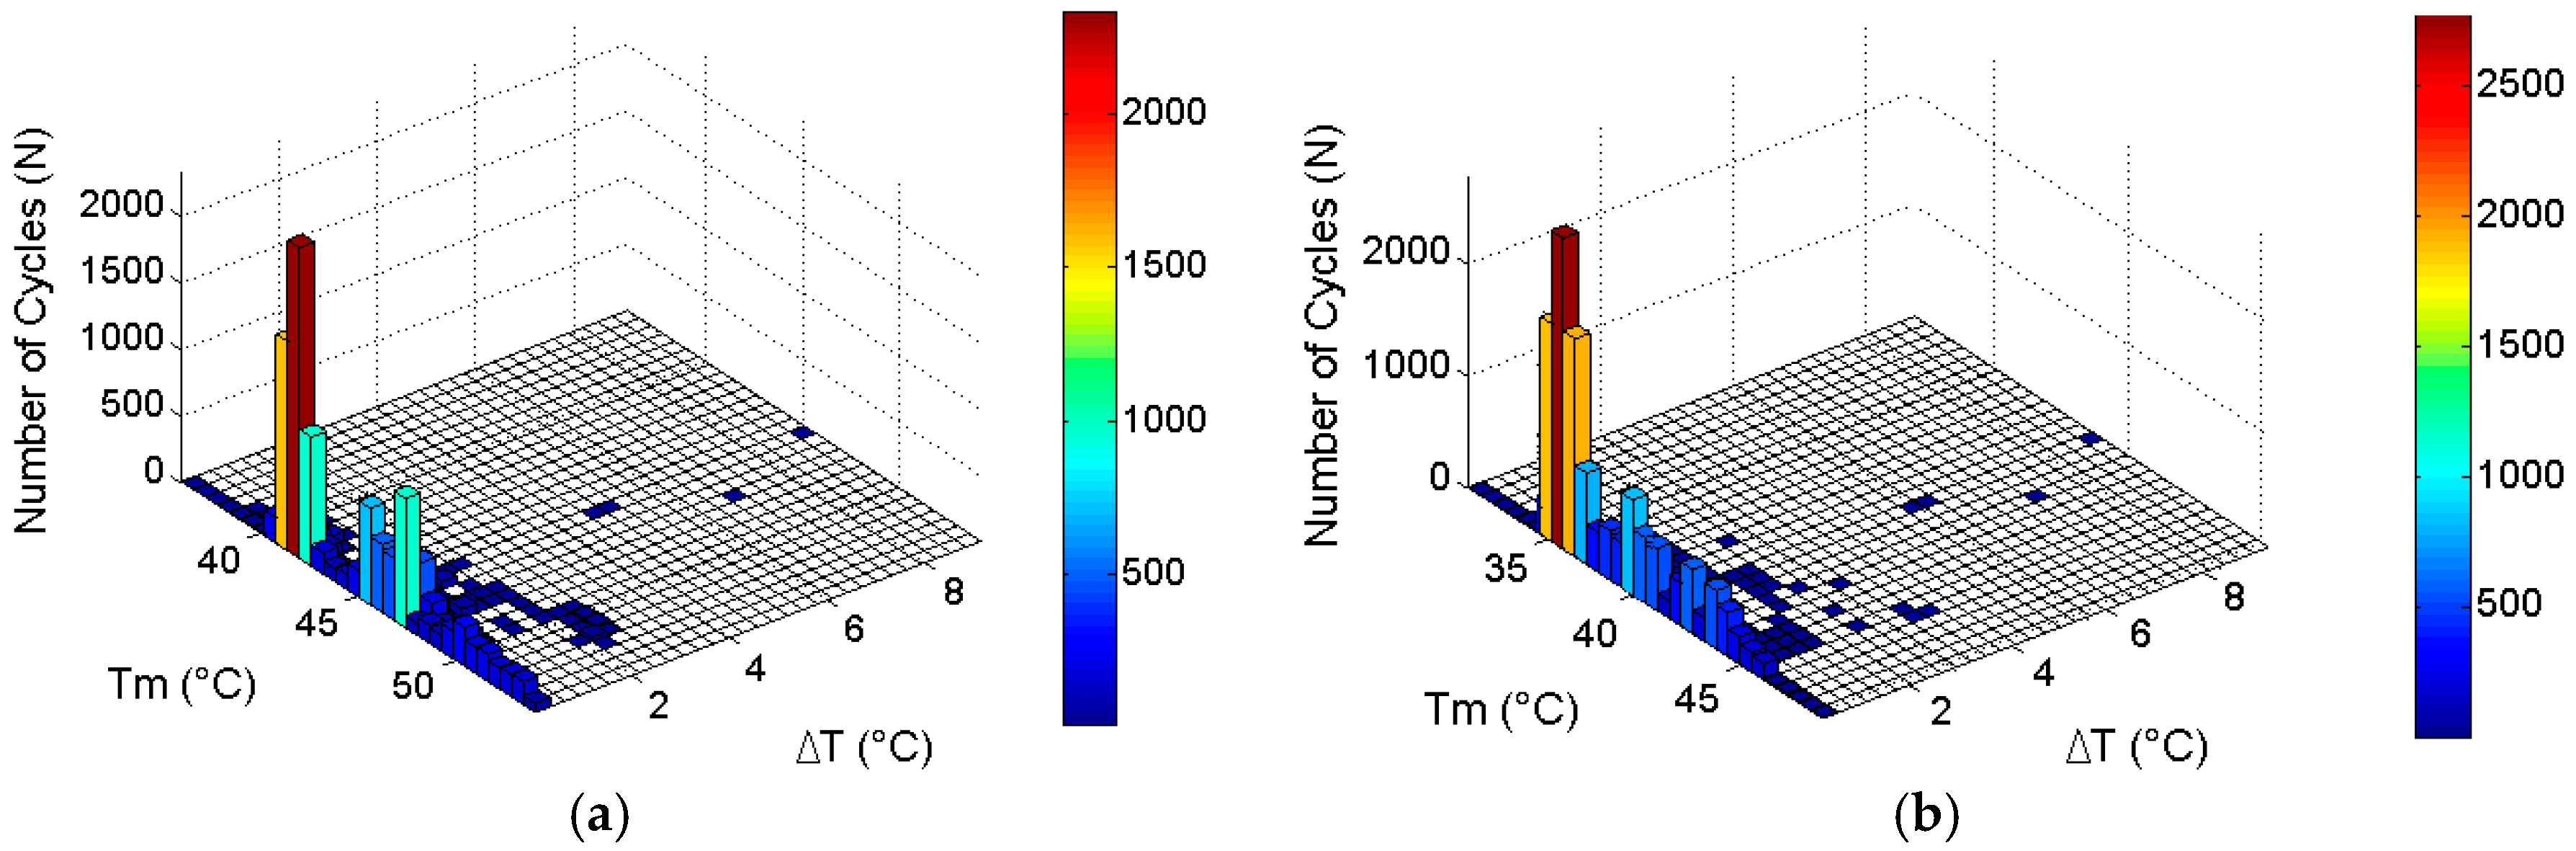
For lifetime estimation analysis purpose, the Rainflow counting algorithm tool [
38] was used to evaluate the temperature variation profile for the IGBT when P&O and IC MPPT algorithms were applied to the PV system. The counted numbers of cycles for both temperature profiles are shown in
Figure 22a,b. The majority of thermal variations (∆
T) are estimated at low values for both algorithms and the mean temperature changes (
Tm) between 40–55 °C for IC and 35–45 °C for P&O. The highest number of cycles for IC is approximately 2000 at 43 °C where it is 2500 cycles for the P&O algorithm at 35 °C.
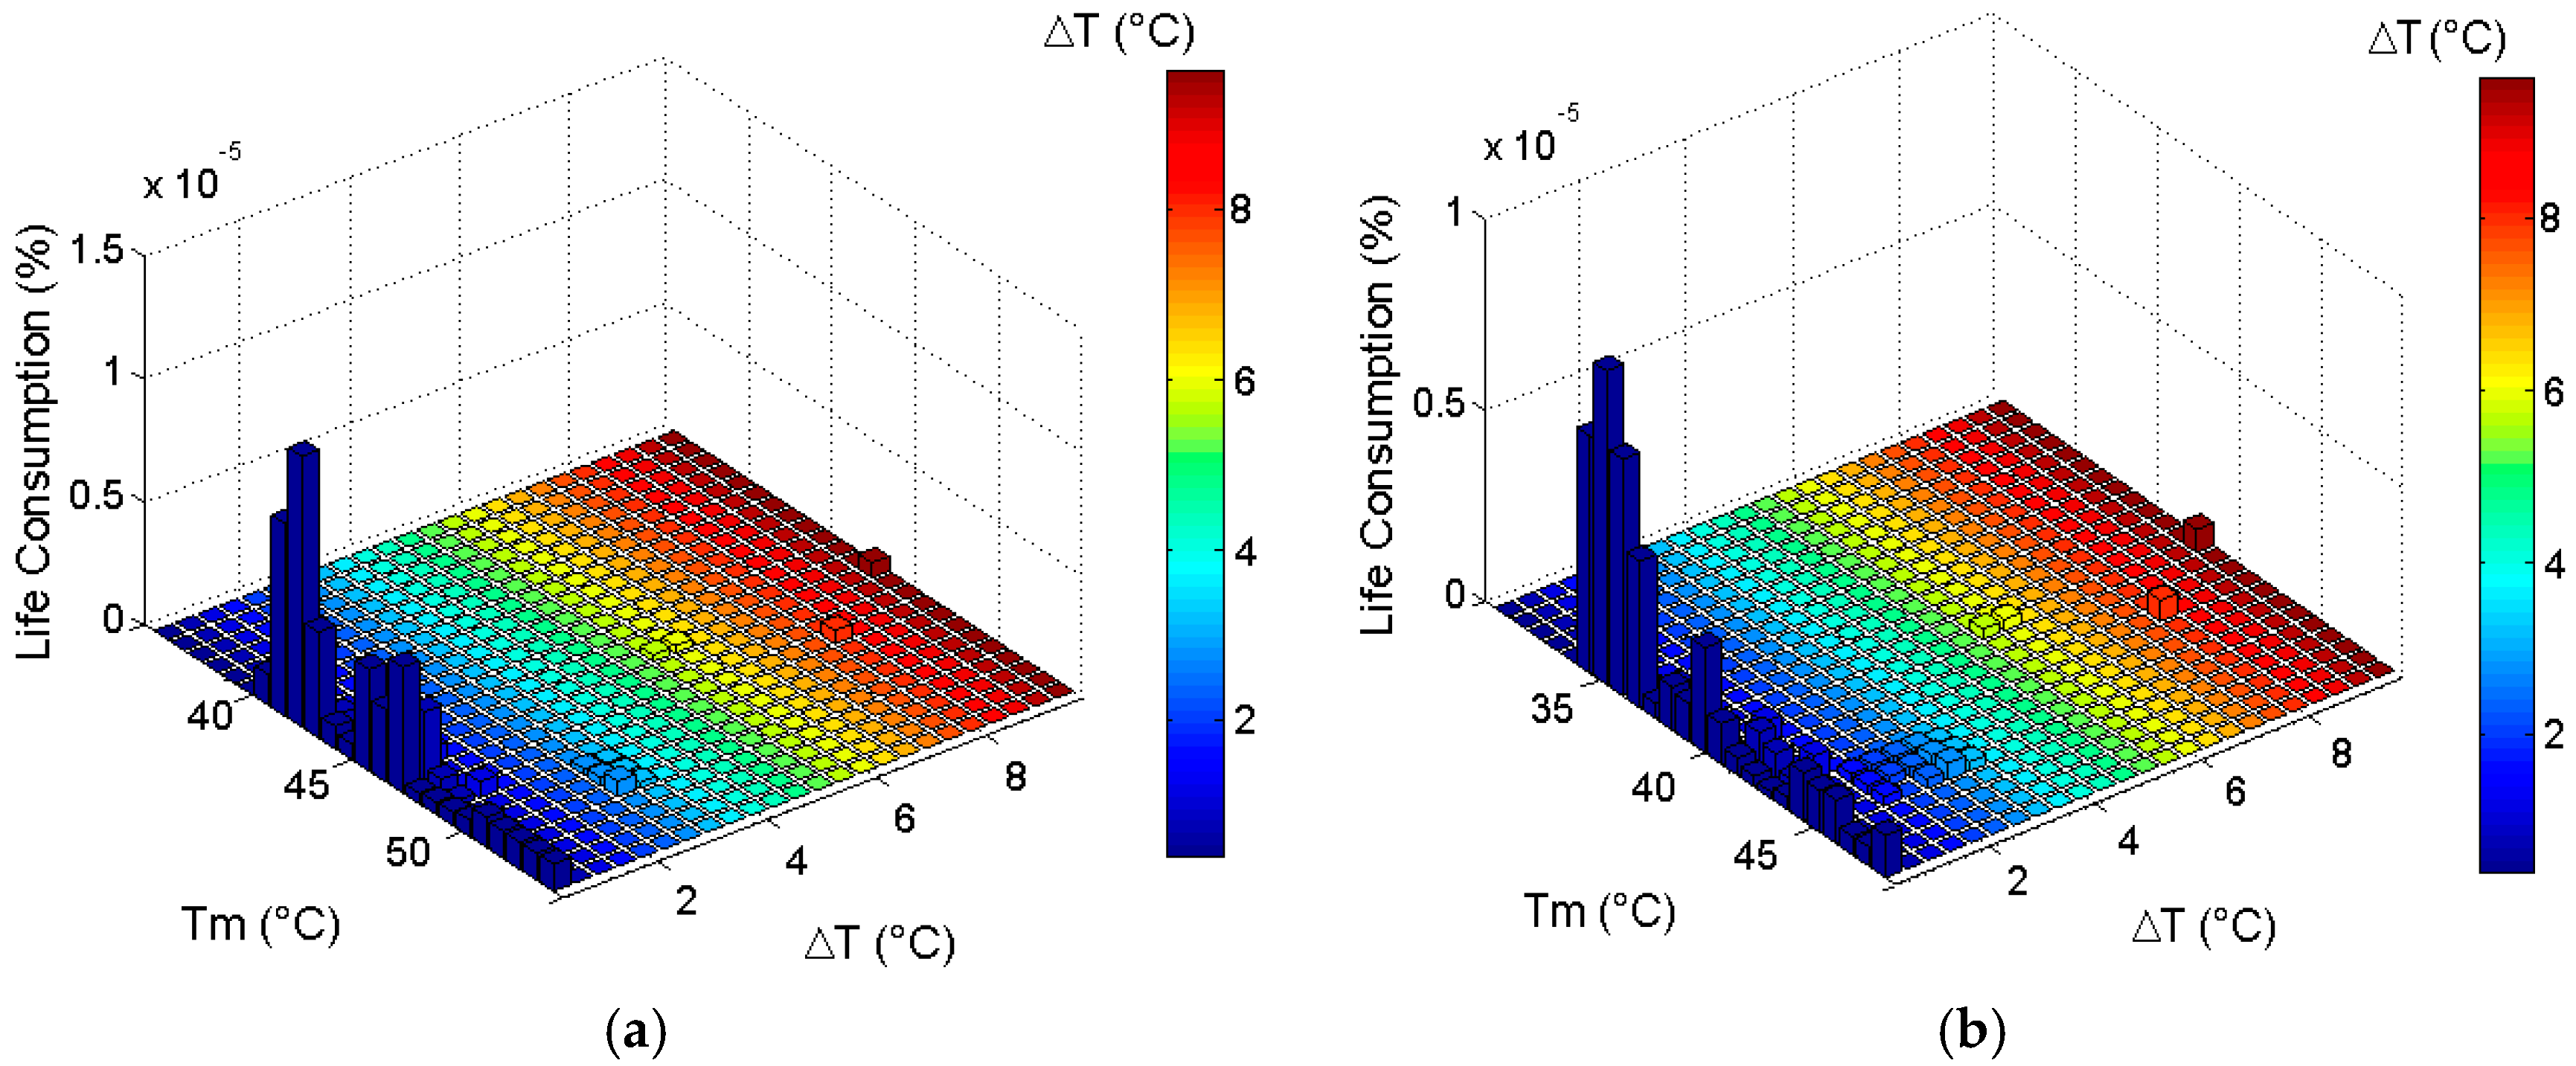
In order to achieve total life consumption (TLC) caused by the combined effect load profile, the Palmgren-Miner linear damage accumulation rule [
37] was applied and modelled for failure prediction. It can be expressed as in Equation (20):
where
ni is the number of cycles,
Ni is the measured lifetime in the
ith profile and
j is the total number of load profile. The rule states that failure happens when condition TLC = 1 occurs. Numbers of life consumption of IGBT for IC and P&O algorithms are shown in
Figure 23a,b. The TLC was calculated by addition of each consumption data by using Equation (20). As it can be observed, less amount of high temperature variation, i.e., at 10 °C mean temperature of 43 °C for IC and 35 °C for P&O methods cause approximately the same amount of life consumption with ten times higher number of cycles at low temperature variation (i.e., 0.5 °C) at 5 °C higher mean temperatures. TLC for IGBT, used in boost converter, was found as 4.817 × 10
−5 while this was 3.44 × 10
−5 for P&O algorithm. Thus, approximately 1.4 times higher TLC was observed for the IC MPPT method usage under the same loading and environmental conditions compared to the P&O algorithm for the described PV system.
6. Discussion
6.1. Dynamics of the Perturb and Observe and Incremental Conductance Maximum Power Point Tracking Algorithms
Prior to discussing the reasons behind the different temperature profiles of the switching device of the converters while operated by P&O and IC MPPT algorithms, it is worth recalling their operating principles and main causes of the electro-thermal power loss occurring which affects the reliability [
39]. The P&O algorithm simply introduces perturbations in the duty cycle of the power converter which leads to changes in the PV voltage and current. Subsequently, by observing the change in the operating power, the duty cycle is further increased or decreased by the amount of the perturbation step size as the direction of the perturbation is retained. It should be noted that, once the maximum power point is reached, the conventional P&O algorithm begins to oscillate around it by a certain amount, depending on this perturbation step size.
The IC, on the other hand, incrementally compares the ratio of the derivative of the conductance with the instantaneous conductance by using Equations (6)–(10) and updates the duty cycle, accordingly. Similar to the P&O, the maximum power point where the condition of dI/dV + I/V = 0 is difficult to be operated; hence the PWM signal oscillates around this point.
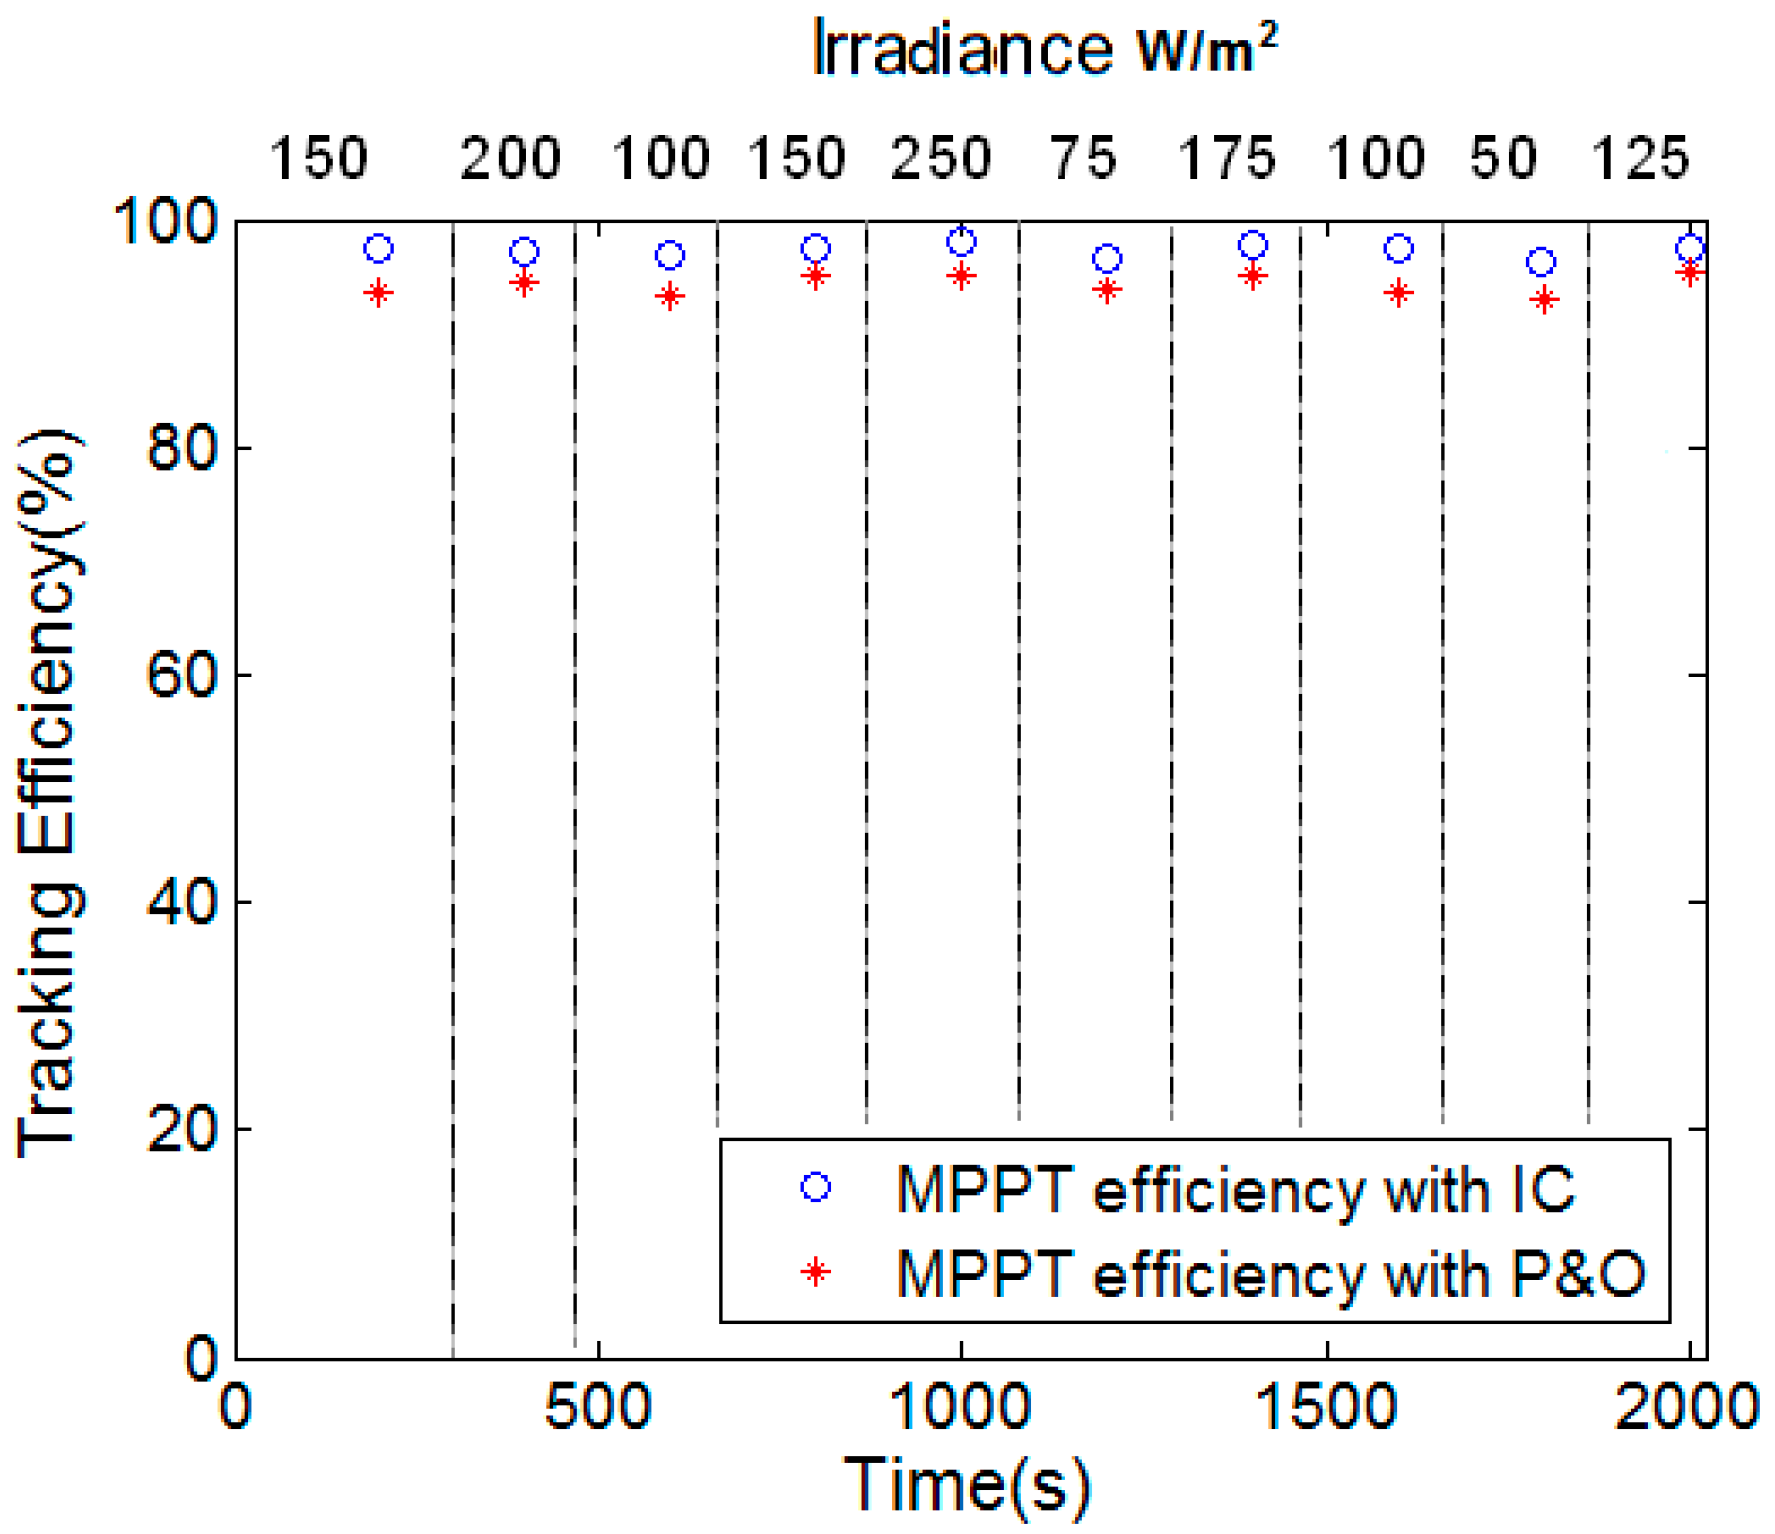
Although in theory, both methods provide very close tracking efficiencies as discussed in the literature, the working principle of the P&O consists of a hill climbing nature which has slower dynamics compared to the IC algorithm’s incremental ratio working principle. This is the one main reason for the difference in the average values of the tracking efficiencies between both algorithms where the INC performs 3% better for the applied test conditions compared to the P&O. The selected perturbation step time, which is 0.005, has also a significant effect on the efficiency and oscillations during varying irradiance conditions. A further optimised perturbation step size would increase the efficiency for both methods and vice versa.
6.2. Efficiency of the Perturb and Observe and Incremental Conductance Maximum Power Point Tracking Algorithms
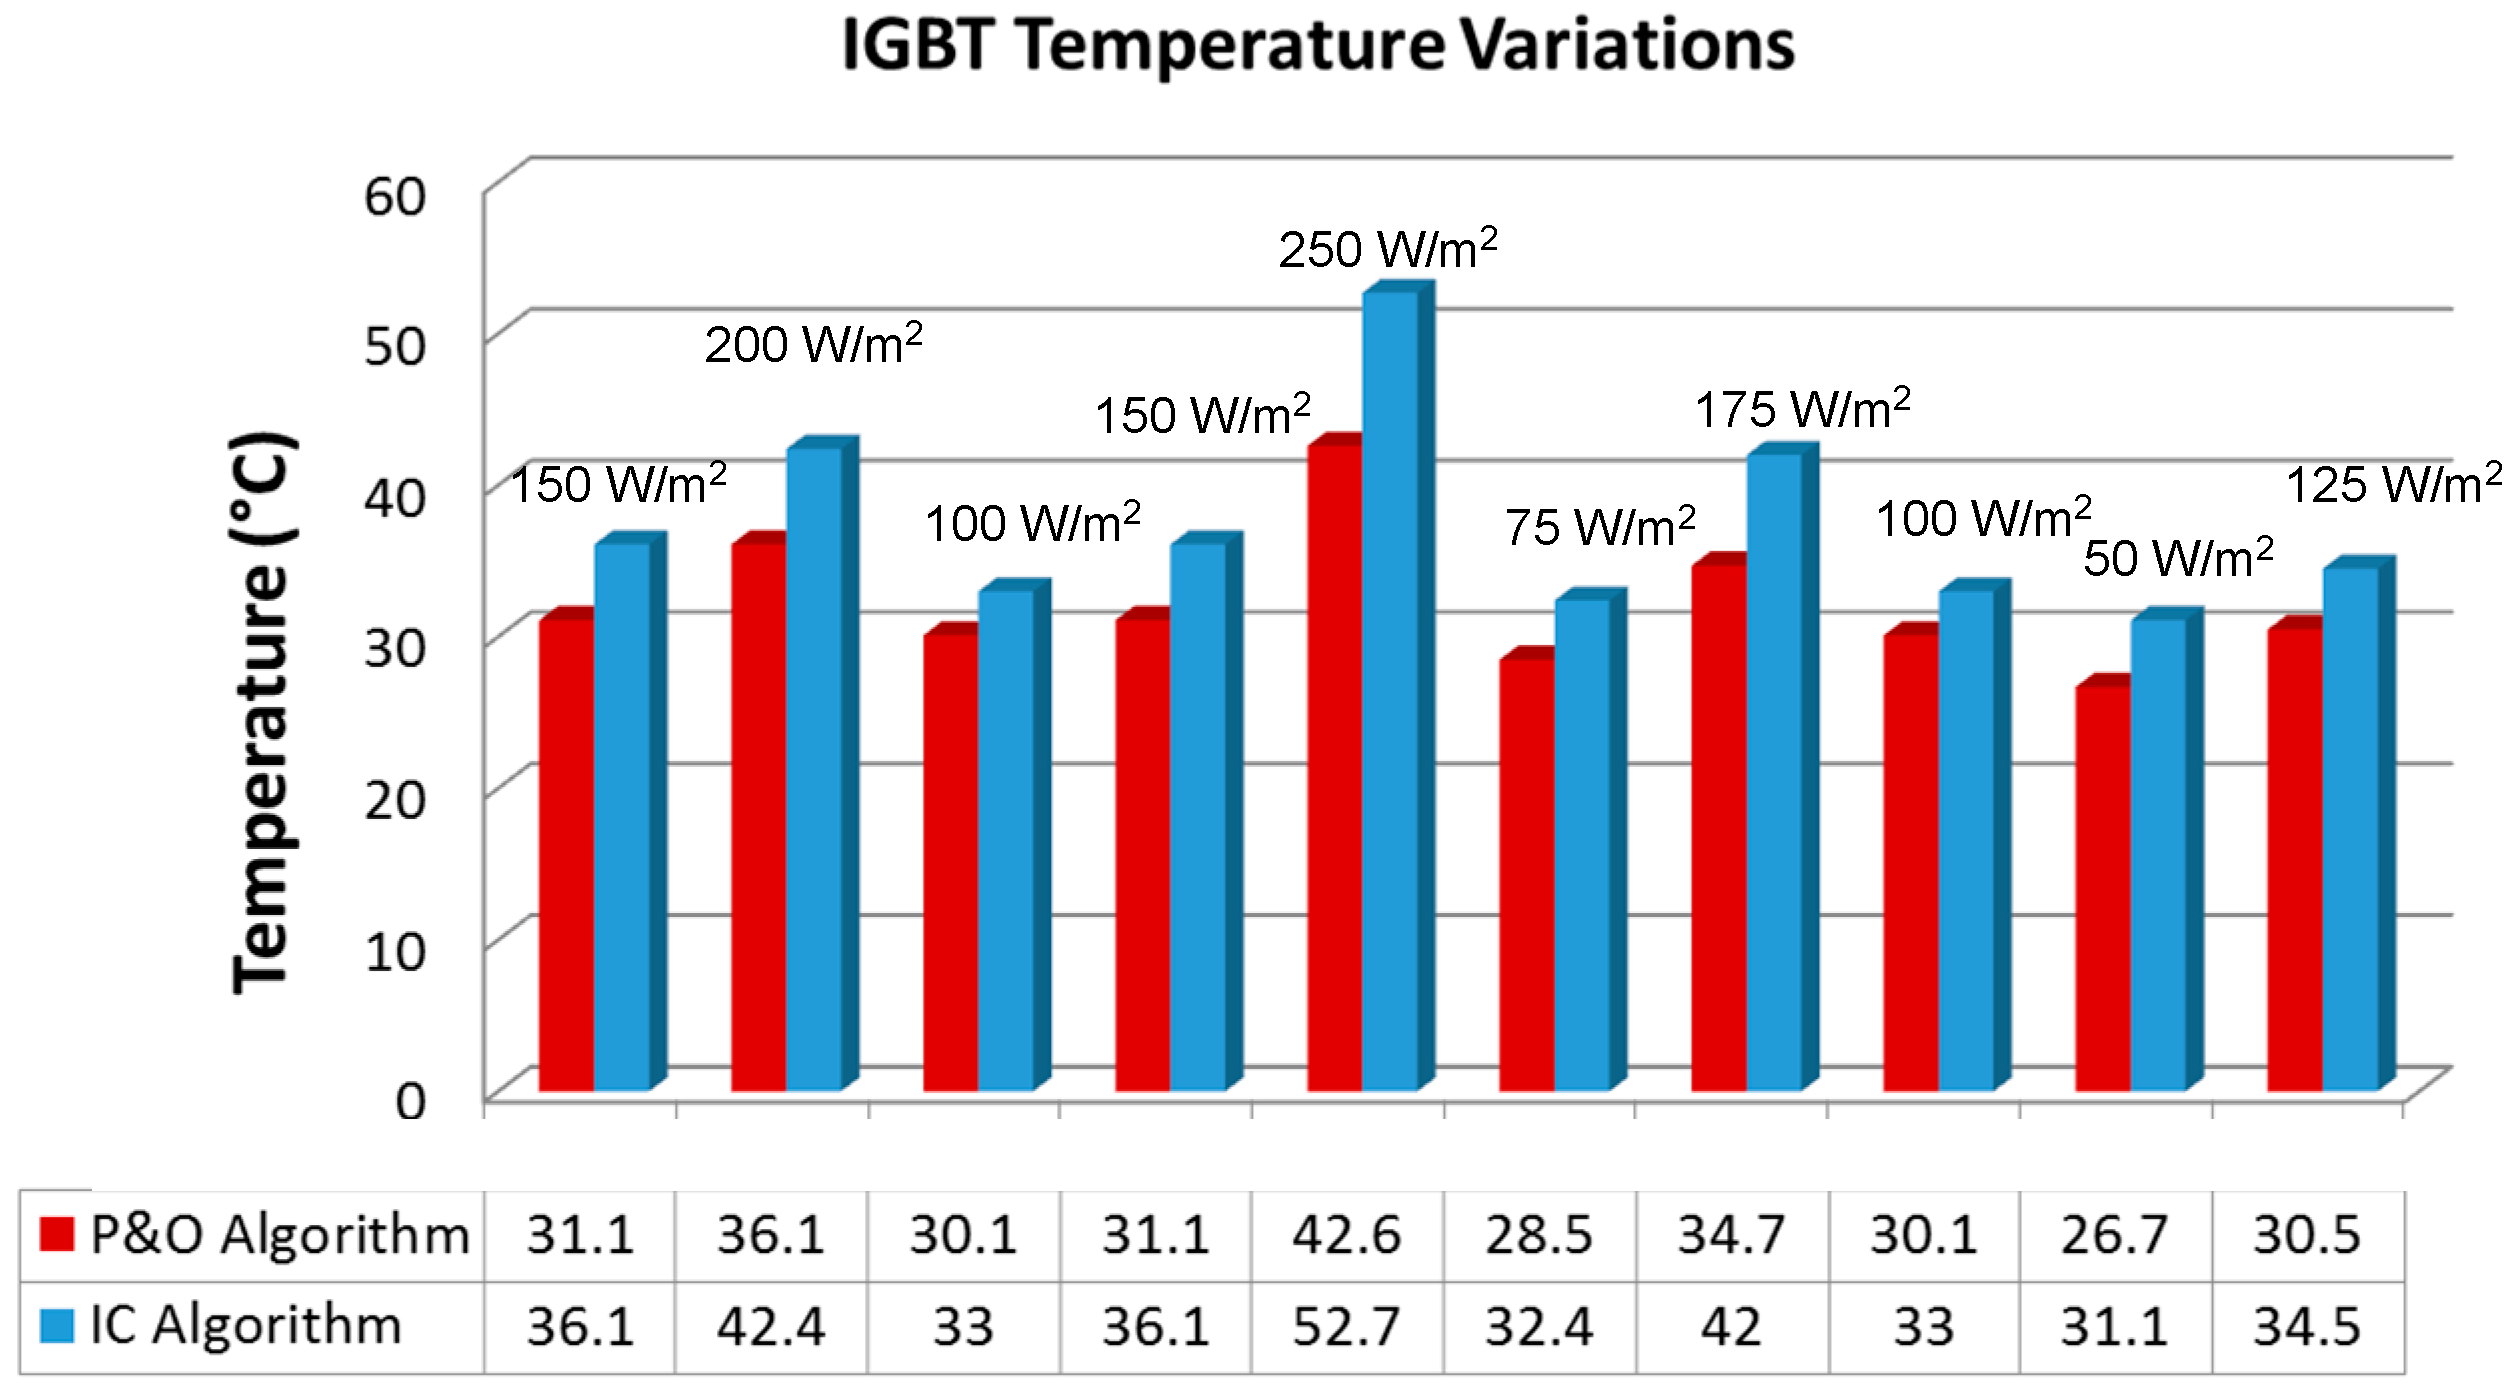
The efficiency of the P&O method is low at the sharp decrements of the irradiance levels such as at 600, 1200 and 1800 s due to the constant perturbation size. The same method has better efficiency at the higher irradiance levels; however it is not as high as the IC due to its slower dynamics. One other reason is that the perturbation step is not sufficient to follow the rapid increase in the MPP, yet the IC has faster working dynamics and provides better tracking efficiency under minimum and maximum light conditions. It continuously inspects the ratio between derivative and instantaneous conductance to update the duty cycle rather than producing perturbations and updating the duty cycle based on the direction of the slope by using a hill climbing method. The searching direction can get confused with P&O due to experimental noise which results in reduced tracking efficiency as well. On the other hand, at medium irradiances, i.e., 125–175 W/m2, the efficiency between both algorithms was found similar.
Lower efficiencies at low irradiance conditions, i.e., around 25–75 W/m
2, are due to the constant perturbation step size which causes undesired oscillations on the very low current drawn from the PV panel [
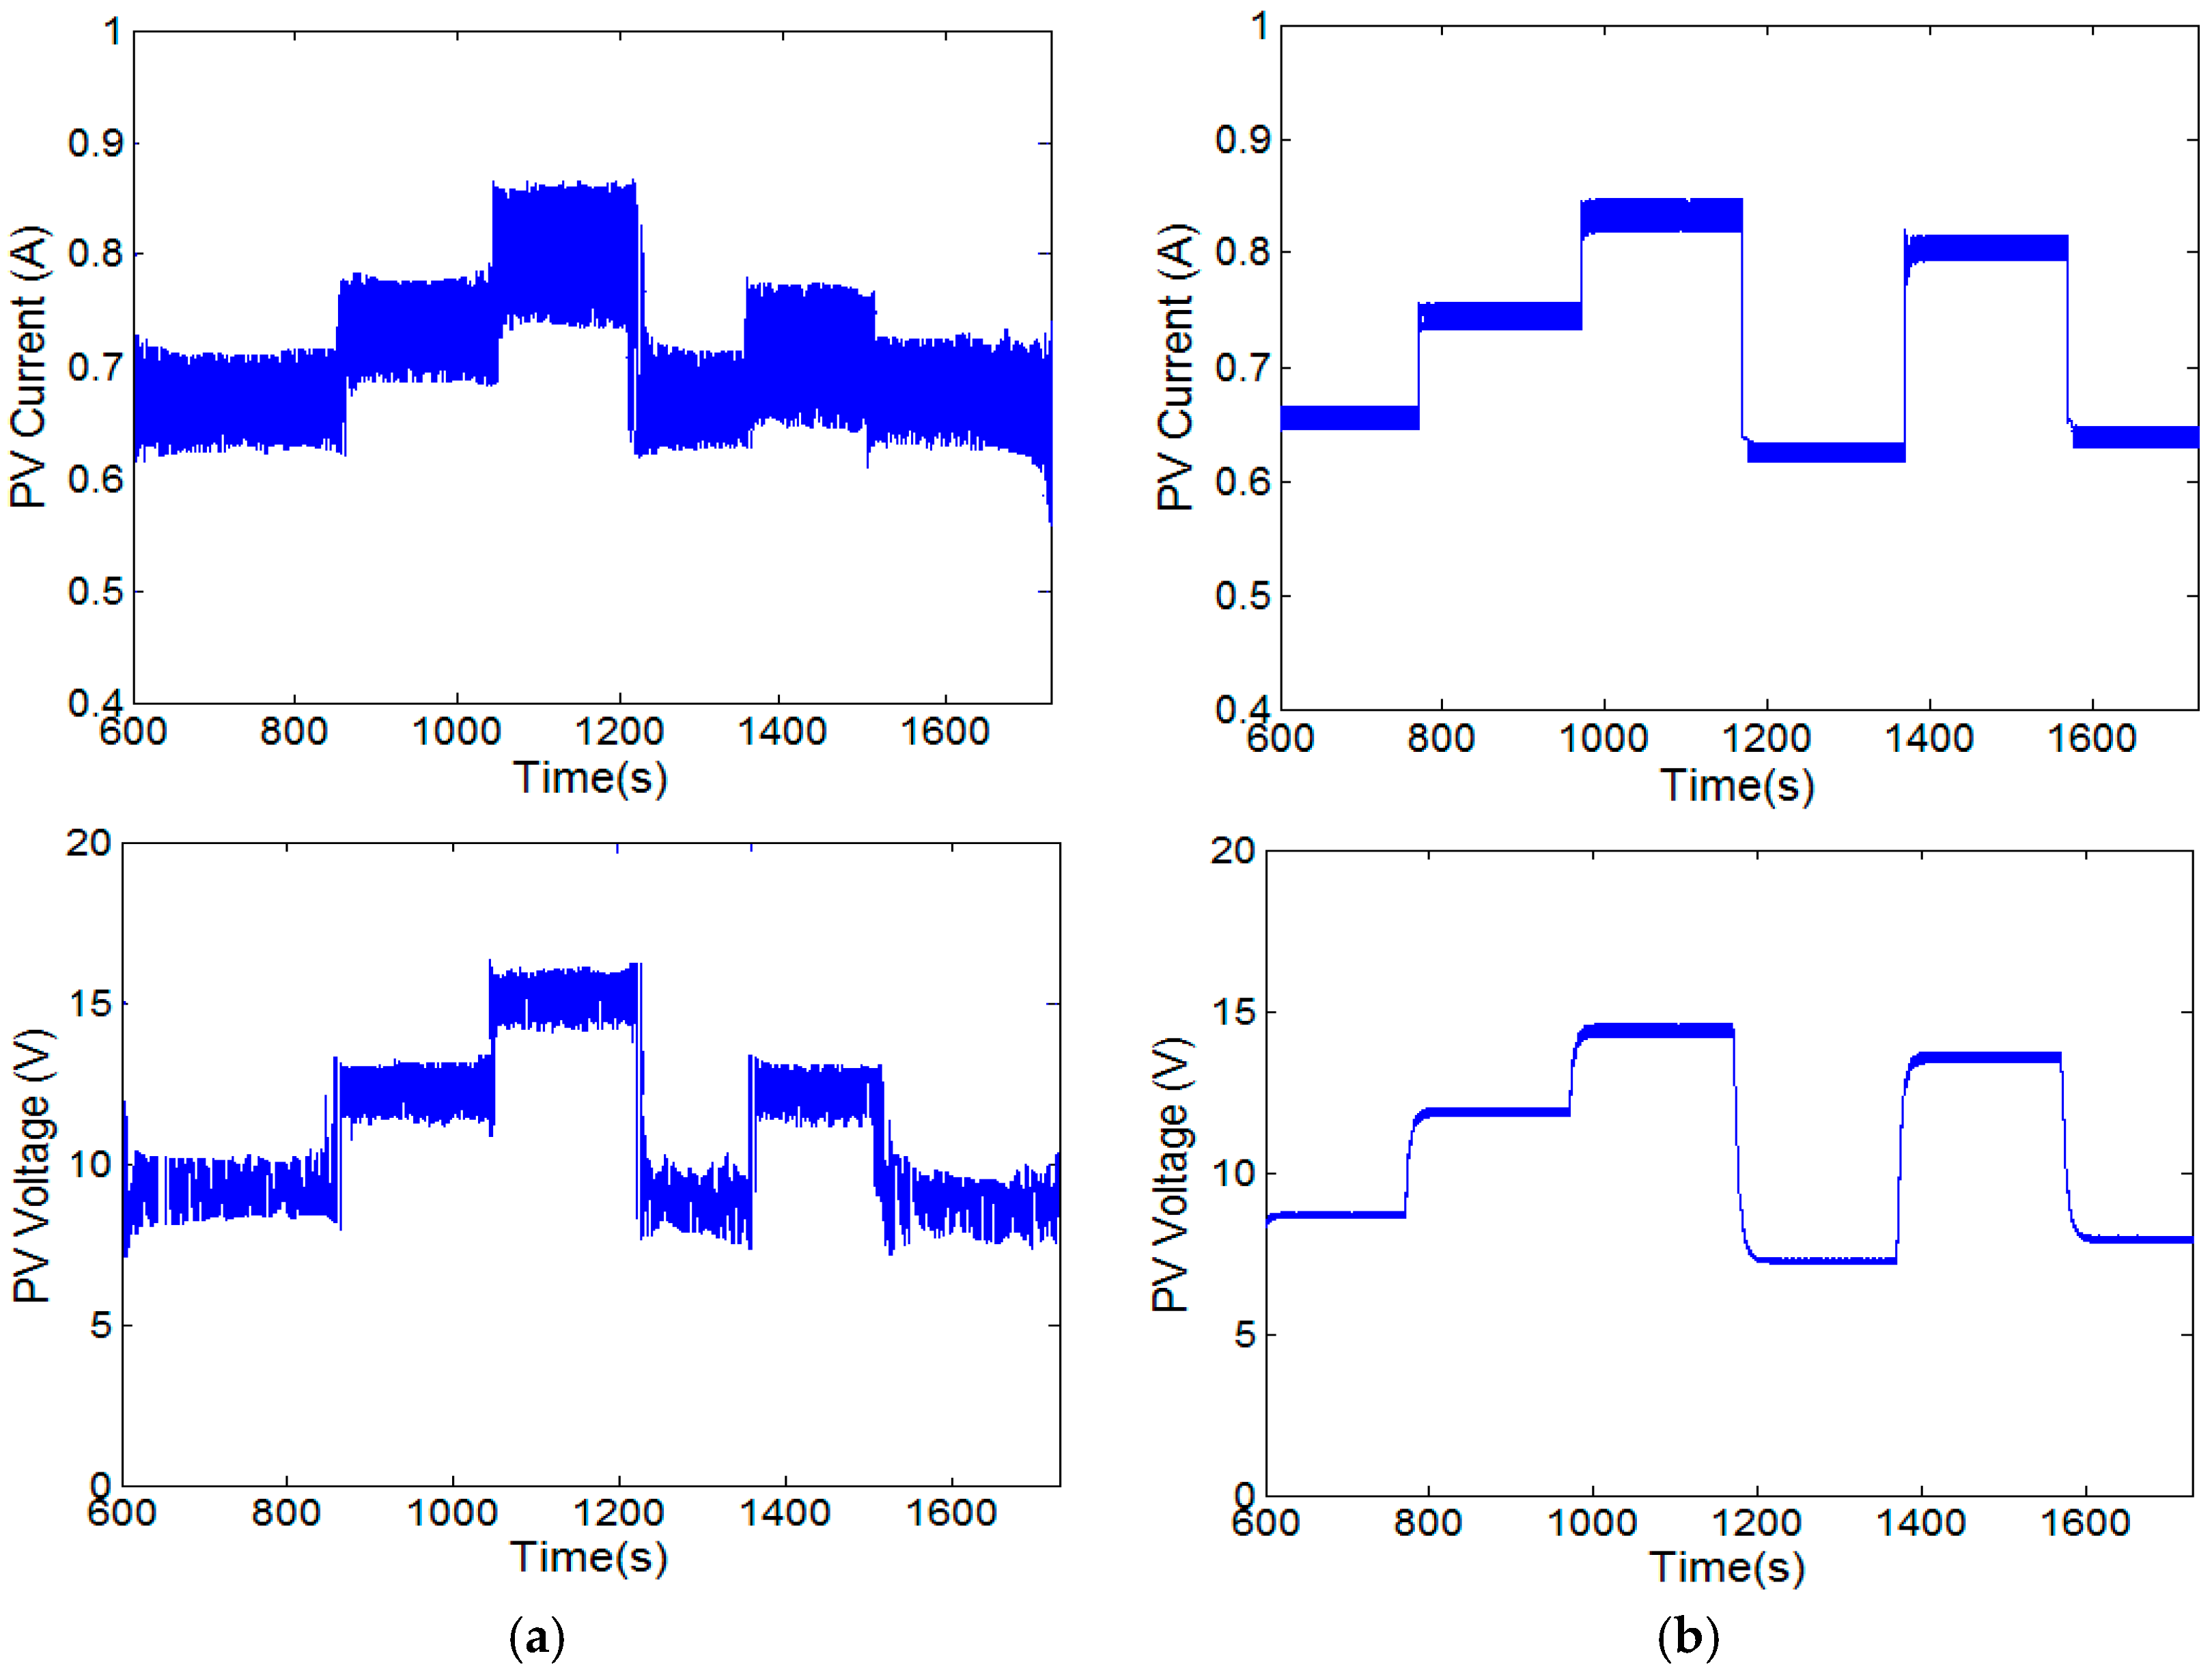
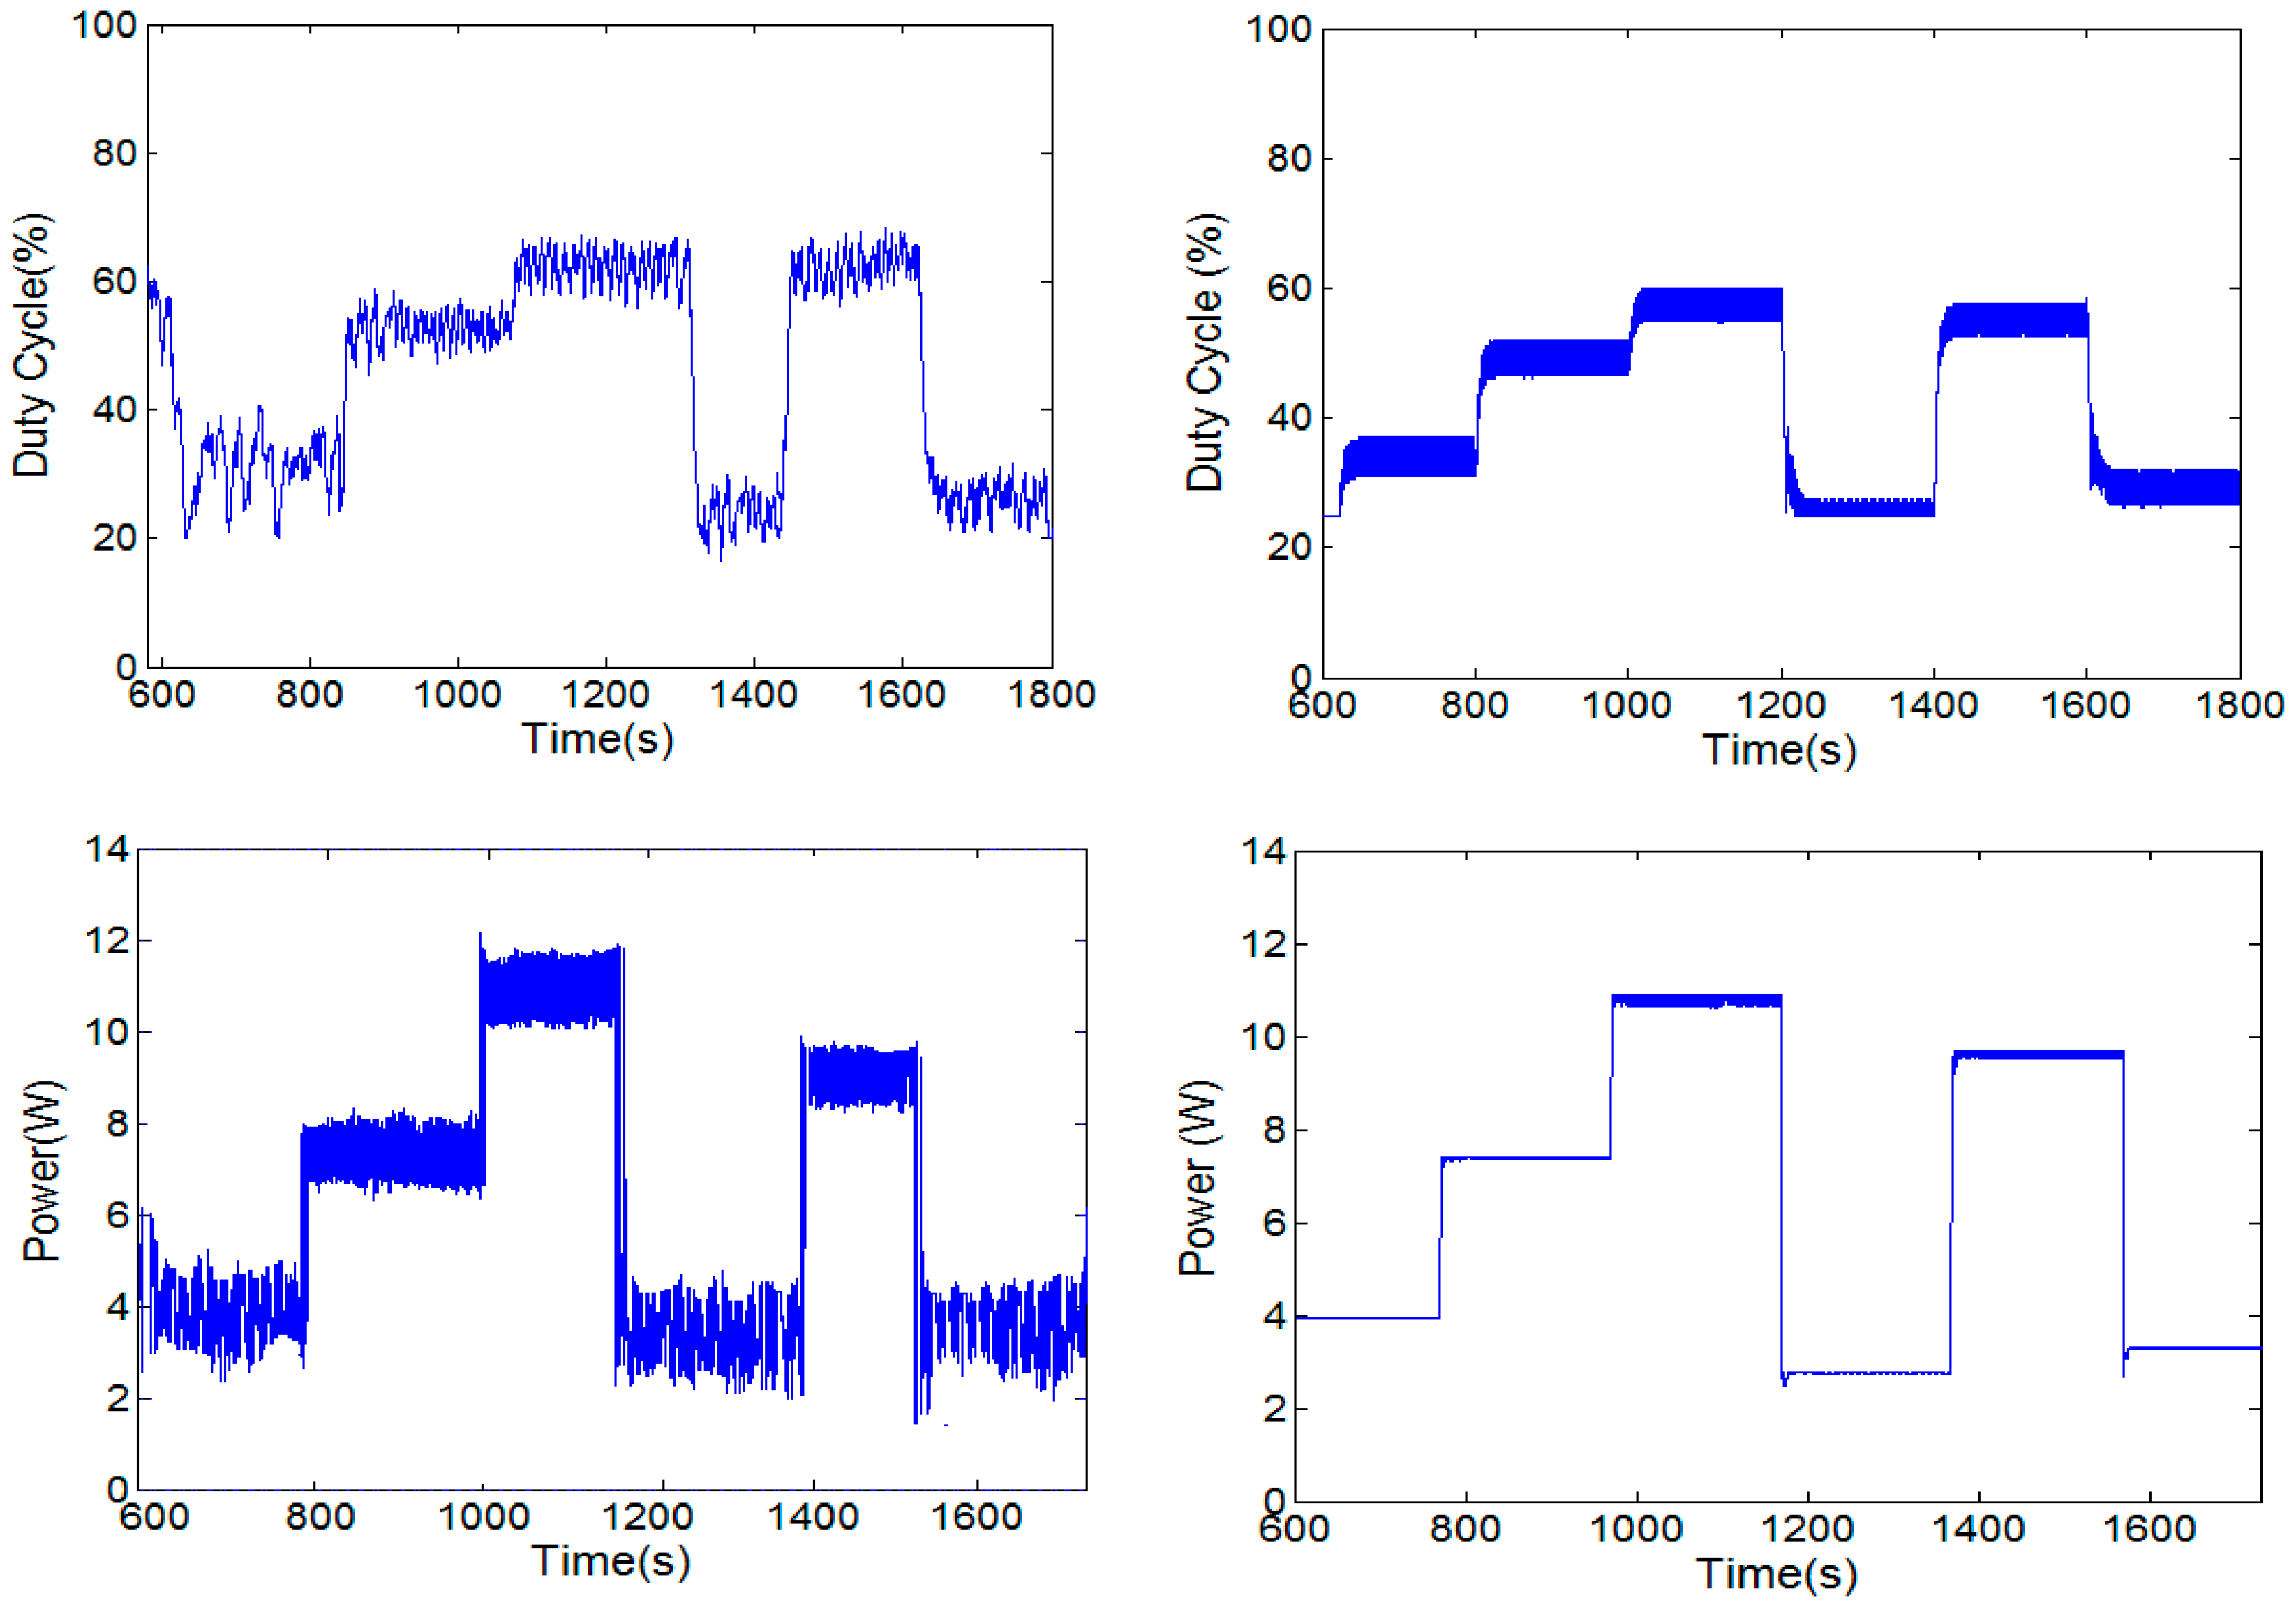
14]. The current oscillations result in oscillations in power and the MPP tracking is affected negatively for both P&O and INC methods. Specifically, the low efficiencies for the IC method at low irradiance conditions are mostly related to the oscillatory behaviour of the duty cycle of the converter which does not allow the voltage and current to settle down smoothly as seen in
Figure 9a; hence, the MPP condition cannot be stabilised constantly as mentioned in references [
14,
15].
6.3. Impact of the Perturb and Observe and Incremental Conductance Algorithms on the Electro-Thermal Performance of Insulated Gate Bipolar Transistor
According to the experimental and simulated analysis discussed above, the IC method was found as more efficient compared to the P&O method under identical operating conditions which is in agreement with the previous literature studies. Specifically, the IC yield better efficiency for drastic changes and the P&O method has slower dynamics and offers lower efficiency due to the perturbed PV output parameters (oscillation may cause divergence) in every MPPT cycle, although it is mostly accepted as easier to implement.
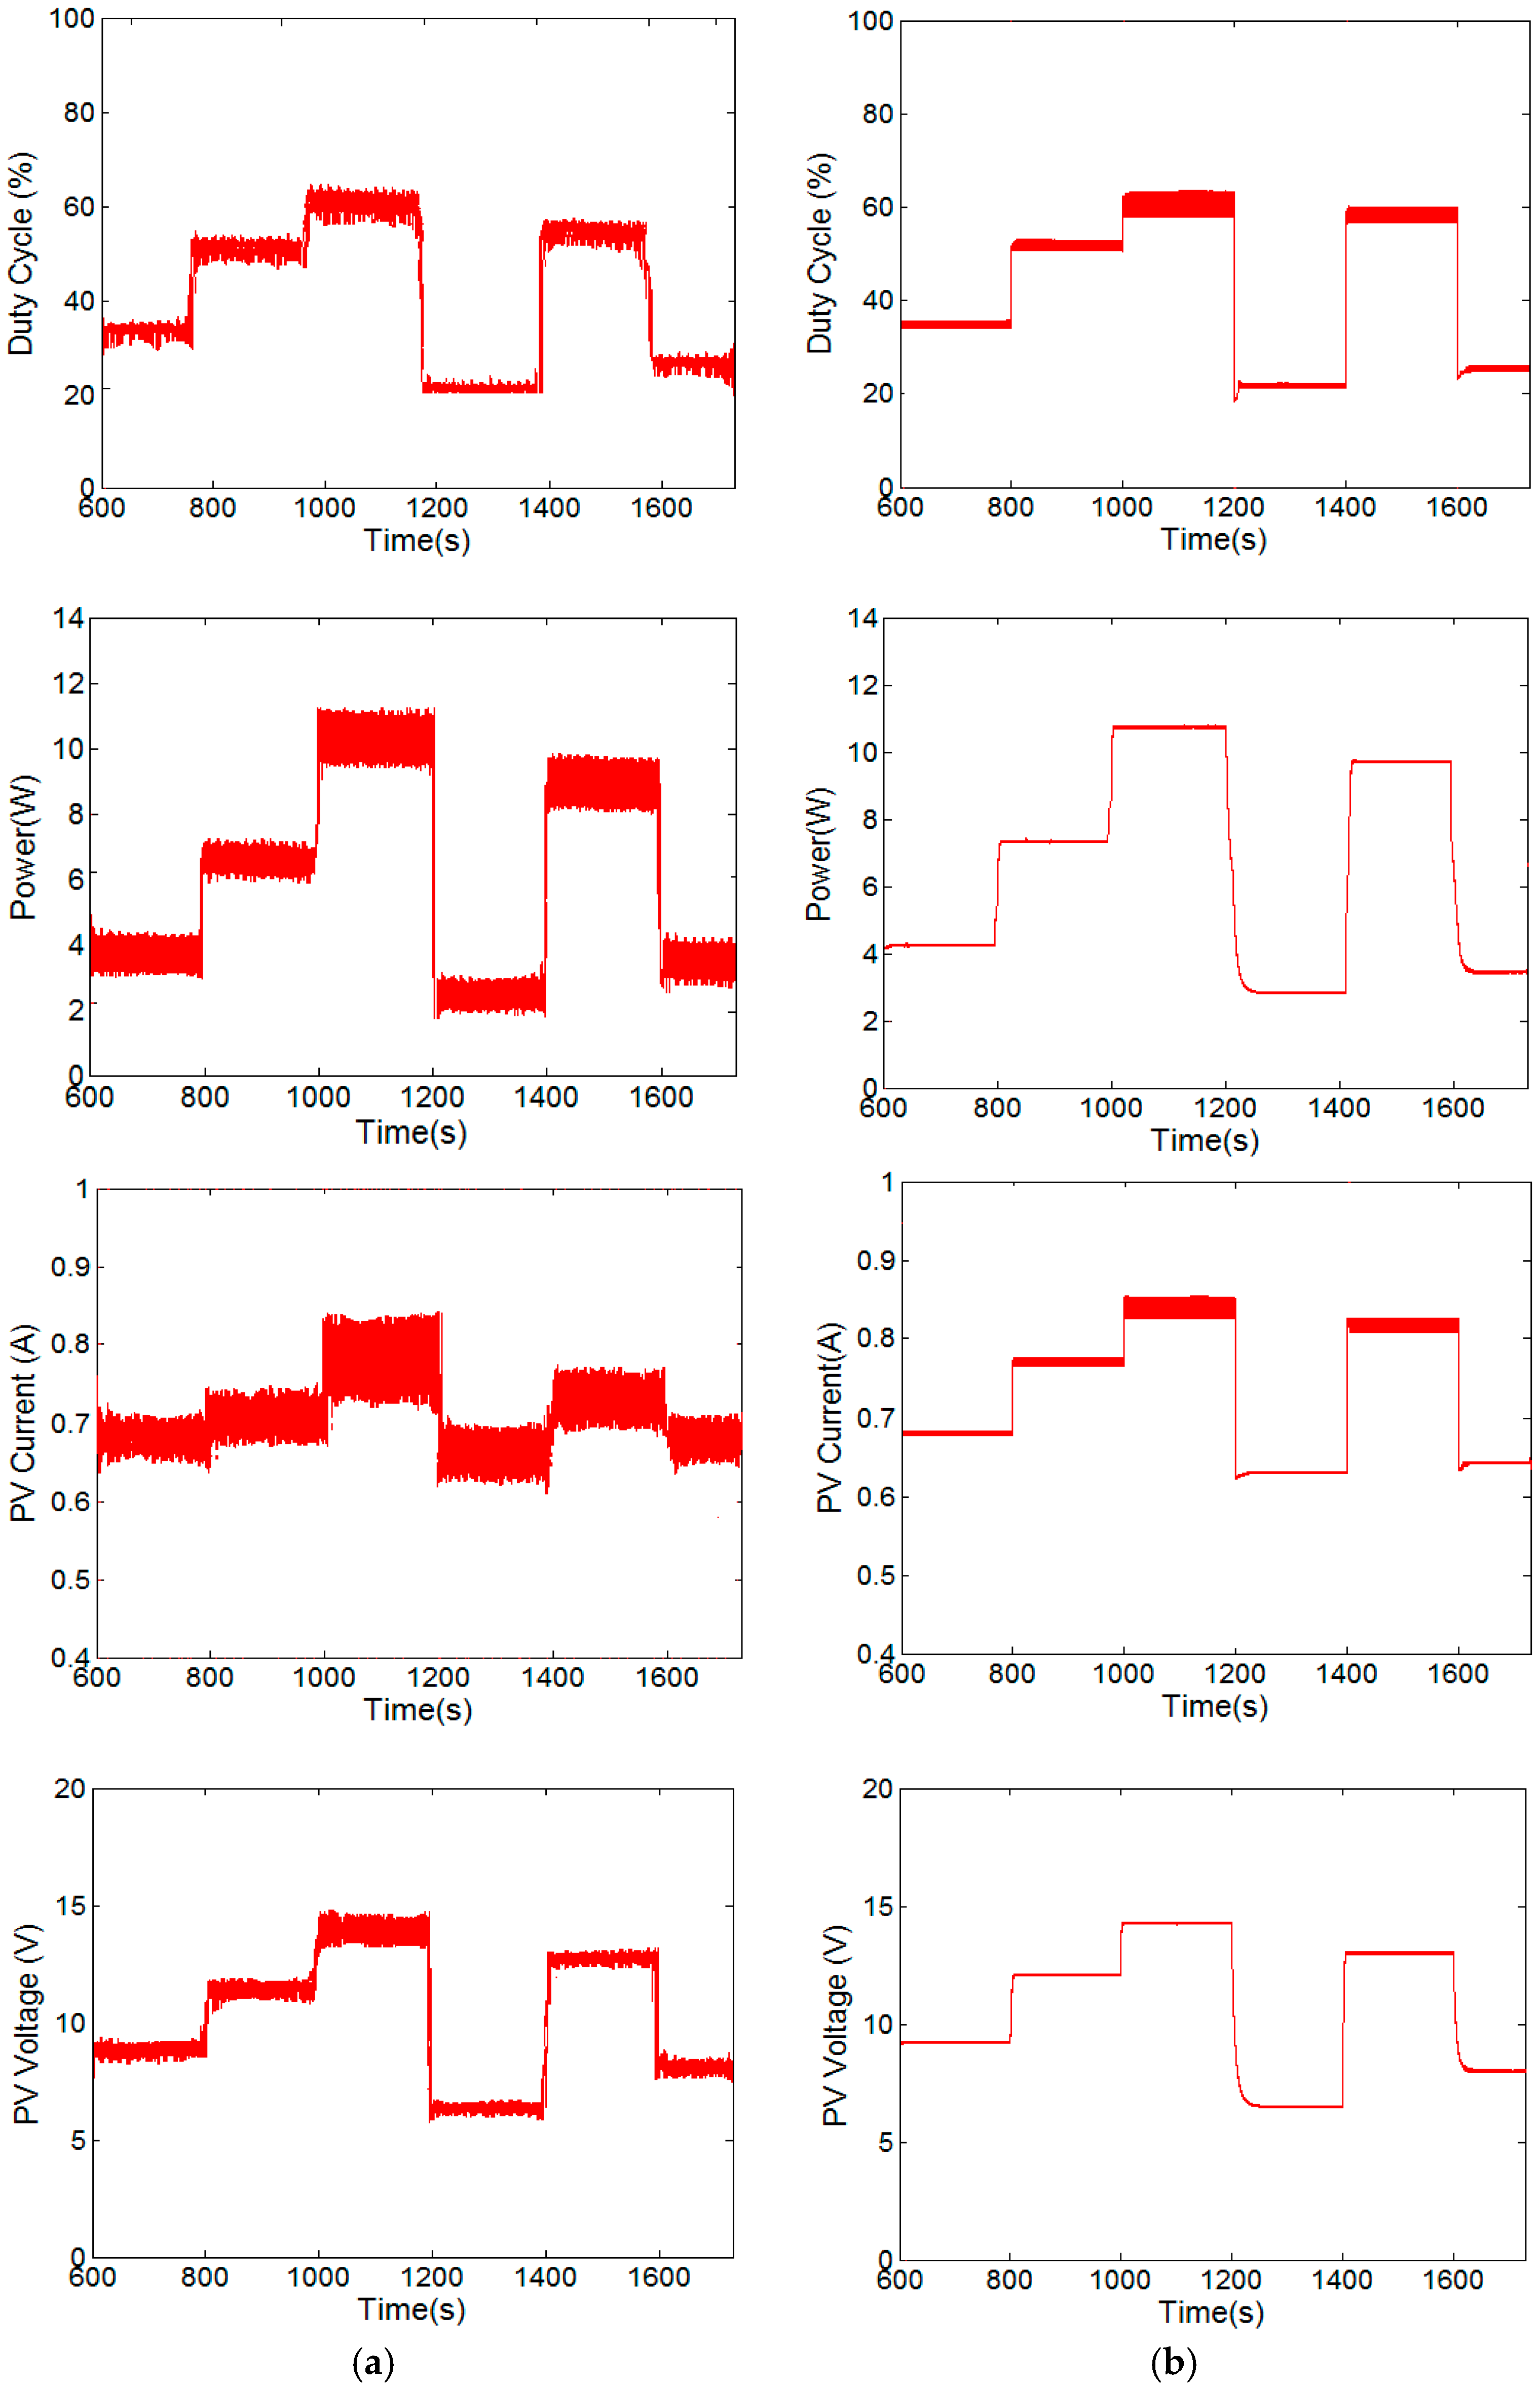
Having studied the tracking efficiency, the reflection of the dynamics of both methods on the electro-thermal performance of the switching devices of the converters can be further analysed. To begin with, since the IC method was found as more efficient than the P&O method, theoretically it can deliver more power from the PV panel under identical working environment. This, in turn, results in more current drawn through the converter as experimentally and theoretically shown in
Figure 9 and
Figure 10. It was initially stated in Equations (14)–(16) through that the current increase causes more power losses for the switching devices and it is also a function of both duty cycle and temperature.
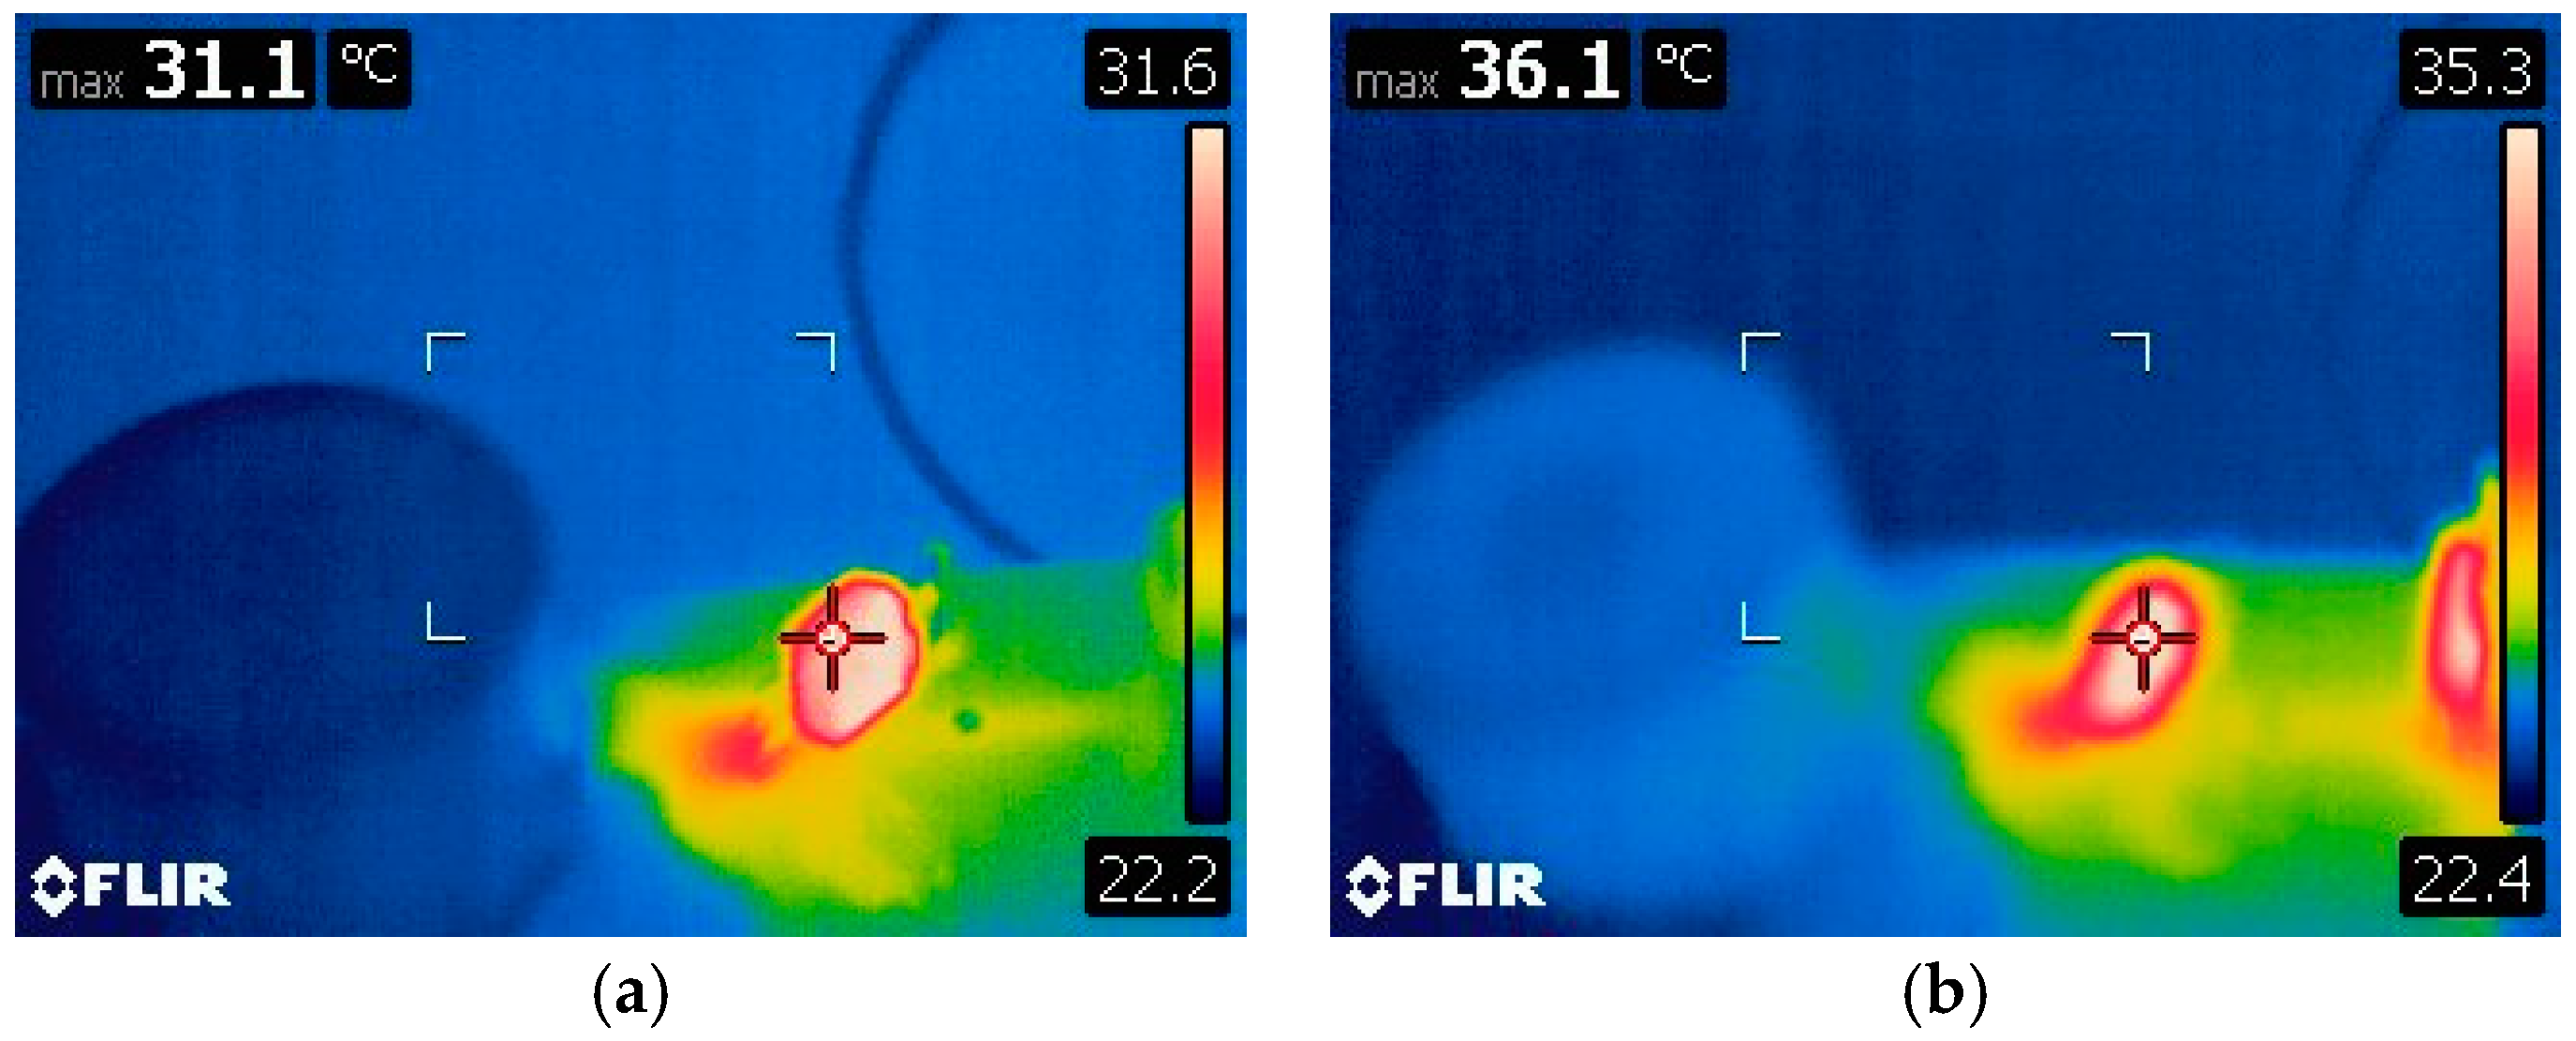
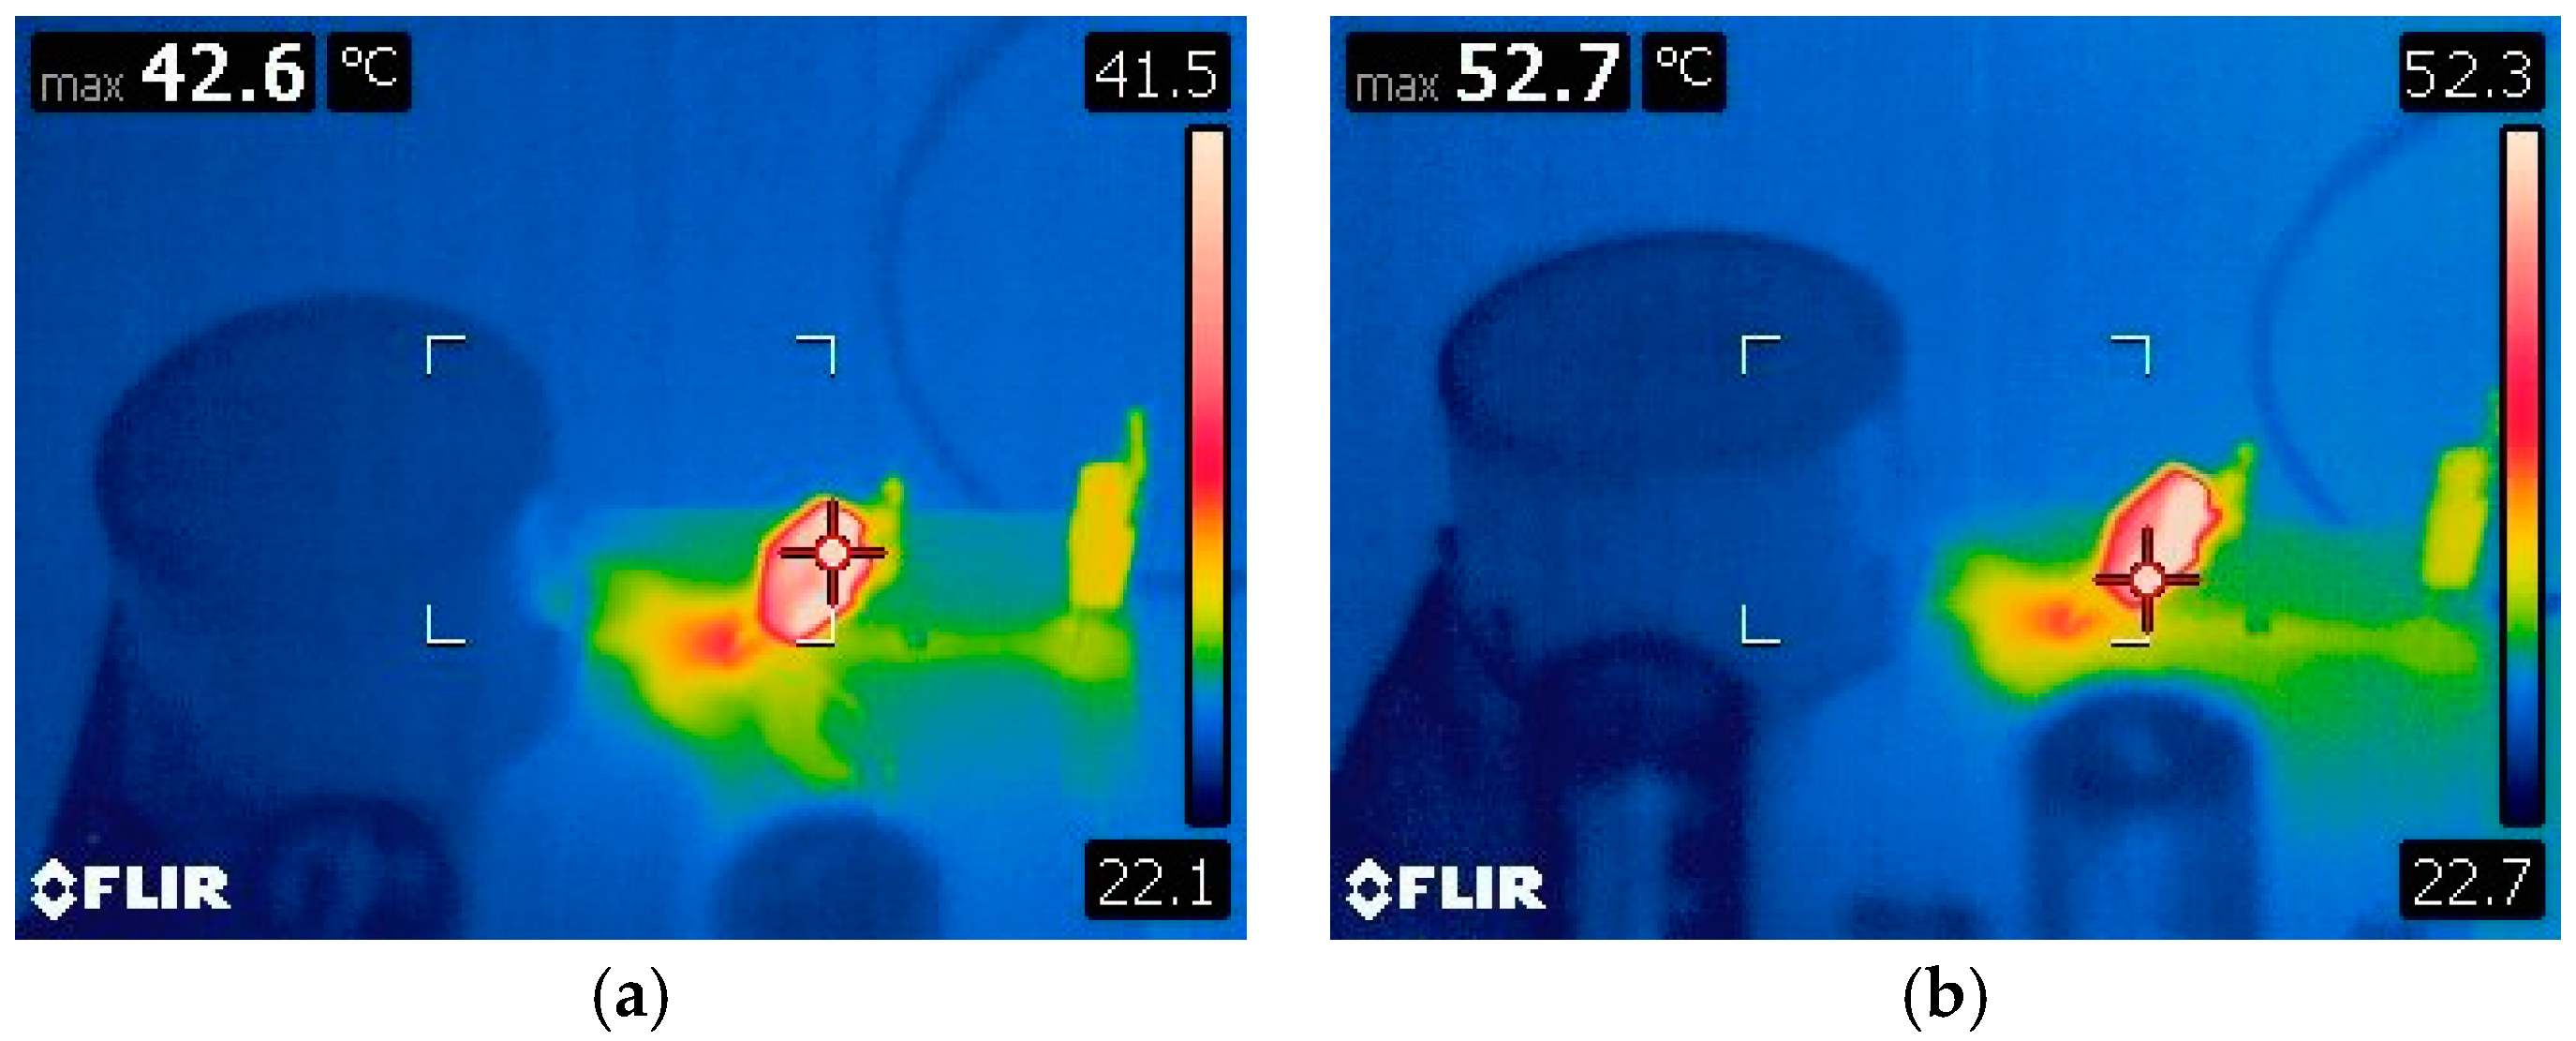
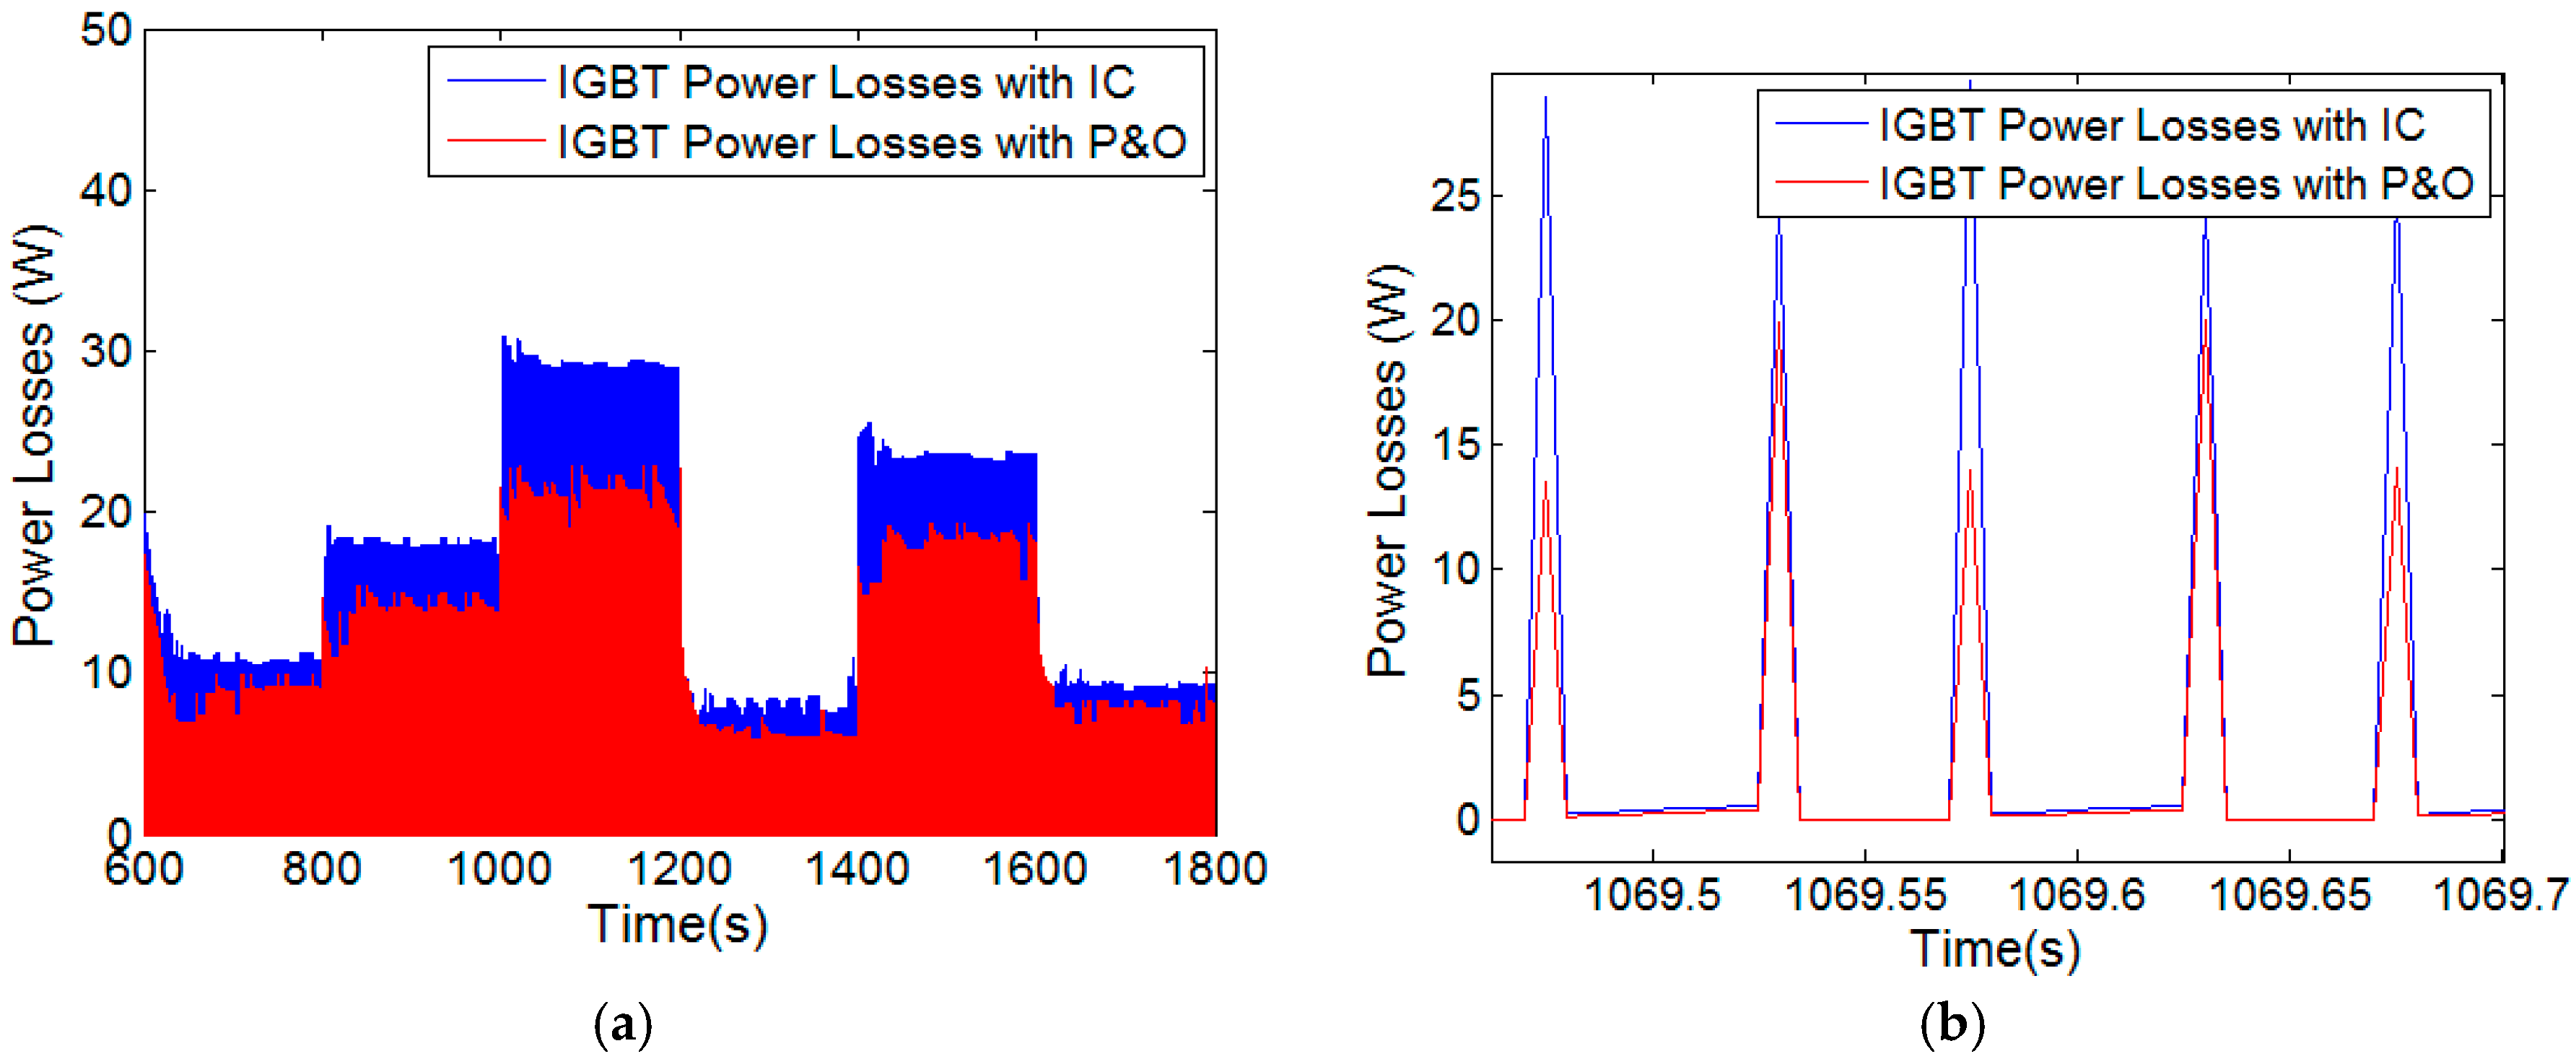
This is the main reason why the IC method has a higher loss profile compared to the P&O method which causes higher temperature and lifetime consumption. In particular, for instance, at the highest irradiance, the duty cycle is increased by both algorithms to extract the maximum available power where the IC method showed better efficiency. The converter extracted 11.2 W average power when operated by IC whereas this was 10.5 W with the P&O method. The average duty cycle provided by the IC was 63% where it was only 59% from the P&O method. This clearly shows that with the IC method, longer conduction time occurred on the switching device compared to the P&O method. This leads to more current passing through the device in on-stage; hence, causes higher conduction losses as shown in
Figure 11a,b. The increments in the average temperature profile with IC and the fluctuations are related to this analysis as can be depicted in
Figure 14a,b. As a result of the lower temperature profile, the P&O caused 1.4 times less lifetime consumption on the switching device compared to the IC method.
6.4. Future Direction
It is worth noting that the outcomes of this work are based on the conventional IC and P&O methods under identical operating conditions by using direct duty cycle MPPT without any further controller. Performance utilisation studies in literatures [
14,
15] such as the adaptive time step adjustments would offer more efficient MPPT; hence the thermal profile of the switching devices would change accordingly. These systems work based on the marginal error tracking method with addition of tuneable controller parameters to increase the tracking speed and to reduce the oscillations. They would require complex and more expensive control circuitry. Also, selecting the correct perturbation step size is important for achieving optimised efficiencies. A further research direction would be the investigation of the utilised MPPT methods and their effects on the lifetime of the switching devices operated in different PV converters.
7. Conclusions
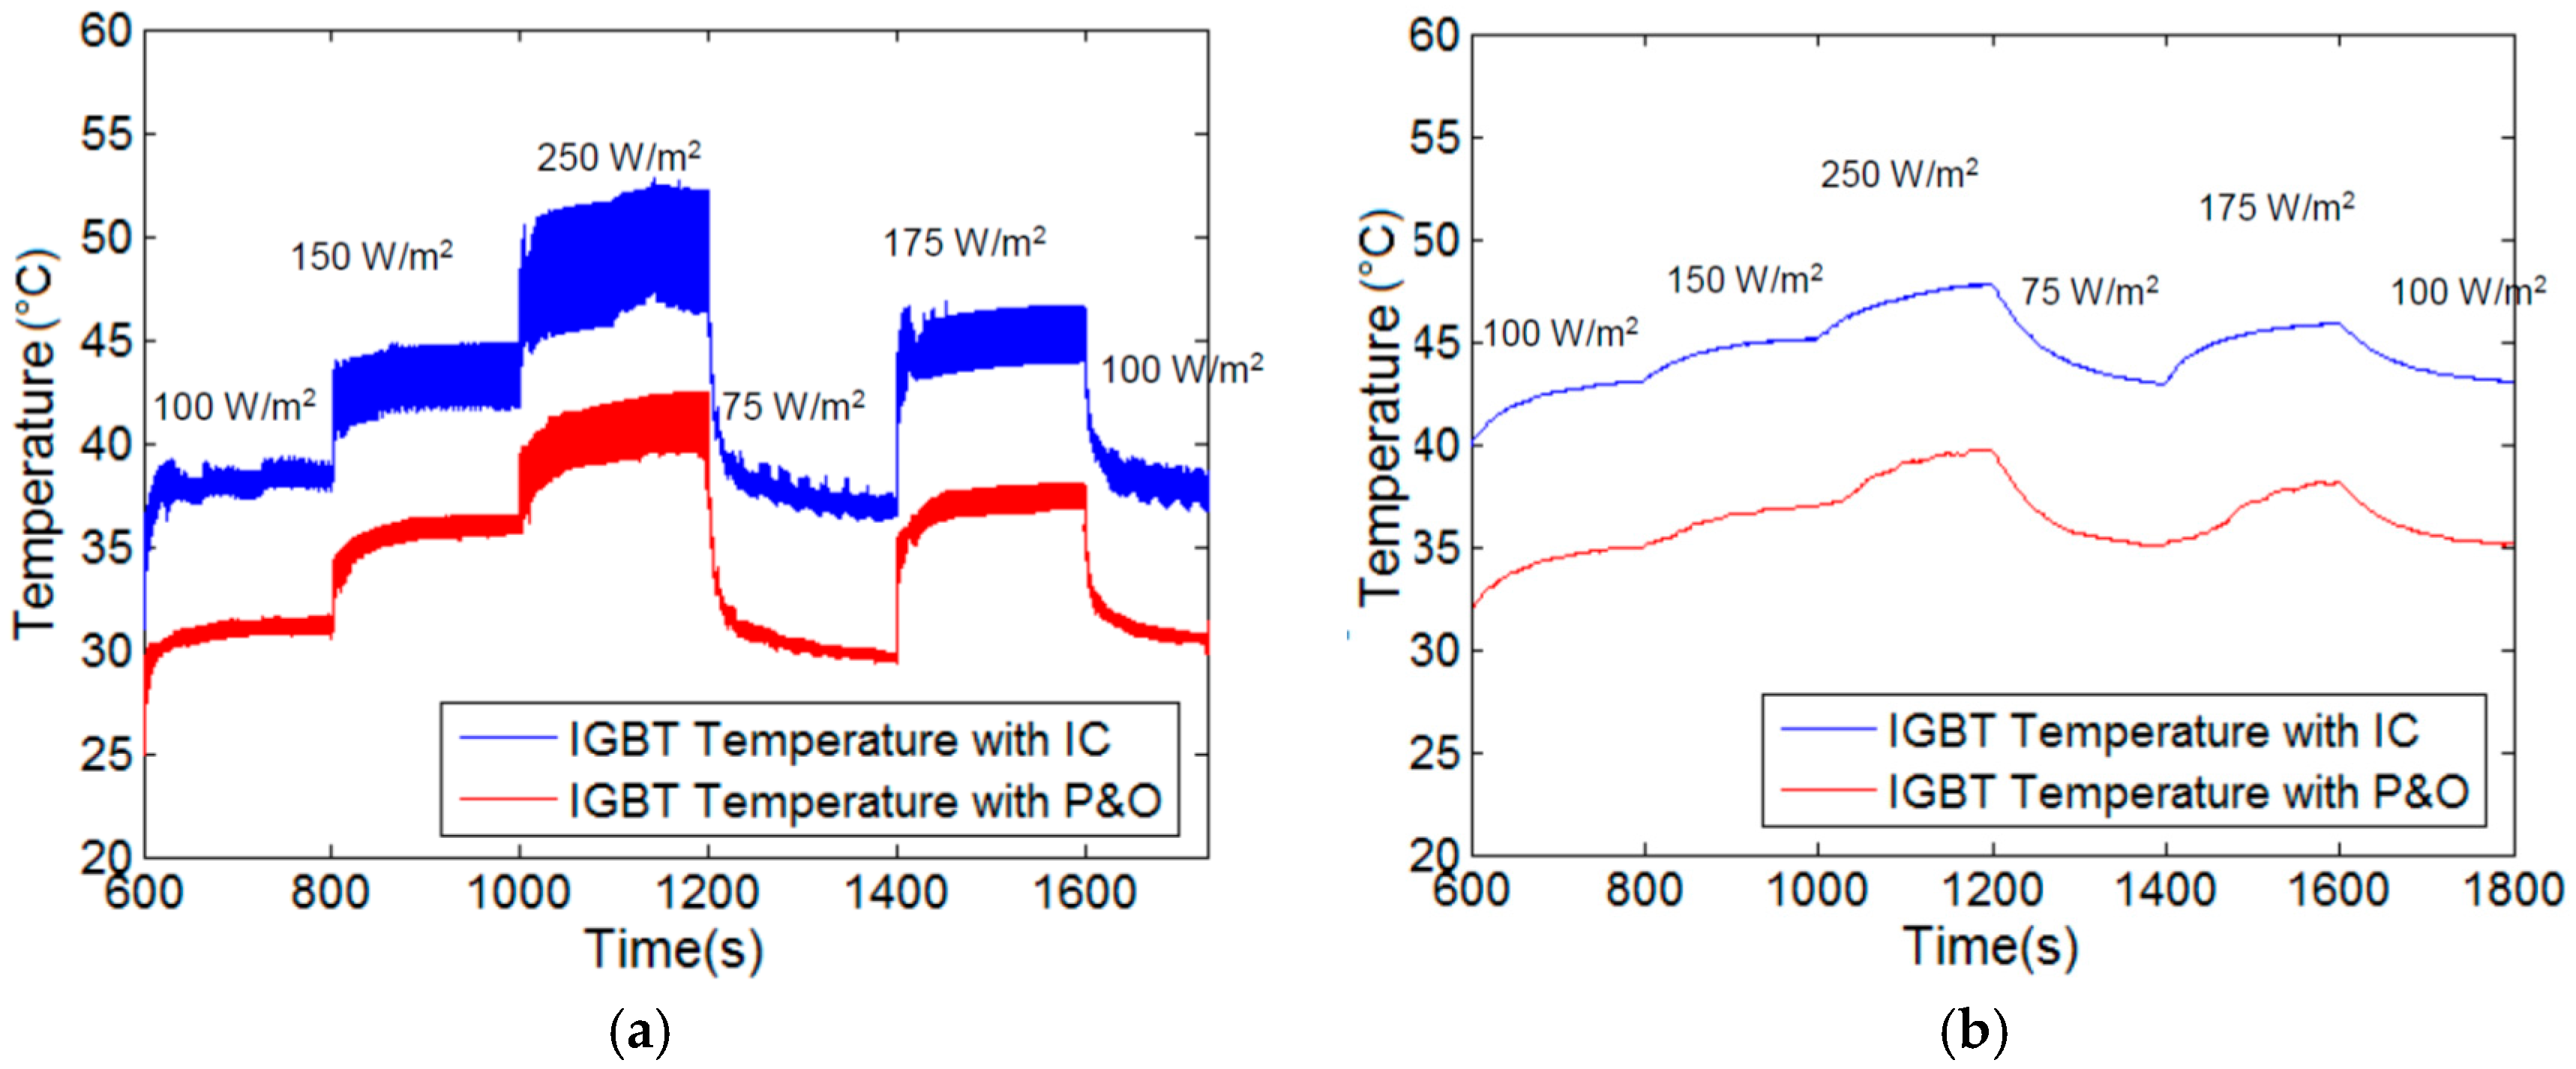
Effects of IC and P&O PMAs on the electro-thermal performance and lifetime of the IGBT used as switching element of PEC were presented. Compared to the P&O method, thermal cycling on the IGBT component was found to be approximately 4 °C higher when the IC method is operated and the steady state temperature was 52.7 °C, while this was 42.6 °C with P&O. The lifetime of such a semiconductor component depends on the thermal variation caused by changing operating conditions. This was investigated in this work with experimental power cycling test-based lifetime consumption monitoring. Number of cycles to failure was estimated by this test and number of cycles in temperature profile of IGBT used in PEC was counted by a Rainflow algorithm. Then, lifetime consumption was calculated based on the Palmgren-Miner linear damage accumulation rule. The system operated by the IC method was found to be less reliable compared to the one with P&O, when they are operated under the same operating conditions. IC method was found to cause 1.4 more life consumption. Consequently, the IC method is superior in terms of tracking efficiency and response to sudden irradiance changes on PV module based on this study; however, it causes higher varied temperatures on IGBT and reduces its reliability. The results presented in this paper, for the first time in the literature, clearly show that the reliability of the converter switching devices is affected by different MPPT methods in PV applications. An interesting future study needs to be done for further investigating this phenomenon under different operating parameters, i.e., power rating and environmental conditions. As the future trend is to increase the power capacity of solar PV applications, this research states that the lifetime consumption for the converter units will be also affected and life consumption estimation techniques will be required for conscious assessment of the reliability of these devices. Materials with less thermal impedance properties, such as silicon carbides, would be desirable for the manufacturing of more reliable devices. Advanced cooling techniques would also be essential for those systems.


