Article

Energy Saving in Water Distribution Network through Pump as Turbine Generators: Economic and Environmental Analysis

Faculty of Engineering and Architecture, University of Enna Kore, Cittadella Universitaria, Enna 94100, Italy
*
Author to whom correspondence should be addressed.
Energies 2016, 9(11), 877; https://doi.org/10.3390/en9110877
Submission received: 13 July 2016 / Revised: 18 October 2016 / Accepted: 19 October 2016 / Published: 26 October 2016
(This article belongs to the Special Issue Energy Saving Design for Manufacturing Process, Product, and System)

Abstract

:
Complex systems of water distribution networks (WDS) are used to supply water to users. WDSs are systems where a lot of distributed energy is available. Historically, this energy is artificially dissipated by pressure reduction valves (PRVs), thanks to which water utilities manage the pressure level in selected nodes of the network. The present study explores the use of economic hydraulic machines, pumps as turbines (PATs) to produce energy in a small network located in a town close to Palermo (Italy). The main idea is to avoid dissipation in favor of renewable energy production. The proposed study is applied to a WDN typical of the Mediterranean countries, where the users, to collect water during the period of water scarcity conditions, install private tanks. The presence of private tanks deeply modifies the network from its designed condition. In the proposed analysis, the economic benefit of PATs application in water distribution networks has been investigated, accounting for the presence of users’ private tanks. The analysis, carried out by mean of a mathematical model able to dynamically simulate the water distribution network with PATs, shows the advantage of their installation in terms of renewable energy recovery, even though the energy production of PATs is strictly conditioned by their installation position.

1. Introduction

Water and energy savings are major concerns in the management of water distribution networks (WDNs). Nowadays, energy for pumping represents the main cost for water companies which have to guarantee the delivery of enough water with good quality to population: indeed, water losses reflect directly in energy wasting. This strong connection between water and energy consumption gives rise to programs, such as Watergy [1], aimed at investigating technical and managerial strategies to realize energy, water, and monetary savings through cost-effective actions.
A large effort has been made in recent years to investigate management strategies aimed at reducing net energy consumption in WDNs. Traditional solutions focus on pump and pipe selection, leak detection and repair, and pressure control policies. In fact, water and energy thrifts in WDNs are strictly linked to pipeline water leakages (pipe breaking, joint failures, etc.), which are related to water pressure.
Traditionally, in existing WDNs, head reduction has been achieved by inserting pressure reducing valves (PRVs) [2,3,4,5] that are able to maintain pressure variation in a controlled manner. Recently, there has been growing interest in recovering energy instead of dissipating excess pressure through valves, analyzing the potential of turbines to replace PRV or break-pressure tanks, achieving two main objectives: leakage reduction and renewable energy production. Unfortunately, the hydraulic turbine installation is a suitable solution just where the available hydraulic power is fairly constant. In fact, where flow rates and heads are highly variable, turbines are not cost effective, so other strategies have been investigated in recent years.
One of the easiest technological solutions, which can combine efficiency and economical convenience, is the use of a centrifugal pump in reverse mode, with the engine acting as a generator [6,7]. Pumps as turbines (PATs) require low cost hydraulic and electric equipment and are often claimed as the cheapest and most sustainable solutions [8] for energy production [9,10,11], especially for small size power plants (<40–50 kW). In fact, pumps have various advantages compared to turbines, which are linked to ease of availability, proven technology, low initial installation and maintenance cost, availability for a wide range of heads, and flows [12,13].
The concept of electricity generation through reverse running centrifugal pumps is not new but dates back to around 80 years ago. Recently, Jain and Patel [12] analyzed the historical development and state-of-the-art of PATs, which found application in micro-hydropower plants as well as in water supply piping systems.
Pumps, which work in reverse mode, do not show the same performance when acting in direct (pump) and reverse (turbine) modes, and pumps manufacturers usually provide the characteristic curves only for the direct mode. The evaluation of the characteristic curves of PATs has been one of the most important limitations of their applicability [14,15,16,17,18]. There have been many performance prediction techniques of the turbine operation of pumps based on best efficiency or on specific speed, which have tried to establish a correlation enabling the passage from the direct to the reverse characteristics (see [13,16] for a review). Derakhshan and Nourbakhsh [16] tested several centrifugal pumps and used experimental data to derive some relations to predict the best efficiency point characteristic of PAT. More recently, Nautiyal et al. [8] experimentally tested a centrifugal pump of specific speed to relate pump and turbine mode characteristics. They also used experimental data from other researchers to develop relations to obtain PATs efficiency from pump mode characteristics. These relations gave lower deviation from experimental results respect to those obtained by previous researchers [15,16,17].
A large number of theoretical and experimental studies have been done for prediction of PAT performance, but there is still a need to explore this area more deeply since the results predicted by these methods are not reliable for pumps with different specific speeds and capacities.
Most recent attempts to predict performance of PATs have been made using computational fluid dynamics (CFD). Unfortunately, in many cases, large deviations in results have been found between experimental and CFD results [13,15,18,19].
Recently, PATs have been investigated in terms of economic benefits. Arriaga [20] carried out the cost analysis for a pico-hydro plant development in the Lao People’s Democratic Republic, showing that the implementation of PAT reduces the cost 53% as compared with cross-flow turbine. Carravetta et al. [19] proposed a method which allows PAT’s geometry selection for a given flow-head distribution pattern to find the solution which maximizes the produced energy in WDNs. Carravetta et al. [21] extended the methodology to investigate on best economic efficiency between a hydraulic regulation via a series-parallel hydraulic circuit or an electrical regulation via inverter, finding that hydraulic regulation is more flexible and efficient than electrical regulation. Recently, Puleo et al. [22] investigated energy recovery by PATs in WDNs characterized by the presence of private tanks and intermittent service, highlighting that further analysis was needed for these operating conditions to investigate the possibility and the efficiency of the PATs to recover energy from the WDN. Fontana et al. [23] analyzed a water distribution network in the city of Naples to assess the potential revenues from energy recovery instead of dissipating excess pressure by replacing some of PRVs with PATs, which turned out to guarantee adequate pressure service.
They found that the optimal location of PRVs to reduce water losses did not maximize energy production. Maximum energy recovery needed a multi-objective approach. Nevertheless, results showed attractive profits and capital payback period (CPP), which further justify efforts in the analysis of PAT application in WDNs [21,24].
The aim of the present study is to investigate energy recovery in WDNs by PATs to guarantee adequate pressure service and recovery energy from the fluid instead of classical energy dissipation devices (i.e., PRVs). The analysis has been carried out in terms of energy and capital cost recovery.
CFD analysis has been used to analyze energy recovery in WDNs characterized by the presence of private tanks where users who experience water resources rationing store water resources (see [25,26]). Such local water storage volumes are actually very common in those countries (e.g., in the Mediterranean area) where water supply is not reliable and users are brought to collect water to cover their needs when the service in unavailable, due to shortage of supply or intermittent distribution [27]. The local private storage interposed between the user and the network is subject to filling/emptying processes, which modify user’s demand profile and pressure distribution in the network, causing modifications on PATs energy production capability in the network. Water heads and discharges are calculated through the method of characteristics (MOC). The model, already presented in De Marchis and Freni [28], was used to simulate PATs in small water distribution network.
The above-mentioned research focused the attention of the effect of PATs in water distribution network without actually taking into account the dynamic variation of the energy produced in light of the WDN users’ behavior. The proposed mathematical model is able to modify the regulation point of the PAT with the discharge flowing in the WDN, simulating different scenarios and taking into account the presence of private tanks, if installed. The model can thus be considered a management tool for the water utilities to investigate on the possibility of recover energy in WDNs and to optimize the position of the PATs. With respect to other approaches, the proposed mathematical model which is able to simulate a lot of possible work combinations in WDNs (i.e., steady state condition, intermittent distribution, presence of water tanks, etc.).
The model has been applied to the Misilmeri network, a small town located close to Palermo (Italy), characterized by the presence of several private tanks on the roofs, and the results have been analyzed in terms of a management strategy based on the economic analysis and the payback period, taking into account users’ satisfaction in terms of water volume supplied in each node for over 24 h.

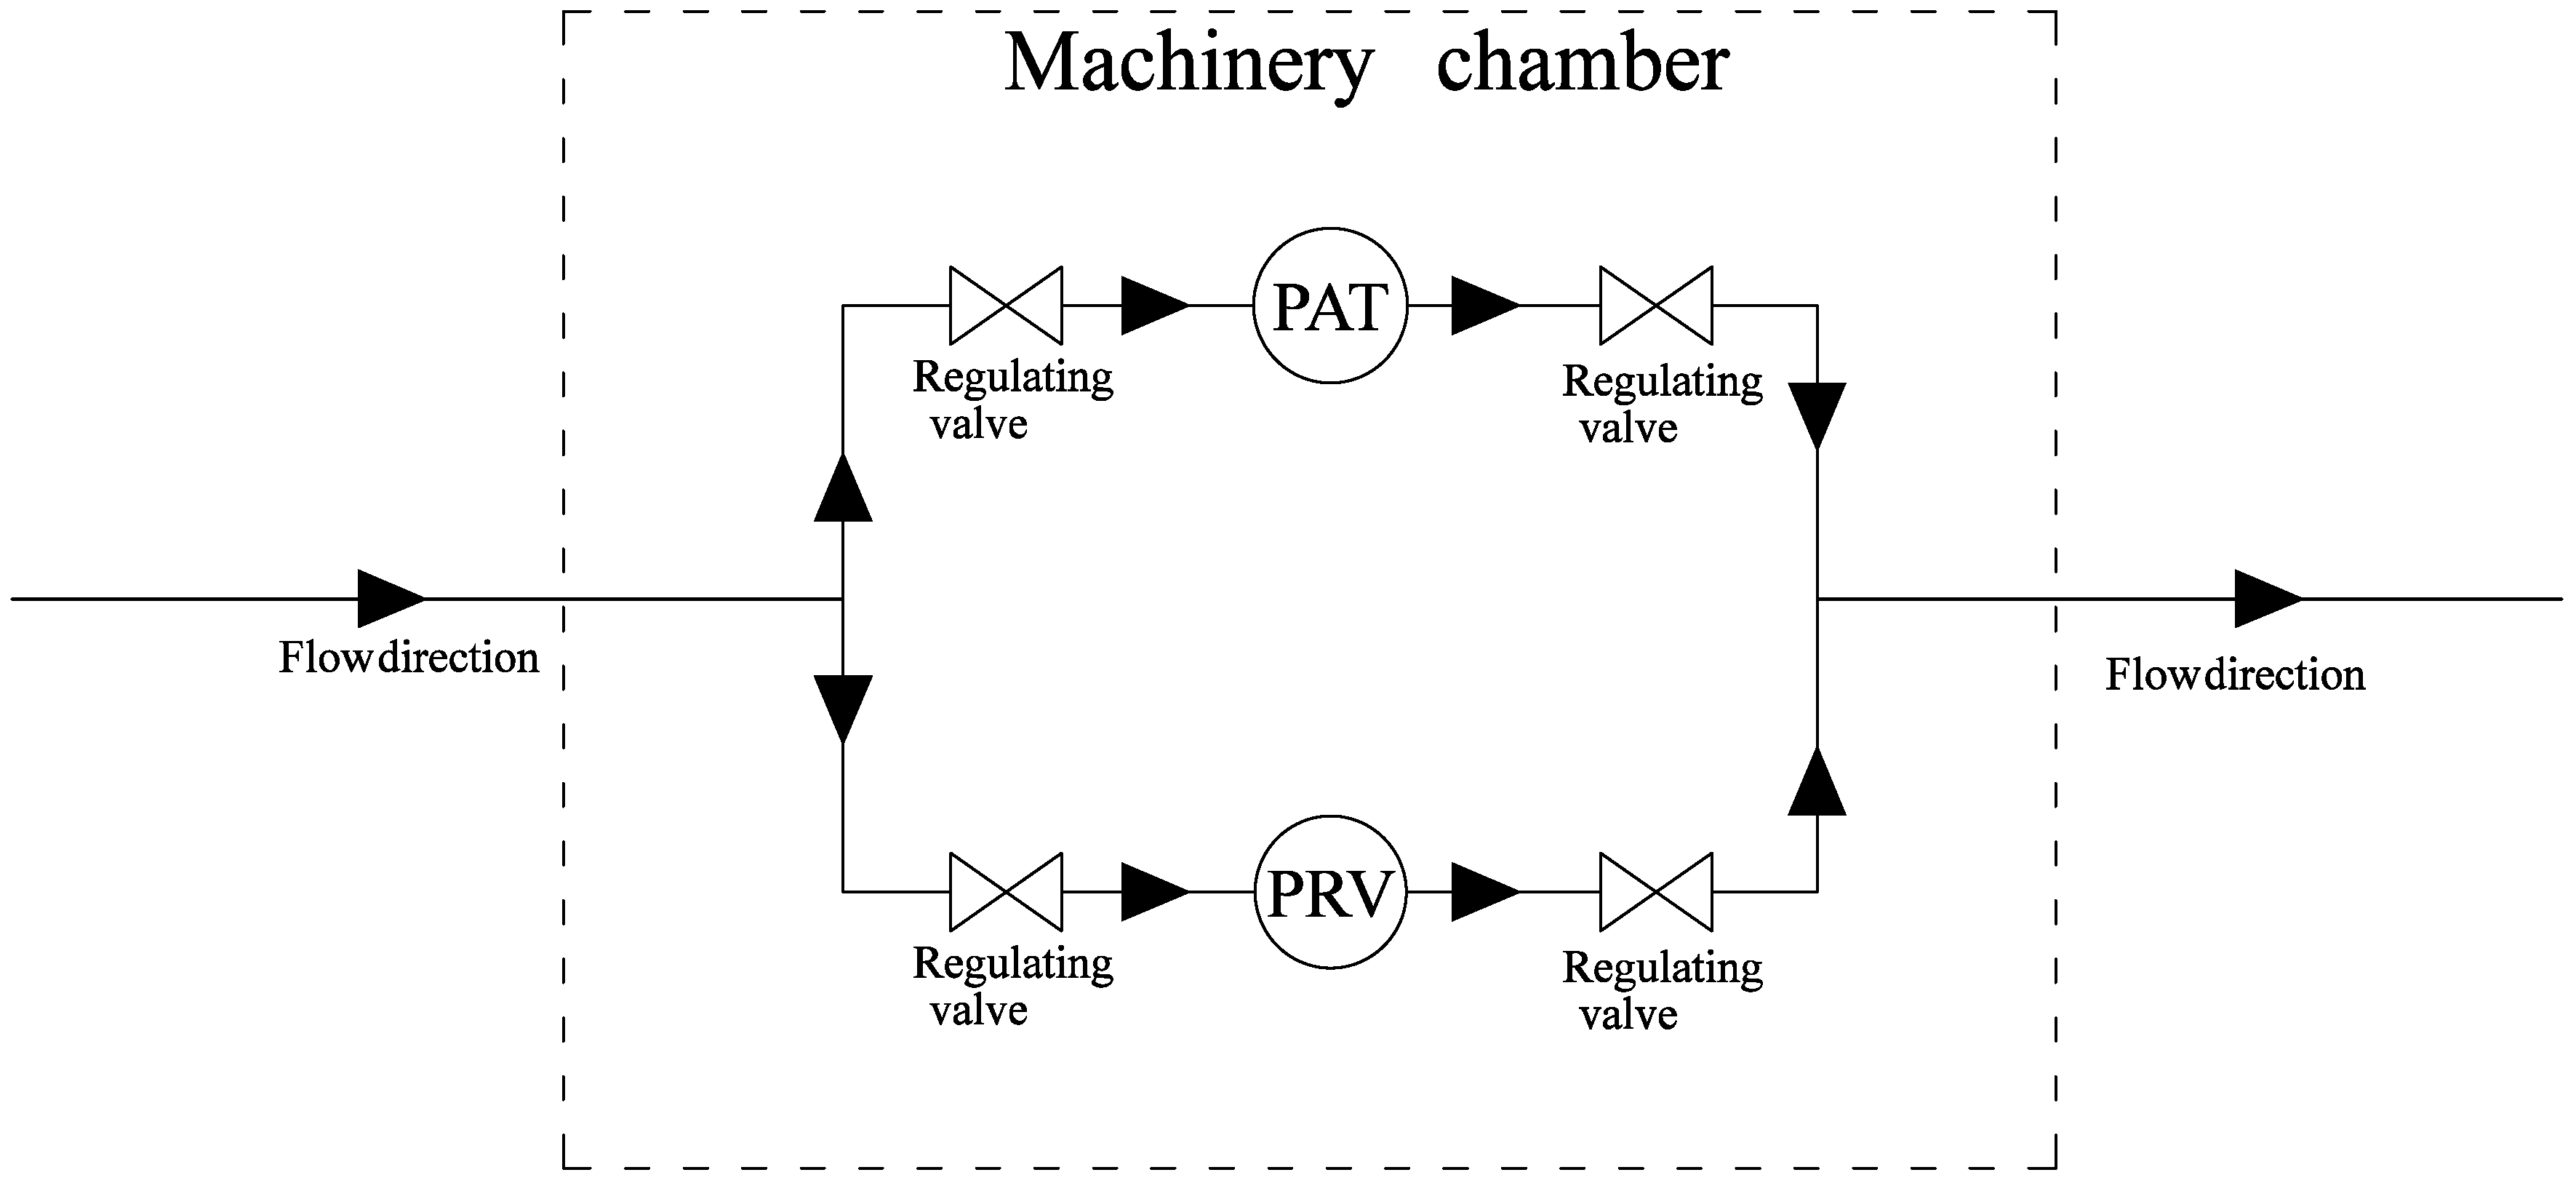
2. Mathematical Model and Numerical Procedure
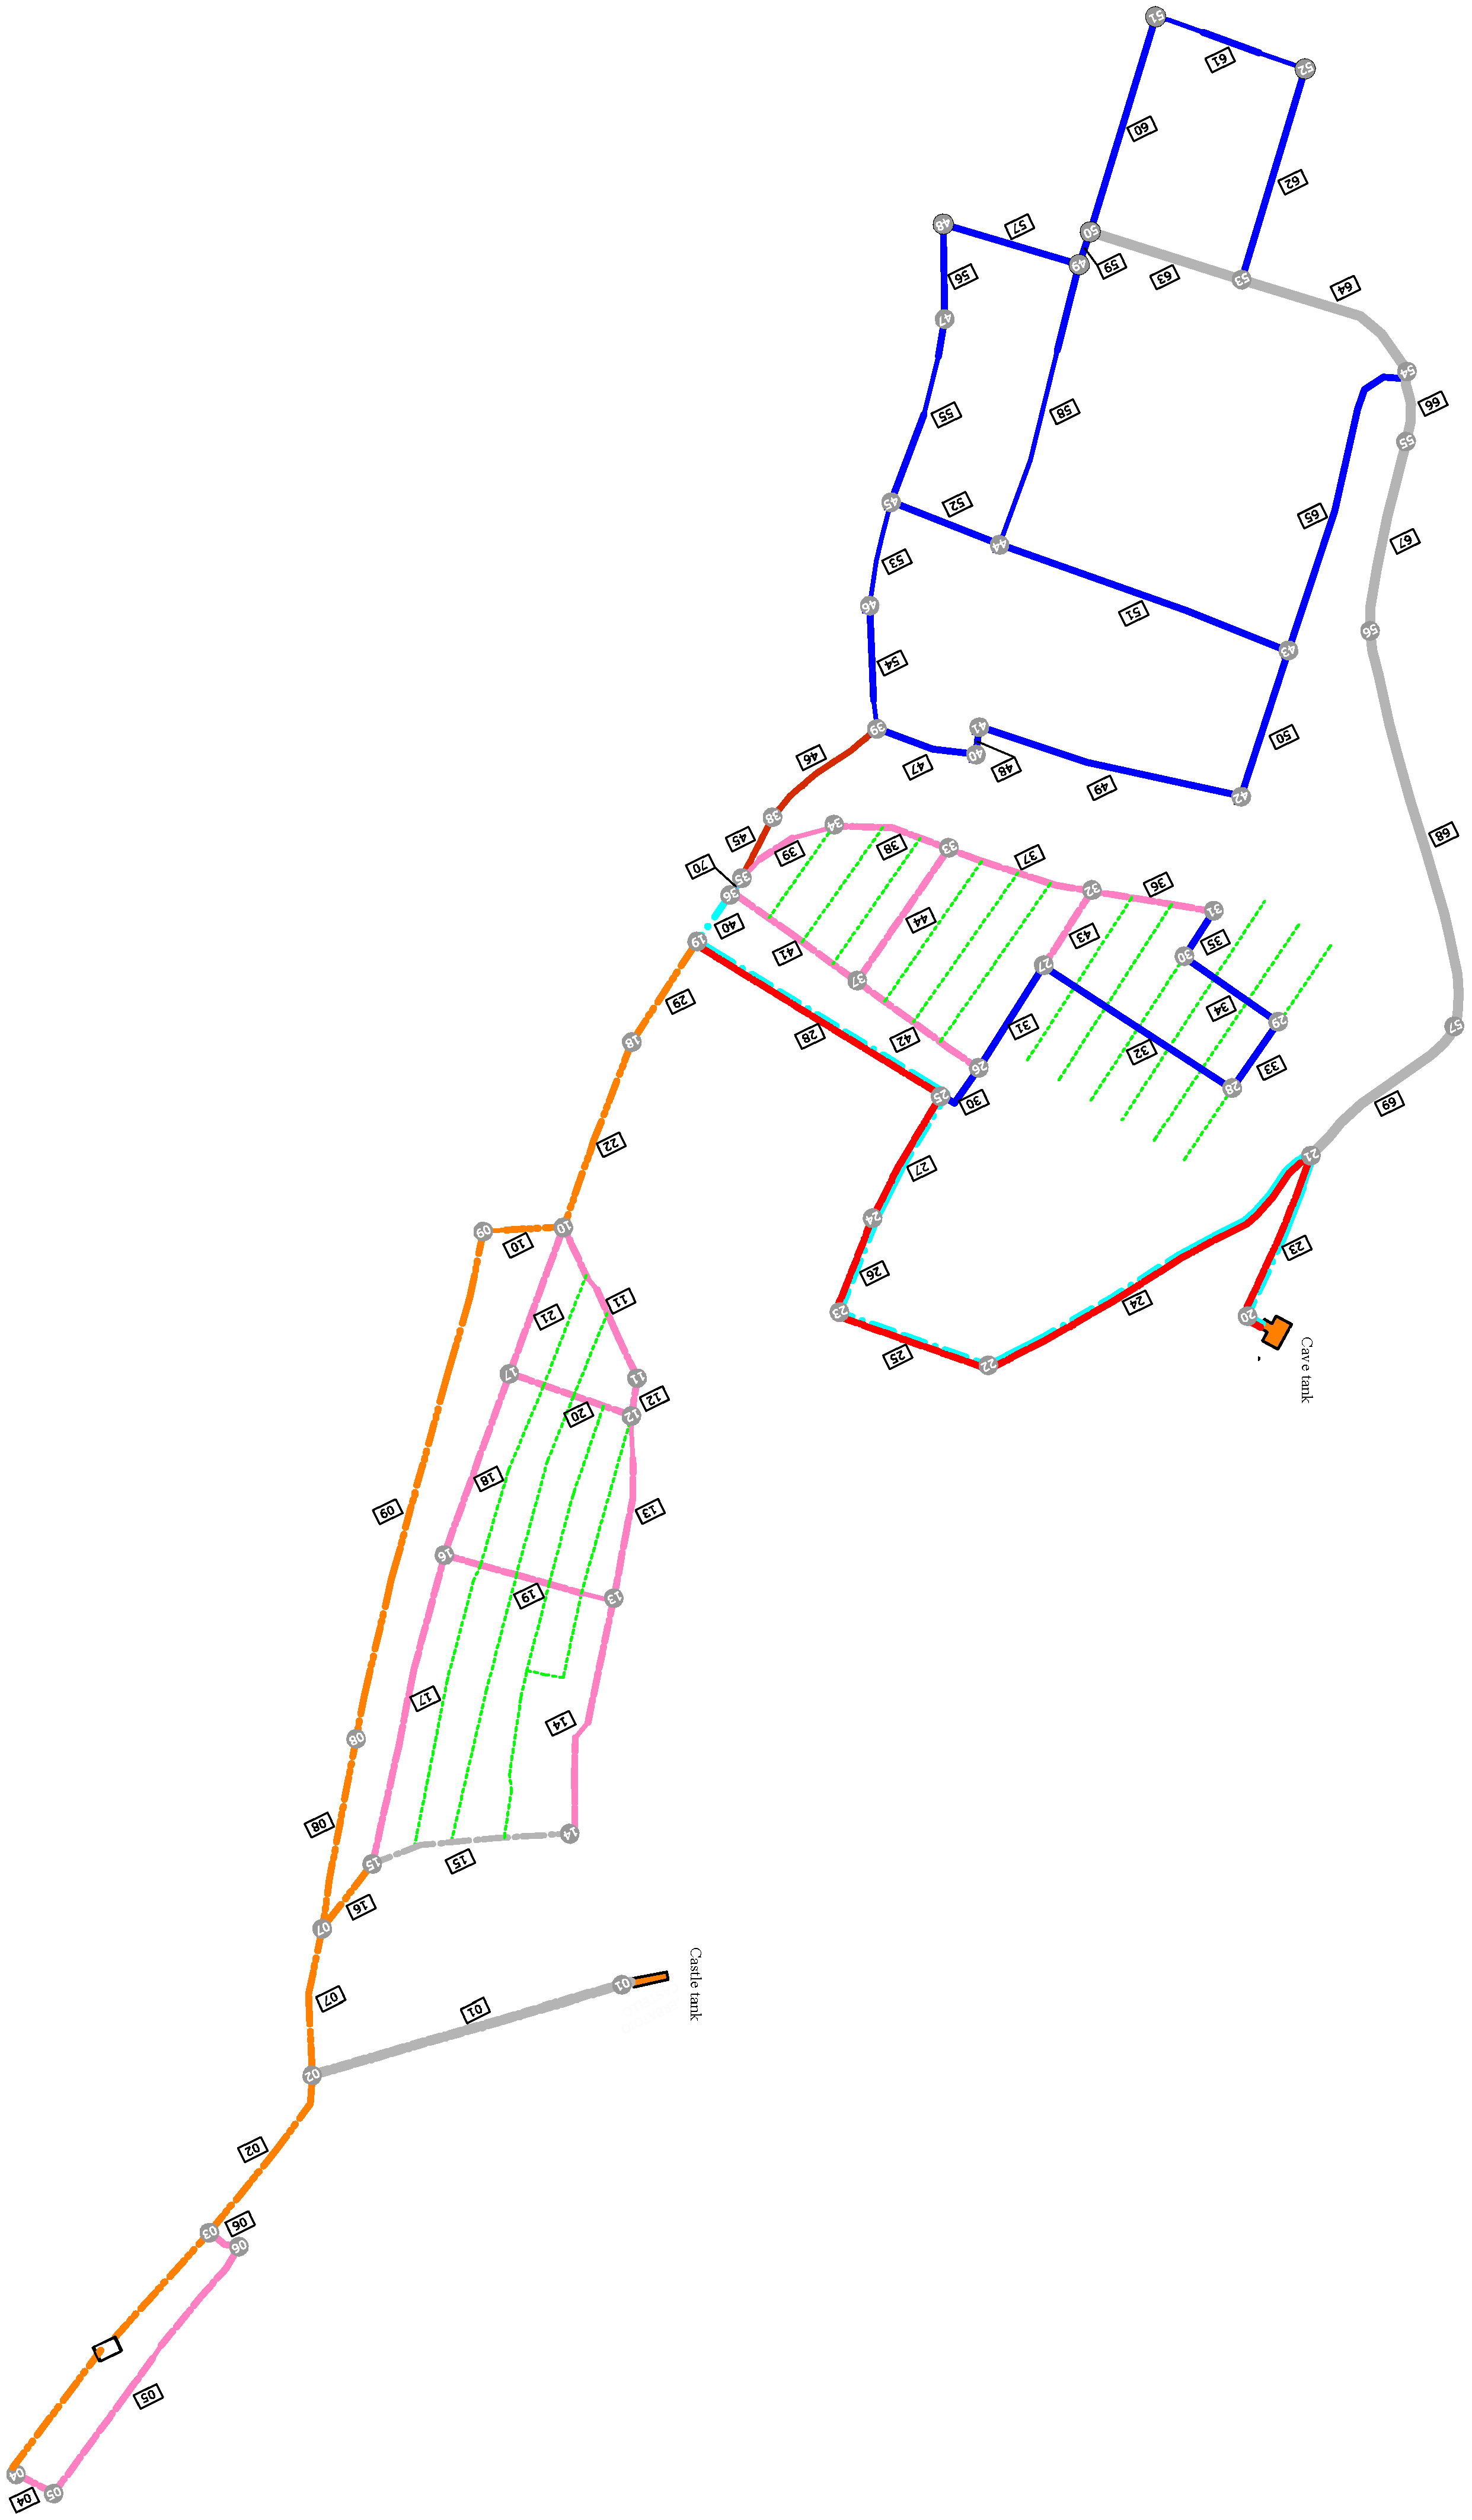
The mathematical tool has a main part given by the hydrodynamic model, able to simulate complex water distribution networks [25] and a second module able to reproduce the PAT operation mode [28].
The hydrodynamic model solves the momentum and continuity equations using MOC which transform the system of partial differential equations into ordinary differential equations, known as compatibility equations:
d V d t + g d h c d t + g J s + g c V sin ( θ ) = 0
d V d t g d h c d t + g J s g c V sin ( θ ) = 0
where t is the time, V is the velocity averaged over the pipe cross-section, h is the water head, g is the acceleration due to gravity, c is the celerity of pressure waves and θ is the slope of the pipeline. In the present analysis, a steady state friction model has been used, thus Js, that is the head loss per unit length, has been calculated according to the classical formulation by Darcy-Weisbach. The formula is strictly dependent on the roughness of the pipe, which plays a fundamental role in the discharge estimation [29,30]. The model is developed to take into account the unsteady friction model of Vítkovský et al. [31] (details can be found in De Marchis and Freni [28]), even though in the present analysis a steady state friction model was used.
The compatibility equations are valid along the well known characteristic lines (positive and negative):
C + : d s d t =   + c
C : d s d t =   c
Equations (1) and (2) can be solved through the finite difference technique and read:
h j i , n + 1 h j m i , n + c g ( V j i , n + 1 V j m i , n ) + [ c J j m i , n + V j m i , n s i n θ i ] Δ t i = 0
h j i , n + 1 h j v i , n c g ( V j i , n + 1 V j v i , n ) [ c J j v i , n V j v i , n s i n θ i ] Δ t i = 0
where V j i , n + 1 and h j i , n + 1 are the velocity and the water head in the jth section (of abscissa (j – 1)Li/Ni) of the ith pipe at the time step tn + t; θi is the slope of the ith pipe; jm and jv are the sections upstream and downstream to the jth section, respectively.
The time step advancement Δ t i n , function of the length and the celerity of the ith pipe, is calculated for each pipe and the minimum value is chosen as the unique time step integration:
Δ t n = min i Δ t i n = min i ( L i n / ( N i   c i   ) )
The flow rate into users’ tanks is calculated as:
Q j , u p = C v · a · 2 g ( h j i h j , t a n k )
where Qj,up is the discharge at the jth node entering the tank connected to the node, Cv is the non-dimensional float valve emitter coefficient, a is the valve effective discharge area, g is the gravity acceleration, h j i is the water head at the jth node, and h j , t a n k i is the height of the private tank. Further details on the numerical model can be found in De Marchis et al. [25,27].
The accuracy of the hydrodynamic model was verified comparing numerical results to measured water heads in a real WDN of the city of Palermo (Italy). The comparison, shown in De Marchis et al. [32], clearly showed the ability of the numerical model to predict the variation of the pressure in 24 h. The qualitative agreement between measured and simulated pressure profiles were confirmed by the quantitative analysis carried out calculating the root square mean error (RSME), obtaining an accuracy of the model of about 5% of the average measured pressure.
To investigate on the energy recovery in water distribution networks, the hydrodynamic model was developed to simulate PAT behavior. Even though several analyses have been carried out to derive the characteristic curve of a water turbine [33], here the characteristic curves achieved by Derakhshan and Nourbakhsh [15,16], through experimental analysis, have been used:
H t H t b = 1.0283 · ( Q t Q t b ) 2 0.5468 · ( Q t Q t b ) + 0.5314
P t P t b = 0.3092 · ( Q t Q t b ) 3 + 2.1472 · ( Q t Q t b ) 2 0.8865 · ( Q t Q t b ) + 0.0452
where H (m), P (W), and Q (m3/s) are head, power, and flow rate, respectively. Subscripts t and b are related to turbine and best efficiency point (BEF).
Following, among others, Derakhshan and Nourbakhsh [15,16] PATs parameters are related to the specific rotational speed per second (rps).
In the present case of study, described in the next paragraph, a pipeline system is investigate, thus justifying the use of 1D model (MOC method and PAT curve module) to predict the energy recovery in urban water distributions. The model is developed thus to work even for flow rate or the pressure conditions which are not compatible with the energy production by means of PATs. In these cases the PATs are by-passed and PRVs are simulated, according to the scheme shown in Figure 1, where turbines are coupled to valves [23].

3. The Case Study

The proposed numerical model has been applied to a small town close to Palermo city (Sicily), called Misilmeri, designed to supply about 22,000 inhabitants (11,300 users). The network is made of HDPE and cast iron pipes whose diameters range between 80 and 300 mm. Two main pipelines connected to two water reservoirs feed the network. The first tank, called Castle, is located at 190 m referred to the mean sea level (MSL) and has a volume of about 500 m3. The second reservoir, known as Cave, is located at 155 m MSL, having a total water volume of about 1,000 m3.
In Figure 2a, schematic representation of the water network is depicted. As shown, the pipeline system can be subdivided into two sub-network, supplied by the two water tanks. 70 pipes and 57 nodes compose the network under investigation. In Appendix A (Table A1 and Table A2), details on the distribution network (diameter, pipe length, water supplied, etc.) are reported. In Appendix A it is also reported the value of the roughness, clearly a key parameter, even though the calibration process (not shown here) pointed out that all the pipes fall into a hydraulically smooth regime, with values of equivalent sand grain roughness ks [34] in the range: 0.001 mm < ks < 0.005 mm. For this reason, the roughness ks was set equal to the average value (ks = 0.003 mm).
The water distribution network configuration is characterized by significant differences between the geodetic quote of water tanks and the users, suggesting high levels of energy recovery. The network orography thus seems to have an excellent configuration in order to test the application of micro energy recovery, introducing PATs in the network pipes.
One of the main problems in PATs positioning is to find the optimal installation point, thus to achieve both maximum energy production and desired water supply. Due to the small number of users, in the present case the choice of the optimal installation point has been carried out following the hydraulic regulation of the network. In small WDNs, the hydraulic regulation can be easily applied, achieving high performance levels, as demonstrated by De Marchis and Freni [28].
Taking advantage of the high variation of the geodetic elevation between the water tanks and the network, the main objective of the present analysis is to recover energy, in terms of water head, from water distribution networks.
At the moment, in WDNs the energy is dissipated through float valves. As specified in the following, the cost of electrically regulated valves is similar to the cost of a pump working in turbine mode, with the fundamental difference that PATs have the capability of producing small amounts of renewable energy.
Due to the specific case of study, three different scenarios have been explored. In the first PAT installation scenario (hereafter referred to TC1), the PAT has been installed in the pipe 23 having a DN equal to 200 mm and connecting the Cave tank with the WDN. The second scenario (hereafter referred to TC2) analyzed the case of a PAT installed in the connection pipe, number 01, between the Castle tank and the network, having a diameter of 300 mm. In Table 1 some details on the BEPs of the scenarios, used in Equations (9) and (10) of the PAT model, are reported.
Finally, a third scenario (hereafter referred to TC3) has been simulated considering the simultaneous installation of both the turbines in the main pipes. The analyzed network, as briefly described above, is characterized by the presence of private tanks that strongly modify the network behavior.
The local reservoirs, installed by the users to cover the water scarcity condition periods, can affect the energy production and the efficiency of the PAT installation. In this framework, the proposed dynamic numerical model was applied to investigate on the effect of the user water tanks in the energy recovery from the WDS.
In the following, N- will indicate scenarios without the private tanks, whereas with the capital letter T- will specify the cases where user’s tanks are considered.
In light of the year to year economic analysis, in the present case a single demand condition was simulated (see Appendix A for details), representative of an average condition of water supply. Even though the demand varies throughout a single day as well as throughout the seasons, the aims of the present research is to give indication about the energy recovery during several years, thus the use of an averaged condition of water demand is clearly justified. A daily demand pattern is request for diurnal analysis of energy recovery.
Considering that average demands are used and a year-to-year analysis is performed, the use of complex mathematical model able to simulate the transient condition could be not necessary. Nevertheless, the presence of private tanks could create small changes in water distribution networks. De Marchis et al. [25], in fact, demonstrated that small water hammer events occur in WDN due to the opening and closing of the ball valves supplying the private tanks. Even though, in the proposed analysis a steady state version of the mathematical model is applied, the presence of user’s tanks suggest the use of a model, based on the MOC method, able to take into account for these small dynamic phenomenon, interacting with the PAT module.

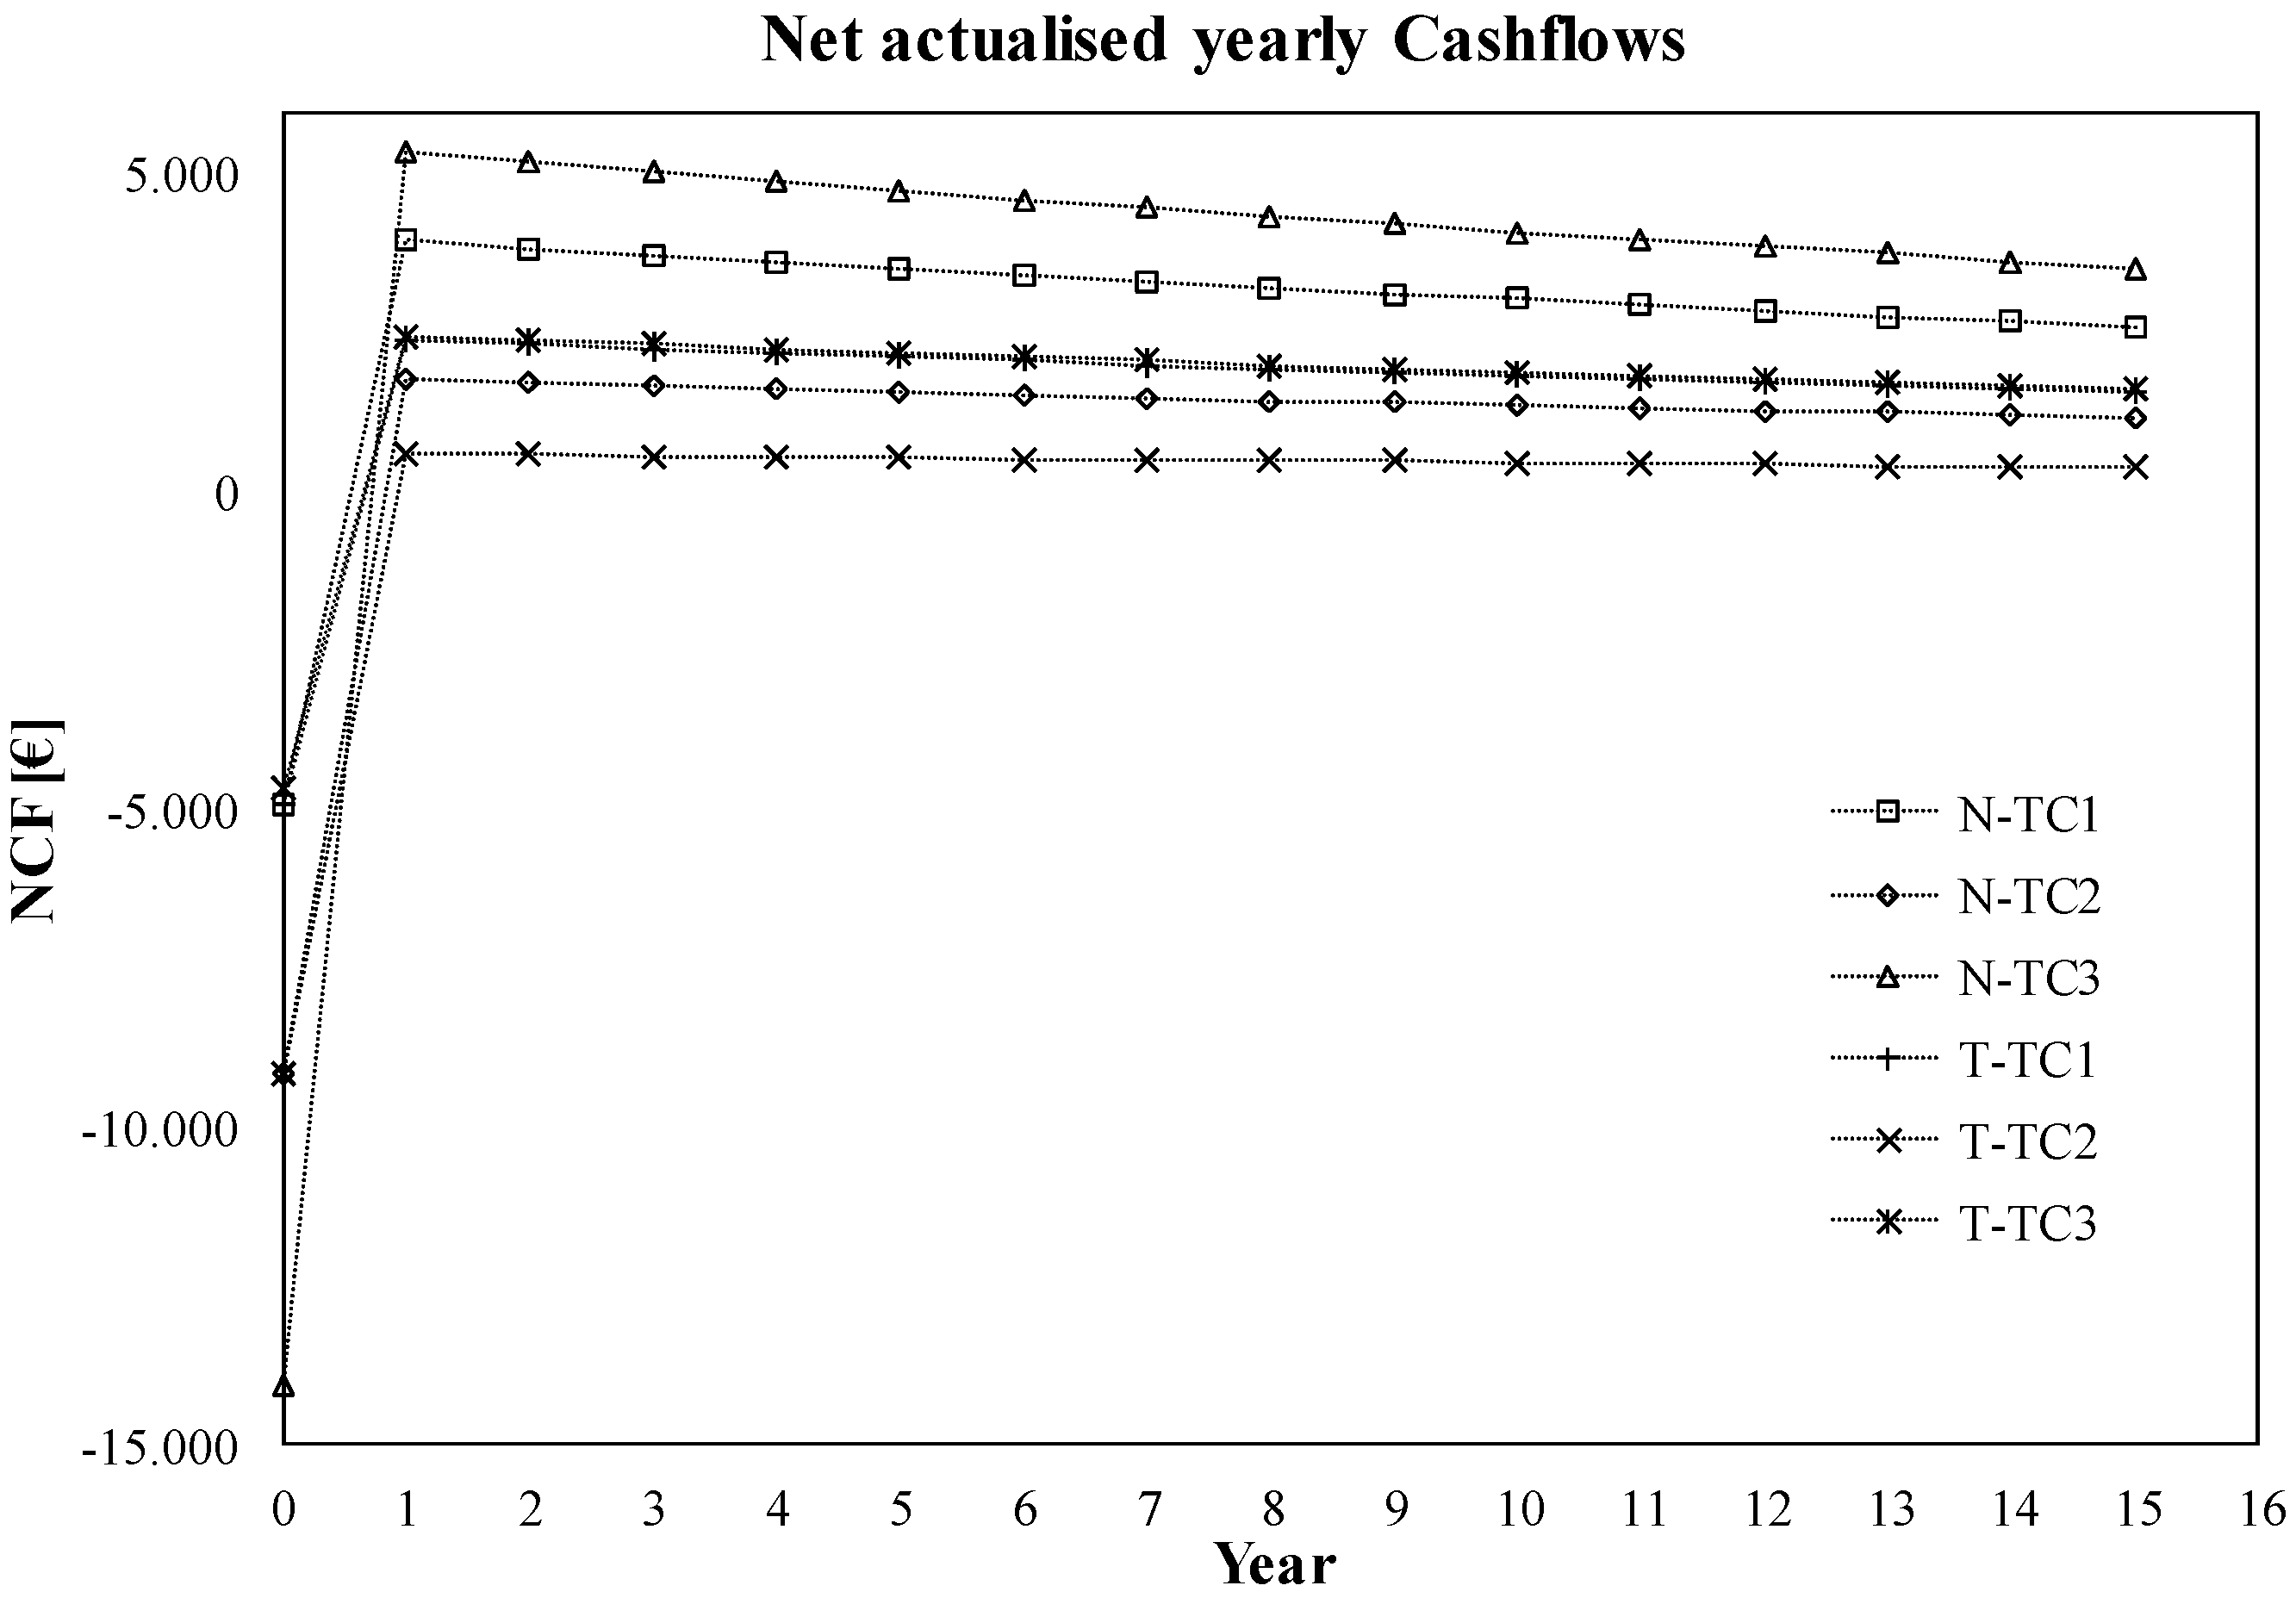
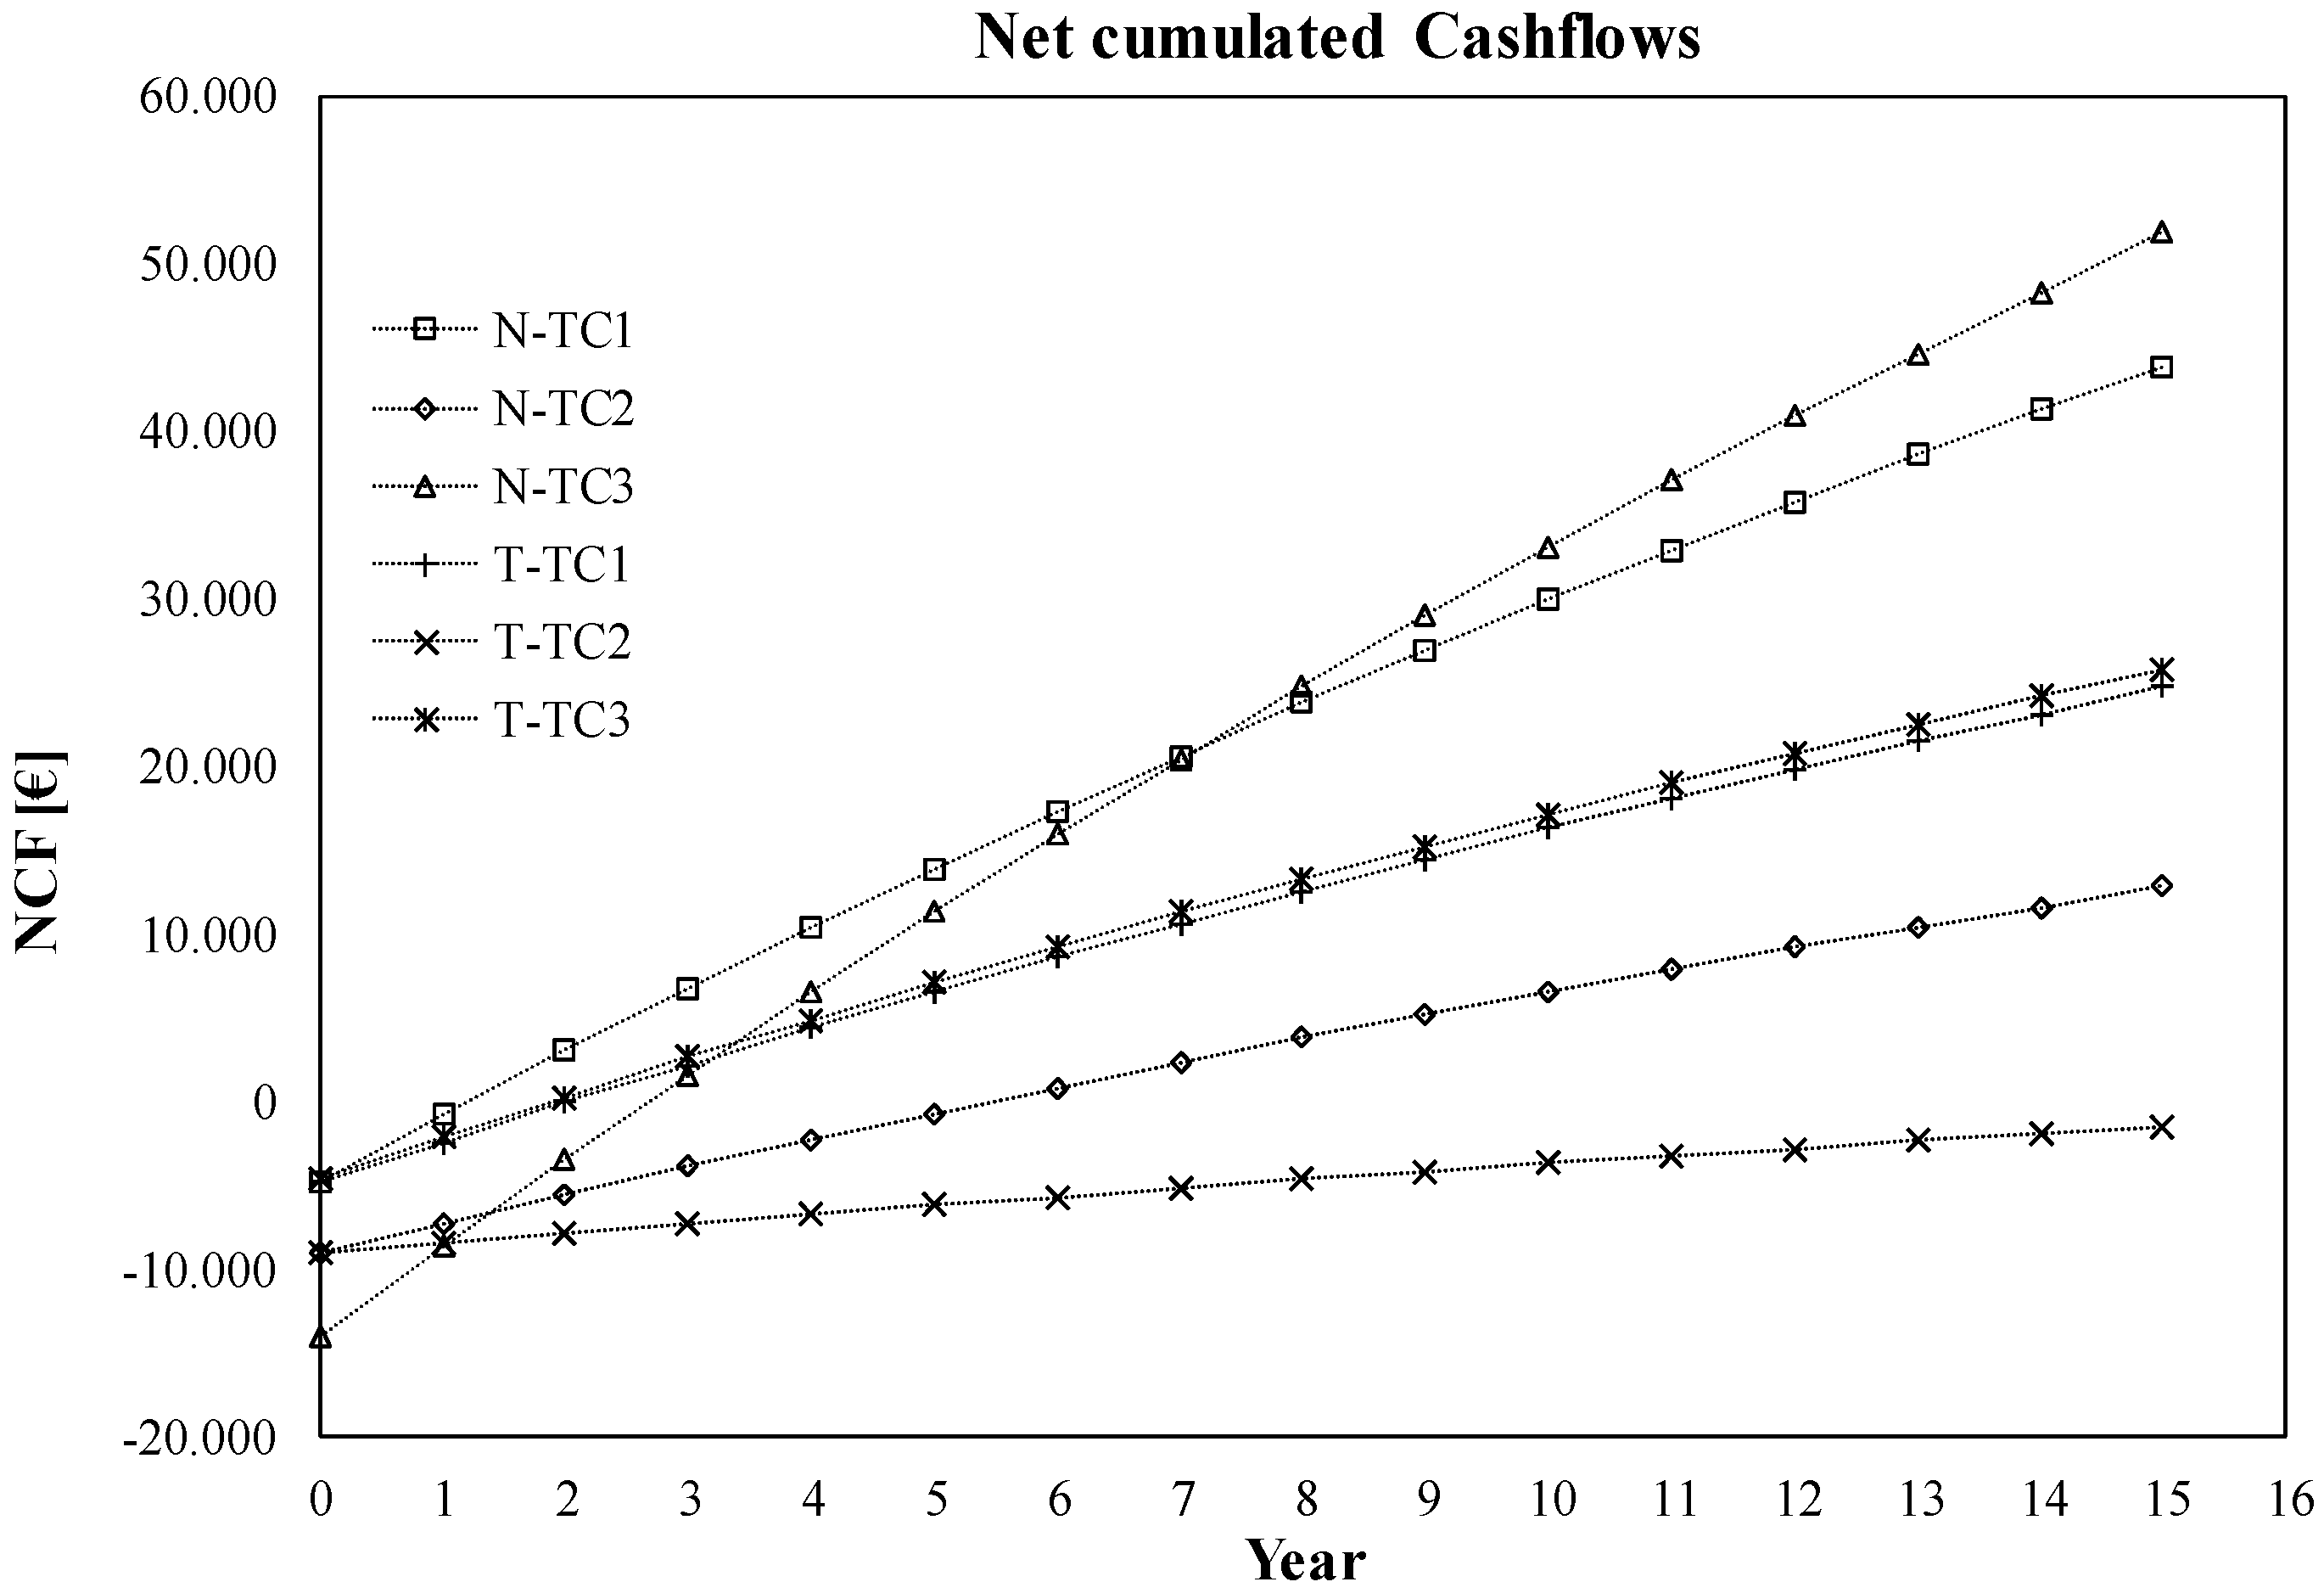
4. Economic Analysis

The results of a generalized model to simulate both WDN behavior and power production are discussed with the aim of analyzing the energy recovery in water network of small towns. The analysis is based on the average daily energy production (ADEP (kWh/day)) obtained by integrating PAT power profile along 24 h, through the equation:
A D E P = 1 3600 · γ 1000 T q · η t · H t · d t
where T = 86,400 s, η t   is the PAT efficiency, γ is the specific weight of water, q is the flow rate through the supply pipe, and H t is the head drop due to the PAT, calculated according to equations of the characteristic curves achieved by Derakhshan and Nourbakhsh [15] (Equations (9) and (10)). Average yearly energy production (AYEP (kWh/year)) is calculated assuming that ADEP is generated daily, also in consideration that the network supplies a mainly resident population and that an averaged demand pattern was considered as input for the hydraulic model. In Table 2 details on the installed power and related costs are reported.
Future NCF are actualized to present time by applying a discount rate calculated as the weighted average cost of capital (WACC) of a potential investor.
In the present case, the investor would be a public utility company so that WACC is effectively equal to the current bank interest rate. Here, coherently with the period and the Italian National Bank, it is assumed to be 3%.
The Net Present Value (NPV) is defined by the equation:
N P V = j = 1 N ( N C F ) j + I 0 ( 1 + i ) j
where the (NCF)j is the cash flow at year j related to the conditions under analysis, I0 is the initial capital investment which is assumed to financially occur all in year 0, and i is the WACC.
The PbT and IRR are respectively the time t and the interest rate i at which the following equation is true:
N P V = j = 1 N ( N C F ) j + I 0 ( 1 + i ) j = 0
whereas the PI is given by Equation (14):
P I = N P V I 0
Finally, the ROI at year j, is defined as:
R O I j = N C F I 0
The economic analysis is based on the use of the MOC model to solve the equation of water distribution networks, presented above. We analyzed two different scenarios related to two different operational condition of the network. In the first one, private tanks are simulated in the hydrodynamic model whereas, in the second, the users are directly connected with the WDN and the presence of private reservoirs is neglected.
The values obtained for NPV, PI, IRR, and ROI are reported on Table 3 calculated assuming the unit energy revenue, equal to 0.22 €/kWh (the current feed in tariff).
Table 3 reports the principal economic indicators for investments both in case of no-tanks (N-) and with tanks (T-). Results show that in case of No tanks, Scenario 1 offers the best option in terms of PbT and IRR, whilst, Scenario 3 offers a better option with respect to NPV.
However, among the No-Tank cases, Scenario 1 is to be considered the preferred one due to a favorable combination between low investment and high NPV. Despite the fact that NPV is higher in Scenario 3, the lower investment of Scenario 1, implies a significant lower risk and significant lower yearly working capital (operation and maintenance expenses).
Among the cases with tanks installed, Scenarios 1 and 3 offer largely similar returns both in terms of NPV and other indicators.
Figure 3 and Figure 4 show results in graphic form for both the No tank and Tank cases.
Figure 4 shows, in particular, how the N-TC3 case becomes more attractive than N-TC1 case only after the seventh year of operation, at which, the cumulated actualized cash flows becomes higher than the N-TC1 case. In addition, Figure 3 shows that the Cases T-TC1 and T-TC3 are very similar in terms of cumulated cash flow, throughout all the period and both considerably more attractive than T-TC2.
The proposed model can be considered an innovative tool, able to guide the water utilities to the optimal positioning of hydraulic machines for the energy saving in WDN. Similarly to the analysis of De Marchis and Freni [28], all the simulations were carried out ensuring the same level of user satisfaction in terms of water supply.

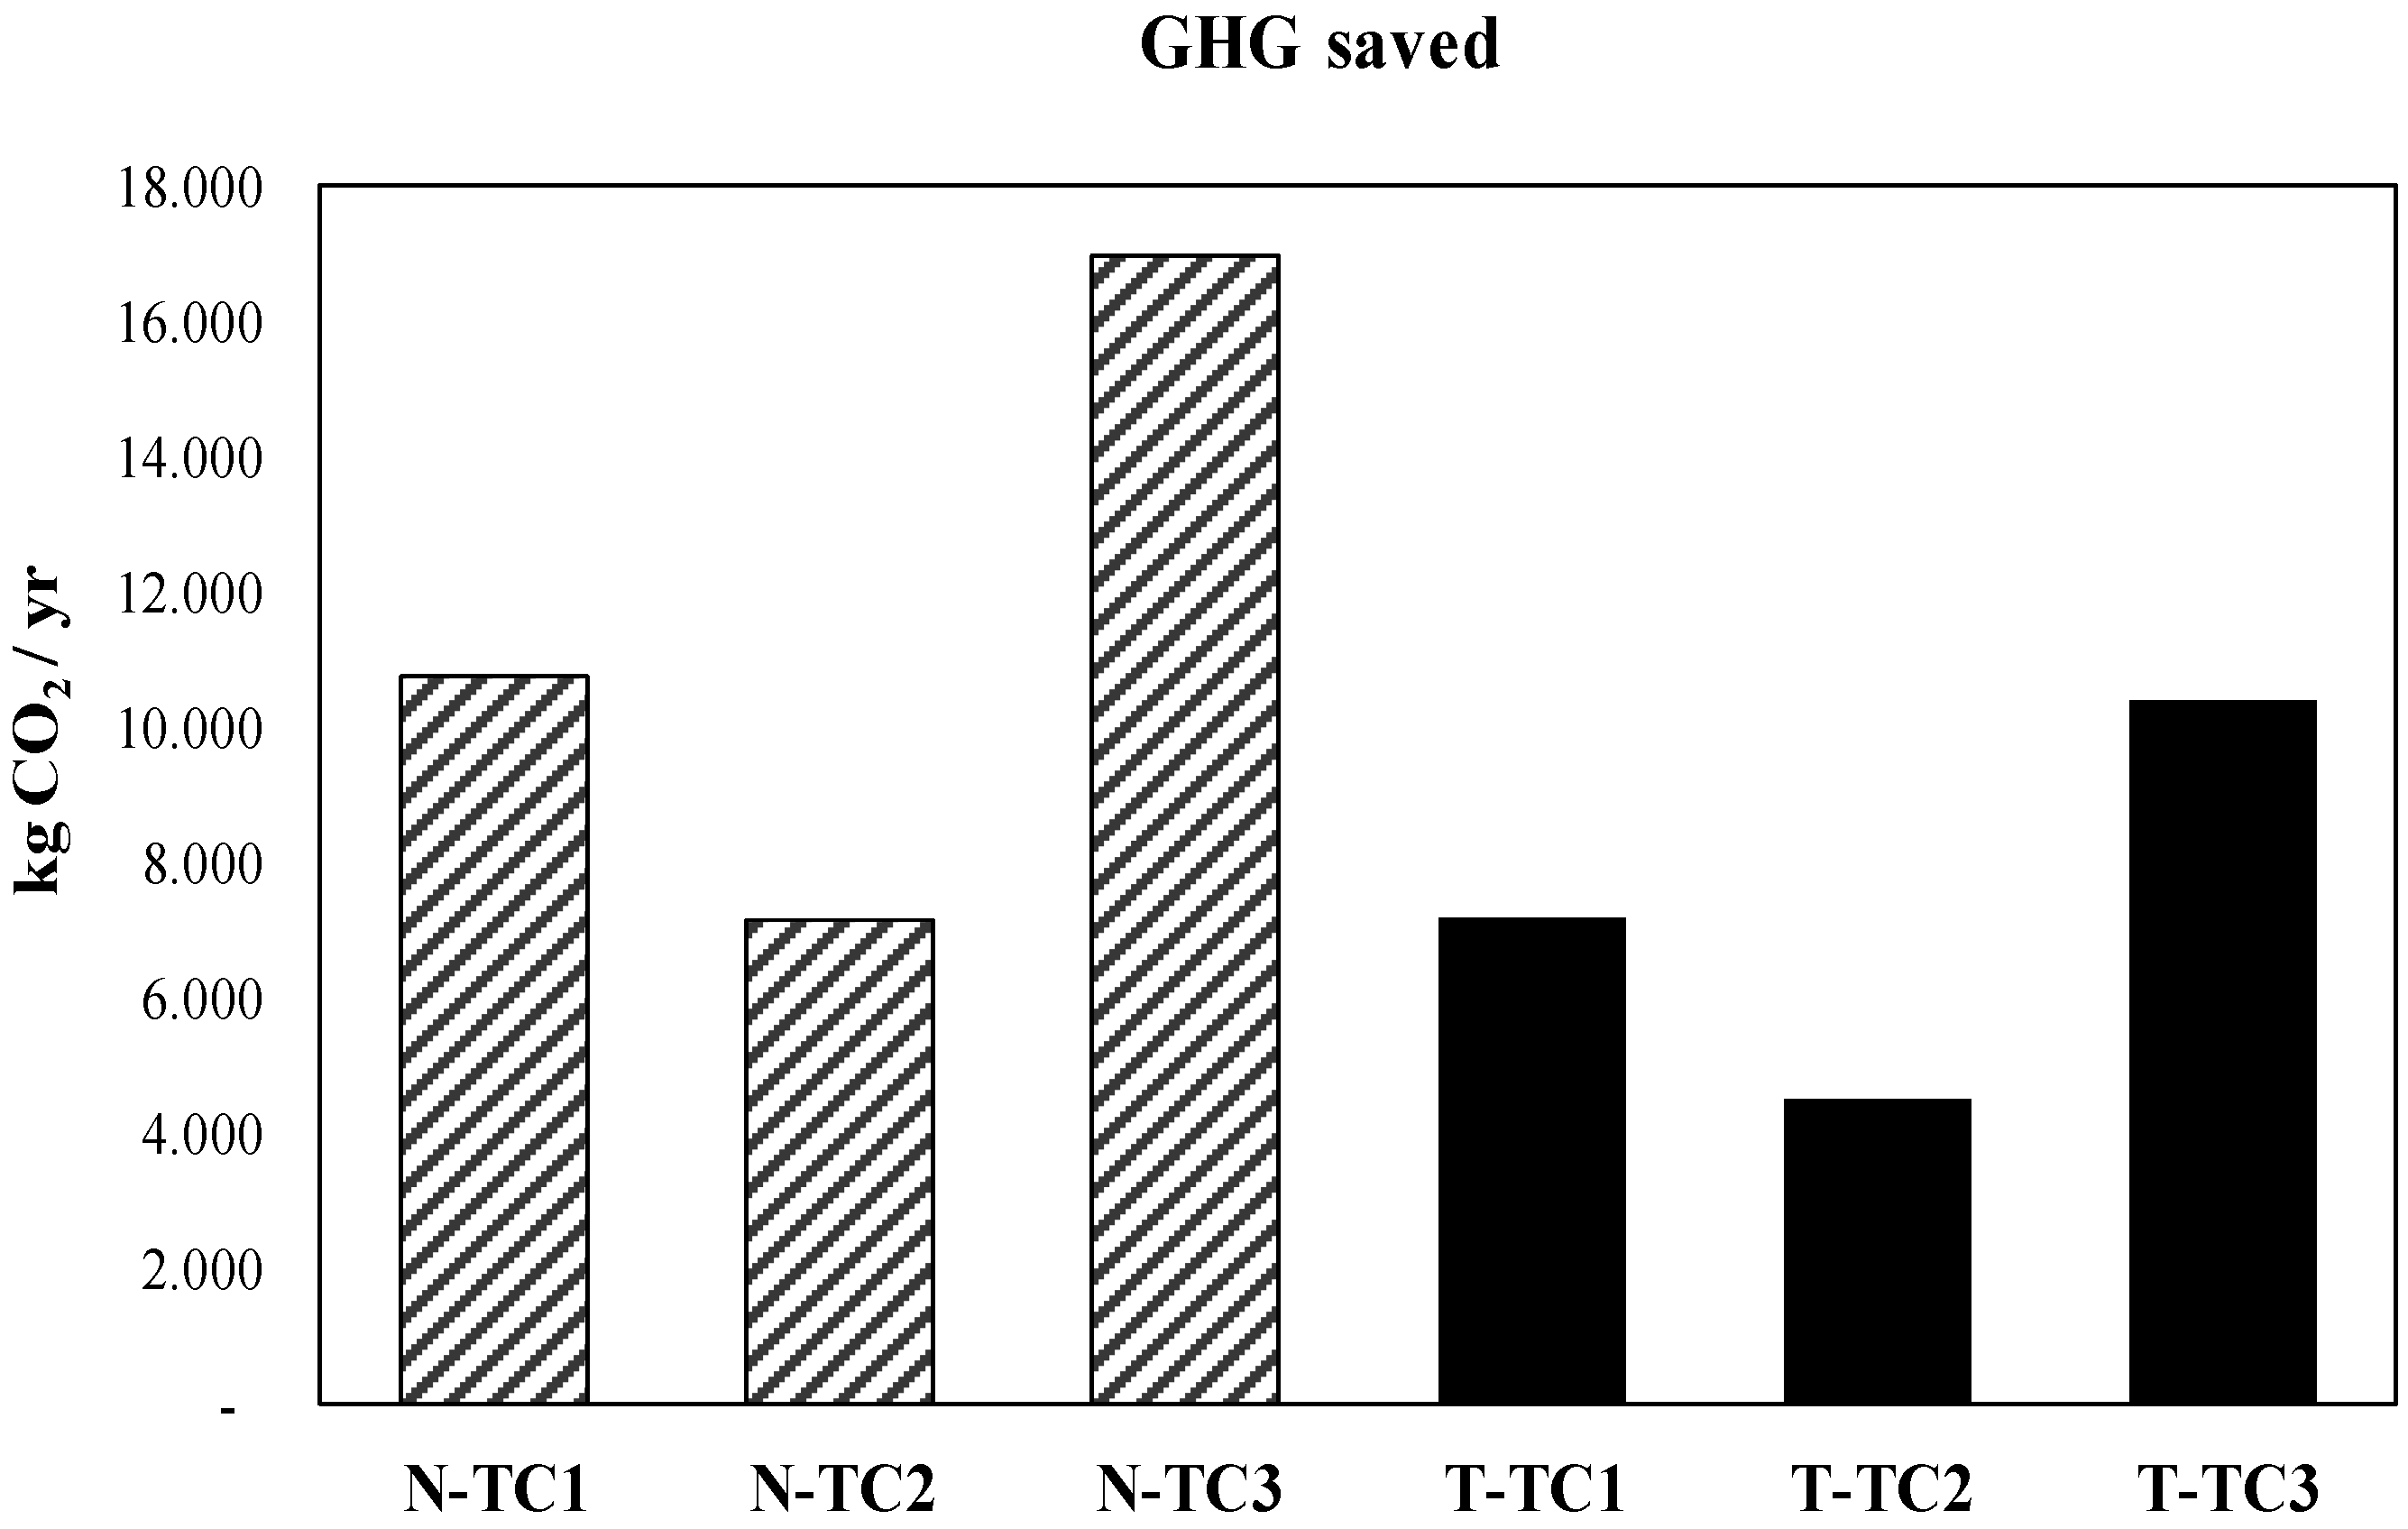
5. Environmental Analysis

In addition to the economic indicators, the installation of PATs implies a significant savings of greenhouse gas (GHG) emissions.
According to the National Energy Authority, the current national energy mix entails a consumption of 0.49 kg equivalents of CO2 per each kWh produced [35,36,37,38]. The renewable energy produced yearly by PATs in each of the scenarios directly translates into savings of energy which would otherwise be produced by traditional sources, thus in a direct saving of CO2 emission. Figure 5 shows the GHG savings for all the scenarios. The no-tank scenarios induce higher CO2 saving: N-TC1 and N-TC3 are the most beneficial.
If we now couple the economic results described above with the benefits induced by savings of GHG, we may conclude that N-TC3 is the best scenario. In general terms, should the No-Tank case apply, TC1 is the preferred option from the economic point of view, and TC3 becomes the preferred one if we consider also the environmental benefits. Should instead the Tank case apply, TC3 proves the best option both in economic and environmental terms.
Another environmental consideration worthy of attention is leak reduction. It is known that even though several efforts have been made to reduce hydraulic leakages in WDN, almost all the networks are characterized by water losses. The leakages are strictly connected with the pressure in the networks (see De Marchis et al. [39]) thus the use of PATs, able to produce renewable energy reducing the pressure, represent a double environmental challenge, worthy of extensive future investigations.

6. Conclusions

In the proposed study the capability of recover energy in small water distribution network is explored. Basically, a mathematical model was applied to investigate the installation of hydraulic machines known as PATs in small districts of WDNs. The economic and environmental analysis was performed including, in the hydraulic simulation, the presence of private tanks, installed by the users. This way, the results can be considered representative of almost all the networks of the Mediterranean countries, where the practice to use small single reservoirs is well established.
The analysis showed that the use of PATs can be attractive in economic and energy recovery terms, considering the lower capital cost, when compared to traditional turbines. Nevertheless, the PAT installation point affects energy saving. The computed compound Payback Time achieved values of about 2 years or 12 years as a function of the PAT position, clearly showing that, in some cases, the investment is economically unfeasible.
The proposed model can be thus considered a tool, for the water utilities, to maximize the energy saving in WDN. It is useful to specify that all the simulations were carried out ensuring the same level of user satisfaction in terms of water supply.
Overall, the results confirmed that private tanks cause a high decrease of energy production. Considering that, in Mediterranean countries, water utilities have no control on these tanks, to give a more realistic analysis on the performance of energy recovery in WDS, private tanks must be considered.
Finally, the model indicates the possibility of a significant reduction of atmosphere emission of CO2 equivalent greenhouse gases, thus confirming the utility to apply distributed micro energy generators along the several and several WDNs.

Acknowledgments

The authors would like to thank Vincenzo Sucato for the data of the water distribution network of Misilmeri (PA), collected in his degree thesis.

Author Contributions

All the authors contributed to the work in this manuscript. Mauro De Marchis and Barbara Milici mainly contributed to the numerical simulations of the water distribution network model as well as the Pump as Turbine model. Roberto Volpe and Antonio Messineo mainly focused their attention on the economic and environmental analysis. All the authors analyzed the obtained data and contributed to the figure and table generation. All authors revised and approved the manuscript.

Conflicts of Interest

The authors declare no conflict of interest.

Appendix A

In Appendix A are reported the data of the network used.
Table A1. Misilmeri network pipe data.
Pipe No.Start NodeEnd NodeDiameter D (mm)Length Li (m)Roughnees ks (mm)Discharge Q (l/s)
1123002000.00336.33
2231501100.00311.37
3341501700.0037.64
44580320.0030.97
565801800.0030.88
63680320.0032.73
772150900.00318.96
8871501100.0039.41
9981503000.0038.85
10109150440.0038.29
111011801000.0032.69
12111280200.0032.69
131213801100.0031.51
141314801400.0030.1
151514801100.0034.55
16157150440.0039.03
171516801840.0033.23
181716801100.0030.43
191316801100.0031.79
20171280800.0031.22
21101780900.0032.88
2218101501200.0031.93
2320212001000.00345.79
2421222002200.00336.25
2522232001000.00336.25
262324200800.00336.25
272425200600.00336.25
2825192001700.00327.98
2919181501020.0038.38
302526100340.0038.27
312726100580.0034.84
3228271001280.0032.15
332928100510.0030.8
342930100640.0030.11
353031100300.0031.11
36313280760.0031.11
37323380850.0030.27
38333480700.0030.09
39343580420.0030.3
403619200380.00319.6
41363780880.0030.48
42372680840.0032.16
43322780510.0031.29
44373380840.0031.06
453538150250.00317.59
463839150820.00317.59
474039100600.0036.83
484140100200.0034.87
4942411001540.0034.87
504342100900.0032.39
5143441001700.0031.55
524544100740.0033.27
534546100560.0037.38
544639100740.0037.38
5545471001120.0032.81
564748100540.0032.81
574849100740.0031.06
5844491001700.0031.87
594950100240.0032.93
6050511001280.0031.26
615251100920.0030.36
6253521001060.0031.63
635053100940.0030.96
645453100860.0035.41
6554431001950.0032.63
665455110500.0039.54
6755561101140.0039.54
6856571102550.0039.54
6957211101100.0039.54
703536200240.00319.55
Table A2. Misilmeri network node data.
Node IDNode Elevation z (m)Water Head H (m)Demand q (l/s)
11901900
2141.5189.751.4
3143189.231
4145.4188.874.32
5150.5188.840.2
6147188.990.2
7137.2188.580.52
8135.25188.220.56
9126.1187.360.56
10128.45187.254.65
11134.8186.490
12134.9186.342.4
13148186.073.2
14158.3186.074.65
15138.5188.451.25
16137186.441.87
17132186.471.23
18132.5187.276.45
19135187.530
201951950
21186193.3545.79
22181191.070
23154.5190.030
24156189.20
25156188.580
26156187.851.27
27154187.421.39
28172187.231.35
29166187.210.91
30158187.221
31154187.230
32150187.330.46
33143.1187.330.87
34139.5187.340.21
35135187.341.67
36135187.410.53
37146187.440.62
38134187.060
39131186.143.38
40136185.251.96
41136185.10
42156183.942.48
43159183.783.47
44134.5183.652.95
45129.5183.91.3
46130184.860
47132.5183.620
48133.5183.481.75
49143183.450
50143183.392.63
51142.5183.321.62
52149183.331.27
53150183.422.82
54164184.211.5
55165185.080
56168187.050
57183191.450

References

  1. Barry, J.A. WATERGY: Energy and Water Efficiency in Municipal Water Supply and Wastewater Treatment Cost-Effective Savings of Water and Energy; The Alliance to Save Energy: Washington, DC, USA, 2007. [Google Scholar]
  2. Tucciarelli, T.; Criminisi, A.; Termini, D. Leak analysis in pipeline systems by means of optimal valve regulation. J. Hydraul. Eng. 1999, 125, 277–285. [Google Scholar] [CrossRef]
  3. Walski, T.; Bezts, W.; Posluzny, E.; Weir, M.; Withman, B. Modeling leakage reduction through pressure control. J. Am. Water Works Assoc. 2006, 98, 147–155. [Google Scholar]
  4. Araujo, L.; Ramos, H.; Coelho, S. Pressure control for leakage minimisation in water distribution systems management. Water Resour. Manag. 2006, 20, 133–149. [Google Scholar] [CrossRef]
  5. Nazif, S.; Karamouz, M.; Tabesh, M.; Moridi, A. Pressure management model for urban water distribution networks. Water Res. Manag. 2010, 24, 437–458. [Google Scholar] [CrossRef]
  6. Chapallaz, J.; Eichenberger, P.; Fischer, G. Manual on Pumps Used as Turbines; Friedr. Vieweg & Sohn Verlagsgesellschaft mbH: Braunschweig, Germany, 1992. [Google Scholar]
  7. Ramos, H.; Borga, A. Pumps as turbines: An unconventional solution to energy production. Urban Water 1999, 1, 261–263. [Google Scholar] [CrossRef]
  8. Nautiyal, H.; Kumar, V.A.; Yadav, S. Experimental investigation of centrifugal pump working as turbine for small hydropower systems. Energy Sci. Technol. 2011, 1, 79–86. [Google Scholar]
  9. Giugni, M.; Fontana, N.; Portolano, D. Energy saving policy in water distribution networks. In Proceedings of the International Conference on Renewable Energies and Power Quality (ICREPQ’09), Valencia, Spain, 15–17 April 2009.
  10. Milici, B.; De Marchis, M. Statistics of inertial particle deviation from fluid particle trajectories in horizontal rough wall turbulent channel flow. Int. J. Heat Fluid Flow 2016, 60, 1–11. [Google Scholar] [CrossRef]
  11. Carravetta, A.; del Giudice, G.; Fecarotta, O.; Ramos, H. PAT design strategy for energy recovery in water distribution networks by electrical regulation. Energies 2013, 6, 411–424. [Google Scholar] [CrossRef]
  12. Jain, S.V.; Patel, R.N. Investigations on pump running in turbine mode: A review of the state-of-the-art. Renew. Sustain. Energy Rev. 2014, 30, 841–868. [Google Scholar] [CrossRef]
  13. Nautiyal, H.; Kumar, V.A. Reverse running pumps analytical, experimental and computational study: A review. Renew. Sustain. Energy Rev. 2010, 14, 2059–2067. [Google Scholar] [CrossRef]
  14. Williams, A.A. Pump as turbines for low cost microhydropower. Renew. Energy 1999, 9, 1227–1234. [Google Scholar] [CrossRef]
  15. Derakhshan, S.; Nourbakhsh, A. Experimental study of characteristic curves of centrifugal pumps working as turbines in different specific speeds. Exp. Therm. Fluid Sci. 2008, 32, 800–807. [Google Scholar] [CrossRef]
  16. Derakhshan, S.; Nourbakhsh, A. Theoretical, numerical and experimental investigation of centrifugal pumps in reverse operation. Exp. Therm. Fluid Sci. 2008, 32, 1620–1627. [Google Scholar] [CrossRef]
  17. Singh, P.; Nestmann, F. Internal hydraulic analysis of impeller rounding in centrifugal pumps as turbines. Exp. Therm. Fluid Sci. 2011, 35, 121–134. [Google Scholar] [CrossRef]
  18. Yang, S.S.; Derakhshan, S.; Kong, F.Y. Theoretical, numerical and experimental prediction of pump as turbine performance. Renew. Energy 2012, 48, 507–513. [Google Scholar] [CrossRef]
  19. Carravetta, A.; del Giudice, G.; Fecarotta, O.; Ramos, H. Energy production in water distribution networks: A PAT design strategy. Water Resour. Manag. 2012, 26, 3947–3959. [Google Scholar] [CrossRef]
  20. Arriaga, M. Pump as turbine—A pico-hydro alternative in Lao People’s Democratic Republic. Renew. Energy 2010, 35, 1109–1115. [Google Scholar] [CrossRef]
  21. Carravetta, A.; Fecarotta, O.; Sinagra, M.; Tucciarelli, T. Cost-benefit analysis for hydropower production in water distribution networks by pump as turbine. J. Water Resour. Plan. Manag. 2014, 140. [Google Scholar] [CrossRef]
  22. Puleo, V.; Fontanazza, C.M.; Notaro, V.; De Marchis, M.; Freni, G.; la Loggia, G. Pumps as turbines (PATs) in water distribution networks affected by intermittent service. J. Hydroinform. 2014, 16, 259–271. [Google Scholar] [CrossRef]
  23. Fontana, N.; Giugni, G.; Portolano, D. Losses reduction and energy production in water-distribution networks. J. Water Resour. Plan. Manag. 2012, 138, 237–244. [Google Scholar] [CrossRef]
  24. Motwani, K.H.; Jain, S.V.; Patel, R.N. Cost analysis of pump as turbine for pico hydropower plants—A case study. Proc. Eng. 2013, 51, 721–726. [Google Scholar] [CrossRef]
  25. De Marchis, M.; Fontanazza, C.M.; Freni, G.; la Loggia, G.; Napoli, E.; Notaro, V. Analysis of the impact of intermittent distribution by modelling the network-filling process. J. Hydroinform. 2011, 13, 358–373. [Google Scholar] [CrossRef]
  26. Freni, G.; De Marchis, M.; Napoli, E. Implementation of pressure reduction valves in a dynamic water network model. J. Hydroinform. 2014, 16, 207–217. [Google Scholar] [CrossRef] [Green Version]
  27. De Marchis, M.; Milici, B.; Freni, G. Pressure-discharge law of local tanks connected to a water distribution network: Experimental and mathematical results. Water 2015, 7, 4701–4723. [Google Scholar] [CrossRef]
  28. De Marchis, M.; Freni, G. Pump as turbine implementation in a dynamic numerical model: Cost analysis for energy recovery in water distribution network. J. Hydroinform. 2015, 17, 347–360. [Google Scholar] [CrossRef]
  29. De Marchis, M.; Milici, B.; Napoli, E. Numerical observations of turbulence structure modification in channel flow over 2D and 3D rough walls. Int. J. Heat Fluid Flow 2015, 56, 108–123. [Google Scholar] [CrossRef]
  30. De Marchis, M.; Milici, B.; Sardina, G.; Napoli, E. Interaction between turbulent structures and particles in roughened channel. Int. J. Multiph. Flow 2016, 78, 117–131. [Google Scholar] [CrossRef]
  31. Vítkovský, J.P.; Bergant, A.; Simpson, A.R.; Lambert, M.F. Systematic evaluation of one-dimensional unsteady friction models in simple pipelines. J. Hydraul. Eng. 2006, 132, 696–708. [Google Scholar] [CrossRef]
  32. De Marchis, M.; Fontanazza, C.M.; Freni, G.; la Loggia, G.; Napoli, E.; Notaro, V. A model of the filling process of an intermittent distribution network. Urban Water J. 2010, 7, 321–333. [Google Scholar] [CrossRef]
  33. Sammartano, V.; Morreale, G.; Sinagra, M.; Tucciarelli, T. Numerical and experimental investigation of a cross-flow water turbine. J. Hydraul. Res. 2016, 54, 321–331. [Google Scholar] [CrossRef] [Green Version]
  34. De Marchis, M. Large eddy simulations of roughened channel flows: Estimation of the energy losses using the slope of the roughness. Comput. Fluids 2016, 140, 148–157. [Google Scholar] [CrossRef]
  35. Marvuglia, A.; Messineo, A. Using recurrent artificial neural networks to forecast household electricity consumption. Energy Procedia 2012, 14, 45–55. [Google Scholar] [CrossRef]
  36. Volpe, R.; Messineo, A.; Millan, M.; Volpe, M.; Kandiyoti, R. Assessment of olive wastes as energy source: Pyrolysis, torrefaction and the key role of H loss in thermal breakdown. Energy 2015, 82, 119–127. [Google Scholar] [CrossRef]
  37. Volpe, M.; Volpe, R.; Panno, D.; Messineo, A. Upgrade of citrus waste as a biofuel via slow pyrolysis. J. Anal. Appl. Pyrolysis 2015, 115, 66–76. [Google Scholar] [CrossRef]
  38. Alaimo, A.; Esposito, A.; Messineo, A.; Orlando, C.; Tumino, D. 3D CFD analysis of vertical axis wind turbine. Energies 2015, 8, 3013–3033. [Google Scholar] [CrossRef]
  39. De Marchis, M.; Fontanazza, C.; Freni, G.; Notaro, V.; Puleo, V. Experimental evidence of leaks in elastic pipes. Water Resour. Manag. 2016, 30, 2005–2019. [Google Scholar] [CrossRef]
Figure 1. Installation scheme of a coupled system of pumps as turbine (PAT) and pressure reduction valve (PRV).
Energies 09 00877 g001
Figure 2. Case study network in Misilmeri (PA). Boxe: pipe number; circle: node number. Colors are representative of pipe diameters. Red line: DN 80 mm; blue line: DN 100 mm; dot dashed gray line: DN 110 mm; dot-dot dashed orange line: DN 150 mm; dashed sky-blue line: DN 200 mm; bold gray line: DN 300 mm.
Energies 09 00877 g002
Figure 3. Net actualized cash flows generated in all scenarios.
Energies 09 00877 g003
Figure 4. Actualized cumulated cash flows generated by all scenarios.
Energies 09 00877 g004
Figure 5. Amount of CO2 saved (kg) yearly in all scenarios analyzed.
Energies 09 00877 g005
Table 1. PATs characteristic in turbine mode.
ScenarioDimp (mm)QBEP (m3/s)HBEP (m)PBEP (kW)
TC12000.0299.001600
TC23000.01515.003.00
Table 2. Economic feasibility of PATs installation in a WDN: Production and Cost analysis for cases with no tank (N-) and with tank (T-). EGE: energy generation equipment; CWC: civil work cost; and MC: maintain cost.
ScenarioPinst (kW)ADEP (kWh/Day)AYEP (kWh/Year)EGE (€)CWC (€)MC (€/Year)
N-TC11.6060.0021,900.003800.001100.00750.00
N-TC23.0040.0014,600.007100.002100.001400.00
N-TC34.6095.0034,700.0010,800.003200.002100.00
T-TC11.6040.0014,600.003800.001100.00750.00
T-TC23.0025.009100.007100.002100.001400.00
T-TC34.6058.0021,200.0010,800.003200.002100.00
Table 3. Economic indicators for investments regarding cases with no tank (N-) and with tank (T-).
IndicatorN-TC1N-TC2N-TC3T-TC1T-TC2T-TC3
I0 (€)4900920014,000490092004600
NPV (€)43,90012,70051,80024,700−160025,700
PI (%)8962601058504−34526
PbT (Years)1.245.502.702.07>121.91
ROI (%)83.020.039.051.07.055.0
IRR (%)83.018.039.050.50.555.0

