
Quantification of the Lifecycle Greenhouse Gas Emissions from Nuclear Power Generation Systems


Abstract
:1. Introduction
2. Methodology
- Boiling water reactor (BWR): BWRs are a single-loop system that makes steam in the primary circuit itself above the reactor core. BWRs generally operate using uranium dioxide (UO2) as the fuel and water (H2O) as the moderator as well as the coolant. The reactor core in a BWR comprises of up to 800 fuel assemblies or more. The fuel assemblies of the BWR are comprised of a 7 × 7 to 10 × 10 square array of fuel pins, surrounded by a metal fuel channel that prevent the movement of steam-water mixture between the fuel assemblies, thereby ensuring adequate cooling of the fuel assemblies. The feedwater (pumped into the steel reactor vessel containing the core) is converted to steam as a result of the heat generated by fission chain reactions occurring within the fuel pins. The reactivity control is implemented through a combination of neutron-controlling fuel rods (made of boron carbide-filled pins) and coolant flow adjustment. The steam-water mixture that leaves from the top of the core enters the stage of moisture separation where the water droplets are removed before the steam is allowed to enter the steam line. The steam line then directs the steam to turn the turbine generator to produce electricity.
- Pressurized water reactor (PWR): PWRs have water in a primary cooling/heat transfer circuit and generate steam in a secondary circuit. Like BWRs, PWRs also operate with UO2 as the fuel and H2O as the moderator as well as the coolant. The reactor core in a large PWR comprises of 150 to 200 fuel assemblies, or more. The fuel assemblies of the PWR are comprised of a 14 × 14 to 17 × 17 square array of fuel pins or up to 331 hexagonal fuel pins. In the PWRs, there is no metal fuel channel as the single-phase primary fluid (water) operated better than the BWR’s boiling coolant. The water in the primary loop is maintained as a liquid under high pressure and enters the steel reactor vessel containing the core through inlet nozzles. The water flows downward along the inner vessel wall and flows up through the fuel assemblies gathering heat energy, and exits through the outlet nozzle as a liquid. The heat energy from the primary loop is extracted by the steam generators (secondary circuit) that convert the water into steam. The reactivity control is implemented through neutron-controlling fuel rods (made of boron carbide-filled pins) and soluble neutron poison boric acid. The steam-water mixture that leaves from the top of the secondary circuit enters the stages of moisture separation. The steam line then directs the steam to turn the turbine generator to produce electricity.
- Heavy-water-moderated reactor (HWR): HWRs are also a two-loop system like PWRs with the exception that heavy water (in primary loop) transfers the heat to water (in secondary loop) for generation of steam. The HWRs operate with UO2 as the fuel and heavy water/deuterium oxide (D2O) as the moderator as well as the coolant. The Canadian Deuterium-Uranium (CANDU) reactor is the signature representative of HWRs. The pressurized heavy water (PHW) CANDU also contains a two-loop system, like the PWRs, with the primary PHW loop transferring the heat to a loop of ordinary water for steam production. The primary fluid, i.e., the PHW is distributed among the pressure tubes that pass through a large Calandria vessel that contains a separate heavy water moderator. The coolant is collected in two separate loops. The fuel assemblies of the HWRs are comprised of uranium dioxide fuel pellets clad in zirconium. The reactivity control is accomplished through online fueling (a machine-based technique that enables changing the fuel of a nuclear reactor, while the reactor is critical) that is required to compensate for low reactivity inherent in natural uranium. The steam-water mixture that leaves from the top of the secondary circuit enters the stage of moisture separation for segregation of steam, which is passed in to the steam line to finally turn the turbine generator for producing electricity.
- Gas-cooled reactors (GCR): The initial version of GCRs used natural uranium as the fuel, graphite as the moderator, and natural-circulation air for cooling. Subsequent GCRs utilized graphite as the moderator in combination with natural or enriched uranium as the fuel, and carbon dioxide (CO2) or helium as the coolant. The Magnox reactor having a two loop system with CO2 as a primary coolant, gas to waste stream generators, and natural uranium as the fuel is representative of the GCRs. The development of CO2 gas-cooled reactors is inhibited by the coolant limitations such as excessive corrosion in piping and steam generators under high temperatures.
- Light-water-cooled graphite moderated reactor (LWGR)/pressure tube graphite reactor (PTGR): The LWGR/PTGR uses graphite as an array of blocks to act as a moderator in controlling the neutrons and comprises of a direct steam cycle like BWRs. Like the HWRs, the LWGR/PTGR reactors also have a complex pressure tube design with separate coolant and moderator in the core. LWGRs/PTGRs operate with UO2 as the fuel, graphite as the moderator, and H2O as the coolant. The soviet-era Reaktor Bolshoy Moshchnosti Kanalnyy (RBMK) is representative of the PTGR. There are approximately 1900 vertical pressure tubes that accommodate multiple fuel assemblies or control rods in a RBMK reactor. The pressure tubes in the RBMK reactor are surrounded by an array of long, square-shaped graphite blocks set side by side to resemble a cylinder shape that functions as a moderator. In the RBMK reactor, water is introduced from the bottom of the core and enters the pressure tubes. The water then boils due to the fission heat from the fuel pins. The steam is then drawn out for use in one of the two steam generators. The pressure tubes and the piping are enclosed within a steel reactor vessel. The fuel assemblies of the RBMK reactor include two sub-assemblies of 18 zirconium-clad fuel pins of enriched uranium. The reactivity control is accomplished through online fueling, as noted in the case of HWRs.
- Fast breeder reactor (FBR): FBRs work on the principle of breeding more new fuel than that is required for the neutron chain reaction. FBRs generally operate using UO2 or plutonium dioxide (PuO2) as the fuel, have no moderator, and use sodium (Na) as the coolant. The liquid metal fast breeder reactor (LMFBR) represents the FBR and has three loops (first two loops with Na, third loop with water) in the steam cycle. The intermediate loop isolates the first loop from coming in contact with the third loop. The primary loop Na becomes radioactive from neutron absorption and also picks up fission-product radionuclides. When this comes in contact with water, it can lead to precipitation as an exothermic reaction and radioactive contamination. The fuel for LMFBR comprises of mixed-oxide (MOX: PuO2-UO2) pellets that are loaded into thin stainless steel cladding tubes to form hexagonal array fuel assemblies. Additional depleted or natural uranium is used as a cover to the MOX core to optimize the breeding. The reactivity control is accomplished through the use of neutron-poison control rods.
3. Results and Discussion
3.1. Review of Nuclear LCA Studies
3.2. Statistical Evaluation of Nuclear LCA Studies
4. Conclusions
Acknowledgments
Author Contributions
Conflicts of Interest
References
- World Nuclear Association. Nuclear Power Reactors. Available online: http://www.world-nuclear.org/info/Nuclear-Fuel-Cycle/Power-Reactors/Nuclear-Power-Reactors/ (accessed on 26 January 2016).
- International Energy Statistics. Available online: http://www.eia.gov/cfapps/ipdbproject/iedindex3.cfm?tid=44&pid=44&aid=2&cid=ww,r1,&syid=2008&eyid=2012&unit=QBTU (accessed on 9 November 2015).
- United States Energy Information Administration. International Energy Outlook 2013. Available online: http://www.eia.gov/forecasts/ieo/pdf/0484(2013).pdf (accessed on 9 November 2015).
- Energy Technology Data Exchange World Energy Base (ETDEWEB). Meridian Corporation. Energy System Emissions and Materiel Requirements. Available online: https://www.etde.org/etdeweb/servlets/purl/860706-4YG3j9/860706.pdf (accessed on 14 June 2016).
- San Martin, R.L. Environmental Emissions from Energy Technology Systems: The Total Fuel Cycle. Available online: http://www.fischer-tropsch.org/DOE/DOE_reports/OSTI/OSTI_860643/OSTI%20860643.pdf (accessed on 14 June 2016).
- Yasukawa, S.; Tadokoro, Y.; Kajiyama, T. Lifecycle CO2 emission from nuclear power reactor and fuel cycle system. In Proceedings of the Expert Workshop on Life-Cycle Analysis of Energy Systems, Methods and Experience, Paris, France, 21–22 May 1992; pp. 151–160.
- Yasukawa, S.; Tadokoro, Y.; Sato, O.; Yamaguchi, M. Integration of Indirect CO2 Emissions from the Full Energy Chain. Available online: http://www.iaea.org/inis/collection/NCLCollectionStore/_Public/28/013/28013033.pdf (accessed on 14 June 2016).
- Uchiyama, Y. Lifecycle analysis of electricity generation and supply systems. In Electricity, Health and the Environment: Comparative Assessment in Support of Decision Making; International Atomic Energy Agency: Vienna, Austria, 1995; pp. 279–291. [Google Scholar]
- Dones, R.; Gantner, U.; Hirschberg, S.; Doka, G.; Knoepfel, I. Environmental Inventories for Future Electricity Supply Systems for Switzerland. Available online: http://www.iaea.org/inis/collection/NCLCollectionStore/_Public/27/025/27025674.pdf?r=1 (accessed on 14 June 2016).
- Andseta, S.; Thompson, M.J.; Jarrell, J.P.; Pendergast, D.R. CANDU reactors and greenhouse gas emissions. In Proceedings of the 11th Pacific Basin Nuclear Conference, Banff, AB, Canada, 3–7 May 1998.
- Hondo, H.; Uchiyama, Y.; Moriizumi, Y. Evaluation of Power Generation Technologies Based on Lifecycle CO2 Emissions—Reestimation Using the Latest Data and Effects of the Difference of Conditions; Report No. 99009; Central Research Institute of Electric Power Industry: Tokyo, Japan, 2000. [Google Scholar]
- Rashad, S.M.; Hammad, F.H. Nuclear power and the environment: Comparative assessment of environmental and health impacts of electricity generating systems. Appl. Energy 2000, 65, 211–229. [Google Scholar] [CrossRef]
- Voorspools, K.R.; Brouwers, E.A.; D’haeseleer, W.D. Energy content and indirect greenhouse gas emissions embedded in ‘emission-free’ plants: results from the low countries. Appl. Energy 2000, 67, 307–330. [Google Scholar] [CrossRef]
- White, S.W.; Kulcinski, G.L. Birth to death analysis of the energy payback ratio and CO2 gas emission rates from coal, fission, wind, and DT-fusion electrical power plants. Fusion Eng. Des. 2000, 48, 473–481. [Google Scholar] [CrossRef]
- Hondo, H. Lifecycle GHG emission analysis of power generation systems: Japanese case. Energy 2005, 30, 2042–2056. [Google Scholar] [CrossRef]
- Tokimatsu, K.; Kosugi, T.; Asami, T.; Williams, E.; Kaya, Y. Evaluation of lifecycle CO2 emissions from the Japanese electric power sector in the 21st century under various nuclear scenarios. Energy Policy 2006, 34, 833–852. [Google Scholar] [CrossRef]
- Dones, R.; Bauer, C.; Bolliger, R.; Burger, B.; Heck, T.; Roder, A.; Emmenegger, M.F.; Frischknecht, R.; Jungbluth, N.; Tuchschmid, M. Lifecycle Inventories of Energy Systems: Results for Current Systems in Switzerland and Other UCTE Countries. Available online: http://ecolo.org/documents/documents_in_english/Life-cycle-analysis-PSI-05.pdf (accessed on 14 June 2016).
- Environmental Product Declaration. Certified Environmental Product Declaration EPD of Electricity from Ringhals Nuclear Power Plant. Available online: http://gryphon.environdec.com/data/files/6/9916/epd26_Vattenfall_Ringhals_Nuclear_Power_Plant_2014-03-27.pdf (accessed on 14 June 2016).
- Environmental Product Declaration. Certified Environmental Product Declaration EPD of Electricity from Forsmark Nuclear Power Plant. Available online: http://gryphon.environdec.com/data/files/6/9914/epd21_Vattenfall_Forsmark_Nuclear_Power_Plant_2014-03-27.pdf (accessed on 14 June 2016).
- Fthenakis, V.M.; Kim, H.C. Greenhouse-gas emissions from solar electric- and nuclear power: A life-cycle study. Energy Policy 2007, 35, 2549–2557. [Google Scholar] [CrossRef]
- New Energy Externalities Developments for Sustainability (NEEDS) Report. Final Report on Technical Data, Costs, and Lifecycle Inventories of Nuclear Power Plants. Available online: http://www.needs-project.org/RS1a/RS1a%20D14.2%20Final%20report%20on%20nuclear.pdf (accessed on 14 June 2016).
- Environmental Product Declaration. Environmental Product Declaration of Electricity from Torness Nuclear Power Station. Available online: https://www.edfenergy.com/sites/default/files/torness_epd_report_final.pdf (accessed on 14 June 2016).
- Environmental Product Declaration. Beznau Nuclear Power Plant. Available online: http://www.axpo.com/content/dam/axpo/switzerland/umwelt/dokumente/umweltdeklaration_beznau_en.pdf (accessed on 14 June 2016).
- Kunakemakorn, J.; Wongsuchoto, P.; Pavasant, P.; Laosiripojana, N. Greenhouse gas emission of European pressurized reactor (EPR) nuclear power plant technology: A lifecycle approach. J. Sustain. Energy Environ. 2011, 2, 45–50. [Google Scholar]
- Santoyo-Castelazo, E.; Gujba, H.; Azapagic, A. Lifecycle assessment of electricity generation in Mexico. Energy 2011, 36, 1488–1499. [Google Scholar] [CrossRef]
- Kumari, S.; Rao, P.S. Electricity from nuclear power: Is it a solution to greenhouse gas emissions in India. Int. J. Sci. Technol. Res. 2013, 2, 242–247. [Google Scholar]
- Nian, V.; Chou, S.K.; Su, B.; Bauly, J. Lifecycle analysis on carbon emissions from power generation—The nuclear energy example. Appl. Energy 2014, 118, 68–82. [Google Scholar] [CrossRef]
- Pereira, J.P.; Parady, G.T.; Dominguez, B.C. Japan’s energy conundrum: Post-Fukushima scenarios from a lifecycle perspective. Energy Policy 2014, 67, 104–115. [Google Scholar] [CrossRef]
- Poinssot, Ch.; Bourg, S.; Ouvrier, N.; Combernoux, N.; Rostaing, C.; Vargas-Gonzalez, M.; Bruno, J. Assessment of the environmental footprint of nuclear energy systems: Comparison between closed and open fuel cycles. Energy 2014, 69, 199–211. [Google Scholar] [CrossRef]
- Nuclear Energy. Advantages and Disadvantages of Nuclear Power. Available online: http://nuclear-energy.net/advantages-and-disadvantages-of-nuclear-energy.html (accessed on 9 November 2015).
- Warner, E.S.; Heath, G.A. Lifecycle greenhouse gas emissions of nuclear electricity generation. J. Ind. Ecol. 2012, 16, S73–S92. [Google Scholar] [CrossRef]
- Lenzen, M. Lifecycle energy and greenhouse gas emissions of nuclear energy: A review. Energy Convers. Manag. 2008, 49, 2178–2199. [Google Scholar] [CrossRef]
- Nuclear Engineering International. World Nuclear Industry Handbook. Available online: http://viewer.zmags.com/publication/95b5bc6a#/95b5bc6a/1 (accessed on 9 November 2015).
- Austrian Energy Agency. Energy Balance of Nuclear Power Generation. Available online: http://www.ecology.at/files/berichte/E22.595.pdf (accessed on 9 November 2015).
- United States Energy Information Administration. Today in Energy. Available online: http://www.eia.gov/todayinenergy/detail.cfm?id=18591 (accessed on 14 September 2016).
- Storm van Leeuwen, J.W.; Smith, P. Nuclear Power: The Energy Balance. Available online: http://www.stormsmith.nl/reports.html (accessed on 9 November 2015).
- World Nuclear Association. Comparison of Lifecycle Greenhouse Gas Emissions of Various Electricity Generation Sources. Available online: http://www.world-nuclear.org/uploadedFiles/org/WNA/Publications/Working_Group_Reports/comparison_of_lifecycle.pdf (accessed on 14 June 2016).


| Source | Nuclear Reactor Type | GHG Emissions (gCO2e/kWh) | EGC (MW) | ηt (%) | CF (%) | PL (years) | FEM Type | UOG (%) | LCA Type | GL |
|---|---|---|---|---|---|---|---|---|---|---|
| Meridian Corporation [4] | BWR | 8.59 | 1000 | 70 | 30 | D | 0.17 | Process | USA | |
| San Martin [5] | BWR | 8 | 1000 | 70 | 30 | D | 0.17 | Process | USA | |
| Yasukawa et al. [6] | PWR | 34 | 1000 | 33 | 75 | 30 | D | Hybrid | Japan | |
| Yasukawa et al. [7] | PWR | 25.7 | 1100 | D | Hybrid | Japan | ||||
| PWR | 7.9 | 1100 | C | Hybrid | Japan | |||||
| Uchiyama [8] | FBR | 7.8 | 1000 | 33 | 75 | 30 | C | Hybrid | Japan | |
| BWR | 10.4 | 1000 | 32 | 75 | 30 | C | Hybrid | Japan | ||
| BWR | 21.1 | 1000 | 32 | 75 | 30 | D | Hybrid | Japan | ||
| Dones et al. [9] | PWR | 6 | 600 | 87 | 60 | C | Process | Switzerland | ||
| BWR | 6 | 1300 | 87 | 60 | C | Process | Switzerland | |||
| Andseta et al. [10] | HWR (best case) | 3.2 | 600–900 | 31 | 80 | 40 | Process | Canada | ||
| HWR (worst case) | 15.41 | 600–900 | 31 | 80 | 40 | Process | Canada | |||
| Hondo et al. [11] | BWR (Pu recycle) | 11 | 1000 | 32 | 70 | 30 | C | Hybrid | Japan | |
| BWR (Pu recycle) | 21.6 | 1000 | 32 | 70 | 30 | M-DC | Hybrid | Japan | ||
| PWR (Pu recycle) | 24.7 | 1000 | 32 | 70 | 30 | M-DC | Hybrid | Japan | ||
| BWR (no Pu recycle) | 26.4 | 1000 | 32 | 70 | 30 | M-DC | Hybrid | Japan | ||
| PWR (no Pu recycle) | 31.4 | 1000 | 32 | 70 | 30 | M-DC | Hybrid | Japan | ||
| BWR (Pu recycle) | 37 | 1000 | 32 | 70 | 30 | D | Hybrid | Japan | ||
| Rashad and Hammad [12] | PWR | 25.7 | 1000 | 75 | 30 | D | 0.2 | Process | ||
| Voorspools et al. [13] | PWR | 1.8 | 1000 | 33 | 85 | 40 | M-DC | 0.2 | Process | Belgium |
| PWR | 4 | 1000 | 33 | 85 | 40 | M-DC | 0.2 | I-O | Belgium | |
| White and Kulcinski [14] | PWR | 15 | 1000 | 33 | 75 | 40 | C | Hybrid | USA | |
| Hondo [15] | BWR | 24.2 | 1000 | 32.2 | 70 | 30 | D | Hybrid | Japan | |
| Tokimatsu et al. [16] | LWR | 10 | 1000 | 90 | 60 | C | Process | Japan | ||
| LWR | 13 | 1000 | 90 | 60 | M-D | Process | Japan | |||
| Dones et al. [17] | PWR | 5.19 | 1000 | 32 | 88.7 | 40 | M-D | Process | Switzerland | |
| PWR | 5.18 | 1000 | 32 | 88.7 | 40 | M-C | Process | Switzerland | ||
| PWR | 9.8 | 1000 | 33 | 84.6 | 40 | M-C | Process | Germany | ||
| PWR | 5.95 | 1000 | 33 | 71.7 | 40 | D | Process | France | ||
| PWR | 7.74 | 1000 | 33 | 80.4 | 40 | M-D | Process | Europe | ||
| BWR | 11 | 1000 | 32 | 88.7 | 40 | M-D | Process | Switzerland | ||
| BWR | 10.7 | 1000 | 32 | 88.7 | 40 | M-C | Process | Germany | ||
| BWR | 7.45 | 1000 | 32 | 88.7 | 40 | M-D | Process | Europe | ||
| EPD Report [18] | LWR (1 BWR, 3 PWRs) | 3.8 | 3671 | 34 | 90 | 50 | C | Process | Värö Peninsula, Sweden | |
| EPD Report [19] | BWR | 3.3 | 3274 | 34 | 90 | 50 | C | Process | Forsmark, Sweden | |
| Fthenakis and Kim [20] | LWR (best case) | 16 | 1100 | 85 | 40 | D | 12.7 | Hybrid | USA | |
| LWR (baseline case) | 25 | 1100 | 85 | 40 | D | 0.2 | Hybrid | USA | ||
| LWR (worst case) | 55 | 1100 | 85 | 40 | D | Process | USA | |||
| NEEDS Report [21] | PWR | 5.91 | 1000 | 34 | 40 | D | Process | Europe | ||
| PWR | 5.58 | 1590 | 37 | 60 | C | Process | Europe | |||
| FBR | 4.72 | 1450 | 40 | 40 | Process | Europe | ||||
| EPD Report [22] | GCR | 8.35 | 1185 | 35 | C | Process | Scotland | |||
| EPD Report [23] | PWR | 3.54 | 730 (2 × 365) | 50 | C | Process | Canton of Aargau, Switzerland | |||
| Kunakemakorn et al. [24] | PWR | 1.98 | 1630 | 37 | 94 | 60 | D | Process | Canada | |
| Santoyo-Castelazo et al. [25] | BWR | 11 | 1365 | 32.8 | 91 | 100 | Process | Mexico | ||
| Kumari and Rao [26] | HWR | 66 | 4560 | 100 | Process | India | ||||
| Nian et al. [27] | LWR | 20.68 | 1000 | 33 | 70 | 60 | Process | Japan | ||
| Pereira et al. [28] | PWR | 16.95 | 1250 | 70 | 40 | Process | Japan | |||
| Poinssot et al. [29] | PWR | 5.29 | 63400 | 20–50 | C | Process | France |
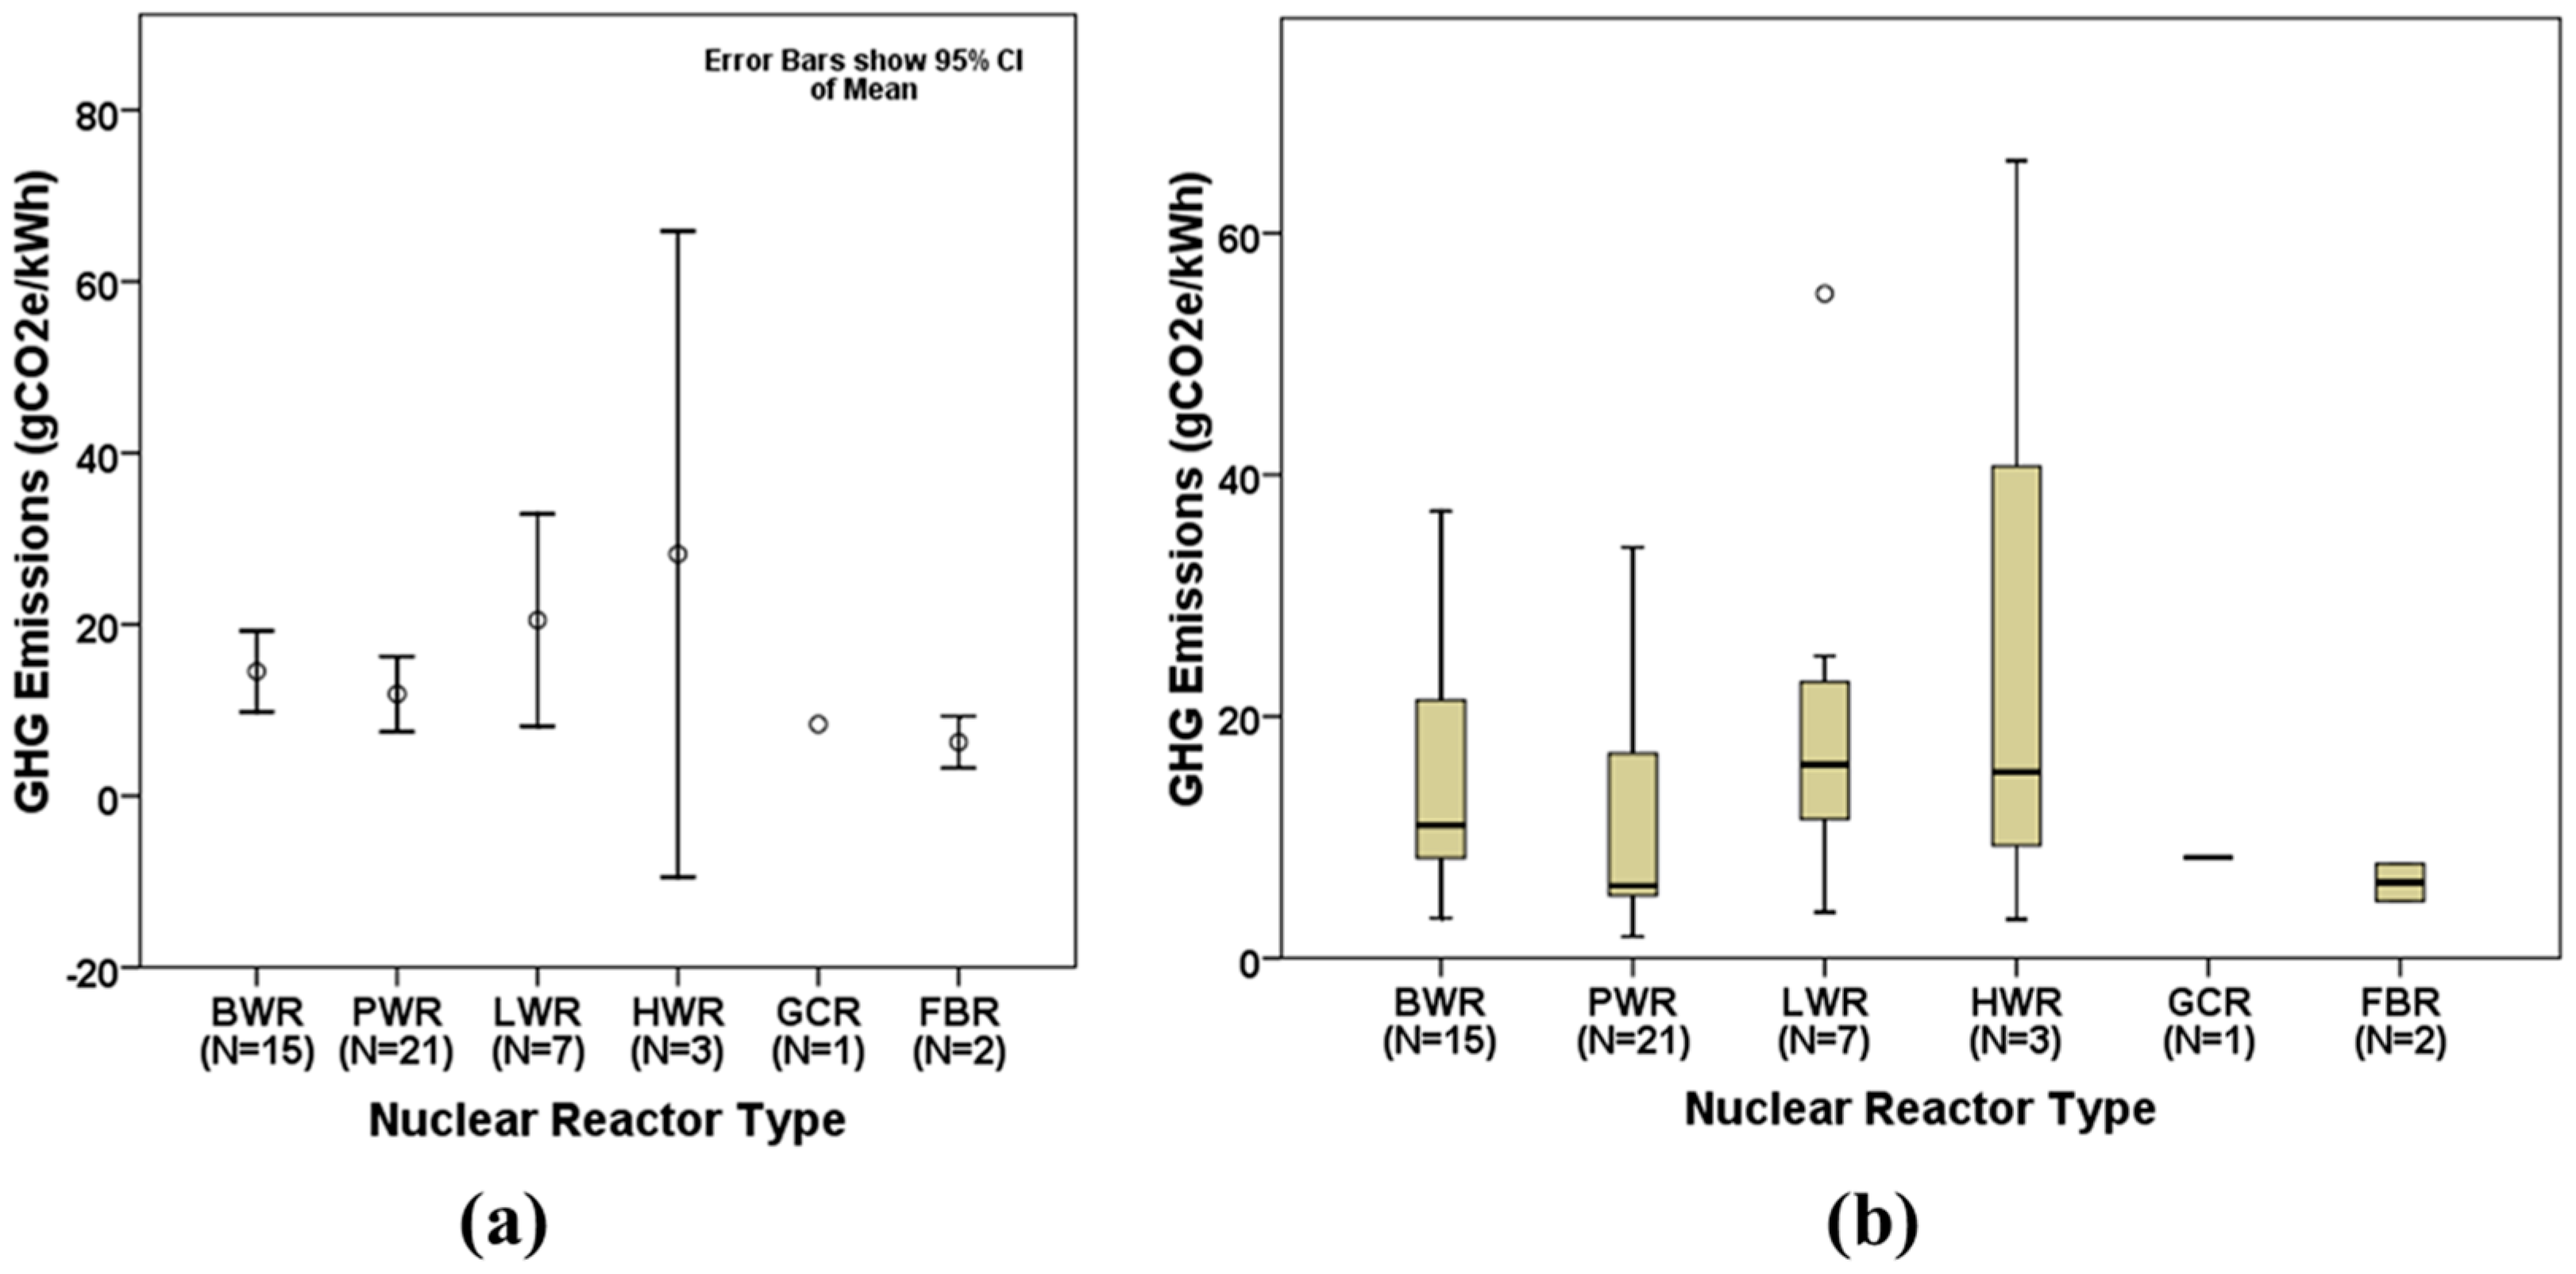
| Nuclear Reactor Type | N | X ± SD | Min. | Max. | SE | Q1 | Q2 | Q3 |
|---|---|---|---|---|---|---|---|---|
| BWR | 15 | 14.52 ± 9.37 | 3.3 | 37 | 2.42 | 8 | 11 | 21.6 |
| PWR | 21 | 11.87 ± 10.24 | 1.8 | 34 | 2.24 | 5.18 | 6 | 15 |
| LWR | 7 | 20.5 ± 16.71 | 3.8 | 55 | 6.32 | 10 | 16 | 25 |
| HWR | 3 | 28.2 ± 33.3 | 3.2 | 66 | 19.22 | 3.2 | 15.41 | 66 |
| GCR | 1 | 8.35 ± 0 | 8.35 | 8.35 | 0 | 8.35 | 8.35 | 8.35 |
| FBR | 2 | 6.26 ± 2.18 | 4.72 | 7.8 | 1.54 | 4.72 | 6.26 | 7.8 |
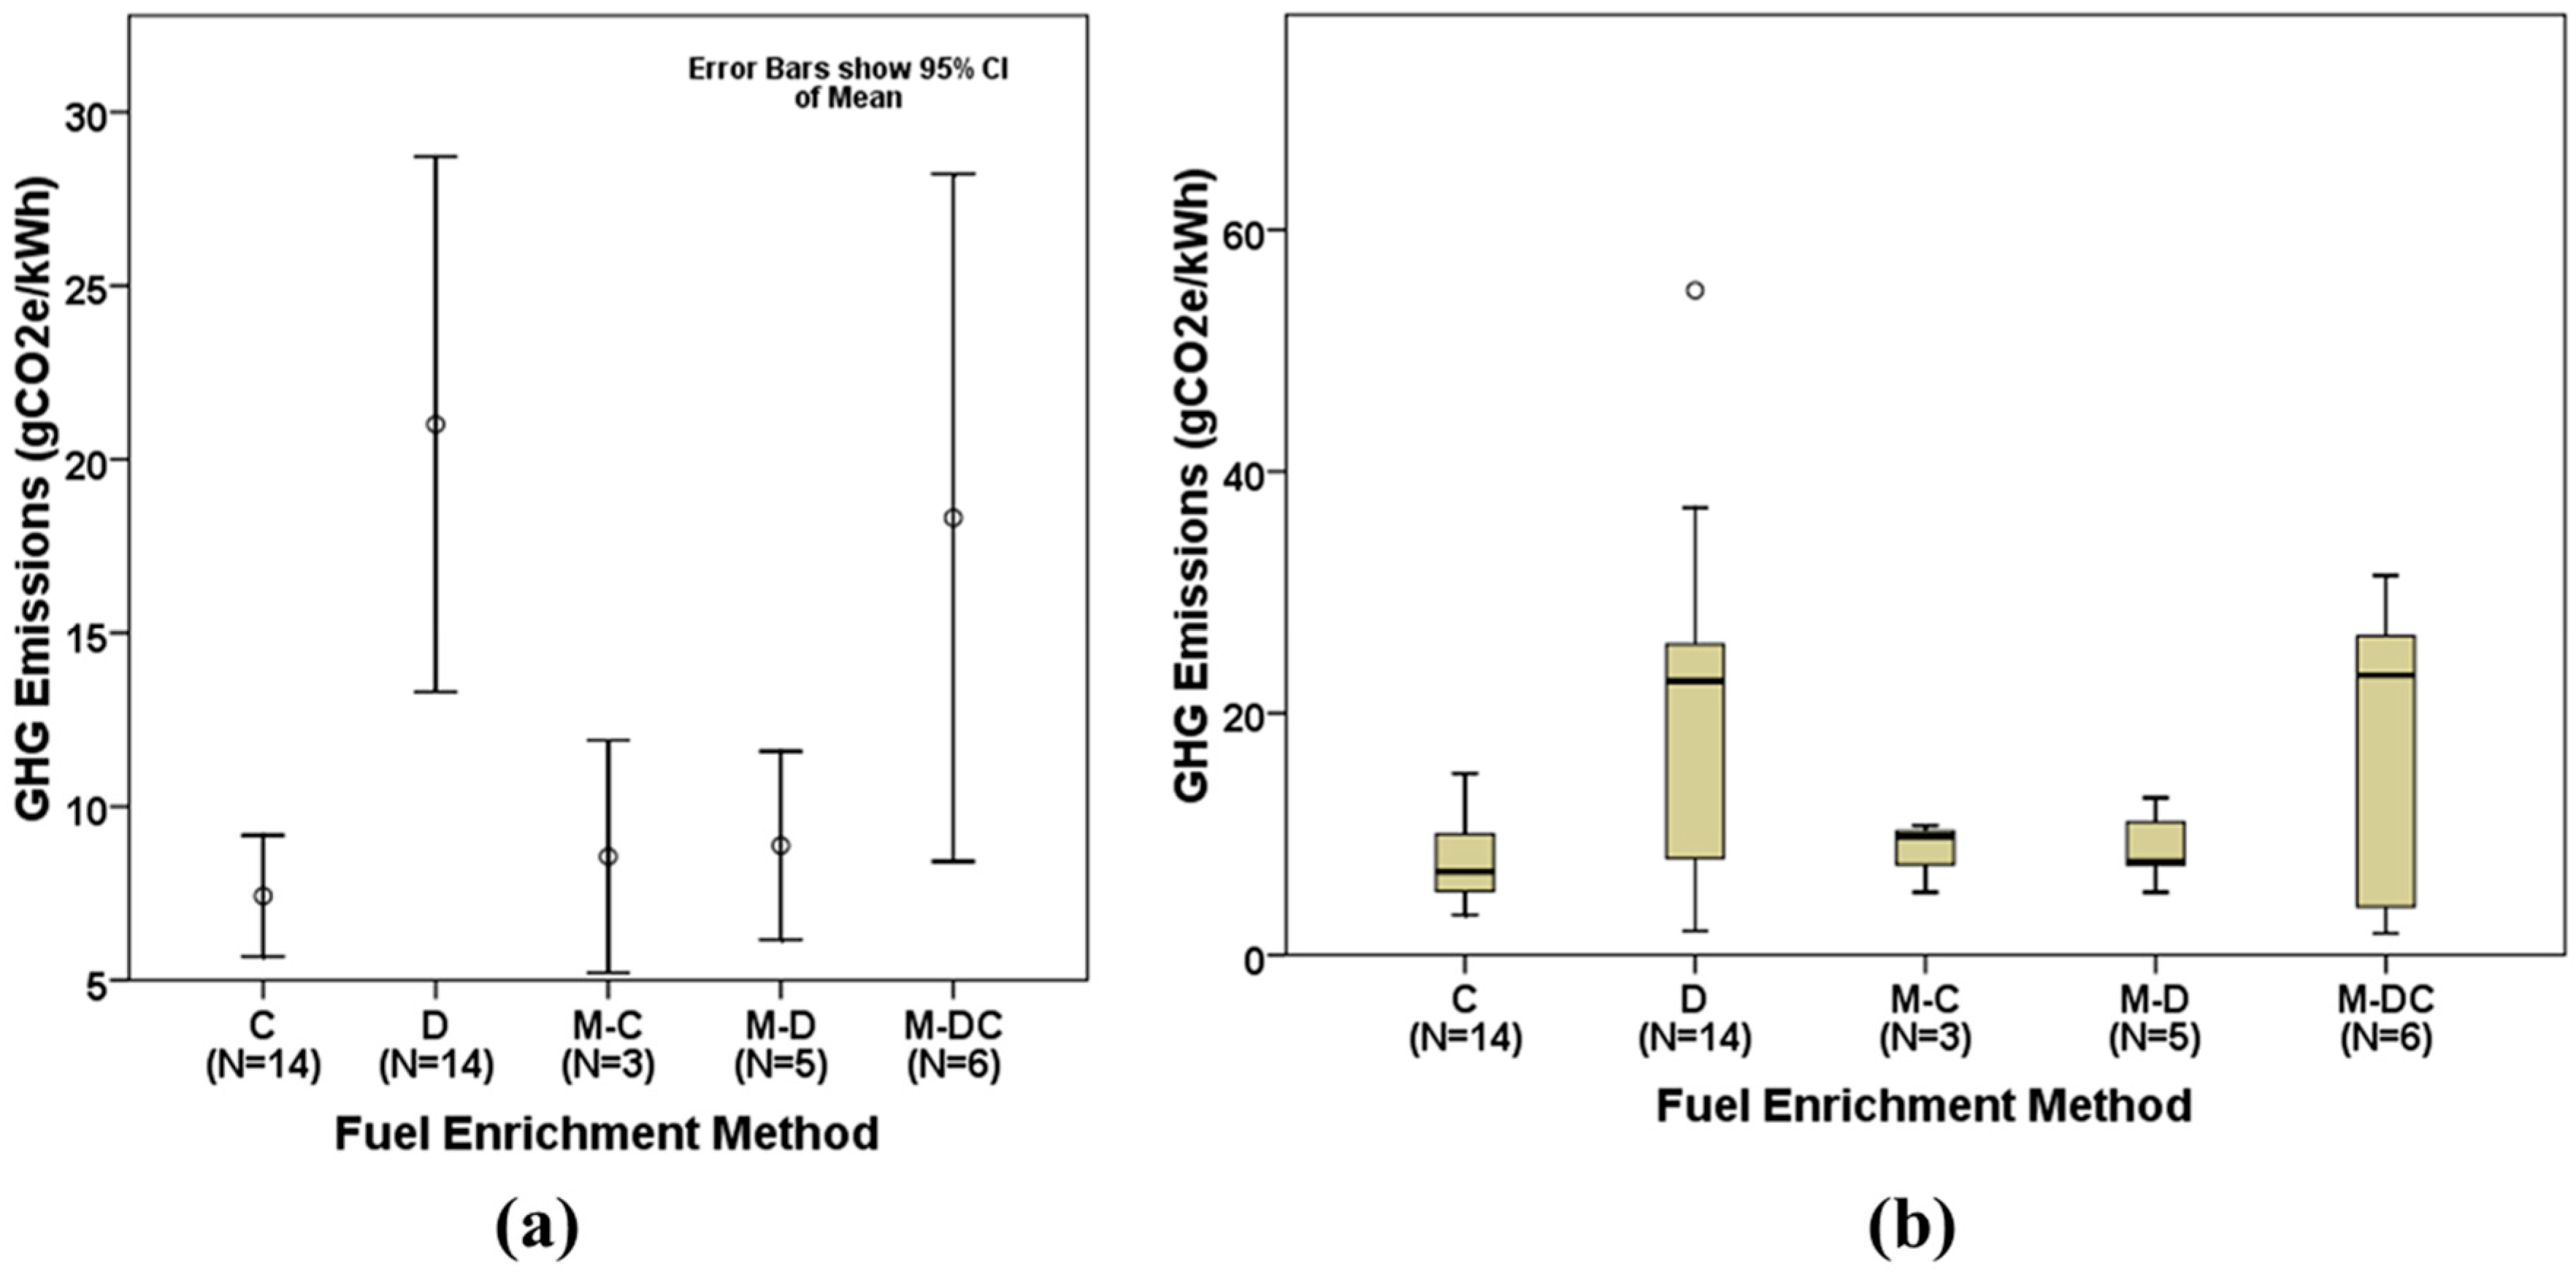
| Fuel Enrichment Method | N | X ± SD | Min. | Max. | SE | Q1 | Q2 | Q3 |
|---|---|---|---|---|---|---|---|---|
| C | 14 | 7.43 ± 3.33 | 3.3 | 15 | 0.89 | 5.29 | 6.9 | 10 |
| D | 14 | 21 ± 14.72 | 1.98 | 55 | 3.93 | 8 | 22.65 | 25.7 |
| M-C | 3 | 8.56 ± 2.96 | 5.18 | 10.7 | 1.71 | 5.18 | 9.8 | 10.7 |
| M-D | 5 | 8.87 ± 3.1 | 5.19 | 13 | 1.39 | 7.45 | 7.74 | 11 |
| M-DC | 6 | 18.32 ± 12.38 | 1.8 | 31.4 | 5.05 | 4 | 23.15 | 26.4 |
© 2016 by the authors; licensee MDPI, Basel, Switzerland. This article is an open access article distributed under the terms and conditions of the Creative Commons Attribution (CC-BY) license (http://creativecommons.org/licenses/by/4.0/).
Share and Cite
Kadiyala, A.; Kommalapati, R.; Huque, Z. Quantification of the Lifecycle Greenhouse Gas Emissions from Nuclear Power Generation Systems. Energies 2016, 9, 863. https://doi.org/10.3390/en9110863
Kadiyala A, Kommalapati R, Huque Z. Quantification of the Lifecycle Greenhouse Gas Emissions from Nuclear Power Generation Systems. Energies. 2016; 9(11):863. https://doi.org/10.3390/en9110863
Chicago/Turabian StyleKadiyala, Akhil, Raghava Kommalapati, and Ziaul Huque. 2016. "Quantification of the Lifecycle Greenhouse Gas Emissions from Nuclear Power Generation Systems" Energies 9, no. 11: 863. https://doi.org/10.3390/en9110863