1. Introduction
Among the actions that the Kyoto Protocol indicates in order to reduce CO
2 emissions, innovative technologies are promoted, in particular the renewable energy. The penetration of renewable energy into the energy system of human settlements on Earth is from one point of view nearly 100% [
1]. The energy system seen by the inhabitants of the Earth is dominated by the environmental heat associated with the greenhouse effect, which captures solar energy and stores it within a surface-near sheet of topsoil and atmosphere around the Earth [
2]. Only 0.02% of this energy system is currently managed by human society. Within this economically managed part of the energy sector, renewable energy sources currently provide about 25% of the energy supplied [
3]. Energy use and resource depletion does not, of course, constitute the primary goals of any society or individual within a society. For example, a European or a Japanese citizen on average uses about half of the energy consumed by a North American, despite equivalent living standards. This underlines the fact that the living standard and welfare depends on having primary (food, shelter, and relations) as well as secondary standards of individual preference, which can be realized in different ways with different implications for energy use [
3]. In the last years, the research and the policy focused the attention on new systems able to exploit energy from nature or economical source of energy.
Electricity generation from clean, safe and sustainable energy sources is nowadays a priority for many industrialized countries to meet increased energy demand and to reduce CO
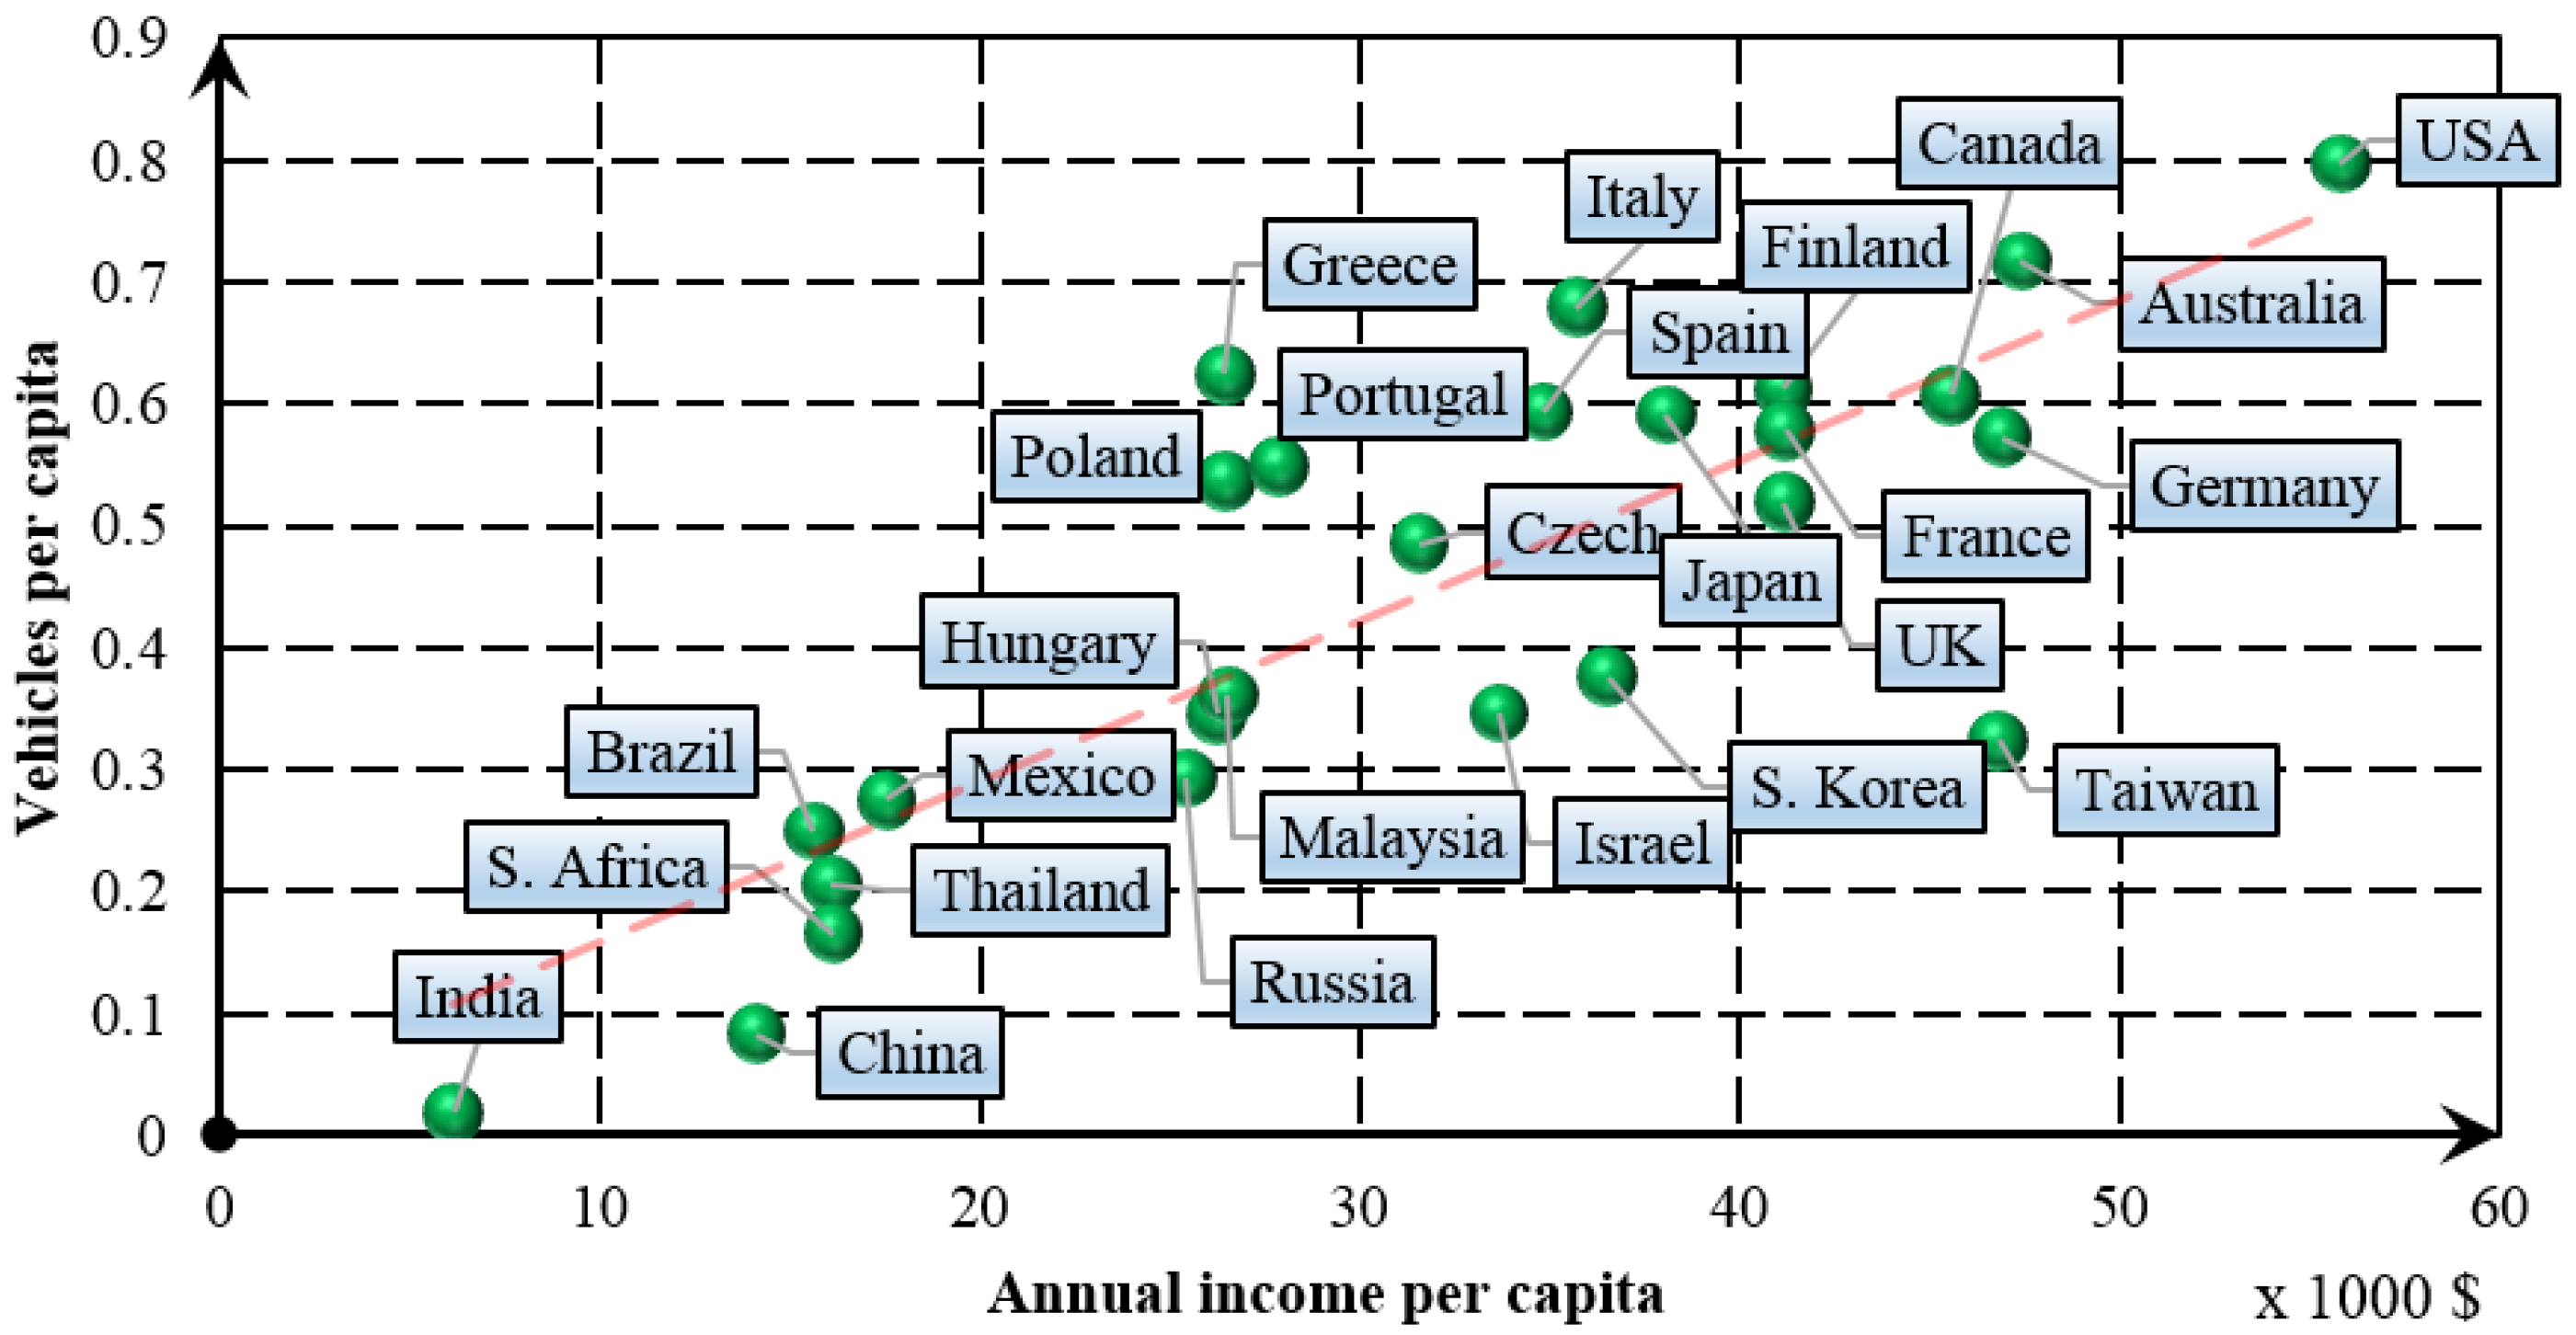
2 emissions. Residential and industrial sectors modified their fundamental structure, for example with the adoption of clean and sustainable improvements. In fact, another field that European Government studies with great attention is mobility. Numerous researches have demonstrated as the number of vehicles in the world is expected to double in the next 30 years, which could have serious negative consequences for the energy security and the climate. The cause of this is the growing demand for cars in countries such as Brazil, China, India, South Korea, Mexico, Poland, Russia and Thailand as the people there seek to increase their individual mobility when they become more prosperous [
4].
Figure 1 shows the correlation between wealth per capita and the number of vehicles per capita, in different parts of the world.
The most common effect of this amount above mentioned is air pollution increase. Therefore, new solutions should been investigated. Hydrogen is an energy carrier with great potential for clean, efficient power in stationary, portable and transport applications. It is envisaged as a significant element of the future fuel mix for transport, enhancing energy security, reducing oil dependency, greenhouse gas emissions and air pollution. Hydrogen allows a wide diversification of energy sources. In combination with fuel cells, it can also improve energy efficiency in transport and contribute strongly to mitigating climate change, especially when produced by renewable primary energy sources. Hydrogen and fuel cell technologies were identified amongst the new energy technologies needed to achieve a 60% to 80% reduction in greenhouse gases by 2050. Recent studies show the possible advantages of hydrogen’s introduction on bus fleet. Shaheen et al. [
6] showed that greater levels of exposure to hydrogen-fueled vehicles lead to higher levels of hydrogen acceptance and that early adopters tend to feel safer when using the technology, leading to significant improvements in public awareness. Langford et al. [
7] presented Knoxville Area Transit (KAT) as a case study to support the transition of a medium sized transit agency to full conversion to hydrogen fuel, describing requirements for hydrogen bus fleets, production, storage, refueling and maintenance facilities. In the past decade, there have been several projects demonstrating feasibility of hydrogen bus infrastructure, vehicles, and operating procedures. Another interesting trouble regards hydrogen’s production; it can be obtained from a different variety of sources, such as fossil fuels, water, etc. Technologies for the production of hydrogen from fossil fuels (steam reforming, partial oxidation, and gasification) are, as mentioned, mature and widely used (more than 95% of the hydrogen produced today comes from these processes). On the other hand, the use of renewable sources, such as water or biomass, to produce hydrogen is still in a development step. Currently, the European Parliament passed a law on hydrogen vehicles homologation in an effort to protect the environment in urban centers.
The law applies not only to the development of fuel cell vehicles but also to the development of hydrogen filling stations and the necessity of producing hydrogen in sustainable ways [
8]. Hydrogen can be produced from biomass through several thermochemical processes, such as gasification or pyrolysis, and biological processes. One of the possible renewable energy sources to be used to produce hydrogen is water, through electrolysis or thermochemical cycles.
In particular, the electrolysis process, which requires electrical energy, allows the use of several renewable energy sources in a stand-alone configuration, solving the randomness problem [
9]. The idea, in fact, is produce hydrogen, also in a discontinuous way, in order to accumulate chemically the electrical energy produced from renewable source. The hydrogen thus produced can be employed in different applications by the use of fuel cells, for example, in the transport sector or in the same electrical sector, enabling the delivery of electrical energy according to a predetermined load profile.
Among various renewable energy sources, wind was one of the first to be analyzed for similar application. In the last two decades, several studies were realized about the production of hydrogen from wind energy [
10,
11]. In particular, Paynter et al. [
10] already in 1991 suggested that hydrogen–wind coupling could be an interesting solution for energy sector, in particular areas characterized by intense winds (speed higher than 12 m/s) and the presence of a small electrical grid.
More recent studies show different technical solutions. For example, Koiwa et al. [
9] suggest the installation of wave farms, based on wind turbines, permanently connected in parallel through power converters, in order to maximize and control the electrical supply of a hydrogen electrolyzer.
Other renewable sources, usable to produce hydrogen, are certainly water (using hydroelectric plant) [
12] and solar (using photovoltaic panels) [
13]. However, these source have important limitations: hydrogen production by hydroelectric is achievable in limited areas, because the availability of rivers with particular properties is necessary, while solar is not very concentrated, therefore a plant for a large scale hydrogen production could consume significant land.
Brazil, for example, is an interesting area where the realization of a hydrogen plant based on hydroelectric energy is possible thanks to the availability of huge waterways. Currently, in Brazil, about 80% of electrical power production is based on hydroelectric plants. For this reason, in Brazil, the research is focused on the production of hydrogen that could be exported abroad or used in public transport [
12].
Solar source is exploitable, for example, in the northern part of Africa, thanks to the high solar radiation, low population density and the presence of areas not exploited for agriculture. In particular, the Algerian Government has launched a National Research Program intended to promote renewable energies. Among the selected and accepted projects, there is “SOLAHYD” that consists in the realization of a pilot plant, based on PV module and PEM electrolyzer [
14].
Finally, in last decade, another energy source has been taken into consideration: sea wave. Many studies investigated the energy potential and technical solutions for exploitation, in order to produce electrical energy, hydrogen or fresh water [
15,
16,
17]. In particular, Falcão [
15] shows the different methodologies investigated for the energy extraction from sea weave. This energy source is currently investigated for several reasons: high energy potential; its exploitation does not require land consumption; and very limited visual and environmental impact [
18]. Moreover, in small islands, the cost of electrical energy production and fuel for public transportation are higher than in other regions. For all these reasons, sea wave could be a very important energy resource in small islands.
The main aim of this work is to analyze a possible application of hydrogen production by the renewable sources such as wind and wave energy and hydrogen utilization in public transport. Two different cases are analyzed: the Province of Trapani, located on the western coast of Sicily (Italy), and the small island of Pantelleria, in the middle of Mediterranean Sea, between Sicily and Africa.
The principle innovative aspects are the integration of wave energy into renewable source and a presentation of small-scale prototype made by University of Palermo.
3. DEIM Point Absorber
DEIM Point Absorber is an innovative conversion device proposed by Energy Department of University of Palermo (DEIM), which is able to convert directly wave energy into electrical output without the use of intermediate devices [
24], such as toothed wheels, transmission belts or pressurized fluids (water or oils). Moreover, it can convert wave energy independently from its propagation direction.
This new technology is based on an innovative small-scale prototype of linear generator projected and realized in the laboratories of the Energy Department. The Wave Energy Converter (WEC) is shown in
Figure 5. It is fundamentally composed of two buoys, which are able to float independently. The external buoy (yellow one) is the capture device, because it intercepts the continuous alternate wave motion. This motion is transferred by a connecting rod (blue rod) to the internal buoy (green one), which contains eight linear generators. The external buoy has a nominal diameter of 5 m, while the internal one has a nominal diameter of 2 m. The working stroke of the linear generators is about 4 m; thus, the WEC will produce electrical energy [
25] in bad weather too (which usually represents the most energetic sea state). Additionally, most of the conversion device is under the sea level in order to avoid a significant visual impact. The presence of a red light in the upper part of the WEC makes it visible up to several nautical miles away. Each of the eight linear generators presents a nominal power of 10 kW, for a total nominal power of 80 kW. The particular size of the conversion device has been chosen in order to optimize the electrical energy production according to the wave climate along the western coast of Sicily. The central buoy has a great inertia due the presence of linear generators inside and a hemispherical ballast located in the lower part, in order to maintain an appropriate floating level and vertical positioning during the motion.
Furthermore, a jumper buoy (blue one) connects the lower part of the inner buoy to the weights located on the seabed, through heavy chains. The role of this jumper buoy is very important: it maintains the vertical position of the four lower chains, which avoids damaging the seabed and its precious flora and fauna. Two springs are located in the upper and lower part of the inner case, avoiding any damage of the inner buoy due to bad weather, as shown in
Figure 6. The linear generator developed by University of Palermo consists of two fundamental parts: the stator part (the external one) and the translator part (the internal one). The first one contains the magnetic circuit, composed of two laminated steel packs, and the electric circuit. The copper coils are arranged in the hollows and presents a three phases connection. The translator is composed of 132 neodymium-iron-boron permanent magnets fixed in a plate realized in a non-magnetic material, bakelite, which is also resistant to electricity, and prized for its low conductivity even though it is not flexible. The neodymium magnets are disposed with a rotation angle of 13°, in order to minimizing the cogging force that is present in this type of conversion device. Moreover, this particular alloy has been chosen because of its prominent features. In fact, neodymium-iron-boron magnets are able to produce a strong and long lasting magnetic field, without any electrical energy request. Obviously, the time variation of the magnetic field, due to the vertical alternate motion of the devices, caused by the wave source, produces the electromotive forces in the electric circuit and then the electrical power supply to the load.
The electrical output can be used to produce hydrogen. At present, the authors are evaluating two different solutions: totally stand-alone system or connected farm. In the first hypothesis, the inner buoy is equipped with a small system, able to produce hydrogen. This system is composed of several components, in particular: a power unit, able to convert the irregular electrical output, produced by linear generators, into stable continuous voltage; a desalination system, composed of a pump and a reverse osmosis membrane; and an electrolyzer and the hydrogen storage system. In this way, each buoy can produce and store inside the hydrogen, using only the sea wave energy. Periodically, the hydrogen could be removed from the buoy using a boat, thus enabling the carrying out of eventual maintenance. The second hypothesis is based on a centralized hydrogen production. Each buoy is equipped with only a power unit to produce stable continuous voltage. This energy could be transferred to mainland by wire to a central plant, composed of the desalination system and the hydrogen producing system.
For the following energy production evaluations, the overall efficiency of the wave energy converter is fixed to 50%, according to the experimental data obtained on a small scale prototype of the linear generator tested in laboratory. It is clear that continuous studies about this WEC will be able to improve this percentage. DEIM Point Absorber can be used in multiple array in off-shore wave farms along the western coastline of the Province of Trapani. In this way, it is possible to minimize the exploited areas and, at the same time, increase significantly the installed power.
4. First Case Study: Replacing the Diesel Fleet of Urban Bus with Hydrogen Fuel
Urban buses represent one excellent example for introduction of hydrogen fuel into urban mobility. Some benefits of this choice include:
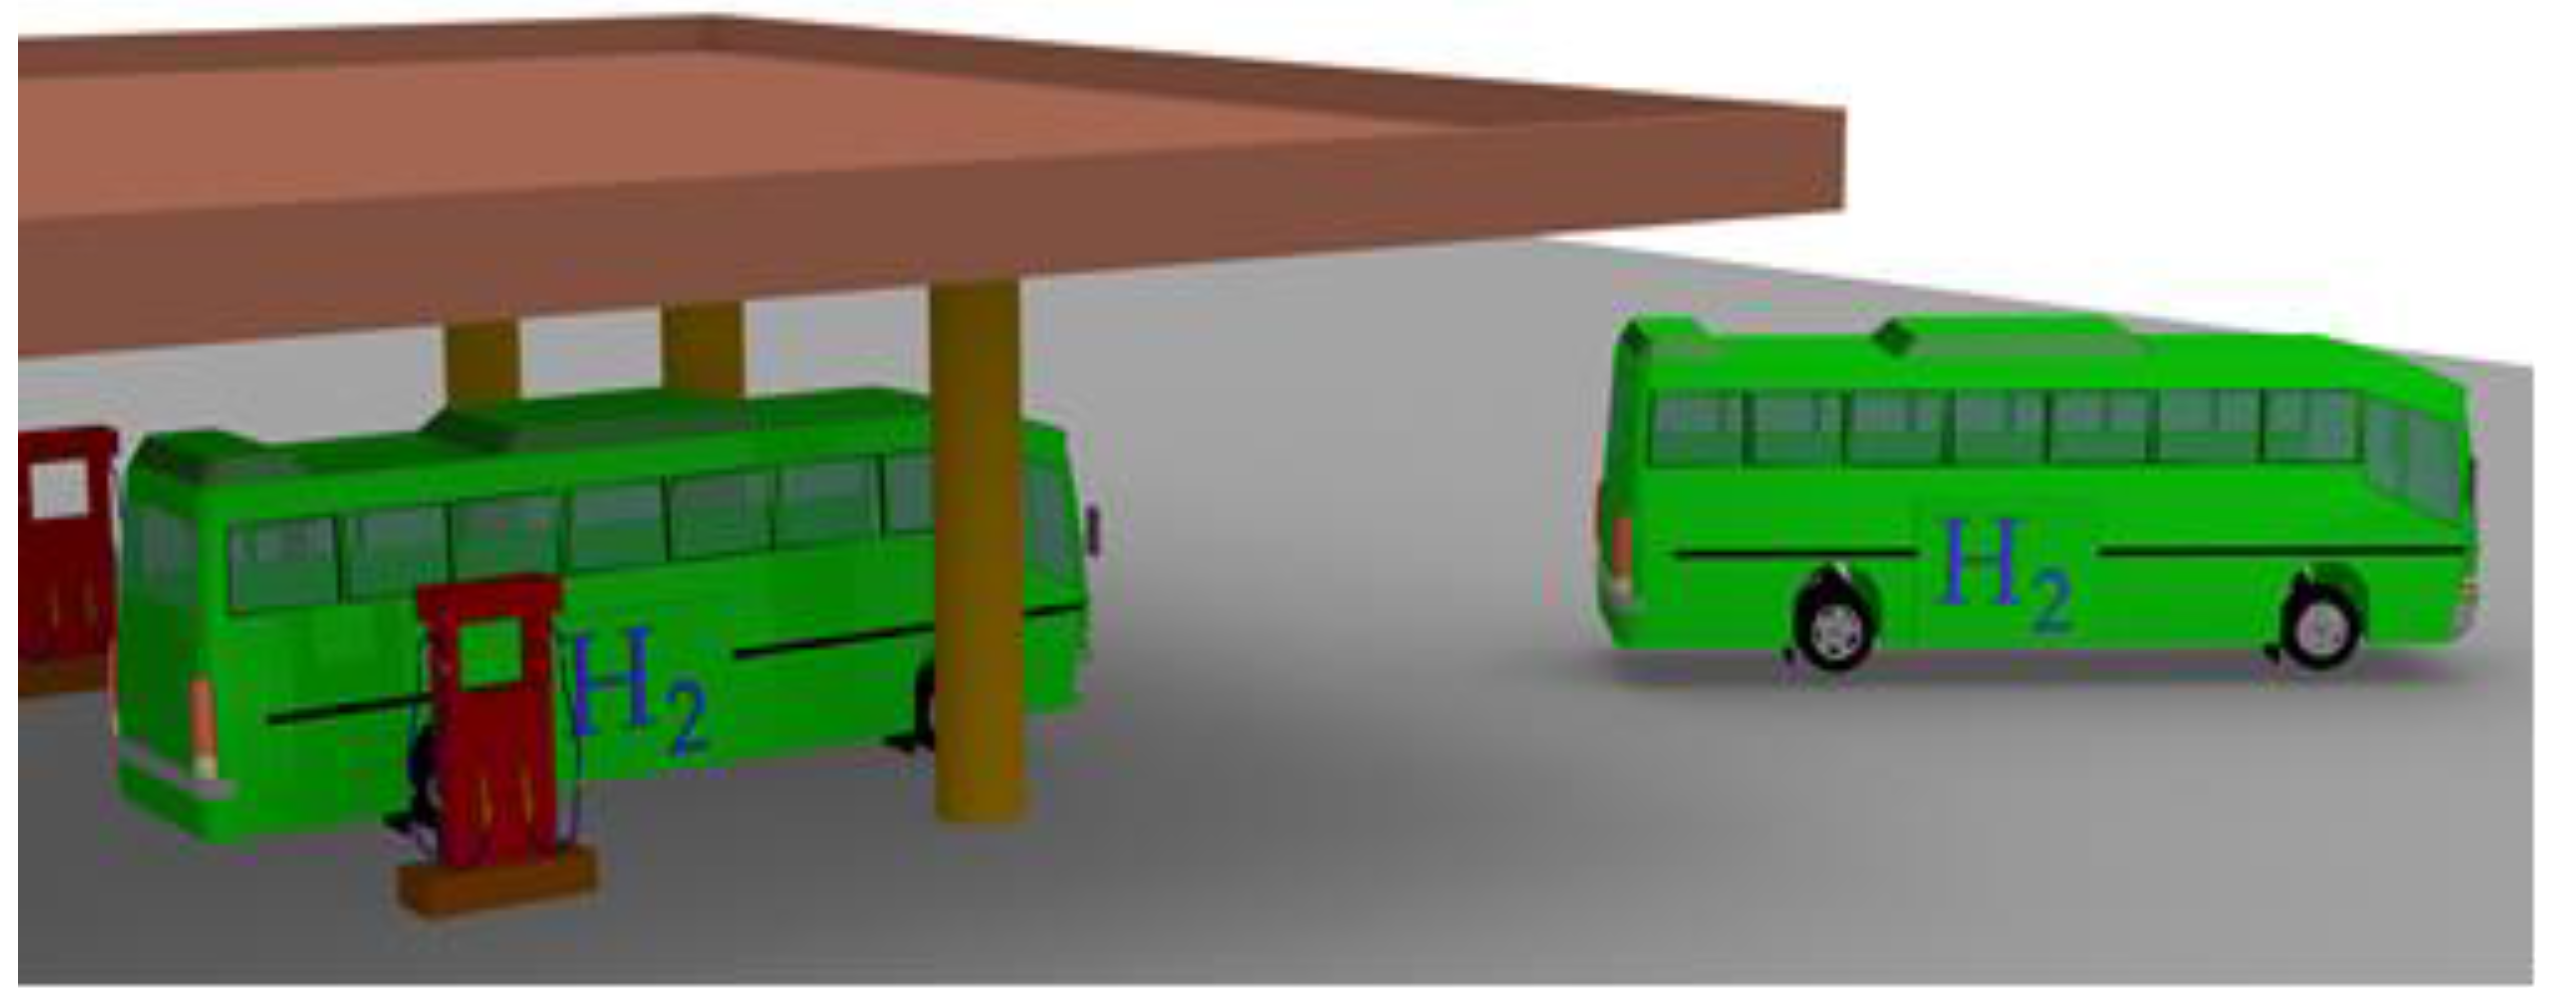
In general, all manufacturers have focused on the polymer electrolyte cell (PEMFC, Proton Exchange Membrane Fuel Cell), which meets the requirements to be used in road vehicles. Proton exchange membrane fuel cells (PEMFCs) are highly efficient power generators, achieving up to 50%–60% conversion efficiency, even at sizes of a few kilowatts. PEMFCs have zero pollutant emissions when fueled directly with hydrogen and near zero emissions when coupled to reformers. There are some advantages, such as the high power density, the lack of corrosive fluids, a simple structure and the ability to provide a quick cold start of the vehicle. We present an adoption of this system (PEMFCs) to the urban bus of Trapani (see
Figure 7). Trapani is a city on the west coast of Sicily, Italy. The Municipal territory is inhabited by little more than 70,000 people spread over a vast area of 271 square kilometers. The urban buses have a central role in its mobility. The
Table 1 shows data of ATM (Transport Company) of Trapani.
The principal aim of this work is the gradual replacement of diesel with hydrogen produced by renewable source such as wave and wind energy (examples presented in this work). We represent three different scenarios of the total annual kilometers of the urban fleet. In particular, we study the alternative generation of hydrogen by wind or wave source. Finally, we evaluate the avoided emissions of hydrogen buses and a short economic analysis.
4.1. Scenarios
The aim of this work is to replace gasoline buses with hydrogen buses in the Province of Trapani. This important goal can be achieved by using renewable energies, including wind source and wave source, which can be exploited with the innovative conversion device proposed by University of Palermo. Different scenarios will be proposed in order to show the electrical energy demands to satisfy the production of hydrogen as the energy vector (see
Table 2). These scenarios comprise a penetration of 50%, 75% and 100% of the total annual kilometers of the urban fleet (see
Table 3). A compensatory approach will be proposed: the conversion devices will be installed in the best sites of the Province without territorial or marine constraints, while the production and storage of hydrogen used is realized near the transport company’s venue. The presence of the storage tanks will be helpful to compensate the fluctuations of the electrical energy production and, in this way, the hydrogen generator will be able to work optimally. Technical practices and management will be improved too. In this text, the gasoline consumption in the urban areas has been set equal to 0.4 L/km, while the hydrogen one has been set equal to 0.25 kg/km.
Assuming an average efficiency of 60%, the electrical energy demand to produce 1 kg of H
2 has been set equal to 56.3 kWh [
26]. Furthermore, the electrical energy consumption for the storage of 1 kg of H
2 in compressed form has been set equal to 3.35 kWh, for a global demand of 59.65 kWh/kg of H
2 [
26].
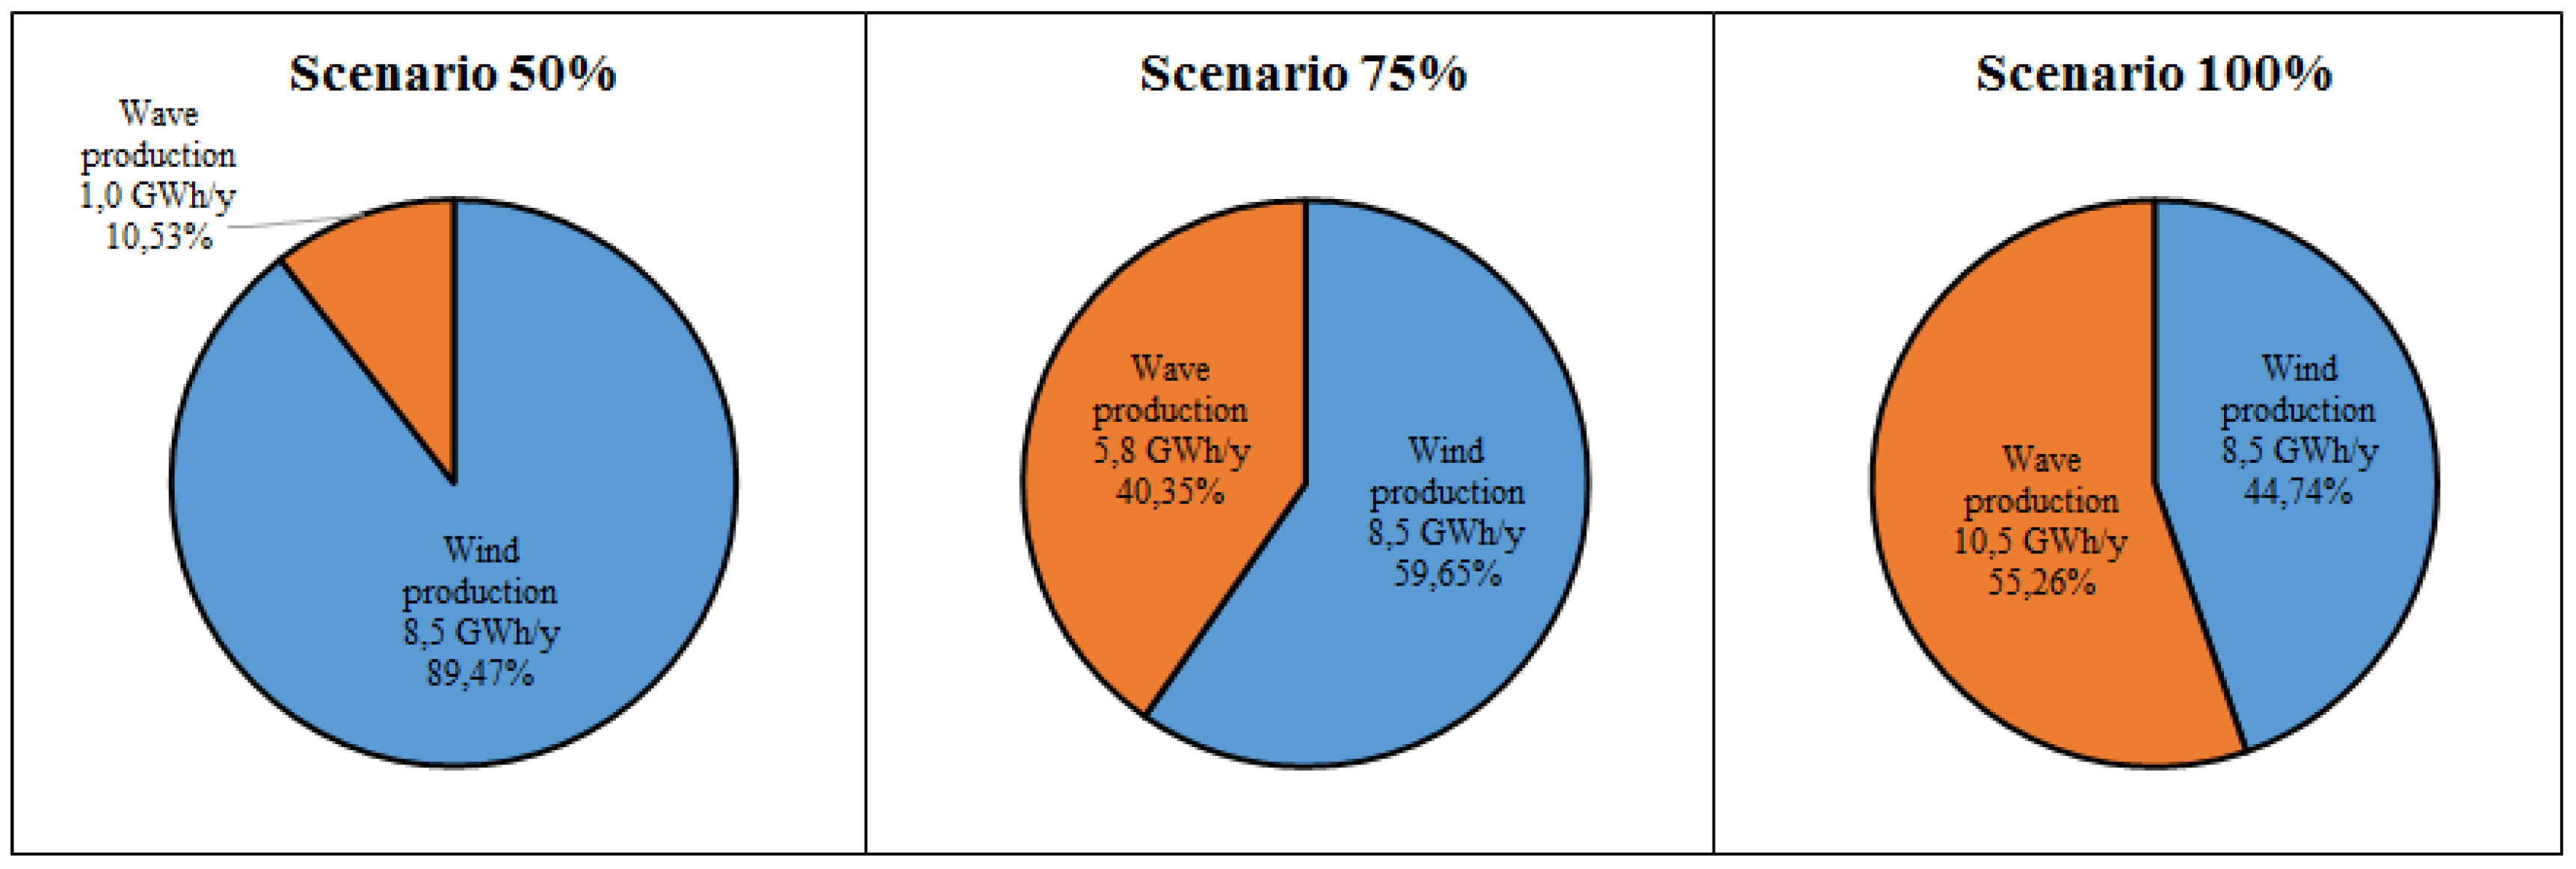
As explained before, the REs used in this study are wind source and wave source. This is fundamentally due to the high energetic potential of wind source inland and to the significant energetic density of wave source through the Province’s coastlines. Particularly, it is considered a fixed share of the electrical energy production from wind generators, while the electrical energy production from DEIM Point Absorbers increases according to the selected scenario (see
Figure 8 and
Table 4).
The installation of five wind turbines with a nominal power of 850 kW (for a total installed power of 4.25 MW) will be able to produce about 8.5 GWh/year of electrical energy, which represents 44% of the global electrical energy demand.
Therefore, a 50% penetration rate can be easily achieved with an installed wave power of 0.8 MW (which corresponds to 10 DEIM Point Absorber), a 75% penetration rate with 4.8 MW and a global penetration with 8.6 MW. In every scenario, there are two wave farms, one in the northern coastline and the other in the southern one, installed. Every wave farm is characterized by the presence of the same number of conversion devices.
4.2. Avoided Emissions
The replacement of gasoline buses with hydrogen buses in Province of Trapani represent a big opportunity to reduce significantly the production of pollutants in urban areas, especially due to public transport. The centralization of the storage and the presence of specialized workers represent other important advantages. The emission factors used in this text are presented in
Table 5. These are: CO
2, CO, PM
10, NMVOC and NO
x, expressed in g/km.
The avoided emissions (see
Table 6) are obtained by multiplying these emissions factors by the kilometers of the gasoline buses of every scenario. Obviously, the biggest item is represented by CO
2, but the avoided emissions of the other pollutants are also important in order to reduce greenhouse gases (GHG) emissions and global warming.
Finally,
Figure 9 shows the avoided emissions for only the third scenario (penetration rate equal to 100%). It was obtained using the emission factors above mentioned and the total number of the avoided kilometers. It is clear that wave energy and DEIM Point Absorber have a fundamental role in order to achieve this prestigious goal.
4.3. Economic Analysis
The evaluation of the investment costs for hydrogen production does not have many troubles because the technologies are essentially components used in the chemical industry. As for the economic appraisal of wind plant, it is very easy and reliable seeing as how the wind turbines are defined as mature and strengthened technology. However, wave energy converters are nowadays in a prototypal stage and there are no commercial devices (except Pelamis). In
Table 7, all of the economic data input in the analysis are reported. The annual operative and maintenance costs (OpEx) are expressed as percentage of initial investment (CapEx).
Other technical inputs are: the fixed installation of five wind turbines with a nominal power of 850 kW (for a total installed power of 4.25 MW) and a variable number of DEIM Point Absorber to satisfy hydrogen’s electrical need. In order to calculate the cost of energy from an array of wave energy devices, the lifetime costs (both capital and operating) and the cumulative energy yield for the array must be considered.
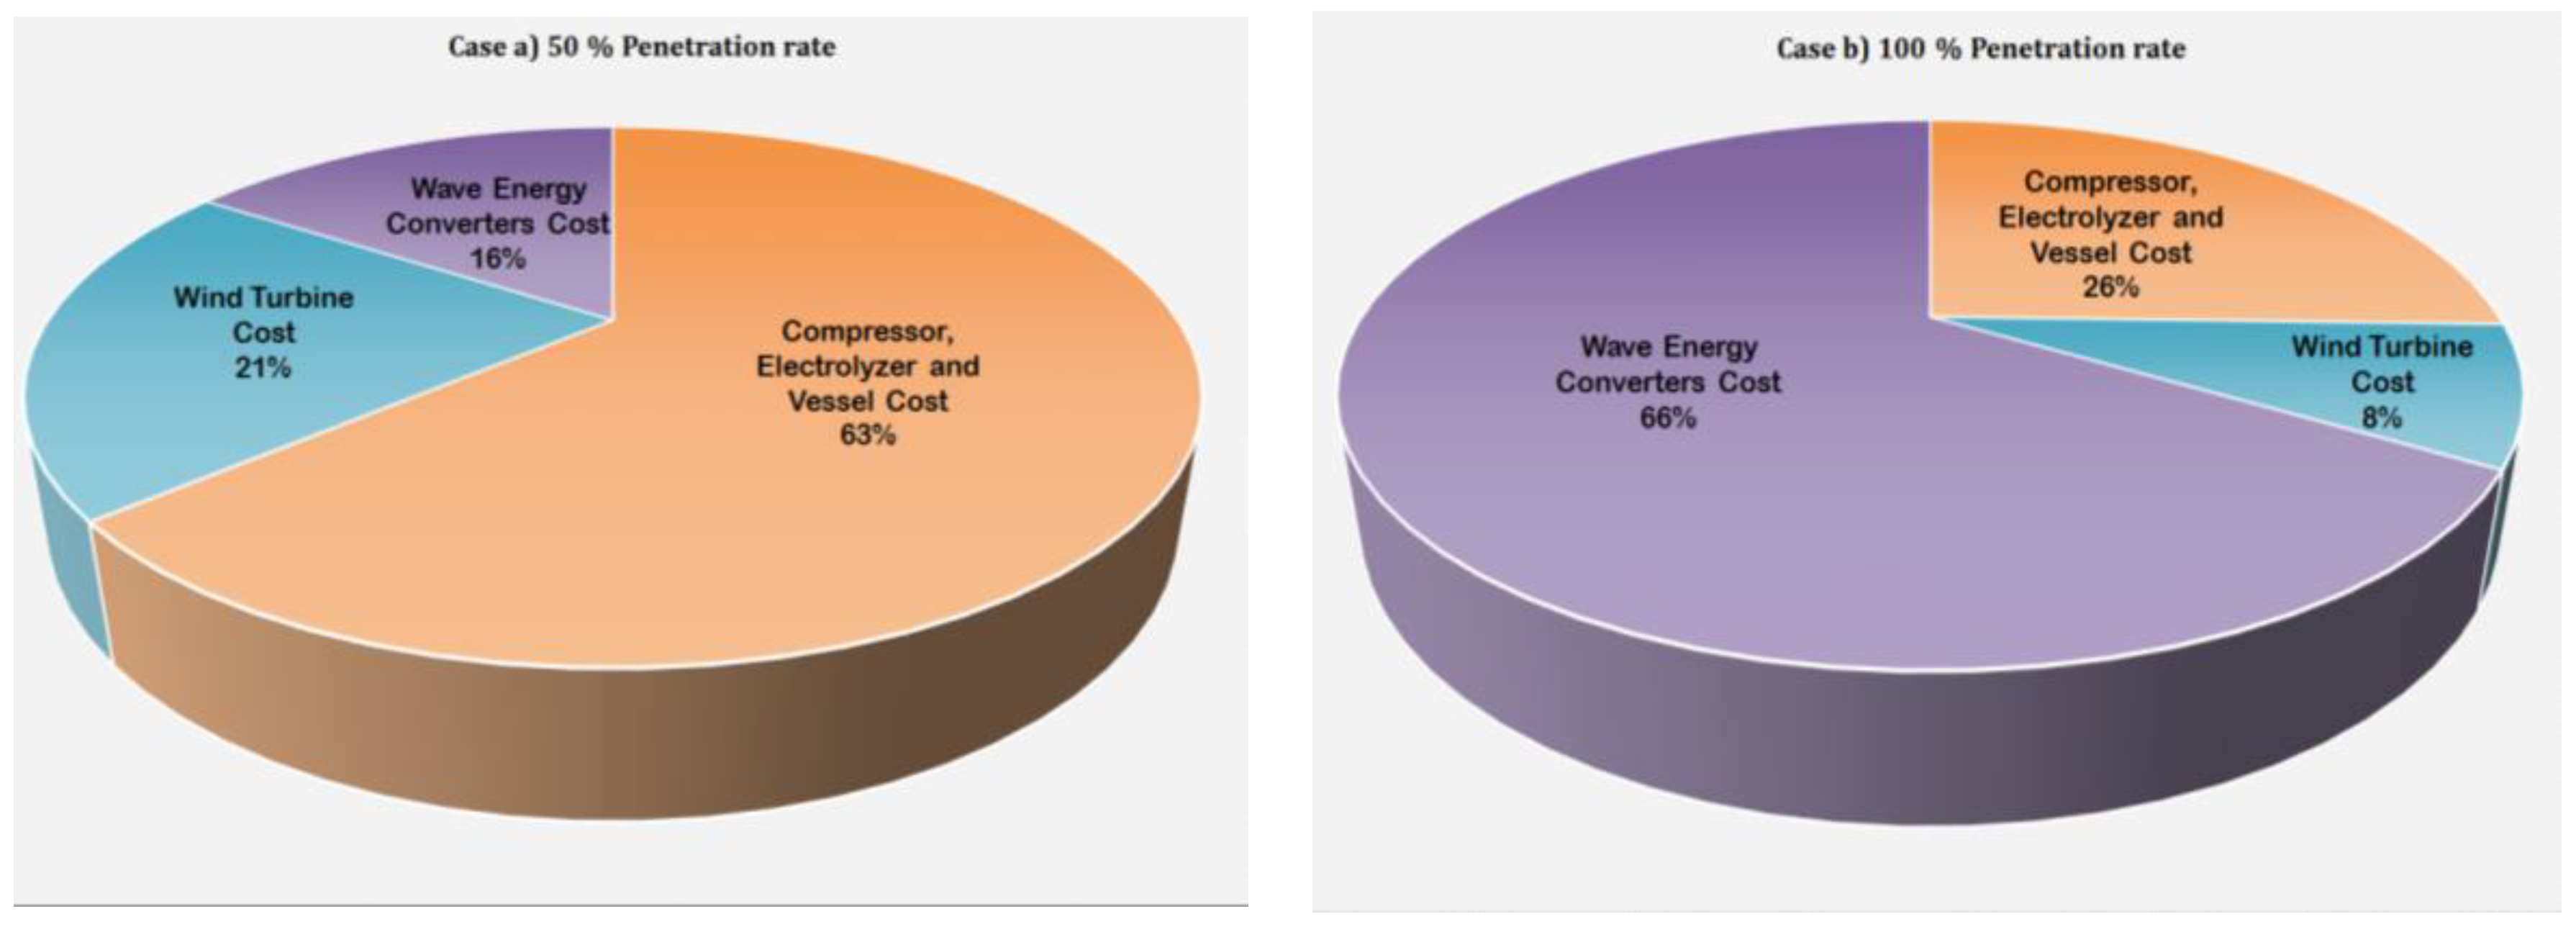
The
Figure 10 shows the cost’s distribution for the 50% scenario and 100% scenario. The items of costs are grouped into: wave energy converter, wind turbine and hydrogen facilities.
In conclusion, the results show the high economic impact of WECs’ use. The cost of energy from first arrays is relatively high compared to other renewables at a more advanced stage of development (such as offshore wind) but rapid reduction in costs from prototypes is already evident and there is reason to expect significant reduction in cost of energy will continue if deployment increases. WECs are more expensive to build and operate, however, there is great scope for cost of energy reductions through scale effects because very large arrays can be built using identical devices and moorings. The wave energy resource is larger and in theory all of this can be accessed by current generation devices. It is likely that, as deployment progresses, wave arrays will be built further offshore in more energetic sites using the same device types.
5. Second Case Study: Hydrogen’s Introduction in Bus Fleet of Pantelleria
The second case study regards the introduction of hydrogen as main fuel in public mobility in Pantelleria. It is a small island in Mediterranean Sea sited 110 km from Sicily (in the south) and 70 km from Tunisia (northeast). Its area is 80 km2 and the island has a population of about 7700 inhabitants in the winter season but as many as 14,000 in summer.
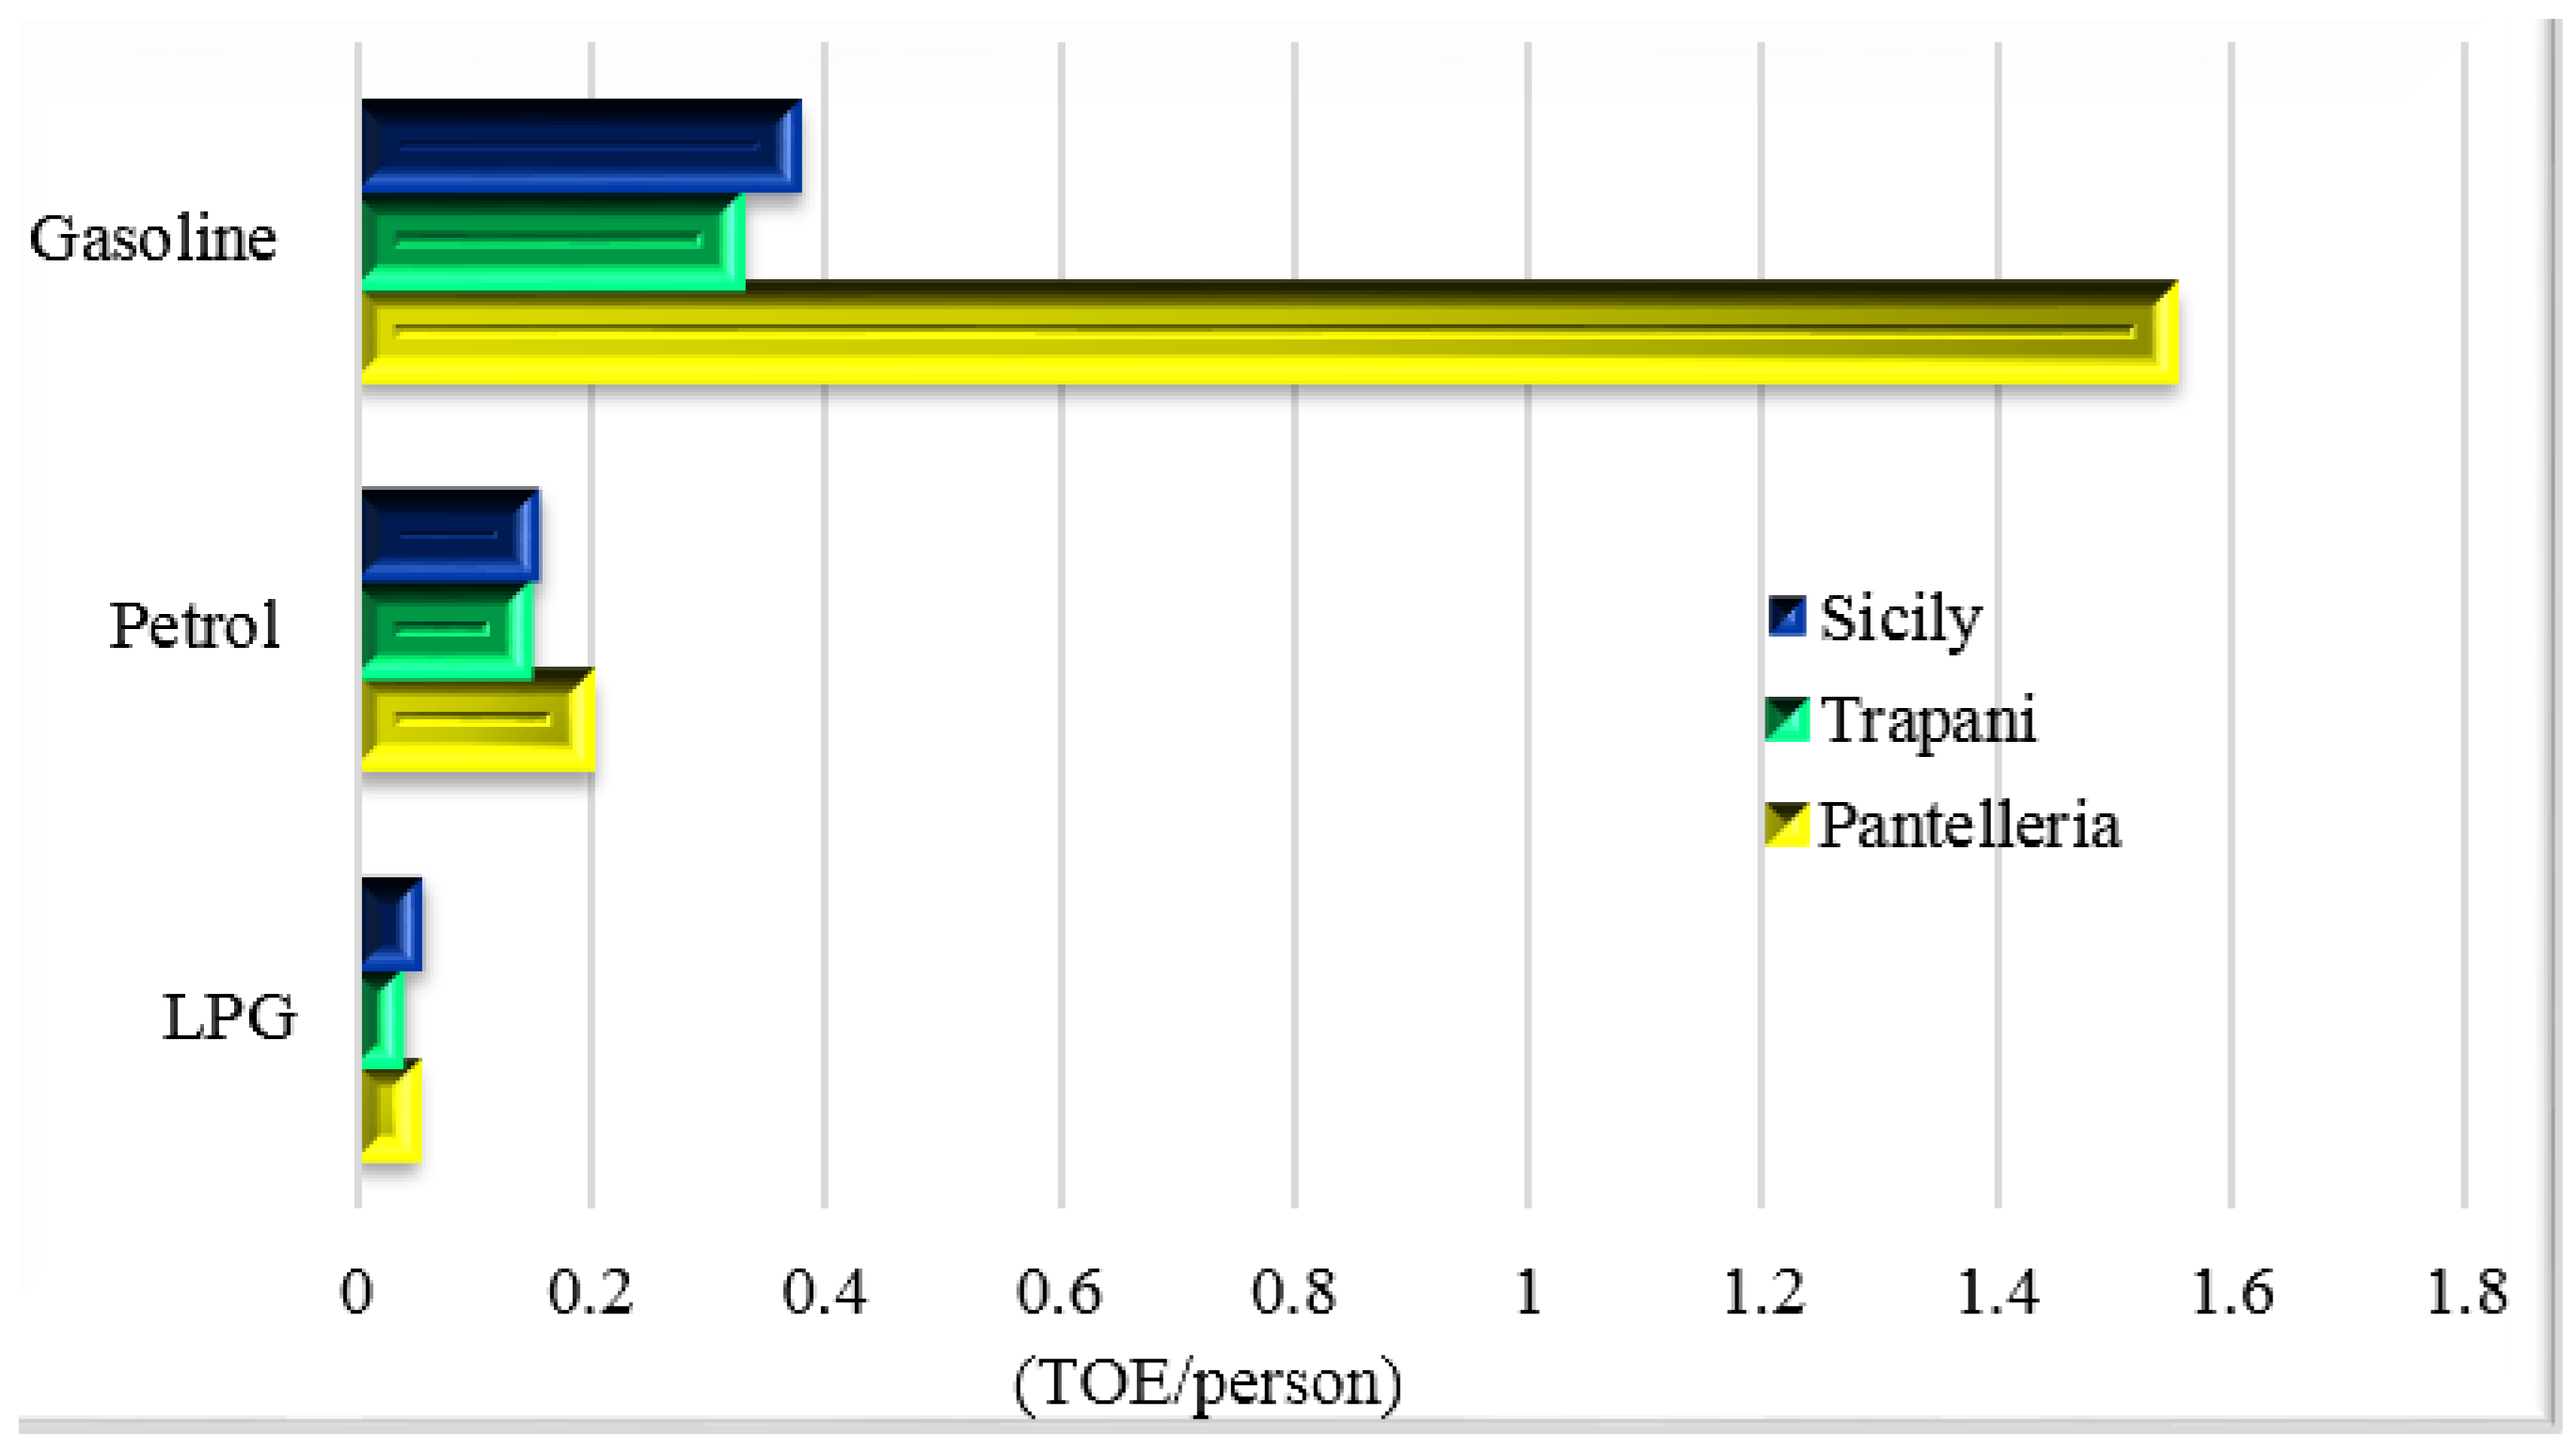
The island is not connected to the national grid; the electricity is produced locally by a diesel power plant. Electricity consumption per capita is over 30% higher than the national average (1500 kWh against 1200 kWh). It has fossil fuel consumption much higher than the province (Trapani) and region (Sicily), as shown in
Figure 11. The main reason is the inefficient transportation infrastructure.
Gasoline is principally used in the thermal electrical central station and covers about 81% of the total consumption while for the mobility sector it represents only 14%.
Pantelleria has subscribed to the Pact of Islands, in which insular mayors undertake the European objectives in order to reduce CO
2 emissions independently. The subsequent development of the “Plan of Action for Sustainable Energy Island” has allowed the planning of the development of RE, thus the island could represent an innovative sustainability model [
28].
The aim of this case study is the description of an interesting interconnection among renewable energy devices and new hydrogen bus. The study is divided into two sections: the first evaluates some renewable sources (solar, wind and wave) of Pantelleria while the second, according to its mobility plan, describes a hypothetical replacement for urban fleet with hydrogen vehicle.
5.1. Renewable Energy Sources: Solar, Wind and Wave Energy
Solar source is certainly one of the most promising ones, thanks to the possibility to exploit it everywhere. In the literature, we find some different studies about the evaluation and application of photovoltaic systems in the island of Pantelleria [
27,
28]. The use of photovoltaic (PV) technology could be a perfect choice, if we suppose the installation of PV panels in building’s roof, avoiding the use of the small island’s soil. Pantelleria solar radiation data show high annual solar radiation, about 1.69 MWh/(m
2 year), the monthly solar radiation is higher in summer season and lower in winter one. Thus, it has the same trend of the electrical energy request. Sansaverino et al. [
27] describe a possible scenario with the installation of 1.5 MW in the building’s roofs. The plant could produce 2440 MWh/year.
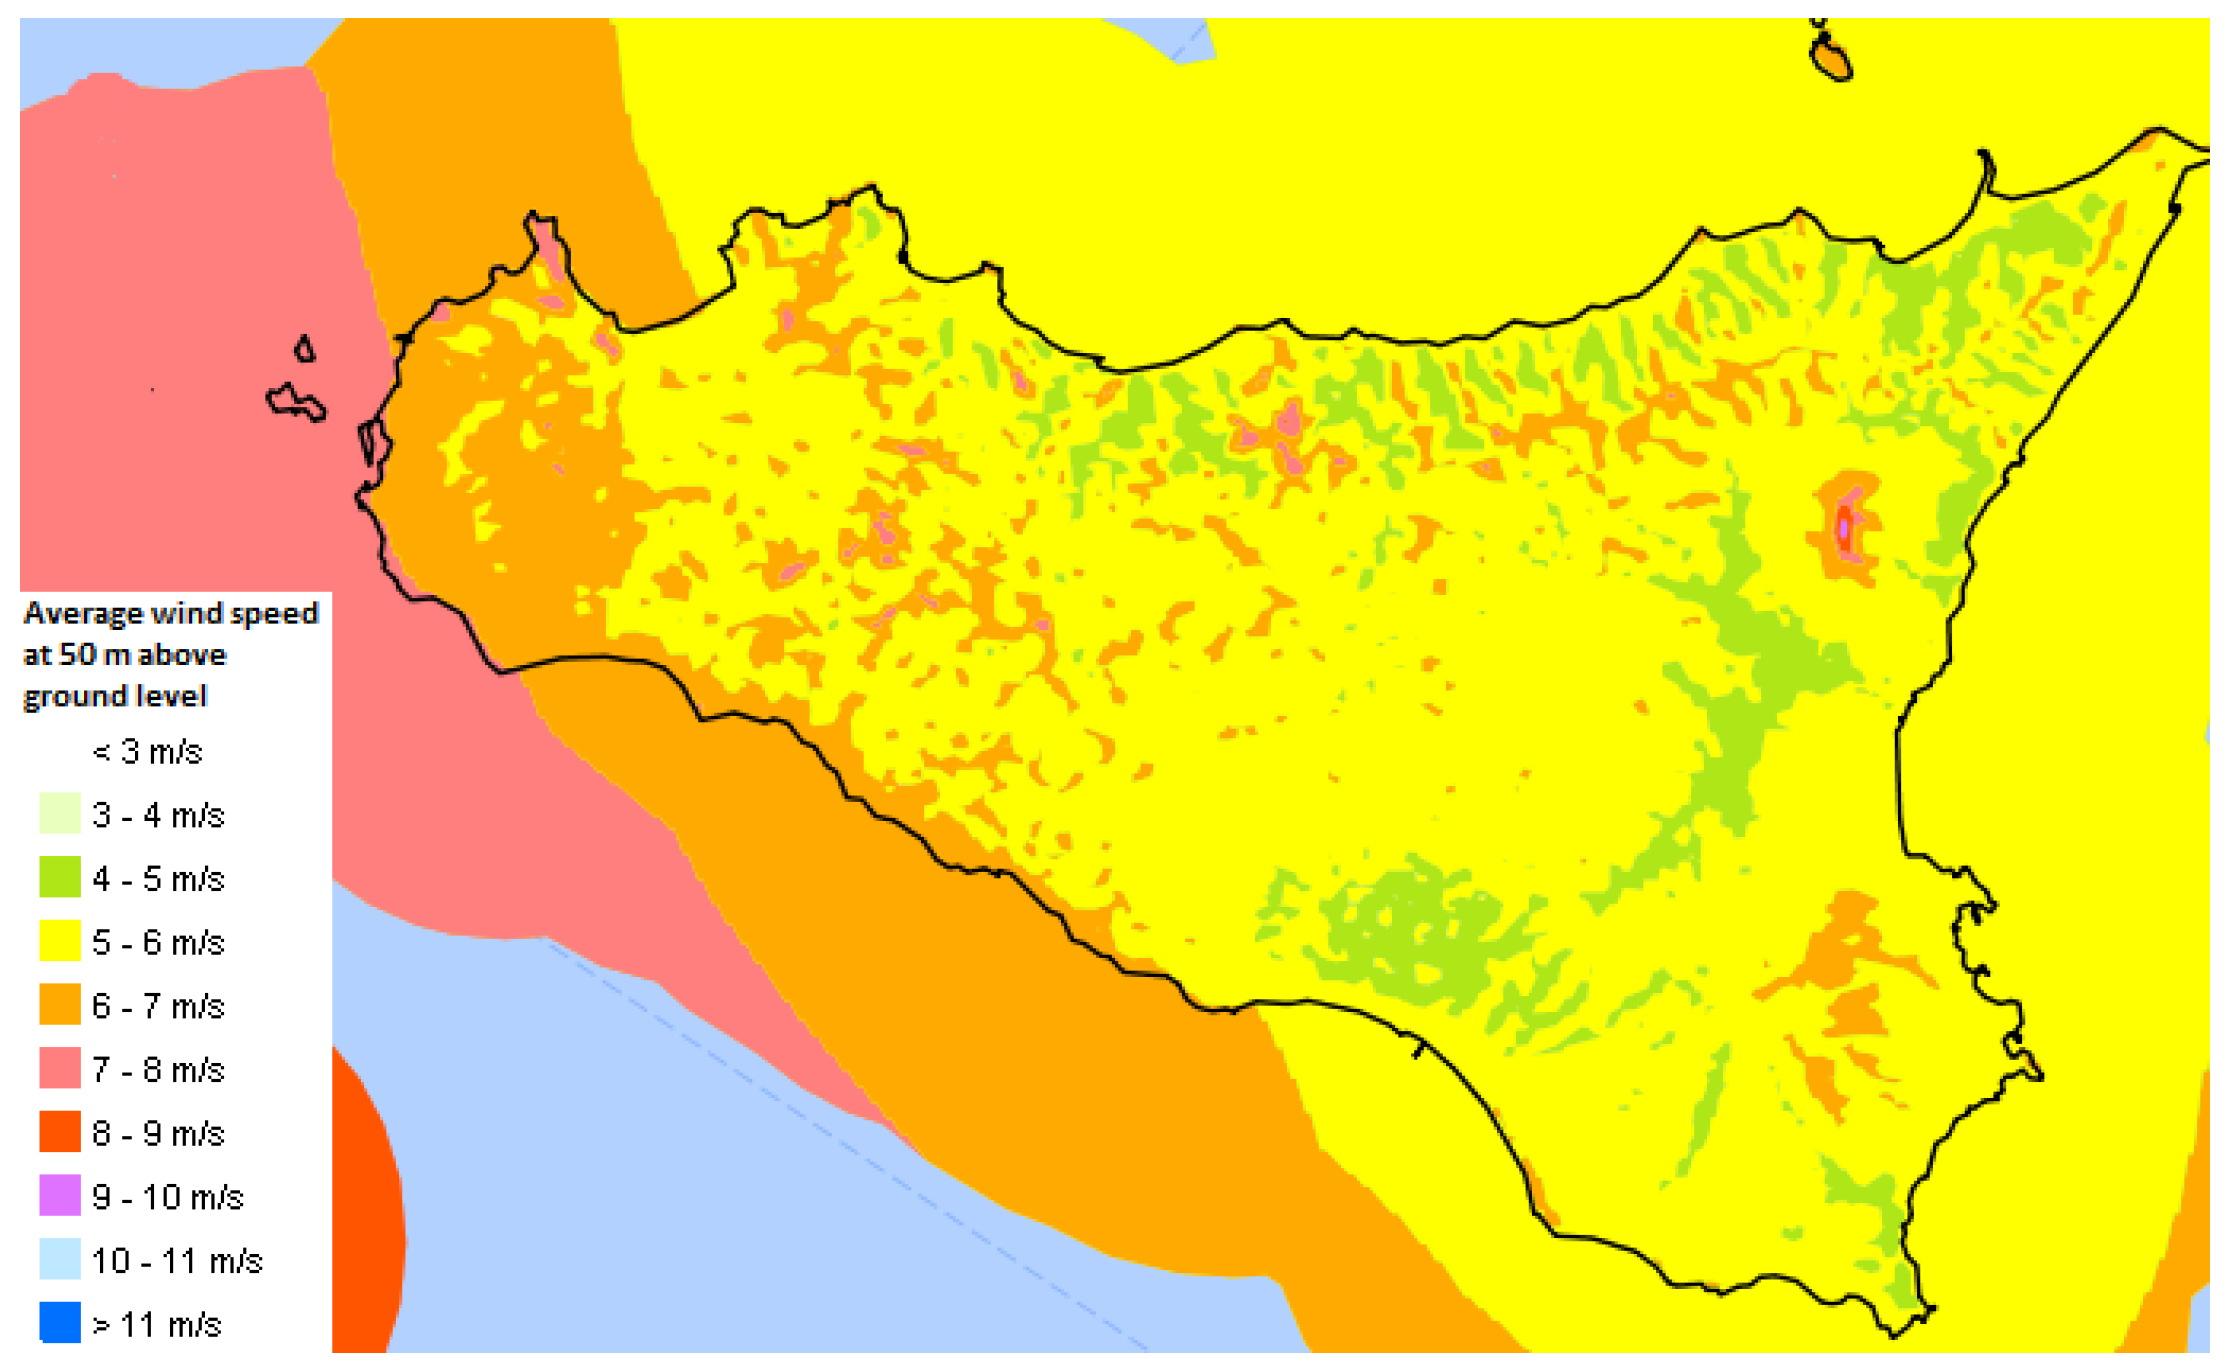
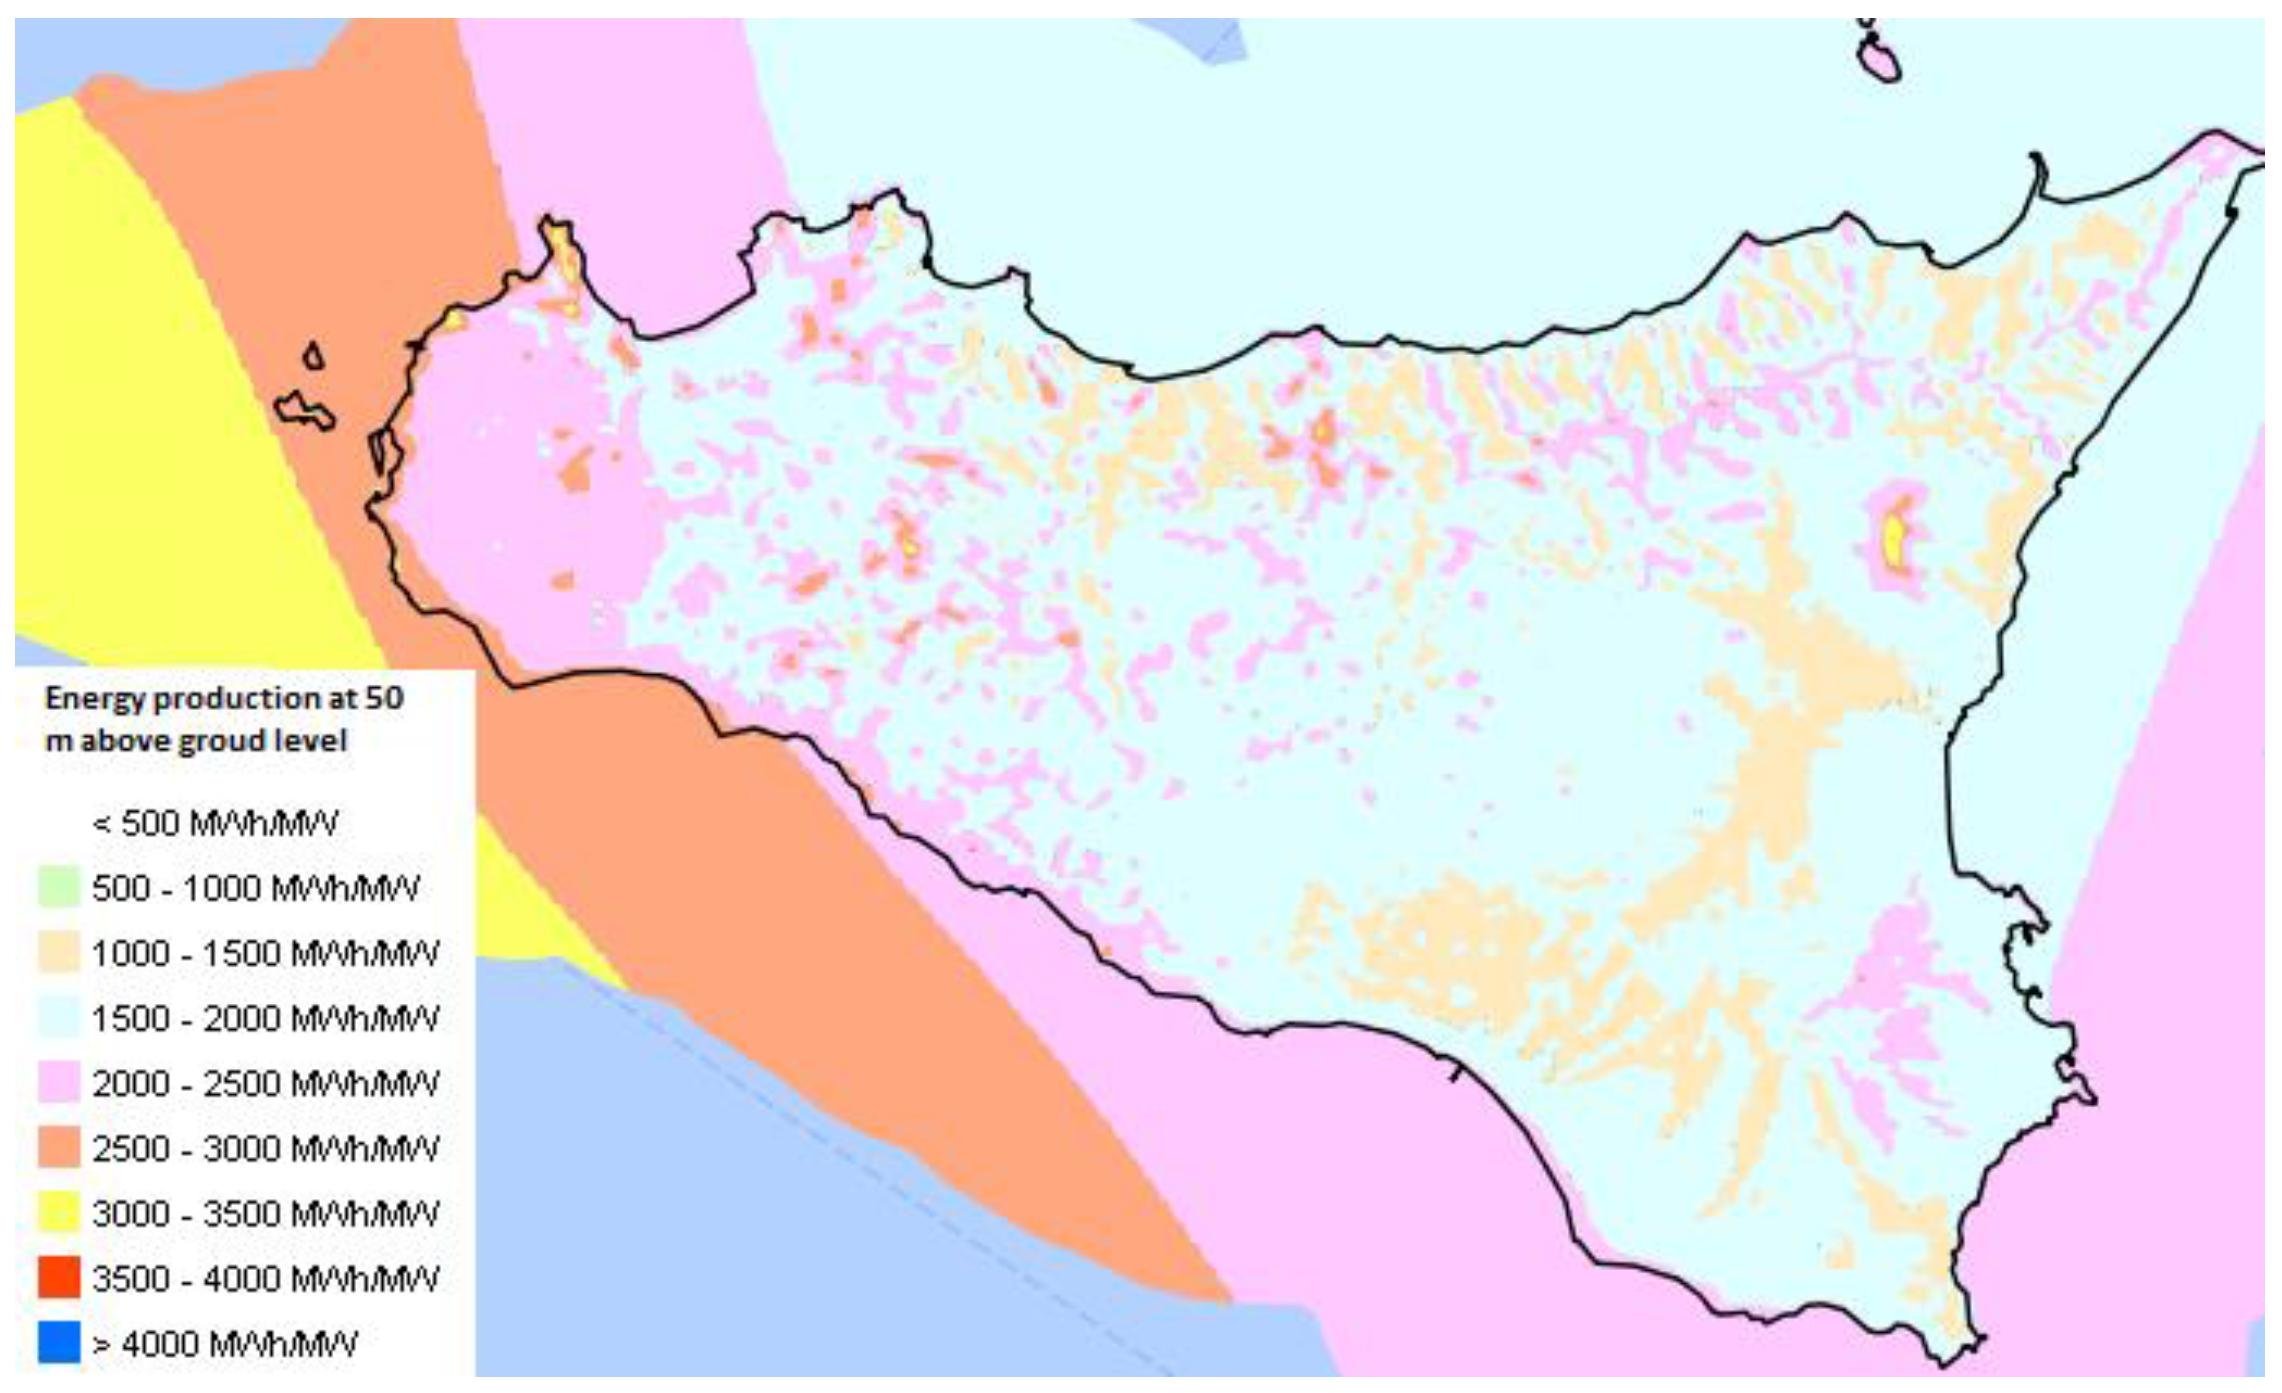
As regards the wind energy, the island of Pantelleria represents an appealing site thanks to its advantageous wind weather (see
Figure 12). The most suitable technology for the exploitation of wind power is the vertical axis wind turbine. The advantages are the capability to exploit wind source from every direction and easily integration in urban areas, while the main drawback is their lower conversion efficiency. For example, Sansaverino et al. [
27] analyze the installation of a 1.9 MW wind farm in Contrada Arenella, composed of 63 vertical axis wind generators characterized by a nominal power of 30 kW. In this context, the wind farm will be able to produce 3600 MWh/year.
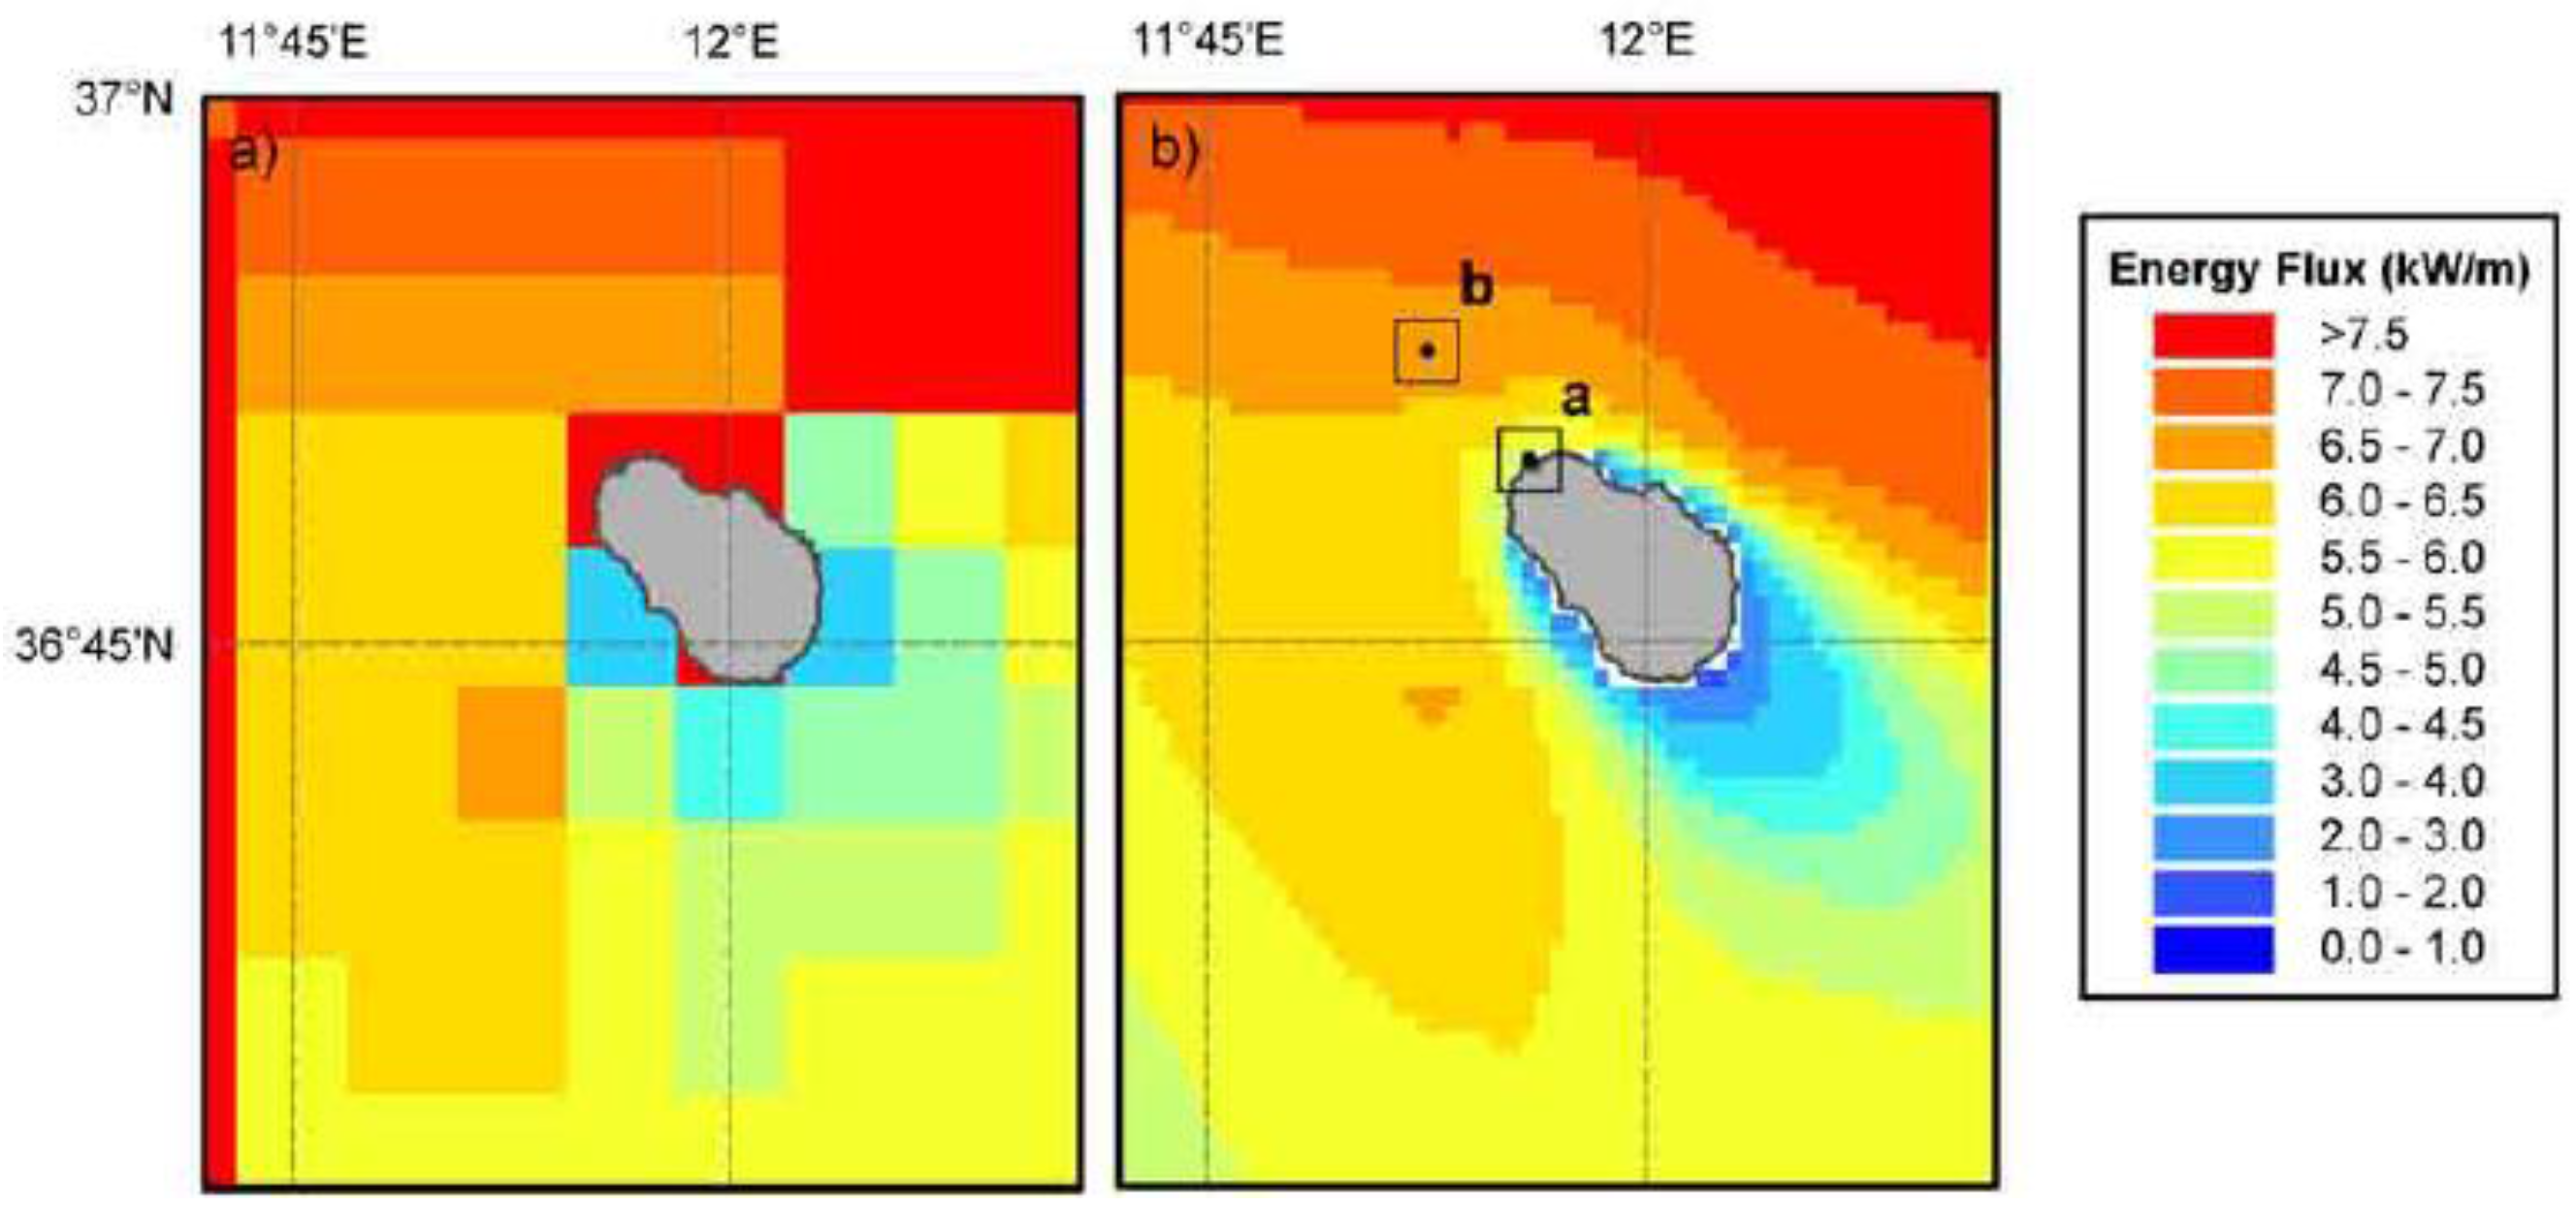
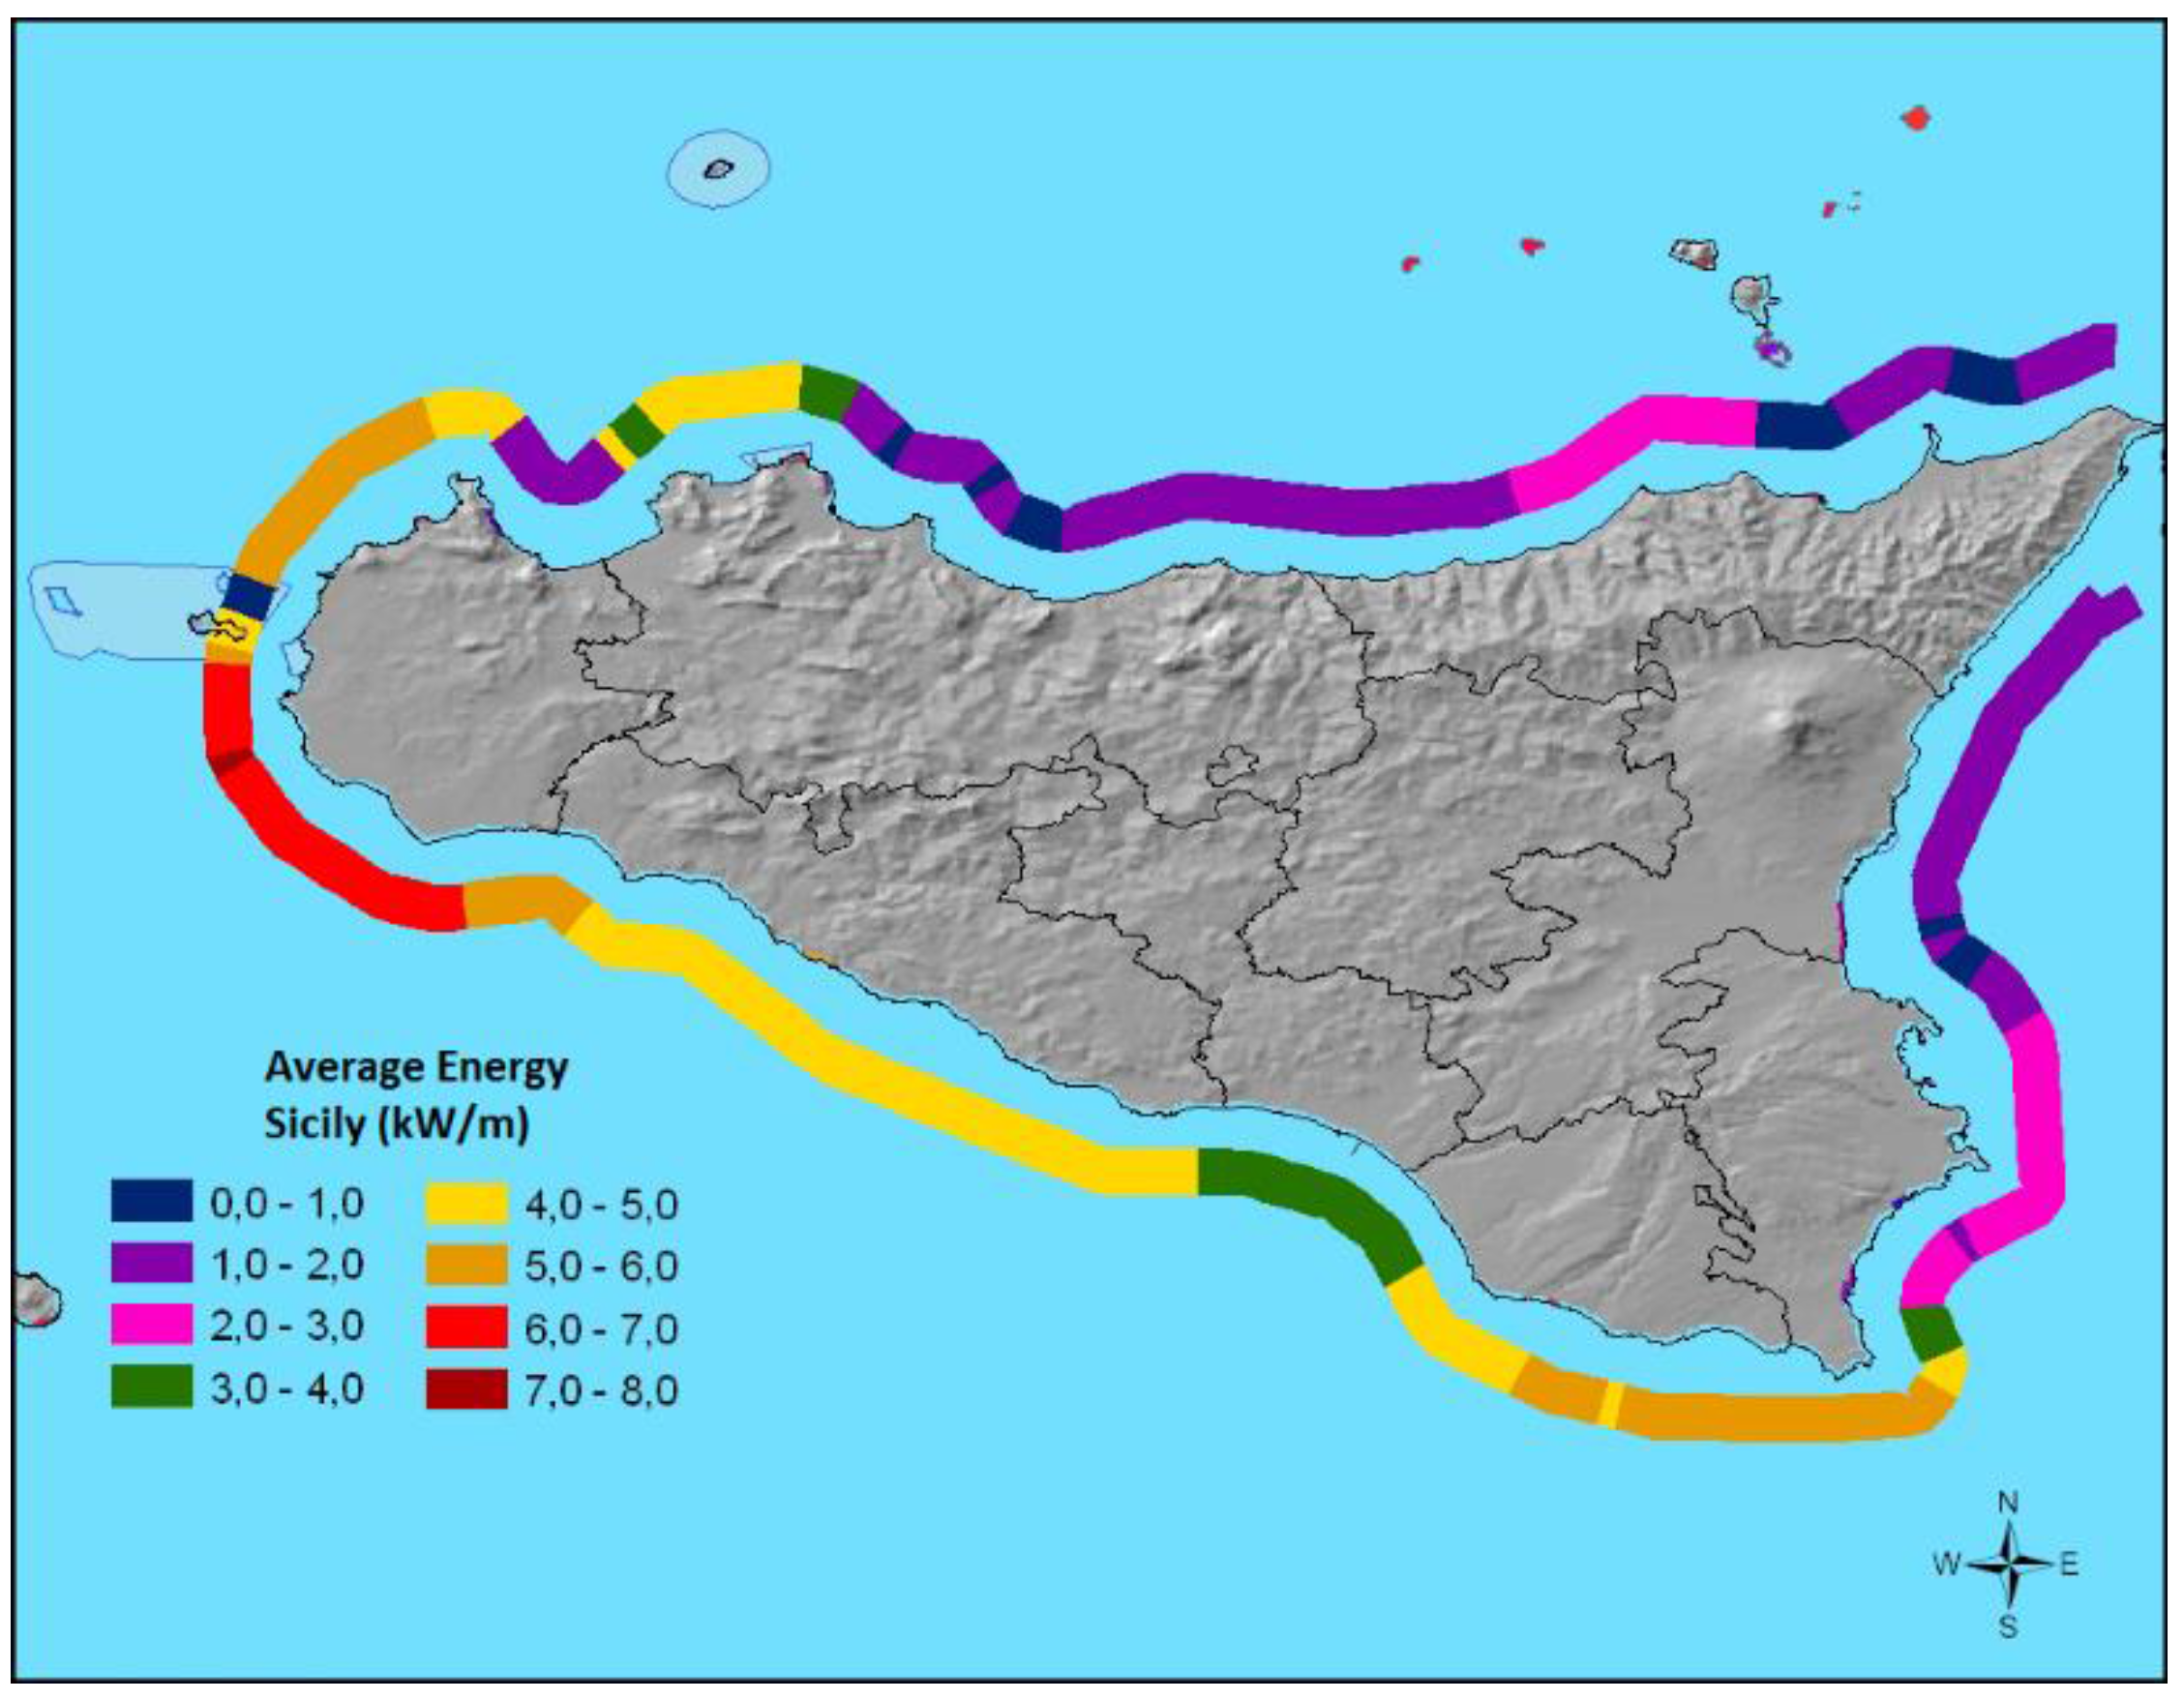
In conclusion, we study a possible integration of wave energy into the new electrical energy assessment of the island. Due to its strategic position in the Mediterranean Sea, the island of Pantelleria is a suitable site to produce electrical energy from the wave source [
28]. Several researches have shown the maximum annual energy depends on wave height, which in this location ranges from 1 m to 3 m. The average annual wave power estimated by [
29] is 7 kW/m (see
Figure 13).
In this work, to evaluate the electrical energy conversion, we adopt the devices mentioned above (
Section 3) and consider the installation of two wave farms for a gross power of 4.8 MW, producing about 7400 MWh/year. Every wave farm is composed of three arrays of 10 devices each, increasing their nominal power.
Table 8 summarizes all technical information of RES studied.
5.2. A Case Study of Transport Sector Renewal in the Island of Pantelleria
The energy consumption of Pantelleria’s lines is characterized by a marked seasonality linked to summer tourism. Considering the trend of monthly consumption of transport fuels, this is divided into a share related to domestic journeys of residents, and another share for tourists.
The government of the island has planned several actions to modify its own transport sector. In this context, actions to improve the spatial and temporal availability of public transport in rural areas, with sparse population or characterized by the absence of services, are evaluated.
As for the management of seasonal traffic flows, the creation of light transport services (bicycles and electric bicycles) that satisfy tourist needs, by taking visitor directly into key destinations is also evaluated.
One of the most interesting suggestions is a replacement or integration of diesel bus fleet to electrical or hydrogen vehicle.
The aim of this section is a description of possible scenarios of hydrogen buses driven by renewable energy.
Starting from the analysis of the internal transport system of the City of Pantelleria, it is possible to give information about a change of vehicle fleet. The construction of a new scenario allows you to evaluate the fuel consumption and greenhouse gas reduction.
Table 9 gives more detail about the urban transport in the island.
The suggestion proposed is a gradual exchange of urban fleet (10%, 50%, and 100%) driven by wave energy. The information used is connected to 2020. Assuming the same value of gasoline and hydrogen consumption found in the literature,
Table 10 summarizes this new scenario to 2020.
Assuming an average efficiency of 60%, the electrical energy value to produce 1 kg of H2 is 5965 kWh/kg of H2, so the total electrical energy demand for each possible rate (10%, 50% and 100%) is, respectively, 0.63 GWh, 3.16 GWh and 6.3 GWh. These values could be satisfied by renewable energy supply. In particular, some photovoltaic energy may cover the summer electrical demand (increased by tourism) while wind or wave energy is sufficient in the winter. These are the sustainable environmental solutions for the island and the real applications of European Programs.
6. Conclusions
The wind and sea wave energy availability in the Province of Trapani and smaller Sicilian islands (like Pantelleria) shows that the use of these resources for the electrolytic hydrogen production would allow replacing the entire fleet of urban buses powered by diesel with an equal number of hydrogen vehicles.
In Trapani’s case, according to the three different scenarios, the electrical demand of the electrolytic system, able to produce sufficient hydrogen for an innovative public bus fleet, could be satisfied by a wind farm composed of five turbines with a power of 850 kW each, and a wave farm composed at maximum of 108 DEIM WEC converter (60 in the case of a penetration rate of 75% and 10 in the case of 50%).
In Pantelleria’s case, electrical energy demand and fuel consumed are shown. Renewable sources (solar, wind and sea wave), analyzed previously, allow satisfying almost the entire energy demand.
The analysis on the avoided emissions shows the level of environmental performance associated with this type of solution and allows the conclusion that the orientation of these resources towards the production of electrolytic hydrogen is able to provide a valid response to the introduction, into urban transport, of feasible models with a strong environmental compatibility.
However, as first preliminary evaluation, in both case of studies the problem of energy balancing between demand and real production has not been given attention. This aspect, obviously, becomes very important, if the penetration rate of renewable resources increases, especially in small grids like Pantelleria. In order to solve this question, there are several paths to follow: First, a variegated mix of energy sources should be used, in order to compensate the fluctuations in energy production caused by alternation of seasons and daily weather conditions. For example, during the winter, sea wave and wind show a greater energy potential than in summer, which is the opposite of the solar radiation. Second, the hydrogen production could be used to compensate the mismatches between energy production and consumption. When the energy production exceeds consumption, the energy surplus can be used to produce hydrogen. Conversely, when the renewable energy production is not sufficient, hydrogen can be converted into electrical energy using fuel cells. These aspects will be better analyzed in future studies.


