Article

Optimal Site Selection of Tidal Power Plants Using a Novel Method: A Case in China

School of Economics and Management, North China Electric Power University, Beijing 102206, China
*
Author to whom correspondence should be addressed.
Energies 2016, 9(10), 832; https://doi.org/10.3390/en9100832
Submission received: 15 May 2016 / Revised: 19 September 2016 / Accepted: 26 September 2016 / Published: 19 October 2016
(This article belongs to the Special Issue Numerical Modelling of Wave and Tidal Energy)

Abstract

:
The site selection plays an important role in the entire life cycle of a tidal power plant (TPP) project. However, some problems decrease the evaluation quality of TPP site selection: (a) suitable and effective methods are scarce since the TPP site selection involves multiple forms of data; (b) there is no comprehensive evaluation index system due to the unilateralism of existing criteria. In this paper, we firstly propose a novel method based on interval number with probability distribution weighted operation and stochastic dominance degree. It takes all stakeholders’ preferences into consideration and can simultaneously deal with different forms of data in the TPP site selection; then, a comprehensive evaluation index system for TPP site selection is constructed on the basis of academic literature, feasibility research reports and expert opinions in different fields. It takes the factors of construction conditions, existing policies, social impacts as well as ecological and environmental impacts which reflects the inherent characteristics of TPP site selection fully into account. Finally, a Chinese case study is given to illustrate the applicability and effectiveness of the proposed method.

1. Introduction

Climate change presents a threat to ecosystems and human society [1]. In response to the urgent circumstances of global climate change, the Chinese government has made a commitment to reduce the levels of carbon dioxide emissions significantly during the coming years. In order to achieve this formidable task, it is imperative to develop renewable energy sources to replace conventional fuels since the use of coal in electricity generation is a major source of carbon dioxide in China. Among all forms of renewable energy which can be converted to electricity, tidal energy offers lots of advantages. It is not only a freely available and abundant source, but also one that is of nonpolluting, and predictable for as far into the future as it is necessary to consider [2]. Moreover, the longevity of tidal barrages is also a considerable advantage. Compared with the 40 year service life of a nuclear power plant and just 20 years of service life of a wind farm, a tidal barrage can last for 120 years. Developing tidal energy could not only help combat the greenhouse gas effect, but also alleviate the energy crisis in the regions of Eastern China. Tidal energy resources and the number of potential barrage sites in coastal provinces are given in Table 1. As can be seen from the table, the distribution of tidal energy is extremely uneven since nearly 87% of the national tidal energy is distributed in the East China coastal area (Zhejiang, Fujian Province and the north branch of the Yangtze River). At the same time, those areas demand large amounts of energy while the conventional resources are scarce, which significantly affects the socio-economic development of the regions. Thus the Chinese government is more concerned than ever about tidal energy, and the wish to develop TPP is stronger than before. However, how to select the optimal one from the 426 potential barrage sites (listed in Table 1) is a daunting challenge for decision-makers (DMs).
Numerous studies concerning tidal energy have been carried out in the past, mainly focusing on the following aspects: turbine technology [3,4,5,6], sediment transport simulation models [7,8,9,10] resource assessments [11,12,13], and cost-benefit analysis [14,15]. It can be seen that many scholars have paid considerable attention to tidal energy in the recent years, however, compared with the aforementioned aspects, valid researches on TPP site selection are rare. Rainey [16] selected the optimum location for a tidal power barrage from the point of view of electricity generation, but he did not study the social, ecological and environmental impacts of TPP, which must be considered in the TPP site selection. Due to the lack of research on TPP site selection, some problems concerning this issue remain unsolved.
First of all, an effective and suitable method has not been proposed. Due to the increasing complexity of objects and the restriction of measuring technology and the inherent vagueness of human thinking, the TPP site selection data is usually heterogeneous. The vagueness of human thinking means that human beings cannot express their opinions as accurately as machines when describing a complex object, and vagueness and uncertainty always exist in the mode of thinking. Some criteria values can be measured definitely and expressed by real numbers, while some criteria values are usually expressed by random numbers due to the restriction of measuring and forecasting technology. However, for the criteria which are affected by multiple factors, it’s difficult to obtain their values by measurement methods. In practice, it’s common to ask several experts to evaluate them according to their experience. Because of the inherent vagueness of human thinking, the value is generally expressed by an interval number rather than real number [17,18]. Thus interval number forms are usually used simultaneously to express the criteria values of alternatives. Multi-criteria decision making (MCDM) is a well-known branch of decision-making, which aims to find the most suitable solutions from a set of alternatives under multiple criteria conditions [19]. A lot of methods have been developed to deal with MCDM problems with interval numbers or random numbers, respectively [20,21,22,23,24,25,26]. However, for real-world decisions where several forms of number are used simultaneously, methods for a single form of number are helpless.
Besides that, in real-world decision situations, DMs are just the agents of all stakeholders. The decision should be made based on the preference of all stakeholders, but not the agents’. In such cases, the elicitation of a unique probability or utility function may be difficult and its usage is questionable [27]. One well-regarded method for comparing two alternatives with uncertain utility information is via the idea of stochastic dominance (SD). As a method for comparing two alternatives with uncertain information, the SD rule has many advantages. It takes the differences of stakeholders’ utility functions into account and compares the expected utility of alternatives pairwise. What’s more, it only makes minimal assumptions regarding utility function, and makes no assumptions at all with respect to the particular probability distributions of returns [28]. However, the disadvantages of the method are also obvious. First of all, SD rules have strong conditions and generally a SD relation between two alternatives does not exist [29]. Then SD relations are qualitative rather than quantitative. The verification of SD relations is not sufficient to accept strict preference if the alternatives differ insignificantly [30].
Secondly, no work exists on integrating a series of criteria into an evaluation index system. Many scholars merely discussed some part of the factors which influence the site selection of TPP. For example, Hooper and Austen [31] provided a detailed review of the current understanding of the potential ecological and social impacts of tidal barrages, and gave a discussion of strategies for mitigating barrage impacts; Xia et al. [32] mainly studied the hydrodynamic impact of three proposed tidal power projects; Fedorov and Shilin [33] analyzed basic factors of TPP’s influence exerted on the coastal ecosystems. However, the TPP site selection is a MCDM issue [34], which is collectively affected by various factors. Thus a comprehensive index system for TPP site selection must be constructed urgently.
To address these problems, a novel MCDM method based on interval number with probability distribution (INPD) weighted operation and stochastic dominance degree (SDD) is proposed to select an optimal TPP site. INPD is a uniform form of real number, interval number and random number. Under certain conditions, it can be degraded to the three forms of number. Using INPD, we can calculate and rank the three forms of number with the same method. Moreover, the newly proposed SDD definition overcomes the defects in traditional SD rules. It can measure the degree of SD and ASD and it has clear economic meaning. For real numbers, interval numbers and random numbers, the results derived from SDD are all consistent with those derived from traditional methods. Compared with existing methods, the new method can better cope with different forms of number in the TPP site selection, and produce a precise dominance degree for every alternative, which is helpful to make correct decisions. In addition, a comprehensive evaluation index system of TPP is established by referring to the relative academic literature, feasibility research reports and expert opinions in different fields. These consist of construction conditions, existing policies, societal, as well as ecological and environmental aspects associated with a total of 22 sub-criteria.
The rest of this paper are organized as follows: the next section elaborates the basic theory of INPD and SDD. The index system and decision framework for the TPP site selection are presented in Section 3. In the Section 4, the description of prospective TPP sites in China after the preselection phase is given. 
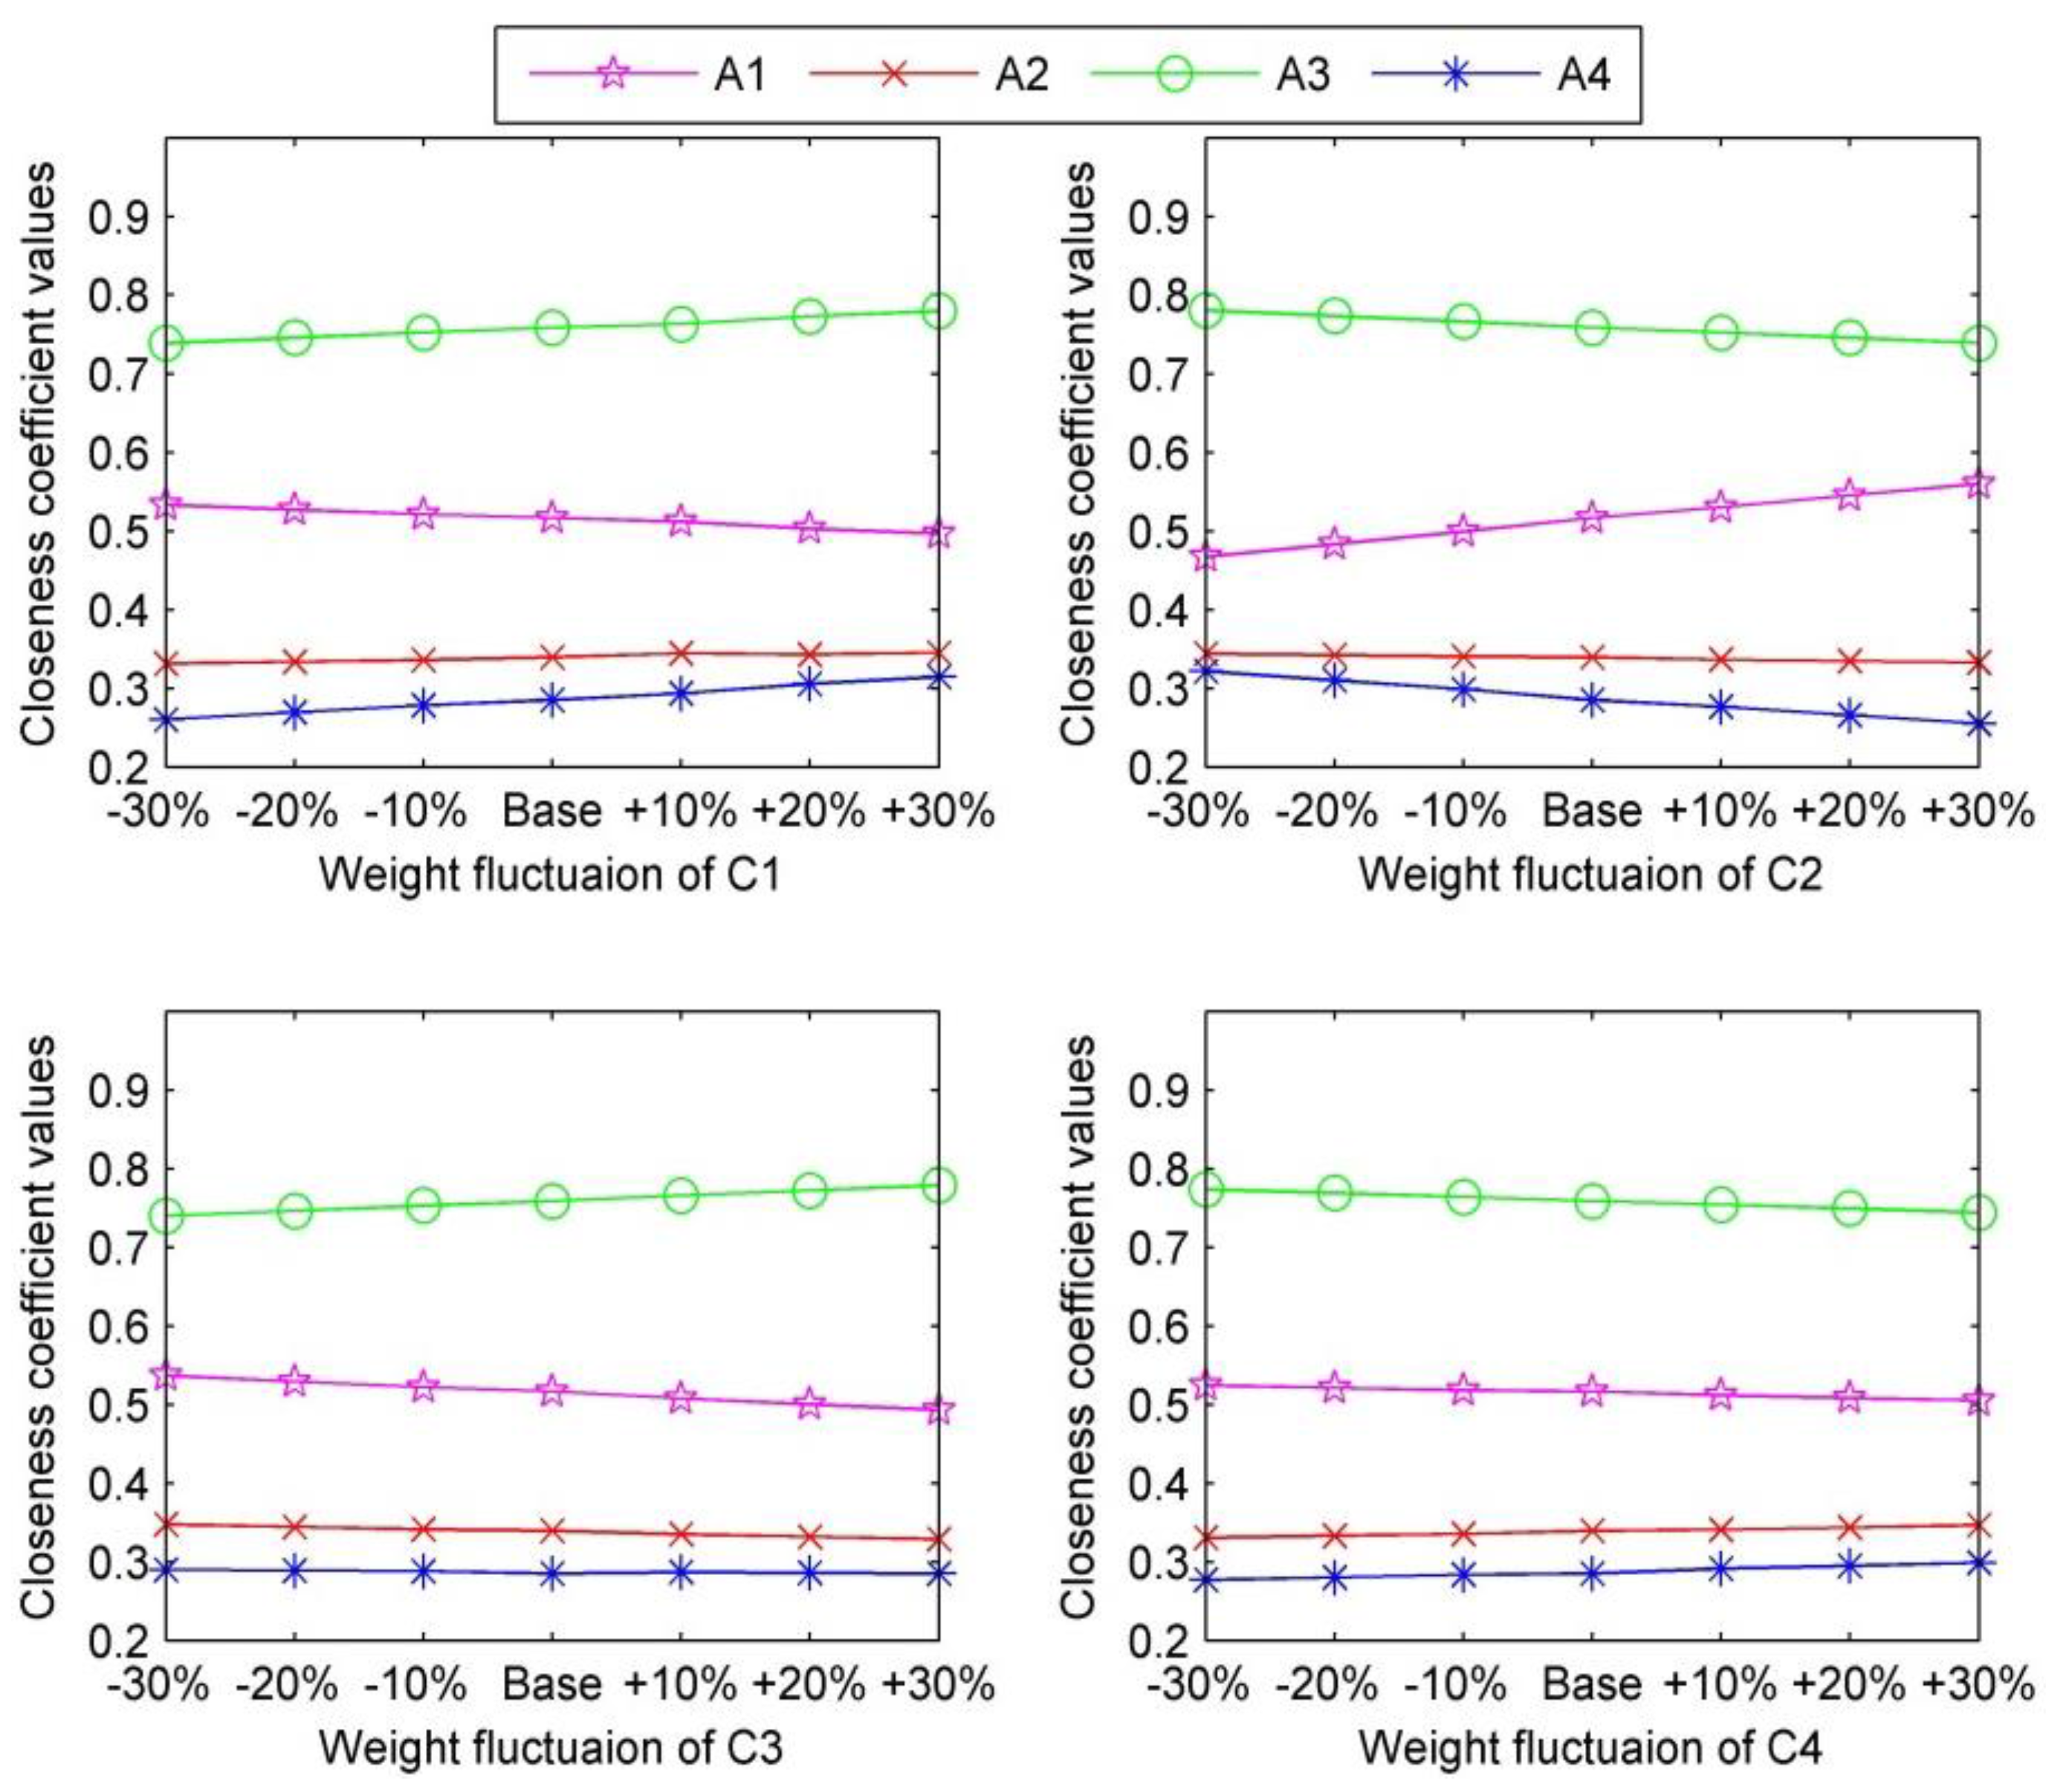
Section 5 performs the optimal TPP site selection by employing the Technique for Order Preference by Similarity to an Ideal Solution (TOPSIS) method based on INPD and SDD, then a result analysis and sensitivity analysis are also carried out. Section 6 conducts a comparative analysis. In the last section (Section 7), the conclusions are provided.

2. INPD and SDD Methods for TPP Site Selection

2.1. Preliminaries

In TPP site selection, the evaluations of the alternatives are expressed in three different forms: real numbers, interval numbers and random numbers. However, methods which can deal with the three forms of number are scarce. In this section, we firstly propose the definition of interval number with probability distribution. The real number, interval number and random number can be deemed as special forms of INPD. Then, a new definition of stochastic dominance degree based on almost stochastic dominance is presented to compare and order any two INPD. Finally, a TOPSIS-based method is proposed to solve the TPP site selection problem.

2.1.1. Interval Numbers with Probability Distribution

Definition 1.
Let a l and a u be two real numbers, a l a u . Let X be a random variable supported on [ a l , a u ] , and f ( x ) be the probability density function of X , where a l a u f ( x ) d x = 1 , then ( [ a l , a u ] , f ( x ) ) is called an interval number with probability distribution (INPD). Hereinafter, a ˜ is used to denote ( [ a l , a u ] , f ( x ) ) for brevity.
Especially, when the closed interval [ a l , a u ] is extended to ( , + ) , INPD degrades to a random number. When the distribution function f ( x ) is a uniform distribution, INPD degrades to an interval number. When a l = a u , INPD degrades to a real number. According to the principles of joint probability distribution, we proposed the basic operations of INPD.
Definition 2.
Let a ˜ = ( [ a l , a u ] , f 1 ( x 1 ) ) , b ˜ = ( [ b l , b u ] , f 2 ( x 2 ) ) be two INPD, λ R , then:
a ˜ b ˜ = ( [ a l + b l , a u + b u ] , f ( x ) )
a ˜ b ˜ = ( [ min ( a l b l , a l b u , a u b l , a u b u ) , max ( a l b l , a l b u , a u b l , a u b u ) ] , f ( x ) )
λ a ˜ = ( [ λ a l , λ a u ] , f ( x λ ) )
where f ( x ) = x 1 x 2 = x f 1 ( x 1 ) f 2 ( x 2 ) d x 1 d x 2 , f ( x ) = x 1 + x 2 = x f 1 ( x 1 ) f 2 ( x 2 ) d x 1 d x 2 .
In the above operations, INPD is seen as an extension of the concept of a real number and a numerical value. However, in practice, INPD can also be thought of as the uncertain opinions given by DM. In such case, set operations are more suitable, so another two operations are given as follows:
Definition 3.
Let a ˜ = ( [ a l , a u ] , f 1 ( x 1 ) ) , b ˜ = ( [ b l , b u ] , f 2 ( x 2 ) ) be two INPD, then:
a ˜ b ˜ = ( [ a l , a u ] [ b l , b u ] , f ( x ) )
where f ( x ) = f 1 ( x ) + f 2 ( x ) 2 , f ( x ) = { f 1 ( x 1 ) ε 1 + f 2 ( x 2 ) ε 2 2 [ a l , a u ] [ b l , b u ] ϕ 0 [ a l , a u ] [ b l , b u ] = ϕ , ε 1 , ε 2 is the conversion coefficient, ε 1 = [ a l , a h ] f 1 ( x 1 ) [ a l , a u ] [ b l , b u ] f 1 ( x 1 ) , ε 2 = [ b l , b h ] f 2 ( x 2 ) [ a l , a u ] [ b l , b u ] f 2 ( x 2 ) .
It is easy to know that the results of the above operations are still INPD. Based on the above INPD operations, three INPD weighted operators are proposed to aggregate DMs’ options expressed by INPD.
Definition 4.
Let a ˜ i = ( [ a i l , a i u ] , f i ( x i ) ) , i = 1 , 2 , , n be a collection of INPD; ω = ( ω 1 , ω 2 , , ω n ) T is the weight vector of a ˜ i ( i = 1 , 2 , , n ) , with ω i [ 0 , 1 ] and i = 1 n ω i = 1 , then:
INPDWCP ω ( a ˜ 1 , a ˜ 2 , , a ˜ n ) = ( [ i = 1 n ω i a i l , i = 1 n w i a i u ] , f INPDWCP ( x ) )
INPDWA ω ( a ˜ 1 , a ˜ 2 , , a ˜ n ) = ( i = 1 n [ a i l , a i u ] , f INPDWA ( x ) )
INPDWCS ω ( a ˜ 1 , a ˜ 2 , , a ˜ n ) = ( i = 1 n [ a i l , a i u ] , f INPDWCS ( x ) )
where f INPDWCP ( x ) = i = 1 n w i x i = x i = 1 n f i ( x i ) d x 1 d x 2 d x n ; f INPDWA ( x ) = i = 1 n f i ( x i ) ω i ; f INPDWCS ( x ) = { i = 1 n f i ( x i ) ω i ε i i = 1 n [ a i l , a i u ] 0 i = 1 n [ a i l , a i u ] = ; ε i ( i = 1 , 2 , , n ) is the conversion coefficient, with ε i = [ a i l , a i u ] f i ( x i ) i = 1 n [ a i l , a i u ] f i ( x i ) . The three weighted operators are respectively called interval numbers with probability distribution weighted compromise operator (INPDWCP), interval numbers with probability distribution weighted acceptance operator (INPDA) and interval numbers with probability distribution weighted consensus operator (INPDWCS).

2.1.2. Almost Stochastic Dominance and Stochastic Dominance Degree

SD rules are used to identify SD relations for pairwise comparisons of alternatives under uncertain environment conditions. They are robust analytical tools for solving decision making problems under uncertainty [35,36] and have been applied in economics and finance [37,38,39] because of less restrictive assumptions. As one method for solving uncertain problems, SD rules have proven extremely useful [30,40,41,42]. However, its disadvantage is also obvious. SD rules are so strict that the SD relation between two alternatives does not exist sometimes, and it would be difficult to obtain a clear ranking of alternatives. In standard SD rules, some utility functions are deemed “extreme” and do not represent the preferences of any real-world DM. Leshno and Levy [43] suggested that we should rule out such utility functions. They defined the concept of almost stochastic dominance (ASD). It’s a form of SD which holds for most, but not all, of the utility functions in a given class. Leshno and Levy’s ASD was defined as follows:
Definition 5.
Let X and Y be two random variables, F ( x ) and G ( x ) be the cumulative distribution functions of X and Y , respectively, [ a , b ] ( < a < b < ) be the finite support of cumulative distributions, where a and b are the most extreme limits on our distributions of returns. For every 0.5 < ε < 1 : let U ( ε ) a l m o s t include all the utility functions u for which u ( x ) 0 and u ( x ) inf { u ( x ) } [ ε 1 ε ] : F ( x ) ε Almost stochastic dominance G ( x ) ( F ( x ) > ε A S D G ( x ) ) , if and only if:
(i) 
E F ( u ( X ) ) E G ( u ( Y ) ) for all u U a l m o s t ( ε ) , or
(ii) 
S [ G ( x ) F ( x ) ] d x ε F G ;
where S ( F , G ) = { x [ a , b ] : F ( t ) < G ( t ) } and F G = a b | F ( x ) G ( x ) | d x .
The core idea of ASD is to relax the strict restrictions on distribution functions by eliminating some extreme utility functions, and to obtain the dominance relation held by almost all DMs. For decision making problems, the elimination of utility functions is actually the elimination of the DMs with these utility functions or the DMs who may not support the dominance relation. According to the “elimination” concept of ASD, we can state the following proposition:
Proposition 1.
Let ε 1 = S 1 [ G ( x ) F ( x ) ] d x F G , ( 0.5 < ε 1 < 1 ) , for all stakeholders whose utility function u U 1 a l m o s t ( ε 1 ) , they hold E F ( u ( X ) ) E G ( u ( Y ) ) , namely X dominate Y .
Note that when ε approaches 0.5, the set U a l m o s t contains risk-neutral utilities only, when ε approaches 1, the set U a l m o s t approaches “all” utility functions. This implies that the closer ε gets to 0.5, the fewer DMs hold utility function u U a l m o s t , or the fewer DMs hold X dominates Y . And the closer ε gets to 1, the more DMs hold X dominate Y . The value of ε reflects the number of people who hold X dominate Y . The more people hold X dominate Y , we should believe the better X than Y . Therefore, we choose ε as an indicator with respect to the merit of alternatives.
On the other hand, mean is also a simple and time-honored indicator taken from financial applications to measure the value of uncertain number. Many methods, such as mean-variance and mean-semi variance, regard mean as an important indicator to judge priority of alternatives. Although the introduction of utility function makes expected utility and mean unequal, there is still positive correlation between them. Especially when some extreme utility functions are excluded, the correlation increases further. Therefore, we choose mean as the other indicator. The new stochastic dominance degree were defined based on the above two aspects.
Definition 6.
If F ( x ) > S D G ( x ) (either almost or standard), then the stochastic dominance degree (SDD) of F ( x ) > S D G ( x ) (denoted as D ( F ( x ) > S D G ( x ) ) ) is given by:
D ( F ( x ) > S D G ( x ) ) = ε [ E F ( X ) E G ( X ) ]
where ε = S [ G ( x ) F ( x ) ] d x F G , 0.5 < ε < 1 . Hereinafter, D ( F ( x ) > S D G ( x ) ) is abbreviated as D F G for brevity.
Note that, when ε = 1 , ASD is reduced to standard SD. The SDD is defined as D F G = E F ( X ) E G ( X ) . When ε = 0.5 , E F ( X ) E G ( X ) = 0 , the SDD is 0.

2.2. Proposed Methodology

Consider a TPP site selection problem. Let A = { A 1 , A 2 , A m } ( m 2 ) be a discrete set of alternatives, and C = { C 1 , C 2 , , C n } be the set of criteria, w = ( w 1 , w 2 , , w n ) T is the weight vector of the criteria, with 0 w j 1 and j = 1 n w j = 1 . Let D = { d 1 , d 2 , , d t } be a group of DMs, and λ = ( λ 1 , λ 2 , , λ t ) T be the weight vector of DMs, where 0 λ k 1 , k = 1 n λ k = 1 . Suppose that R ˜ i j k = ( r ˜ i j k ) m × n = ( [ r i j k l , r i j k u ] , f ( x ) i j k ) m × n is the INPD decision matrix, where r ˜ i j k is an INPD, provided by the DM d k for the alternative A i with respect to the criteria C j . The problem concerned is to rank alternatives or to select the most desirable alternatives among a finite set A based on a decision matrix R ˜ i j k ( k = 1 , 2 , , t ) , criteria weight vector w and DM weight vector λ .
Step 1: Calculate the normalized decision matrix.
The normalized values n i j l , n i j u and f n ( x ) i j are calculated as
n i j k l = r i j k l i = 1 m [ ( r i j k l ) 2 + ( r i j k u ) 2 ] ; ( i = 1 , 2 , , m ; j = 1 , 2 , , n ; k = 1 , 2 , t )
n i j k u = r i j k u i = 1 m [ ( r i j k l ) 2 + ( r i j k u ) 2 ] ; ( i = 1 , 2 , , m ; j = 1 , 2 , , n ; k = 1 , 2 , t )
f n ( x ) i j k = f ( i = 1 m [ ( r i j k l ) 2 + ( r i j k u ) 2 ] x ) i j k ; ( i = 1 , 2 , , m ; j = 1 , 2 , , n ; k = 1 , 2 , t )
The normalization method mentioned above is to preserve the property that the ranges of normalized interval numbers belong to [0, 1].
Step 2: Construct the weighted normalized interval decision matrix as:
v i j k l = w j n i j k l ; ( i = 1 , 2 , , m ; j = 1 , 2 , , n ; k = 1 , 2 , t )
v i j k u = w j n i j k u ; ( i = 1 , 2 , , m ; j = 1 , 2 , , n ; k = 1 , 2 , t )
f v ( x ) i j k = f n ( x w j ) i j k ; ( i = 1 , 2 , , m ; j = 1 , 2 , , n ; k = 1 , 2 , t )
Step 3: Utilize the INPD weighted operators (INPDWCP, INPDWCS or INPDWA) and DMs’ weighting vector λ to derive the collective overall INPD decision matrix V ˜ i j = ( v ˜ i j ) m × n = ( INPDW λ ( v ˜ i j 1 , v ˜ i j 2 , , v ˜ i j t ) ) m × n .
Step 4: Calculate the SDD that an alternative dominates another by Definition 15, set up SDD matrix D j = ( D a b j ) m × n for each criteria, where D a b j denote the SDD of alternative A a dominates A b with respect to the criteria C j .
Step 5: Identify positive ideal solution and negative ideal solution as:
A + = { v 1 + , v 2 + , v n + } = { ( max i   v ˜ i j | j O ) , ( min i   v ˜ i j | j I ) }
A = { v 1 , v 2 , v n } = { ( min i   v ˜ i j | j O ) , ( max i   v ˜ i j | j I ) }
where O is associated with benefit criteria, and I is associated with cost criteria.
Step 6: Calculate the separation of each alternative from positive ideal solution and negative ideal solution. The separation of each alternative for each criterion from the ideal solution can be defined as
d i j + = { ( D ( v j + > S D v ˜ i j ) | j O ) , ( D ( v j + > S D v ˜ i j ) | j I ) } ; ( i = 1 , 2 , , m )
d i j = { ( D ( v j + > S D v ˜ i j ) | j O ) , ( D ( v j + > S D v ˜ i j ) | j I ) } ; ( i = 1 , 2 , , m )
Then the separation of each alternative from the positive and negative ideal solution, using the n-dimensional Minkowski distance, can be currently calculated as
d i + = j = 1 n ( d i j + ) p 1 p
d i = j = 1 n ( d i j ) p 1 p
Step 7: Calculate the relative closeness to the ideal solution. The relative closeness of the alternative A j with respect to A + is defined as
Ψ i = d i d i + d i +
Step 8: Rank the preference order of all alternatives according to the closeness coefficient.

3. Index System and Decision Framework for the TPP Site Selection

3.1. Index System for the TPP Site Selection

The process of site selection not only simply considers the power generation capacity, but also takes the social, ecological and environmental implications as well as local existing policies into consideration. In light of the academic literature, feasibility research reports and expert opinions in different fields, the criteria and sub-criteria of TPP site selection are established and listed in Table 2. The first two criteria reflect the impacts of various local conditions on the TPP, the last two criteria are the impacts induced by the TPP after completion. The analysis of these criteria and sub-criteria is given in Appendix A.
TPP site selection involves evaluating and selecting the optimal one through comparing the alternatives against a series of qualitative and quantitative criteria. The sub-criteria values can be divided into three forms: real numbers, random numbers and interval numbers. The first two forms of criteria are quantitative criteria, while the last one is qualitative criteria: (1) Real number. Those criteria are C12, C14, C16, C17, C18, C19, C21, C22, C23, C44 and C45. The value of such criteria can be measured definitely and expressed by a real number; (2) Random number. Due to the restriction of measuring and forecasting technology, the values of criteria C11, C13 and C31 is usually expressed by random numbers; (3) Interval number. For the criteria C15, C32, C33, C34, C41, C42, C43 and C46 which are affected by multiple factors, it’s difficult to obtain their values by measurement methods, so it’s common to invite a group of experts, whose academic backgrounds are hydrology, policy/legislation, engineering, renewable energy, social, economic and environmental fields, to score those criteria with respect to the four alternatives to reduce the subjectivity of any expert as much as possible. Because of the inherent vagueness of human thinking, experts generally express their preferences or assessments by using interval numbers rather than real numbers.

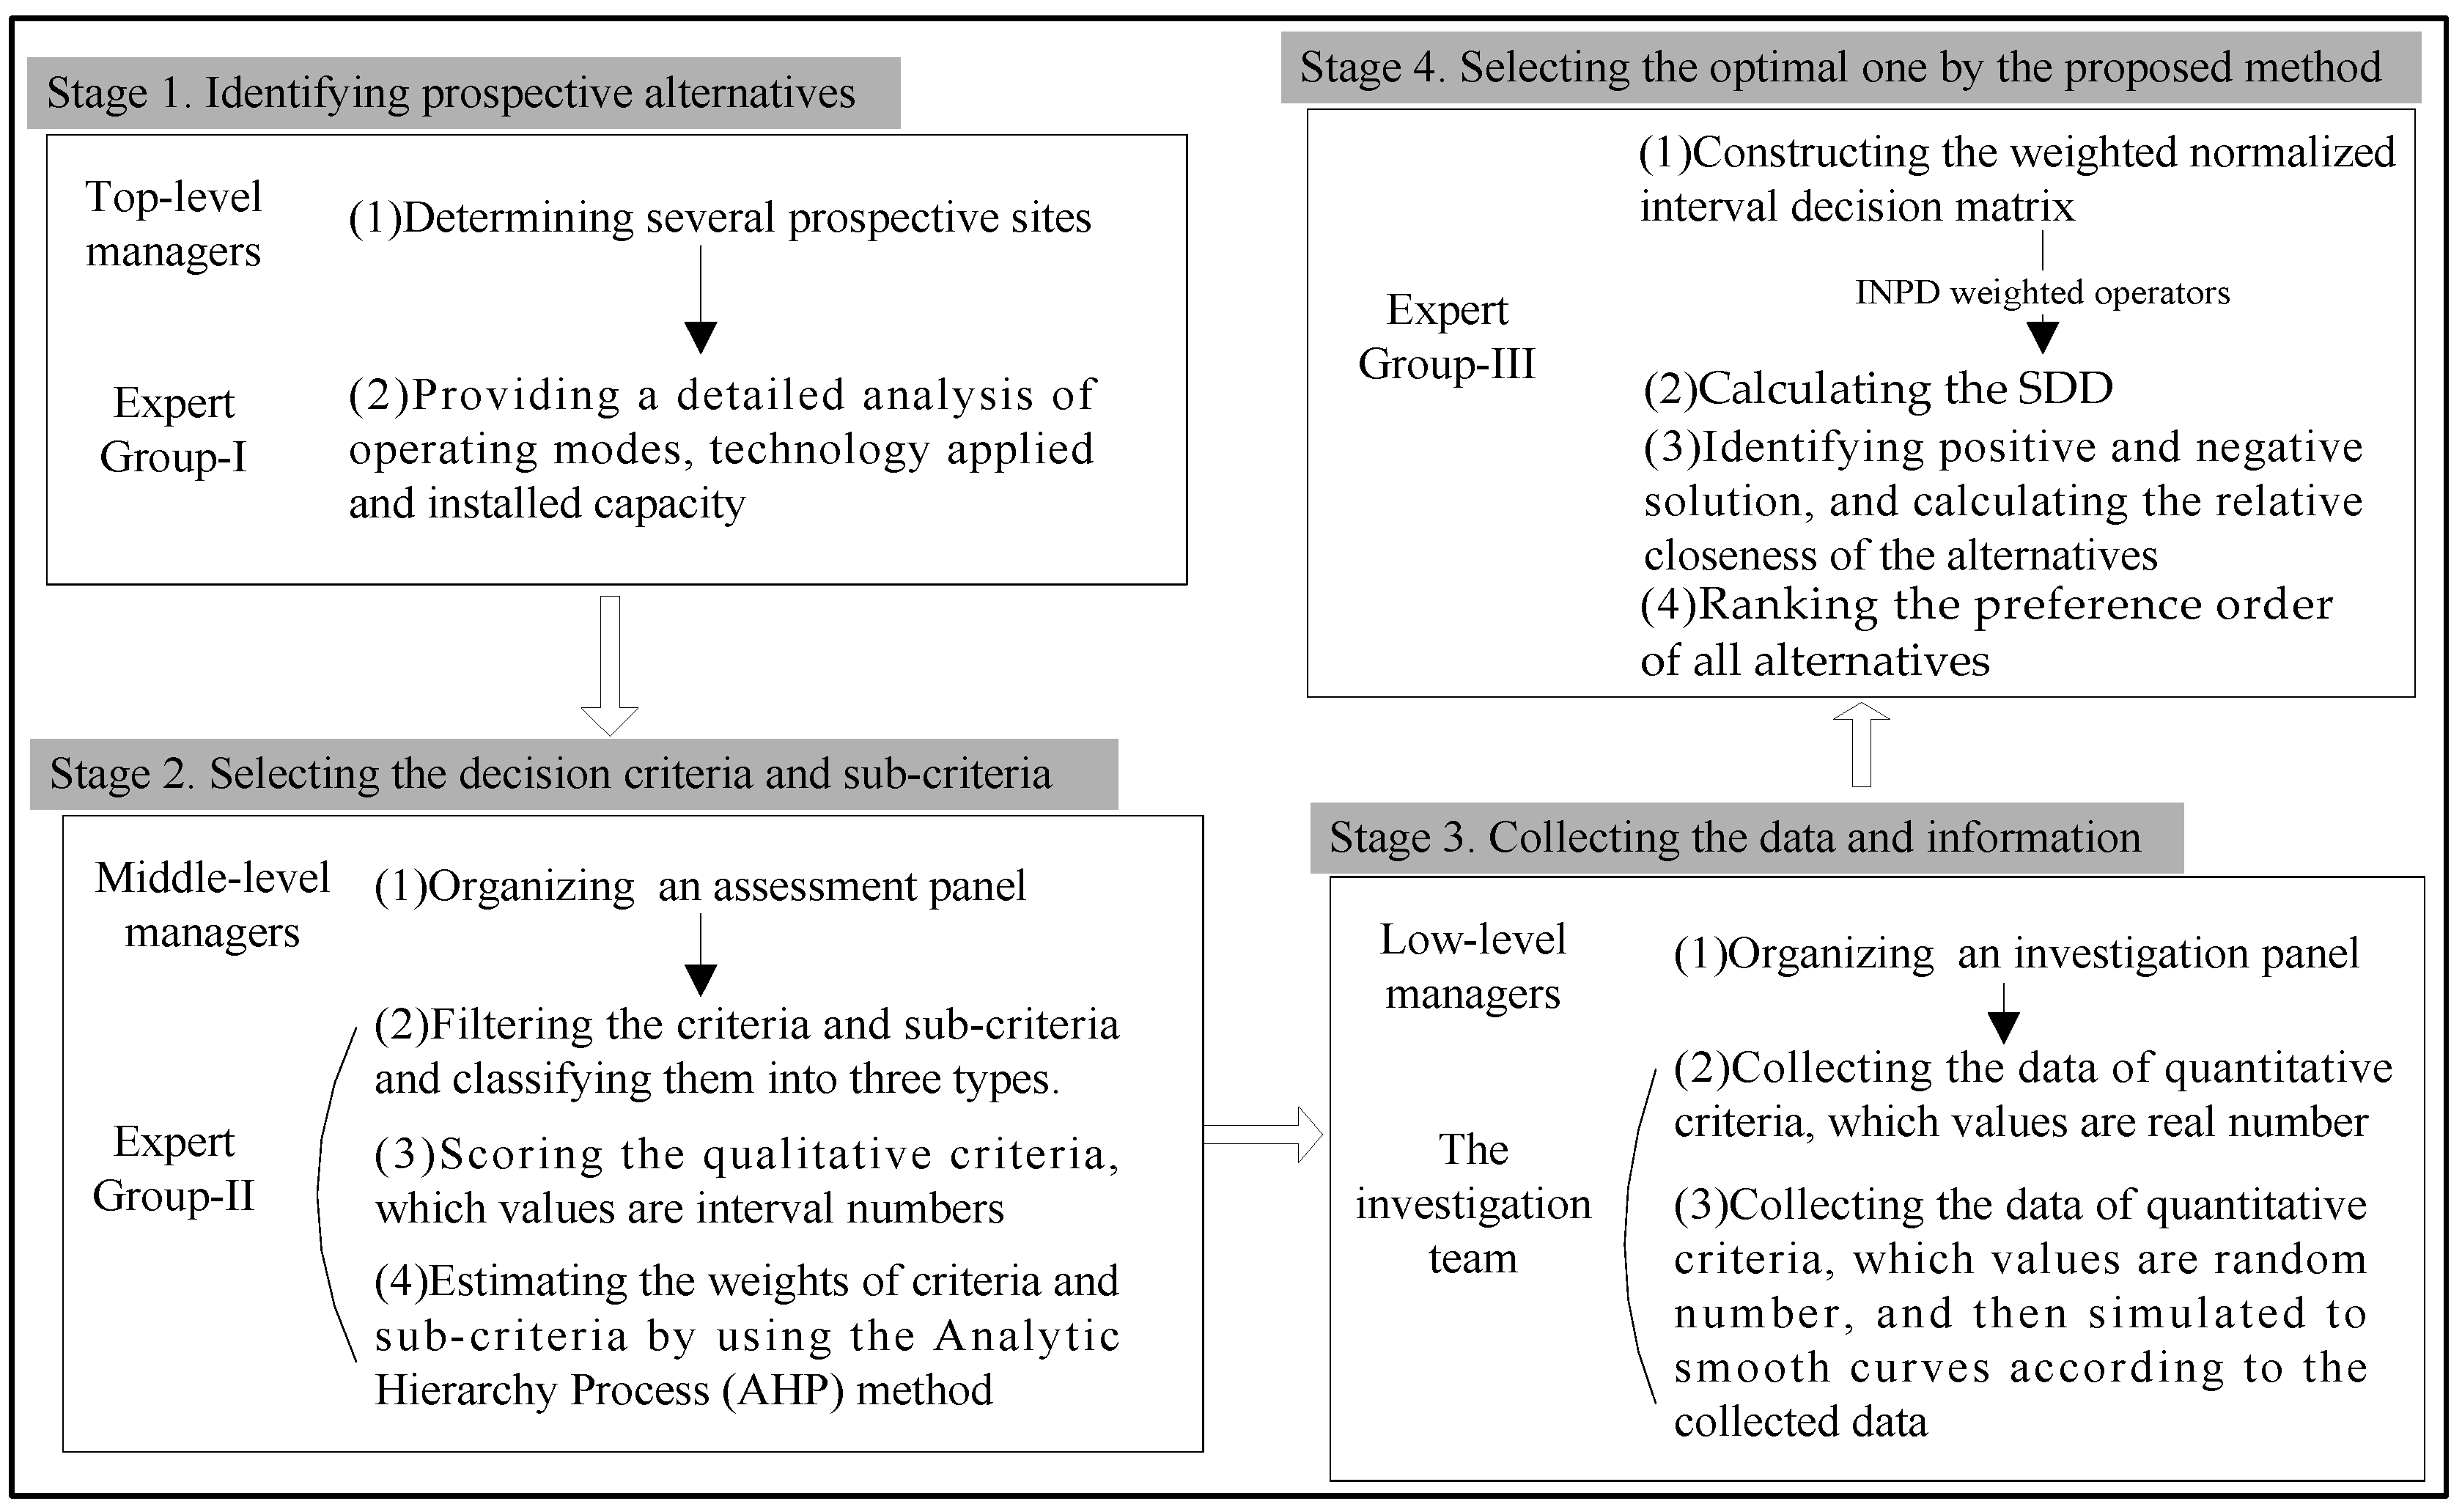
3.2. Decision Framework for the TPP Site Selection

In this section, a four-stage decision framework for the TPP site selection is presented in Figure 1, which not only suits TPP selection in China, but for TPP selection in other regions. Moreover, because most studies neglected the managerial idea and lacked practical operability, this decision framework combines the method in this paper with the decisions of project managers.
A review and decision committee (hereafter referred to as committee) consisting of different level project managers who have rich experience in TPP management and three expert groups whose academic backgrounds are hydrology, policy/legislation, engineering, renewable energy, social, economic and environmental fields is set up.
Stage 1: Identifying prospective alternatives
In the first stage, the top-level managers should take the electricity demand, economic conditions and natural conditions into account to identify several prospective sites. The objective of this stage is to eliminate inferior sites leaving a number of “qualified” sites. The benefits would be twofold: (1) the complexity and difficulty of decision-making can be reduced partly; (2) nonsense and useless work can be avoided. After that, expert group-I should make a thorough investigation of the prospective sites, and then provide a detailed analysis of operating modes, technology applied and installed capacity.
Stage 2: Selecting the decision criteria and sub-criteria
In the second stage, an assessment panel should be organized among the middle-level managers. The assessment panel, which is made up of experts in group II, has three tasks: (1) Filtering the criteria and sub-criteria for TPP site selection from the index system. Some criteria should be screened out since the values of them are nearly same with respect to some sites; (2) Scoring the qualitative criteria which values are interval numbers; (3) Estimating the weights of criteria and sub-criteria by using the AHP method.
Stage 3: Collecting the data and information
In the third stage, an investigation team should be organized among the lower-level managers. The investigation team mainly gathers the data and information for the criteria, which values are real numbers and random numbers.
Stage 4: Selecting the optimal one by the proposed method
Expert group-III is responsible for calculating the ranking result by the proposed method. The specific calculation process is as follows: (1) Constructing the weighted normalized interval decision matrix based on the normalized decision matrix; (2) Utilizing the INPD weighted operators and weighting vector λ of DMs to derive the collective overall INPD decision matrix; (3) Calculating the SDD, and setting up the SDD matrix for each criterion; (4) Identifying positive ideal solution and negative ideal solution, and calculating the separation of each alternative from the positive ideal solution and negative ideal solution; (5) Calculating the relative closeness to the ideal solution; (6) Ranking the preference order of all alternatives; (7) Selecting the optimal one.

4. Description of Prospective TPP Sites in China

4.1. Preselection Phase

It has been mentioned previously that there are total 426 potential barrage sites in China’s coastal areas complying with the basic requirements of the establishment of TPP, so it is a complex and challenging task for top-level managers to select the optimal one from among so many alternatives. Besides it is impossible to collect a large amount of data for every potential site. Thus, the preselection phase is extremely necessary which improve the efficiency and quality of decision making. The screening procedure indicates the following:
(1) Zhejiang and Fujian provinces are the primary development areas for establishing a TPP. The reasons are as follows: (a) the best tidal energy resources are located in Fujian and Zhejiang provinces [44]; (b) the fossil fuel resourced in the two provinces is scarce, so billions of tons coal are transported there from the north provinces of China, which increases the transport pressure of railways; (c) the electricity demand is extremely high due to the rapid development of the economy in the two provinces. In view of the above points, Zhejiang and Fujian provinces are selected as priority areas to build a TPP. Thus, the number of potential barrage sites could be reduced to 161 (73 + 88).
(2) After the construction and successful operation of the Jiangxia TPP, the key scientific and technical problems of building and running a TPP in China were basically solved. In order to build large-scale TPPs in the future, a middle-scale test TPP with an installed capacity of about 10 4 × kW - class is required at present. There are only 13 potential TPP sites that meet this requirement [45].
(3) Excellent natural conditions are required, which are listed as follows: (a) avoid military activity areas and military facilities area as much as possible; (b) the mean tidal range has to be higher than 3 m; (c) the average sediment concentration has to be lower than 0.5 kg/m3; (d) avoid large faults, landslide and other unstable area.
Only four TPP sites meet the excellent natural condition requirements and are the four entering the data collection stage.

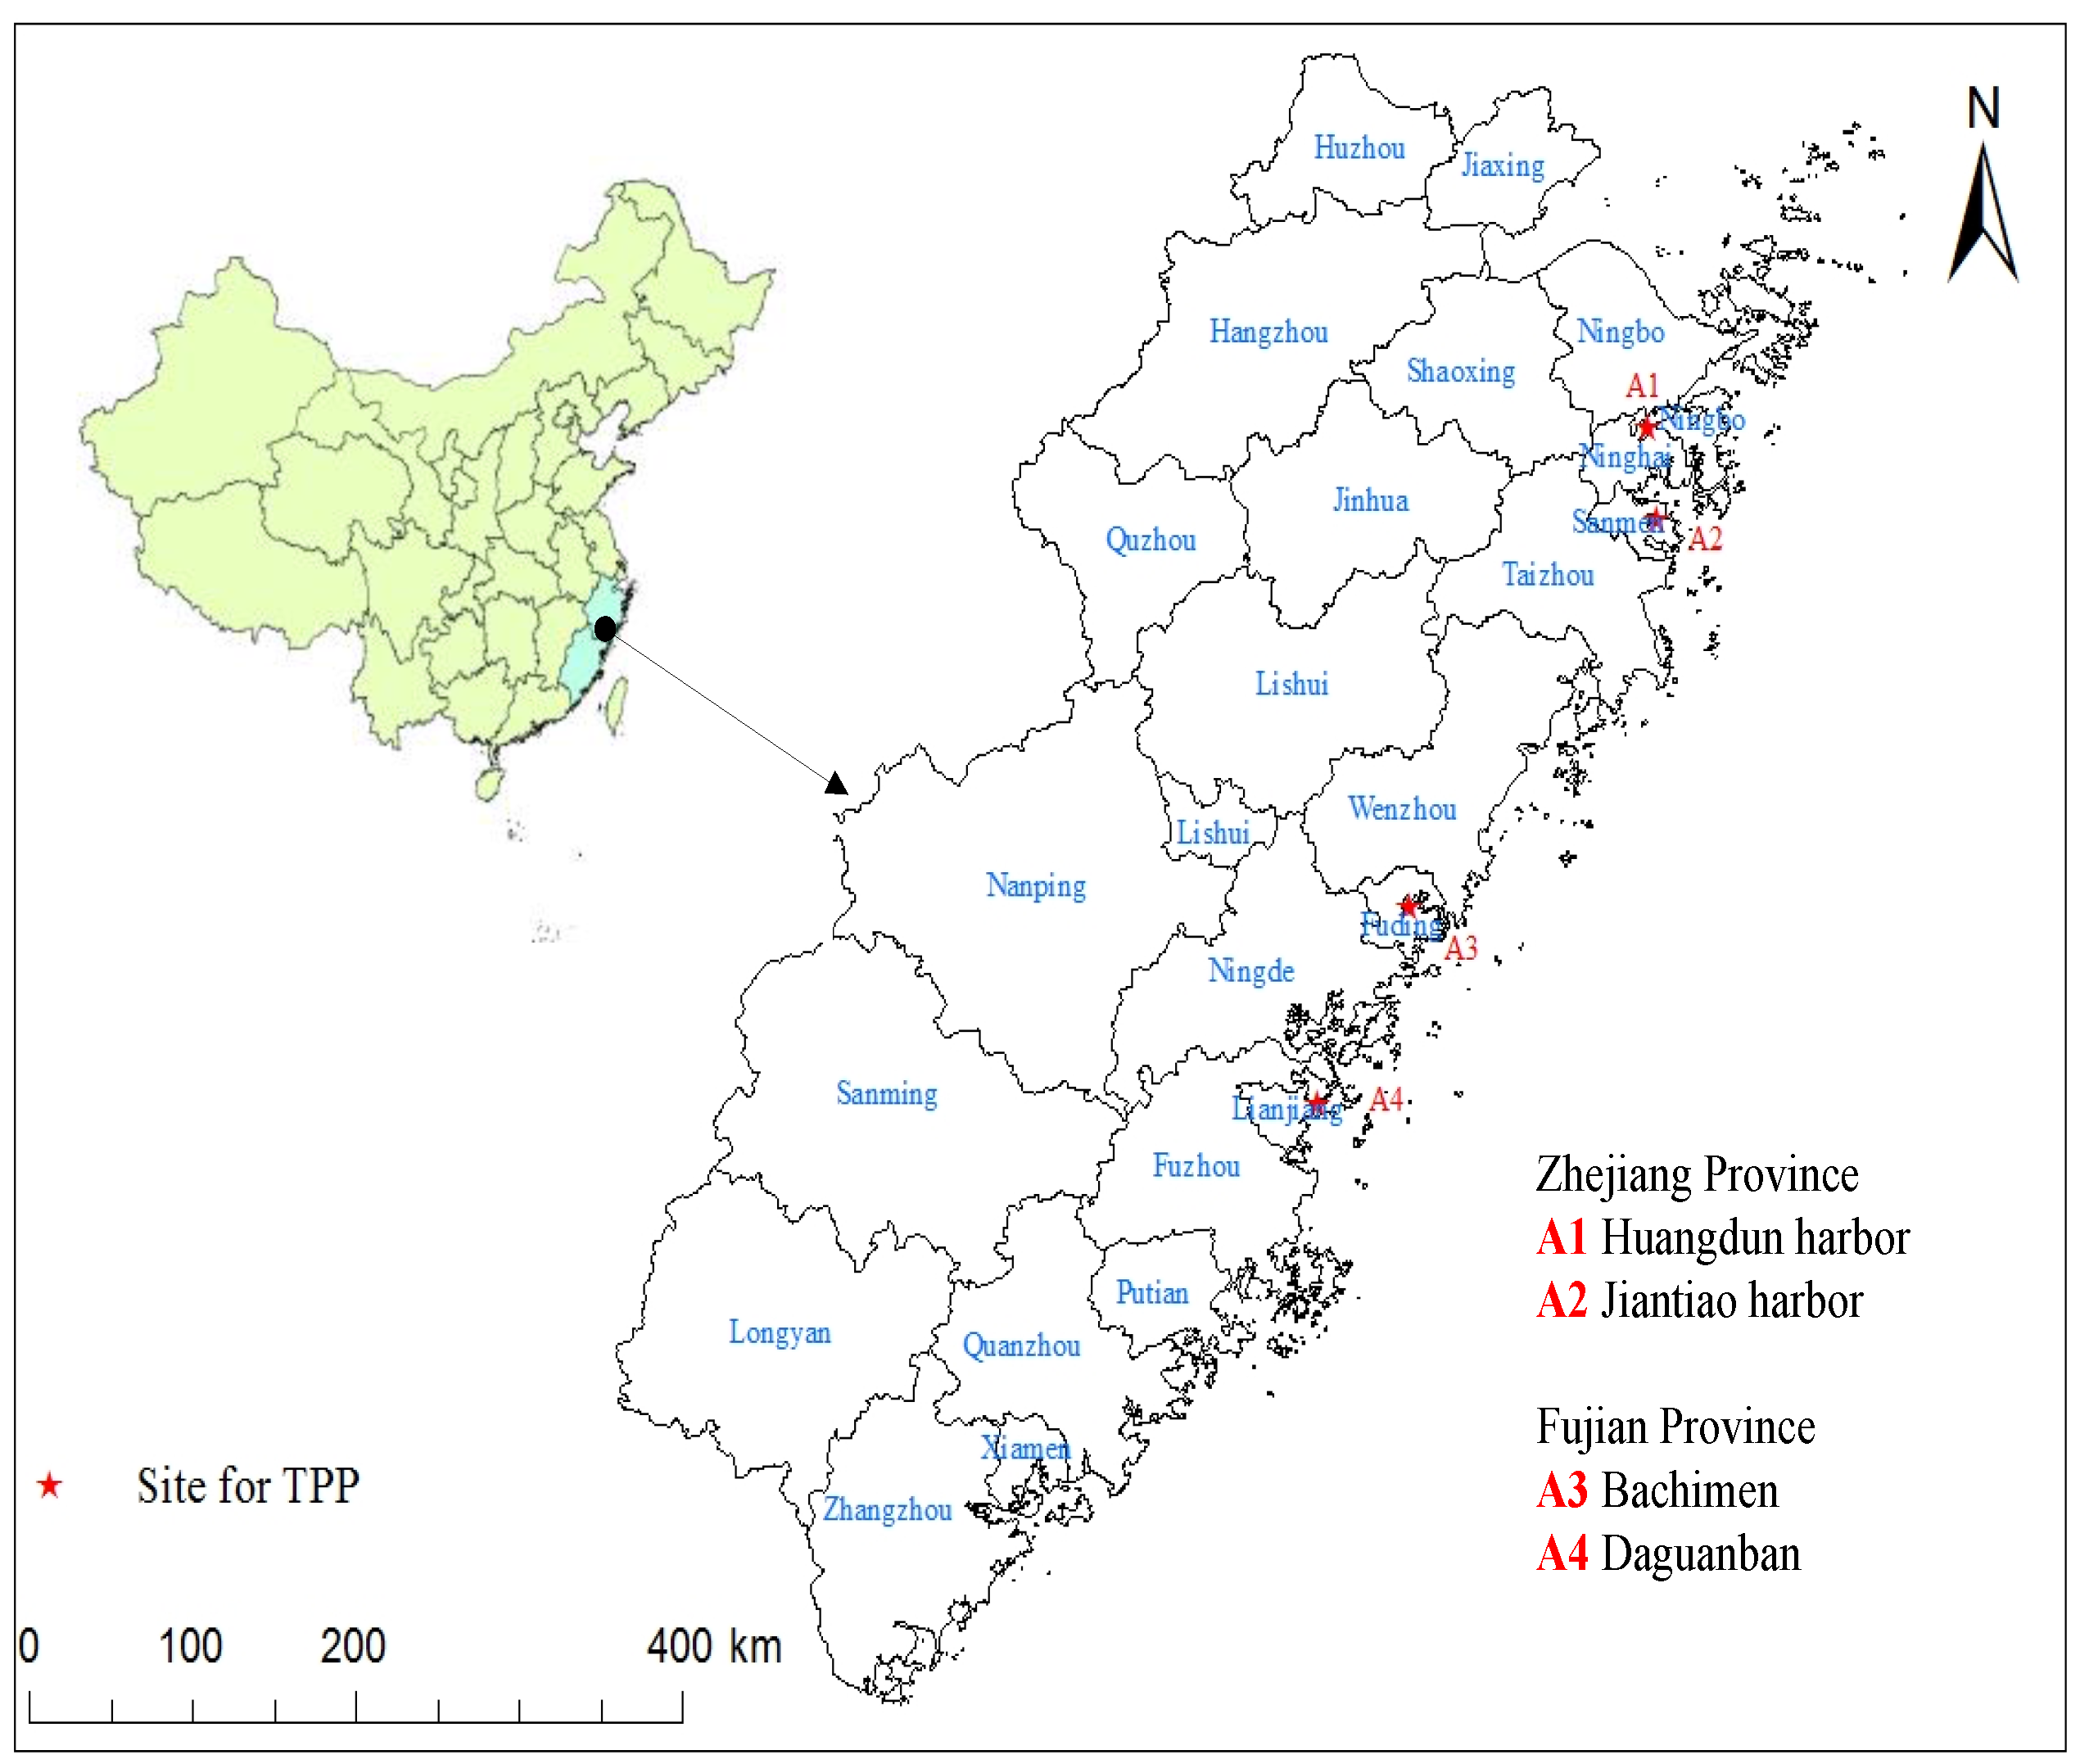
4.2. Site Descriptions

Four “qualified” TPP sites are selected among the numerous potential TPP sites after the preselection phase. There are Huangdun harbor (29°27′ N, 121°32′ E) TPP, with a capacity of 24 MW, Jiantiao harbor (29°02′ N, 121°35′ E) TPP, with a capacity of 20 MW in Zhejiang Province as well as Bachimen (27°15′ N, 120°13′ E) TPP, with a capacity of 36 MW, and Daguanban (26°20′ N, 119°43′ E) TPP, with a capacity of 14 MW in Fujian Province.
In order to help project managers further understand the characteristics of the four ideal TPP sites, the introduction of the four TPP sites about their distribution, general engineering characteristics as well as barrage locations are carried out in the following Figure 2, Table 3, and Figure 3, respectively. Site investigations are carried out at the four TPP sites and the decision data (listed in Table 4 and Table 5 and shown in Figure 4) are collected and surveyed, including the social and economic data, electric power system data of the cities as well as the data about policy/legislation/legislation, hydrology, tides, underwater topography and geology of the relative sites.
The general engineering characteristics of the four aforementioned sites are given in
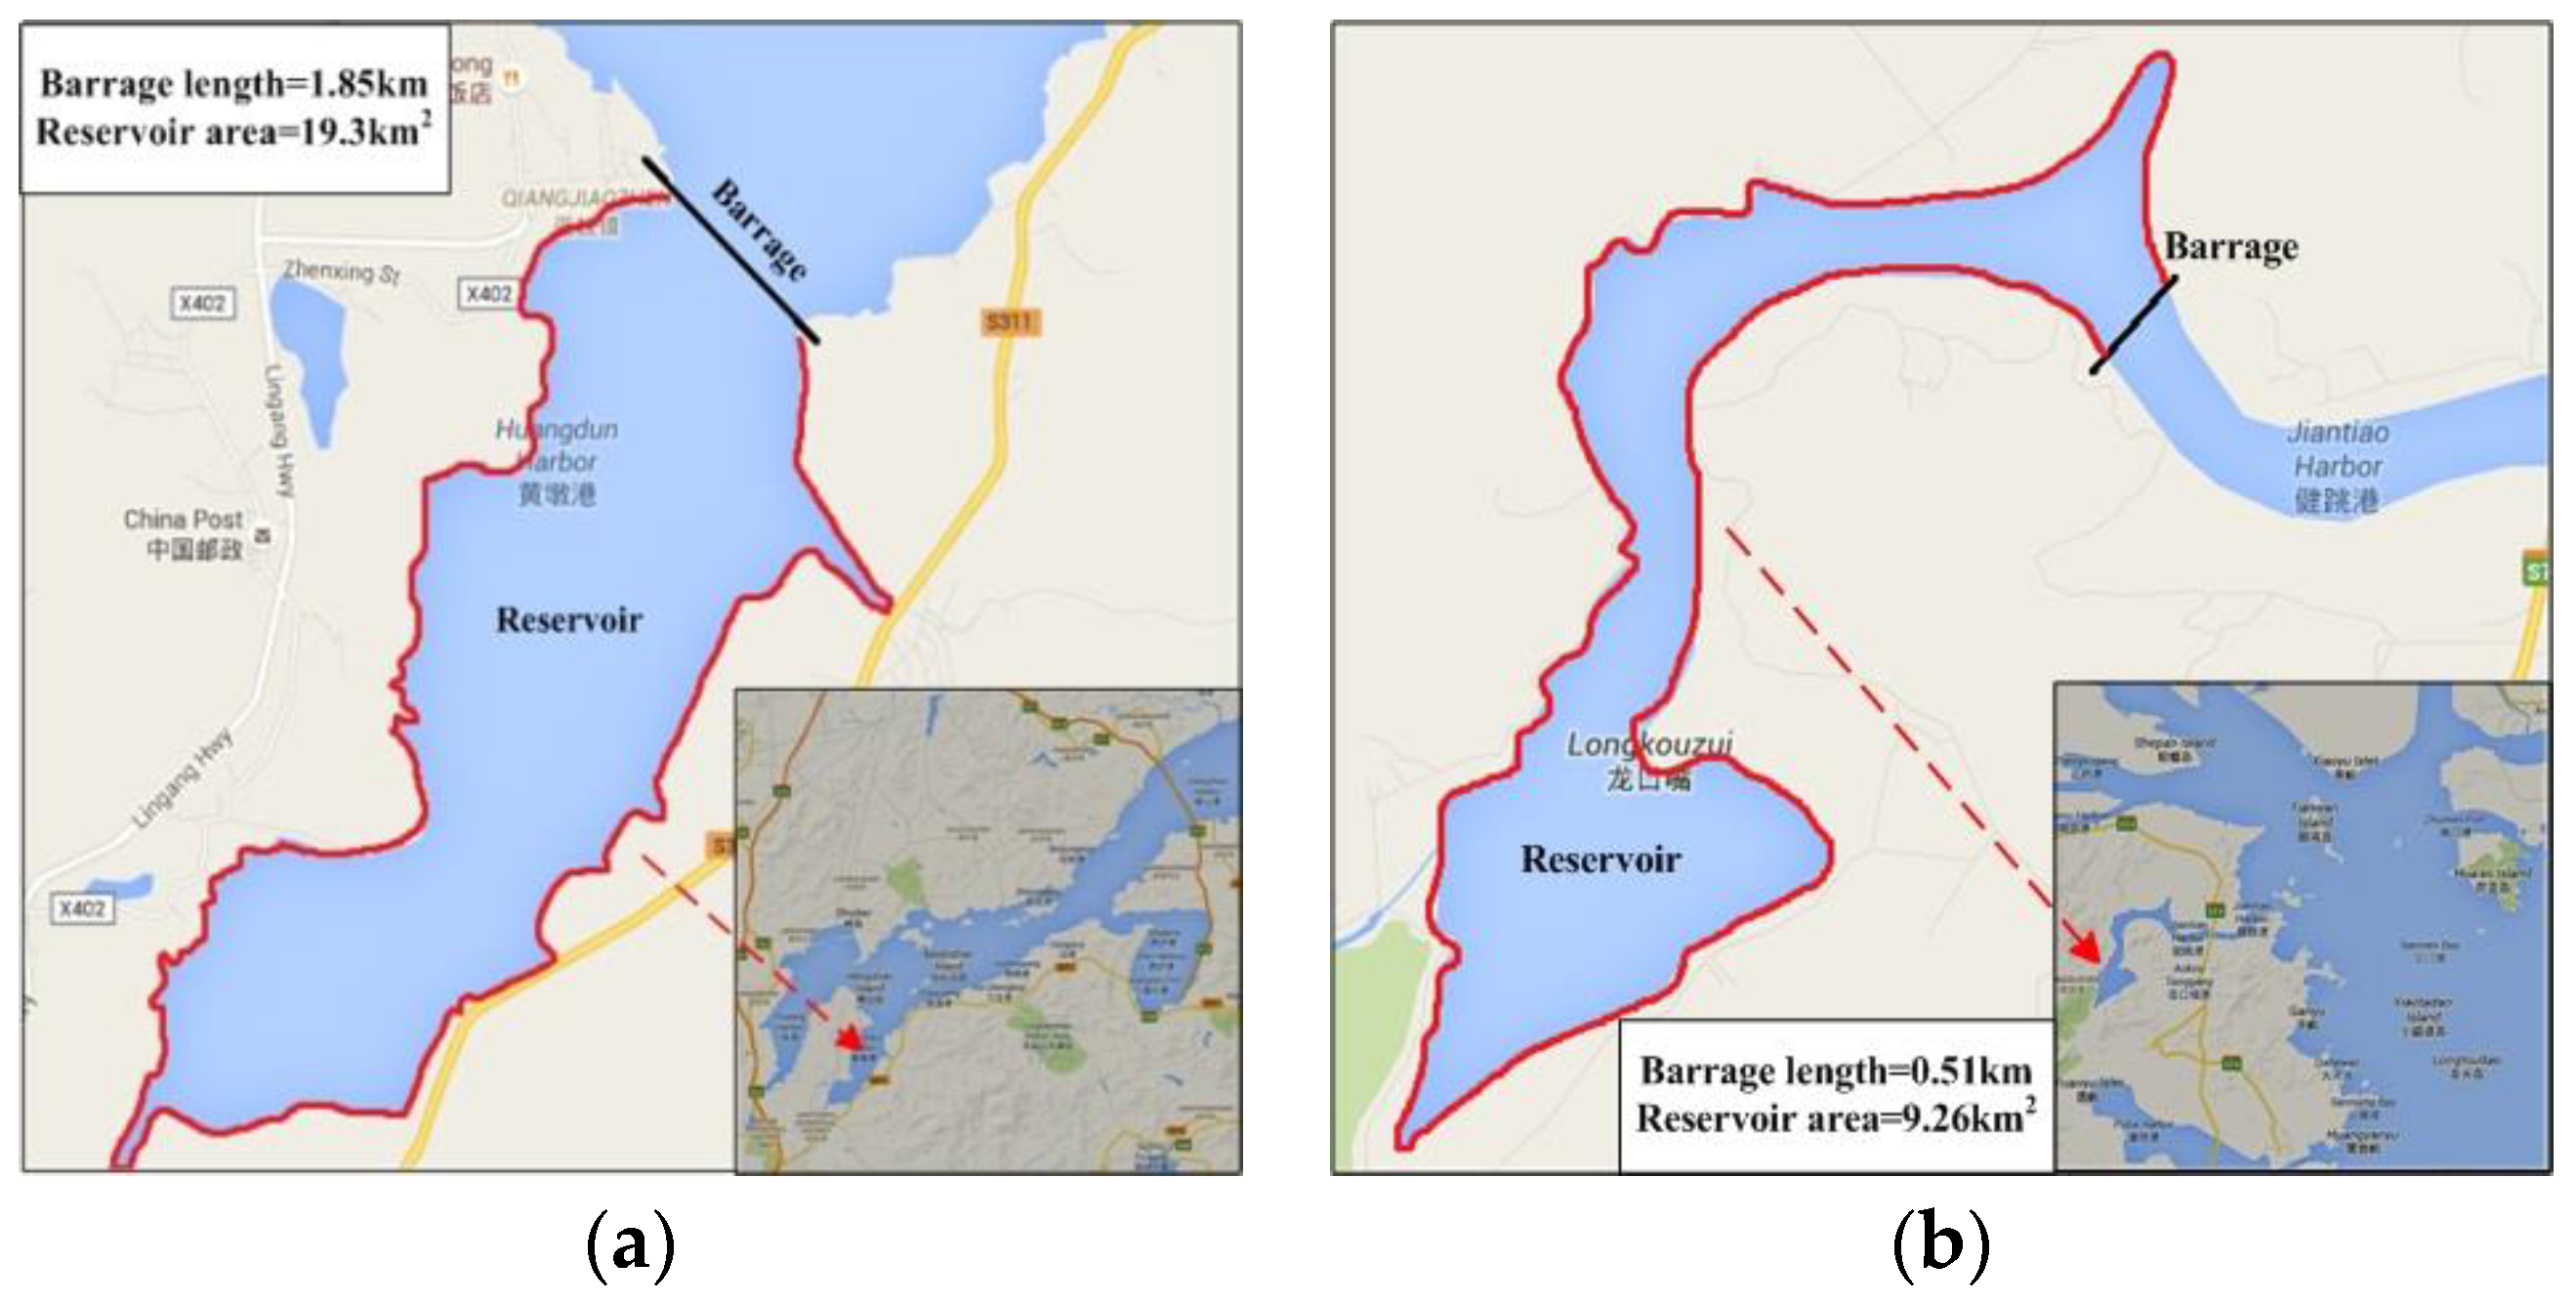
 Table 3.
For the specific sites, more than one barrage scheme could be selected. Thus, the best locations of the ideal barrage for every TPP are identified based on the feasibility study shown in Figure 3.
The four ideal sites are particularly attractive for tidal power due to their respective advantages, which are listed as follows:
(1) Huangdun Harbor: It is located at the end of Xiangshan Harbor. The two major advantages of Huangdun Harbor are the low silt content of the seawater (about 32%), and no sedimentation problems with good economic indicators. Moreover it does conflict with maritime traffic, coastal defense, and the project layout is also reasonable.
(2) Jiaotiao Harbor: This site has been listed in the marine function zoning of Sanmen City. Except for an abandoned port and wharf on the left bank of the site, there are basically no large ports, wharves or land reclamation zones in the reservoir area, so there is no major factor restricting project construction. Moreover, the maximum tidal range of 7.25 m, and the small investment of 62.5 million yuan and short construction period of 4 years are the major advantages of this site.
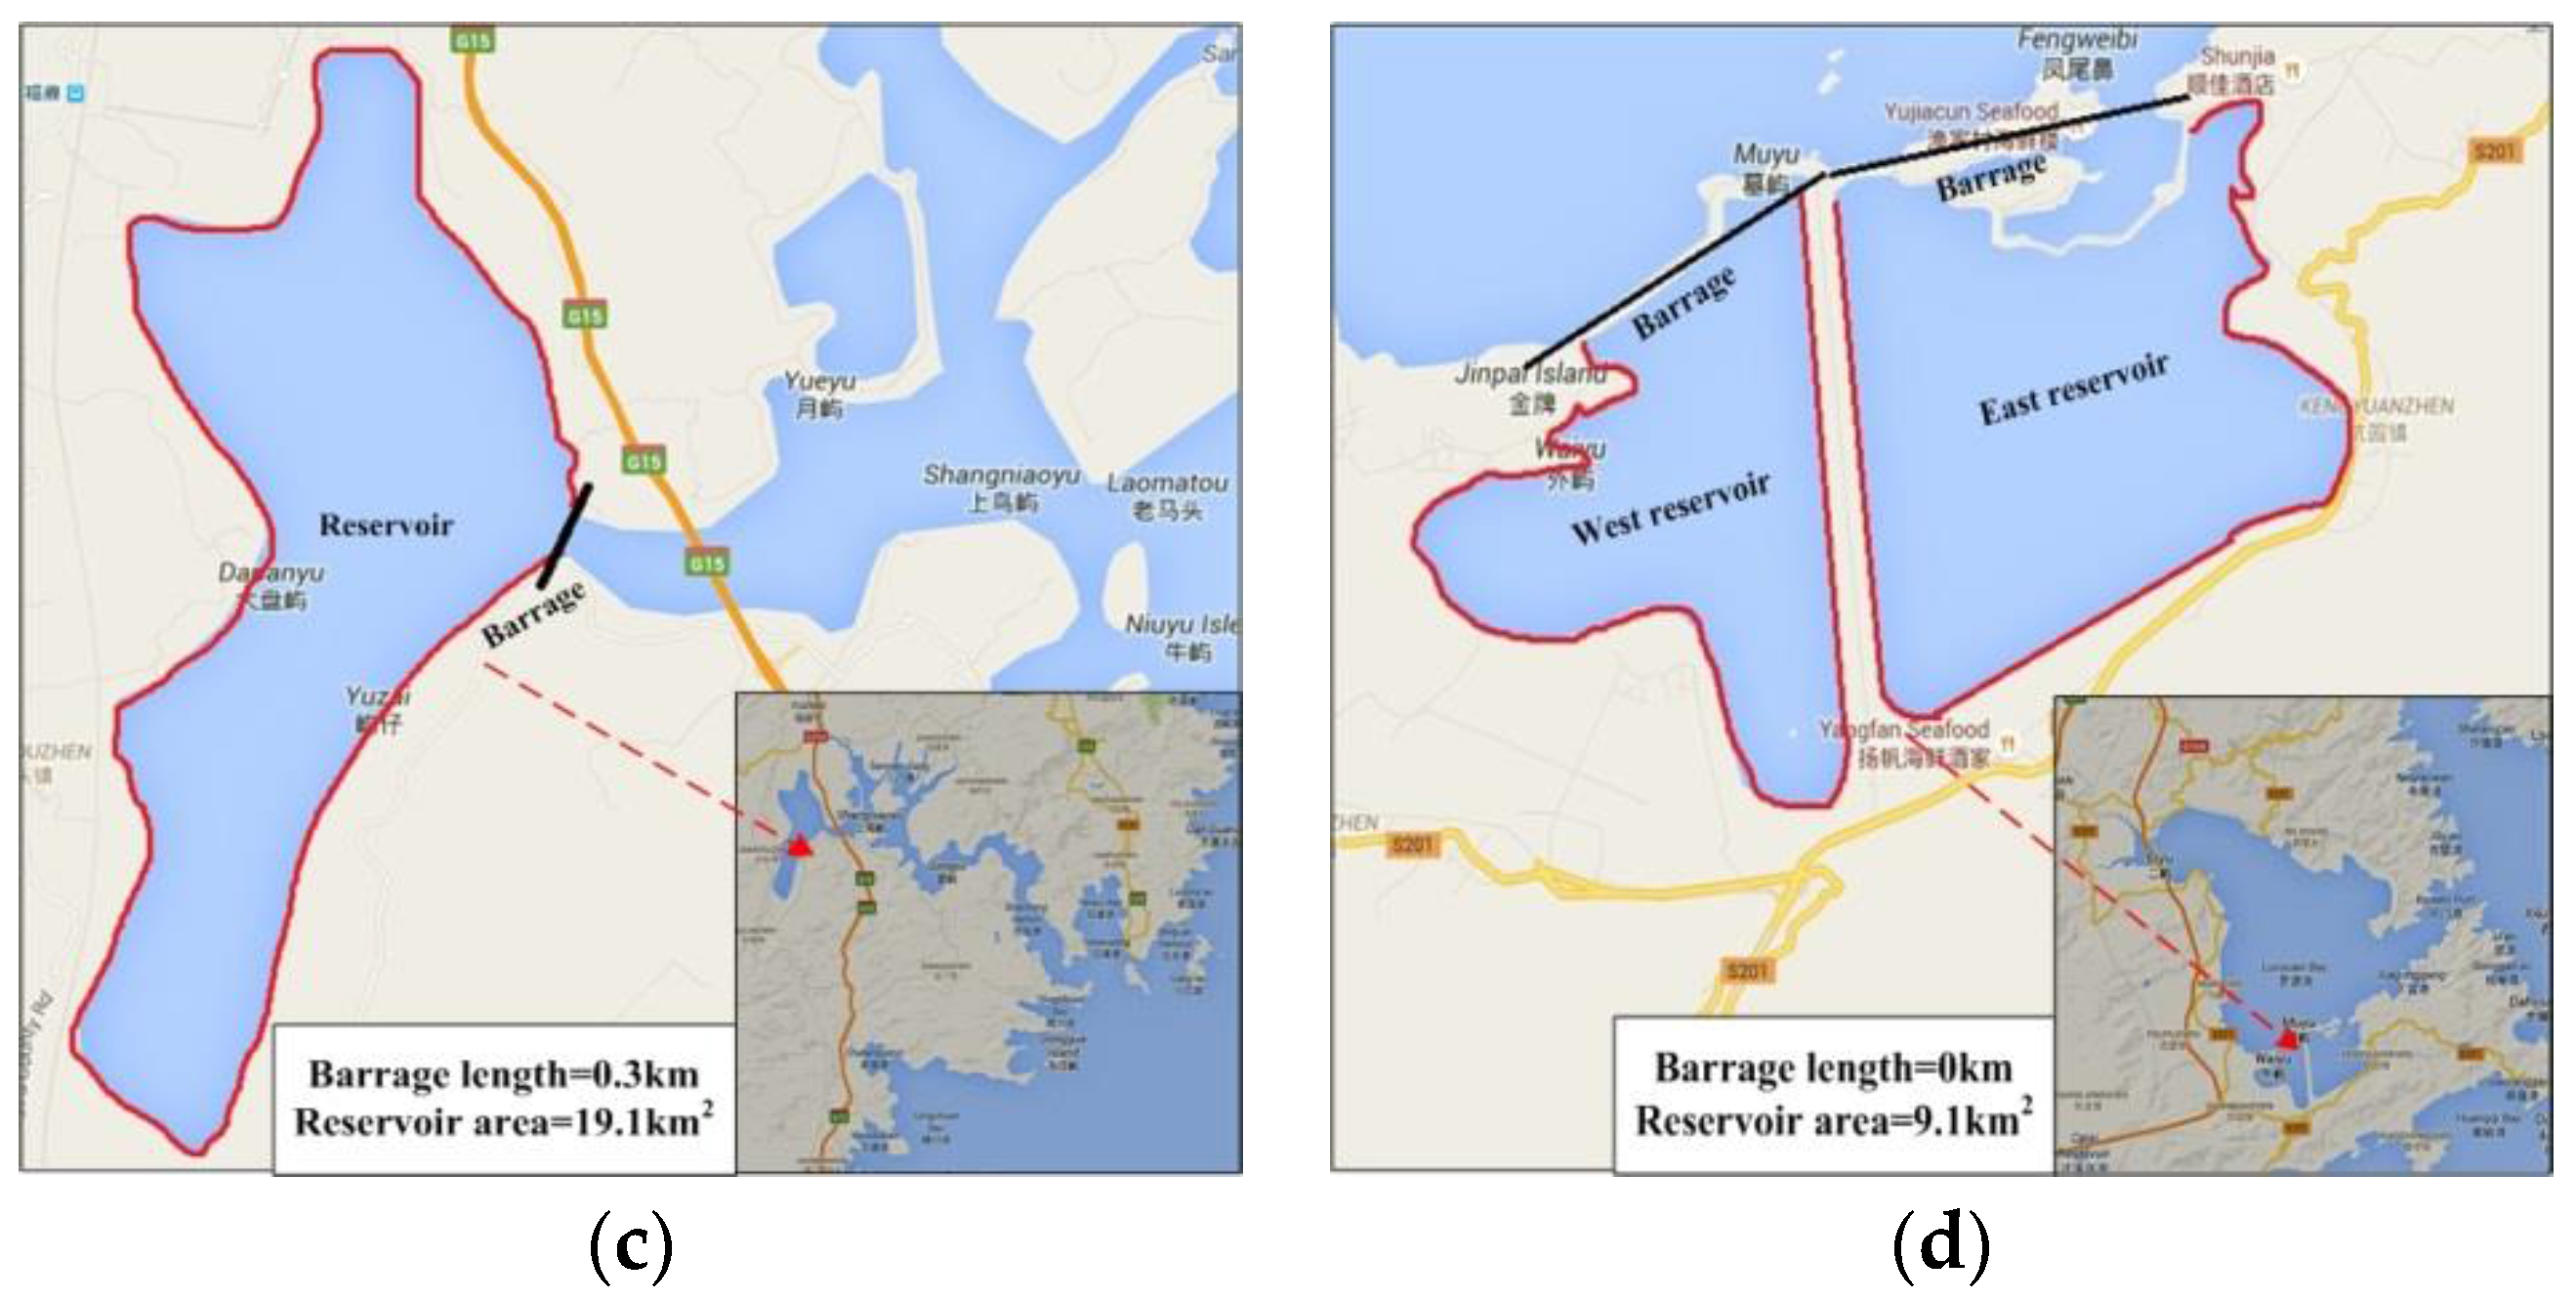
(3) Bachimen: It is on the edge of Shacheng B, located on the northeast coast of Fujian Province [46]. This area seriously lacks coal and oil but is rich in tidal energy resources (the installed capacity is about 36 MW, and the annual output is about 8638 TW·h). The barrage is sited in a narrow gorge, and has the features of a smaller entry and a bigger middle part. The barrage length is about 300 m, and the reservoir area is about 19.1 km2. At present, the county is severely short of electricity, which is seriously affecting industrial and agricultural production. The construction of a TPP can be combined with the construction of the 104 State Line Road Highway Bridge, reducing part of the generation investment. The multiple utilization benefits in Bachimen TPP are also considerable.
(4) Daguanban: The Daguanban TPP located in Lianjiang County has many advantages, such as a maximum tidal range of 5.02 m, slight silt silting of 0.67–1.92 cm/year, and a rocky base. Those natural conditions and existing engineering structures are advantageous to the construction of a TPP. As a result the higher construction cost can be minimized since the required infrastructure already exists.

5. TPP Site Selection in China, Result Analysis and Sensitivity Analysis

5.1. Optimal TPP Site Selection by Employing TOPSIS Method Based on INPD and SDD

In this section, the INPD and SDD methods are employed to select the optimal one from the aforementioned four TPP sites. The step by step procedure is as follows:
Step 1: The assessment panel identifies the criteria and sub-criteria. For the four particular sites, the sub-criteria C18, C19, C46 could not be taken into account, since their values are almost equal. The rest of the criteria and sub-criteria in the index system are used as the basis to make decisions.
Step 2: Two tasks have been undertaken by the expert group-II: (a) score the qualitative criteria on a scale of 0 to 100; (b) use the AHP method to evaluate the corresponding weights of criteria and sub-criteria.
The investigation team collected the decision data of the criteria which are in real number form, as shown in Table 4.
Because those criteria C15, C32, C33, C34, C41, C42, and C43 are quantitative, an assessment panel is organized by expert group-II, to grade them on a scale from 0 to 100. The corresponding scores are shown in Table 5.
Due to the restriction of measuring and forecasting technology, the distribution functions of the random numbers are difficult to obtain, thus the distribution functions of the random numbers are simulated to smooth curves according to the data collected by the investigation team, as shown in Figure 4.
Step 3: The assessment panel applies AHP to evaluate the corresponding weights of criteria and sub-criteria, which are shown in Table 6.
The following steps are done by expert group-III:
Step 4: Identify the SD or ASD relation, calculate the SDD, and then set up SDD matrix for each criterion. For the uncertain criteria, the SDD are calculated with Equation (9). For the certain criteria, the SDD are equal to the difference of criteria value. The SDD matrixes for each criterion are shown in Appendix B1.
Step 5: Identify positive ideal solution and negative ideal solution and calculate the separation of each alternative from positive ideal solution and negative ideal solution, which is shown in Table 7.
Step 6: Calculate the relative closeness to the ideal solution:
Ψ = ( 0.517 , 0.339 , 0.759 , 0.285 )
Step 7: The ranking result of alternatives is A3 > A1 > A2 > A4.

5.2. Result Analysis

The four alternatives are ranked by the TOPSIS method based on IPND and SDD, and the result shows that the alternative A3 is the optimal. From the relative closeness to the ideal solution, it can be seen that the gaps between the four alternatives are relatively large, which implies the ranking results are relatively stable. Although the overall ranking of A3 is the first, it has bad performance on the seismic intensity (C16), income tax relief (C22), water quality within the basin damage (C42), as well as fish and other marine animals’ damage (C43), which can be observed in Table 7. Thus, the committee needs to take corresponding measures to solve these issues, such as increasing the earthquake resistance grade in the process of construction and adopting a fish-friendly technology to reduce negative environmental effects. If these measures fail to be implemented, it will cause serious consequences in terms of economic cost and environmental impacts. On the contrary, the alternative A3 will be ideal to construct a TPP if these measures can be implemented. For the alternative A1, it obtains high scores on the basin area (C12), degree of sediment silting (C13), seismic intensity (C16), government subsidies (C21), income tax relief (C22) and on-grid price (C23). These numerous significant advantages will enable the committee to think twice on this alternative before making a final decision. The alternatives A2 and A4 receive lower scores, which means that there are many flaws in some aspects of the twin sites.

5.3. Sensitivity Analysis

A sensitivity analysis is performed to test whether the results would qualitatively change if the criteria weights fluctuate. Figure 5 shows those cases where the four criteria have 10%, 20% and 30% less weight and 10%, 20% and 30% more weight than the base weight. The overall consequences of the sensitivity analysis are that no matter how changes of criteria weights within plus or minus 30%, A3 is always the best alternative and its scores are much higher than other alternatives. At the same time, the ranking result of four alternatives is always A3 > A1 > A2 > A4, which is extremely stable. Based on these robust results, it could be concluded that the method proposed in this study is effective and suitable for the optimal site selection of TPP. Figure 4 also presents that A1 has good performance on criteria C2 while has poor performance on other three criteria. The gap between A1 and the best alternatives A3 is greatly narrow with the weight of C2 growth. In all the case of criteria weight fluctuation, the score of A2 remain relatively stable. In some extent, it means that A2 has less sensitive towards the changing of criteria weight. A3 is superior to other alternatives, and the superiority of A3 becomes greater with the weight of C1 and C3 growth. Although A4 obtains the lowest values in those cases, it will surpass A2 if the weight of C1 continues to growth or the weight of C2 continues to drop. Nowadays, the government and general public are giving more and more attention to the ecological environment, and DMs consider more about ecological and environmental aspects when selecting a TPP site. In terms of C4 (ecological environment impacts), A1, A2, and A4 all have no chance to surpass A3 since the scores of four alternatives are all relatively stable. It implies that the alternative A3 will still secure its top ranking no matter changes on the weight of C4 and it relative importance. From the aforementioned analysis, it is rational for the DMs to choose the alternative A3 to be the optimal TPP site.

6. Discussion

In this section, the validation on an international site for a potential TPP location is firstly performed based on the case of the Severn Estuary in the UK. Subsequently, the analysis of the international relevance of this paper is also discussed.

6.1. Validation on an International Site for a Potential TPP Location

It is necessary to discuss the validation of the proposed methodology on an international site for a potential TPP location. The Severn Estuary in the UK, which is one of the most promising sites in the world for constructing a TPP, is taken as an example. The Severn Estuary has a natural and cultural heritage which deserves special attention and it is also a living and working environment for many people who live around its shores and care about its future. More importantly, the Severn Estuary has the potential to generate more renewable electricity than all other UK estuaries. If harnessed, it could create up to 5% of the UK’s electricity, contributing significantly to UK climate change goals as well as European Union renewable energy targets. A number of different barrage proposals have been proposed for the Severn Estuary, all of them are of national public interest. Thus, it is strongly recommended that a site selection be carried out if any proposal is chosen as a development one.
Similarly, a committee consisting of different level project managers and three expert groups is set up. The procedure of TPP site selection in the Severn Estuary is as follows: firstly, in order to make a better comparison, the barrages A–E in the Severn Estuary mentioned in the Rainey’s paper [16] are used as the prospective alternatives; Secondly, for the Severn Estuary, the criteria and sub-criteria are selected from the index system introduced in Section 3.1 by the expert group-II. Then, to estimate the weights of criteria and sub-criteria, the comparative judgment matrixes are conducted by the expert group-II, which is shown in Appendix B2. Table 8 shows the selected criteria and sub-criteria as well as their corresponding weights. Thirdly, the values of the sub-criteria with respect to the barrages A–E are collected: (1) the data of sub-criteria C11 are derived from tide stations’ observation records; (2) the data of sub-criteria C12, C13, and C15 come from the Rainey’s paper [16]; (3) the data of sub-criteria C34 are calculated by Kelly’s methodology [47]; (4) the sub-criteria C14, C21, C22, C23, C31, C32, C33, C35 are all qualitative criteria, so they are scored by expert-group II on a scale of 0 to 100. The collected data are presented in Table 9 and Table 10. Fourth, the expert group-III is responsible for calculating the ranking result by the proposed method.
The SDD matrixes for each criterion as well as the separation of each alternative from positive and negative ideal solution are given in Appendix C. Finally, the relative closeness to the ideal solution is calculated as (0.466, 0.372, 0.543, 0.513, 0.557). The ranking result E > C > D > A > B is obtained, which implies that alternative E is the optimal one. Obviously, the ranking result is different from the result A > B > C > D > E in Rainey’s paper [16], which selected the optimum position for a barrage in the Severn Estuary from the power point of view. The enormous difference illustrates that other factors besides the power generation capacity are crucial. Although the most important factor influencing the site selection of TPP would always be the power generation capacity, the site selection of TPP is also influenced by the construction cost, environmental effect, and social effect and so on. It might cause wrongly decisions on choosing the best location by not taking into account all the factors. To be more convincing, the four criteria collectively influencing the power generation capacity of TPP are only used for decision-making by our proposed methodology: the tidal range (C11), the basin area (C12), the barrage length (C13) and the water depth (C15). Then the overall scores is calculated as (0.549, 0.518, 0.517, 0.460, 0.451) and then ranking result is obtained as A > B > C > D > E. This also proves the validation of our proposed methodology from a different perspective. Furthermore, in order to gain a deeper understanding of the performance of every alternative on every criterion, the overall scores of five alternatives on three criteria are also conducted and shown in Table 11. As the table shows, the overall score of the optimal alternative E ranks the last with respect to the criteria C3. Thus, for the alternative E, the committee needs to take corresponding measures to mitigate the serious ecological and environmental impacts. If these measures cannot be done, the committee should consider the alternative C as the optimal one since the gap of score between alternative E and alternative C is very small.
In sum, the roles of the proposed methodology in the decision making process are significant and mainly manifested in two aspects: (1) the proposed methodology helps the committee to select the initial optimal TPP site from numerous potential sites by comprehensively considering various factors; (2) the proposed methodology helps the committee to take some corresponding measures to improve the poor performance of a certain proposal. So the decision-making mistake can be decreased by our proposed methodology.

6.2. Analysis of the International Relevance of This Paper

This paper is not only limited to the site selection of TPP in Chinese areas, but also suitable for the site selection of TPP worldwide. Firstly, this paper has established a comprehensive index system for the TPP site selection. The index system is not designed for Chinese regions, but for regions worldwide. For a certain region worldwide, the corresponding criteria and sub-criteria used for decision-making can be selected from the index system. The regional features of the location of TPP decide which criteria and sub-criteria are used for decision. This process of criteria selection is performed by some international authoritative experts, whose academic backgrounds are hydrologic, policy/legislation, engineering, renewable energy, social, economic and environmental fields. Moreover, the importance of every criterion in different regions is different. For example, the weight of tidal range in the Chinese case is about 0.111, however, it is 0.231 in the Severn Estuary case. The reason is that the tidal range in coastal areas of China is relatively low, so it is difficult to maintain the operation of TPPs only by the profits of power generation. This is, the site selection of TPP in China places more emphasis on the other factors rather than tidal range, such as multiple-utilization benefits, but this situation does not exist in the Severn Estuary case, so the methodology in this paper has taken the regional differences into account with respect to the TPP site selection.
Secondly, for any region worldwide, the forms of criteria values for TPP site selection can be divided into three kinds: real numbers, random numbers and interval numbers. The major advantage of this method is that it can cope with multiple forms of criteria values including real numbers, random numbers and interval numbers. For these criteria that their values can be measured definitely and expressed by a single number, their value’s form is a real number; For these criteria that their values can be measured definitely and cannot be expressed by a single number, their value’s form is random number; for these criteria that their values are difficult to measure definitely, their value’s form is an interval number.
Thirdly, this paper combines with the roles of project managers and expert groups. The project managers and expert groups play a key role in any engineering project at home and abroad. To reduce the duplication of effort and improve efficiency, the tasks of project managers and expert groups have been specified. In this paper, a committee consisting of different level project managers three expert groups is set up. The numbers of project managers and expert groups can be adjusted according to the size of a certain TPP. In a word, the proposed methodology is not limited to the site selection of TPP in Chinese areas, but can be used worldwide.

7. Conclusions

The site selection plays an important role in the entire life cycle of a TPP project. However, related researches are scarce and some problems still exist: (a) an effective and suitable method for TPP site selection has not been proposed; (b) there is no research on integrating a series of criteria into an evaluation index system to comprehensively reflect the inherent characteristics of TPP site selection.
Hence, in this paper, a novel method based on INPD and SDD is proposed for TPP site selection. It can cope with multiple forms of criteria values simultaneously. Meanwhile, it can also take the preference of all stakeholders into consideration and overcome the shortcomings in traditional SD rules. Besides, an evaluation index system for TPP site selection is built, which consists of four criteria associated with a total of 22 sub-criteria. In order to reflect the inherent characteristics of TPP site selection comprehensively, these factors of construction conditions, existing policy/legislation, social impacts as well as ecological and environmental impacts are integrated into the evaluation index system. This comprehensive index system applies not only to the evaluation of the four particular sites in China, but also to the evaluation of sites elsewhere.
Finally, a case study of the coastal areas of China is carried out. Four ideal sites are selected among 426 potential TPP sites by setting up a series of constraints. After that, the proposed method is employed to rank the four best TPP sites. The result shows that the Bachimen TPP located in Fujian Province ranks the first and should be selected as the optimal site. Moreover, a sensitivity analysis is performed to show that the decision result has good robustness and a comparative analysis is carried out to illustrate the effectiveness and applicability of the proposed methodology.
This article has provided a theoretical basis for the site selection of TPP in China, and fills the gaps in the study of the site selection. Moreover, it could be applied to international TPP site selection. The proposed method can analyze the good or poor performance of alternatives with regard to every criterion clearly and also obtain the gaps between an ideal choice and other alternatives. Thus it helps project managers to make better decisions and the probability of decision-making mistake can be decreased. The proposed method can also be employed to other MCDM problems. Such as: construction project selection, material supplier selection and many other areas of management decision problems or strategy selection problems. In the future, it is worthwhile to extend this proposed method to deal with other forms of criteria values, such as fuzzy number and linguistic information.

Acknowledgments

Project supported by the National Nature Science Foundation of China (No. 71271085) and the Fundamental Research Funds for the Central Universities (No. 2015XS40).

Author Contributions

Yunna Wu designed the optimal TPP site selection framework. Chuanbo Xu collected the relative data, calculated the result and drafted the paper. Hu Xu mainly studied the proposed method. Finally, Chuanbo Xu formatted the manuscript for submission.

Conflicts of Interest

The authors declare no conflict of interest.

Abbreviation

The following abbreviations are used in this manuscript:
TPPTidal power plant
MCDMMulti-criteria decision making
DMsDecision-makers
TOPSISTechnique for Order Preference by Similarity to an Ideal Solution
INPDInterval number with probability distribution
INPDWCPInterval numbers with probability distribution weighted compromise operator
INPDAInterval numbers with probability distribution weighted acceptance operator
INPDWCSInterval numbers with probability distribution weighted consensus operator
SDDStochastic dominance degree
ASDAlmost stochastic dominance
PISPositive ideal solution
NISNegative ideal solution

Appendix A

Analysis of the Criteria for TPP Evaluation

  • C1: Construction conditions. Construction conditions play a decisive role in site selection due to its determination of the annual energy output and needed investment of a TPP.
  • C11: Tidal range (m). It has been accepted that the energy effectively recovered from the tidal motion is proportional to the square of the tidal range [48]. Sites with large tidal range are therefore best suited for tidal power development, whereas sites with low tidal range that are less suited for energy extraction [49].
  • C12: Basin area (km2). The capacity of the basin is another determining factor of the tidal barrage power [50]. The difference of basin area between various sites is usually significant.
  • C13: Degree of sediment silting (cm/year). The issue of sediment movement must be paid attention to in the whole process of a TPP, which includes planning, design, construction and operation. The degree of sediment silting directly relates to the power head, and then influence the service life of a TPP. Many TPPs were abandoned because of serious sediment silting, summarized from many painful lessons.
  • C14: Barrage length (km). A barrage is created across an estuary with turbines located along its length [51]. The high construction costs are considered as one of the greatest issues when deciding whether or not a site is economically viable for tidal energy extraction [52]. Moreover, a narrow barrage is helpful to create high velocities, which can be captured with the use of turbines.
  • C15: Foundation stability. The foundation stability also influences the cost of construction. The batholith is the most ideal foundation because it will greatly reduce the quantities of construction work [52]. However, reinforcement would be required if the foundation is silt. For the reason that the silt has great compressibility and little bearing capacity that results in the sink of the project.
  • C16: Seismic intensity (degree). It is well known that earthquake will take a devastating disaster over TPP. Therefore, the risk of earthquake cannot be ignored.
  • C17: Distance to the local grid (km). Connecting the TPP to the main grid will increase the total amount of electricity in national grid and overcome the discontinuity of tidal energy. Large and medium-sized TPPs are often far from load center, which means long-distance transmission line is required.
  • C18: Water depth (m). The water depth affects the generation capacity of TPP in a certain extent.
  • C19: Flow velocity (m/s). The flow velocity is related to the seabed deposition rates and flushing rates [31].
  • C2: Existing policy/legislation. Policy/legislation has the potential to have a dramatic effect on the future of tidal energy presenting many opportunities alongside many risks to existing and future tidal developments [53]. Thus, tidal energy policy/legislation has been the main driver for tidal energy development as demonstrated at other countries [54]. The larger TPP projects could require the involvement of national governments if they are to succeed [49].
  • C21: Government subsidies (BYN). Price subsidy from local government can encourage the production of TPP, which generally becomes important source of profits [44].
  • C22: Income tax relief (%). Financial and tax incentives provide the cost reductions tidal energy technologies require to become competitive with conventional energy systems [54].
  • C23: On-grid price (CNY/kW·h). On-grid price directly relate to the economics of TPP. The on-grid price of TPP is usually higher than that of other energy plants.
  • C3: Social impacts. The constructions of a tidal barrage will have both positive and negative impacts on society [31]. For example, tidal barrages could increase employment and could also provide flood defenses, which could protect against both tidal and river flood risks. However, restrictions on the ability of commercial and recreational vessels to navigate in the area due to obstructions, collision risks and reduced water depth could be a major negative implication of tidal barrages.
  • C31: Electricity load relief. There is no doubt that the construction of a TPP will relieve the local electricity load. Establishing a TPP is a priority in those areas with high demand for electricity. Some factors which include local GDP, population, electricity coverage and per capita electricity consumption collectively affect the electricity load demand.
  • C32: Multiple-utilization benefits. The development of TPP is still in the primary stage, and it is hard to maintain its running only by generating power. The benefits of multiple-utilization have a large proportion in the general earnings. In addition, social impacts from multiple-utilization are significant. The multiple-utilization including road and rail links across the barrage, aquaculture in the basin, increased employment, tourism, and farmland reclamation, etc. [31,49].
  • C33: Storm surge and flood control. Storm surge disasters are becoming a restrictive factor in the economic and social development of China’s coastal areas. Fortunately, tidal defense engineering plays an important role in defending the invasion of storm surges and reducing its harmful effects [55]. In addition, tidal defense engineering is also created for flood control. Thus, the construction of tidal defense engineering effectively improves the defense standard of storm surge and flood.
  • C34: Maritime traffic effect. The construction and service of a TPP need occupy navigation channel [52]. Thus the TPP sites should avoid maritime traffic as much as possible.
  • C4: Ecological and environmental impacts. There are numerous ecological and environmental factors that must be considered for the site selection of TPP. Available evidence suggests that the ecological environment impacts of a tidal barrage would be significant, which result from the barrage construction and operation; however, benefits would be possible [31]. The tidal energy will reduce the emissions of polluting gases since it is a clean and unpolluted energy.
  • C41: Flow of the tidal currents change. Building a dam across an estuary or bay will affect the flow of the tidal currents significantly [52]. For example, a Cardiff-Weston barrage could reduce the maximum tidal current in upstream areas by 45%.
  • C42: Water quality within the basin damage. Barrages are expected to reduce tidal flushing rates [31]. Thus they have a significant effect on water quality within the impounded basin, like the water temperature and salinity [44].
  • C43: Fish and other marine animals’ damage. The effect on fish and other marine animals may be detrimental, due to their passing through the turbines. Potential effects on fish, particularly migratory species, may arise through mortality at the turbines or delayed passage, as has been found at Annapolis [49]. Fortunately, since the development of the first bulb turbine there has been significant advancements in fish friendly technology [56].
  • C44: Area of tidal flat reduction (km2). The morphology of tidal flats is a complex outcome of tides, waves, sediment properties and ecological processes [57,58]. Tidal flats provide housing and feeding grounds for a wide range of marine life, animals, and birds. In addition, the tidal flat is also a source of revenue for residents in the area. But the construction of TPP will reduce the area of the tidal flat by 40 percent of the current level [59]. Therefore, the reduction in the area of the tidal flat implies the loss of space for spawning, birth, breeding, etc. [59,60].
  • C45: Carbon emissions reduction (t/year). Tidal energy as a clean and renewable energy source, of which the benefits of carbon reduction are an important part of their environmental influence. Marine renewable energy from tidal barrages is carbon-free and has the potential to make a significant contribution to energy supplies now and in the future [11]. The reduced carbon emission can be considerable, both saving money and is a move in the right direction when it comes to tackling climate change.
  • C46: Groundwater pattern change. In most coastal areas, groundwater level dynamics and groundwater discharge dynamics are mainly influenced by tidal forcing [61,62].

Appendix B

Appendix B.1 SDD Matrixes for Each Criterion

D C 11 = ( 0 0.586 0 0 0 0 0 0 3.827 4.876 0 0 4.036 5.062 0.128 0 ) ; D C 12 = ( 0 12.973 0.258 13.180 0 0 0 0.207 0 12.715 0 12.922 0 0 0 0 ) ; D C 13 = ( 0 0 0 0 0.930 0 0.135 0 0.716 0 0 0 4.867 3.934 4.151 0 ) ; D C 14 = ( 0 16.050 18.565 22.158 0 0 2.515 6.108 0 0 0 3.593 0 0 0 0 ) ; D C 15 = ( 0 0.003 0 0 0 0 0 0 3.236 3.241 0 0 3.564 3.570 0.327 0 ) ; D C 16 = ( 0 0 0 0 0 0 0 0 0.698 0.698 0 0 0.698 0.698 0 0 ) ;
D C 17 = ( 0 0 2.417 0 0.906 0 3.323 0 0 0 0 0 1.813 0.906 4.230 0 ) ; D C 21 = ( 0 27.513 15.132 35.767 0 0 0 8.254 0 12.381 0 20.635 0 0 0 0 ) ; D C 22 = ( 0 0 3.787 3.787 0 0 3.787 3.787 0 0 0 0 0 0 0 0 ) ;
D C 23 = ( 0 10.076 5.969 12.824 0 0 0 2.748 0 4.107 0 6.855 0 0 0 0 ) ; D C 31 = ( 0 1.263 0 0 0 0 0 0 26.672 27.935 0 15.089 11.576 12.847 0 0 ) ; D C 32 = ( 0 2.463 0 7.595 0 0 0 5.132 1.984 4.447 0 9.579 0 0 0 0 ) ; D C 33 = ( 0 0 1.390 4.478 0.033 0 1.477 4.541 0 0 0 3.063 0 0 0 0 ) ; D C 34 = ( 0 0 0.127 1.530 1.729 0 1.897 3.259 0 0 0 1.362 0 0 0 0 ) ; D C 41 = ( 0 3.759 1.777 7.504 0 0 0 3.745 0 1.982 0 5.727 0 0 0 0 ) ; D C 42 = ( 0 1.361 0 2.750 0 0 0 1.385 1.519 2.880 0 4.269 0 0 0 0 ) ; D C 43 = ( 0 1.110 0 0 0 0 0 0 1.732 2.842 0 0.407 1.278 2.389 0 0 ) ; D C 44 = ( 0 5.082 0.582 0 0 0 0 0 0 4.500 0 0 14.390 19.472 14.972 0 ) ; D C 45 = ( 0 1.732 0 2.938 0 1.202 0 0 8.864 10.597 0 11.799 0 0 0 0 ) .

Appendix B.2 Comparative Judgment Matrixes

Y ( C 1 , C 2 , C 3 ) = ( 1 2 4 1 / 2 1 2 1 / 4 1 / 2 1 ) ; Y ( C 11 , C 12 , C 13 , C 14 , C 15 ) = ( 1 2 2 4 5 1 / 2 1 1 2 3 1 / 2 1 1 2 3 1 / 4 1 / 2 1 / 2 1 1 1 / 5 1 / 3 1 / 3 1 1 ) ; Y ( C 21 , C 22 , C 23 ) = ( 1 2 3 1 / 2 1 2 1 / 3 1 / 2 1 ) ; Y ( C 31 , C 32 , C 33 , C 34 , C 35 ) = ( 1 1 / 2 1 / 3 3 4 2 1 1 6 8 3 1 1 8 10 1 / 3 1 / 6 1 / 8 1 1 1 / 4 1 / 8 1 / 10 1 1 ) .

Appendix B.3 SDD Matrixes for Each Criterion in the Severn Estuary

D C 11 = ( 0 0 0 0 0 6.687 0 0 0 0 10.866 4.179 0 0 0 18.388 11.701 7.522 0 0 22.567 15.880 11.701 4.179 0 ) ; D C 12 = ( 0 14.251 6.960 27.640 38.443 0 0 0 13.389 24.193 0 7.291 0 20.680 31.484 0 0 0 0 10.804 0 0 0 0 0 ) ; D C 13 = ( 0 3.636 13.291 22.444 34.356 0 0 9.655 18.808 30.720 0 0 0 9.153 21.065 0 0 0 0 11.912 0 0 0 0 0 ) ; D C 14 = ( 0 0 0 0 0 0.122 0 0 0 0 0.296 0.128 0 0 0 2.778 2.596 2.415 0 1.000 1.778 1.596 1.415 0 0 ) ; D C 15 = ( 0 4.638 7.070 11.651 11.651 0 0 2.432 7.013 7.013 0 0 0 4.581 4.581 0 0 0 0 0 0 0 0 0 0 ) ; D C 21 = ( 0 1.491 0 0 0 0 0 0 0 0 1.536 3.028 0 0 0 2.729 4.221 1.141 0 0 2.800 4.292 1.186 0.042 0 ) ; D C 22 = ( 0 0 0 0 0 1.863 0 0.268 0 0 1.516 0 0 0 0 2.538 0.650 0.962 0 0 3.620 1.743 2.103 0.738 0 ) ; D C 23 = ( 0 0 0.170 0.180 0 0.107 0 0.304 0.319 0 0 0 0 0.008 0 0 0 0 0 0 0.453 0.347 0.666 0.681 0 ) ; D C 31 = ( 0 0 0 0 0 0.141 0 0 0 0 0.740 0.514 0 0 0.003 1.066 0.919 0.249 0 0.295 0.735 0.588 0 0 0 ) ; D C 32 = ( 0 0 0.088 0.032 0 2.118 0 2.263 2.165 1.055 0 0 0 0 0 0 0 0.056 0 0 1.061 0 1.183 1.111 0 ) ; D C 33 = ( 0 0 0 0.007 0.810 0.215 0 0 0.219 1.028 0.795 0.558 0 0.786 1.628 0 0 0 0 0.794 0 0 0 0 0 ) ; D C 34 = ( 0 1.318 2.139 2.676 2.995 0 0 0.820 1.357 1.676 0 0 0 0.537 0.856 0 0 0 0 0.319 0 0 0 0 0 ) ; D C 35 = ( 0 0 0 0.068 0 0.212 0 0.180 0.281 0.164 0.009 0 0 0.089 0 0 0 0 0 0 0.036 0 0.018 0.105 0 ) .

Appendix C

Separation of Each Alternative from Positive and Negative Ideal Solution in the Severn Estuary

CriteriaPIS 1NIS 2ABCDE
d1j+d1j−d2j+d2j−d3j+d3j−d4j+d4j−d5j+d5j−
C11EA22.57015.886.6911.710.874.1818.39022.57
C12AE038.4414.2524.196.9631.4827.6410.838.440
C13EA34.36030.723.6421.0613.2911.9122.44034.36
C14DA2.7802.60.122.410.302.7811.78
C15AE011.654.647.017.074.5811.65011.650
C21EB2.81.494.2901.193.030.044.2204.29
C22EA3.6201.741.862.11.520.742.5403.62
C23ED0.450.180.350.320.670.010.68000.68
C31AD01.070.140.920.740.251.0700.730.29
C32AB02.122.1200.092.260.032.171.061.05
C33EC0.810.81.030.561.6300.790.7901.63
C34AE02.991.321.682.140.862.680.322.990
C35DB0.070.210.2800.090.1800.280.10.16
1 PIS means positive ideal solution; 2 NIS means negative ideal solution.

References

  1. Chen, D.; Cheng, C.-Y.; Urpelainen, J. Support for renewable energy in China: A survey experiment with internet users. J. Clean. Prod. 2016, 112, 1–9. [Google Scholar] [CrossRef]
  2. Shaw, T. A policy for tidal energy. Mar. Policy 1977, 1, 61–69. [Google Scholar] [CrossRef]
  3. Ge, X.; Feng, Y.; Zhou, Y.; Zheng, Y.; Yang, C. Optimization study of shaft tubular turbine in a bidirectional tidal power station. Adv. Mech. Eng. 2013, 5, 1–9. [Google Scholar] [CrossRef]
  4. Zhu, G.; Guo, P.; Luo, X.; Qi, G. Optimal design of runner blade in bulb turbine base on multidisciplinary feasible method. Trans. Chin. Soc. Agric. Eng. 2014, 30, 47–55. [Google Scholar]
  5. Han, F.; Yang, L.; Yan, S.; Kuboat, T. New bulb turbine with counter-rotating tandem-runner. Chin. J. Mech. Eng. 2012, 25, 919–925. [Google Scholar] [CrossRef]
  6. Istorik, B.; Shpolyanskii, Y.B. Numerical investigations of a straight-flow turbine with an axis of rotation perpendicular to the flow. Hydrotech. Constr. 1991, 25, 9–14. [Google Scholar] [CrossRef]
  7. Erikson, L.H.; Wright, S.A.; Elisa, E.; Hanes, D.M.; Schoellhamer, D.H.; Largier, J. The use of modeling and suspended sediment concentration measurements for quantifying net suspended sediment transport through a large tidally dominated inlet. Mar. Geol. 2013, 345, 96–112. [Google Scholar] [CrossRef]
  8. Keshtpoor, M.; Puleo, J.A.; Shi, F.; Ma, G. 3D numerical simulation of turbulence and sediment transport within a tidal inlet. Coast. Eng. 2015, 96, 13–26. [Google Scholar] [CrossRef]
  9. Chen, W.-B.; Liu, W.-C.; Hsu, M.-H.; Hwang, C.-C. Modeling investigation of suspended sediment transport in a tidal estuary using a three-dimensional model. Appl. Math. Model. 2015, 39, 2570–2586. [Google Scholar] [CrossRef]
  10. Ma, F.; Jiang, C.; Rauen, W.B.; Lin, B. Modelling sediment transport processes in macro-tidal estuary. Sci. China Ser. E Technol. Sci. 2009, 52, 3368–3375. [Google Scholar] [CrossRef]
  11. Xia, J.; Falconer, R.A.; Lin, B.; Tan, G. Estimation of annual energy output from a tidal barrage using two different methods. Appl. Energy 2012, 93, 327–336. [Google Scholar] [CrossRef]
  12. Yin, J.-C.; Wang, N.-N.; Hu, J.-Q. A hybrid real-time tidal prediction mechanism based on harmonic method and variable structure neural network. Eng. Appl. Artif. Intell. 2015, 41, 223–231. [Google Scholar] [CrossRef]
  13. Hou, F.; Bao, X.; Li, B.; Liu, Q. The assessment of extactable tidal energy and the effect of tidal energy turbine deployment on the hydrodynamics in Zhoushan. Acta Oceanol. Sin. 2015, 34, 86–91. [Google Scholar] [CrossRef]
  14. Denny, E. The economics of tidal energy. Energy Policy 2009, 37, 1914–1924. [Google Scholar] [CrossRef]
  15. Johnstone, C.; Pratt, D.; Clarke, J.A.; Grant, A.D. A techno-economic analysis of tidal energy technology. Renew. Energy 2013, 49, 101–106. [Google Scholar] [CrossRef]
  16. Rainey, R. The optimum position for a tidal power barrage in the Severn estuary. J. Fluid Mech. 2009, 636, 497–507. [Google Scholar] [CrossRef]
  17. Lee, S.K.; Mogi, G.; Hui, K.S. A fuzzy analytic hierarchy process (AHP)/data envelopment analysis (DEA) hybrid model for efficiently allocating energy R&D resources: In the case of energy technologies against high oil prices. Renew. Sustain. Energy Rev. 2013, 21, 347–355. [Google Scholar]
  18. Lee, S.K.; Mogi, G.; Kim, J.W.; Gim, B.J. A fuzzy analytic hierarchy process approach for assessing national competitiveness in the hydrogen technology sector. Int. J. Hydrog. Energy 2008, 33, 6840–6848. [Google Scholar] [CrossRef]
  19. Düğenci, M. A new distance measure for interval valued intuitionistic fuzzy sets and its application to group decision making problems with incomplete weights information. Appl. Soft Comput. 2016, 41, 120–134. [Google Scholar] [CrossRef]
  20. Li, L.; Xie, X.; Guo, R. Research on group decision making with interval numbers based on plant growth simulation algorithm. Kybernetes 2014, 43, 250–264. [Google Scholar] [CrossRef]
  21. Yue, Z. An extended TOPSIS for determining weights of decision makers with interval numbers. Knowl.-Based Syst. 2011, 24, 146–153. [Google Scholar] [CrossRef]
  22. Fan, Z.-P.; Liu, Y.; Feng, B. A method for stochastic multiple criteria decision making based on pairwise comparisons of alternatives with random evaluations. Eur. J. Oper. Res. 2010, 207, 906–915. [Google Scholar] [CrossRef]
  23. Jalao, E.R.; Wu, T.; Shunk, D. A stochastic AHP decision making methodology for imprecise preferences. Inf. Sci. 2014, 270, 192–203. [Google Scholar] [CrossRef]
  24. Fan, Z.-P.; Zhang, X.; Liu, Y.; Zhang, Y. A method for stochastic multiple attribute decision making based on concepts of ideal and anti-ideal points. Appl. Math. Comput. 2013, 219, 11438–11450. [Google Scholar] [CrossRef]
  25. Quan, Z.; Qisheng, G.; Jinhua, G. New approach to multiple attribute decision making with interval numbers. J. Syst. Eng. Electron. 2008, 19, 304–310. [Google Scholar] [CrossRef]
  26. Xu, Z.; Da, Q. Possibility degree method for ranking interval numbers and its application. J. Syst. Eng. 2003, 18, 67–70. [Google Scholar]
  27. Yager, R.R.; Alajlan, N. Probability weighted means as surrogates for stochastic dominance in decision making. Knowl.-Based Syst. 2014, 66, 92–98. [Google Scholar] [CrossRef]
  28. Montes, I.; Miranda, E.; Montes, S. Stochastic dominance with imprecise information. Comput. Stat. Data Anal. 2014, 71, 868–886. [Google Scholar] [CrossRef]
  29. Tsetlin, I.; Wimkler, R.L.; Huang, R.J.; Tzeng, L.Y. Generalized almost stochastic dominance. Oper. Res. 2015, 63, 363–377. [Google Scholar] [CrossRef]
  30. Nowak, M. Aspiration level approach in stochastic MCDM problems. Eur. J. Oper. Res. 2007, 177, 1626–1640. [Google Scholar] [CrossRef]
  31. Hooper, T.; Austen, M. Tidal barrages in the UK: Ecological and social impacts, potential mitigation, and tools to support barrage planning. Renew. Sustain. Energy Rev. 2013, 23, 289–298. [Google Scholar] [CrossRef]
  32. Xia, J.; Falconer, R.A.; Lin, B. Impact of different tidal renewable energy projects on the hydrodynamic processes in the Severn Estuary, UK. Ocean Model. 2010, 32, 86–104. [Google Scholar] [CrossRef]
  33. Fedorov, M.; Shilin, M. Ecological safety of tidal-power projects. Power Technol. Eng. (Former Hydrotech. Constr.) 2010, 44, 117–121. [Google Scholar] [CrossRef]
  34. Yunna, W.; Geng, S. Multi-criteria decision making on selection of solar–wind hybrid power station location: A case of China. Energy Convers. Manag. 2014, 81, 527–533. [Google Scholar] [CrossRef]
  35. Graves, S.B.; Ringuest, J.L. Probabilistic dominance criteria for comparing uncertain alternatives: A tutorial. Omega 2009, 37, 346–357. [Google Scholar] [CrossRef]
  36. Yager, R.R. Stochastic dominance for measure based uncertain decision making. Int. J. Intell. Syst. 2014, 29, 881–905. [Google Scholar] [CrossRef]
  37. Hodder, J.E.; Jackwerth, J.C.; Kolokolova, O. Improved Portfolio Choice Using Second-Order Stochastic Dominance. Rev. Financ. 2015, 19, 1623–1647. [Google Scholar] [CrossRef]
  38. Zagst, R.; Kraus, J. Stochastic dominance of portfolio insurance strategies. Ann. Oper. Res. 2011, 185, 75–103. [Google Scholar] [CrossRef]
  39. Lizyayev, A. Stochastic dominance efficiency analysis of diversified portfolios: Classification, comparison and refinements. Ann. Oper. Res. 2012, 196, 391–410. [Google Scholar] [CrossRef]
  40. Nowak, M. INSDECM—An interactive procedure for stochastic multicriteria decision problems. Eur. J. Oper. Res. 2006, 175, 1413–1430. [Google Scholar] [CrossRef]
  41. Tan, C.; Ip, W.; Chen, X. Stochastic multiple criteria decision making with aspiration level based on prospect stochastic dominance. Knowl.-Based Syst. 2014, 70, 231–241. [Google Scholar] [CrossRef]
  42. Ustinovichius, L.; Simanaviciene, R. The application of stochastic dominance to sensitivity analysis in quantitative multiple criteria decision making (MCDM-1). In Cooperative Design, Visualization, and Engineering; Springer: New York, NY, USA, 2008; pp. 184–191. [Google Scholar]
  43. Leshno, M.; Levy, H. Preferred by “all” and preferred by “most” decision makers: Almost stochastic dominance. Manag. Sci. 2002, 48, 1074–1085. [Google Scholar] [CrossRef]
  44. Liu, L.-Q.; Liu, C.-X.; Han, R.-C. The development and application practice of neglected tidal energy in China. Renew. Sustain. Energy Rev. 2011, 15, 1089–1097. [Google Scholar] [CrossRef]
  45. Dai, Q.-Z. Hydraulic Generating Sets of Tidal Power Station. Dongfang Electr. Rev. 2007, 4, 003. [Google Scholar]
  46. Yu, H.; Wang, L.; Kuang, L.; Yu, H.; Sun, Y.; Qu, Y.; Wu, X. Estimation of annual energy output from BCM tidal barrage and the corresponding marine environmental impact. J. Ocean Univ. China 2016, 15, 209–218. [Google Scholar] [CrossRef]
  47. Kelly, K.A.; Mcmanus, M.C.; Hammond, G.P. An energy and carbon life cycle assessment of tidal power case study: The proposed Cardiff–Weston severn barrage scheme. Energy 2012, 44, 692–701. [Google Scholar] [CrossRef] [Green Version]
  48. Kiho, S.; Shiono, M.; Suzuki, K. The power generation from tidal currents by Darrieus turbine. Renew. Energy 1996, 9, 1242–1245. [Google Scholar] [CrossRef]
  49. Hammons, T.J. Tidal power. Proc. IEEE 1993, 81, 419–433. [Google Scholar] [CrossRef]
  50. Soleimani, K.; Ketabdari, M.J.; Khorasani, F. Feasibility study on tidal and wave energy conversion in Iranian seas. Sustain. Energy Technol. Assess. 2015, 11, 77–86. [Google Scholar] [CrossRef]
  51. Waters, S.; Aggidis, G. Tidal range technologies and state of the art in review. Renew. Sustain. Energy Rev. 2016, 59, 514–529. [Google Scholar] [CrossRef]
  52. Etemadi, A.; Emami, Y.; AsesfAfshar, O.; Emdadi, A. Electricity generation by the tidal barrages. Energy Procedia 2011, 12, 928–935. [Google Scholar] [CrossRef]
  53. Kolios, A.; Read, G. A political, economic, social, technology, legal and environmental (PESTLE) approach for risk identification of the tidal industry in the United Kingdom. Energies 2013, 6, 5023–5045. [Google Scholar] [CrossRef] [Green Version]
  54. Rourke, F.O.; Boyle, F.; Reynolds, A. Tidal energy update 2009. Appl. Energy 2010, 87, 398–409. [Google Scholar] [CrossRef]
  55. Zhong, D.; Yang, B.; Li, W.; Liu, D.; Tong, D. Application of three-dimensional visual simulation in tidal defense engineering. Trans. Tianjin Univ. 2013, 19, 1–9. [Google Scholar] [CrossRef]
  56. Waters, S.; Aggidis, G. A World First: Swansea Bay Tidal lagoon in review. Renew. Sustain. Energy Rev. 2016, 56, 916–921. [Google Scholar] [CrossRef]
  57. Le Hir, P.; Roberts, W.; Cazaillet, O.; Christie, M.; Bassoullet, P.; Bacher, C. Characterization of intertidal flat hydrodynamics. Cont. Shelf Res. 2000, 20, 1433–1459. [Google Scholar] [CrossRef]
  58. Friedrichs, C. 3.06-Tidal Flat Morphodynamics: A Synthesis; Virginia Institute of Marine Science: Gloucester Point, VA, USA, 2011; pp. 137–170. [Google Scholar]
  59. Lee, J.-S.; Yoo, S.-H. Measuring the environmental costs of tidal power plant construction: A choice experiment study. Energy Policy 2009, 37, 5069–5074. [Google Scholar] [CrossRef]
  60. Van der Werf, J.; Reinders, J.; van Rooijen, A.; Holzhauer, H.; Ysebaert, T. Evaluation of a tidal flat sediment nourishment as estuarine management measure. Ocean Coast. Manag. 2015, 114, 77–87. [Google Scholar] [CrossRef]
  61. Zhou, P.; Li, G.; Lu, Y. Numerical modeling of tidal effects on groundwater dynamics in a multi-layered estuary aquifer system using equivalent tidal loading boundary condition: Case study in Zhanjiang, China. Environ. Earth Sci. 2016, 75, 1–16. [Google Scholar] [CrossRef]
  62. Li, H.; Jiao, J.J. Tidal groundwater level fluctuations in L-shaped leaky coastal aquifer system. J. Hydrol. 2002, 268, 234–243. [Google Scholar] [CrossRef]
Figure 1. Decision framework of the international TPP site selection.
Energies 09 00832 g001
Figure 2. The distribution of the four ideal sites.
Energies 09 00832 g002
Figure 3. The shapes of the reservoir and estuary of the four TPP sites: (a) Huangdun harbor TPP; (b) Jiaotiao harbor TPP; (c) Bachimen TPP; (d) Daguanban TPP.
Energies 09 00832 g003aEnergies 09 00832 g003b
Figure 4. Curve of the distributions function for the criteria which forms are random number.
Energies 09 00832 g004
Figure 5. Sensitivity analysis result of changing the four criteria weight.
Energies 09 00832 g005
Table 1. Tidal energy resources and number of potential barrage sites in the coastal provinces of China.
ProvinceInstalled Capacity (MW)Annual Energy Output (GW·h)Number of Potential Barrage Sites
Liaoning597164053
Hebei102120
Shandong12437524
Jiangsu162
Shanghai70422801
Zhejiang891426,69073
Fujian10,33328,41388
Taiwan5613517
Guangdong573152049
Guangxi394111272
Hainan9122927
Total21,79762,421426
Table 2. The criteria and sub-criteria for TPP site selection.
CriteriaSub-Criteria
Construction conditions (C1)Tidal range (C11)
Basin area (C12)
Degree of sediment silting (C13)
Barrage length (C14)
Foundation stability (C15)
Seismic intensity (C16)
Distance to the local grid (C17)
Water depth (C18)
Flow velocity (C19)
Existing policies (C2)Government subsidies (C21)
Income tax relief (C22)
On-grid price (C23)
Social impacts (C3)Electricity load relief (C31)
Multiple-utilization benefits (C32)
Storm surge and flood control (C33)
Maritime traffic effect (C34)
Ecological and environmental impacts (C4)Flow of the tidal currents change (C41)
Water quality within the basin damage (C42)
Fish and other marine animals’ damage (C43)
Area of tidal flat reduction (C44)
Carbon emissions reduction (C45)
Groundwater pattern change (C46)
Table 3. General engineering characteristics of the four TPP sites.
SiteHuangdun HarborJiaotiao HarborBachimenDaguanban
Development modeSingle basin and one-way generationSingle basin and one-way generationSingle basin and one-way generationDouble basin and one-way generation
Mean water level (m)3.03.03.03.5
Installed capacity (MW)24203614
Annual output (TW·h)5901449486384544
Number of units (Set)8562
Turbine typeBulb TubularBulb TubularBulb TubularRim-generator Turbine
Average power head (m)2.382.612.682.9
Installed capacity utilization (h)2460299626173245
Seabed characteristicsSiltSiltBatholithBatholith
Suspended sediment concentration (kg/m3)0.15–0.20.01–1.50.168–0.1720.08–0.12
Table 4. The decision data of the criteria which forms are real numbers.
CriteriaA1A2A3A4
C12 (km2)19.39.2619.19.1
C14 (km) 1.850.510.30 1
C16 (degree)5566
C17 (km)1720923
C21 (BNY)0.680.280.460.16
C22 (%)15151212
C23 (CNY/kW·h)2.5641.8822.161.696
C44 (km2)0.5310.2340.4970.572
C45 (t/year) 47,303.140,882.280,161.236,425.2
1 The value of C14 with regard to A4 is 0 km for the reason that engineering structures exists in Daguanban TPP.
Table 5. The corresponding scores of the quantitative criteria which form are interval number.
DMsAlternativeC15C32C33C34C41C42C43
DM1A1[55,60][80,95][45,50][65,80][35,55][60,70][60,70]
A2[55,70][70,75][40,60][70,80][25,40][50,60][45,60]
A3[75,85][75,85][30,45][70,80][30,50][70,80][70,80]
A4[85,90][60,75][35,40][50,60][15,25][45,60][60,85]
DM2A1[55,60][65,80][40,60][60,70][40,50][50,60][75,80]
A2[45,60][60,75][40,65][70,80][30,45][50,65][65,70]
A3[80,90][80,90][60,70][60,75][30,45][60,70][80,90]
A4[85,90][60,70][35,50][55,70][20,35][55,70][60,70]
DM3A1[50,55][60,80][55,70][60,70][35,50][55,70][55,65]
A2[55,60][70,80][65,70][70,80][25,40][60,70][55,70]
A3[75,85][75,85][40,50][55,70][30,45][65,80][60,70]
A4[80,85][55,65][30,40][50,65][20,30][30,45][65,80]
DM4A1[55,65][80,85][55,70][55,70][40,55][65,80][55,70]
A2[50,60][75,85][45,60][60,80][30,40][40,60][50,60]
A3[70,85][75,85][50,65][50,65][40,50][60,85][75,90]
A4[70,80][65,70][40,55][55,70][15,30][45,50][80,90]
Table 6. The corresponding weights of criteria and sub-criteria.
CriteriaSub-Criteria
C1 (0.3162)C11 (0.1112); C12 (0.0550); C13 (0.0634); C14 (0.0329); C15 (0.0273)
C16 (0.0109); C17 (0.0858)
C2 (0.2221)C21 (0.0858); C22 (0.0485); C23 (0.0878)
C3 (0.2774)C31 (0.0657); C32 (0.1241); C33 (0.0444); C34 (0.0432)
C4 (0.1843)C41 (0.0374); C42 (0.0352); C43 (0.0326); C44 (0.0380); C45 (0.0412)
Table 7. The separation of each alternative from positive and negative ideal solution.
CriteriaPIS 1NIS 2A1A2A3A4
d1j+d1j−d2j+d2j−d3j+d3j−d4j+d4j−
C11A4A24.0360.5865.06200.1284.87605.062
C12A1A4013.18012.9730.2070.25812.92213.1800
C13A1A404.8670.9303.9340.7164.1514.8670
C14A4A122.15806.10816.0503.59318.565022.158
C15A4A23.5640.0033.57000.3273.24103.570
C16A1/A2A3/A400.69800.6980.69800.6980
C17A3A42.4171.8133.3230.90604.2304.2300
C21A1A4035.76727.5138.25415.13220.63535.7670
C22A1/A2A3/A403.78703.7873.78703.7870
C23A1A4012.82410.0762.7485.9696.85512.8240
C31A3A226.6721.26327.9350027.93515.08912.847
C32A3A41.9847.5954.4475.13209.5799.5790
C33A2A40.0334.47804.4511.4773.0634.5410
C34A4A11.53003.2591.7291.3620.12701.530
C41A4A17.50403.7453.7595.7271.77707.504
C42A4A32.7501.5191.3852.8804.269004.269
C43A2A31.1101.73202.8422.84202.3890.407
C44A2A42.4076.81609.2232.3137.0929.2230
C45A3A420.8706.90624.9492.830027.77927.7790
1 PIS means positive ideal solution; 2 NIS means negative ideal solution.
Table 8. The criteria and sub-criteria for TPP site selection in Severn Estuary.
CriteriaWeightsSub-CriteriaWeights
Construction conditions (C1)0.571Tidal range (C11)0.404
Basin area (C12)0.210
Barrage length (C13)0.210
Foundation stability (C14)0.097
Water depth (C15)0.079
Social impacts (C2)0.286Multiple-utilization benefits (C21)0.540
Storm surge and flood control (C22)0.297
Maritime traffic effect (C23)0.163
Ecological and environmental impacts (C3)0.143Flow of the tidal currents change (C31)0.157
Water quality within the basin damage (C32)0.340
Fish and other marine animals’ damage (C33)0.410
Carbon emissions reduction (C34)0.050
Groundwater pattern change (C35)0.043
Table 9. The data of the quantitative criteria with respect to the barrages A-E in the Severn Estuary.
CriteriaABCDE
C11 (m)7.98.79.210.110.6
C12 (km2)800585695383220
C13 (km)40.637.730.022.713.2
C15 (m)36.928.724.416.316.3
C34 (t/year)11.83 × 1067.78 × 1065.26 × 1063.61 × 1062.63 × 106
Table 10. The data of the qualitative criteria with respect to the barrages A-E in the Severn estuary.
AlternativeC14C21C22C23C31C32C33C35
DM1A[70,75][75,80][45,55][65,75][20,30][45,50][60,65][10,15]
B[60,70][70,75][55,65][70,75][25,30][50,55][60,70][15,20]
C[55,65][80,85][50,55][70,75][20,25][35,40][65,70][10,15]
D[65,75][80,90][55,65][65,70][25,30][45,50][60,65][15,25]
E[70,80][70,80][50,60][70,75][30,35][50,55][55,60][10,15]
DM2A[60,65][80,85][55,60][65,70][25,35][50,55][65,75][20,25]
B[60,65][75,85][50,55][70,75][25,30][60,65][60,65][15,20]
C[60,70][80,85][50,60][60,70][35,40][55,65][65,75][15,25]
D[75,85][75,85][65,70][60,65][30,40][45,55][60,65][10,15]
E[65,75][85,90][60,65][65,75][25,30][45,50][60,70][15,25]
DM3A[55,60][75,80][45,50][70,75][25,35][55,60][70,75][15,20]
B[55,65][70,75][50,55][70,80][30,35][65,75][70,80][20,25]
C[60,65][80,85][45,55][75,85][40,45][60,70][65,75][25,30]
D[60,70][85,90][50,60][80,85][35,45][65,70][75,80][15,20]
E[55,65][75,85][55,60][75,85][30,35][70,75][75,80][20,25]
DM4A[55,60][65,75][50,55][70,80][30,35][60,70][50,60][15,20]
B[60,70][70,75][55,60][65,70][30,35][65,75][55,65][15,25]
C[65,70][65,75][60,65][60,70]][25,35][55,65][60,65][10,15]
D[75,80][70,75][45,50][65,75][30,40][50,65][55,60][10,20]
E[70,75][80,85][60,65][70,75][35,40][65,70][45,55][15,20]
Table 11. The ranking result of alternatives on overall goal and every criterion.
CriteriaScoresRankings
C1(0.456, 0.380, 0.552, 0.496, 0.535)E > C > A > D > B
C2(0.196, 0.255, 0.535, 0.822, 1.000)E > D > C > B > A
C3(0.891, 0.392, 0.431, 0.437, 0.391)A > D > C > B > E
Overall(0.466, 0.372, 0.543, 0.513, 0.557)E > C > D > A > B

