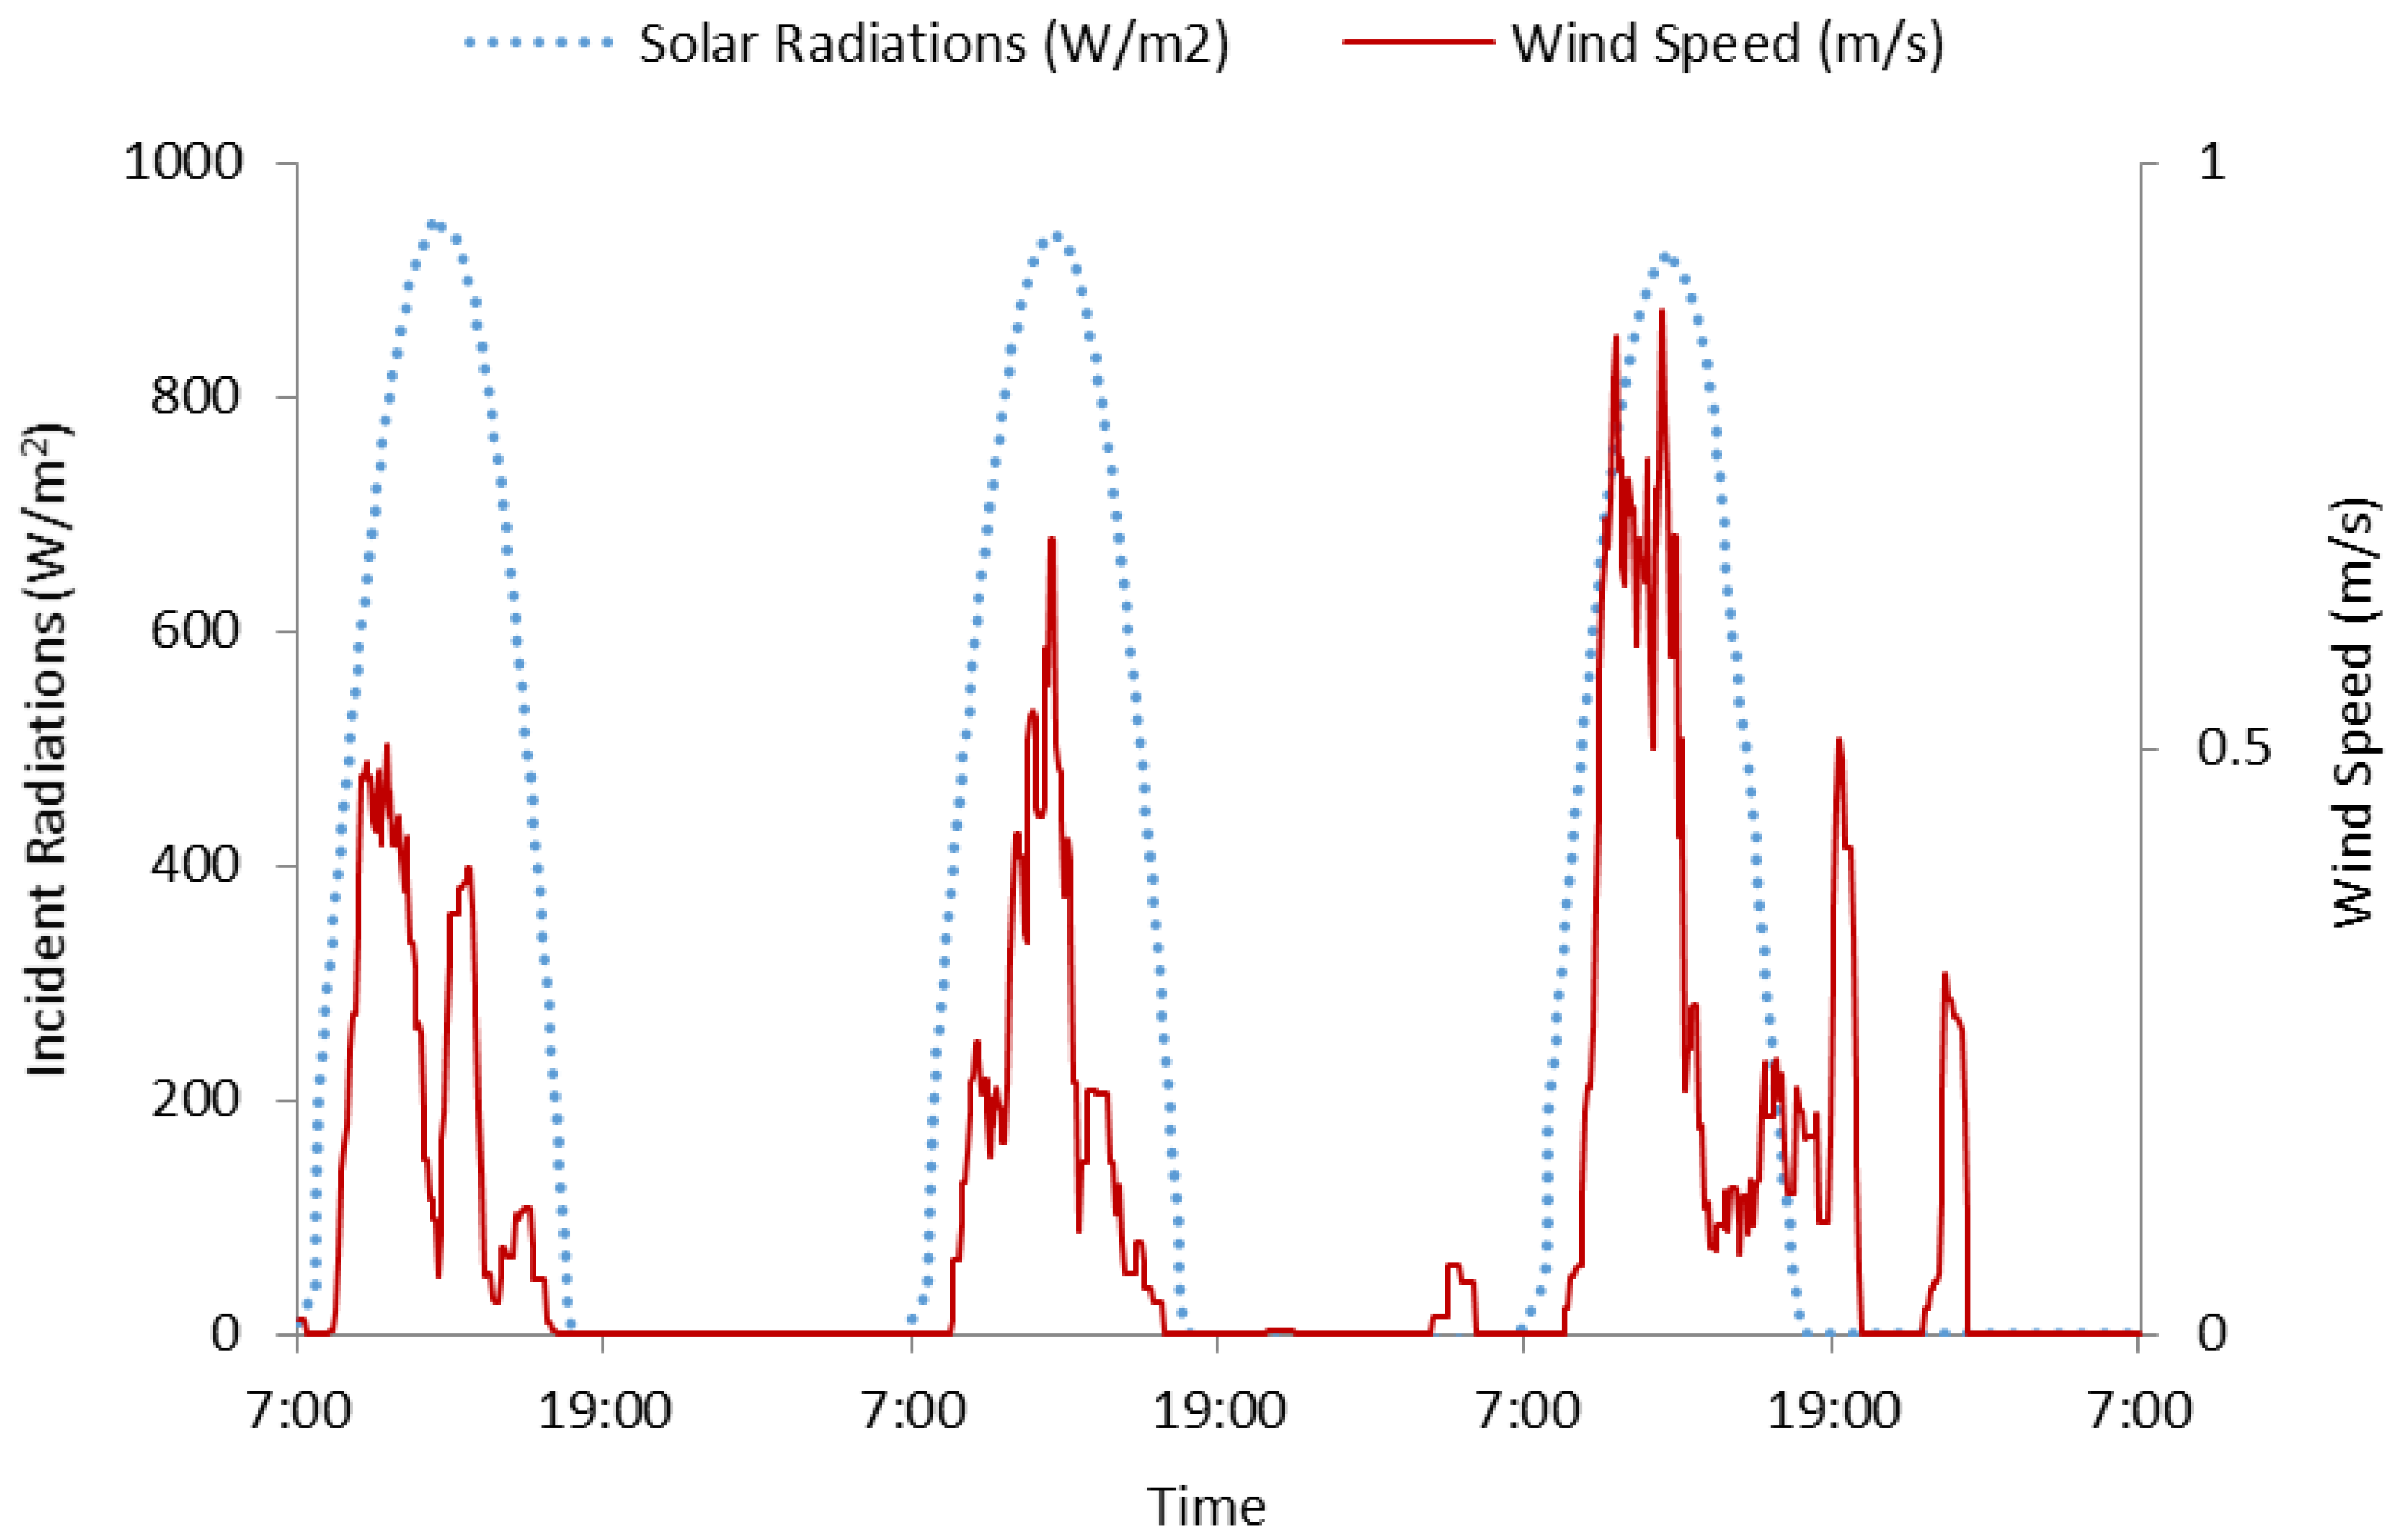
Article

Energy Efficiency Enhancement of Photovoltaics by Phase Change Materials through Thermal Energy Recovery

College of Engineering, United Arab Emirates University, Al Ain 15551, UAE
*
Author to whom correspondence should be addressed.
Energies 2016, 9(10), 782; https://doi.org/10.3390/en9100782
Submission received: 12 June 2016 / Revised: 27 July 2016 / Accepted: 29 July 2016 / Published: 28 September 2016

Abstract

:
Photovoltaic (PV) panels convert a certain amount of incident solar radiation into electricity, while the rest is converted to heat, leading to a temperature rise in the PV. This elevated temperature deteriorates the power output and induces structural degradation, resulting in reduced PV lifespan. One potential solution entails PV thermal management employing active and passive means. The traditional passive means are found to be largely ineffective, while active means are considered to be energy intensive. A passive thermal management system using phase change materials (PCMs) can effectively limit PV temperature rises. The PCM-based approach however is cost inefficient unless the stored thermal energy is recovered effectively. The current article investigates a way to utilize the thermal energy stored in the PCM behind the PV for domestic water heating applications. The system is evaluated in the winter conditions of UAE to deliver heat during water heating demand periods. The proposed system achieved a ~1.3% increase in PV electrical conversion efficiency, along with the recovery of ~41% of the thermal energy compared to the incident solar radiation.

Graphical Abstract

1. Introduction

The most efficient photovoltaic (PV) cells convert up to 27.6% of incoming solar radiation into electricity based on PV cell material [1,2], while the remaining more than 72% is reflected or converted into heat [3,4]. The incident energy converted into heat leads to elevated PV temperatures [5]. The PV temperature varies depending on the incoming solar radiation intensity (G), ambient temperatures (Tamb), inclination of the PV panel, wind speed (Vw), mounting scheme of the panel, partial shading, dust accumulation and faults conditions in the panels [6,7]. The increased PV temperature consequently reduces the open circuit voltage [8], although a marginal increase in current [9] also occurs, with a net effect of a drop in PV power [8,10]. The temperature-induced power drop has been extensively studied and temperature-based power drop coefficients (Tc) ranging from 0.3%/°C to 0.5%/°C are determined, based on the cell technology used [11,12,13,14]. The Tc value may further increase over time due to thermal annealing depending on the cell operation conditions [15].
The effects of increased temperature on PV lifespan are reviewed in [16], where it was concluded that PV cells degrade faster in hot climates due to long-term thermal ageing caused by their elevated operating temperatures [17]. Additionally the PV panels lose structural integrity due to delamination caused by prolonged operations under elevated temperatures [18]. The conventional PV cooling techniques rely on active (air or water) circulation and passive air circulation, comprehensively reviewed by [19]. This work concludes that passive cooling (natural ventilation) is not an optimum option as the PV temperatures can still rise up to 70 °C. Active cooling can limit the temperature within 30 °C, however it consumes tremendous amounts of power through the use of fans or pumps which may override the potential benefits achieved by cell cooling.
A novel method was introduced to cool the PV panels by employing phase change materials (PCMs) on a model PV [20]. Various PCMs were characterized and a selection criteria was developed for their intended use in relation to PV cooling in outdoor ambient conditions [21]. The so-called photovoltaic-phase change materials (PV-PCM) system was evaluated for different PCM containment options [22] and a combination of PCMs with different melting points [23] which were then tested under various solar radiation intensities indoors [24] resulting in effective temperature control. The PCM cooling performance was further enhanced by inserting internal metallic fins which yielded improved PCM melting and solidification due to enhanced thermal conductivity. Conclusively, the PV-PCM technology have been proved to be effective in limiting temperature rise and increasing the performance of PV devices under single Sun [25] as well as low solar radiation concentration [26]. The PV-PCM technology has been tested in different climatic conditions [27] concluding that such technology is found to be more effective in warmer climates. Although the technology is effective in PV cooling as reviewed in detail by [28], it is still not commercially viable [29] unless the thermal energy part can be stored. Temperature regulation and electrical performance enhancement using PV-PCM technology is reviewed comprehensively by [30] emphasizing a need for more research on optimization of heat extraction and utilization.
The current research further enhances previous findings by investigating the extraction of heat stored in PCM and utilizing it for water heating applications. The article presents experimental results in order to quantify the electrical efficiency improvement and thermal energy benefits for water heating using the PV-PCM technology.

2. Methodology

The research methodology consists of the thermo-physical characterization of the PCM and integration of PCM into PV for its passive cooling. The PCM is characterized by differential scanning calorimetry (DSC) to confirm its thermos-physical properties. The PCM is encapsulated at the back of the PV to study its cooling effect and thermal energy storage capability. The cooling effect is quantified by the temperature changes in PV achieved by the presence of the PCM on the front and back surfaces of the PV. The thermal energy storage by the PCM is determined by changes in temperature and physical state (solid-liquid) of the PCM. The thermal energy stored in PCM is extracted by water circulation. The useful thermal energy gain by the water is calculated by changes in (averaged) water temperatures in the storage tank. The enhanced PV power due to the PV cooling is calculated by measuring the open circuit voltage and short circuit current of the respective PVs. Finally, an energy balance is carried out by comparing the solar gains by PV to the sum of electrical energy produced by PV, heat losses by PV, and heat stored in PCM behind PV. The heat stored in PCM is eventually compared with useful energy gain by the water circulated behind the PV containing the PCM.

2.1. Experimental Setup

Polycrystalline EVA-encapsulated PV panels with dimension of 53 cm × 63 cm, rated capacity of 40 W and module efficiency of 15% were tested outdoors facing south at the latitude of Al Ain (24.1° N, 55.8° E). The electrical performance of the modules was confirmed by measuring the open circuit voltage (Voc) and short circuit current (Isc) prior to inclusion of the PCM in the panels. One PV panel (without PCM) was treated as reference and the other two were connected to internally finned containers filled with solid PCM using epoxy resin glue. The containers and internal fins were fabricated from a 4 mm thick sheet of aluminum alloy (1050A). A tubular (1 cm internal diameter) metallic heat exchanger fabricated from the same alloy was embedded in the container to circulate water as heat transfer fluid, as shown in Figure 1.
50 L of water were contained in a polyethylene container with a thermal conductivity of 0.33–0.52 W·m−1·K−1 [31]. Upon PCM melting, water was circulated from the PV-PCM container through insulated polymer pipes with thermal insulation of 1.2–3.0 Km2·W−1 at a flow rate of 0.027 L/s to remove stored heat in the melted PCM. Multiple t-type copper-constantan thermocouples tested in an ice-bath with a measurement error of ±0.3 °C were installed on the three PV systems as shown in Figure 2. The thermocouples covered the front PV surface, back PV surface, inside the PCM and inside the water tank. The thermocouples were positioned on the front surface and were shielded from direct irradiation using a strong tape. A self-powered pyrometer with 0.20 mV per Wm−2 sensitivity and ±5% calibration uncertainty [32] was installed at the latitude angle of the site (24.1° N, 55.8° E) to measure solar radiation intensity (G). A weather station with temperature accuracy of ±1 °C [33] was installed to measure ambient temperature (Tamb) and wind speed (Vw). All the sensors were connected to a National Instruments (NI) compact Rio to log the data as shown in schematic of the experimental set up in the Figure 2. The measurement uncertainties for all the devices are listed in Table 1.

2.2. Experimental Procedures

The PCM was characterized through differential scanning calorimetry (DSC) to verify its thermo-physical properties given in Table 2 [40,41,42,43]. The PCM was filled as liquid (10.2 L) in the containers attached to the PV and subsequently cooled until it completely solidified. The solidified PCM left a 7 cm free space on top intended to accommodate volume expansion during PCM melting. The experiments were conducted for three consecutive days from 30 January 2015 to 2 February 2015 and same PCM solid state at the start of experiments were assured for each day. Water circulation was triggered every day upon PCM complete melting at 13:00 and was stopped upon complete heat removal at 16:00. The data was logged for the reference PV, the PV with PCM (PV-PCM) and PV-PCM with water circulation (PV-PCM-W) with a time step of 5 min.

3. Results and Discussion

3.1. Weather Data

Figure 3 shows global solar radiation intensity (G) and wind speed (Vw) during the three days of the experiment.
It indicates that for all the three days, G remained fairly stable with similar profile however with a slight difference in the peak as well as average hourly radiation intensity summarized in Table 3.
For all the three days, the speed (Vw) remained very low with a peak and average values of 0.9 m/s and 0.2 m/s. The airflow around the PV surface caused by windy conditions induces natural convection heat losses empirically predicted by Tiwari [44]. The approach is based on combined convective and radiative heat loss coefficient (h) applicable to air velocities ≤3 m/s given by Equation (1):
h = 5.7 + 3.8   V w
The h calculated through Equation (1) ranges between 7.6–9 W/m2·K at peak and 6–6.34 W/m2·K on average for the front surface for the three days. The h value calculated for the back surface remained lower than that of the front surface, ranging from 6.3–6.7 W/m2·K at peak and −0.58–6 W/m2·K on average. It can be noticed that on average the h value did not differ substantially between the front and back PV surface. However the peak h value at the PV back surface remained substantially lower than at the front surface. The substantially lower peak h value at the back surface yielded lesser heat loss and resulted in a substantial temperature rise at the back compared to the surface of the reference PV, noticeable in Figure 4 and Figure 5.
The lower h values indicate that natural convection cannot effectively cool the PV at this site, thereby resulting in higher PV temperatures that eventually affects the PV electrical conversion efficiency. However, lower h values can be potentially beneficial once the concept of thermal energy storage and recovery is introduced in the PV, as it would minimize heat losses. The solar radiation absorbed by the PV (Qpv) depends on the surface area (A) and cleanliness of the PV surface represented by dusting coefficient 0.77 (dc) and the absorptance (α) of the PV panel as given by Equation (2):
Q PV = G × A × d c × α
The Qpv values are summarized in Table 3, which indicates that PV receives reasonably different amount of radiation each day, with a highest deviation amongst the three days of 9.2%.

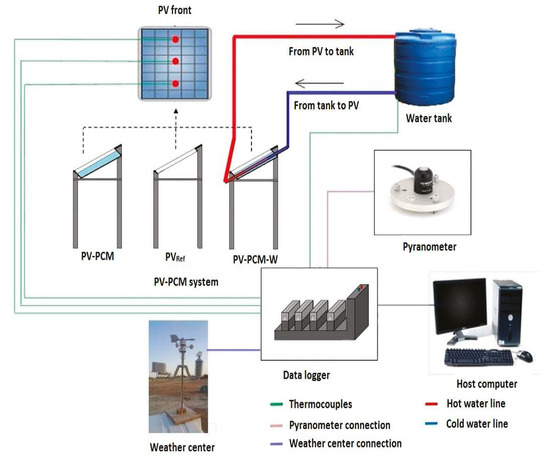
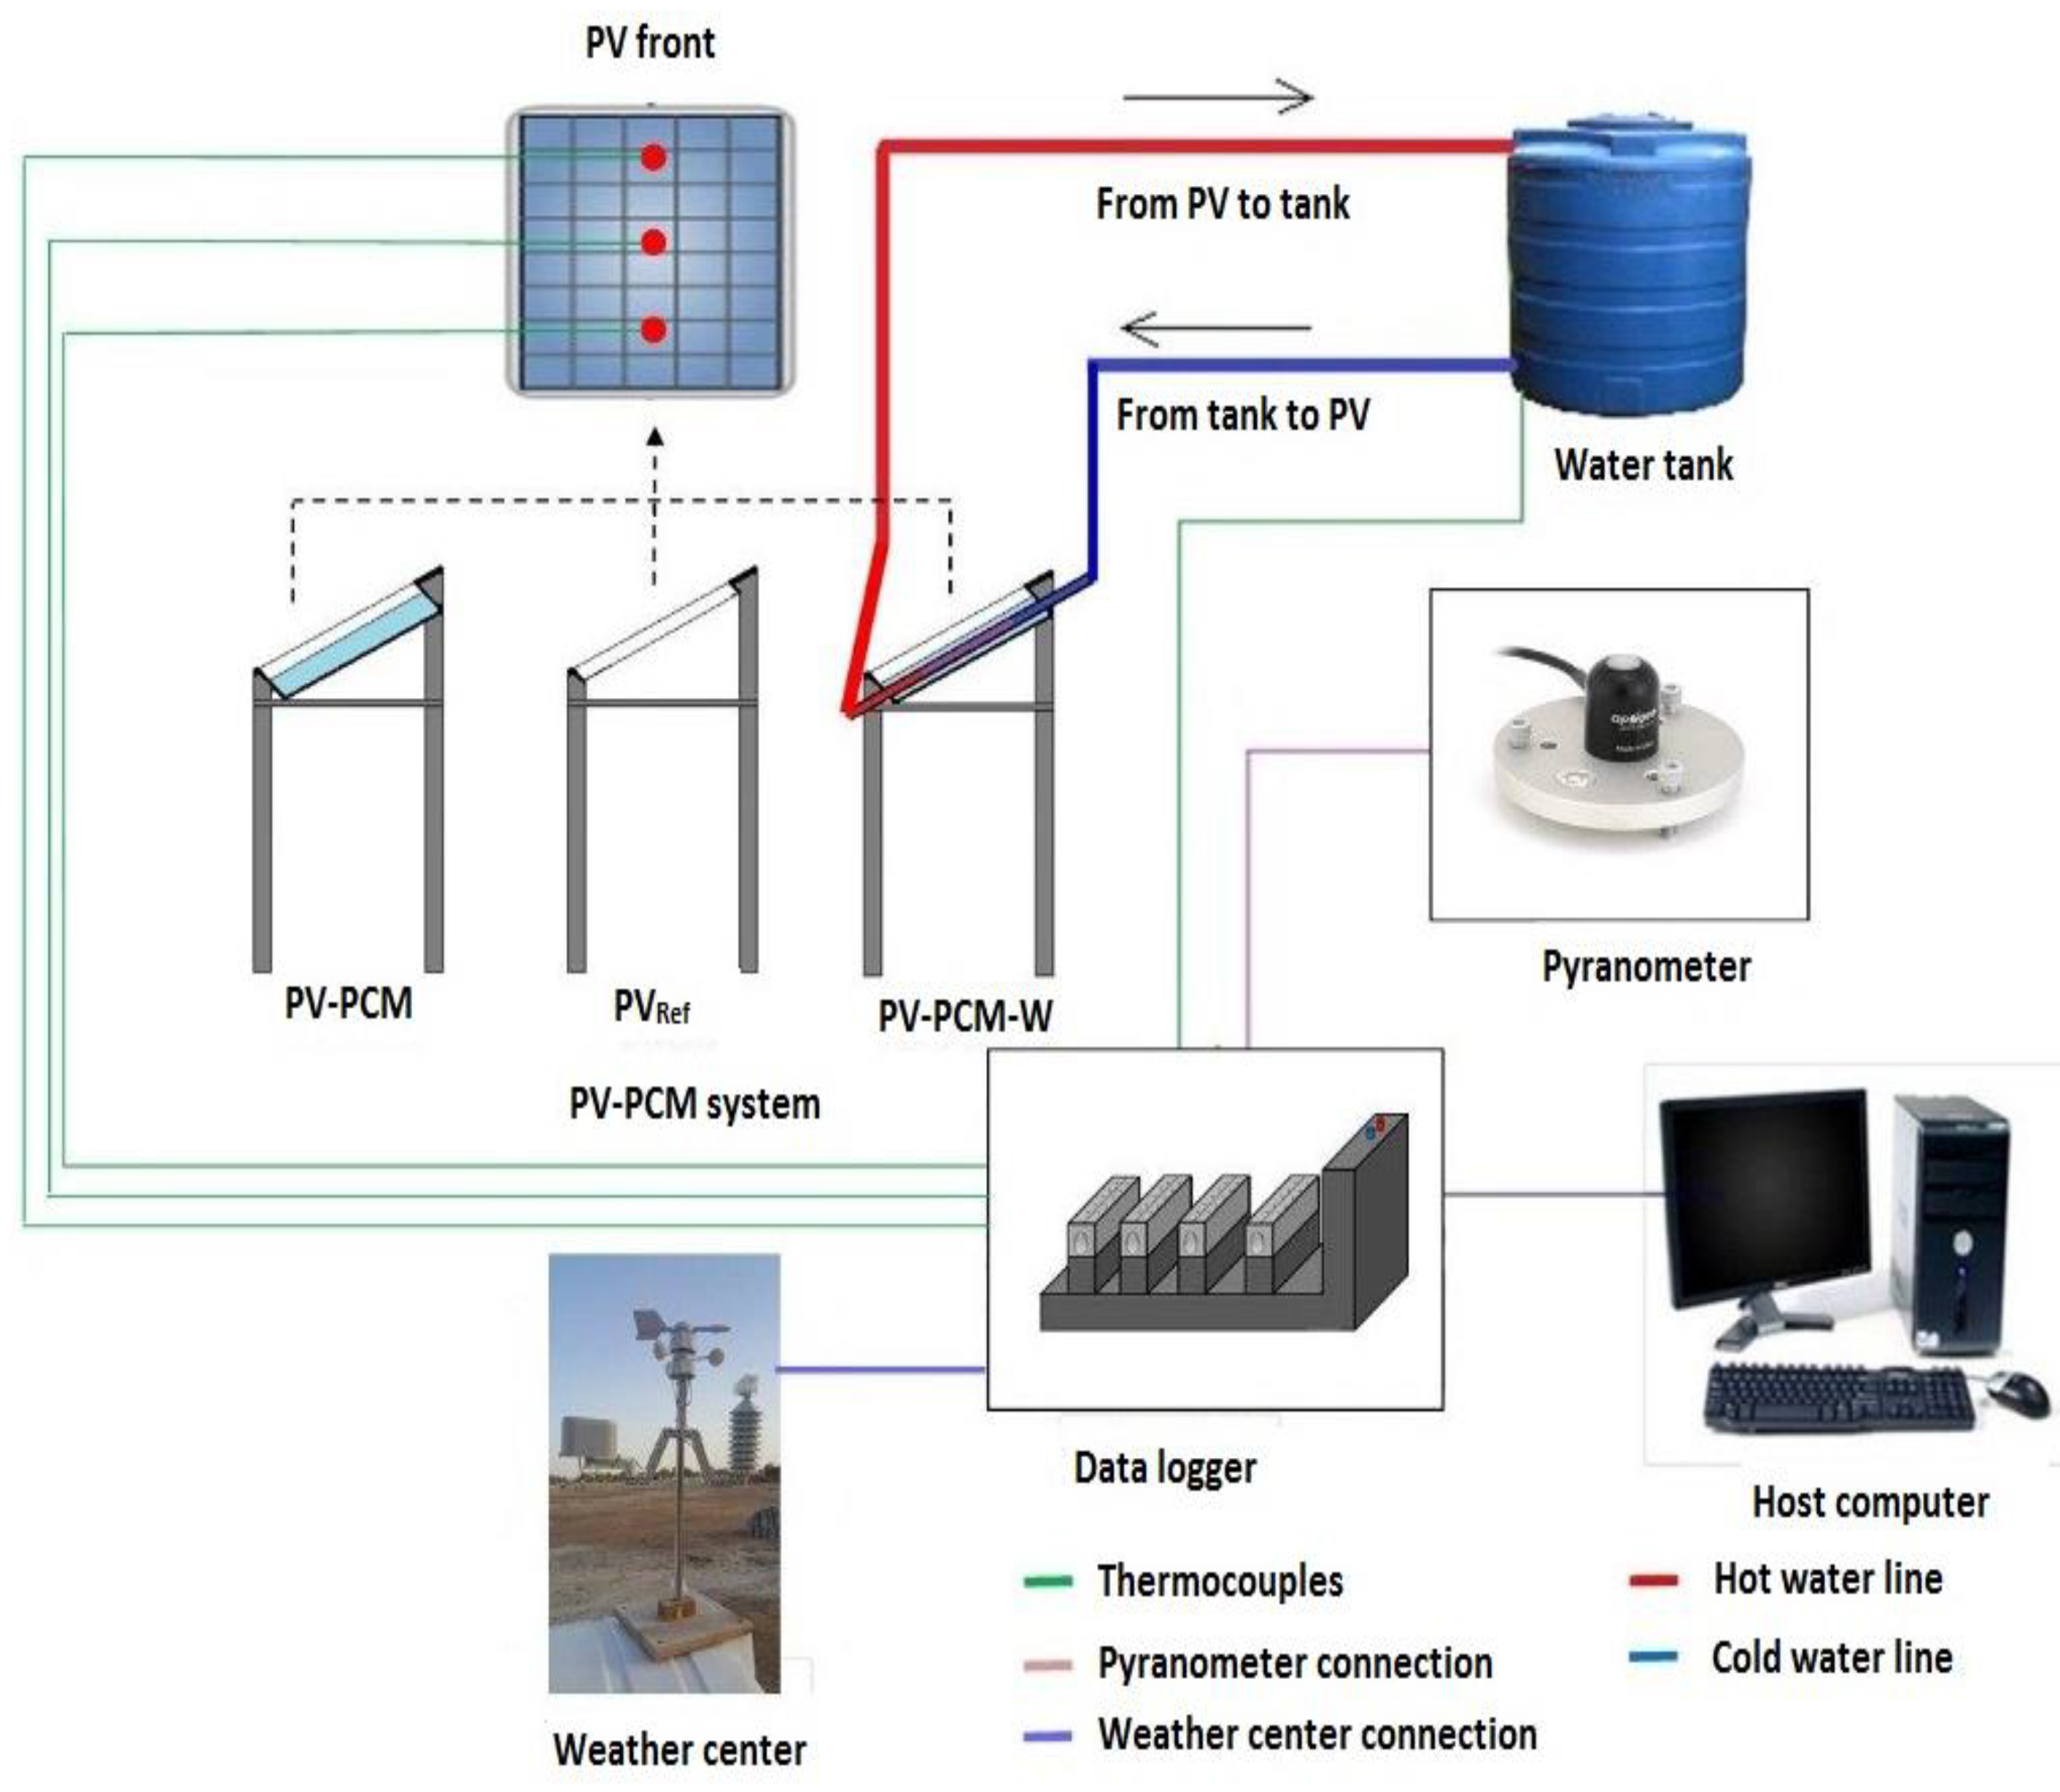
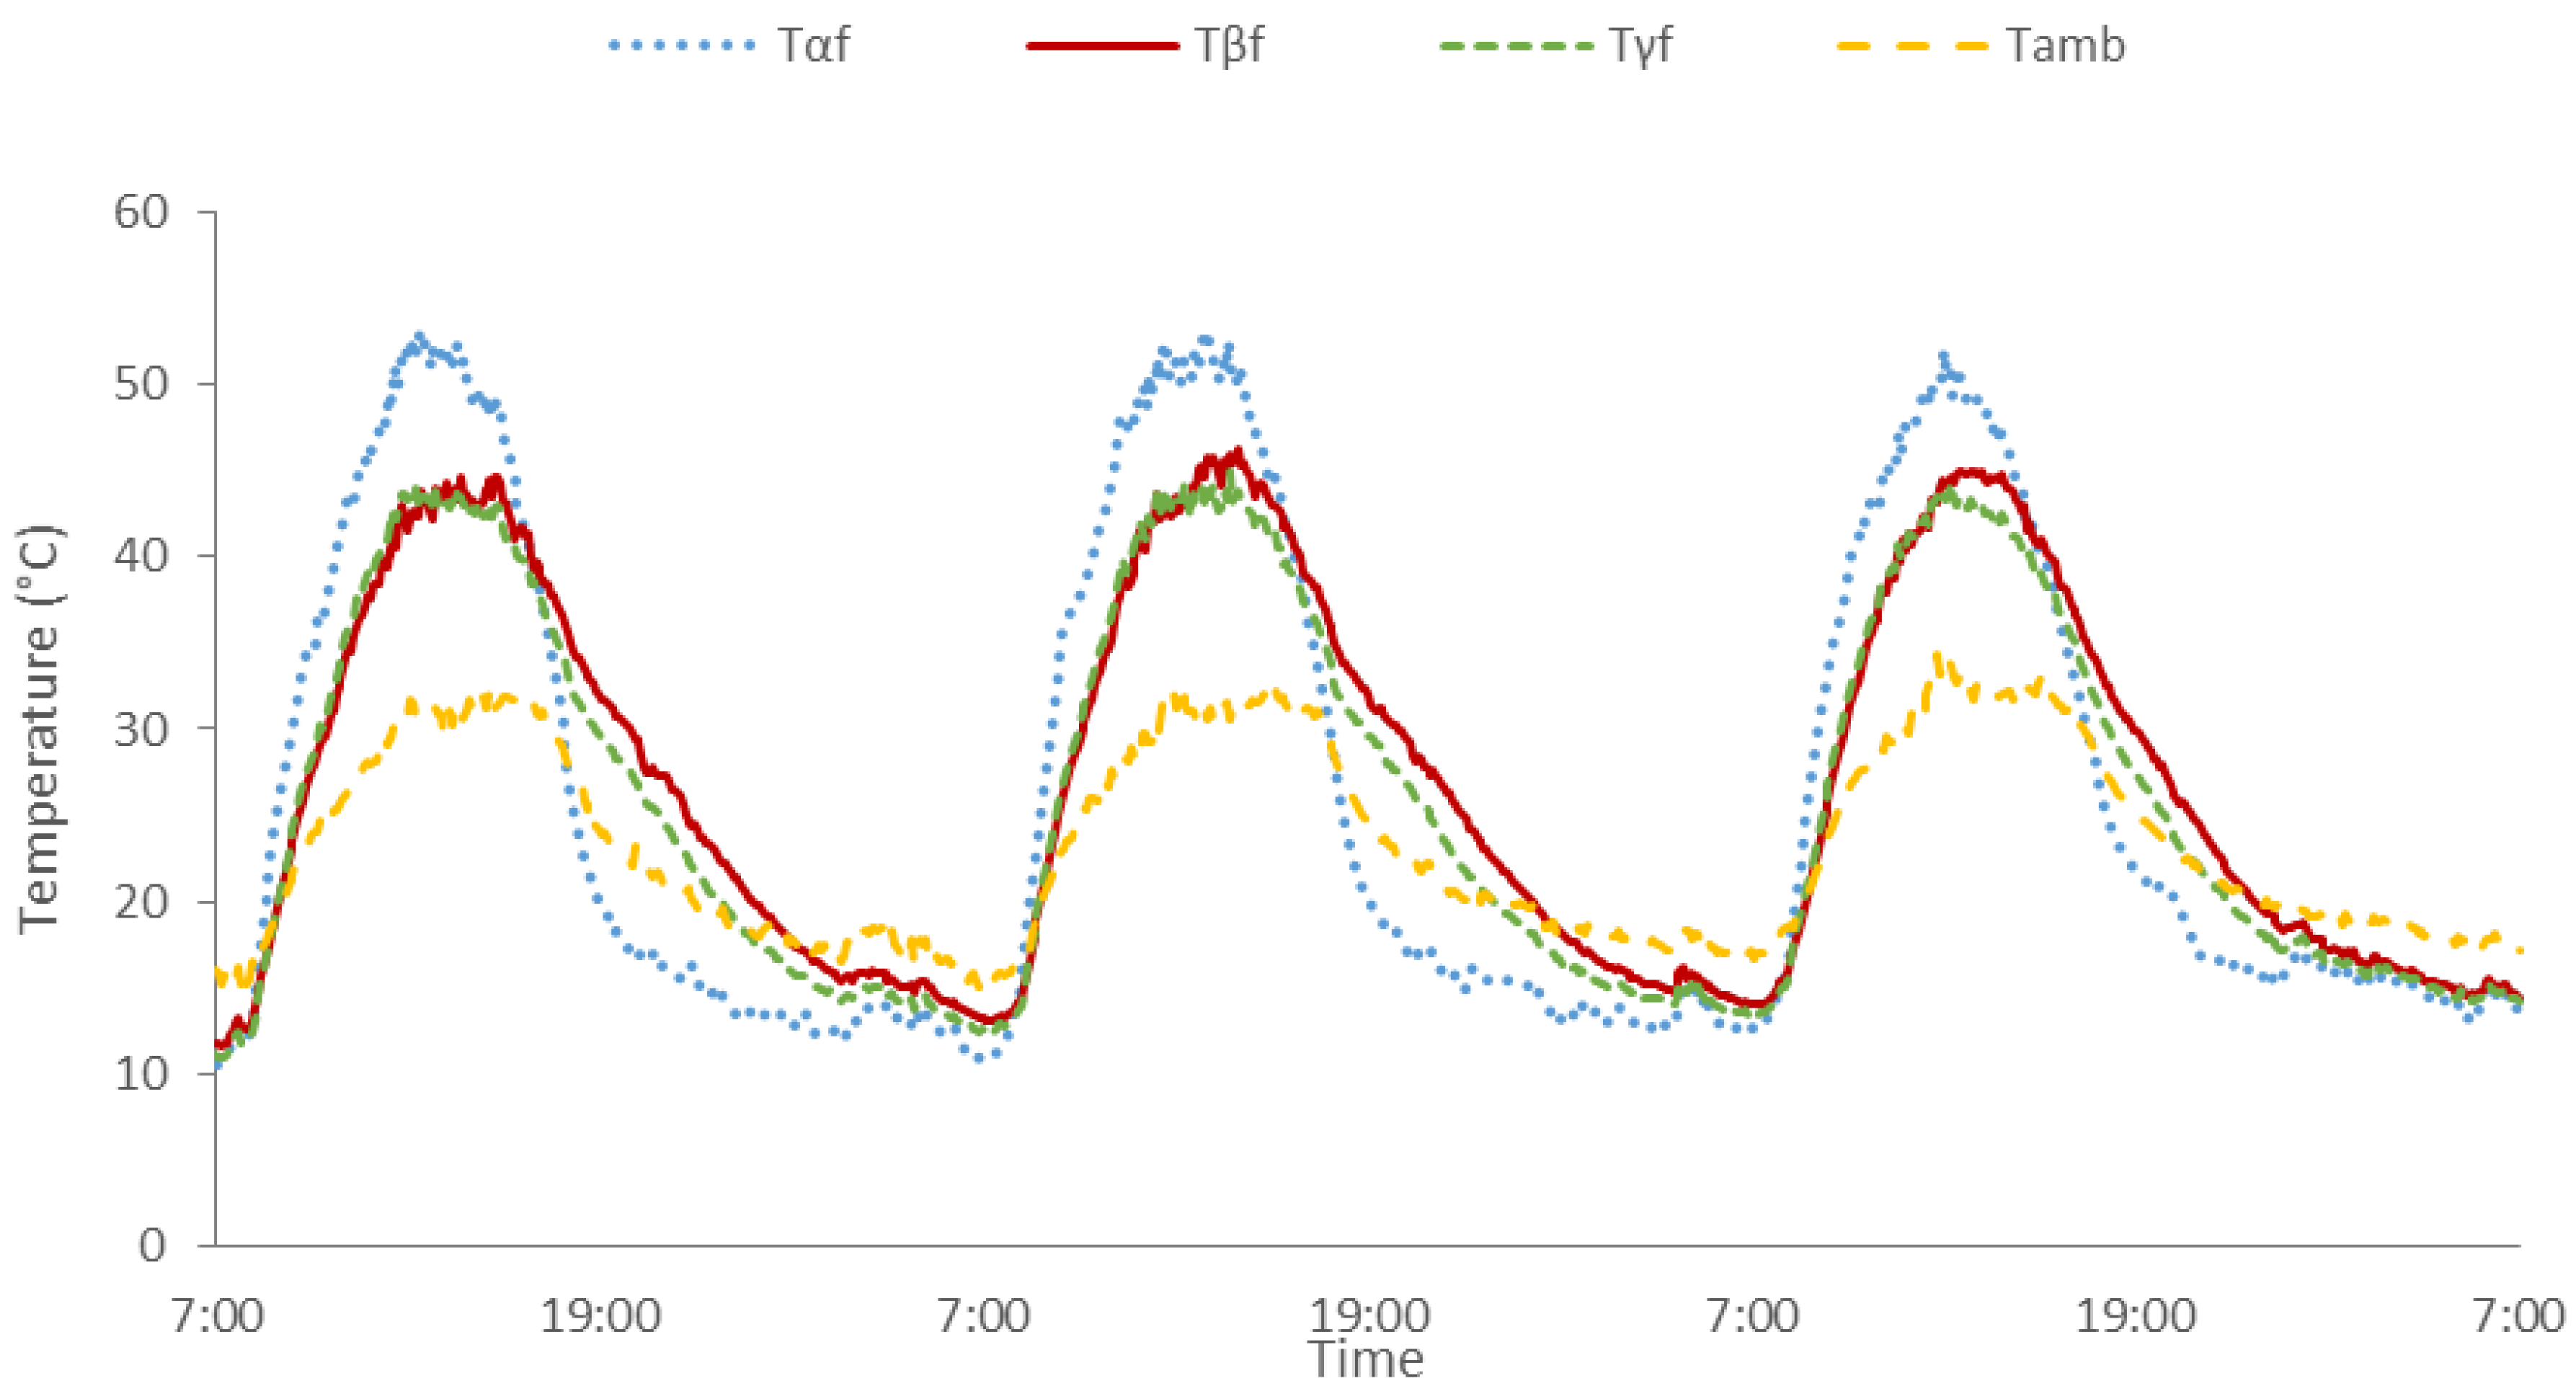
3.2. Temperature Drop

The measured front surface temperatures of the reference PV (Tα), PV-PCM (Tβ) and PV-PCM with water circulation (Tγ) along with ambient temperature (Tamb) are presented in Figure 4. Figure 4 shows that at start of the experiment, Tamb was 16 °C, which increased with a stable gradient reaching peak of 32 °C at 13:00 for day 1. It can be observed that Tamb remained at all times below the PCM melting initiation temperature (Tm) of 37 °C indicating that Tamb alone would not trigger PCM melting. At the start of the experiment, Tαf, Tβf and Tγf were almost the same (11 °C) being substantially lower than Tm, indicating that PCM contained at the PV back was in solid state at the start of the experiment which was also confirmed by visual inspection. As radiation hits the PV at 7:00 am, the temperature started to increase for the three PV modules however each with a different gradient. As expected, Tαf exhibited a higher gradient of rise followed by Tβf and Tγf with a time lag caused by a higher thermal inertia achieved by the inclusion of the PCM (in PV-PCM and PV-PCM-W) compared to the PV alone. The Tαf reached its peak at 53 °C at 1:25 PM while Tβf and Tγf remained below 44 °C at the same time yielding a drop of 9 °C at peak. The average Tαf reached 38.5 °C, followed by 33.5 °C and 33.4 °C in the cases of Tβf and Tγf, respectively, rendering an average temperature drop of 5 °C compared to the PV without PCM. The water circulation at 13:00 induced a slight additional temperature drop observed in Tγf. A similar trend in temperature rise was observed for the remaining two days with slightly different magnitudes. The different Tαf, Tβf and Tγf values resulted in different amounts of heat being discarded to the environment through natural convection and radiation, quantified by Equations (3)–(5):
Q l α f = h × A × ( T α f T amb )
Q l β f = h × A × ( T β f T amb )
Q l γ f = h × A × ( T γ f T amb )
where Ql and A represent the heat loss and cross-section area of the PV panel, respectively. Applying Equations (3)–(5), on the measured data, it is found that the front surface of the reference PV discarded 380 Wh/day to ambient, which was reduced to 242 Wh/day (for PV-PCM) and 232 Wh/day for PV-PCM with water flow.
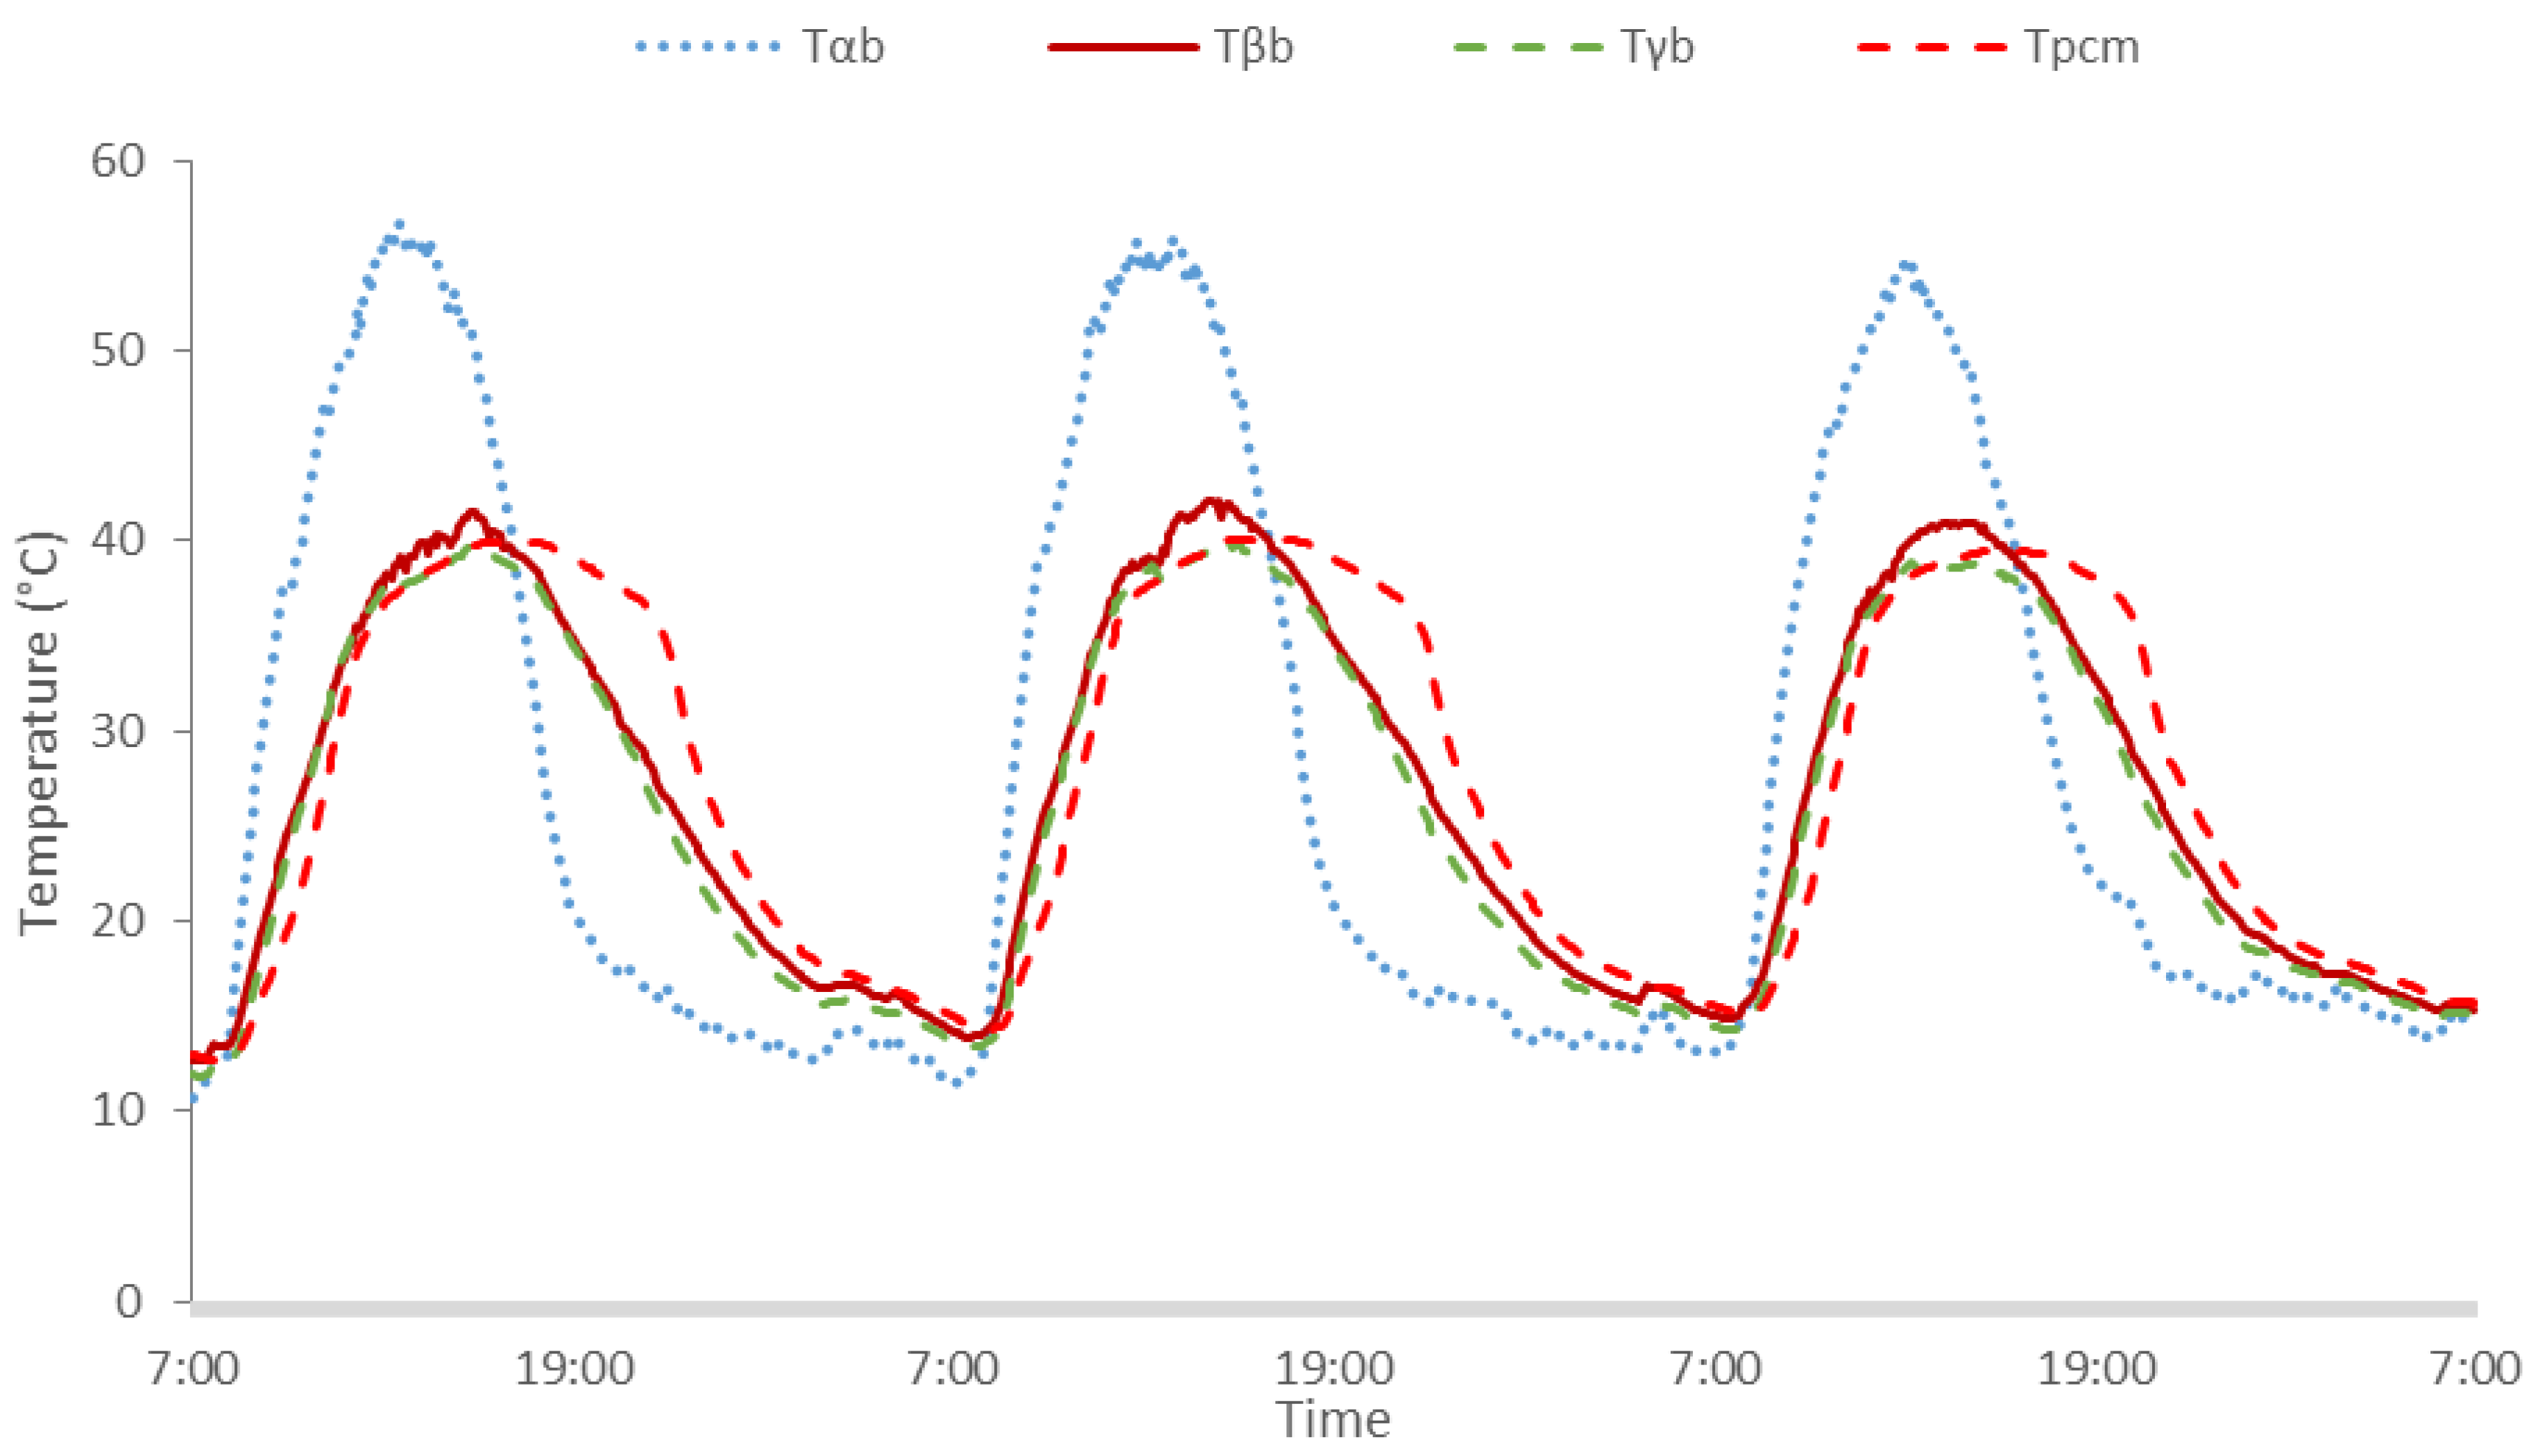
The Tpcm along with the back surface temperatures of the reference PV (Tαb), PV-PCM (Tβb) and PV-PCM with water circulation (Tγb) are presented in Figure 5. All the temperatures, Tαb, Tβb, Tγb and Tpcm were almost the same at the start of the experiment, however they differed in transient temperature rise afterwards, reaching peak values of 57 °C, 39 °C, 38 °C and 42 °C, respectively. It can be see that inclusion of the PCM caused a delay in the temperature rise compared to the PV alone due to the increased thermal inertia of the system caused by the PCM’s latent heat absorption. The peak temperature drop was 19 °C (from 57 °C to 38 °C). Taking the average of the temperature curves, it was noted that an average temperature drop of 10 °C was achieved at the back surface of PV-PCM for day 1, attributed to the heat stored in the PCM. The reduced Tβb, Tγb prevented heat loss from the back surface of the PV-PCM compared to the reference PV calculated by the combined convection and radiation heat loss Equations (6)–(8) below:
Q l α b = h × A × ( T α b T amb )
Q l β b = h × A × ( T β b T amb )
Q l γ b = h × A × ( T γ b T amb )
Heat losses at the back of the PV surface are calculated by applying Equations (6)–(8) on the experimental data from Figure 5. The heat losses dropped from 409 Wh/day for the reference PV (Qlαb) to 143 Wh/day for both PV-PCM and PV-PCM-W (Qlβb and Qlγb, respectively). By combining the front and back surface heat losses, the total heat loss dropped from 794 Wh/day (reference PV) to 385 Wh/day in case of PV-PCM and 375 Wh/day for PV-PCM-W preventing a heat loss of 409 Wh/day and 419 Wh/day, respectively.
Heat losses prevented by the PCM alone are calculated by deducting the sensible heat stored in metallic parts in PV-PCM system calculated using Table 4 (53 Wh/day) [40,42,45]. The heat loss thereby prevented by the PCM dropped to 356 Wh/day.
It can be seen that the inclusion of a PCM reduced the PV temperature (Figure 4 and Figure 5) while reducing heat losses. The novelty of the latent heat storage concept lies in reducing the heat losses by maintaining a lower temperature compared to sensible heat dissipation systems. The heat retention along with lower PV temperature has two benefits. The reduced temperature can increase the PV power output as discussed in Section 3.4, while the retained heat (solely due to heat loss prevention) can be utilized for water heating, as discussed in Section 3.3. The PV temperature drop along with heat retention and utilization by PCM is in agreement with the reported literature findings [46].
The retained heat was consumed in melting the PCM which can be determined by observing changes in PCM temperature (Tpcm). Figure 5 shows that Tpcm reached 37 °C (start of PCM melting) at 11:00, increasing to 42 °C (end of PCM melting) at 12:40 and continued to rise to 43 °C at 13:00. This indicates that PCM had completely melted before 13:00 prior to triggering the water flow to remove the heat stored in the melted PCM to heat the water. At nighttime, the Tpcm dropped below 37 °C (PCM solidification temperature) at 21:00 and reached the lowest value of 13 °C by the morning. It indicates that the PCM had completely solidified before the start of the next day, which was also confirmed by visual inspection. Since the PCM showed complete phase change (melting and solidification), the energy stored can be calculated by assuming complete solid-liquid phase transition given by Equations (9)–(11):
Q s α = ρ α V α C p α   ( T α i T α f )
Q s β = ρ β V β C p β   ( T β i T β f ) + ρ pcm V pcm L
Q s γ = ρ γ V γ C p α   ( T γ i T γ f ) + ρ pcm V pcm L
where ρ, V, Cp are density, volume and heat capacity, while subscripts i and f represent the initial and final state of the PCM. Heat absorbed by the reference PV (Qα), PV-PCM (Qβ) and PV-PCM-W (Qγ) calculated by Equations (9)–(11) are 15 kWh/day, 418 Wh/day and 429 Wh/day, respectively. The heat stored (418 Wh/day and 429 Wh/day) is in close agreement to the prevented heat loss (409 Wh/day and 419 Wh/day) by PV-PCM and PV-PCM-W, respectively, which proves the accuracy of our experiments.

3.3. Useful Energy Gain for Water Heating

In order to extract the thermal energy stored in the PCM, water at an initial temperature of 29 °C was pumped into melted PCM at a flow rate of 0.027 L/s starting from 13:00 (shown by arrows in Figure 6) till 16:00 with a total volume of 50 L. The measured water temperature for the three days of the experiment is shown in Figure 6. The initial ~2 °C increase in water temperature at the start of the days is attributed to the heat exchange with the ambient. The water tank was insulated during the daytime and uninsulated at nighttime to allow the water self-cooling to be ready for the next day recirculation. The insulation was put on at 9:00 each day, which can be confirmed that after initial temperature rise, the water temperature remained stable until the pump was turned on. It can be observed that water temperature raised from 29 °C to 38 °C showing an increase of 9 °C. The heat removed by circulating water (Qw) applying sensible heat gain Equation (12):
Q w = ρ w V w C pw   ( T wi T wf )
where ρw, Vw, Cpw, Twi and Twf are the density, volume, specific heat capacity, initial temperature and final temperature for water, respectively. Applying Equation (12) it is calculated that 521 Wh/day of thermal energy was stored in the water, representing ~41% of the incoming global radiation incident on the PV (1256 Wh/day) as presented in Table 3.

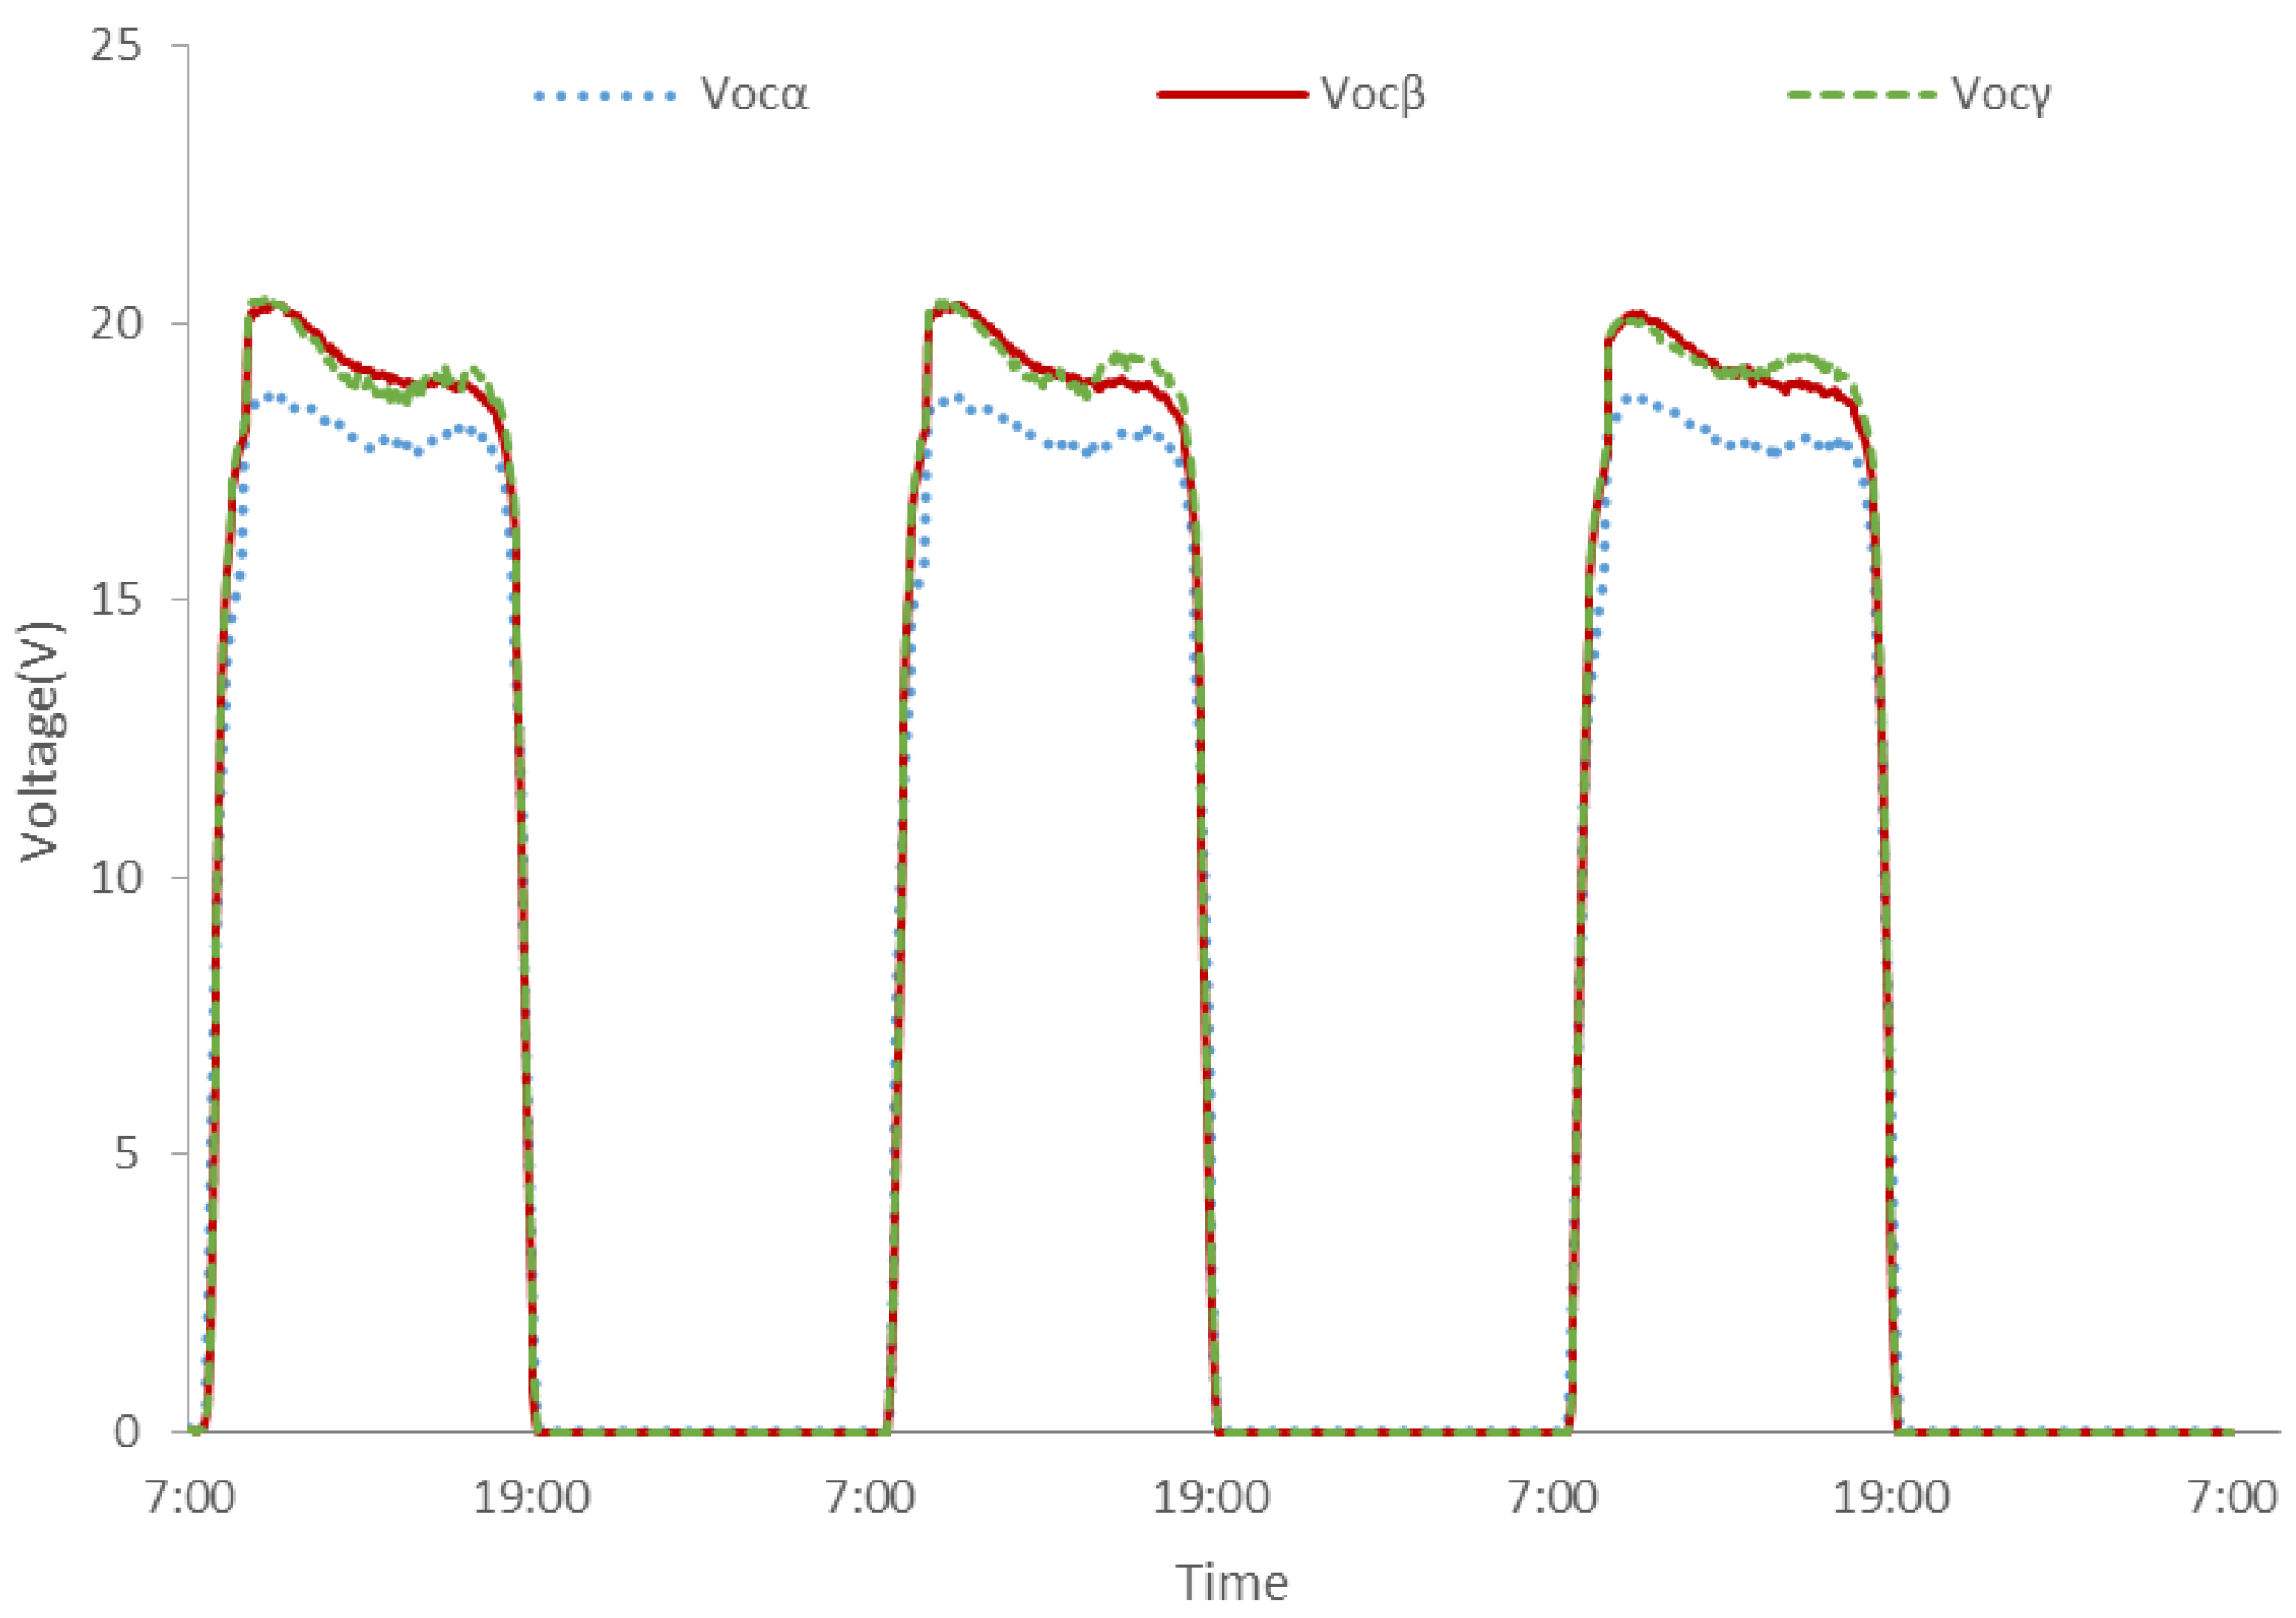
3.4. Improvement in PV Power Output

The decrease in temperature reported in Section 3.2 has a positive effect on the PV voltage but a negative effect on current due to the decreased charge mobility. The measured Voc presented in Figure 7 shows that PV-PCM and PV-PCM-W maintained a higher Voc compared to the reference PV. The peak Voc was recorded as 18.6 V for reference PV (Vocα), 20.3 volt for PV-PCM (Vocβ) and 20.3 V for PV-PCM-W (Vocγ). It indicates that inclusion of PCM yielded an ~9% increase in Voc by virtue of maintaining lower temperatures.
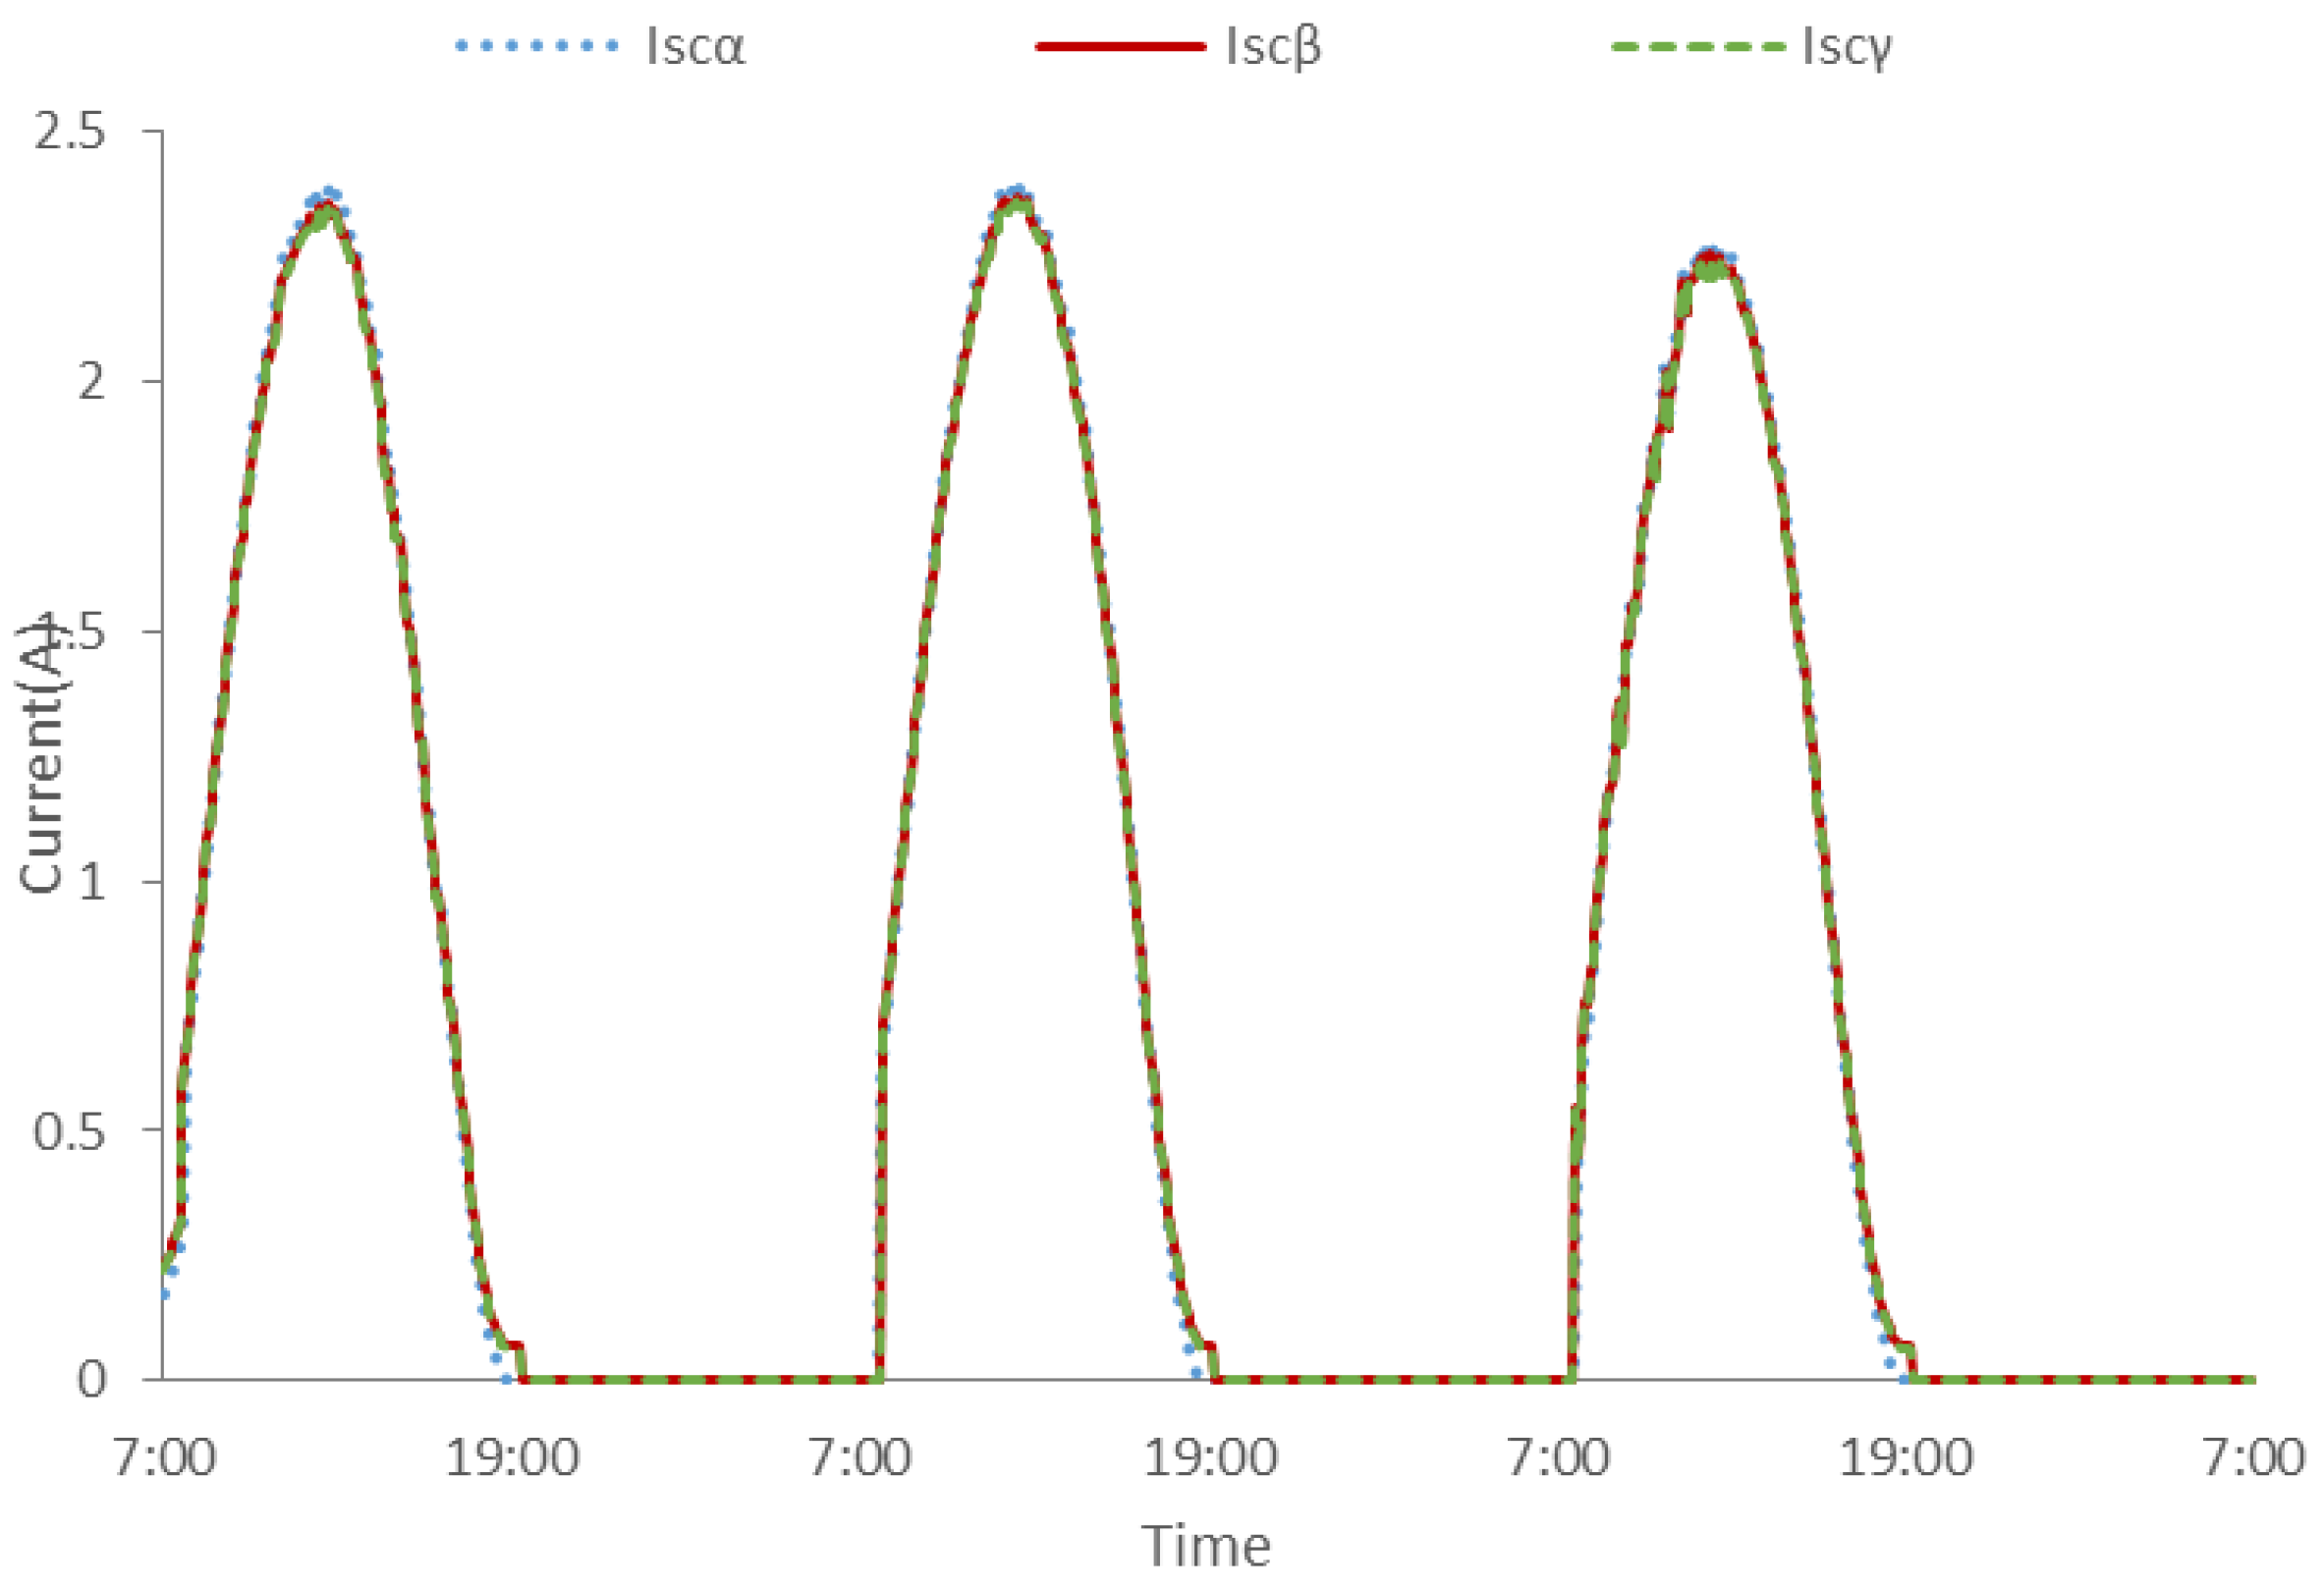
The Isc presented in Figure 8 shows a relatively negligible difference amongst the three systems apart from that at the peak. The reference PV maintained a slight higher current (Iscα) compared to PV-PCM (Iscβ) and PV-PCM-W (Iscγ) due to being at higher temperature.
From recorded Voc and Isc, the power produced by PV is calculated by applying the fill factor (FF) correlation given by Equation (13):
P   = ( V oc × I sc ) / F F
where P is the electrical power produced by the PV. The FF is considered to be constant (0.7) deduced from PV data sheet. 
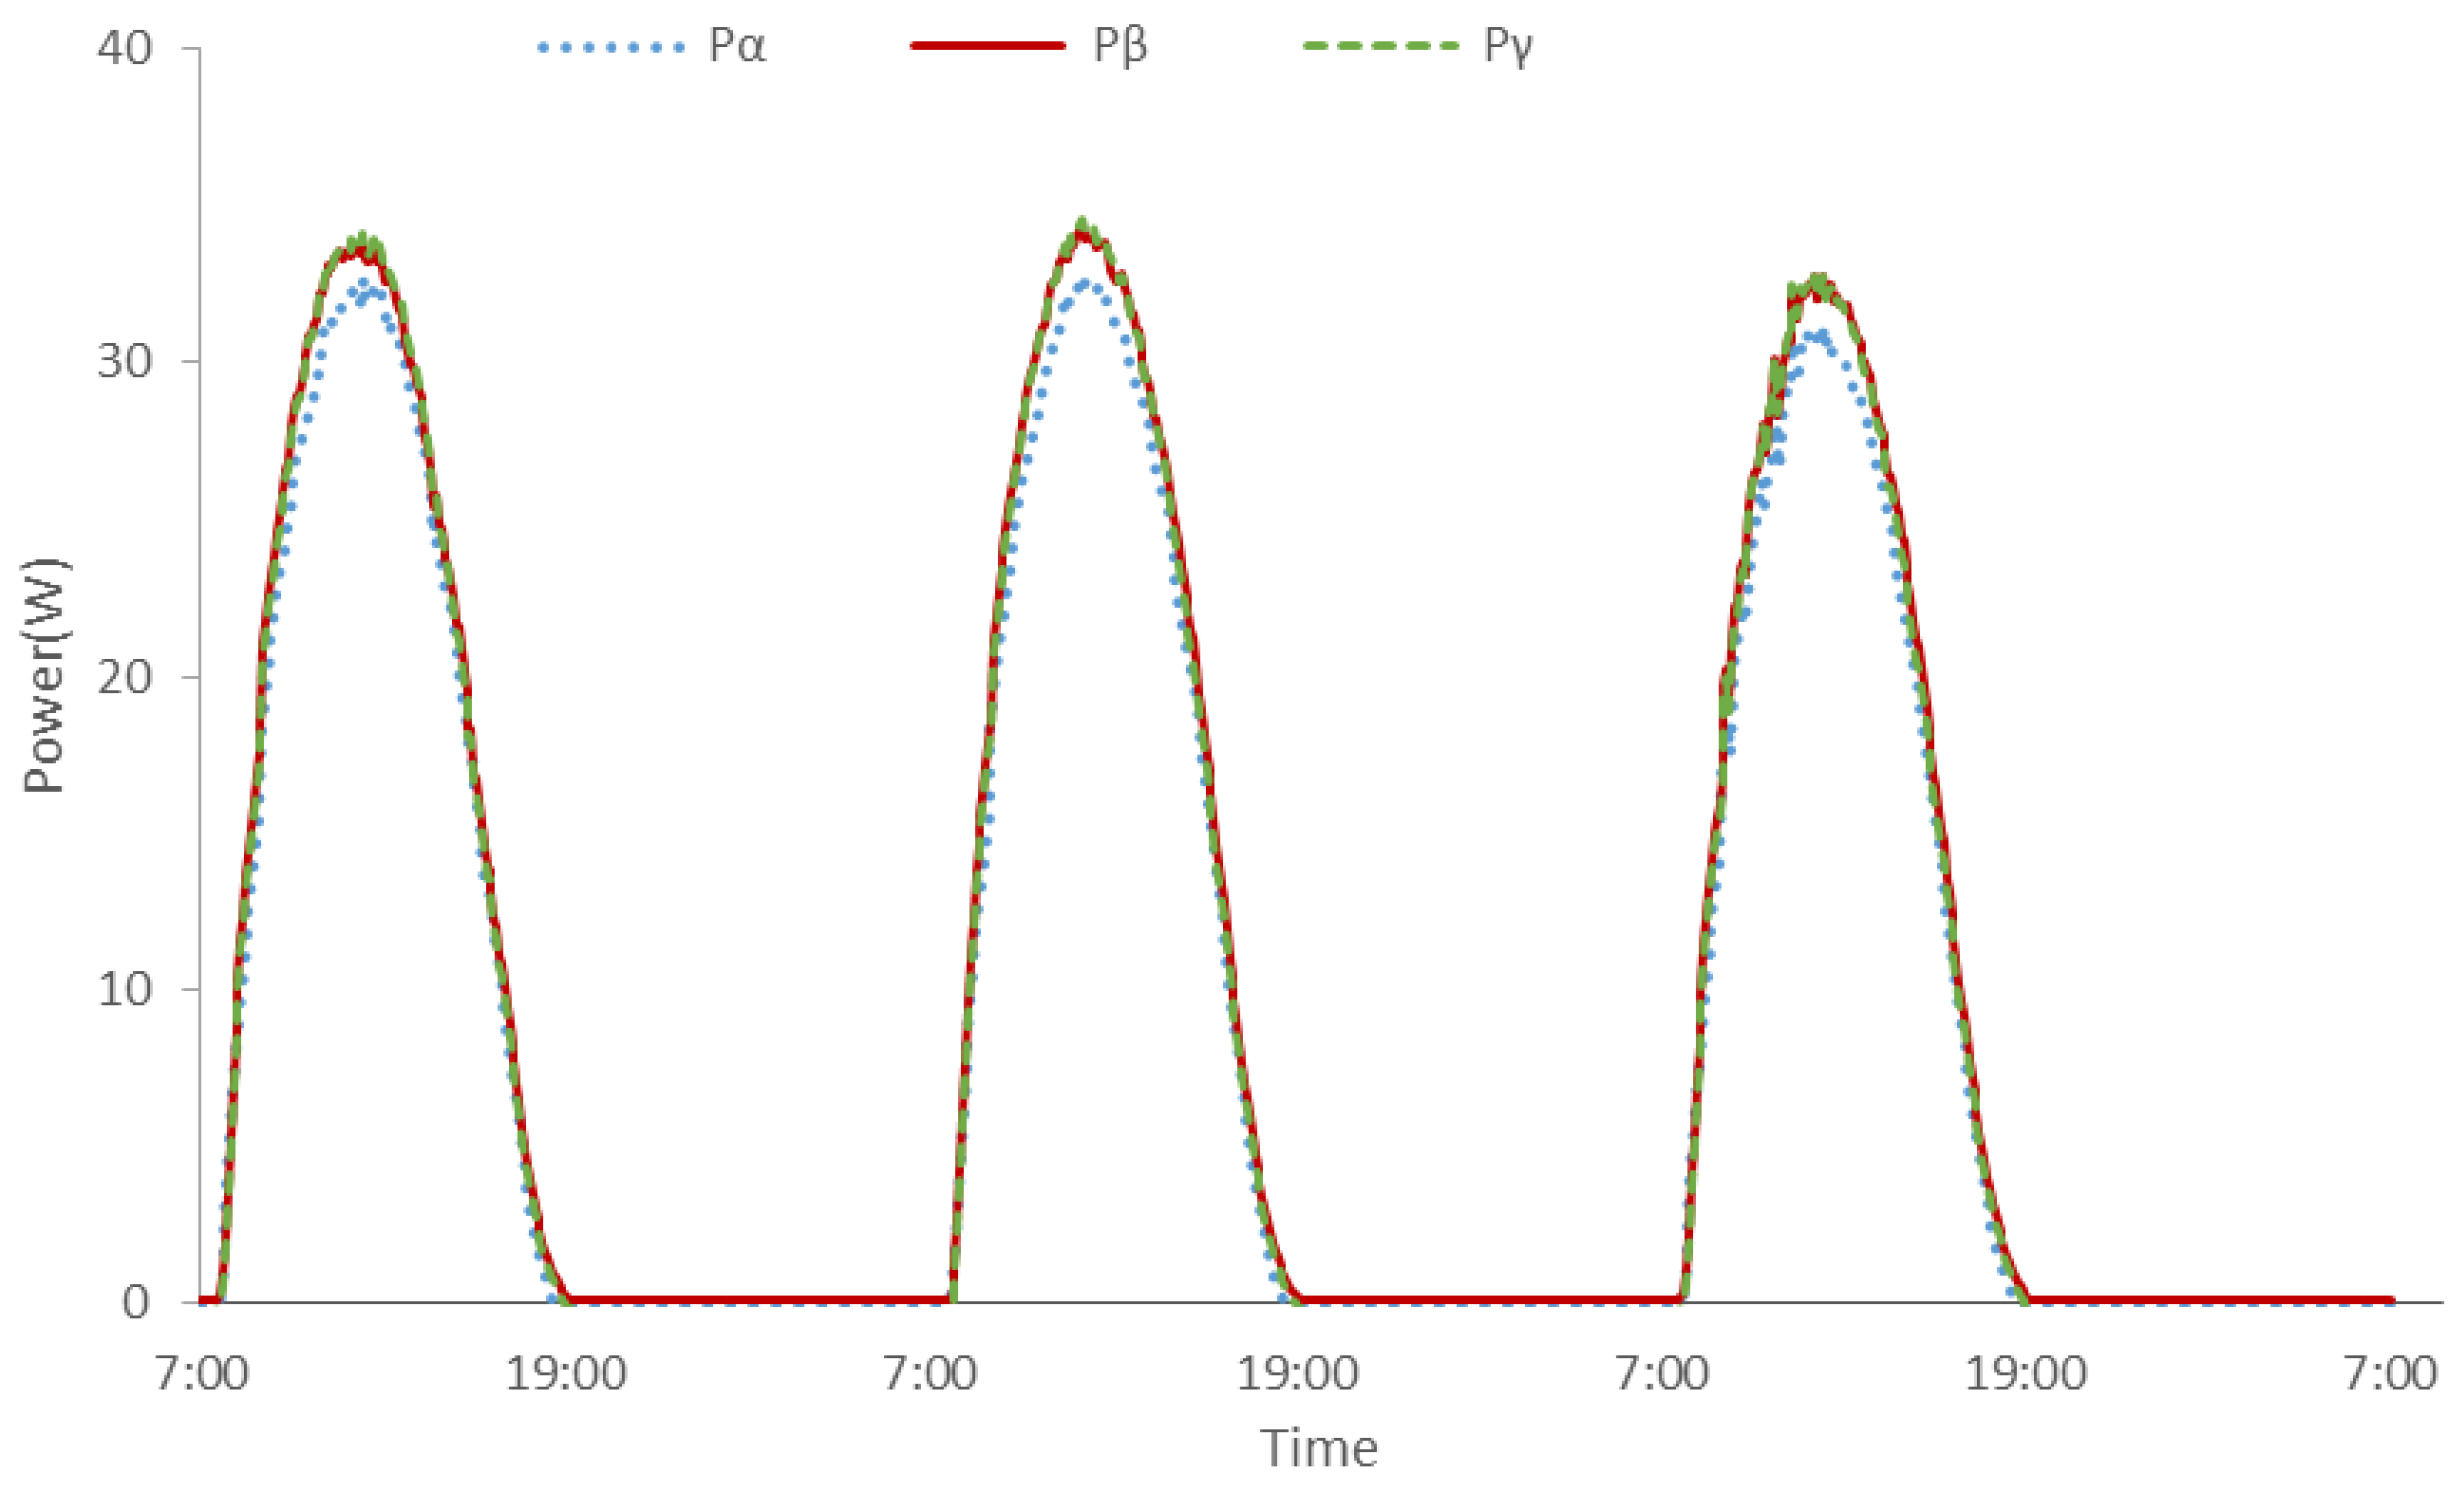
Figure 9 shows that inclusion of PCM produced higher peak power (Pβ = Pγ = 34 W) compared to the reference PV (Pα = 32 W) yielding an increase of ~6.5%. The average power produced by inclusion of PCM (Pβ = Pγ = 20 W) was of ~6% higher compared to that of the reference PV (Pγ = 18.9 W). The total electrical energy produced increased from 272 Wh/day for reference PV to 288 Wh/day for the PV-PCM and PV-PCM-W (increase of 18 Wh/day) indicating an increase of 6% (equivalent to increase in PV efficiency by 1.3%). However since water was circulated behind the PV for heat extraction, the additional power would be needed to account for pressure drop in water circuit. The additional power consumed by the pump due to pressure drop in PV water circulation is calculated by assuming 10 m additional water head with a flow 0.027 L/s. It resulted in the additional shaft power of 4 W with total energy consumed being 12 Wh/day as the water was circulated for three hours a day. The additional power required (12 Wh/day) is still lower than improved PV power output by PV cooling (18 Wh/day) so the concept is justified.
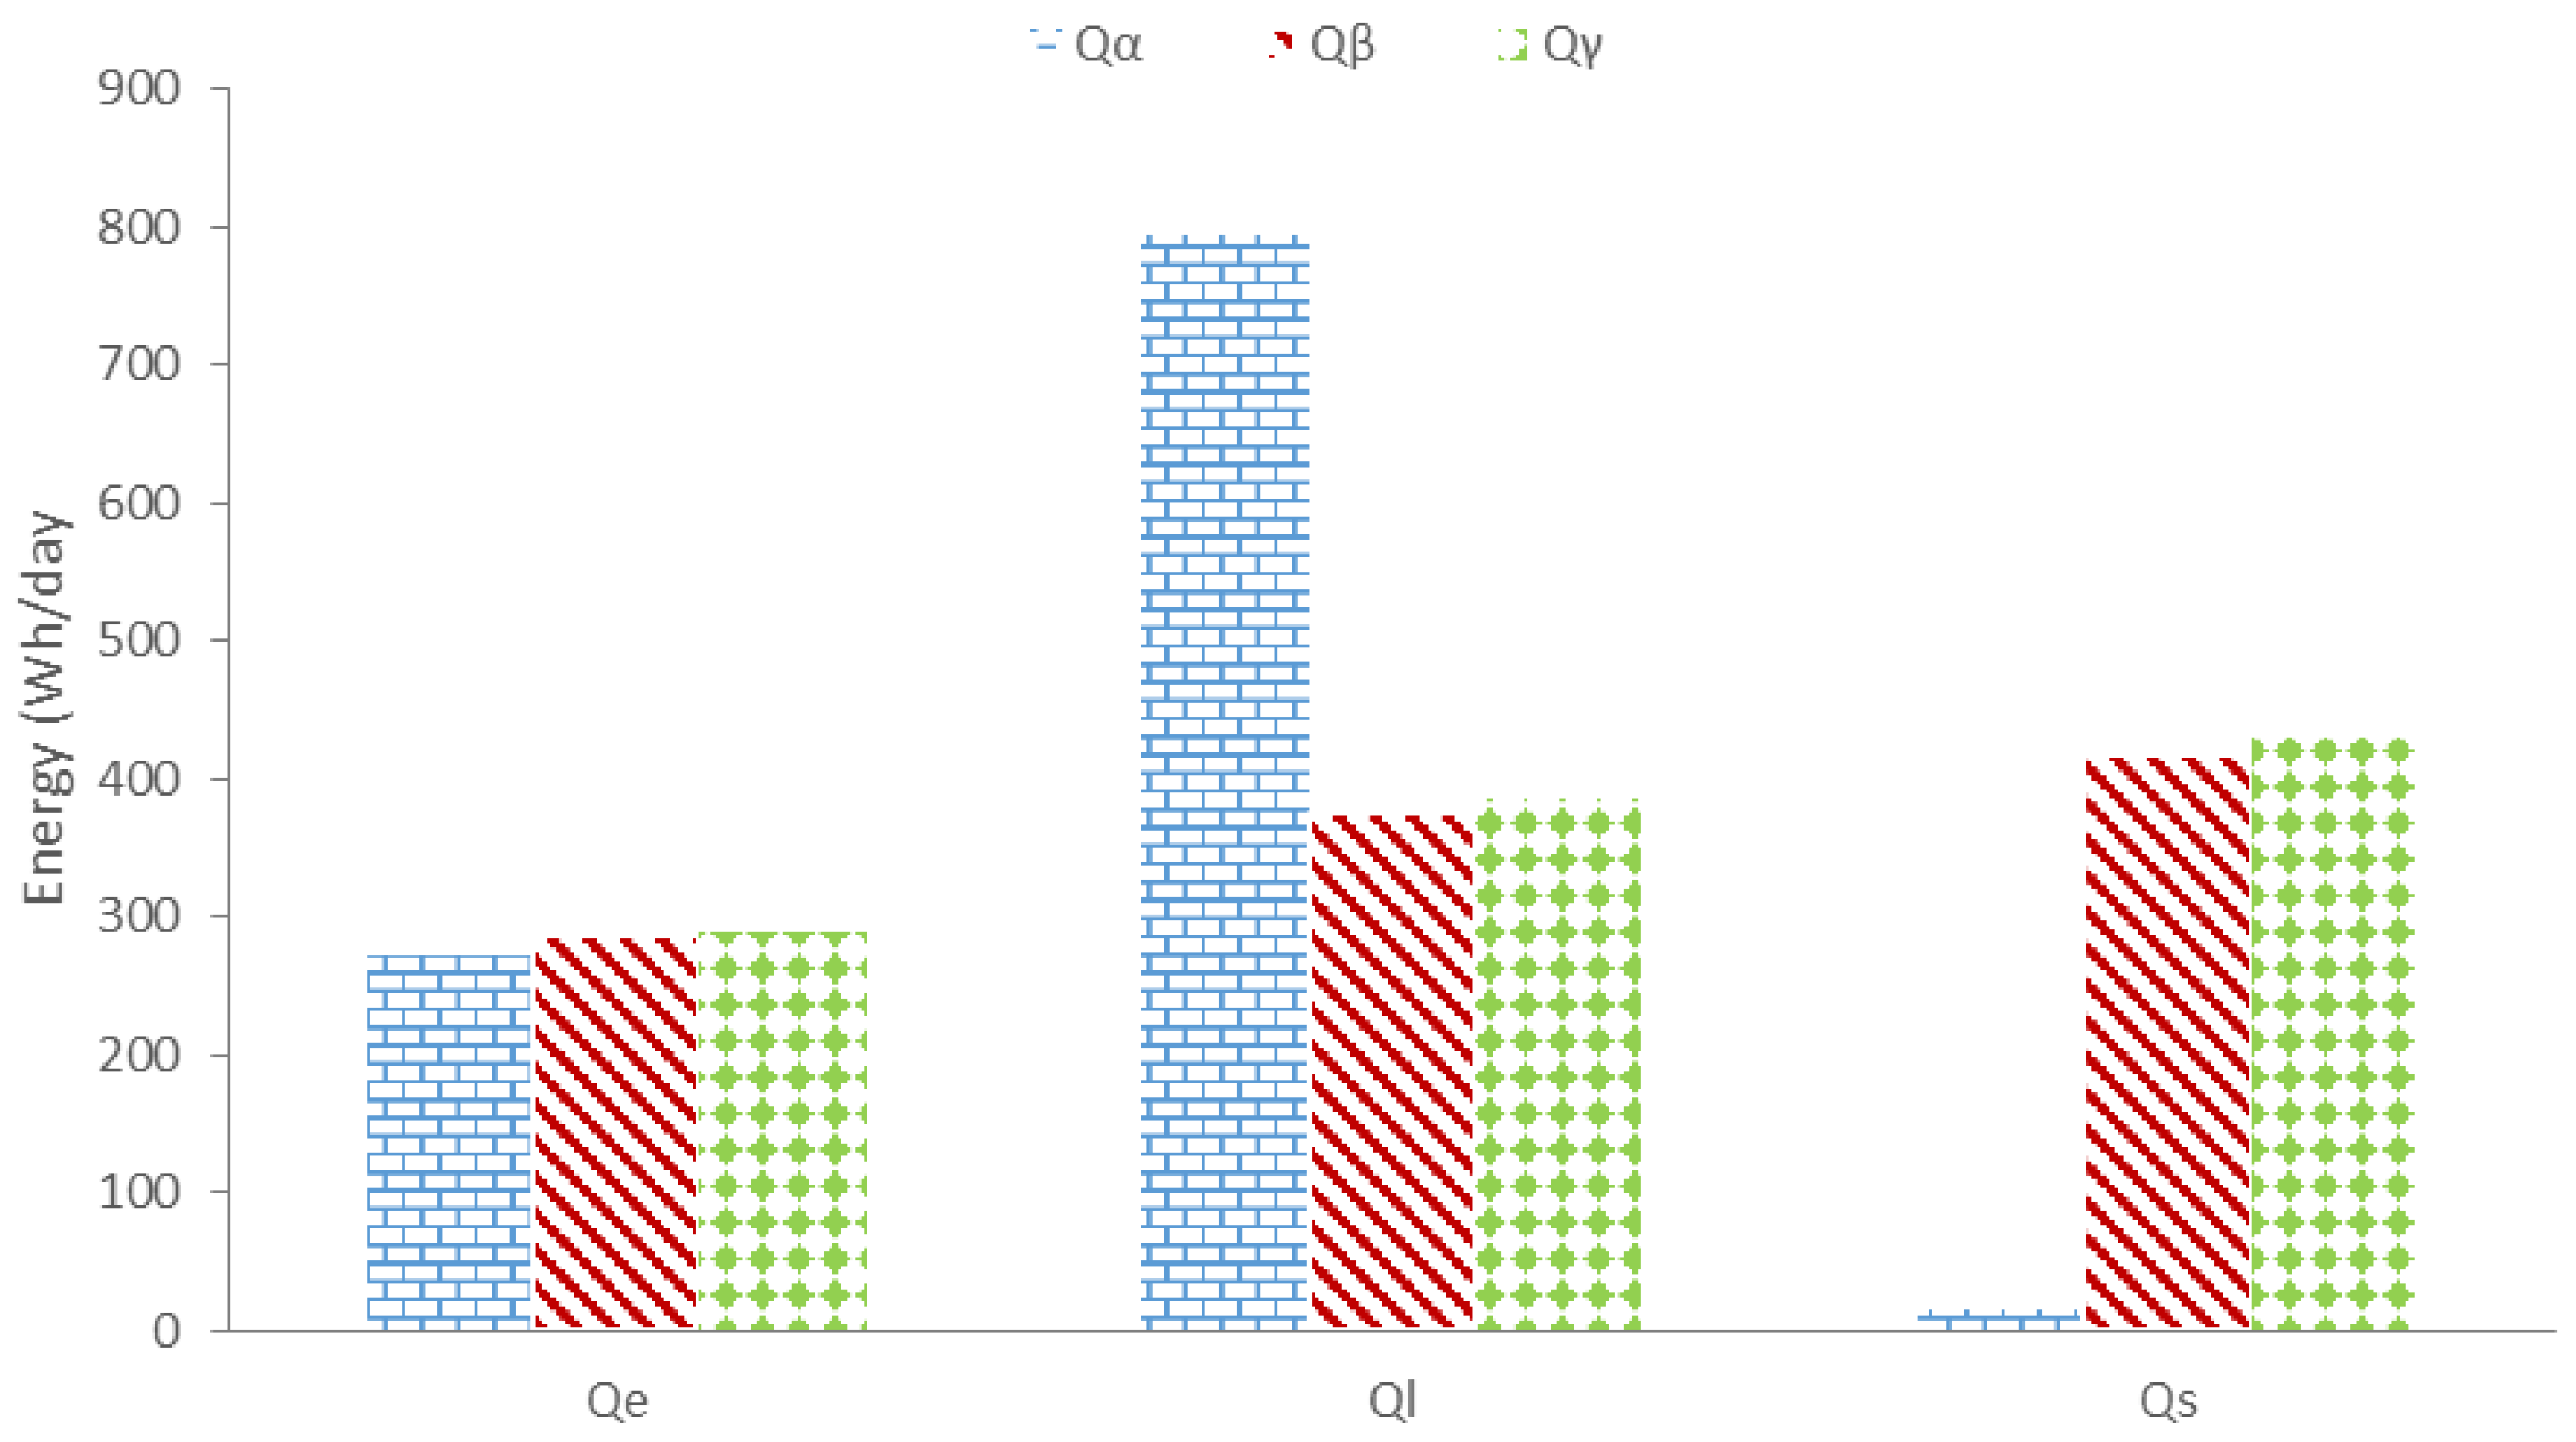
The total electrical energy produced, heat losses and the energy storage capacity of each of the module are summarized in Figure 10. It shows that the reference PV showed a highest heat loss (Ql) and lowest thermal energy storage capacity (Qs) while the PV-PCM and PV-PCM-W showed lower heat losses and higher thermal energy storage capacity. It can also be seen that the PV-PCM and PV-PCM-W produced higher electrical energy (Qe) compared to that of the reference PV. Thus it can be concluded that the PV-PCM system can increase electrical output as well as thermal energy storage capacity of PV system due to temperature regulation and latent heat absorption in PCM.

4. Conclusions

The proposed PV-PCM system with water circulation was evaluated for three winter days in Al Ain, UAE to regulate PV temperature and extract the stored thermal energy in the PCM. Inclusion of the PCM in the PV rendered a drop in PV front surface temperature (representative of PV cell temperature) of 9 °C at peak and 5 °C on the average. The tested PV-PCM system reduced heat losses by up to 435 kWh/day which resulted an increased thermal energy storage capacity by the same amount compared to the PV without PCM. The stored energy is removed by water circulation which heated 50 L of water by 9 °C from 29 °C to 38 °C thereby extracting 521 Wh/day thermal energy. The achieved water temperature is appropriate for domestic hot water applications. Eventually, the proposed PV-PCM-W system increased the electrical performance by ~6% (equivalent to an increase in PV efficiency of ~1%) and thermal performance by ~41% compared to the available global solar irradiation.

Acknowledgments

The authors would like to acknowledge the financial support from UAE University through center based research grant number 31R040-Research center-ECEER-3-2014 and the College of Engineering for the facilities to conduct the research.

Author Contributions

Ahmad Hasan and Hamza Alnoman conceived and designed the experiments; Hamza Alnoman performed the experiments; Ahmad Hassan and Ali Hasan Shah analyzed the data; Hamza Alnouman contributed reagents/materials/analysis tools; Ali Hasan Shah wrote the paper.

Conflicts of Interest

The authors declare no conflict of interest.

Abbreviations

BIPVBuilding integrated photovoltaic
CHPCombined heat and power
DSCDifferential scanning calorimetry
EVAEthylene vinyl acetate
PVPhotovoltaic
PVTHybrid photovoltaic thermal systems
PCMPhase change material
PV-PCMPhotovoltaic-phase change material
PV-PCM-WPhotovoltaic-phase change material with water circulation
STCStandard test conditions
WWater
iInitial state
f Final state

Symbols

AArea (m2)
CpHeat capacity (kJ/kg·K)
dThickness (cm)
dcDusting coefficient
IscShort-circuit current (ampere)
TTemperature (°C)
VocOpen-circuit voltage (V)
GGlobal solar radiation intensity (W/m2)
HLatent heat of fusion (kJ/kg)
PPower (W)
QEnergy (Kwh)
VVolume (L)
VwWind speed (m/s)
αAbsorptance of clear glass (%)
ρDensity (kg/m3)

Subscripts

αPhotovoltaic reference
βPhotovoltaic-phase change material
γPhotovoltaic-phase change material with water circulation
SStored energy
eElectrical energy
bBack surface
lEnergy losses
fFront surface
ambAmbient
mMelting

References

  1. National Renewable Energy Laboratory. National Center for Photovoltaic. Available online: http://www.nrel.gov/ncpv/images/efficiency_chart.jpg (accessed on 3 March 2016).
  2. Razykov, T.M.; Ferekides, C.S.; Morel, D.; Stefanakos, E.; Ullal, H.S.; Upadhyaya, H.M. Solar photovoltaic electricity: Current status and future prospects. Sol. Energy 2011, 85, 1580–1608. [Google Scholar] [CrossRef]
  3. Santbergen, R.; van Zolingen, R.C. The absorption factor of crystalline silicon PV cells: A numerical and experimental study. Sol. Energy Mater. Sol. Cells 2008, 92, 432–444. [Google Scholar] [CrossRef]
  4. Green, M.A. Solar Cells: Operating Principles, Technology, and System Applications; Prentice-Hall, Inc.: Englewood Cliffs, NJ, USA, 1982. [Google Scholar]
  5. Jiang, B.; Ji, J.; Yi, H. The influence of PV coverage ratio on thermal and electrical performance of photovoltaic-Trombe wall. Renew. Energy 2008, 33, 2491–2498. [Google Scholar] [CrossRef]
  6. Sarwar, J.; McCormack, S.; Huang, M.J.; Norton, B. Numerical validation of experimental temperature evolution in photovoltaic cells with varying ambient conditions. Available online: http://www.tara.tcd.ie/bitstream/handle/2262/67168/PVSAT-7_095_Paper_Sarwar.pdf?sequence=1 (accessed on 1 August 2016).
  7. Bücher, K. Site dependence of the energy collection of PV modules. Sol. Energy Mater. Sol. Cells 1997, 47, 85–94. [Google Scholar] [CrossRef]
  8. Chenni, R.; Makhlouf, M.; Kerbache, T.; Bouzid, A. A detailed modeling method for photovoltaic cells. Energy 2007, 32, 1724–1730. [Google Scholar] [CrossRef]
  9. Ceylan, İ.; Gürel, A.E.; Ergün, A.; Tabak, A. Performance analysis of a concentrated photovoltaic and thermal system. Sol. Energy 2016, 129, 217–223. [Google Scholar] [CrossRef]
  10. Skoplaki, E.; Palyvos, J.A. Operating temperature of photovoltaic modules: A survey of pertinent correlations. Renew. Energy 2009, 34, 23–29. [Google Scholar] [CrossRef]
  11. Radziemska, E. The effect of temperature on the power drop in crystalline silicon solar cells. Renew. Energy 2003, 28, 1–12. [Google Scholar] [CrossRef]
  12. Emery, K.; Burdick, J.; Caiyem, Y.; Dunlavy, D.; Field, H.; Kroposki, B.; Moriarty, T.; Ottoson, L.; Rummel, S.; Strand, T.; et al. Temperature dependence of photovoltaic cells, modules and systems. In Proceedings of the Twenty Fifth IEEE Photovoltaic Specialists Conference, Washington, DC, USA, 13–17 May 1996; pp. 1275–1278.
  13. Saga, T. Advances in crystalline silicon solar cell technology for industrial mass production. NPG Asia Mater. 2010, 2, 96–102. [Google Scholar] [CrossRef]
  14. Furkan, D.; Mehmet Emin, M. Critical factors that affecting efficiency of solar cells. Smart Grid Renew. Energy 2010, 1, 47–50. [Google Scholar]
  15. Kamkird, P.; Ketjoy, N.; Rakwichian, W.; Sukchai, S. Investigation on temperature coefficients of three types photovoltaic module technologies under Thailand operating condition. Procedia Eng. 2012, 32, 376–383. [Google Scholar] [CrossRef]
  16. Skoplaki, E.; Boudouvis, A.G.; Palyvos, J.A. A simple correlation for the operating temperature of photovoltaic modules of arbitrary mounting. Sol. Energy Mater. Sol. Cells 2008, 92, 1393–1402. [Google Scholar] [CrossRef]
  17. Kurtz, S.; Whitfield, K.; TamizhMani, G.; Koehl, M.; Miller, D.; Joyce, J.; Wohlgemuth, J.; Bosco, N.; Kempe, M.; Zgonena, T. Evaluation of high-temperature exposure of photovoltaic modules. Progr. Photovolt.: Res. Appl. 2011, 19, 954–965. [Google Scholar] [CrossRef]
  18. Ružinsky, M.; Redi, P. Indoor study and ageing tests of solar cells and encapsulations of experimental modules. In Proceedings of the 24th International Spring Seminar on Electronics Technology: Concurrent Engineering in Electronic Packaging, Calimanesti-Caciulata, Romania, 5–9 May 2001.
  19. Du, D.; Darkwa, J.; Kokogiannakis, G. Thermal management systems for Photovoltaics (PV) installations: A critical review. Sol. Energy 2013, 97, 238–254. [Google Scholar] [CrossRef]
  20. Huang, M.J.; Eames, P.C.; Norton, B. Thermal regulation of building-integrated photovoltaics using phase change materials. Int. J. Heat Mass Transf. 2004, 47, 2715–2733. [Google Scholar] [CrossRef]
  21. Hasan, A.; McCormack, S.J.; Huang, M.J.; Norton, B. Characterization of phase change materials for thermal control of photovoltaics using Differential Scanning Calorimetry and Temperature History Method. Energy Convers. Manag. 2014, 81, 322–329. [Google Scholar] [CrossRef]
  22. Huang, M.J.; Eames, P.C.; Norton, B. Phase change materials for limiting temperature rise in building integrated photovoltaics. Sol. Energy 2006, 80, 1121–1130. [Google Scholar] [CrossRef]
  23. Huang, M.J. The effect of using two PCMs on the thermal regulation performance of BIPV systems. Sol. Energy Mater. Sol. Cells 2011, 95, 957–963. [Google Scholar] [CrossRef]
  24. Hasan, A.; McCormack, S.J.; Huang, M.J.; Norton, B. Evaluation of phase change materials for thermal regulation enhancement of building integrated photovoltaics. Sol. Energy 2010, 84, 1601–1612. [Google Scholar] [CrossRef]
  25. Kibria, M.A.; Saidur, R.; Al-Sulaiman, F.A.; Aziz, M.M.A. Development of a thermal model for a hybrid photovoltaic module and phase change materials storage integrated in buildings. Sol. Energy 2016, 124, 114–123. [Google Scholar] [CrossRef]
  26. Sharma, S.; Tahir, A.; Reddy, K.S.; Mallick, T.K. Performance enhancement of a Building-Integrated Concentrating Photovoltaic system using phase change material. Sol. Energy Mater. Sol. Cells 2016, 149, 29–39. [Google Scholar] [CrossRef]
  27. Hasan, A.; McCormack, S.J.; Huang, M.J.; Sarwar, J.; Norton, B. Increased photovoltaic performance through temperature regulation by phase change materials: Materials comparison in different climates. Sol. Energy 2015, 115, 264–276. [Google Scholar] [CrossRef]
  28. Browne, M.C.; Norton, B.; Mc Cormack, S.J. Phase change materials for photovoltaic thermal management. Renew. Sustain. Energy Rev. 2015, 47, 762–782. [Google Scholar] [CrossRef]
  29. Hasan, A.; McCormack, S.J.; Huang, M.J.; Norton, B. Energy and cost saving of a photovoltaic-phase change materials (PV-PCM) system through temperature regulation and performance enhancement of photovoltaics. Energies 2014, 7, 1318–1331. [Google Scholar] [CrossRef]
  30. Ma, T.; Yang, H.; Zhang, Y.; Lu, L.; Wang, X. Using phase change materials in photovoltaic systems for thermal regulation and electrical efficiency improvement: A review and outlook. Renew. Sustain. Energy Rev. 2015, 43, 1273–1284. [Google Scholar] [CrossRef]
  31. Professional Plastics. Thermal Properties of Plastic Materials. Available online: http://www.professionalplastics.com/professionalplastics/ThermalPropertiesofPlasticMaterials.pdf (accessed on 26 March 2016).
  32. Apogee Instruments. SP-110: Self-Powered Pyranometer. Available online: http://www.apogeeinstruments.co.uk/sp-110-self-powered-pyranometer/ (accessed on 3 August 2016).
  33. Tmart. WS1041 Professional Weather Station with PC Link. Available online: http://www.tmart.com/WS1041-Professional-Weather-Station-with-PC-Link_p238349.html (accessed on 27 March 2016).
  34. Apogee Instruments. Specification Sheet. Available online: http://www.apogeeinstruments.co.uk/content/SP-100-200-spec-sheet.pdf (accessed on 13 March 2016).
  35. National Instruments. NI cRIO-9073. National Instruments. Available online: http://www.ni.com/pdf/manuals/374639f.pdf (accessed on 3 August 2016).
  36. National Instruments, NI 9227. Available online: http://sine.ni.com/nips/cds/view/p/lang/en/nid/208794 (accessed on 15 March 2016).
  37. National Instruments, NI 9213. Available online: http://sine.ni.com/nips/cds/view/p/lang/en/nid/208788 (accessed on 15 March 2016).
  38. WS1041 Professional Weather Station w/ PC Link. Available online: http://www.dx.com/p/ws1041-professional-weather-station-w-pc-link-275697#.Vvf3Q9J97IU (accessed on 27 March 2016).
  39. National Instruments, Data Sheet NI 9221. Available online: http://www.ni.com/pdf/manuals/375905a_02.pdf (accessed on 31 March 2016).
  40. Rubitherm. Available online: http://www.rubitherm.eu/media/products/datasheets/Techdata_-RT42_EN_09052016.PDF (accessed on 3 August 2016).
  41. International Programme on Chemical Safety. POLYSTYRENE. Available online: http://www.inchem.org/documents/icsc/icsc/eics1043.htm (accessed on 16 February 2016).
  42. Aalco Metals Ltd. Aluminium Alloy 1050A H14 Sheet. Available online: http://www.aalco.co.uk/datasheets/Aalco-Metals-Ltd_Aluminium-Alloy-1050A-H14-Sheet_57.pdf.ashx (accessed on 3 August 2016).
  43. Electrolube. ER2074 Epoxy Resin Technical Data Sheet. Available online: http://datasheet.octopart.com/ER2074RP250G-Electrolube-datasheet-537902.pdf (accessed on 17 March 2016).
  44. Tiwari, A.; Sodha, M.S. Performance evaluation of solar PV/T system: An experimental validation. Sol. Energy 2006, 80, 751–759. [Google Scholar] [CrossRef]
  45. Jones, A.D.; Underwood, C.P. A thermal model for photovoltaic systems. Sol. Energy 2001, 70, 349–359. [Google Scholar] [CrossRef]
  46. Browne, M.C.; Norton, B.; Mccormack, S.J. Heat retention of a photovoltaic/thermal collector with PCM. Sol. Energy 2016, 133, 533–548. [Google Scholar] [CrossRef]
Figure 1. Construction of integrated photovoltaic phase change material (PV-PCM) system and metallic pipe heat exchanger immersed inside PCM container.
Energies 09 00782 g001
Figure 2. Experimental setup consisting of PV-reference, PV-PCM, and PV-PCM-W, water tank, data logger, weather station, Pyranometer and desktop computer for the outdoor experiment for consecutive 3 days from 30 January 2015 to 2 February 2015.
Energies 09 00782 g002
Figure 3. The measured solar irradiance (G) and wind speed (Vw) data for consecutive 3 days from 30 January 2015 to 2 February 2015 at the site in Falaj Hazza Campus, UAE University, Al Ain, UAE.
Energies 09 00782 g003
Figure 4. The measured temperatures at front surfaces of reference PV panel (Tαf), PV-PCM panel (Tβf) PV-PCM-water circulation (Tγf) and ambient temperature (Tamb) for consecutive 3 days from 30 January 2015 to 2 February 2015 at the site of system deployment.
Energies 09 00782 g004
Figure 5. The measured temperatures at back surfaces of reference PV panel (Tαb), PV-PCM (Tβb), PV-PCM-water flow (Tγb) and inside phase change material temperature (Tpcm) for consecutive 3 days from 30 January 2015 to 2 February 2015 at the site of system deployment.
Energies 09 00782 g005
Figure 6. Average water temperature inside water tank (Tw), inside temperature of PCM (Tpcm) and inside temperature of PCM with water circulation (Tpcm-w) for three consecutive days from 30 January 2015 to 2 February 2015 at the site of system deployment in Falaj Hazza Campus, UAE University.
Energies 09 00782 g006
Figure 7. Open circuit voltage for PV (Vocα), PV-PCM (Vocβ) and PV-PCM-W (Vocγ) for three consecutive days from 30 January 2015 to 2 February 2015 at the site of system deployment in Falaj Hazza Campus, UAE University, Al Ain, UAE.
Energies 09 00782 g007
Figure 8. Short circuit current for PV (Iscα), PV-PCM (Iscβ) and PV-PCM-W (Iscγ) for three consecutive days from 30 January 2015 to 2 February 2015 at the site of system deployment in Falaj Hazza Campus, UAE University, Al Ain, UAE.
Energies 09 00782 g008
Figure 9. Power produced by reference PV panel (Pα), PV panel with PCM (Pβ) and PV-PCM with water circulation (Pγ) for three consecutive days from 30 January 2015 to 2 February 2015 at the site of system deployment in Falaj Hazza Campus, UAE University, Al Ain, UAE.
Energies 09 00782 g009
Figure 10. Electrical energy produced (Qe), heat losses (Ql) and thermal energy stored (Qs) for PV-Ref (Qα) PV-PCM (Qβ) and PV-PCM-W (Qγ) during three consecutive days from 30 January 2015 to 2 February 2015 measured at the site of system deployment in Falaj Hazza Campus, UAE University.
Energies 09 00782 g010
Table 1. Accuracies and measurement ranges of the devices used in experiments for weather data, temperature and PV performance measurements and data acquisition.
Measurement ParameterDeviceModelMeasurement RangeAccuracy
Solar radiation [34]Apogee pyranometerSP-11036–1120 nm ±1%
Data acquisition [35]NI-Compact Rio9073NA (Not Applicable)±0.02%
Current [36]NI-Analogue module92275 Arms±0.01%
Surface temperature [37]Ni-Analogue module9213−75–250 °C±1%
Ambient temperature [38]Starmeter weather stationWS1041−40–60 °C±1%
Wind speed [38]Starmeter weather stationWS10410–50 m·s−1±1%
Voltage [39]NI-Analogue module9221−60–60 V ±0.25%
Table 2. Thermo-physical properties of PCM, metallic and bonding materials used in the experiments in solid state.
PropertiesMelting Point (°C)Congealing Point (°C)Latent Heat (kJ/kg)Specific Heat Capacity (kJ/kg·K)Heat Conductivity (W/m·K)Density (kg/L)Volume ExpansionFlash Point (°C)
PCM RT42 [40]38–4343–37145% ± 7.5%20.20.8812.5%186
Polystyrene 240NANANA0.032NANA350
Aluminum [41]650NANA0.912222.7124 × 10−6/KNA
Epoxy Resin [43]130NANANA1.262.0934 × 10−6/K350
Table 3. The measured average, peak and daily total data for solar radiation and wind speed for PV back and front surface for consecutive 3 days from 30 January 2015 to 2 February 2015 in Falaj Hazza Campus, UAE University, Al Ain, UAE.
DayWind Speed (m/s)Solar Radiation Intensity (W/m2)Daily Total Radiation (Wh/day)
Average at the PVPeak at the PVAveragePeakAvailableAbsorbed
Front SurfaceBack SurfaceFront SurfaceBack Surface
10.080.040.500.1559596016571256
20.080.040.680.2158294016341234
30.170.090.870.2655292015401140
Table 4. Calculation of heat storage capacity and energy stored in PV-Ref, PV-PCM and PV-PCM-W for the experiment conducted for three consecutive days 30 January 2015 to 2 February 2015 at the site of system deployment in Falaj Hazza Campus, UAE University.
Elementρ (Kg/m3)Cp (J/kg·K)d (m)Area (m2)H (J/kg)A × d × ρ × Cp (J/K)
Silicon PV cells [45]23306770.00030.334NA158
Polyester/Tedlar [45]120012500.00050.334NA250
Glass face [45]30005000.0030.334NA1503
Aluminum [42]27109100.0040.9728NA9596
PCM sensible heat [40]88020000.050.2968NA26118
PCM latent heat [40]880NA0.050.2968155000NA

