Article

Thermal Characteristics of Tube Bundles in Ultra-Supercritical Boilers

1
Department of Mechanical Engineering, Yonsei University, Seoul 120-749, Korea
2
Department of Energy System Engineering, Korea National University of Transportation, Chungbuk 380-701, Korea
*
Author to whom correspondence should be addressed.
Energies 2016, 9(10), 779; https://doi.org/10.3390/en9100779
Submission received: 9 August 2016 / Revised: 1 September 2016 / Accepted: 23 September 2016 / Published: 27 September 2016

Abstract

:
In this study, flow and thermal characteristics of tube bundles in ultra-supercritical boilers were analyzed. The local heat transfer around the tube bundles was measured to predict the local temperature distribution and vulnerable positions of the superheated tube bundles. The maximally superheated tube bundles were simulated in the laboratory and local heat transfer was measured by using the naphthalene sublimation method. The experiment was conducted on three lines of tube bundles, all with in-line arrangements. Each line consist of six tubes. The distance in the streamwise direction (Sx/∅) was 1.99 and that in the spanwise direction (Sz/∅) was 5.45. The Reynolds number varied from 5000 to 30,000, which covers a range of different operating conditions. Thermal and stress analyses were conducted numerically, based on the experimental data. The results showed that the flow characteristic changes the local heat transfer of the tube bundles. The flow impinged on the stagnation point of Tube 1 and reattached at 60° of Tube 2. The high heat transfer occurred at those positions of the tube bundles. The temperature and stress distributions on the surface of each tube bundle also varied. The reattachment point on Tube 2 had the highest heat transfer and temperature distribution. That position on Tube 2 was subjected to the highest stress due to the large temperature gradient. This result indicates that Tube 2 of the ultra-supercritical (USC) boiler is the weakest of the tube bundles, changing the pitch of the streamwise direction of Tube 2 is one method to reduce the highest stress in superheater tube bundles in the USC boiler.

1. Introduction

Recently, there has been significant research interest in renewable energy technologies, such as those that enable us to generate solar and biomass energy. However, coal has provided approximately 41.3% of the total power generated globally [1]. One coal power generation method uses an ultra-supercritical boiler (USC boiler), as shown in Figure 1 [2]. This combines ultra-supercritical steam with circulating fluidized bed boilers and has become the preferred coal-based power generation technology. Commercial supercritical steam power plants were introduced in the late 1950s. Since then, substantial research has been carried out to enhance their efficiency and performance.
Dekhtiarev [3] suggested that CO2 power cycles have an advantage to produce electricity. Feher [4] suggested a thermodynamic explanation of a supercritical CO2 Brayton cycle in power generation applications for high thermal efficiency. Kang et al. [5] conducted a numerical analysis to study the effects of separated overfire air (SOFA) of coal-fired boilers for the reduction of NOx emission. They found the optimum position of SOFA for low NOx emission. Pan et al. [6] carried out a thermal-hydraulic analysis in a 600 MW supercritical circulating fluidized bed (CFB) boiler. They suggested that water wall tubes have a good heat transfer performance and low flow resistance. Fan et al. [7] conducted the conceptual design for the CFB boiler. They reported the effect of plant site condition and coal for the efficient USC CFB boiler. Hou et al. [8] suggested a new modeling for the USC power plant. They presented the T-S model identification approach to increase the performance of the power plant. Wang et al. [9] conducted the advanced thermodynamic analysis and evaluated a supercritical power plant. They analyzed the thermodynamic efficiencies by considering the exergy destruction by splitting the components of the power plant. Xu et al. [10] suggested the novel flue gas heat recovery system for improving the power plant efficiency. With their heat recovery system, $2.6 million can be saved per year. Yang et al. [11] conducted the parametric study of a USC power plant based on exergy evaluation. They conducted the exergy evaluation on the aspect of energy savings. Liu et al. [12] suggested a fuzzy neural network to model the 1000 MW USC power plant. They compared their network with a recursive least square method and concluded that their network system was more applicable for analyzing the 1000 MW USC power plant.
In USC boilers, there are numerous tube bundles that are used for heat exchange, as shown in Figure 1. Extensive research has been performed with the goal of enhancing the performance of tube bundles and analyzing their failures. Viswanathan et al. [13,14] reported materials appropriate for use in ultra-supercritical power plant boilers. They developed materials that are capable of operating at 760 °C and 35 MPa steam. Castello et al. [15] studied the effect of fuel-ash corrosion inside the superheater tubes of USC boilers under laboratory conditions. They investigated the effect of coating the superheater tubes. In addition, Lee et al. [16] conducted a failure analysis on boiler tubes in USC coal power plants. They found that creep ruptures can be caused by softened structures. Furthermore, Krauss et al. [17] investigated the momentum and energy transport in a heated rod bundle. They found that a lower gradient-to-diameter ratio increased the heat transfer efficiency.
Chen et al. [18] conducted an experiment to measure heat transfer and pressure drops inside H-type finned tube banks. Based on their experimental results, they suggested correlations among the fin efficiency, Nusselt number, and Euler number. Yeo et al. [19] presumed the oxide scale growth in a high steam condition by numerical simulation. They concluded that steam temperatures up to 750 °C are allowable in service. Yuan et al. [20] analyzed the tensile and creep deformation for a newly-developed Ni-Fe-based superalloy. They found that the new material can endure 750 °C for 5400 h.
Most research into the USC boiler tube bundles has concentrated on the effects of the material properties and corrosion inside the superheater tubes. As the superheater tubes have gradually been exposed to higher thermal loads, predicting local temperature distributions has become more important. Metzger [21], Armstrong [22], Sparrow [23], Goldstein [24], and Chyu [25] studied the flow characteristics and local heat transfer distribution around the tube bundles. They found that a staggered array of tube bundles has a higher heat transfer rate than an in-line array of tube bundles. Ji et al. [26] conducted heat transfer analysis of elastic tube bundles in heat exchangers. They found that heat transfer of each elastic tube bundles increased significantly with tube vibrations. Eter et al. [27] investigated the heat transfer of three-rod bundles in supercritical condition. They found that the supercritical heat transfer coefficient decreased with increasing heat flux. Zhang et al. [28] measured the heat transfer of a tube bank with the higher oblique fluid flow. They revealed that heat transfer and the friction factor increased with the oblique angle. Shen et al. [29] analyzed the heat transfer performance of horizontal tube bundles. They concluded that a greater column number of tube bundles weakens the heat transfer. Pis’mennyi et al. [30] investigated the drag of in-line finned tubes experimentally. They found the correlation between the Reynolds number and finned tube geometries.
The tube bundles in typical USC boilers are positioned in the in-line arrangement, as shown in Figure 2. Area averaged heat transfer of the tube bundles can be predicted by correlations, however, the local heat transfer cannot be predictable. Furthermore, as the operating condition of the USC boiler has become harsh, analyzing the local thermal properties of tube bundles becomes important. Therefore, the flow and thermal properties of tube bundles were analyzed to predict the vulnerable position of tube bundles. The local heat transfer distribution was measured using the naphthalene sublimation method for various Reynolds numbers. Based on experimental data, the thermal properties and stress effects of tube bundles were analyzed by numerical simulation. The most vulnerable position of tube bundles inside the USC boilers will be predicted by the results.

2. Experimental Method

2.1. Experimental Apparatus

The experiment was conducted in a wind tunnel, as shown in Figure 3. The cross-section of the wind tunnel was 550 mm × 250 mm. The total length of the channel was 1420 mm. To ensure uniform velocity, the mesh was positioned at the end of the wind tunnel. The velocity and temperature of the flow were measured by an FCO-520 Air pro portable manometer (Furness Controls, Bexhill, UK). The probe was positioned 300 mm away from the inlet of the wind tunnel. The test section was positioned 550 mm away from the inlet.
In the test section, three rows of tube bundles were installed in an in-line arrangement. To simulate superheater tube bundles inside a USC boiler, there were six tube bundles in each row. The diameter of the tube bundles was 42.2 mm and the height was 250 mm. The distance in the streamwise direction (Sx/∅) was 1.99 and that in the spanwise direction was (Sz/∅) 5.45, which was 2.5 times higher. The inlet flow conditions were varied from Re = 5000 to 30,000. These were based on the diameter of the tube bundles and the inlet velocity. The temperature of inlet flow was 24 °C.
The heat transfer in the middle row of the tube bundles was measured using the naphthalene sublimation method. To ensure the measurement was accurate, in each experiment, a single tube was coated with naphthalene. For example, Tube 1 was measured and the other tubes were treated as dummy tube bundles in the middle row. Therefore, six tube bundles in the middle row were designed to be portable. The coordinates of the measured tubes are shown in Figure 3c. The stagnation point of the tube was 0°, with the opposite being 180°.

2.2. Data Reduction

The naphthalene sublimation method has the advantage of enabling us to neglect heat loss by both conduction and radiation. Thus, the heat transfer was measured precisely. The sublimation depth of the naphthalene was measured using a linear variable differential transformer (LVDT). The linear motion guide and step motors moved the LVDT to measure the naphthalene sublimation depth. Therefore, the LVDT measured the spatially-resolved layer thickness of the naphthalene sublimation depth. The mass transfer coefficient can be calculated from the sublimation depth of the naphthalene. The mass transfer coefficient is described by the following equation:
h m = m ˙ ( ρ v , w ρ v , ) = ρ s ( z / t ) ρ v , w
where m ˙ is the mass transfer rate of naphthalene per unit area. The mass transfer coefficient ( h m ) was calculated using the density of solid naphthalene ( ρ s ), the naphthalene sublimation rate (∆z/∆t), the vapor density of naphthalene on the surface ( ρ v , w ), and the vapor density of naphthalene in bulk air ( ρ v , ).
The non-dimensional form of the mass transfer coefficient (Sh) can be expressed by the following equation:
S h = h m D n a p h
where is the diameter of the tube bundles, h m is the mass transfer coefficient, and D n a p h is the diffusion coefficient of naphthalene. The value of D n a p h used in this study was taken from Ambrose et al. [31] and Goldstein and Cho [32].
The mass and heat transfer analogy observed by Eckert et al. [33] was used to calculate the heat transfer coefficient from the mass transfer coefficient. The relationship between the Sherwood number (Sh) and the Nusselt number (Nu) is described by the following equation:
N u S h = ( P r S c ) 0.4   ,     N u S h = 0.624
The value of the Schmidt number (Sc) was 2.28 and the Prandtl number (Pr) was 0.7 when the air was 25 °C. Therefore, the ratio of Nu/Sh was 0.624. Using the uncertainty estimation method from Abernety et al. [34], the uncertainty of the Sherwood number was calculated to be ±7.8%.

2.3. Numerical Simulation Method

Numerical analysis was conducted to enable us to characterize the flow and thermal properties of the system. For the flow calculation, the wind tunnel and test section were modeled using a computer-aided design program (CATIA v.5). A grid topology was used in the numerical analysis. This was formed by the ANSYS meshing tool (ver.15). The number of grid cells was around two million. The same grid was used in three cases where only the Reynolds numbers were varied. ANSYS CFX ver.15 was used for numerical analysis. The shear stress transport turbulence model (SST) was used to solve the continuity and momentum equations. This SST model combines the k- ε turbulence model and k- ω turbulence model. The inner region of boundary layer was solved by the k- ω turbulence model and free shear flow was solved by the k- ε turbulence model. Three different Reynolds number cases were solved. The velocity of each case was varied. The velocity is based on the diameter of the tube bundle and the Reynolds number.
Thermal analysis was also performed using numerical simulation. Six hollow tube bundles, which were made from structural steel, were simulated. The material properties, such as thermal conductivity, thermal expansion coefficient, elasticity, and Poisson ratio, were chosen from the ANSYS engineering data. The measured heat transfer coefficient was applied to the outer surface of the tube bundles at an ambient temperature of 650 °C. On the inner side of the tube bundles, a heat transfer coefficient of 10,000 W/m2·°C was selected at an ambient temperature of 560 °C. These boundary conditions were based on the operating condition data for the USC boiler. Thermal analysis results enabled us to perform a stress analysis.

3. Results and Discussion

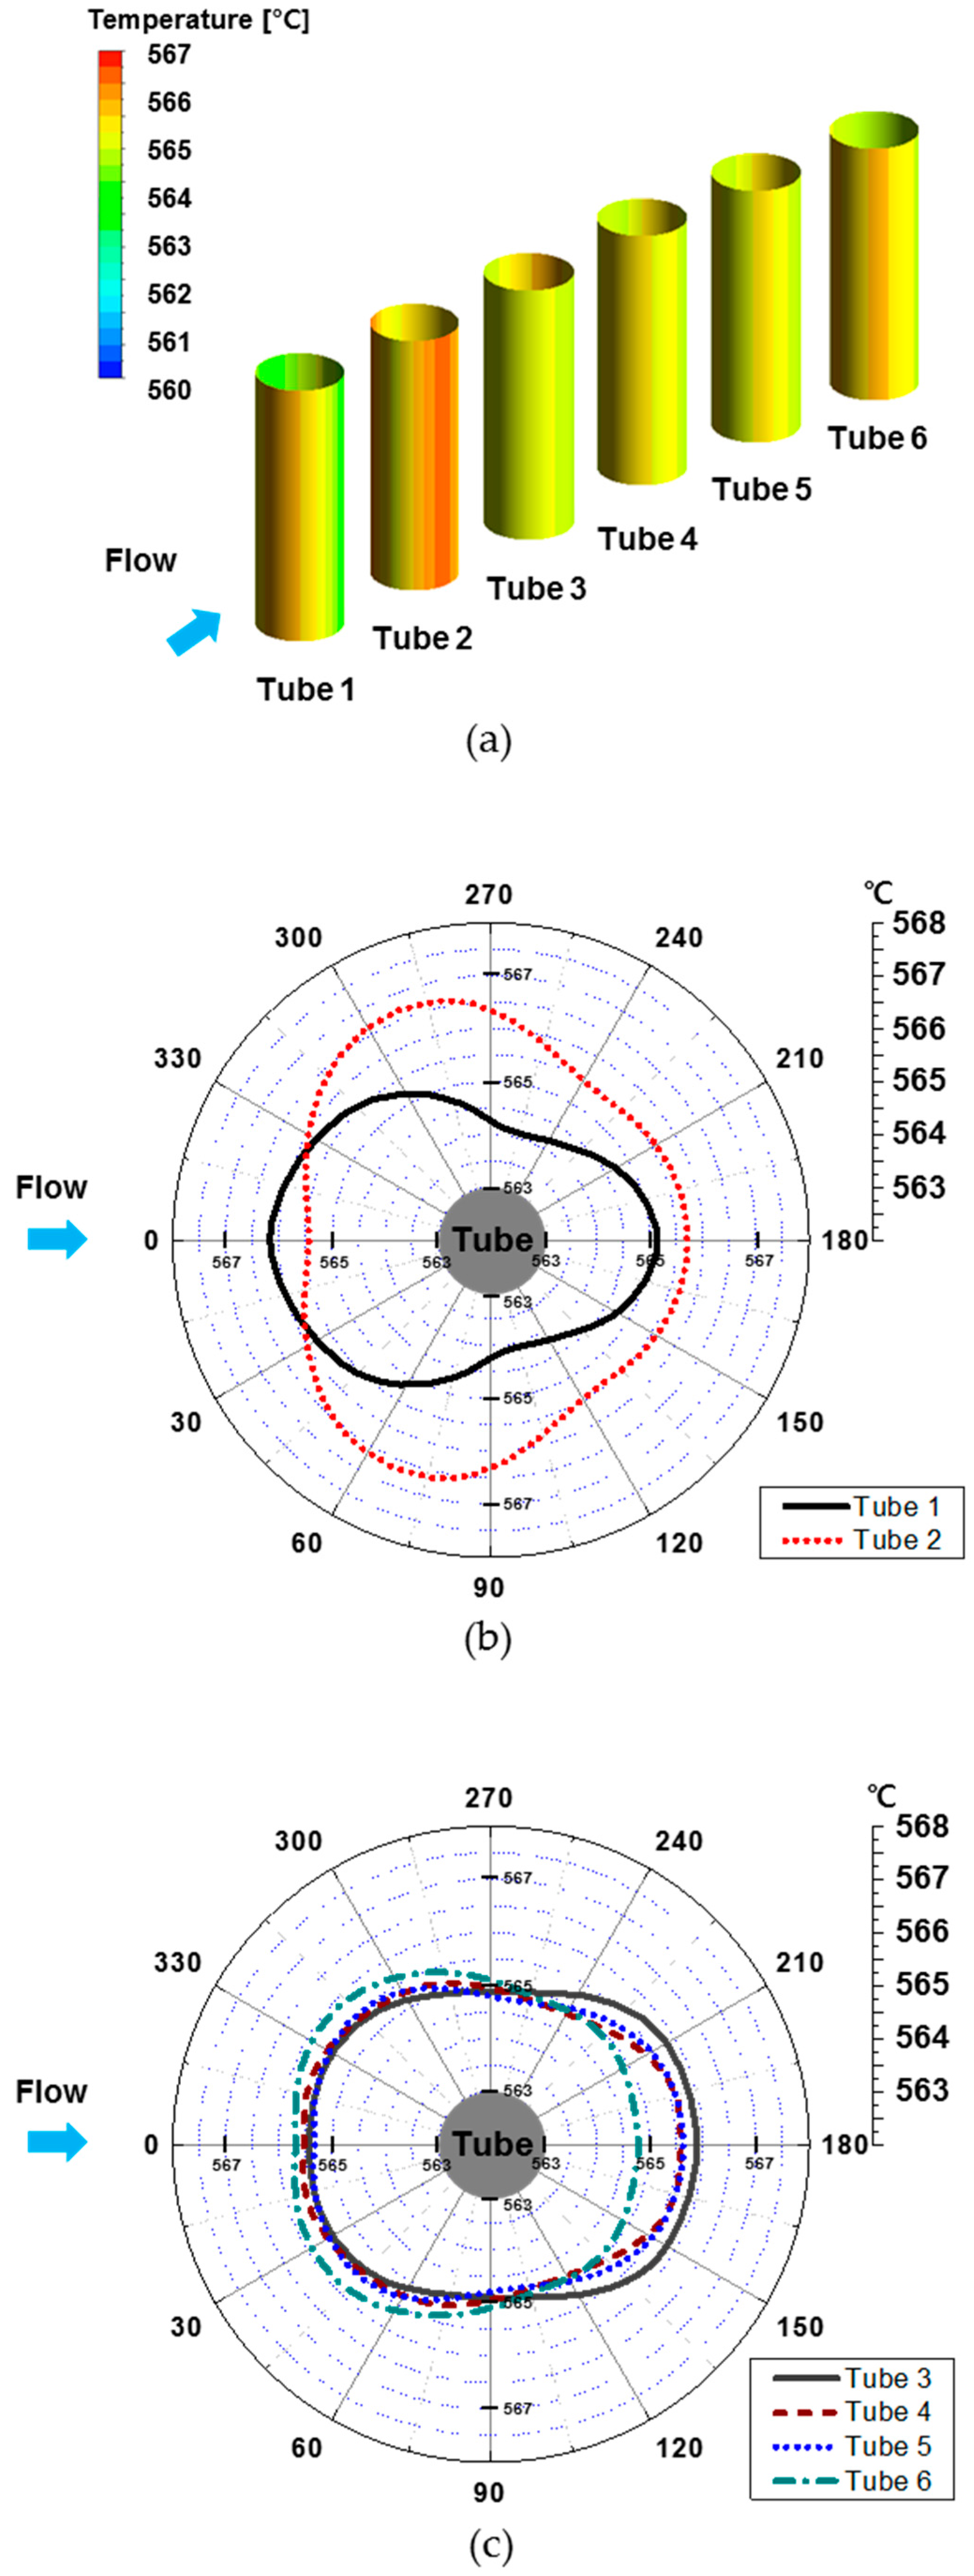
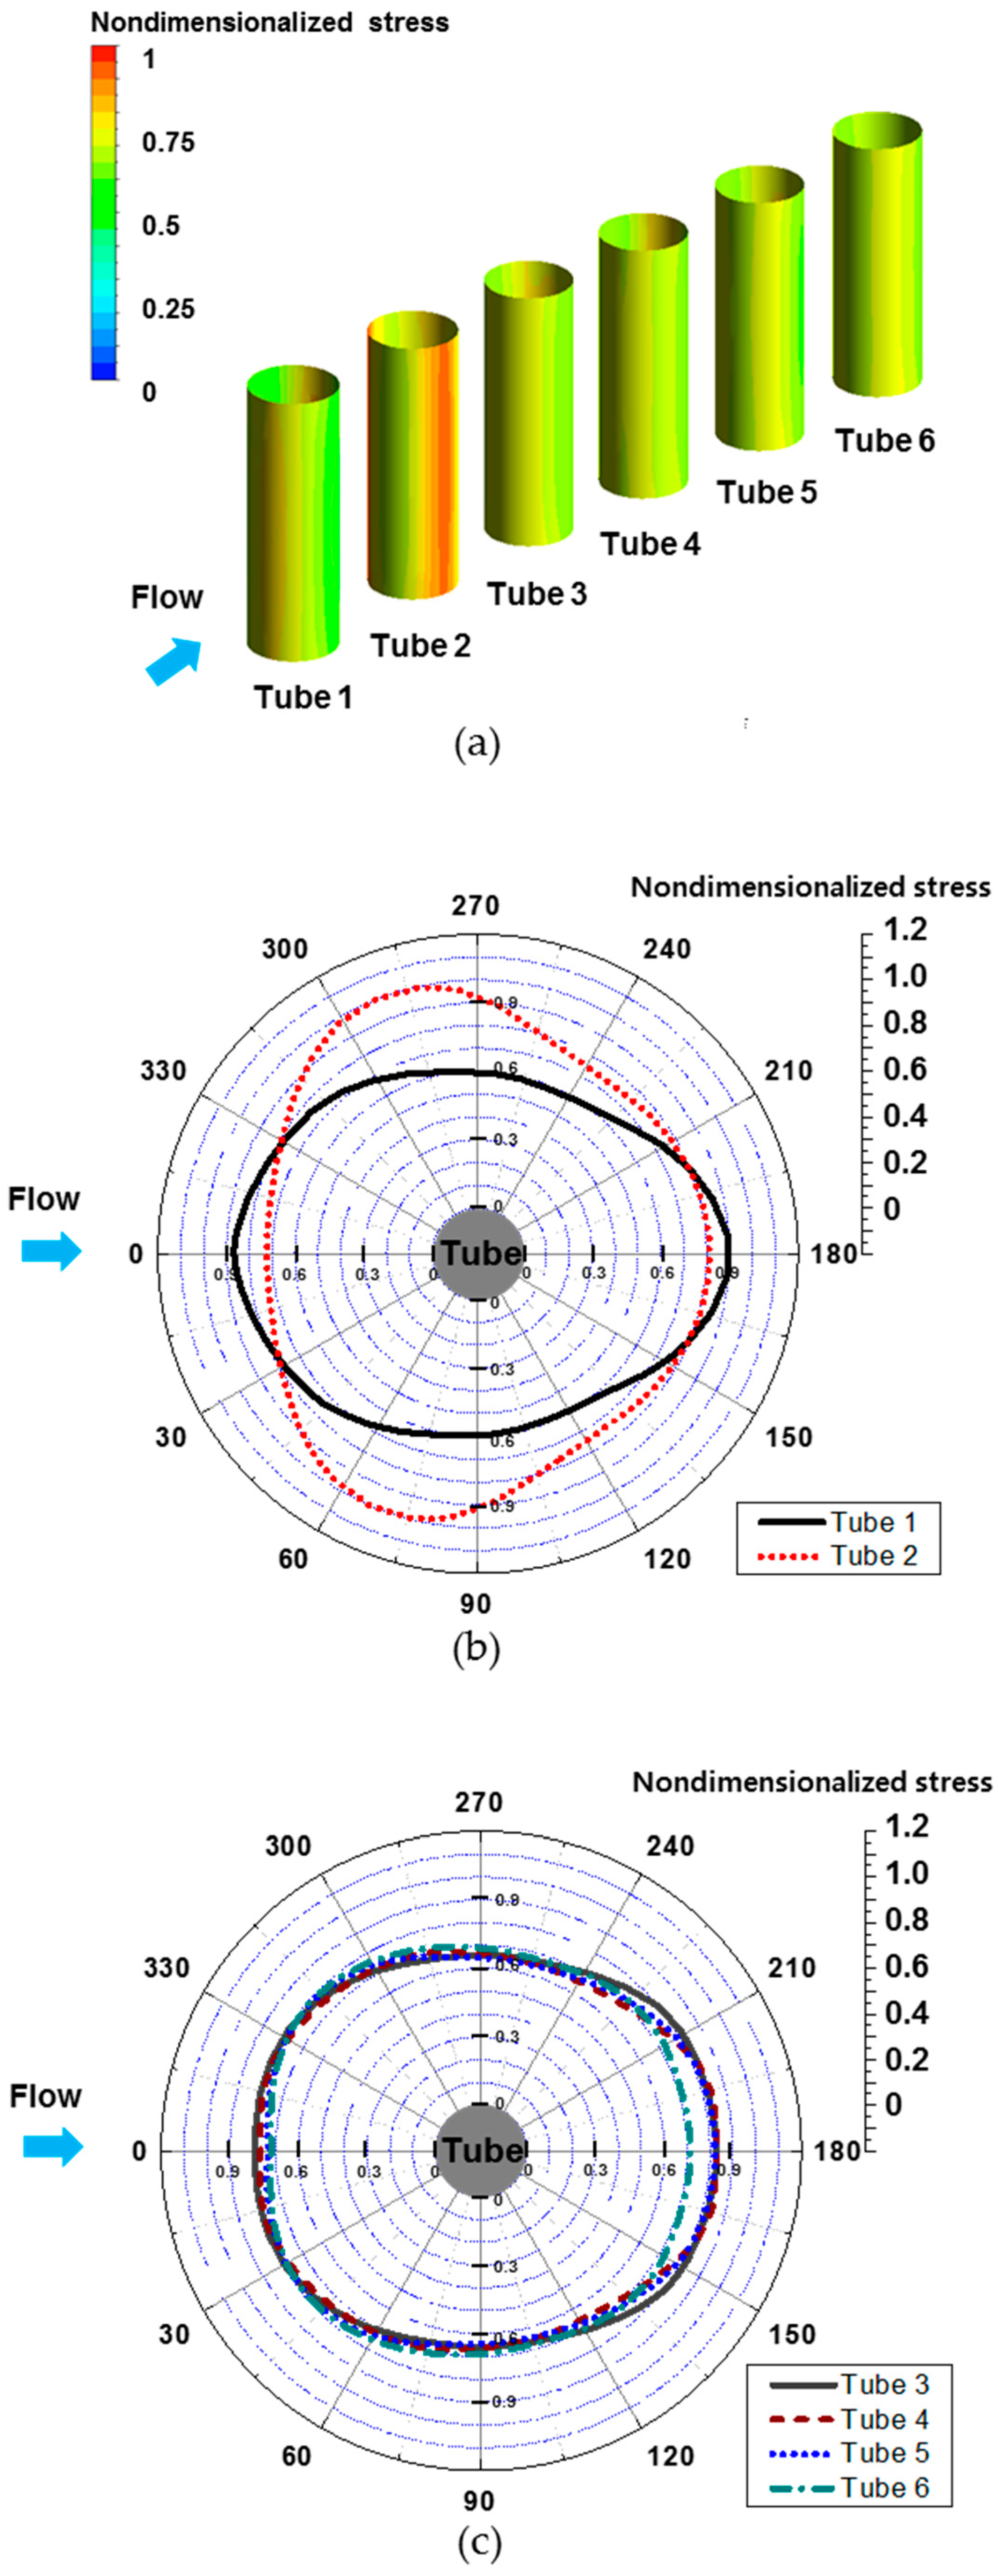
3.1. Flow Characteristics

Local heat transfer characteristics can be understood easily by analyzing flow characteristics. The streamwise velocity distribution of each of the three cases is shown in Figure 4. The velocity is different for each case, but the flow characteristics are similar. The flow impinged on the stagnation point of Tube 1. The flow passed around the surface of the tube bundles smoothly until the separation of the flow began in the x/ = 0 region. After the flow separation, a pair of vortices appeared behind Tube 1.
The distance in the streamwise direction is much shorter than that in the spanwise direction. For this reason, the distance in this direction was insufficient for the flow to develop. Therefore, the flow reattached in the x/ = 1.7 region of Tube 2. After the flow reattached, similar flow characteristics occurred periodically behind Tubes 3–5. As shown in Figure 4, the three different Reynolds number cases had similar flow characteristics in the region where the flow developed. Behind Tube 6, different flow characteristics were observed. However, if there are more rows of tube bundles, flow characteristics similar to those at Tubes 3–5 will be observed behind Tube 6. From these results, the flow characteristics of the final superheater Tube 1 and USC boiler will be similar to those shown in Figure 4.

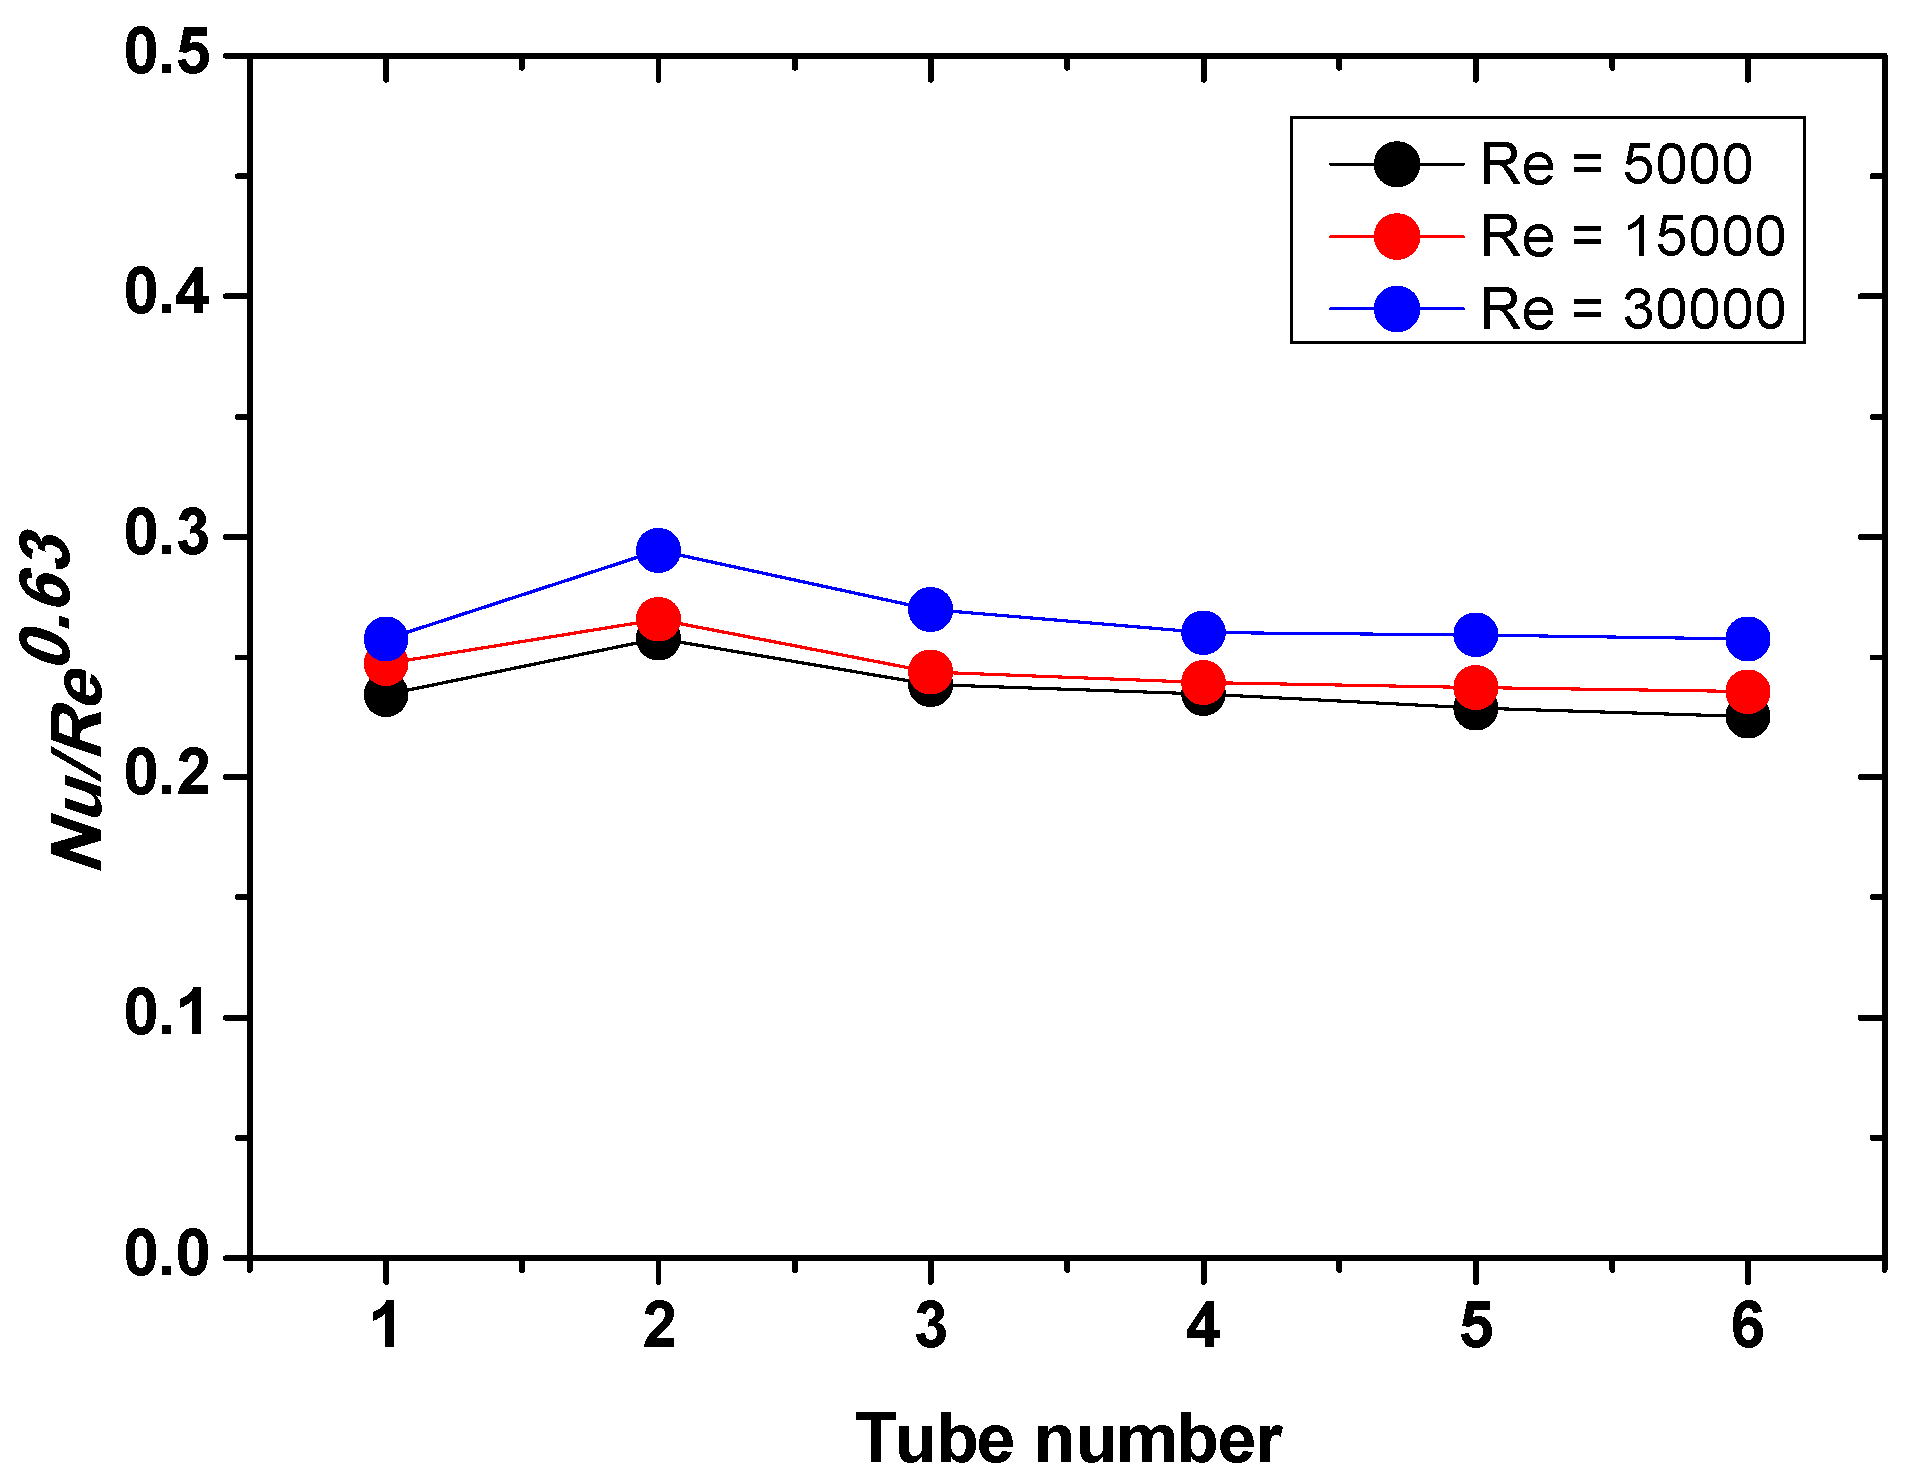
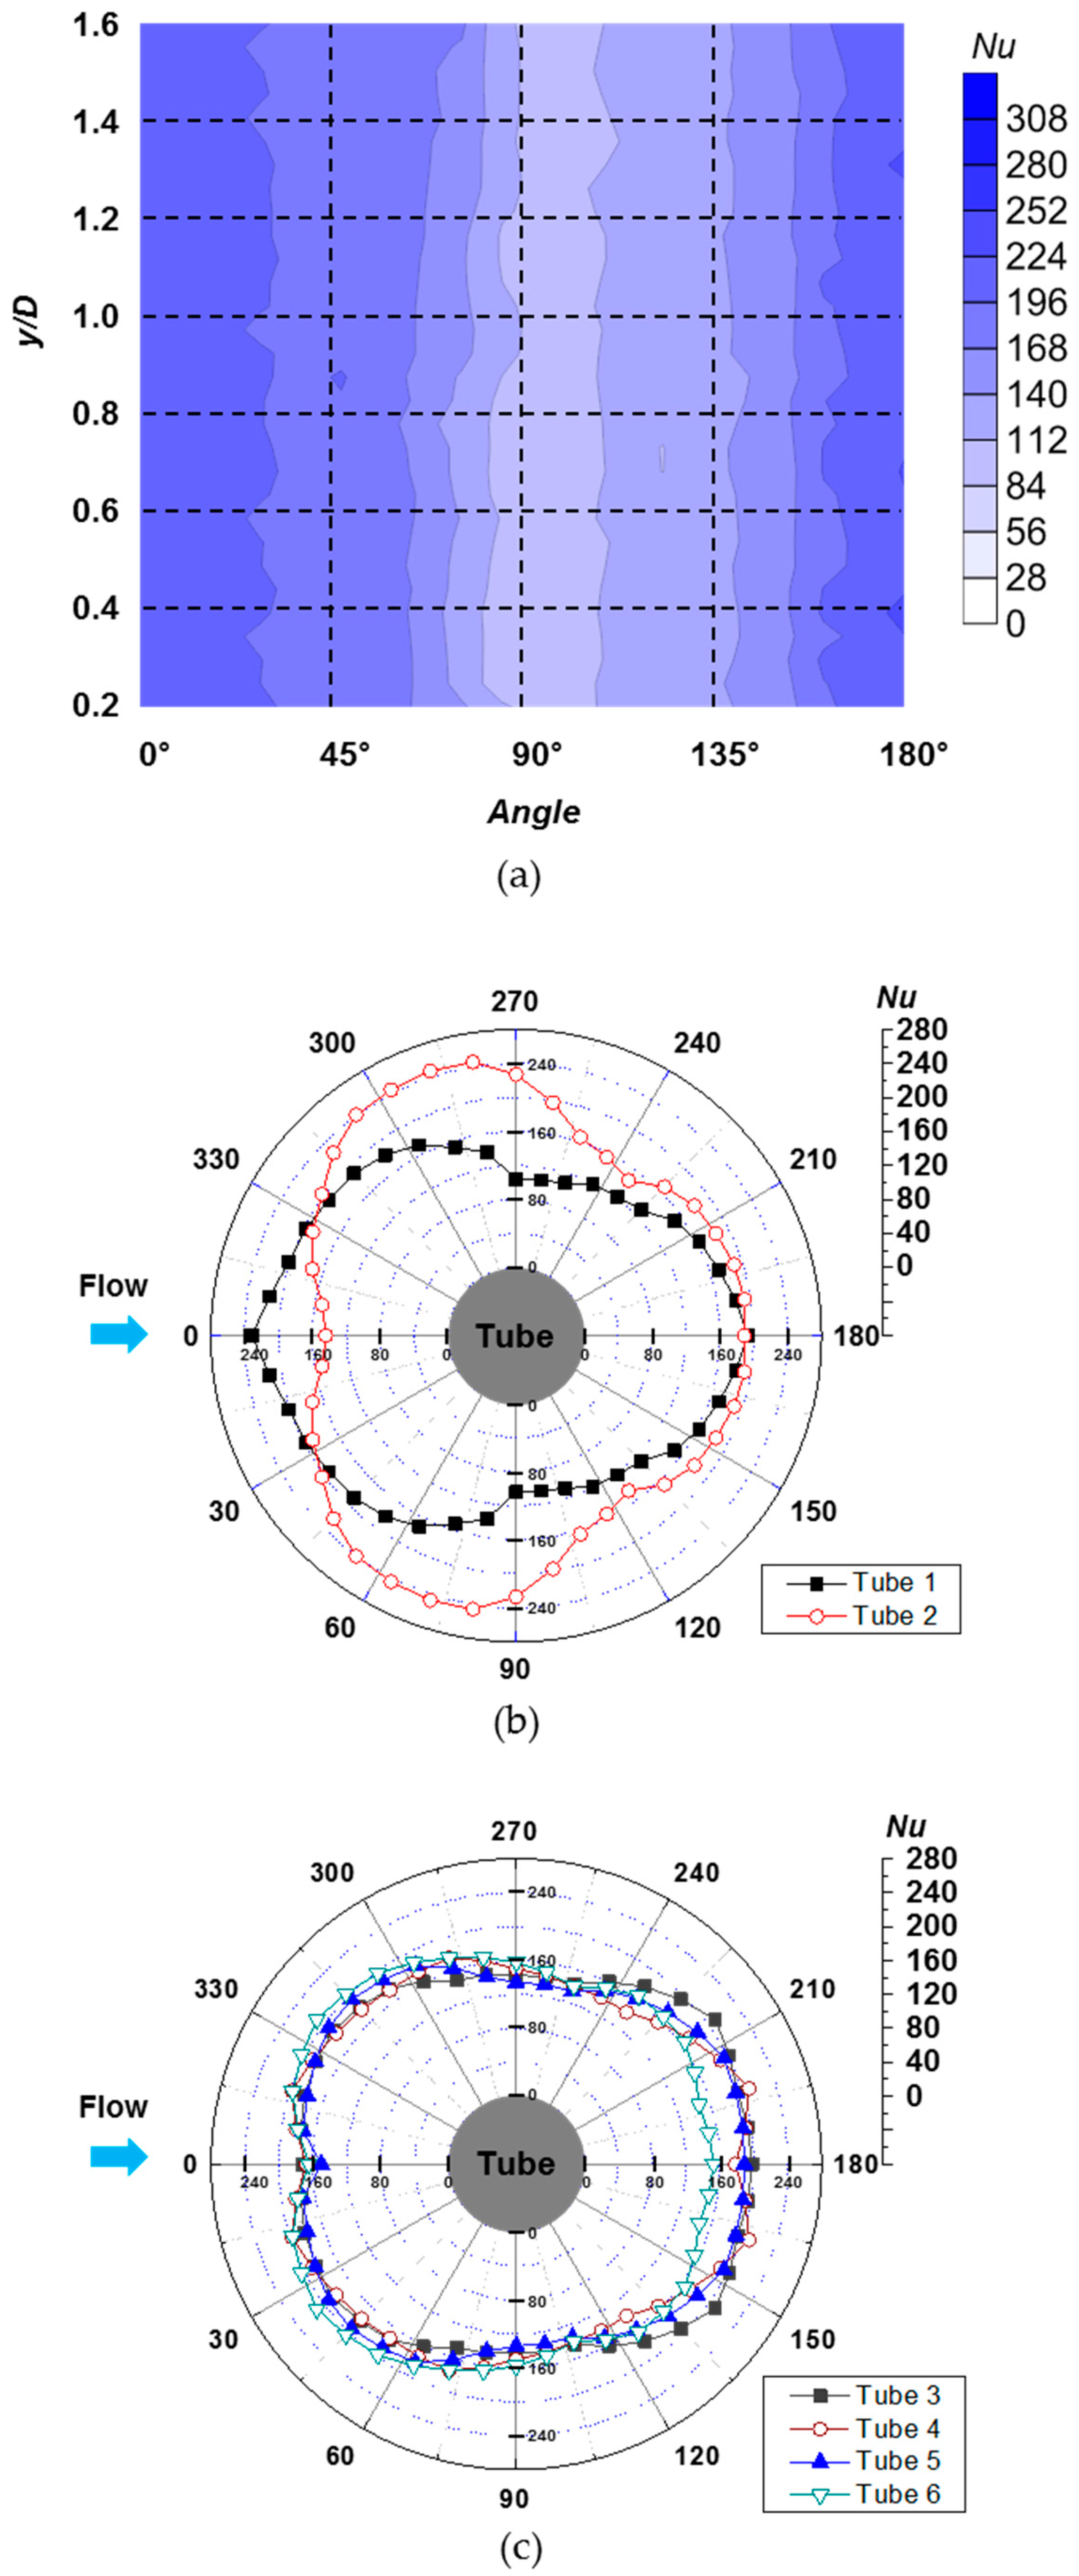
3.2. Heat Transfer Characteristics

The experimental results were compared with previously-reported results to confirm the conclusions regarding heat transfer. Figure 5 shows a comparison between the correlation reported by Zukauskas [35] and measured experimental results. The Nusselt number correlation for an in-line array of tube bundles by Zukauskas [35] is calculated using the following formula:
N u D = 0.255 R e D 0.63 P r 0.36
where N u D is the total area-averaged Nusselt number distribution of the tube bundles, R e D is the Reynolds number based on the diameter of tube bundle, and Pr is the Prandtl number. The results show that the experimental results correlate well with the results reported previously [35]. Therefore, experimental results were confident.
Figure 6 shows the area-averaged Nu/Re0.63 of each tube bundle with various Reynolds numbers. As the experimental results correlated well with the findings of Zukauskas, Nu/Re0.63 had similar heat transfer values in cases with different Reynolds numbers. The laminar flow impinged on Tube 1 and flow separation occurred. The highest heat transfer occurred at Tube 2. This decreased as the flow developed. The area-averaged heat transfer rates at Tubes 3–6 were similar. From these results, when the flow became fully developed, the area-averaged values of the heat transfer were similar at each tube. Furthermore, if more rows of tube bundles were placed beyond Tube 6, the value of the area-averaged heat transfer would be similar to that of Tubes 3–6.
The local mass transfer distribution which was measured by the naphthalene sublimation method is shown in Figure 7a. Figure 7a shows the local Nusselt number distribution of Tube 1 in the case of Re = 30,000. The variation of the local heat transfer depended on the angle. The angle was small in the vertical direction. As the flow had a uniform velocity distribution in the vertical direction, the heat transfer rate was similar. Other tube bundles have different Nusselt number distributions, but the variations of the heat transfer in the vertical direction were similar to the variation characteristics of Tube 1. Therefore, the local Nusselt number distribution of Tube 1 was presented as an example.
Figure 7b,c shows the magnitude of the vertically averaged local heat transfer distribution for Re = 30,000. The heat transfer pattern was different for Tubes 1 and 2, as shown in Figure 7b. As mentioned previously, there was a high rate of heat transfer at the reattachment point near Tube 1. At Tube 1, the heat transfer gradually decreased as the angle increased. This was much lower in the separation region. The heat transfer in the separation region was around 45% of that in the stagnation point region. As the Reynolds number increased, the heat transfer decreased less. The characteristics of Tube 1 were similar to those reported elsewhere [36].
The heat transfer characteristics of Tube 2 differed from those of Tube 1. Tube 2 had the highest heat transfer at an angle of 60°. At this angle, the flow reattached for every Reynolds number. The heat transfer in the reattachment region was higher than that at 0°. The reattachment region had around 169% of heat transfer in the 0° region. After the flow reattachment, the heat transfer decreased gradually. The development of the heat transfer flow in Tubes 3–6 is shown in Figure 7c. As the flow developed, the local heat transfer varied less. The difference between the maximum and minimum heat transfer at Tube 3 was around 60. However, at Tube 6 with Re = 30,000, the difference was approximately 50. Similar characteristics were observed for each of the three Reynolds numbers.
Thermal analysis based on local heat transfer distribution data was conducted, as mentioned before. Figure 8 shows the local temperature distribution on tube bundles with Re = 30,000. As the heat transfer distributions varied from Tube 1 to Tube 6, the temperatures varied. The highest temperature was observed at Tube 2. Figure 8b shows the local temperature distributions at Tubes 1 and 2. The temperature at the stagnation point was high due to the flow impingement. The temperature gradually decreased until 90°, after which it increased due to the effect of vortex shedding. On Tube 2, the angles 60° and 300° had the highest level of temperature flow reattachment. Figure 8c shows the local temperature distribution of Tubes 3–6. As the heat transfer coefficients were similar due to the development of the flow, the temperature distributions of the tube bundles were similar. At Tubes 3–5, the angles 0° and 180° had high temperatures and there were low temperatures at the angles 90° and 270°. However, the temperature deviation was within 1–2 °C. The temperature of Tube 6 was the lowest around 180°. This was not the case for other tube bundles. This is because there are no other tube bundles after Tube 6. If there were further tube bundles after Tube 6, the temperature distribution would be similar to that observed at Tubes 3–5.
The temperature distribution results were used to perform stress analyses. Figure 9a shows the results of the stress analysis for each tube bundle. The stress analysis results were nondimensionalized by the maximum stress. The results show that the highest stress occurred at Tube 2. This was due to the high deviations in the temperature distribution. Figure 9b,c shows the local stress distributions at Tubes 1–6. At Tube 2, the largest stress occurred at angles 60° and 300°. The cause of the high level of stress is the large temperature gradient and the high temperature. The stress analysis results indicate that Tube 2 is the most vulnerable of the superheater tube bundles in the USC boiler.
The cause of large stress on Tube 2 can be released by moving the position of Tube 2. The high heat transfer occurred at 60° of Tube 2 where the flow reattached. Moving the position of Tube 2 around x/ = 0.5–1.0 can avoid the flow reattachment of Tube 2. The high heat transfer can be avoided, which causes high stress on Tube 2. However, considering other factors, such as deposition, corrosion, etc., will be helpful in predicting the flow and heat transfer of superheater tube bundles in the USC boiler more precisely.

4. Conclusions

Heat transfer in tube bundles was measured experimentally for various Reynolds numbers. The local heat transfer distributions were measured using the naphthalene sublimation method, which is based on the analogy between heat and mass transfer. Results showed that the flow impinged on the stagnation point at Tube 1 and reattached at Tube 2. High levels of heat transfer occurred in these regions for every Reynolds number. Subsequently, the fully-developed flow makes similar heat transfer patterns when passing through each of Tubes 3–6. The experimental results were used to analyze the thermal and stress characteristics numerically. The results showed that the highest stress occurred at the reattachment point of Tube 2 due to the large temperature gradient. Tube 2 is the most vulnerable of the superheater tube bundles of the USC boilers. To release the high stress on Tube 2, moving the position of Tube 2 can avoid the flow reattachment which causes the high heat transfer.

Acknowledgments

This work was supported by the Human Resources Development program (No.20144030200560) of the Korea Institute of Energy Technology Evaluation and Planning (KETEP) grant funded by the Korea government Ministry of Trade, Industry and Energy.

Author Contributions

Seok Min Choi and Jun Su Park designed and conducted experiments. Hyung Hee Cho contributed to analysis and guided writing the manuscript. All authors analyzed the data. All authors discussed the results and commented on the manuscript.

Conflicts of Interest

The authors declare no conflicts of interest.

Nomenclature

CFBcirculating fluidized bed
Dnaphmass diffusion coefficient of naphthalene vapor in air (m2/s)
hmmass transfer coefficient (m/s)
LVDTlinear variable differential transformer
m ˙ local naphthalene mass transfer rate per unit area (kg/(m2·s))
NuNusselt number
NuDTotal area averaged Nusselt number
PrPrandtl number
ReReynolds number
ReDReynolds number based on diameter of the tube bundle
Sdistance between tube bundles
ScSchmidt number
ShSherwood number
SOFAseparated overfire air
Sx/Dgradient of the tube bundles in the streamwise direction
Sz/Dgradient of the tube bundles in the spanwise direction
Δtrun time (s)
USCultra-supercritical
xcoordinate in the x-direction
ycoordinate in the y-direction
zcoordinate in the z-direction
Δzsublimation depth of naphthalene surface (m)

Greek Symbols

ρ s density of solid naphthalene at the surface (kg/m3)
ρ v , w vapor density of naphthalene at the surface (kg/m3)
ρ v , vapor density of naphthalene in the main stream (kg/m3)
θ coordinate in tangential direction
tube bundle diameter (mm)

References

  1. International Energy Agency (IEA). Key world energy statistics. 2015. Available online: https://www.iea.org/publications/freepublications/publication/KeyWorld2016.pdf (accessed on 27 July 2016).
  2. Ultra Super Critical Pressure Coal Fired Boiler—State of the Art Technology Applications. Available online: https://www.yumpu.com/en/document/view/40407524/ultra-supercritical-pressure-coal-fired-boiler/1 (accessed on 23 September 2016).
  3. Dekhtiarev, V.L. On designing a large, highly economical carbon dioxide power installation. Elektr. Stantsii 1962, 5, 1–6. [Google Scholar]
  4. Feher, E.G. The supercritical thermodynamic power cycle. Energy Convers. 1968, 8, 85–90. [Google Scholar] [CrossRef]
  5. Kang, K.T.; Song, J.H.; Yoon, M.J.; Lee, B.H.; Kim, S.M.; Chang, Y.J.; Jeon, C.H. A numerical study on the effects of SOFA on NOx emission reduction in 500MW class sub-bituminous coal-fired boiler. Trans. Korean Soc. Mech. Eng. B 2009, 33, 858–868. [Google Scholar] [CrossRef]
  6. Pan, J.; Yang, D.; Chen, G.; Zhou, X.; Bi, Q. Thermal-hydraulic analysis of a 600 MW supercritical CFB boiler with low mass flux. Appl. Therm. Eng. 2012, 32, 41–48. [Google Scholar] [CrossRef]
  7. Fan, Z.; Goidich, S.; Robertson, A.; Wu, S. Ultra-supercritical pressure CFB boiler conceptual design study. Foster Wheel. Dev. 2006. [Google Scholar] [CrossRef]
  8. Hou, G.; Yang, Y.; Jiang, Z.; Li, Q.; Zhang, J. A new approach of modeling an ultra-super-critical power plant for performance improvement. Energies 2016, 9, 310. [Google Scholar] [CrossRef]
  9. Wang, L.; Yang, Y.; Morosuk, T.; Tsatsaronis, G. Advanced thermodynamic analysis and evaluation of a supercritical power plant. Energies 2012, 5, 1850–1863. [Google Scholar] [CrossRef]
  10. Xu, G.; Xu, C.; Yang, Y.; Fang, Y.; Li, Y.; Song, X. A novel flue gas waste heat recovery system for coal-fired ultra-supercritical power plants. Appl. Therm. Eng. 2014, 67, 240–249. [Google Scholar] [CrossRef]
  11. Yang, Y.; Wang, L.; Dong, C.; Xu, G.; Morosuk, T.; Tsatsaronis, G. Comprehensive exergy-based evaluation and parametric study of a coal-fired ultra-supercritical power plant. Appl. Energy 2013, 112, 1087–1099. [Google Scholar] [CrossRef]
  12. Liu, X.J.; Kong, X.B.; Hou, G.L.; Wang, J.H. Modeling of a 1000MW power plant ultra super-critical boiler system using fuzzy-neural network methods. Energy Convers. Manag. 2013, 65, 518–527. [Google Scholar] [CrossRef]
  13. Viswanathan, R.; Coleman, K.; Rao, U. Materials for ultra-supercritical coal-fired power plant boilers International. J. Press. Vessel. Pip. 2006, 83, 778–783. [Google Scholar] [CrossRef]
  14. Viswanathan, R.; Henry, J.F.; Tanzosh, J.; Stanko, G.; Shingledecker, J.; Vitalis, B.; Purgert, R. US program on materials technology for ultra-supercritical coal power plants. J. Mater. Eng. Perform. 2005, 14, 281–292. [Google Scholar] [CrossRef]
  15. Castello, P.; Guttmann, V.; Farr, N.; Smith, G. Laboratory-simulated fuel-ash corrosion of superheater tubes in coal-fired ultra-supercritical-boilers. Mater. Corros. 2000, 51, 786–790. [Google Scholar] [CrossRef]
  16. Lee, N.H.; Kim, S.; Choe, B.H.; Yoon, K.B.; Kwon, D.I. Failure analysis of a boiler tube in USC coal power plant. Eng. Fail. Anal. 2009, 16, 2031–2035. [Google Scholar] [CrossRef]
  17. Krauss, T.; Meyer, L. Experimental investigation of turbulent transport of momentum and energy in a heated rod bundle. Nucl. Eng. Des. 1998, 180, 185–206. [Google Scholar] [CrossRef]
  18. Chen, H.; Wang, Y.; Zhao, Q.; Ma, H.; Li, Y.; Chen, Z. Experimental investigation of heat transfer and pressure drop characteristics of H-type finned tube banks. Energies 2014, 7, 7094–7104. [Google Scholar] [CrossRef]
  19. Yeo, W.H.; Fry, A.T.; Purbolaksono, J.; Ramesh, S.; Inayat-Hussain, J.I.; Liew, H.L.; Hamdi, M. Oxide scale growth and presumed exfoliation in a 700 °C or higher steam condition: A simulation study for future operations of ultra-supercritical power plants. J. Supercrit. Fluid. 2014, 92, 215–222. [Google Scholar] [CrossRef]
  20. Yuan, Y.; Zhong, Z.H.; Yu, Z.S.; Yin, H.F.; Dang, Y.Y.; Zhao, X.B.; Gu, Y. Tensile and creep deformation of a newly developed Ni-Fe-based superalloy for 700 °C advanced ultra-supercritical boiler applications. Met. Mater. Int. 2015, 21, 659–665. [Google Scholar] [CrossRef]
  21. Metzger, D.E.; Berry, R.A.; Bronson, J.P. Developing heat transfer in rectangular ducts with staggered arrays of short tube fins. J. Heat Transf. 1982, 104, 700–706. [Google Scholar] [CrossRef]
  22. Armstrong, J.; Winstanley, D. A review of staggered array tube fin heat transfer for turbine cooling applications. J. Turbomach. 1988, 110, 94–103. [Google Scholar] [CrossRef]
  23. Sparrow, E.M.; Suopys, A.P.; Ansari, M.A. Effect of inlet, exit, and fin geometry on tube fins situated in a turning flow. Int. J. Heat Mass Transf. 1984, 27, 1039–1054. [Google Scholar] [CrossRef]
  24. Goldstein, R.J.; Chyu, M.K.; Hain, R.C. Measurement of local mass transfer on a surface in the region of the base of a protruding cylinder with a computer-controlled data acquisition system. Int. J. Heat Mass Transf. 1985, 28, 977–985. [Google Scholar] [CrossRef]
  25. Chyu, M.K.; Hsing, Y.C.; Shih, T.P.; Natarajan, V. Heat transfer contributions of tubes and endwall in tube-fin arrays: effects of thermal boundary condition modeling. J. Turbomach. 1999, 121, 257–263. [Google Scholar] [CrossRef]
  26. Ji, J.; Ge, P.; Bi, W. Numerical analysis on shell-side flow-induced vibration and heat transfer characteristics of elastic tube bundle in heat exchanger. Applied. Therm. Eng. 2016, 107, 544–551. [Google Scholar] [CrossRef]
  27. Eter, A.; Groeneveld, D.; Tavoularis, S. An experimental investigation of supercritical heat transfer in a three-rod bundle equipped with wire-wrap and grid spacers and cooled by carbon dioxide. Nucl. Eng. Des. 2016, 303, 173–191. [Google Scholar] [CrossRef]
  28. Zhang, L.Z.; Ouyang, Y.W.; Zhang, Z.G.; Wang, S.F. Oblique fluid flow and convective heat transfer across a tube bank under uniform wall heat flux boundary conditions. Int. J. Heat Mass Transf. 2015, 91, 1259–1272. [Google Scholar] [CrossRef]
  29. Shen, S.; Liu, H.; Gong, L.; Yang, Y.; Liu, R. Thermal analysis of heat transfer performance in a horizontal tube bundle. Desalination Water Treat 2015, 54, 1809–1818. [Google Scholar] [CrossRef]
  30. Pis’mennyi, E.N.; Terekh, A.M.; Polupan, G.P.; Carvajal-Mariscal, I.; Sanchez-Silva, F. Universal relations for calculation of the drag of transversely finned tube bundles. Int. J. Heat Mass Transf. 2014, 73, 293–302. [Google Scholar] [CrossRef]
  31. Ambrose, D.; Lawrenson, I.J.; Sparke, C.H.S. The vapor pressure of naphthalene. J. Chem. Thermodyn. 1975, 7, 1173–1176. [Google Scholar] [CrossRef]
  32. Goldstein, R.J.; Cho, H.H. A review of mass transfer measurements using naphthalene sublimation. Exp. Therm. Fluid Sci. 1995, 10, 416–434. [Google Scholar] [CrossRef]
  33. Eckert, E.R.G.; Drake, R.M., Jr. Analysis of Heat and Mass Transfer; Hemisphere Publishing: New York, NY, USA, 1987; pp. 306–383. [Google Scholar]
  34. Abernethy, R.B. ASME measurement uncertainty. J. Fluid. Eng. 1987, 107, 161–164. [Google Scholar] [CrossRef]
  35. Žkauskas, A. Heat transfer from tubes in crossflow. Adv. Heat Transf. 1987, 18, 87–159. [Google Scholar]
  36. Giedt, W.H. Investigation of variation of point unit heat-transfer coefficient around a cylinder normal to an air stream. Trans. ASME 1949, 71, 375–381. [Google Scholar]
Figure 1. Schematic of ultra-supercritical boiler [2].
Energies 09 00779 g001
Figure 2. (a) Side view of final super heater; (b) Top view of final super heater.
Energies 09 00779 g002
Figure 3. (a) Side view of experimental apparatus; (b) Top view of experimental apparatus; (c) Coordinates of naphthalene measured tube.
Energies 09 00779 g003
Figure 4. Flow at middle row of tube bundles: (a) Re = 5000; (b) Re = 15,000; (c) Re = 30,000.
Energies 09 00779 g004
Figure 5. Comparison of experimental results.
Energies 09 00779 g005
Figure 6. Area averaged Nu/Re0.63 of each tube bundle at various Reynolds numbers.
Energies 09 00779 g006
Figure 7. (a) Nusselt number distribution of Tube 1 at Re = 30,000, Vertically averaged Nusselt number; (b) Tubes 1 and 2; (c) Tubes 3–6.
Energies 09 00779 g007
Figure 8. (a) Temperature distribution of tube bundles for Re = 30,000, Vertically averaged temperature distribution; (b) Tubes 1 and 2; (c) Tubes 3–6.
Energies 09 00779 g008
Figure 9. (a) Stress distribution of tube bundles for Re = 30,000, Vertically averaged stress distribution; (b) Tubes 1 and 2; (c) Tubes 3–6.
Energies 09 00779 g009

