1. Introduction
Buildings are indisputably considered as one of the largest energy consuming sectors. According to the International Energy Agency (IEA), the average energy consumed by buildings represents 32% of worldwide energy consumption, with approximately 40% of the primary energy used in most countries. In France, the energetic consumption in the building sector is approximately about 43%, representing a quarter of the nation’s carbon dioxide emissions. The use of energy-hungry appliances to improve the thermal comfort is responsible for both the electrical energy consumption and the increase of greenhouse gas emissions [
1].
For this reason, some actions are performed to curb energy consumption and to protect the environment, for example, the use of renewable energies, passive energy buildings and the use of appropriate building codes for new or retrofitted buildings. Moreover, several studies and applications have shown that the building thermal inertia is among the possible solutions and should be improved, in order to achieve high performance and low-energy buildings [
2,
3,
4]. As a result, the question of the increase of the thermal energy capacity storage of materials used in the building sector arises. With this target in mind, a technology such as the use of phase change materials (PCMs) may be integrated into building envelopes, both to enhance the thermal energy storage [
5] and to improve the thermal comfort. Indeed, because of their higher thermal energy storage densities than other heat storage materials, these materials are able to store and release thermal energy as latent heat, when the phase change occurs. It is important to highlight the fact that the latent heat storage is much larger than the sensible heat storage [
6]. Usually, organic and inorganic PCMs are often used and solid-liquid phases are chosen [
7]. Despite the fact its thermal conductivity should be improved, paraffin is often used for latent heat thermal energy storage [
8]. Indeed, it has useful thermal properties such as absence of supercooling, chemical stability and a low vapor pressure [
3,
9].
The use of PCMs in the building envelope may reduce the peak loads due to heating, ventilating and air conditioning (HVAC) energy consumptions by increasing the thermal inertia of each wall of the building. The peak load may thus be shifted to the off-peak energy use load periods [
10]. In addition, the results of PCM-oriented research on buildings have shown that the thermal comfort was improved and energy savings could be achieved.
Among all the PCM applications to achieve high energy efficiency buildings, for example PCM-integrated walls, PCM-assisted ceiling heating and cooling, photovoltaic systems coupled with a PCM-based heat storage system, [
11], and so on, this paper deals with the inclusion of PCMs in the roof system. Generally, the roof is considered as a thermal buffer between the indoor and outdoor environment. This is the part of the building most exposed to solar radiation in hot climates and considered as the weakest part of a building’s thermal performance [
12,
13].
One possible solution to reduce heat transfer from outside to inside a building may be found in the increased use of mass insulation. Nevertheless, this type of thermal insulation allows one to reduce heat transfer due to conduction, but does not reduce heat transfer by infrared radiation through the roofing. To overcome this drawback, a solution based on the use of radiant barrier systems, which requires the presence of air layers in order to minimize radiation heat transfer, is proposed [
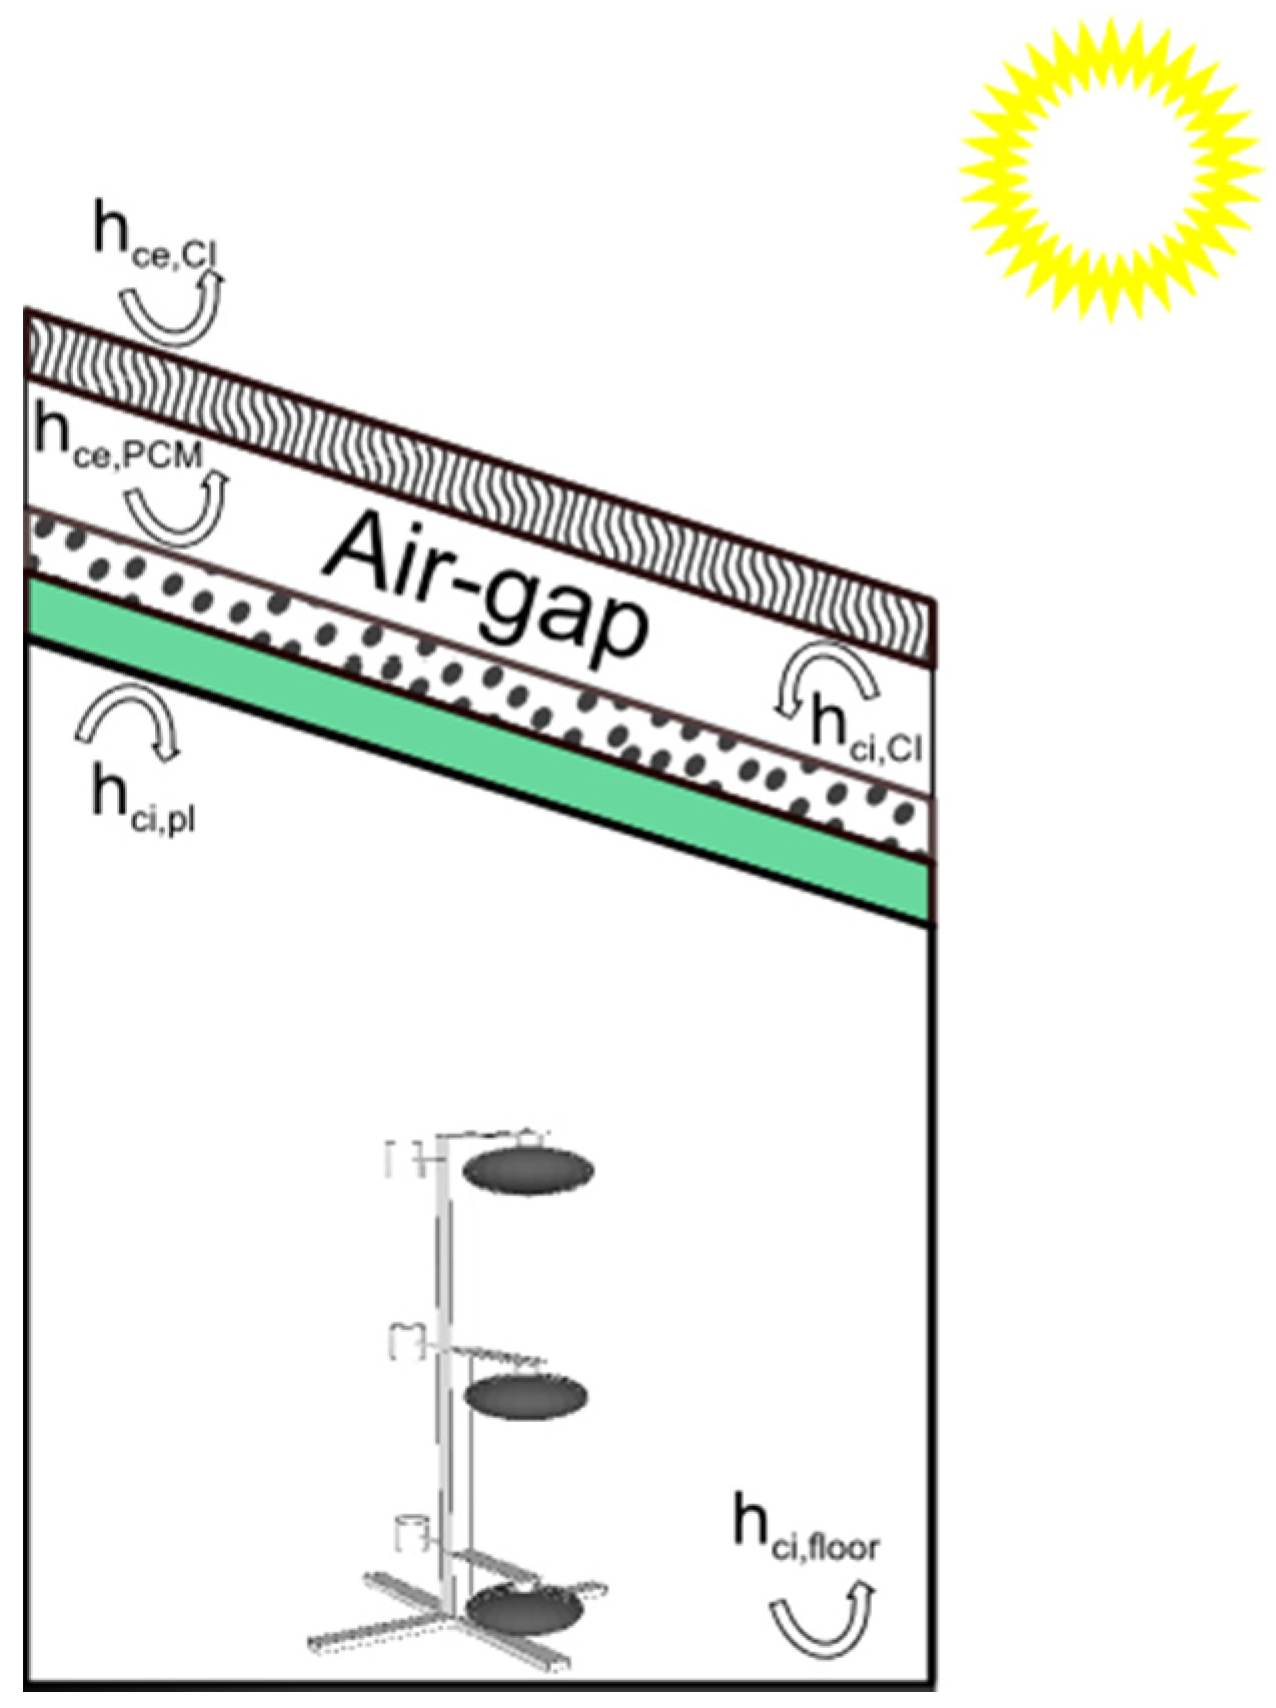
12]. Based on the same approach, PCM under a flexible sheet form laminated on both sides with an aluminum sheet is used in the lower part of the roof between the air layer and the drywall, both to enhance the thermal energy storage and to reduce the solar radiation through the roof system [
14]. Furthermore, before integrating PCM into new or retrofitted buildings, it is interesting to predict the thermal effects of these materials on the whole building performance. To contribute to the energy efficiency policy recommendations for buildings’ energy consumption, a one-dimensional simplified numerical model for PCMs has been developed and implemented in a prototype building simulation code named ISOLAB. ISOLAB is able to take into account the building envelopes, including PCM or not, and their actual impacts on energy consumption. Nevertheless, before using the PCMs model integrated in the ISOLAB code and to ensure the reliability of the results, this article focuses on the empirically validation of the latter. We first present the tools used, building simulation code and the generic optimization program GenOpt®. We then briefly describe the studied system as well as the main results of previous work. Finally, results of the experimental validation of the thermal model are presented and discussed.
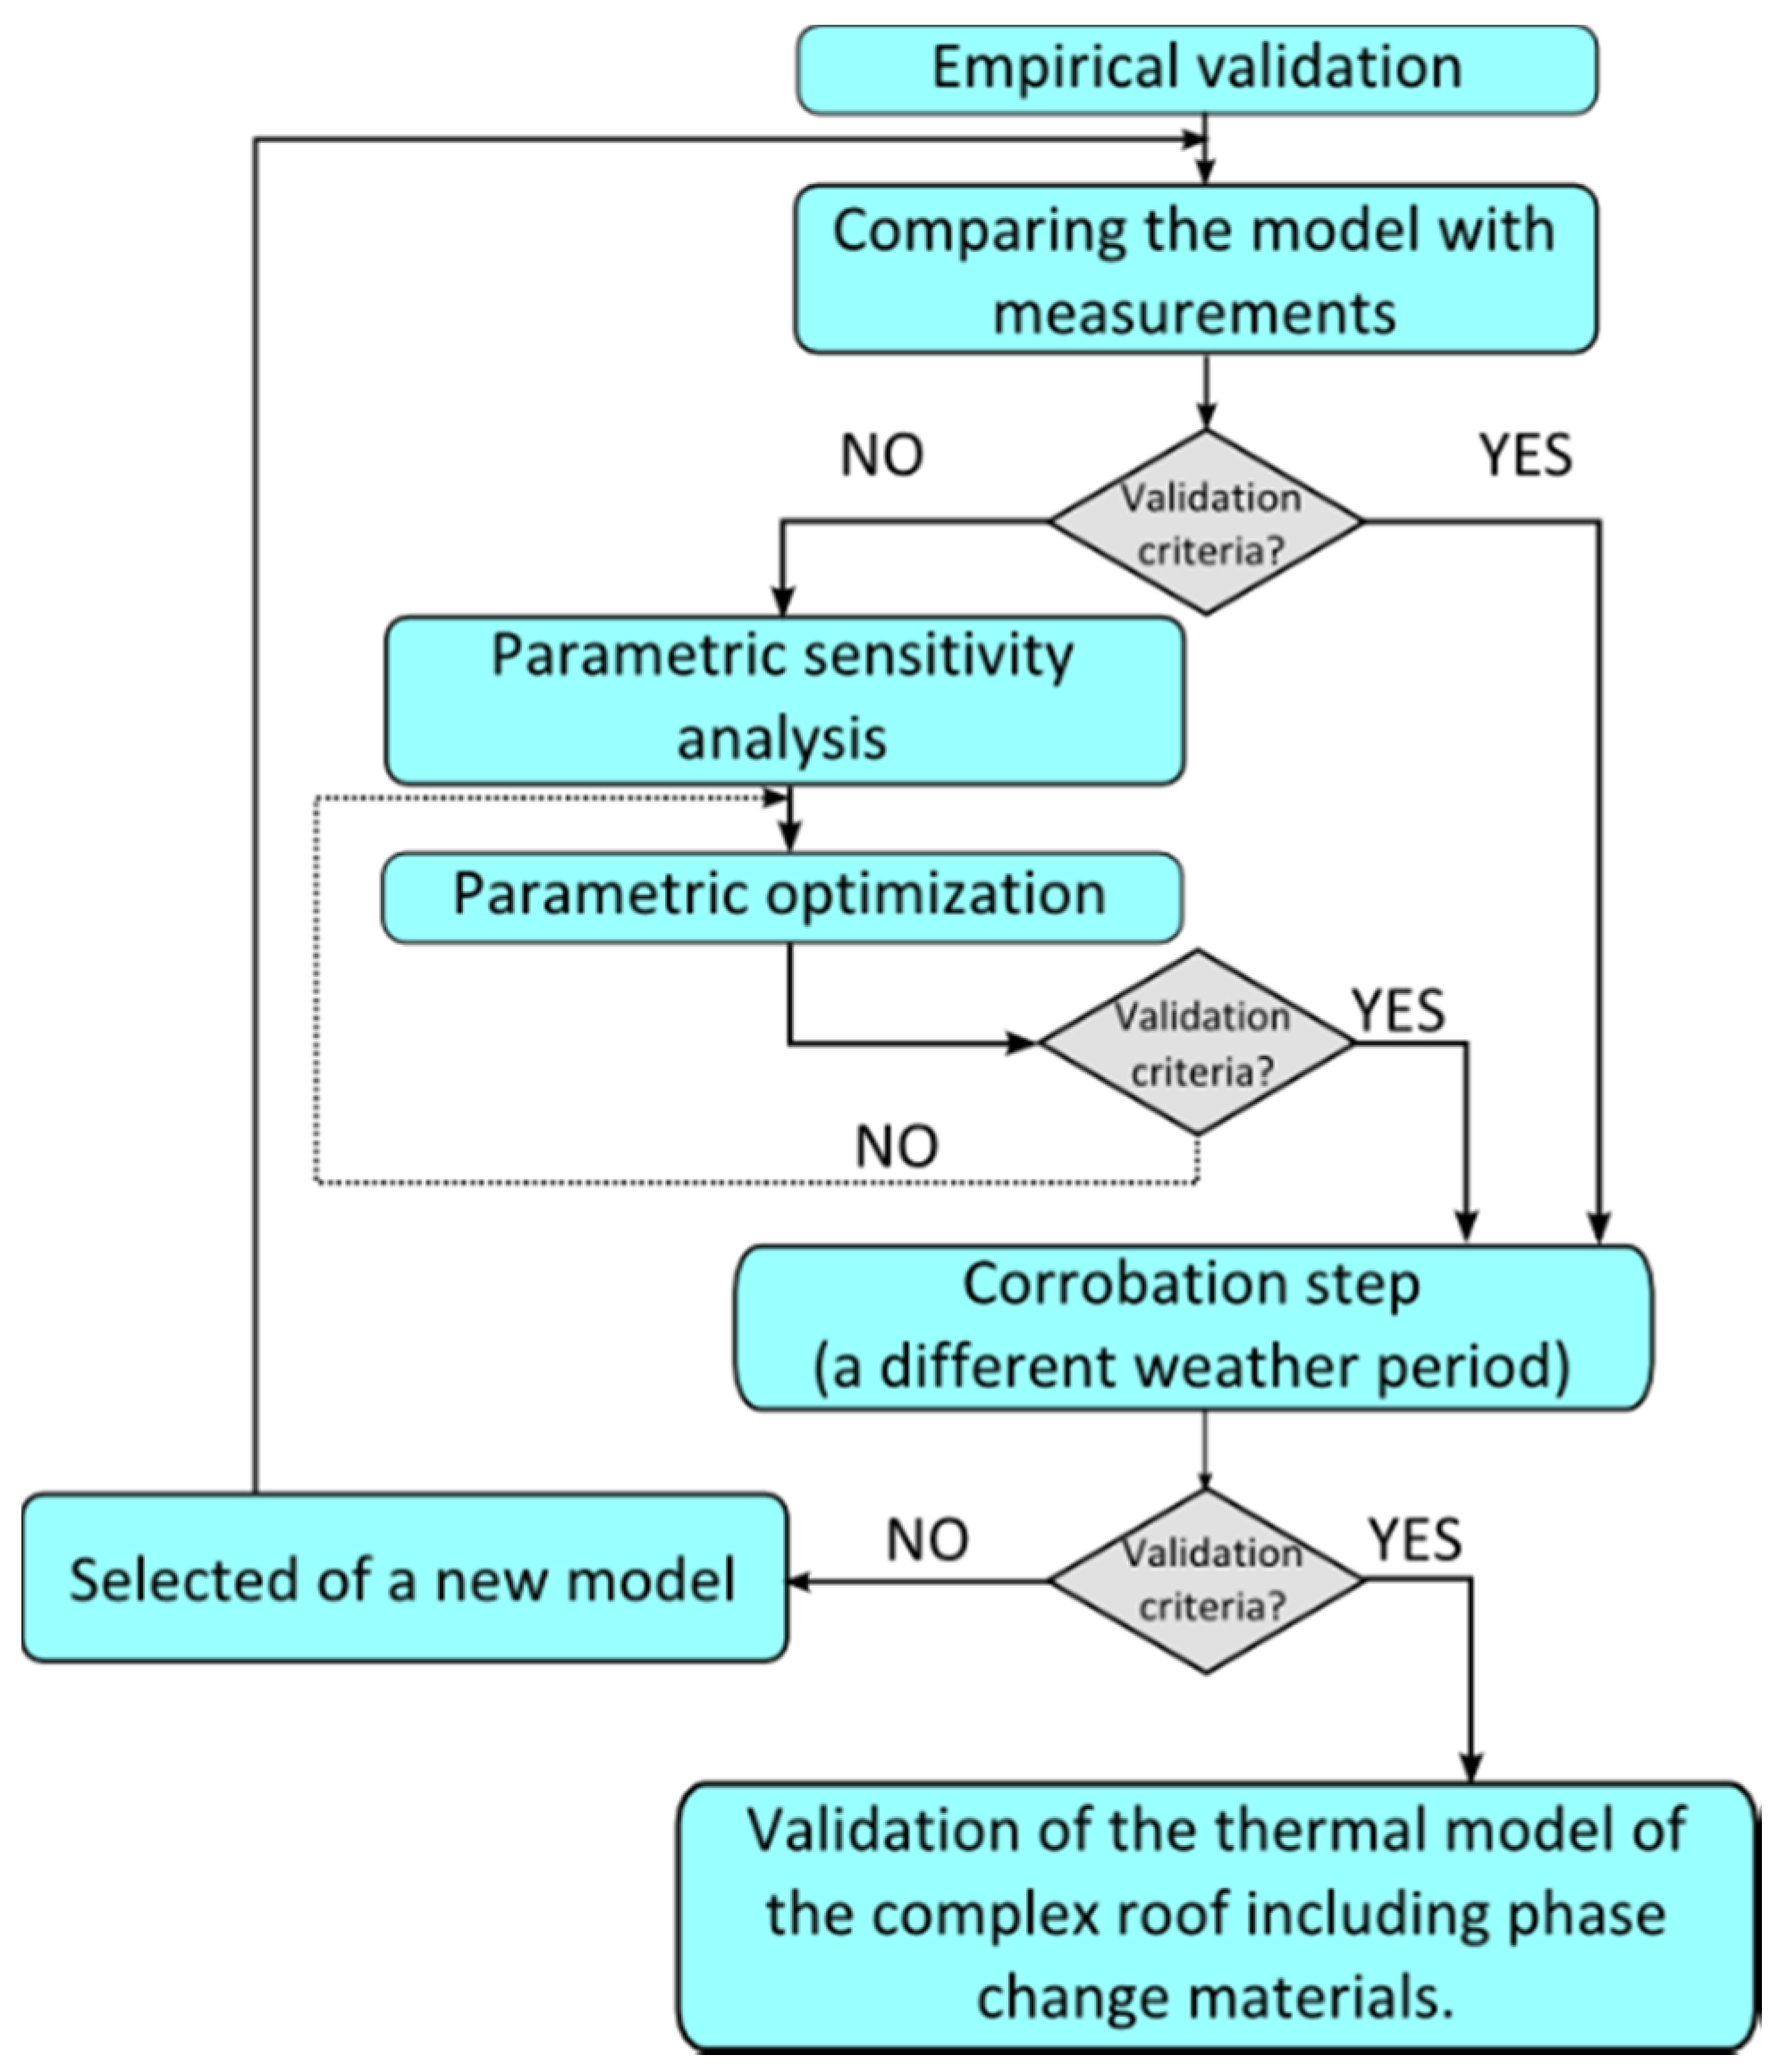
5. Empirical Validation of the Phase Change Material Model
5.1. Phase Change Material Model Optimization Using GenOpt®
The optimization sequence consists in achieving the best set of parameters by maximizing or minimizing a chosen cost function, subject to a set of constraints (or a defined domain), until optimization criteria are met. Indeed, many simulations are run and when a stopping criterion is reached, like the required error on the studied output for instance, the optimization is stopped.
To optimize the thermal model of PCM implemented in ISOLAB by using GenOpt
®, a methodology for the coupling of the building simulation code with the optimization program is required. The study has already been published and the interested reader may see [
18] for details.
Among the various methods of fixing sets of parameters implemented in GenOpt
®, the generalized pattern search (GPS) Hooke-Jeeves MultiStart Algorithm was used. Indeed, it allows to look over some parameters and to avoid the result values to be obtained from a local minimum value. In addition, this algorithm is compatible with all building thermal insulation codes and gives reliable results. The cost function used is calculated by using a mathematical model tool based on the modified standard deviation:
If several model outputs are used to optimize the model, the global cost function is the sum of the absolute values of costs functions for each output. The optimization sequence is stopped, if and only if, same minimum values of the cost functions were reached for 10 different optimization sequences. In our approach, several optimization sequences (1500 optimization sequences were reached approximately) and statistics studies were performed.
5.2. Results of the Optimization
Results from the optimization sequence are summarized in
Table 4.
Table 4.
Parameters before and after optimization sequences.
Table 4.
Parameters before and after optimization sequences.
| Parameters | Before Optimization | After Optimization | Unit |
|---|
| hci,floor | 3.50 | 5.00 | W·m−2·K−1 |
| hci,w | 1.00 | 1.00 | W·m−2·K−1 |
| hci,PCM | 1.00 | 1.50 | W·m−2·K−1 |
| γ (when ) | 0.04 | 0.01 | - |
| hci,CI | 3.50 | 1.75 | W·m−2·K−1 |
| hce,CI | 25 | 5.7 V + 11.4 [15] | W·m−2·K−1 |
| αCI | 0.85 | 0.76 | - |
Each value of an optimized parameter is found in agreement with the physical phenomena. Indeed, convective exchange coefficients are very small and correspond to the non-ventilated upper air layer as the building was kept closed during the experimental sequence. To apply the process for determining the γ parameter, this coefficient has been evaluated to 0.01 when
. The value of absorptivity coefficient (α
CI) is equal to the value that was determined by [
30]. This value, lower than initially expected, can be justified by the fact that the cell was erected and covered a few years ago, time tending to decrease the absorptivity or dark color of the roof. Indeed, over time, the performances of buildings will not be the same than when the building was new [
15].
5.3. Comparison between Optimized Thermal Model of Phase Change Material with Measurements
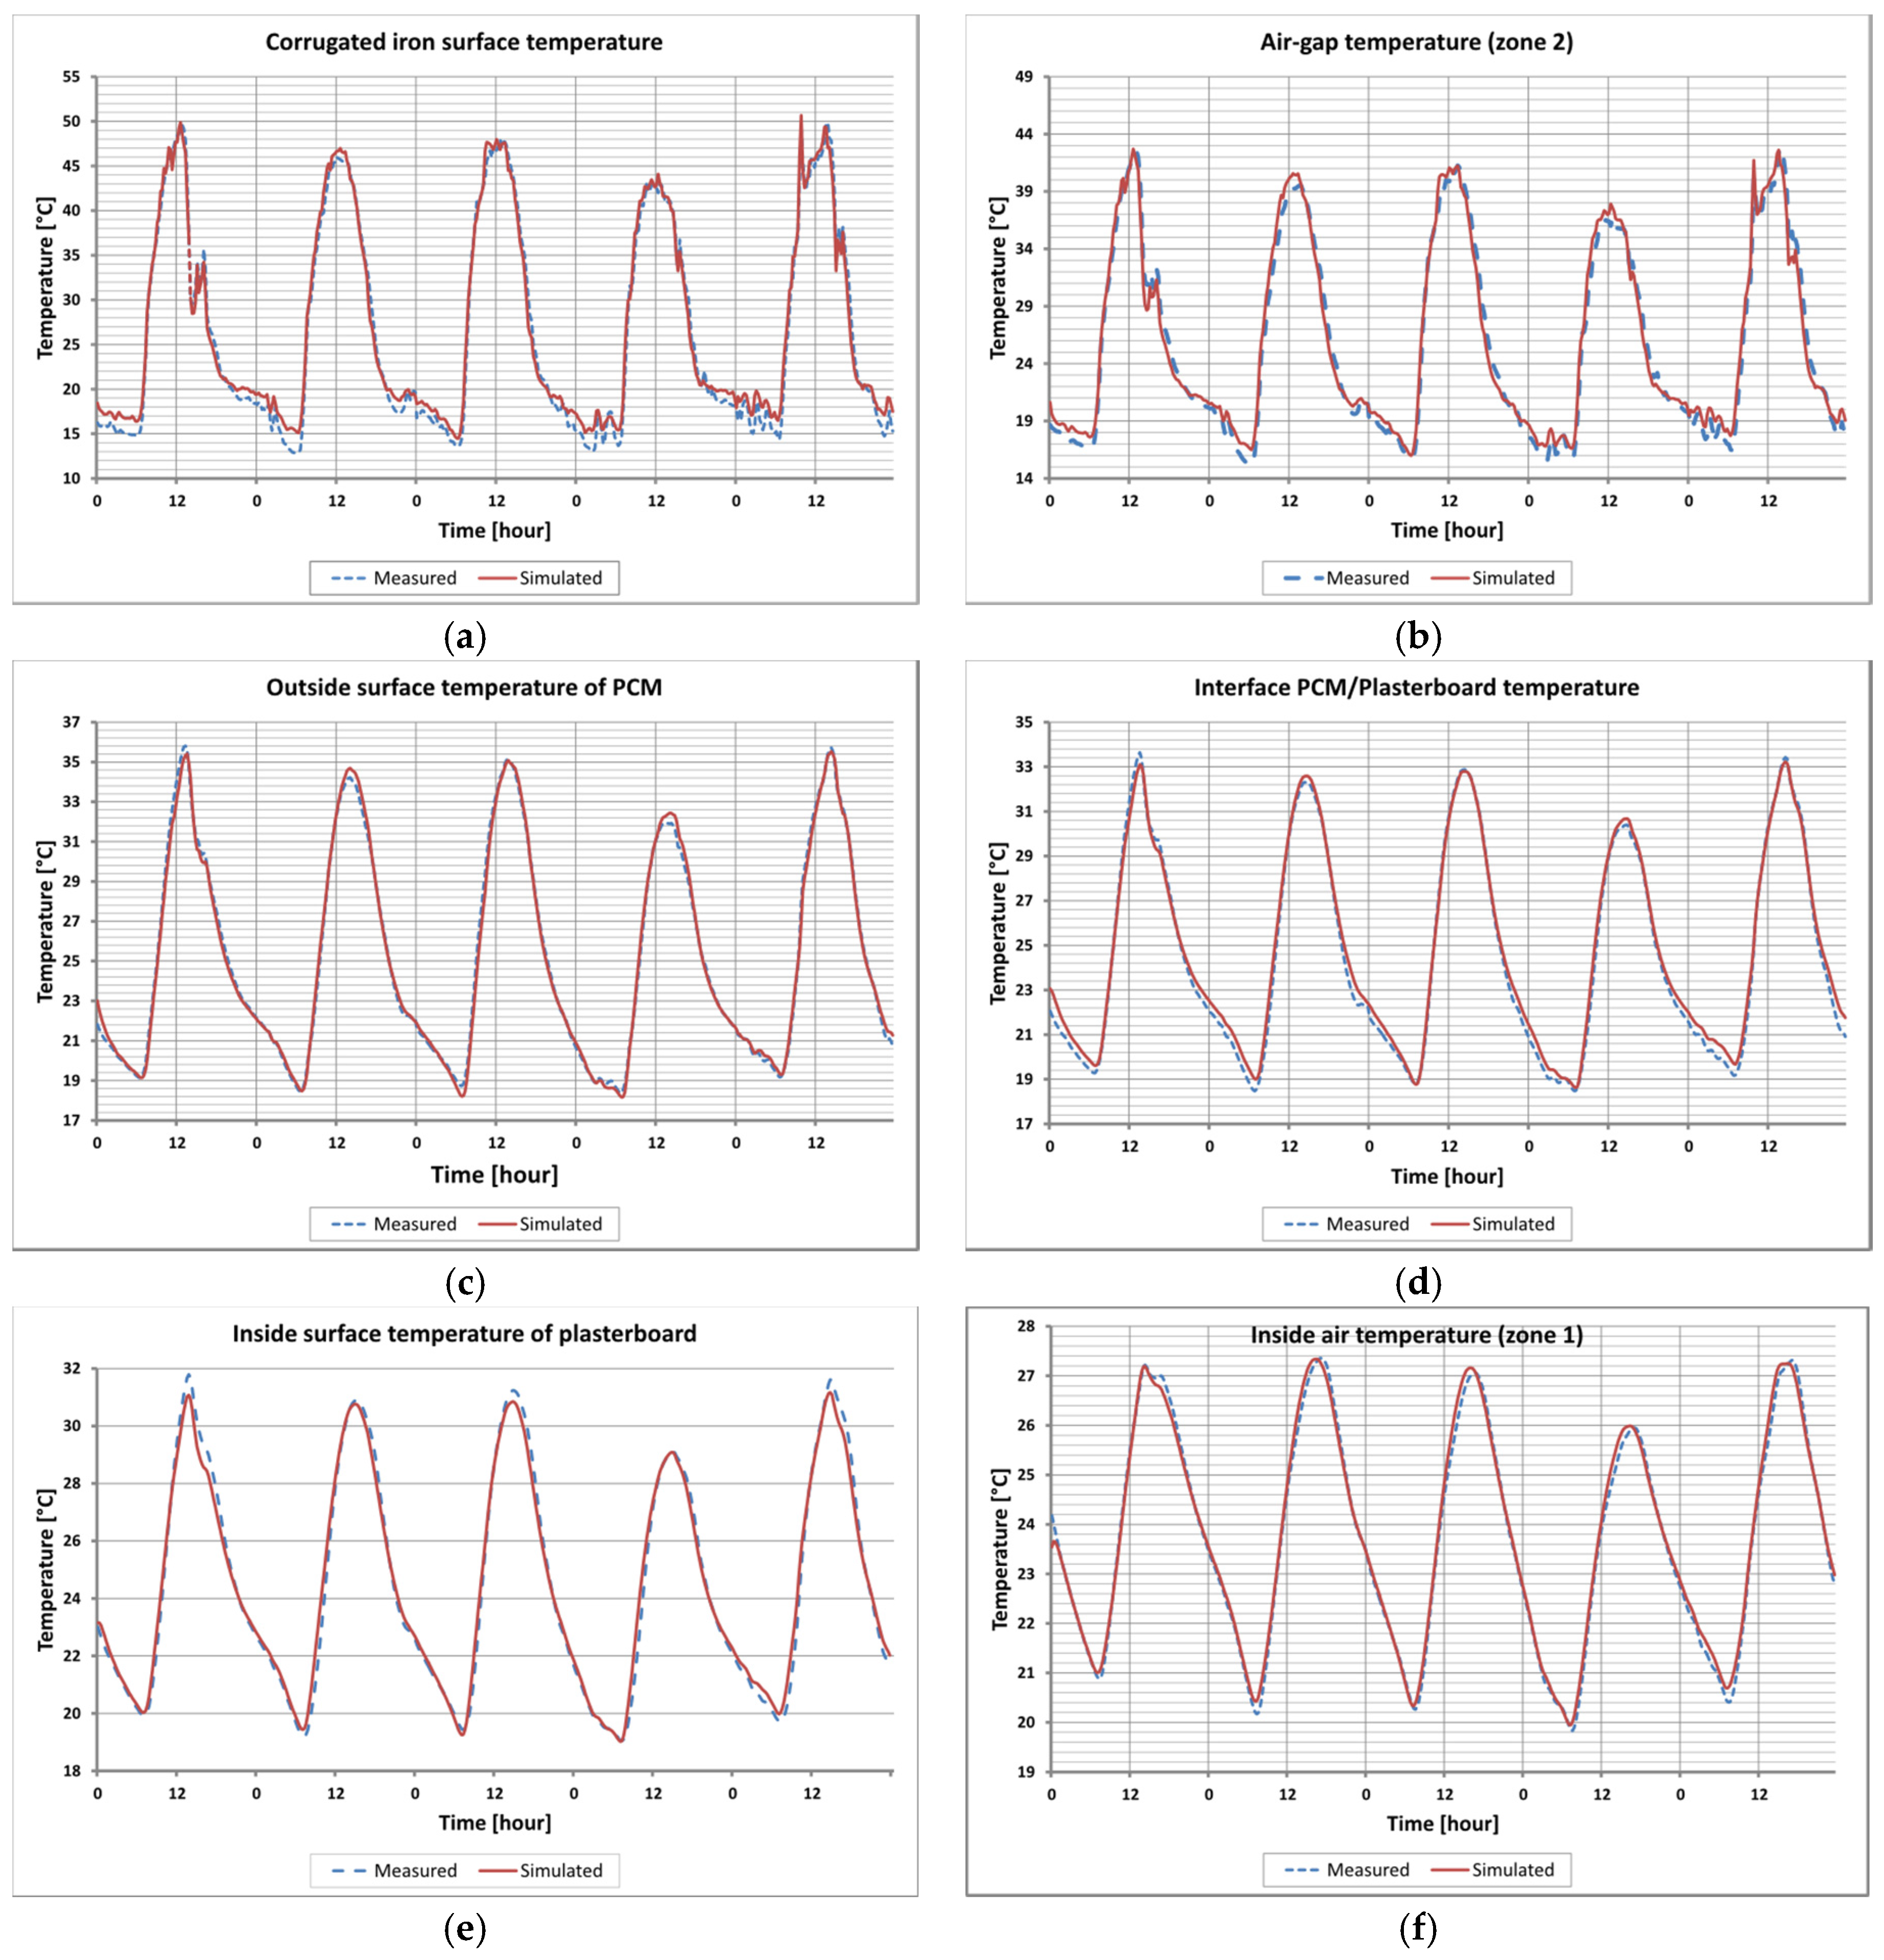
On the whole period, the dynamic behaviour of the components of the complex roof and the indoor air temperature are predicted well. Through the different curves (
Figure 7), we can ensure that the given melting temperature for this application was correctly chosen because the temperatures on both sides of PCM allow the storage and the release of energy during phase change process.
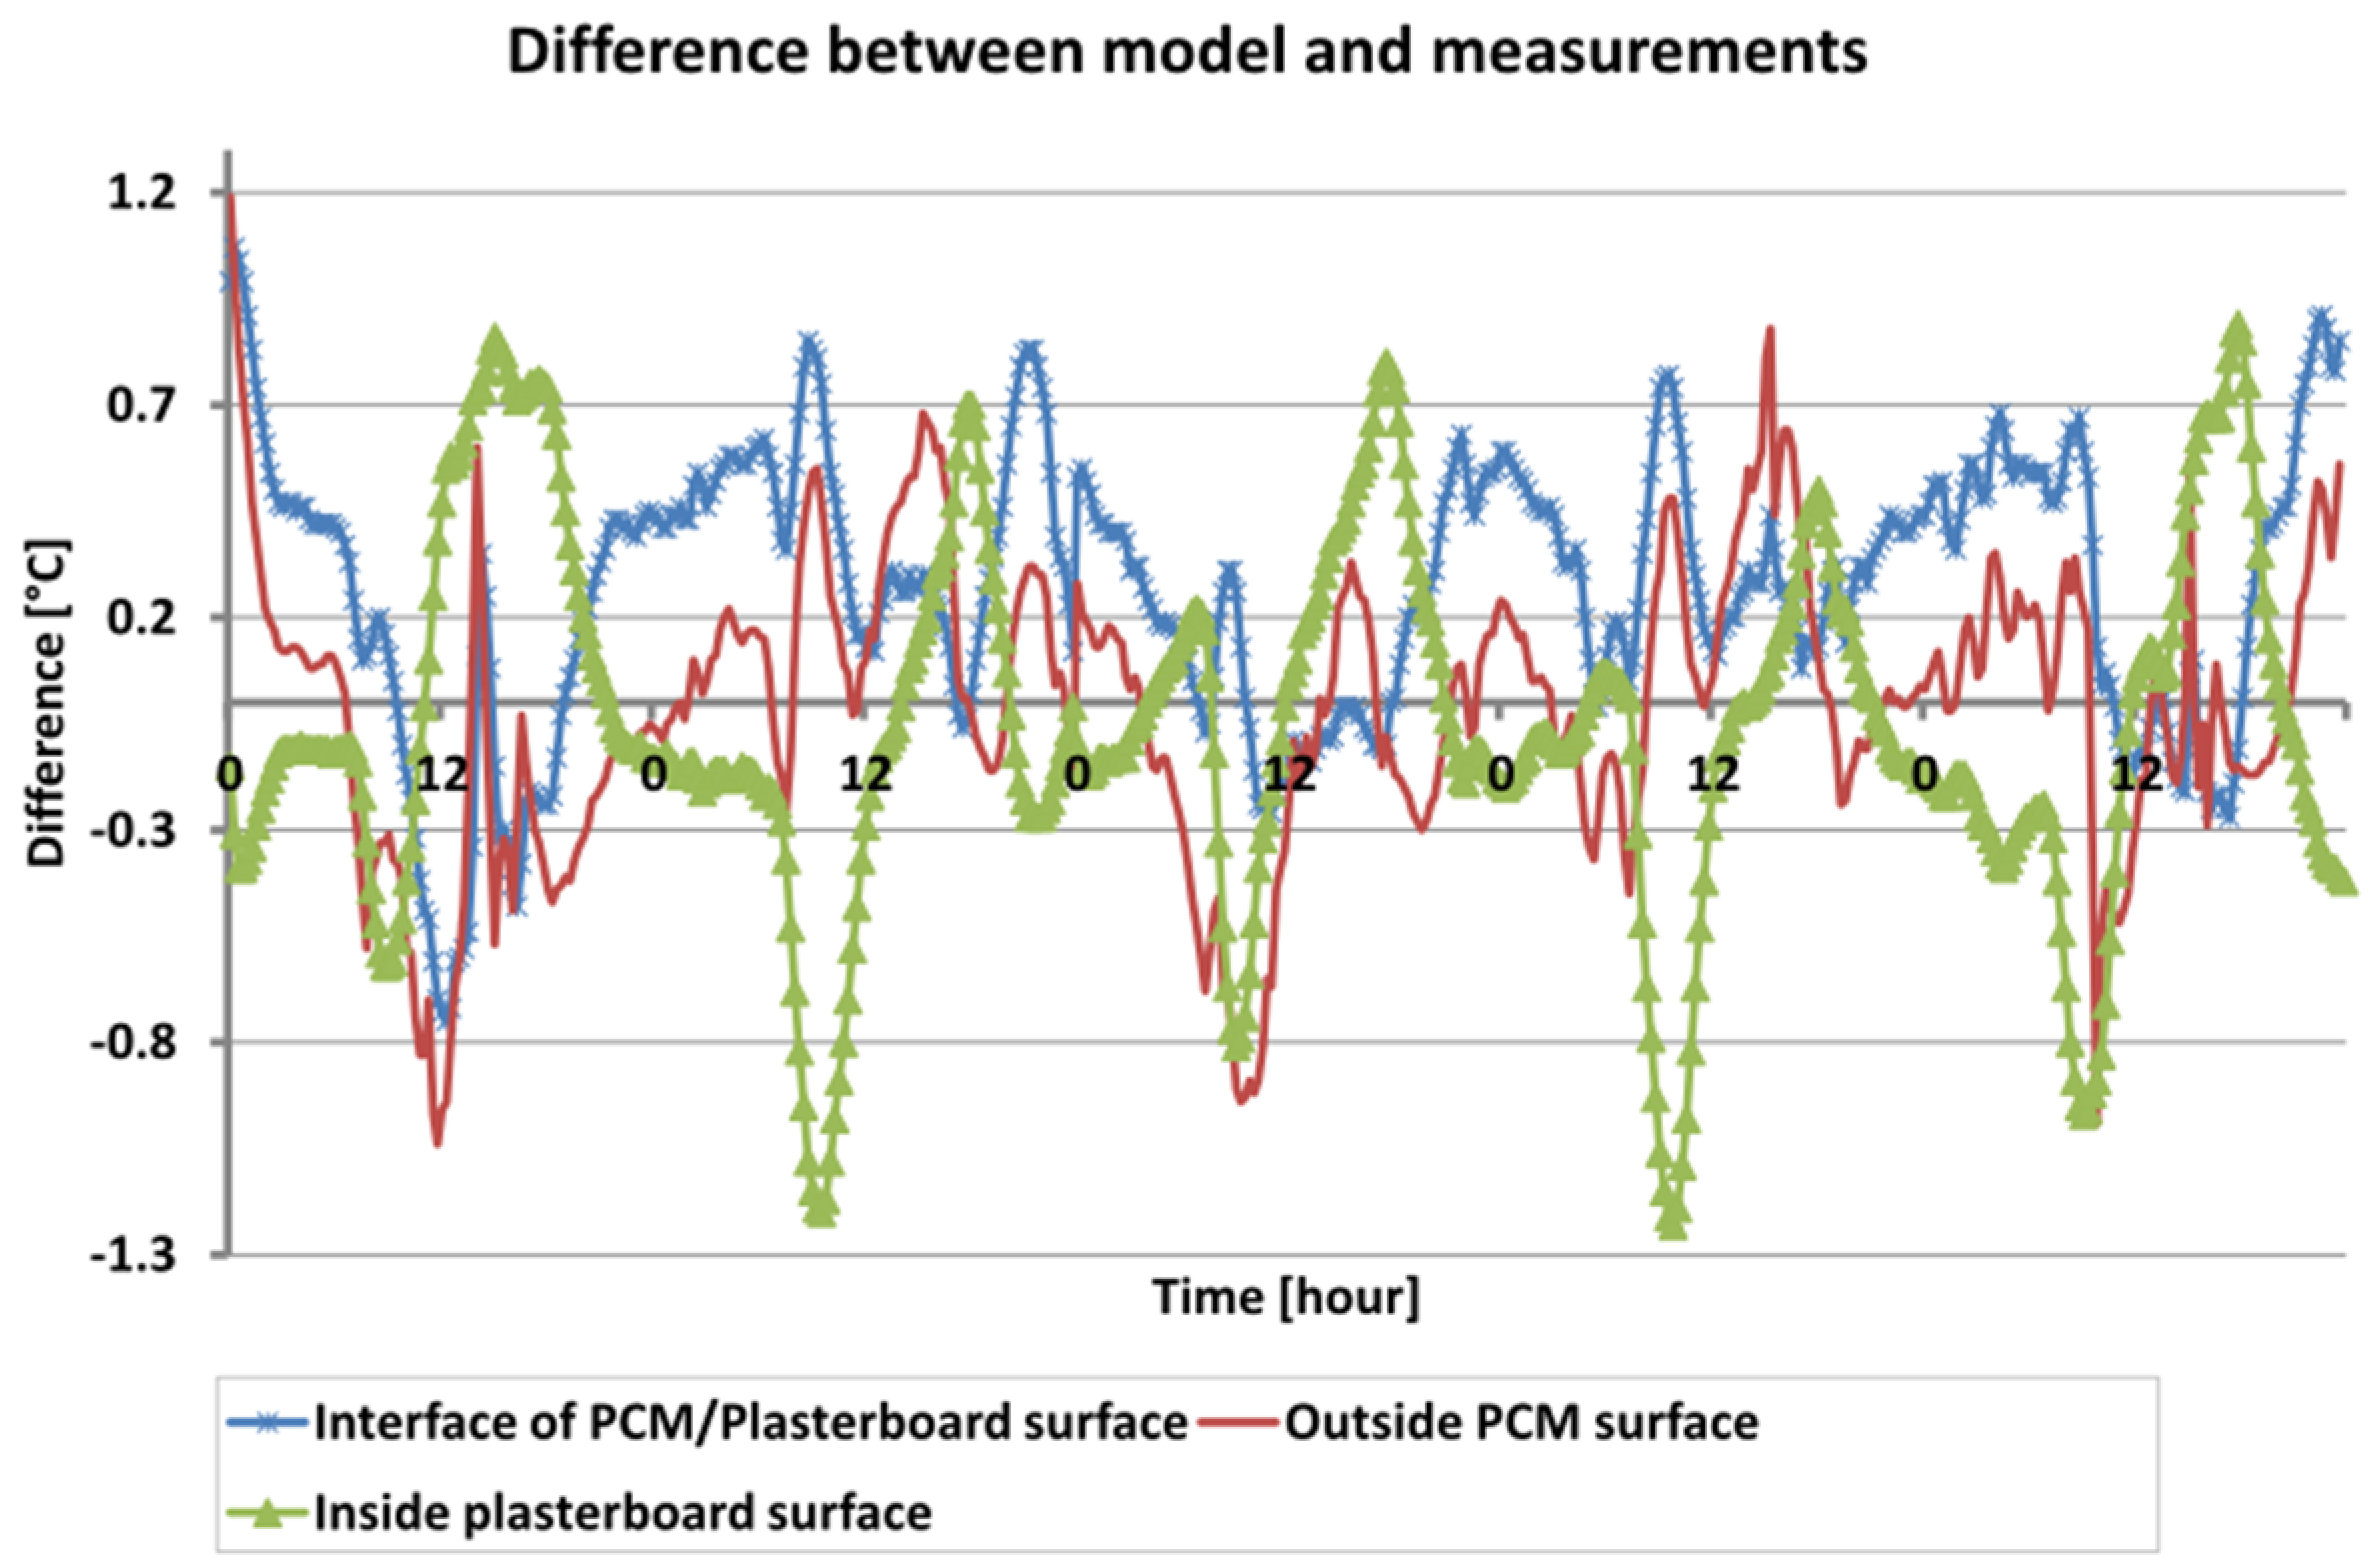
The surface temperature of the suspended ceiling is predicted at ±1.3 °C (
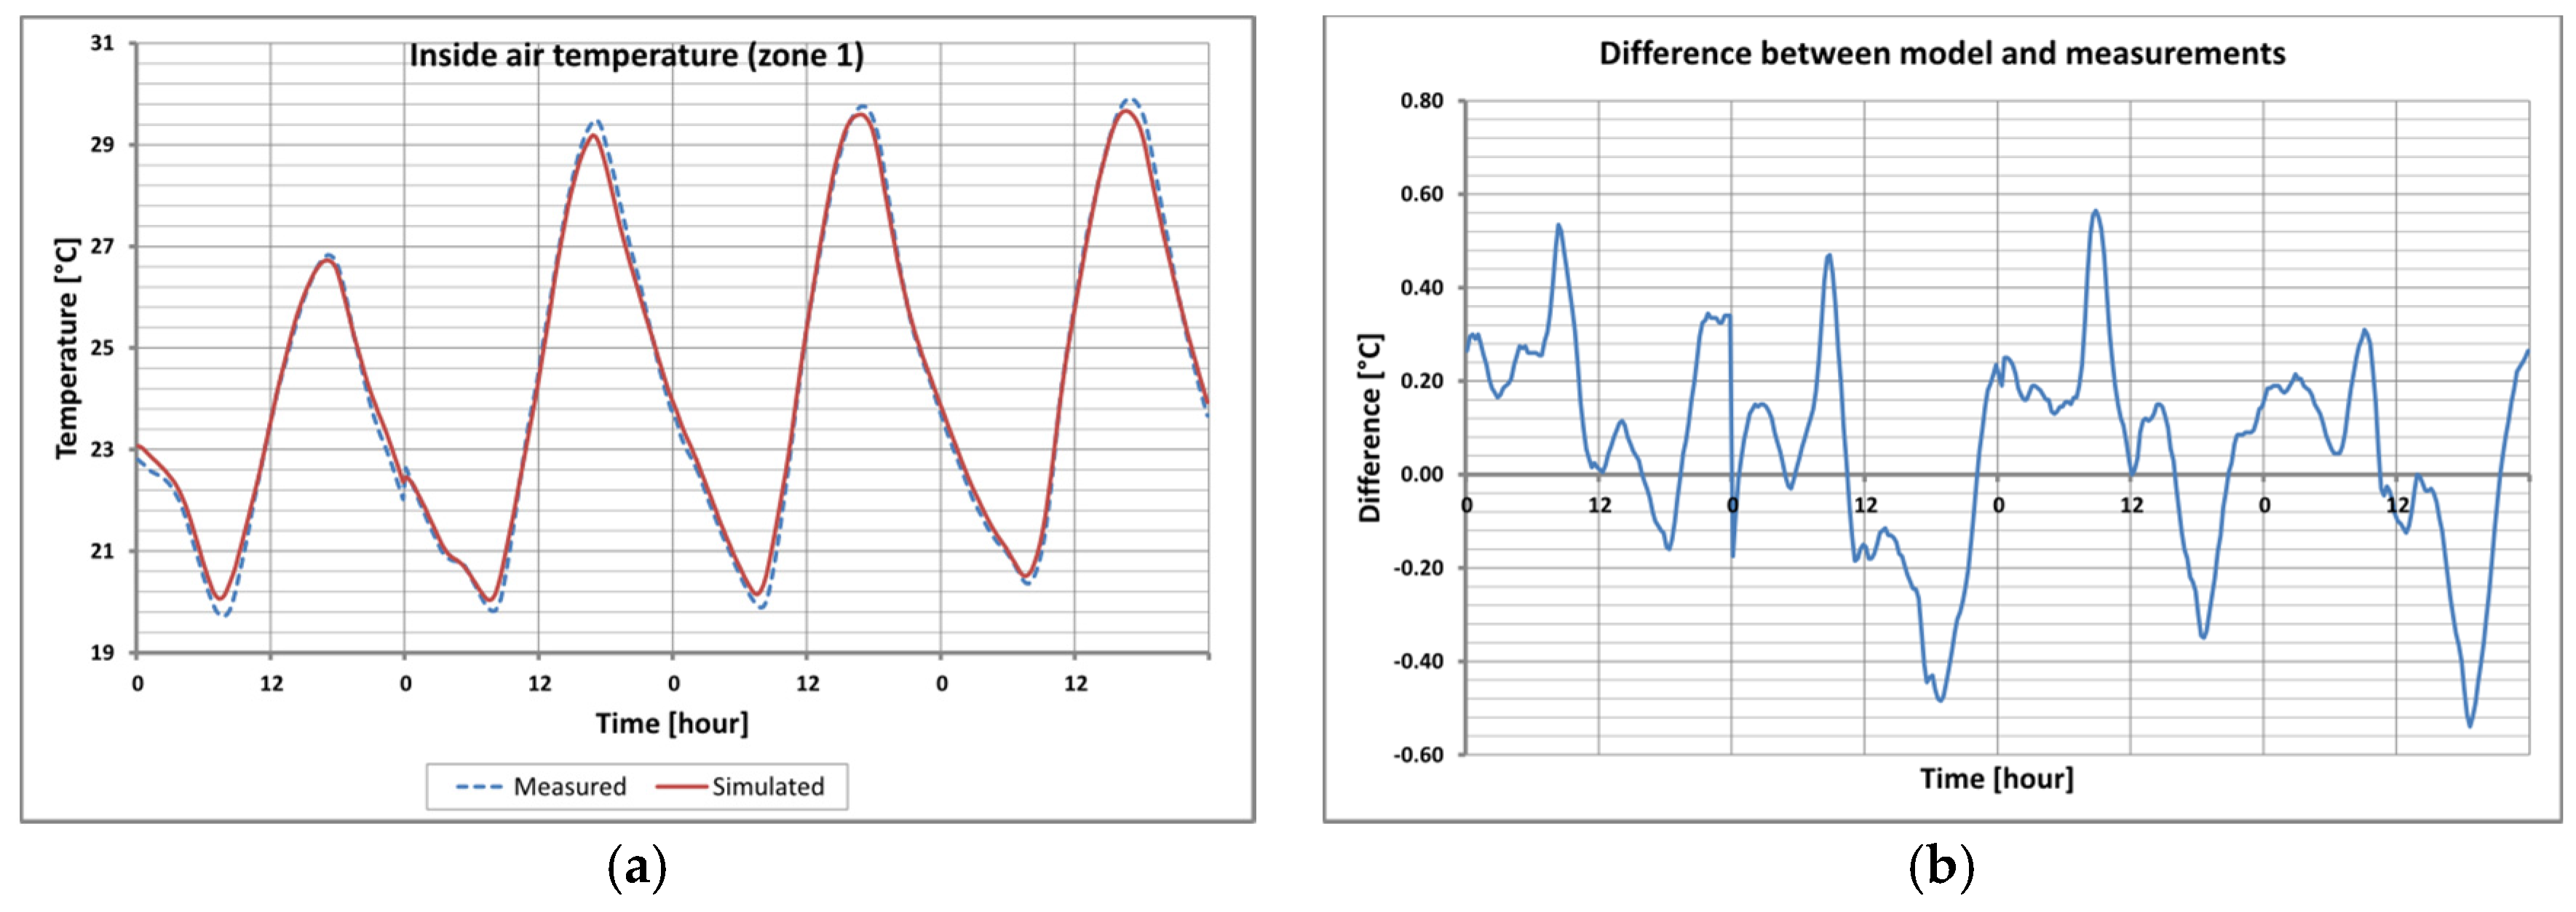
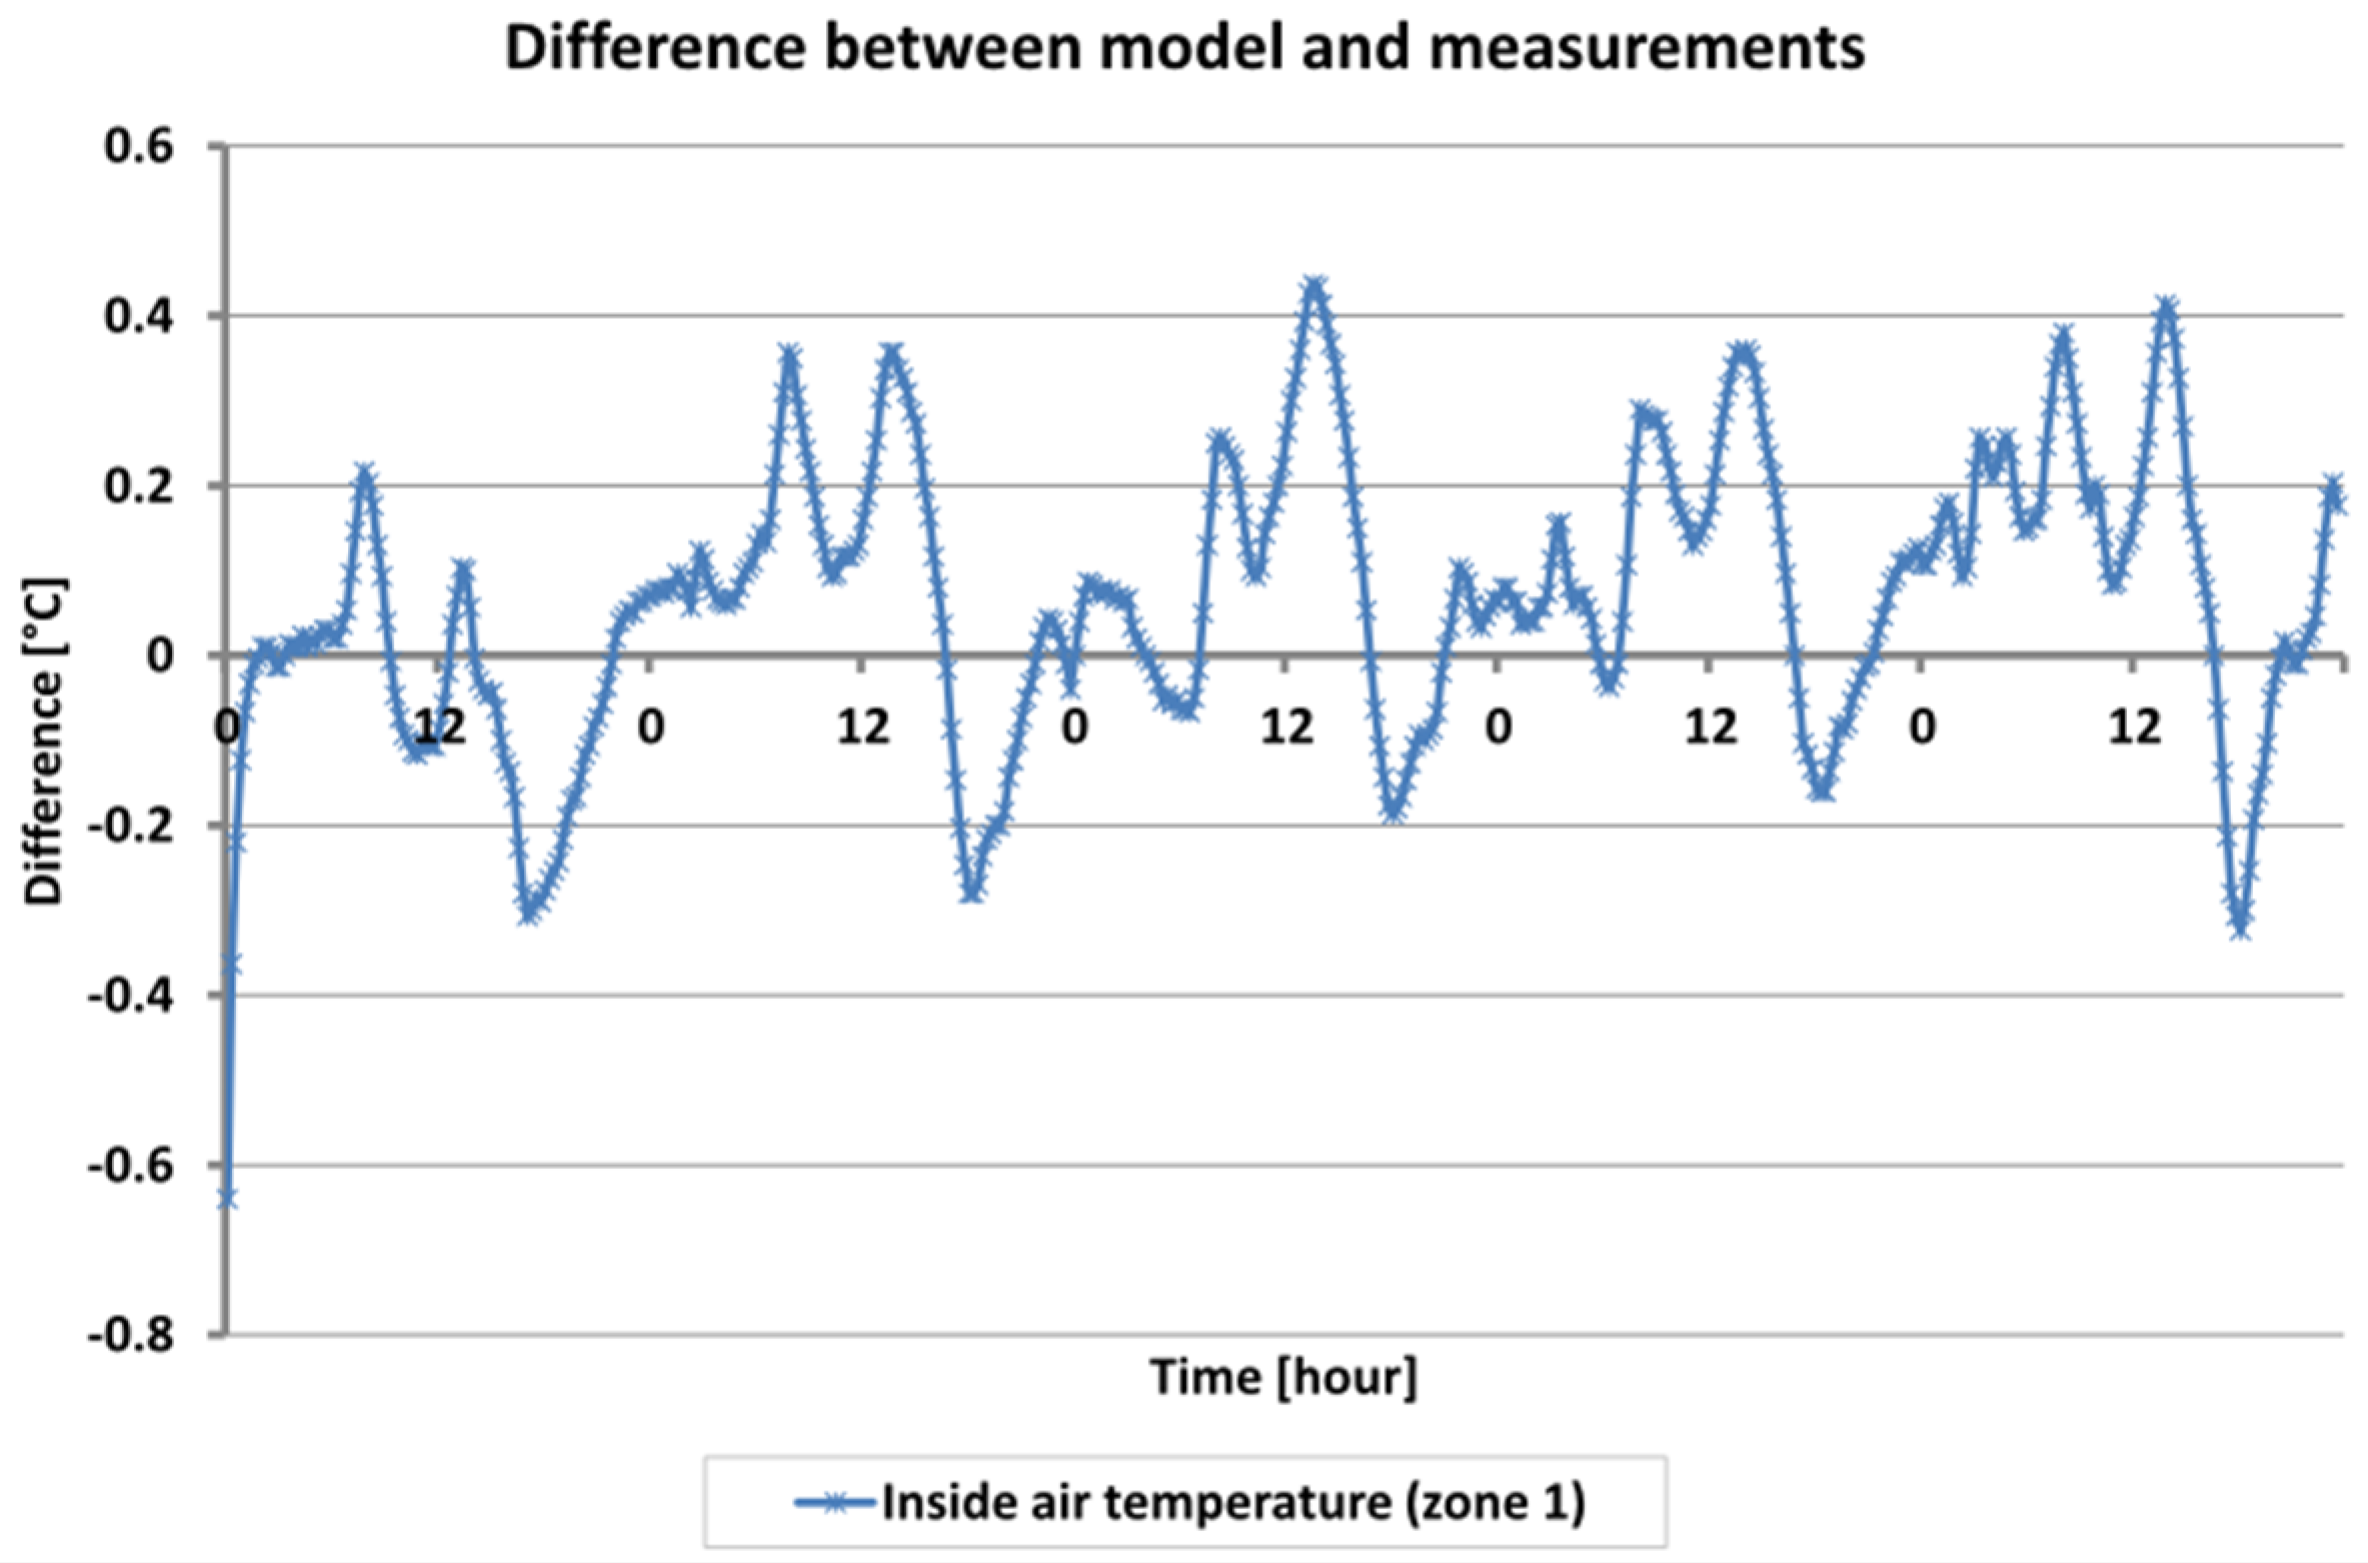
Figure 8). The used conditions show that PCM model is able to properly predict the behavior of the PCM panel. The comparison between numerical simulations and experimental data shows a good agreement. The indoor air temperature of LGI test cell is predicted with an accuracy of ±0.5 °C (
Figure 9). The criteria for the validation of the thermal model are respected. According to
Table 5, the mean errors between numerical solutions and experimental measurements do not exceed 5%.
Table 5.
Standard deviations, maximum differences and errors after optimization sequences.
Table 5.
Standard deviations, maximum differences and errors after optimization sequences.
| Localization | Standard Deviation (°C) | Maximum Difference (°C) | Maximum Error (%) | Mean Error (%) |
|---|
| Inside air temperature (zone 1) | 0.2 | − 0.5 | − 6.2 | 2.1 |
| Suspended ceiling inside surface temperature (plasterboard) | 0.4 | − 1.1 | − 8.9 | 2.9 |
| Interface PCM/plasterboard temperature | 0.4 | − 1.3 | 8.8 | 3.1 |
| Suspending ceiling outside surface temperature (PCM) | 0.5 | − 1.7 | − 9.8 | 2.3 |
| Air-gap temperature (zone 2) | 1.0 | − 2.6 | − 9.4 | 3.1 |
| Corrugated iron temperature | 1.3 | 3.5 | 9.4 | 3.2 |
Figure 7.
Comparison of model results with experimental measurements for all components of the complex roof (a–e) and for inside air temperature (f) (zone 1).
Figure 7.
Comparison of model results with experimental measurements for all components of the complex roof (a–e) and for inside air temperature (f) (zone 1).
Figure 8.
Errors between numerical solutions and experimental data for suspended ceiling temperatures.
Figure 8.
Errors between numerical solutions and experimental data for suspended ceiling temperatures.
Figure 9.
Errors between numerical solutions and experimental data for inside air temperature.
Figure 9.
Errors between numerical solutions and experimental data for inside air temperature.
The most important errors result from the prediction of the air-gap temperature and the prediction of the metal sheet temperature in zone 2. For the air-gap, the model must be improved and models from the literature based on computational fluid dynamics (CFD) showed that the results are inconclusive due to the influence of boundary conditions. Thus, an empirical correlation from experiments will have to be determined. Nevertheless, the values of convective exchange coefficients (
hce,CI and
hci,PCM) determined by the optimization sequences correspond with the empirical correlation developed by Alamdari and Hammond [
31] (it has been verified later that the obtained results fit the correlation). The proposal of these authors is a combination of two correlations for taking into account both natural convection in laminar regime and turbulent regime:
where ∆
T is the averaged difference temperature between the surface of the wall and the indoor air of the room.
H corresponds to the height of the wall.
With the predicted air temperature in zone 2, the errors between the curves can also be explained by the prediction of the corrugated iron surface temperature. Indeed, the latter has a direct effect on the temperature of each component of the complex roof. To reduce these errors, the radiative model should be improved and the radiosity method should be used [
15].
To conclude this step, the thermal model was fully-coupled with the ISOLAB code and the results of the PCM model are very encouraging. Indeed, for different type of walls with PCM or not, the model is able to predict temperatures in actual conditions. However, to definitely validate the PCM model implemented in the ISOLAB building simulation code, it is necessary to compare numerical solutions with another experimental data sequence as presented in the next part.
5.4. The Corroboration Step
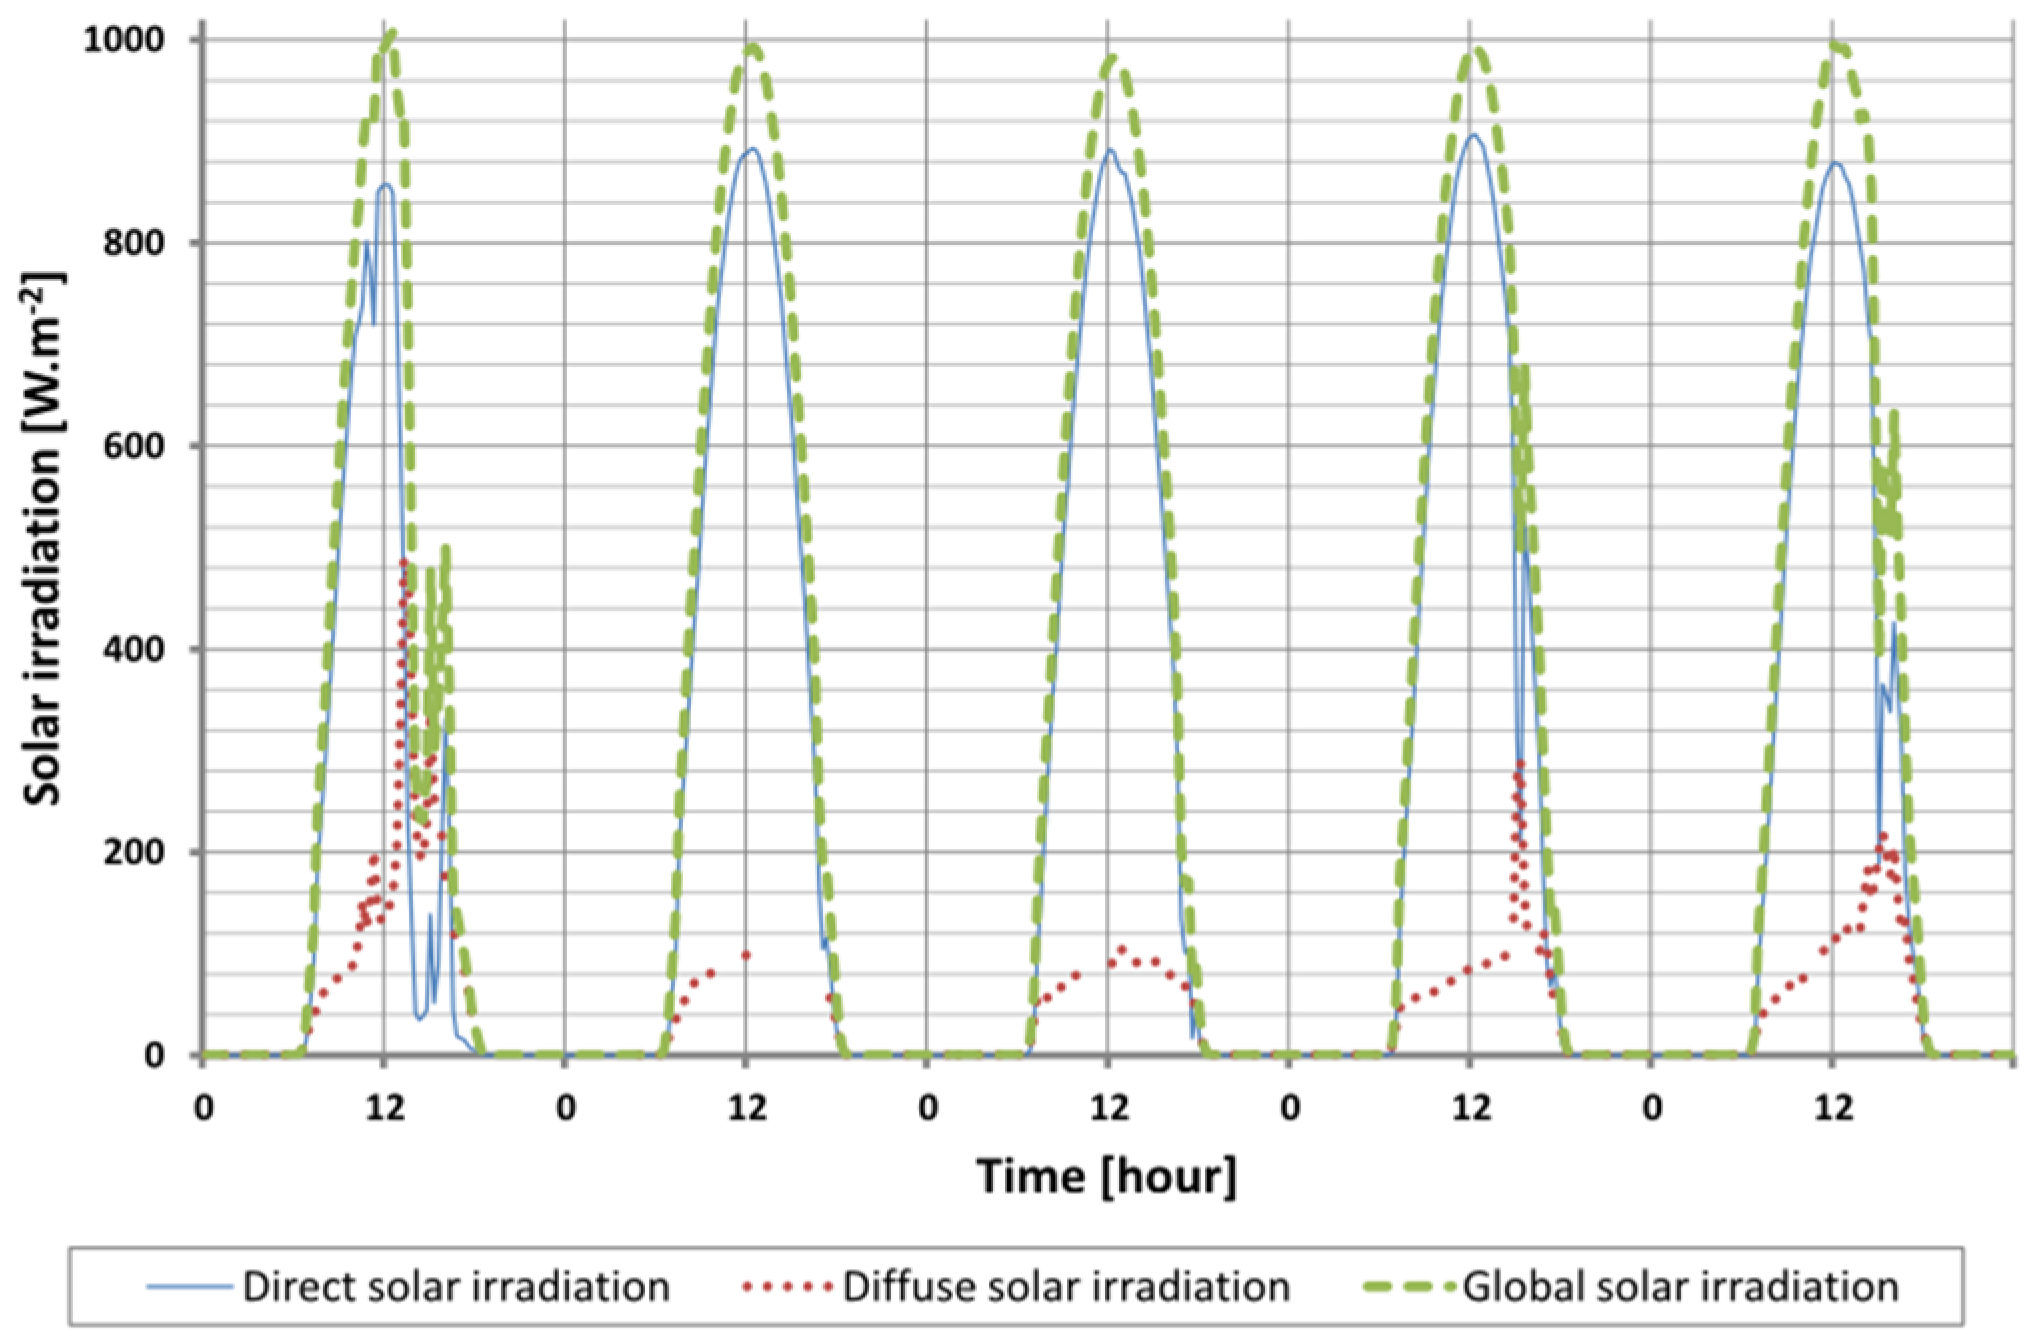
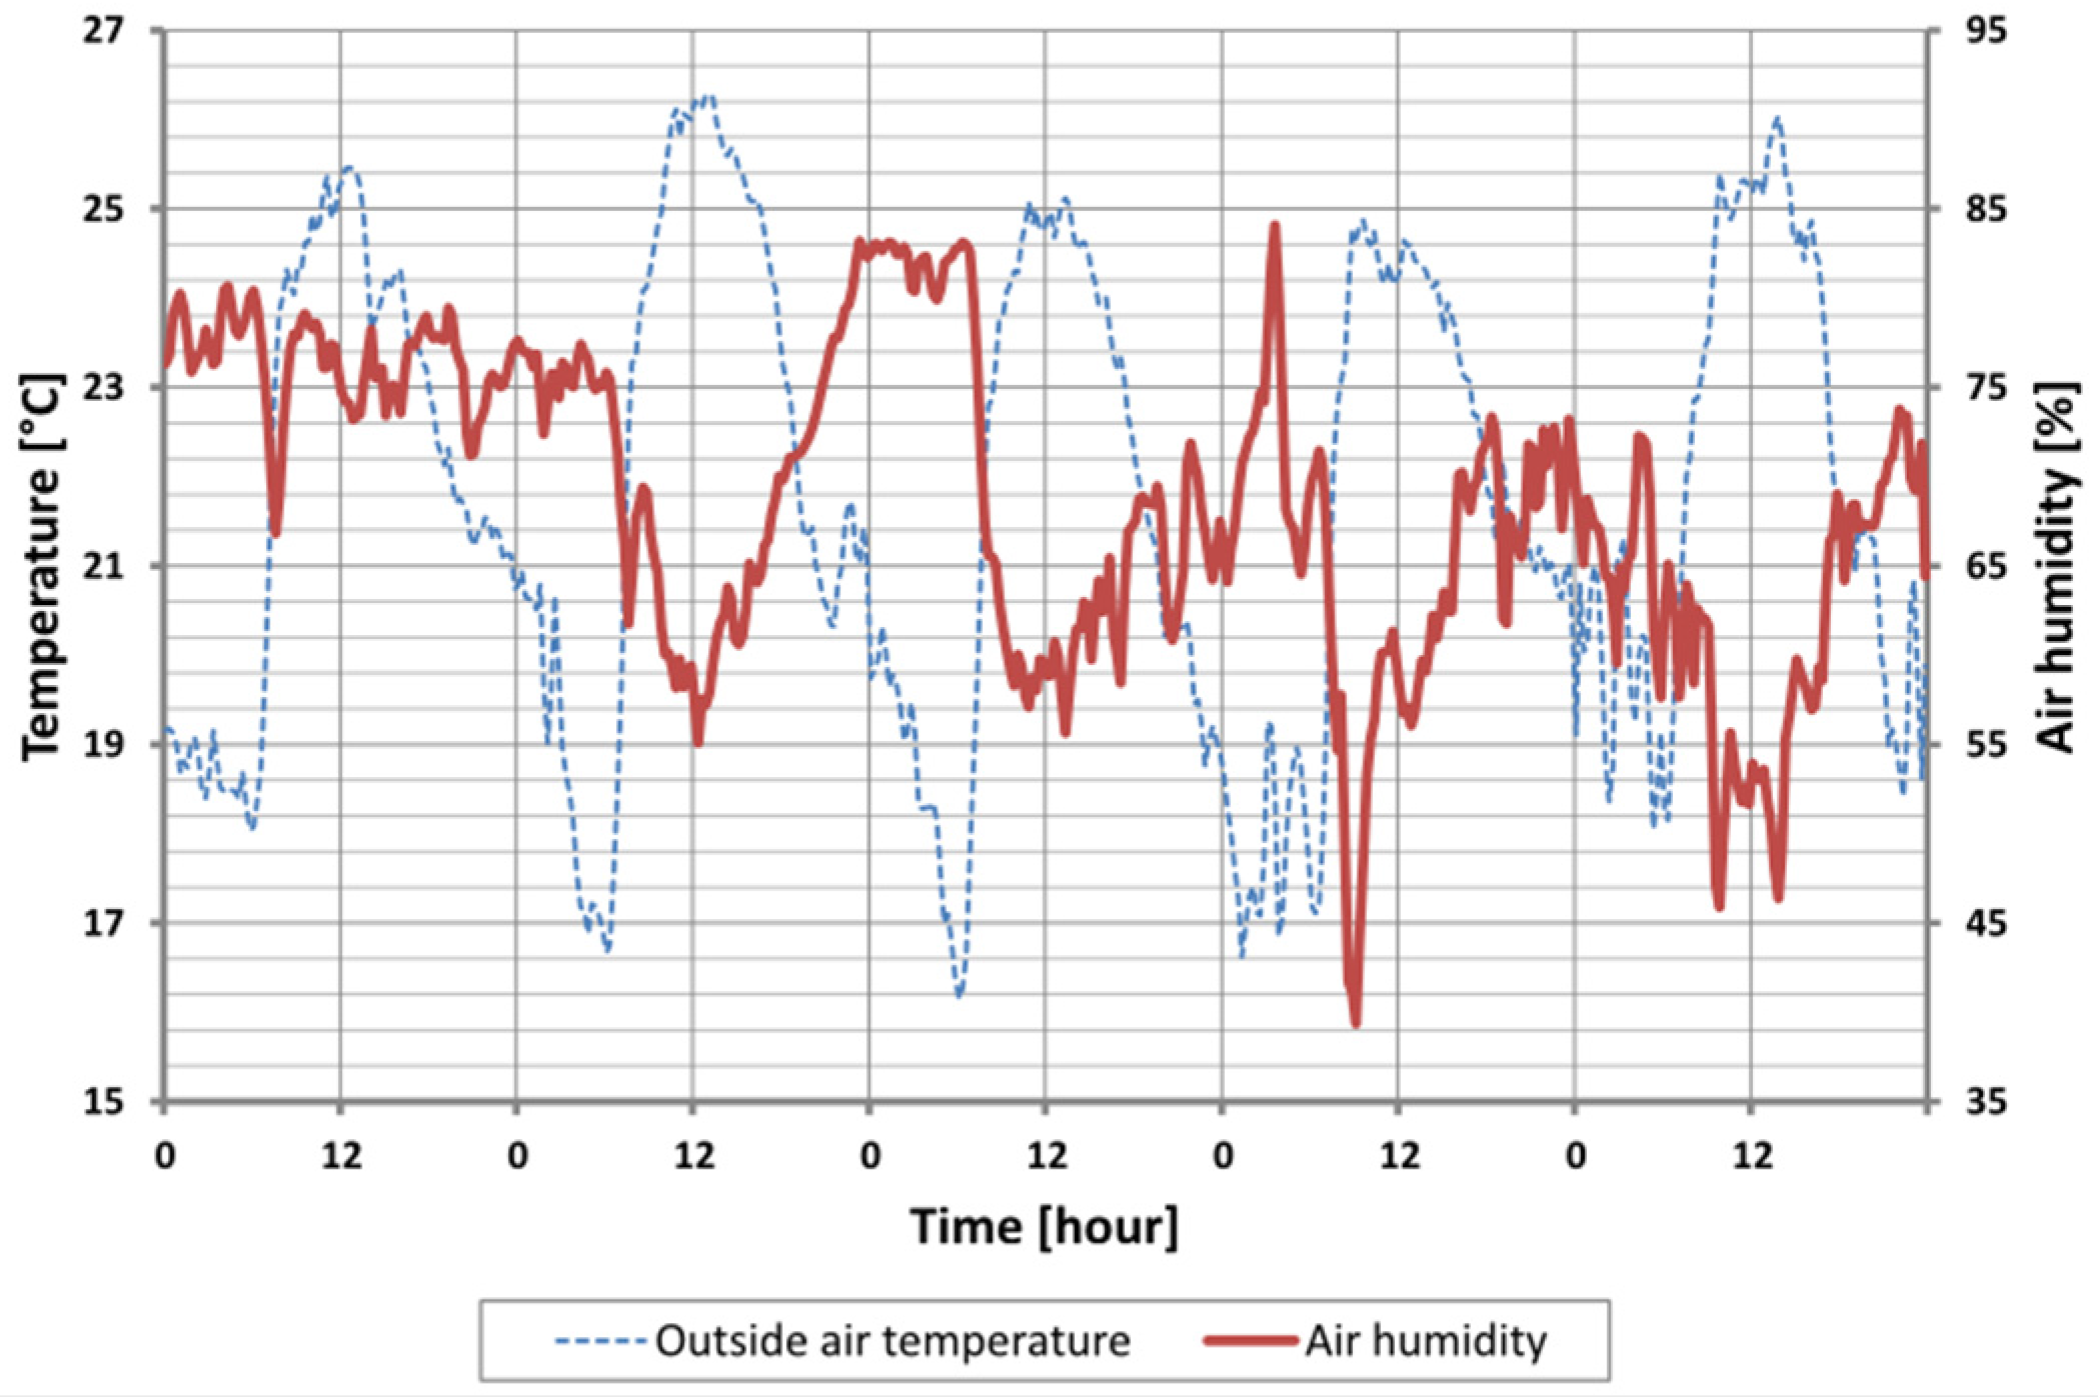
The corroboration step consists in using another experimental period in order to verify if all parameters determined can be generalized and are not specific for a given period. Moreover, it also allows evaluating the efficiency of the proposed model. For this step of corroboration, the meteorological data used are from 2 to 5 October 2012. This period was characterized by [
20]:
an average maximal global radiation of 900 W·m−2
an average wind speed of 3.50 m·s−1
an average outdoor temperature of 26 °C
an average rate humidity of 65%
The results from the corroboration step are summarized in
Table 6. In this part, the validation criteria are also respected. For instance, comparison between numerical simulations and measurements for the predicted indoor air temperature is depicted in
Figure 10. For more details, the interested reader may refer to [
20].
Table 6.
Standard deviations, maximum differences and errors for the corroboration period.
Table 6.
Standard deviations, maximum differences and errors for the corroboration period.
| Localization | Standard Deviation (°C) | Maximum Difference (°C) | Maximum Error (%) | Mean Error (%) |
|---|
| Inside air temperature (zone 1) | 0.2 | 0.6 | 5.6 | 2.1 |
| Suspended ceiling inside surface temperature (plasterboard) | 0.5 | 1.5 | 9.2 | 3.4 |
| Interface PCM/plasterboard temperature | 0.5 | 1.7 | 8.9 | 3.6 |
| Suspending ceiling outside surface temperature (PCM) | 0.5 | 1.7 | 9.9 | 2.8 |
| Air-gap temperature (zone 2) | 1.3 | 3.4 | 8.9 | 3.2 |
| Corrugated iron temperature | 1.6 | 4.7 | 9.8 | 3.3 |
Figure 10.
Comparison (a) and errors (b) between model results with experimental measurements for inside air temperature (zone 1) during the corroboration step.
Figure 10.
Comparison (a) and errors (b) between model results with experimental measurements for inside air temperature (zone 1) during the corroboration step.
Table 5 and
Table 6 show that maximum differences between predictions and measurements are a little more important than the results of the first experimental sequence. A possible explanation is a high setting of parameters for specific environmental conditions. Nevertheless, despite these differences the model can be considered as valid because the validation criteria have again been reached. Furthermore, the maximal standard deviation is approximately of 1.6 °C and all mean errors are below 5%.
6. Conclusions and Further Works
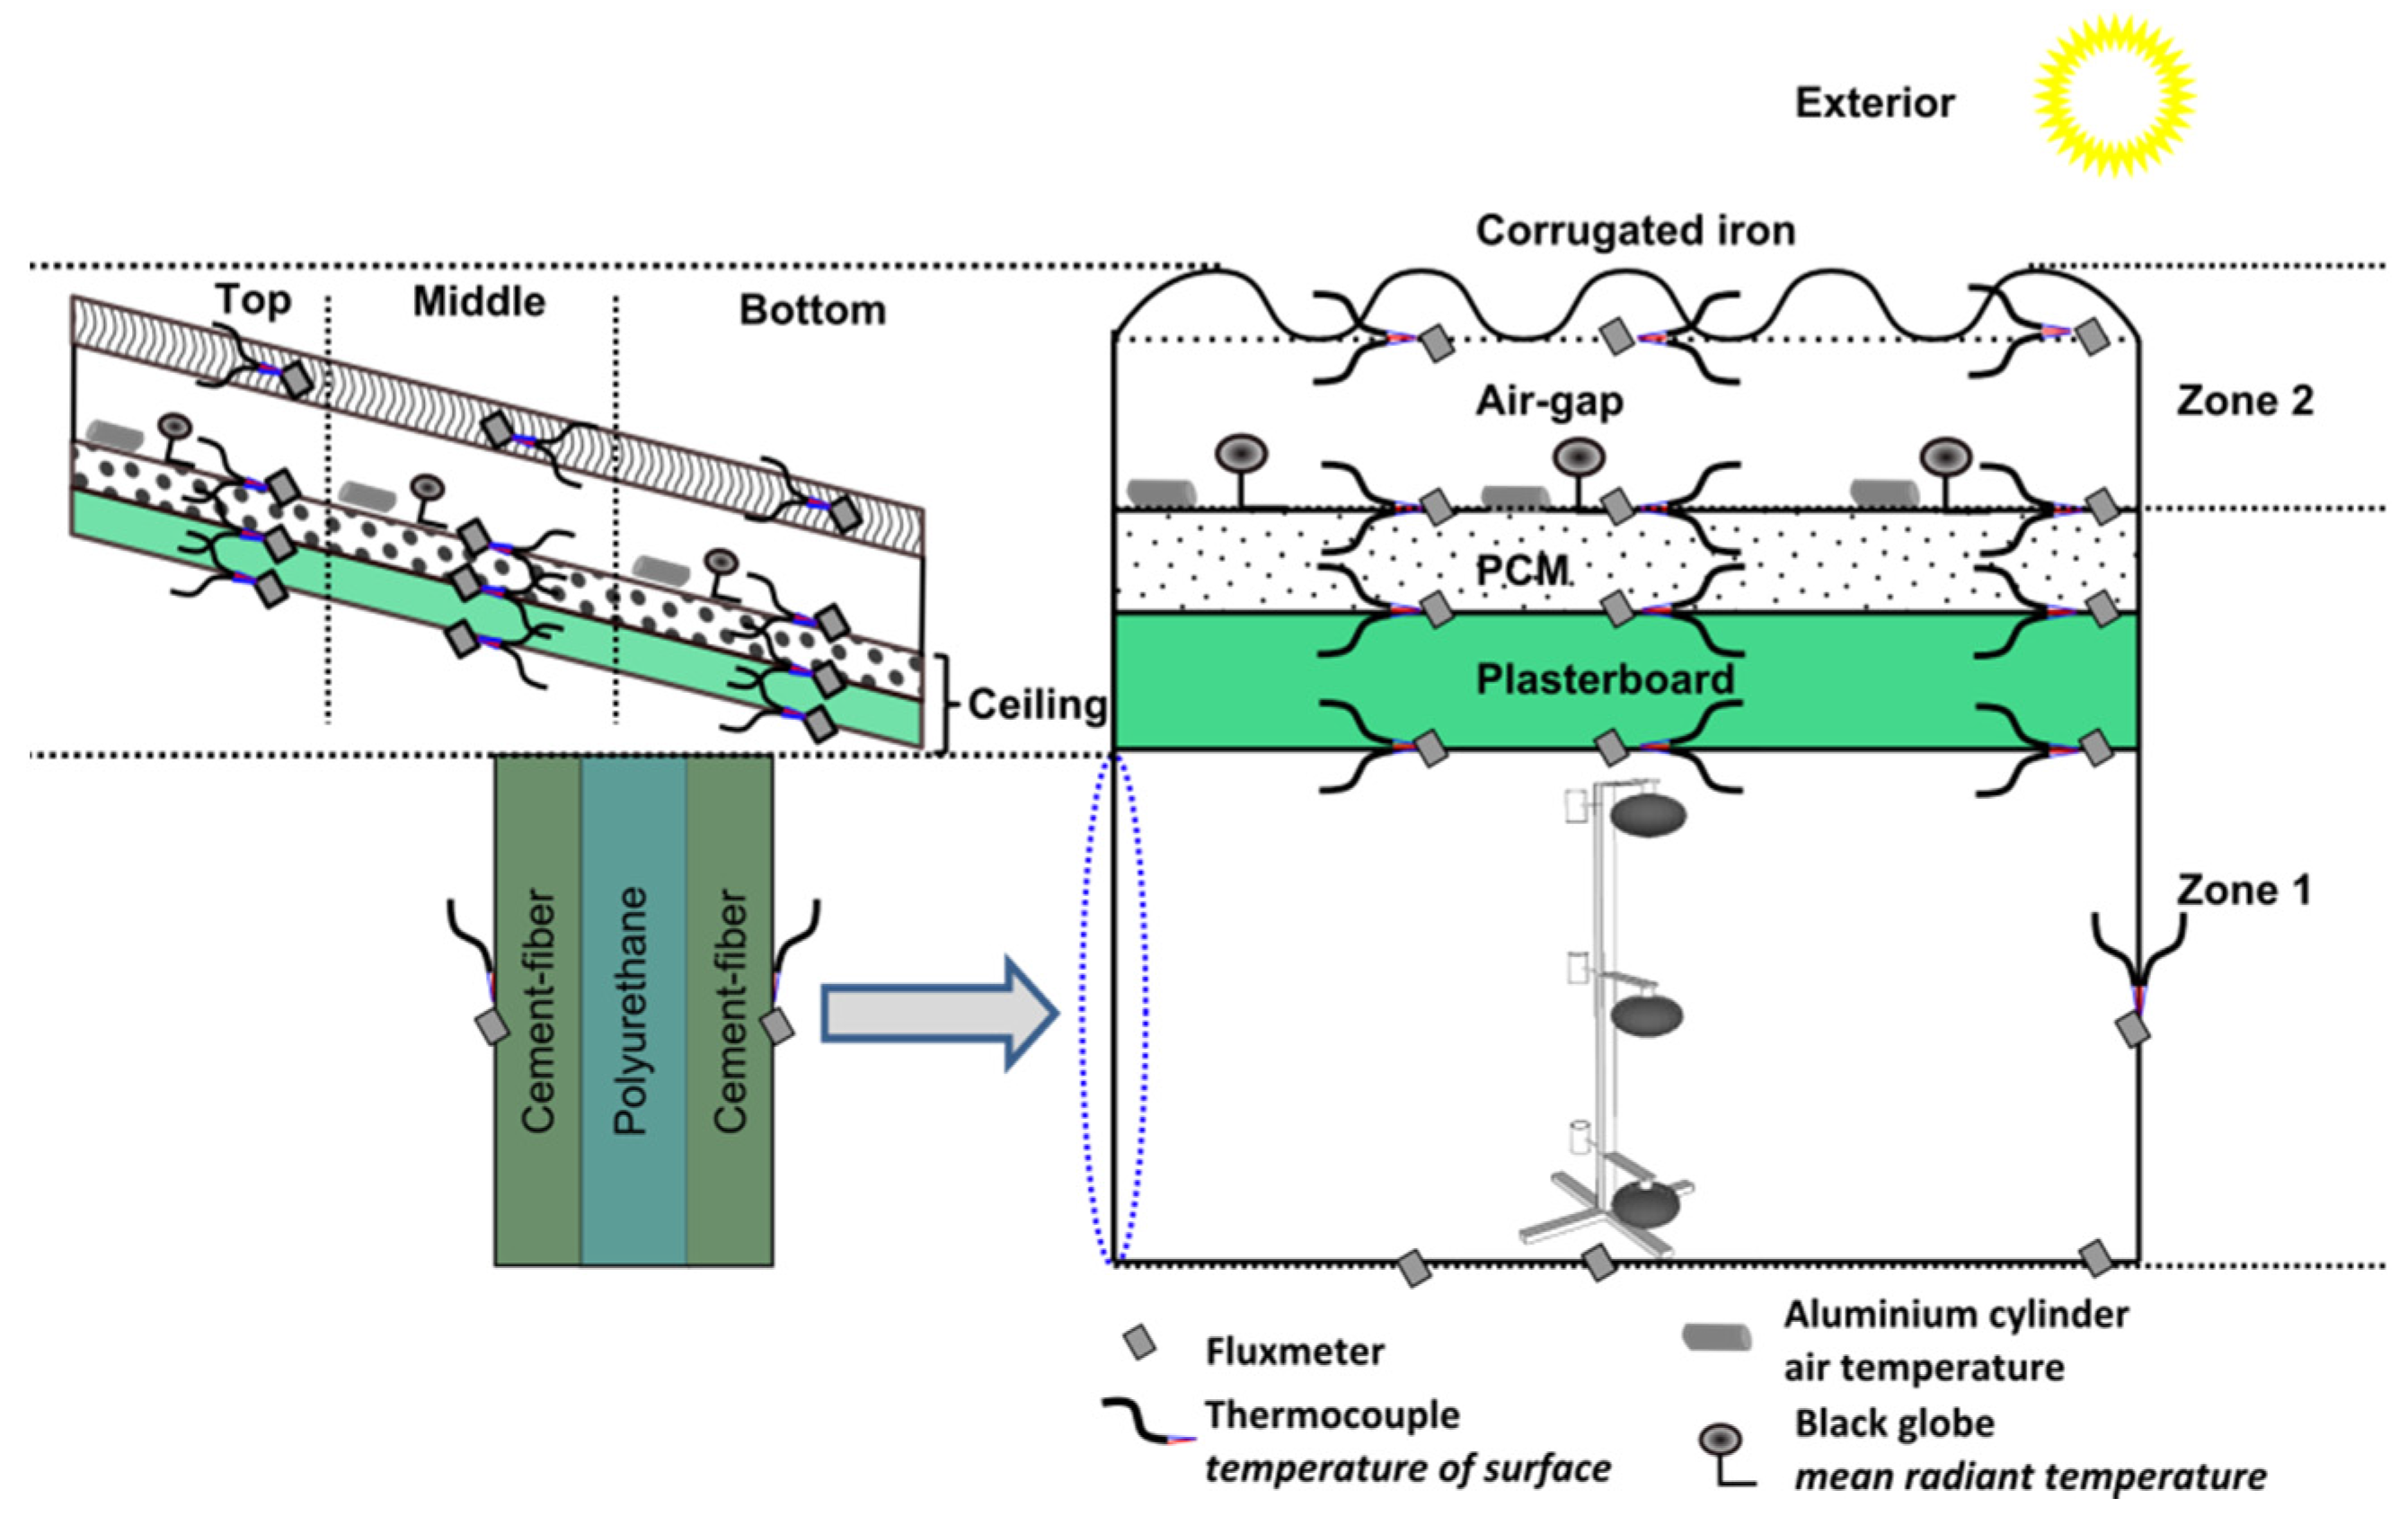
In this paper, a generic thermal model of PCM in buildings, validated with reliable experimental data, was presented. An actual building equipped with PCM in a complex roof was set up and each component's surfaces in contact with the indoor air temperature were measured. A detailed investigation was carried out to evaluate the efficiency of the thermal behavior of the model, with important steps included in experimental validation.
A mathematical model based on the apparent heat capacity has been presented. Moreover, an approach of nodal description of the complex wall and a finite difference method in one-dimensional were used. Thanks to parametric sensitivity analysis, the most influential factors on model outputs such as, all convective exchange coefficients, γ parameter and the absorptivity coefficient of corrugated iron, were determined by a generic optimization tool. Then, a new comparison between the optimized thermal model and experimental data was performed. With the corroboration step, the results showed that the validity criteria were respected. Finally, the validation process of model has been reached and the thermal model of PCM has been validated.
Despite the empirical validity of the PCM model, further work is necessary to improve the air-gap temperature prediction and the radiative model used in order to obtain better agreement between the numerical solutions and measurements. Moreover, a mathematical formulation of the γ parameter should be presented. Other experimental studies should be performed to confirm the use of these materials in tropical climates such as Reunion Island. Future works will also focus on the comfort study from the dedicated test cell.


 ,
, 