Article

Vibration Durability Testing of Nickel Manganese Cobalt Oxide (NMC) Lithium-Ion 18,650 Battery Cells

by
James Michael Hooper
1,*,
James Marco
1,
Gael Henri Chouchelamane
2 and
Christopher Lyness
2
1
Warwick Manufacturing Group (WMG), University of Warwick, Coventry CV4 7AL, UK
2
Jaguar Land Rover, Banbury Road, Warwick, Coventry CV35 0XJ, UK
*
Author to whom correspondence should be addressed.
Energies 2016, 9(1), 52; https://doi.org/10.3390/en9010052
Submission received: 17 November 2015 / Revised: 21 December 2015 / Accepted: 12 January 2016 / Published: 19 January 2016
(This article belongs to the Collection Electric and Hybrid Vehicles Collection)

Abstract

:
Electric vehicle (EV) manufacturers are employing cylindrical format cells in the construction of the vehicles’ battery systems. There is evidence to suggest that both the academic and industrial communities have evaluated cell degradation due to vibration and other forms of mechanical loading. The primary motivation is often the need to satisfy the minimum requirements for safety certification. However, there is limited research that quantifies the durability of the battery and in particular, how the cells will be affected by vibration that is representative of a typical automotive service life (e.g., 100,000 miles). This paper presents a study to determine the durability of commercially available 18650 cells and quantifies both the electrical and mechanical vibration-induced degradation through measuring changes in cell capacity, impedance and natural frequency. The impact of the cell state of charge (SOC) and in-pack orientation is also evaluated. Experimental results are presented which clearly show that the performance of 18650 cells can be affected by vibration profiles which are representative of a typical vehicle life. Consequently, it is recommended that EV manufacturers undertake vibration testing, as part of their technology selection and development activities to enhance the quality of EVs and to minimize the risk of in-service warranty claims.

1. Introduction

Within the automotive sector, the main driving force for technological innovation is the requirement to reduce fuel consumption and vehicle exhaust emissions. Legislative requirements are motivating original equipment manufacturers (OEM) and subsystem suppliers to develop and integrate new and innovative technologies into their fleet. Consequently, over the last few years, different types of electric vehicles (EV) have been built alongside conventional internal combustion engine (ICE) cars. Within the field of EV, a key technology enabling this reduction in fuel consumption and exhaust emissions is design and integration of rechargeable energy storage systems (RESS) [1,2].
Many OEMs are employing cylindrical format cells (e.g., 18650) within the design and construction of RESS [3,4,5,6]. Cylindrical cells are often chosen in EV applications over their prismatic and pouch cell counterparts because of a combination of factors. For example, 18650 cells are produced in very large quantity which makes them very cost effective [6,7,8]. Similarly, they have built-in safety systems such as a positive temperature coefficient (PTC) resistor that prevents high current surge and the use of a current interrupt device (CID) [6,7,8].
To ensure in-market reliability, OEMs perform a variety of life representative mechanical abuse and durability tests during the design and prototype stages of the development process. Firstly, these tests ensure that new vehicle sub-assemblies and components are fit-for-purpose. Secondly, it allows OEMs to obtain characterization data for simulations and computer aided engineering (CAE) activities. Thirdly, it ensures that the product meets requirements for vehicle homologation.
Vibration durability is one of these tests. The use of electromagnetic shaker (EMS) tables is often preferred to understand the behavior of a given vehicle system when subjected to mechanical induced vibration that is representative of the in-service environment and desired vehicle life (typically 100,000 to 150,000 miles of customer usage). Vibration durability tests play an important role in the selection of components. As discussed within [9,10,11,12,13], poorly integrated components, assemblies or structures subjected to vibration can result in a significantly reduced service life or the occurrence of catastrophic structural failure through fatigue cracking or work hardening of materials [11,14,15].
Within the context of individual Li-ion cells aggregated together to form larger vehicle battery RESS, a significant body of research exists that underpins the mechanical characterization of both pouch and cylindrical cell formats through static and dynamic test techniques. The motivation for such work is often to provide data to either parameterize or validate CAE models and simulations. For static test methods, there has been a clear focus on obtaining data from materials found within Li-ion cells such as mechanical strain and bending [16,17,18,19], force displacement [16,17,18,19,20], creep [19] and tolerance changes during charge and discharge [21]. Within the dynamic testing domain there has been a significant focus towards assessing the crashworthiness and robustness of Li-ion cells via mechanical crush [16,20,22], penetration [18,23], impact resistance [16,22], mechanical shock [16,24] and the effect of environmental changes such as temperature [25] and decompression [26]. Research in the static and dynamic domains is driven by a need to comply with whole vehicle crash homologation [27,28], to meet consumer focused accreditation requirements (e.g., Euro NCAP [29]) and mandatory transport legislation such as UN 38.3 [30].
Vibration-induced fatigue was reported for a lithium iron phosphate (LFP) battery [31,32]. However, the impact of vibration on cell performance was not presented. The vibration profile and subsequent test parameters were also not defined in either of these sources.
In a study conducted by [33,34], the authors examined the impact of vibration on different samples of 18650 lithium cobalt oxide (LCO) 2.8 Ah Samsung Cells. Their study aimed to determine if the exposure to vibration would affect the charge/discharge behavior of the cells. The study concluded that the cells were not adversely affected by vibration and also reported “no discernible difference in the measured open-circuit voltage (OCV) before and after testing”. Their conclusions were also supported by visual inspections that showed no significant damage to the cells.
A comprehensive test program in which numerous 18650 Li-ion cells, of unknown chemistry, were subjected to a vibration profile along the Z-axis of the cells is presented in [24]. The cells were clamped to an EMS table and excited for 186 h with a swept-sine wave from 4 to 20 Hz and back to 20 Hz in 30 s. The authors reported that most of the cells exhibited an increase in resistance along with a reduction in their 1C discharge capacity. Additionally, they described that some cells underwent an internal short circuit. This performance degradation was attributed to the central mandrel becoming loose during the vibration test, which in turn damaged the upper and lower cell components, including the current collector and tabs. Within that study, legislative abuse tests were also performed in accordance with UN 38.8 Test 3—Swept Sine and UN 38.8 Test 4—Shock Testing. It was found that no significant degradation in electrical performance was observed. However, the central mandrel was displaced because of the mechanical loading along the Z-axis of the cells. Similarly, deformation of the CID, as well as damage to the current collector was also observed in a subset of 18650 cells assessed in accordance with UN 38.3 Test 4 where the excitation was again applied along the Z-axis of the cell.
A doctoral thesis [35] assessed the robustness of 12 Ah Li-ion pouch cells of four different cell chemistries to vibration. The cells were exposed to vibration and temperature cycling according to ISO 16750-3 (Section 4.1.2.7). It was presented that none of the cells showed any electrochemical performance degradation as their 1C capacity after vibration was similar to that of the control samples. As a result, this study concluded that vibration and temperature cycling did not significantly affect the electrochemical performance of the cells.
From this short review, it is clear that the academic literature within this field, presents conflicting evidence with regard to the susceptibility of Li-ion cells to vibration. In addition, the vibration profiles used within these studies were not representative of an EV application. For example, the UN 38.3 standard utilized in the study defined in [24] was derived for assessing the robustness of batteries for consumer electronics for air transit [11,36]. Similarly, the ISO 16750-3 (Section 4.1.2.7) utilized in [35] is designed to represent the vibration excitation experienced by a large commercial vehicle with chassis mounted component. Also the long term vibration testing discussed in [24] utilizes a swept sine profile which does not excite the cells within a road vehicle representative vibration spectra [11,37,38]. The vibration profiles also did not represent a known service life such as 100,000 miles of vehicle use. Equally, the swept-sine waves utilized within these durability assessments are an unrealistic representation of the vibration loading that occurs within road vehicles [11] and are suited to vibration characterization.
As a result, the authors are proposing to study the effect of mechanical induced vibration, using 2 random vibration cycles (Society of Automotive Engineers (SAE) J2380 and Warwick Manufacturing Group/Millbrook Proving Ground (WMG/MBK) profiles [36,37]), on a commercially available nickel manganese cobalt oxide (NMC) Samsung 2.2 Ah 18650 cylindrical cell (model number ICR18650-22F). Both vibration test profiles were developed to underpin durability evaluation and to replicate a 100,000 miles of vehicle use. Both these specifications apply vibration loading through “random” excitation which is more representative of road-induced structural vibration [11]. Also unlike the previous studies discussed in [24,33,34,35], each cell evaluated experience vibration excitation in the X, Y and Z axis, as opposed to experiencing vibration in a single axis for the duration of the test, which is more representative of the vibration experienced by cells within an EV battery assembly. It is outside the scope of this study to discuss in detail the derivation of the vibration profiles. However, this information is available in [36,37]. These profiles were applied to cells with different states of charge (SOC) and a different in-pack orientation. The effect of mechanical induced vibration on the mechanical and electrochemical performances of the cells, before and after vibration, is also presented.
This paper is structured as follows: Section 2 of this paper provides a detailed overview of the experimental method employed, including the design of the test equipment and fixtures that are key to ensuring accuracy and repeatability of the measurements. Results are presented in Section 3 and include an assessment of the mechanical degradation (visual inspection and natural frequency) as well as changes in the electrochemical performance (capacity, impedance etc.) of the cell. Discussion, further work and conclusions are presented in Section 4, Section 5 and Section 6, respectively.

2. Experimental Method

The following section outlines the experimental method, including the test process, fixture design, rig assembly and cell characterization employed.

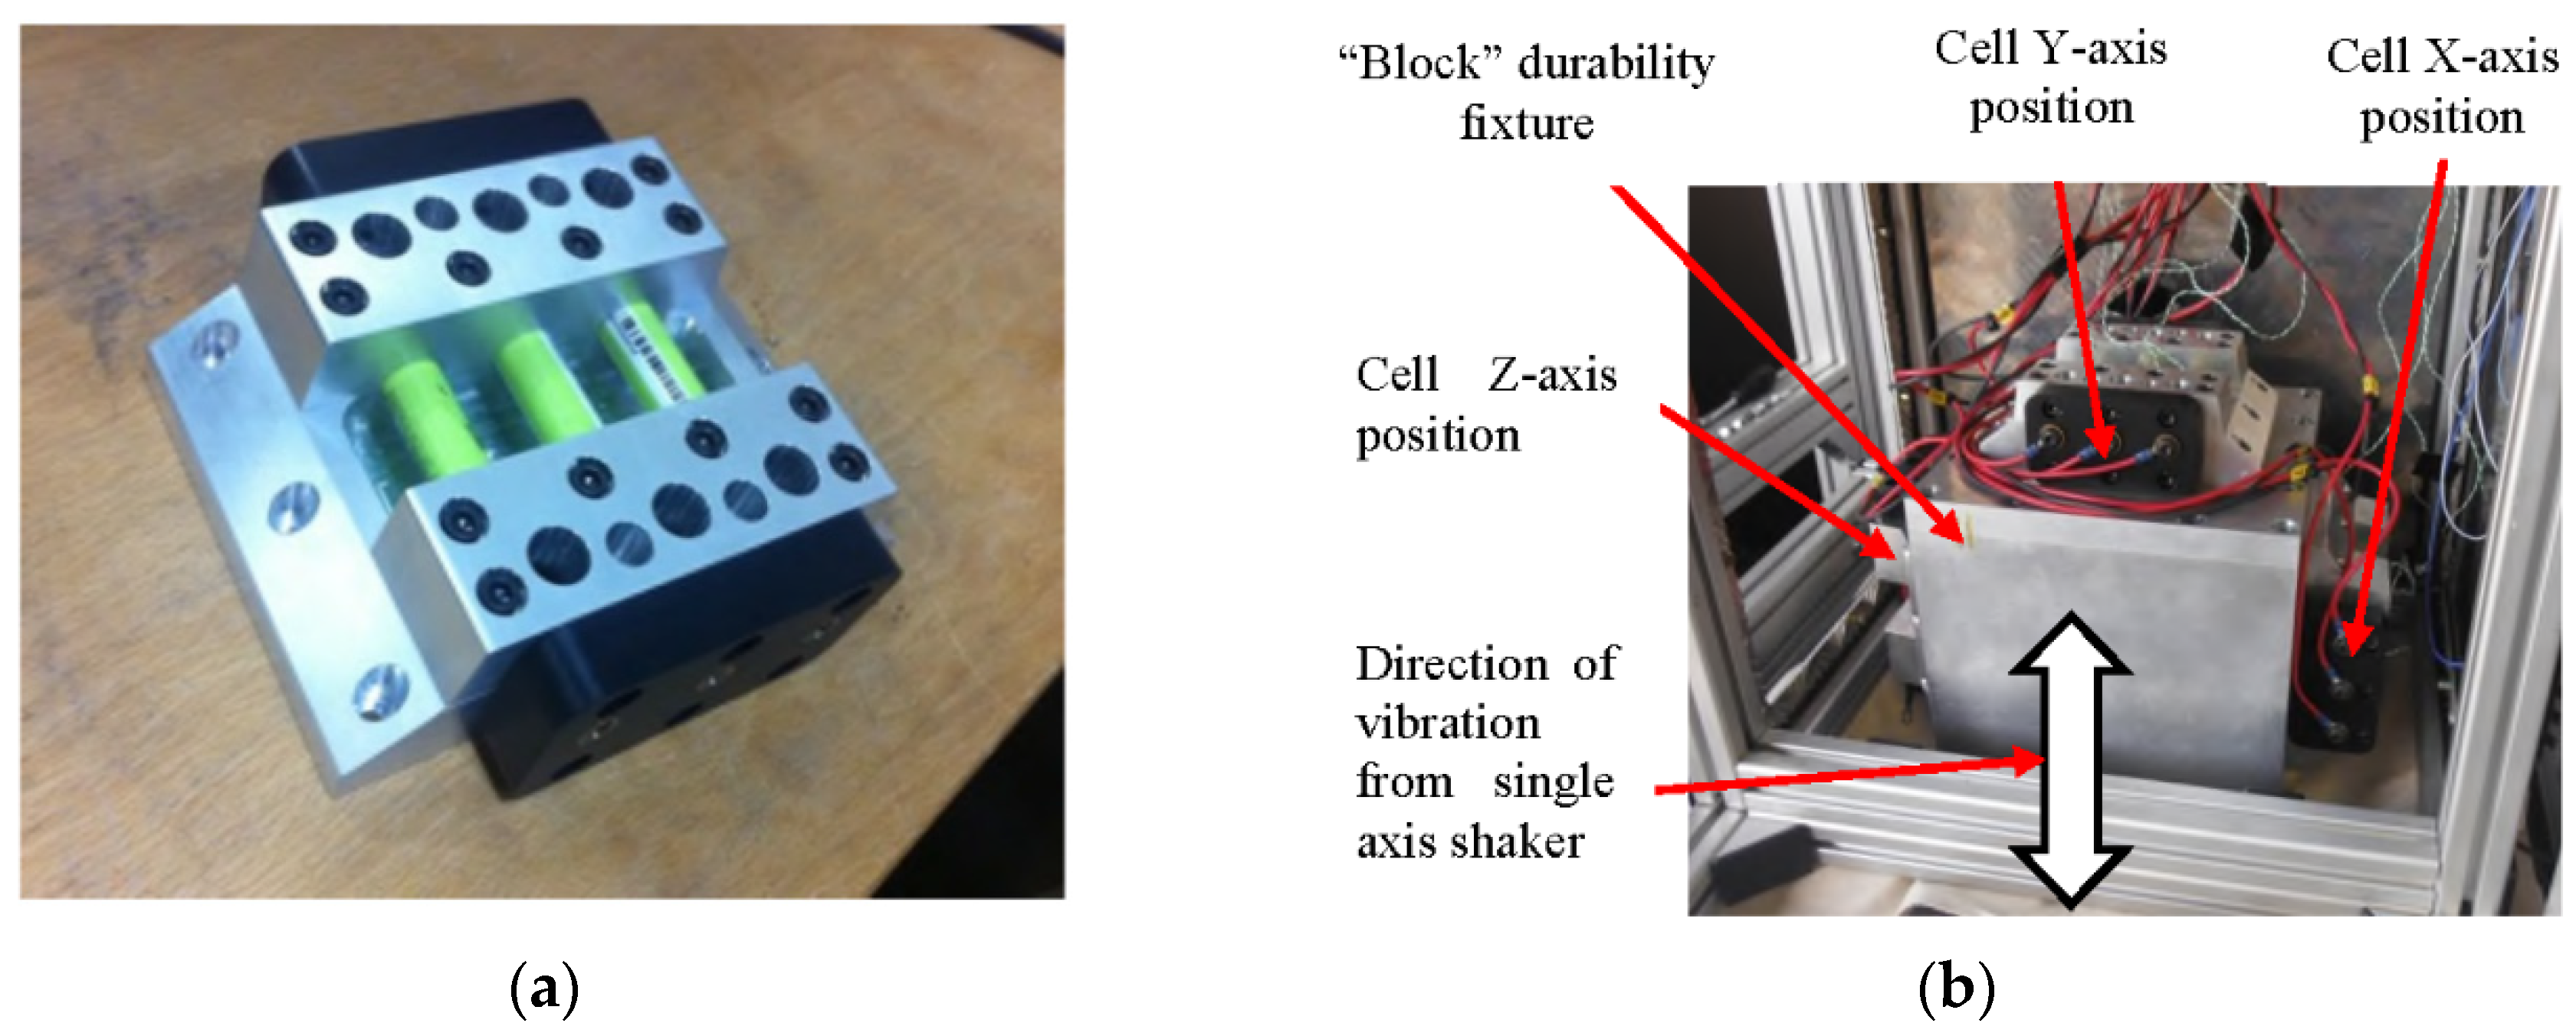
2.1. Test Fixture Design

Figure 1a presents the cell-mounting fixture that was designed and fabricated to support this study. Each fixture holds up to three cells and is intended to recreate a generic but representative 18650 EV RESS mounting condition. 5 mm of each end of the cell are clamped within the cell test fixture.
Because a single axis EMS table was used, 3 cell-mounting fixtures were made, all based on the same design to allow the concurrent evaluation of multiple cells in different orientations during a single vibration test. The different cell orientations (X, Y and Z) were achieved by mounting the 3 fixtures onto different surfaces of the durability fixture. During the test programme, the cells were subjected to different axis of vibration by relocating the cell fixture onto different surfaces of the durability fixture. Installation of the durability fixture and the cell-mounting fixture onto the EMS table, complete with instrumentation, is presented in Figure 1b. The fixtures were constructed from aluminum due to the high specific stiffness [39] (also referred to as materials ratio within vibration testing [40,41] or specific modulus) associated with this material. Specific stiffness is defined in Equation (1) where the materials Young’s modulus is defined as E (in GPa) and density as ρ (in g/cm3) [39,40,41]. A high specific stiffness indicates a high material natural frequency [40,41] and results in a lower risk of undesirable fixture resonances impacting the accuracy of the experimentation.
S p e c i f i c   S t i f f n e s s   =   E ρ
Figure 1. (a) Single test fixture (b) Assembled test fixture on shaker table with test positions.
Energies 09 00052 g001

2.2. Test Setup

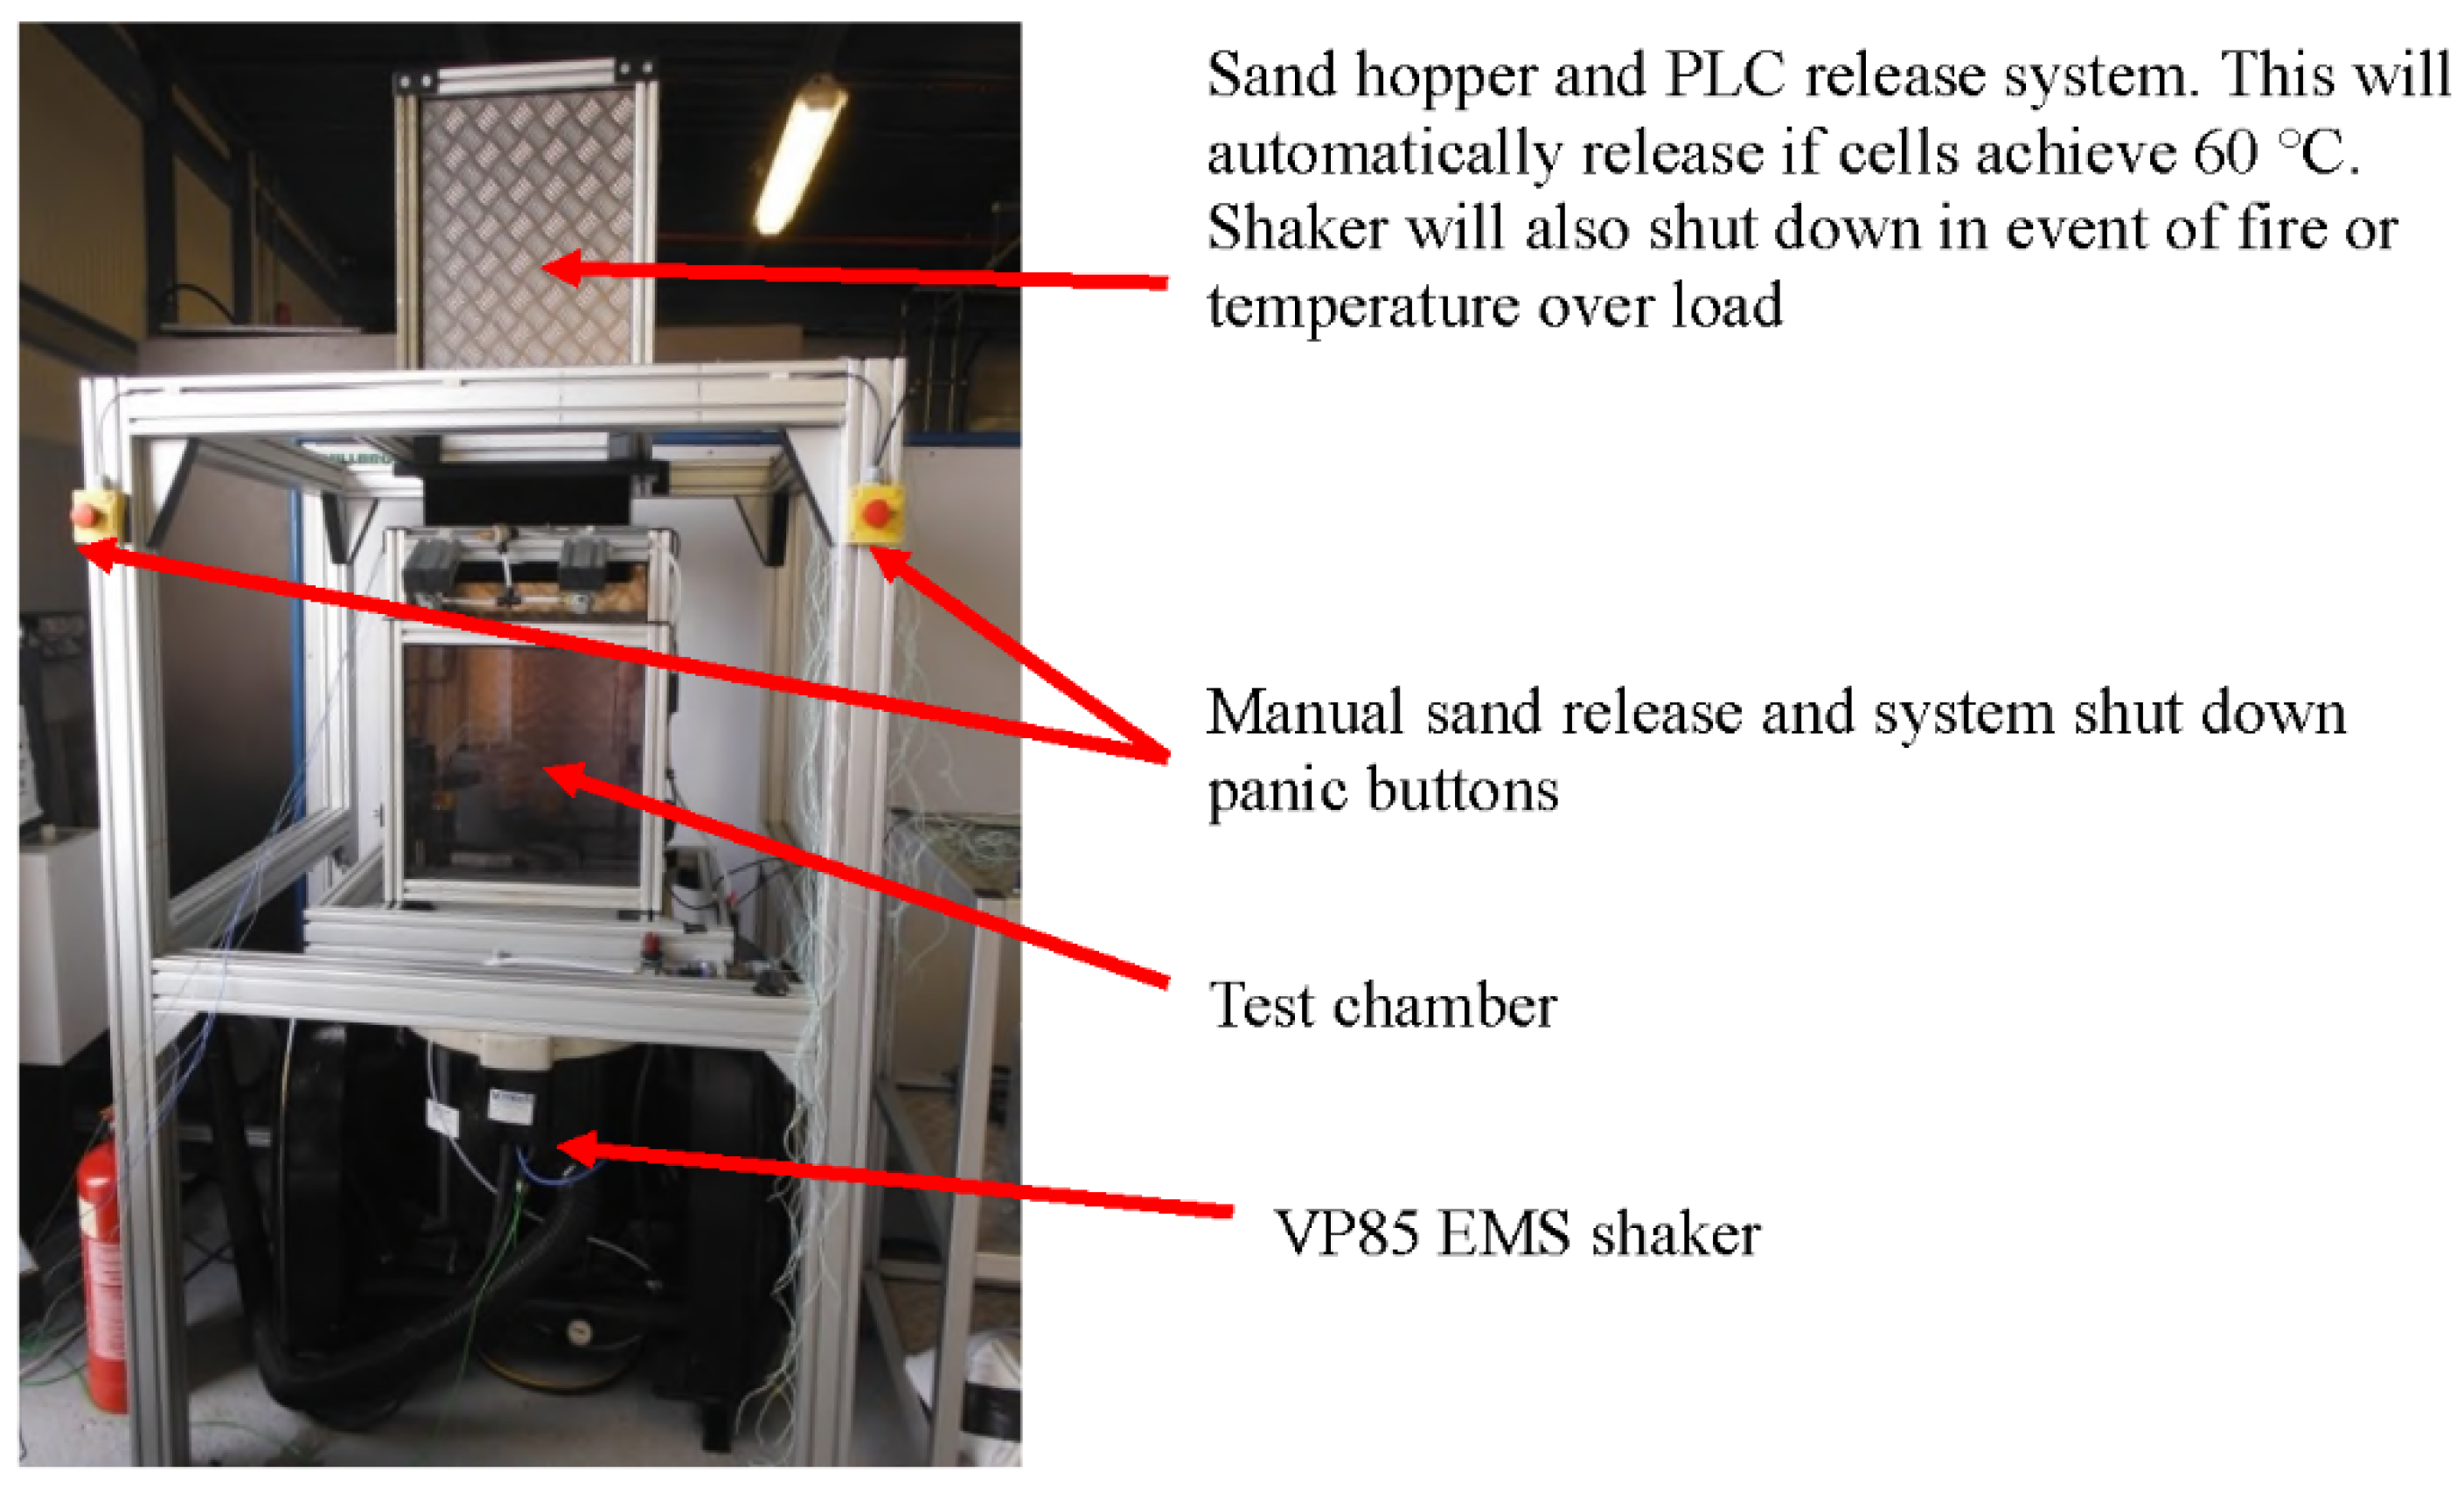
The test environment used to mechanically induce vibration to the Li-ion cells is presented in Figure 2.
Figure 2. Test set up.
Energies 09 00052 g002
The test rig employs a 700 kgf, single axis, EMS table manufactured by Derritron (Hastings, UK; model number: VP85, serial number: 74). A LMS Scadas III (Leuven, Belgium; serial number: 23-4709-58) digital vibration controller was programmed with both the J2380 and WMG/MBK vibration profiles. To facilitate closed-loop vibration control, two single axis accelerometers (PCB 352C65, PCB Piezotronics Inc, Depew, NY, USA) were mounted at opposite sides of the durability fixture via HBM X60 adhesive (North Harrow, UK). A LabVIEW PXie-1075 chassis (National Instruments, Newbury, UK) was used with an integrated Ni-PXIe-8133 controller and input modules for 32 thermocouple sensors (Ni-PXIe-4353, National Instruments, Newbury, UK), 4 channels for accelerometer measurements (NI PXI-4462) and a multifunctional data module (NI PXIe-6363) is used for data acquisition. To mitigate against any potential risk of catastrophic cell failure during vibration testing, the EMS shaker table was installed within a blast proof enclosure. Integrated with the enclosure is a programmable logic controlled (PLC) fire extinguishing mechanism that would automatically activate if either a cell surface temperature greater than 60 °C or an increase in cell temperature of greater than 4 °C/s was observed. Within the test environment, K-type thermocouples and accelerometers are employed to provide suitable test accuracy and safety.

2.3. Rig and Fixture Pre-Testing Characterization

2.3.1. Response of EMS Shaker

As discussed within [42,43,44] prior to commencing any vibration study, a key requirement is to fully understand the frequency response of the EMS shaker to ensure that the armature assembly does not exhibit a resonance within the frequency range of interest. The vibration response of the EMS shaker was measured using a swept sine wave of amplitude 1 gn (9.8 m/s2) over a frequency range of 5–3700 Hz at 1 octave/minute prior to testing. Upon analyzing the response of the EMS shaker used in this study, no significant resonances were identified that would detrimentally impact the accuracy or reliability of the durability test programme.

2.3.2. Transmissibility of Fixtures

The primary requirement for durability testing is to ensure that the vibration profile demanded by the electronic controller is faithfully applied to the samples under test. This is achieved by designing the experimental fixture to maximize the transmissibility of the vibration energy from the EMS table to the sample and to concurrently minimize the cross-axis behavior of the durability fixture. Transmissibility is a comparison of the output signal to the input signal [45] and is determined by pre-test experimental evaluations of the fixture. At a transmissibility of unity, the output faithfully follows input [45]. To ensure a uniform transmission of acceleration from the vibration exciter, the fixture must carry the force to the test object with a minimum of loss and distortion. This is accomplished by ensuring the rigidity of the fixture so that the force is not deflected by the specimen load and that the fixture transfers motion with high fidelity [41,45,46]. Ideally, a dynamic test fixture couples the motion from the vibration shaker table to the specimen with zero distortion at all amplitudes and frequencies specified by the test procedure [45,47]. Practically, an ideal value of 1.0 over a wide test frequency cannot be met, therefore fixtures are characterized via swept sine resonance search evaluations prior to testing to ensure that no significant resonances occur in the three axis of the vibration fixture. The cross-axis behavior of the experimental set-up, (Figure 1b) was evaluated in accordance with BS EN 60068 to ensure that “the maximum vibration amplitude in any axis perpendicular to the specified axis shall not exceed 50% of the specified amplitude up to 500 Hz or 100% for frequencies in excess of 500 Hz [44]”.
To measure the vibration characteristics of the test fixture, accelerometers were placed in the X, Y and Z-axis of the assembled fixture, within or close to every cell mounting position. The fixture was excited in the Z-axis. The test samples were not installed into the fixture during the transmissibility investigation. Prior to conducting the transmissibility measurement activity several vibration test standards were consulted. It was noted that there is ambiguity within the regulatory and industrial guidelines with respect to assessing the suitability of fixtures for durability assessments. For example, standards such as the NASA GSFC-STD-7000A [48] and MIL-STD-810f [49] request that fixture transmissibility is assessed on the fixture in isolation. However BS 60068 and DEF STAN 0035 (Part 3) [50] suggest testing both with and without the device under test installed.
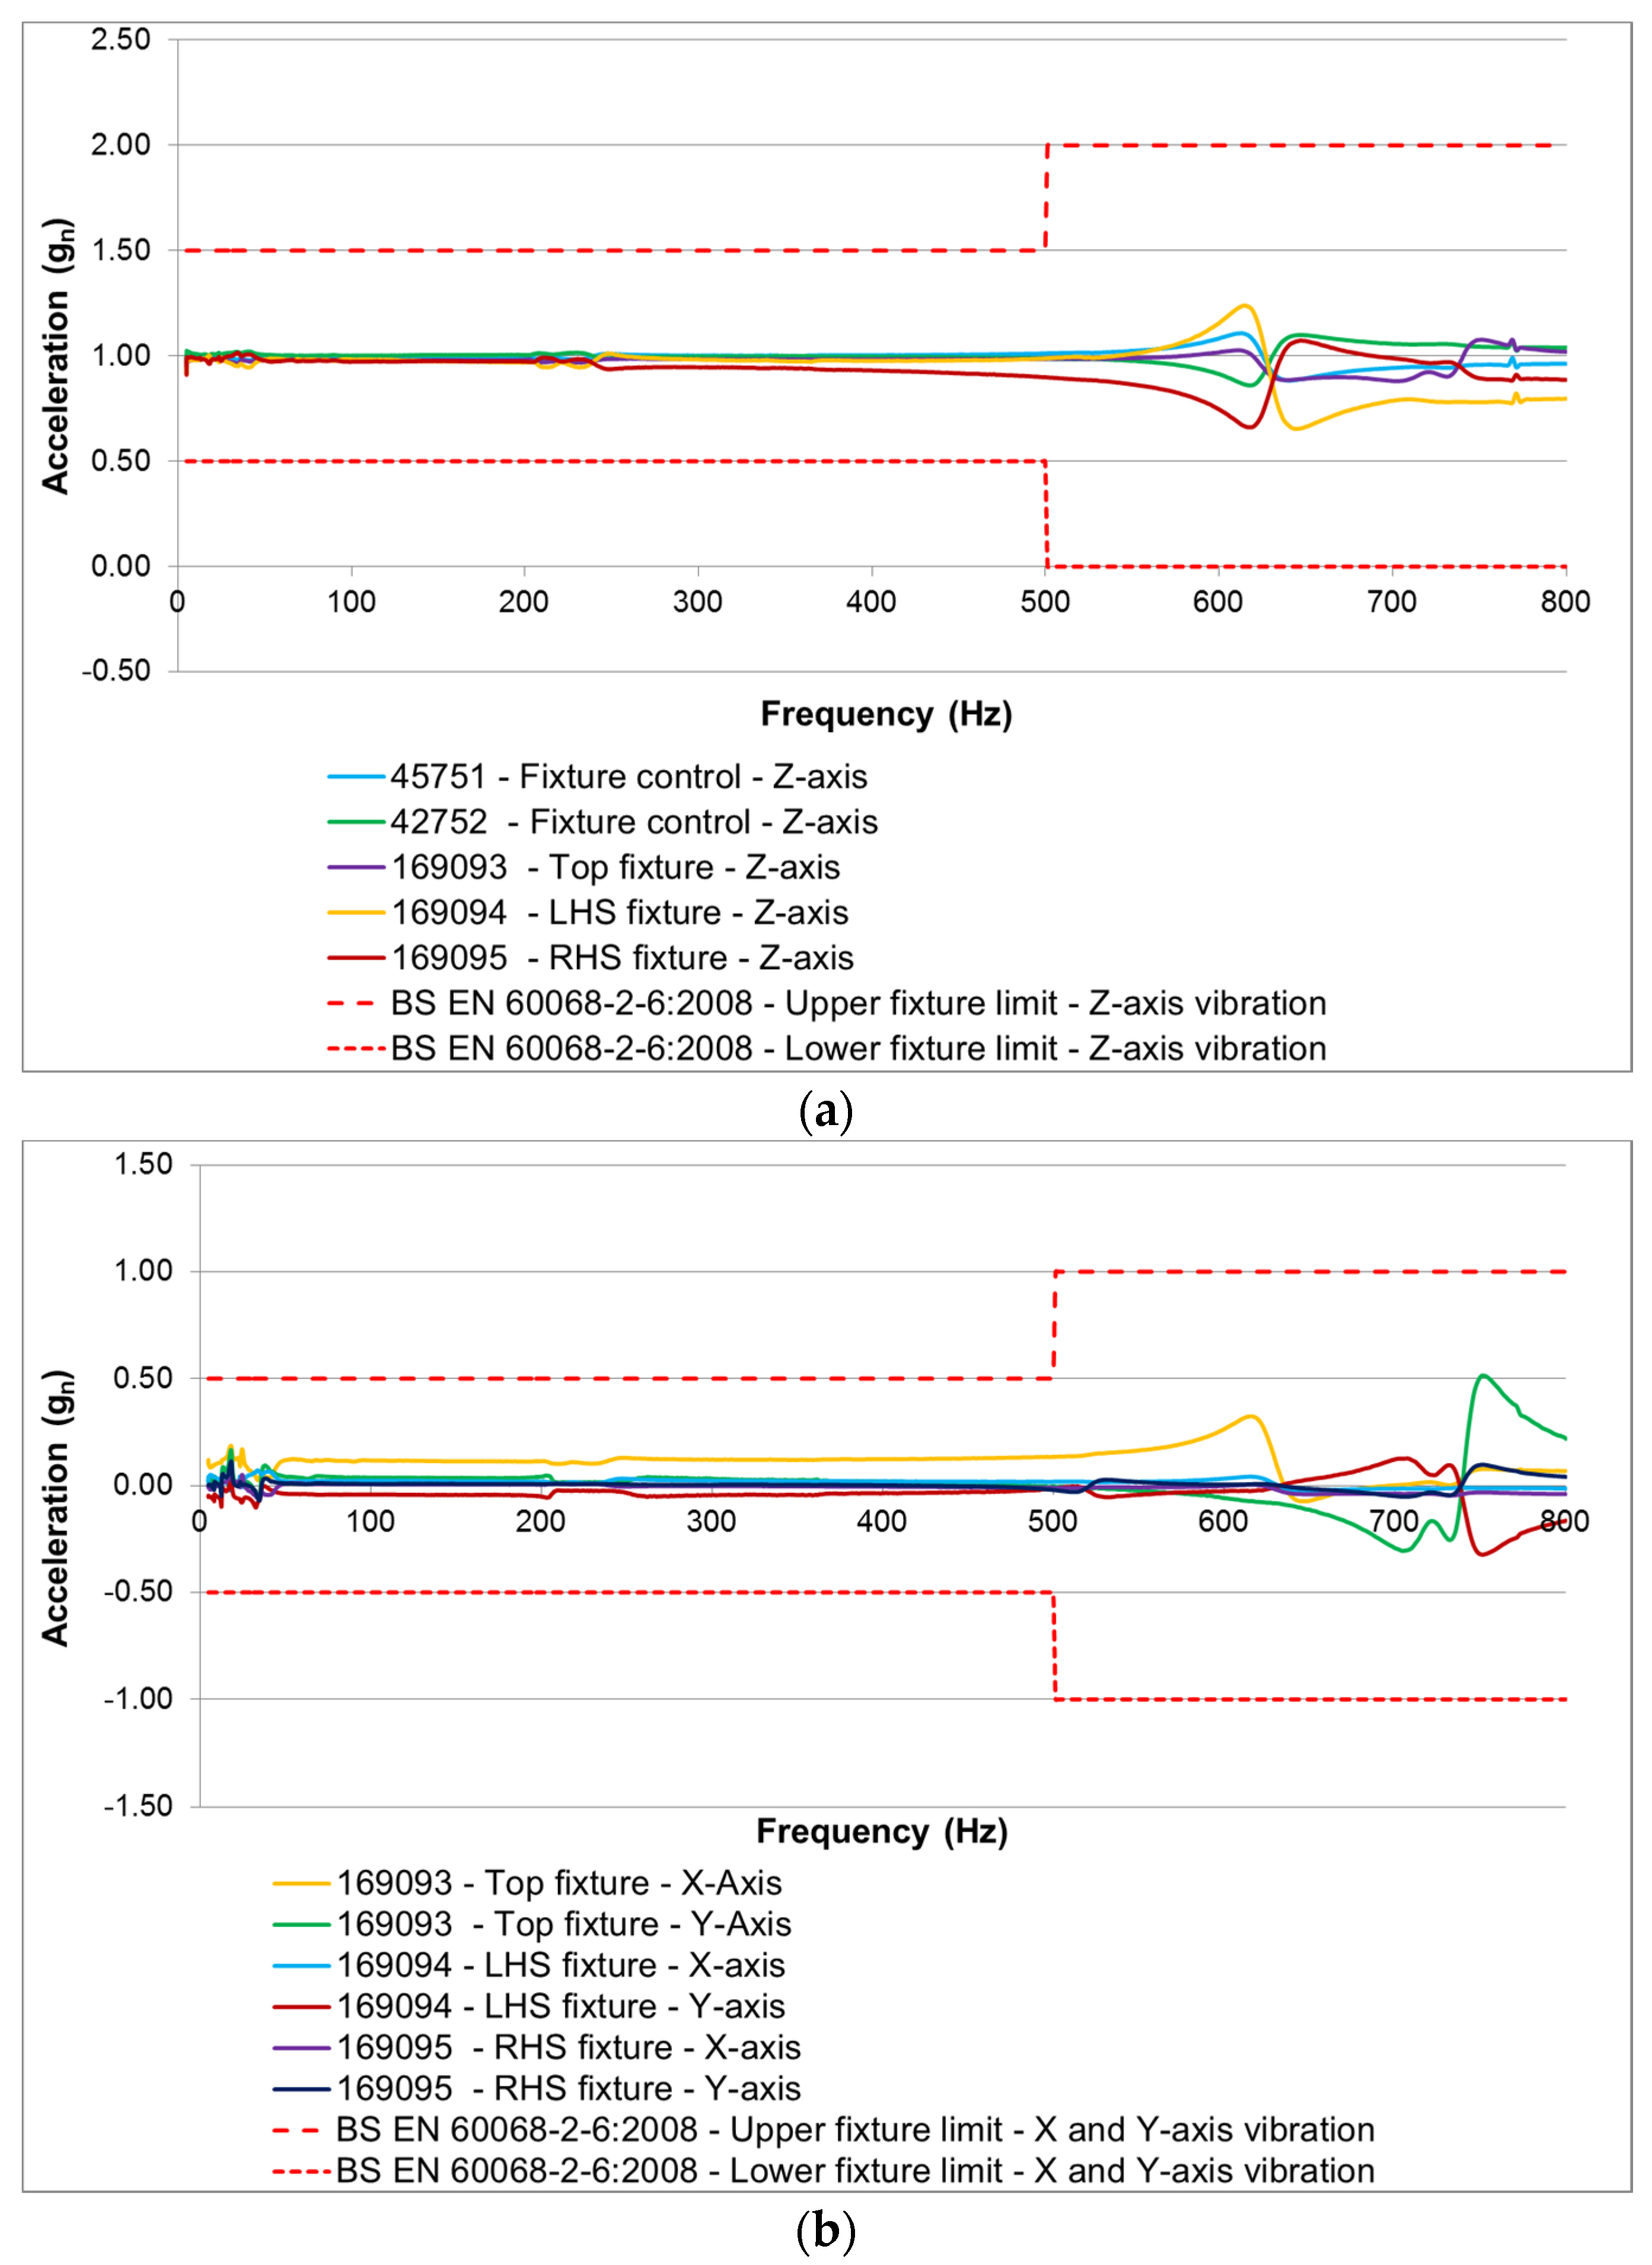
Figure 3 shows the measured response of the fixture in the X, Y and Z-axis when excited in the Z-axis via a swept sine wave, of amplitude 1gn over a frequency range from 5–800 Hz (800 Hz is peak frequency of durability profiles utilized within this study) at a rate of 1 octave per minute. The results show that the vibration responses measured, in all three axis, are within the limits specified by BS EN 60068. Please note that the data presented in Figure 3 is a sample of the total data recorded for illustrative purposes.
Figure 3. BS EN 60068 resonance evaluation of 18650 durability fixture: (a) Z-Axis of fixture (b) X and Y-Axis of fixture.
Energies 09 00052 g003
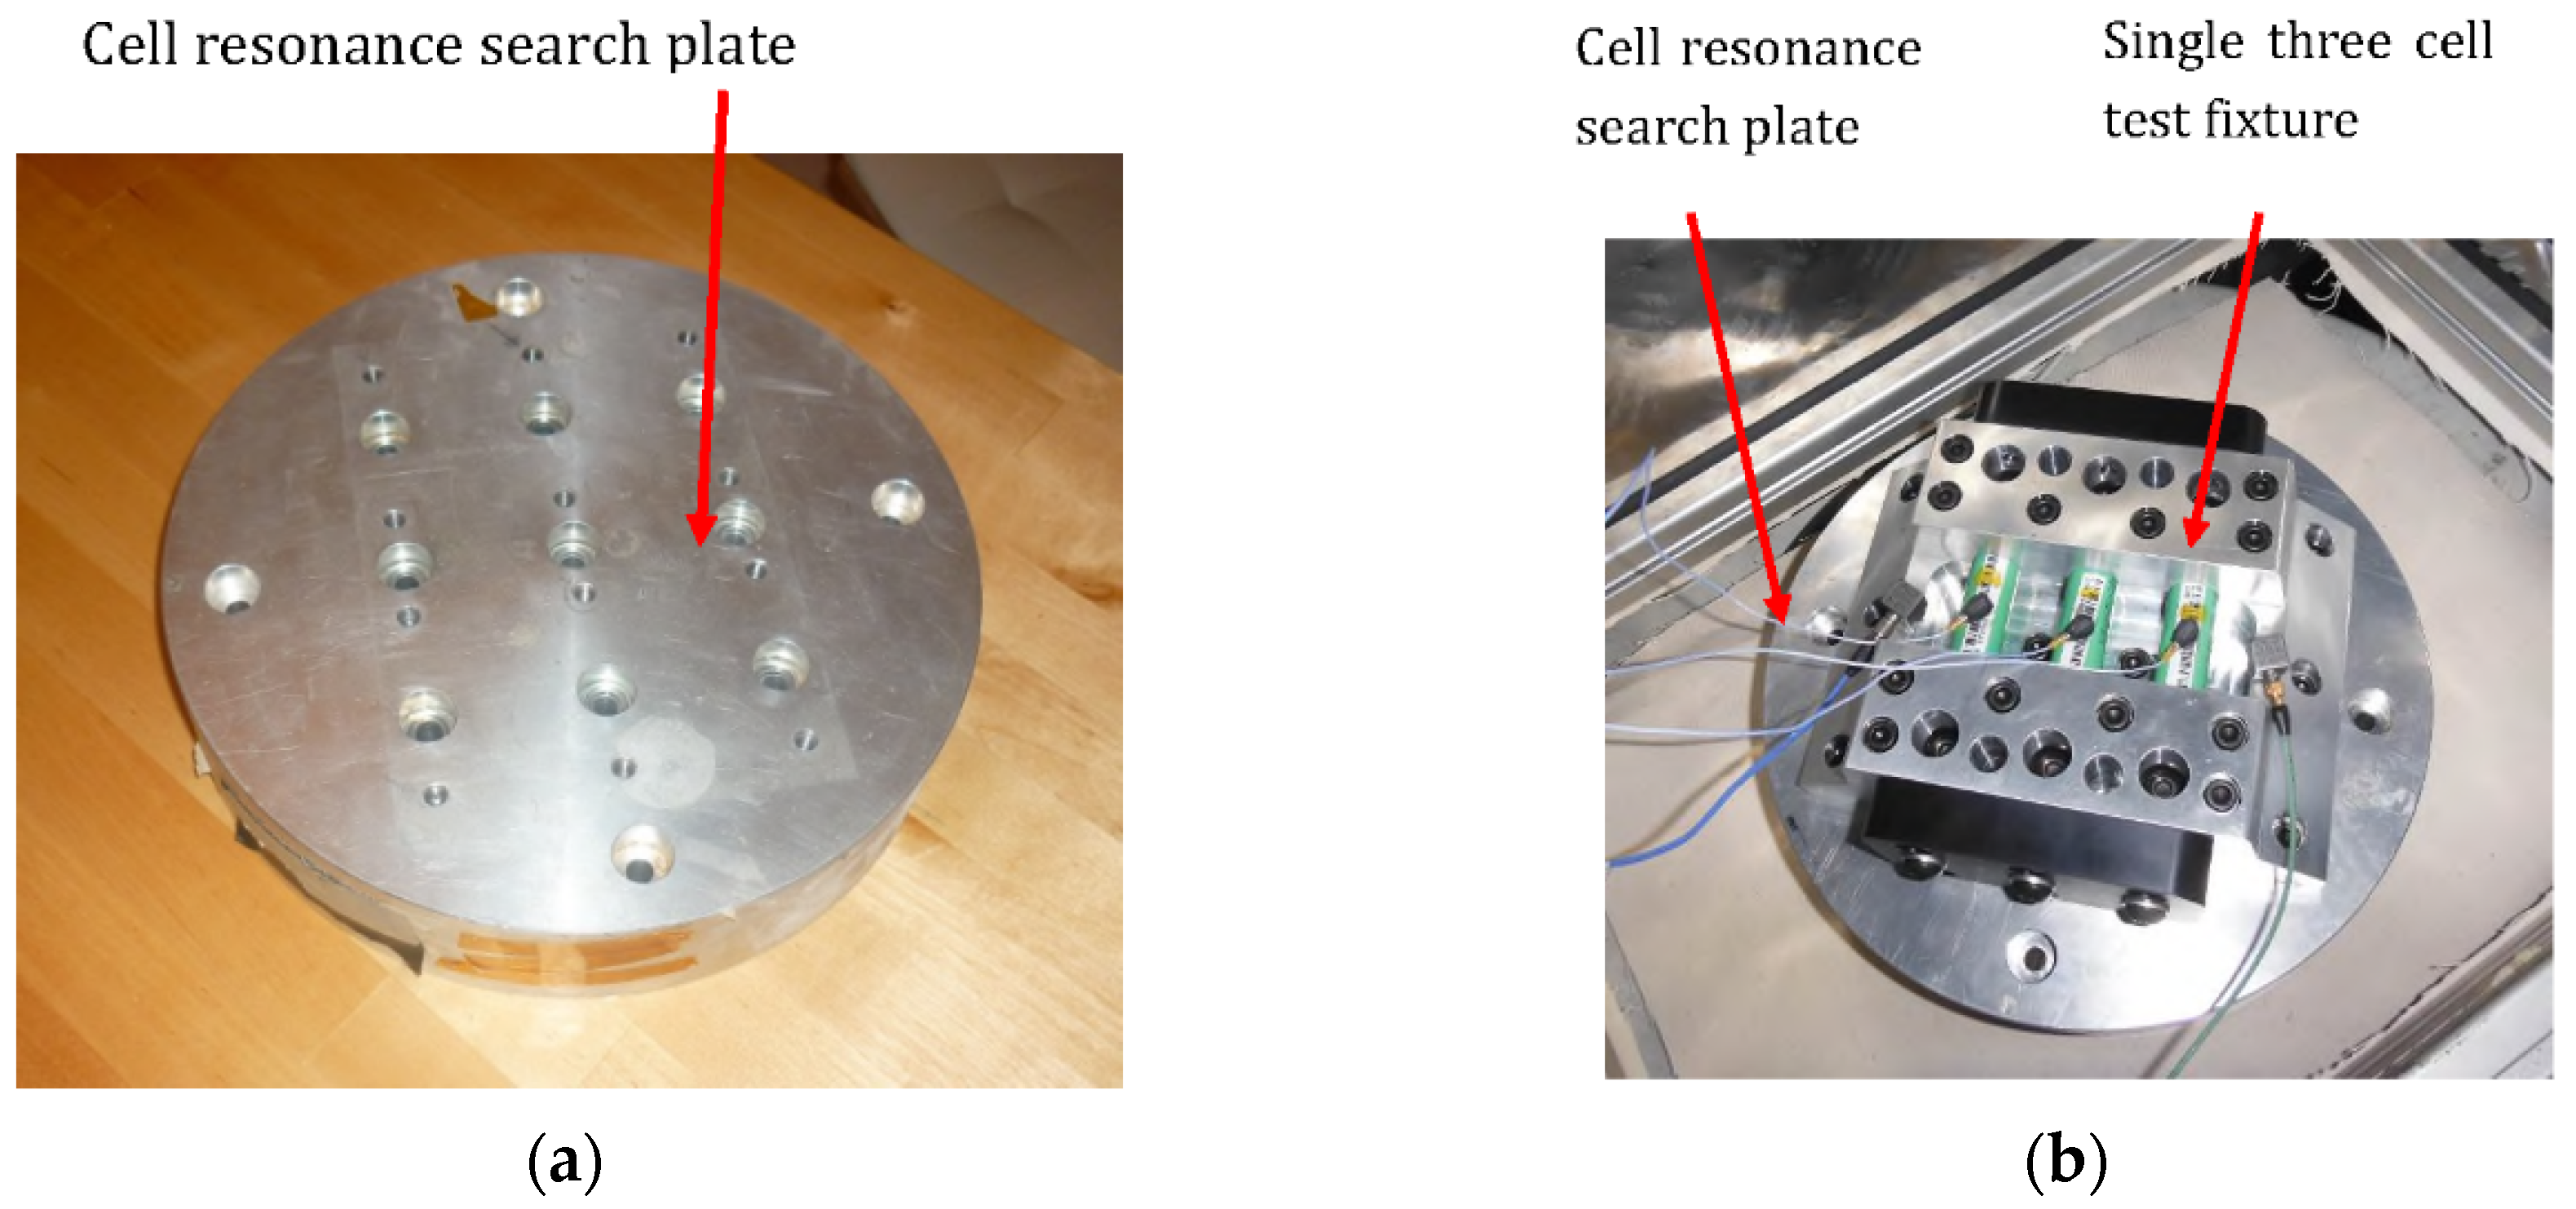
To mechanically characterize the cells at the start and end of test (discussed in Section 2.6.6), an additional “cell resonance search plate” fixture was fabricated to perform this assessment (shown in Figure 4a) which was designed to accept a three cell test fixture (as shown in Figure 1a). The assembled resonance search plate and three cell test fixture is shown in Figure 4b. This separate fixture plate was fabricated to allow for accurate natural frequency measurements outside the frequency range (>800 Hz) of the durability fixture assembly.
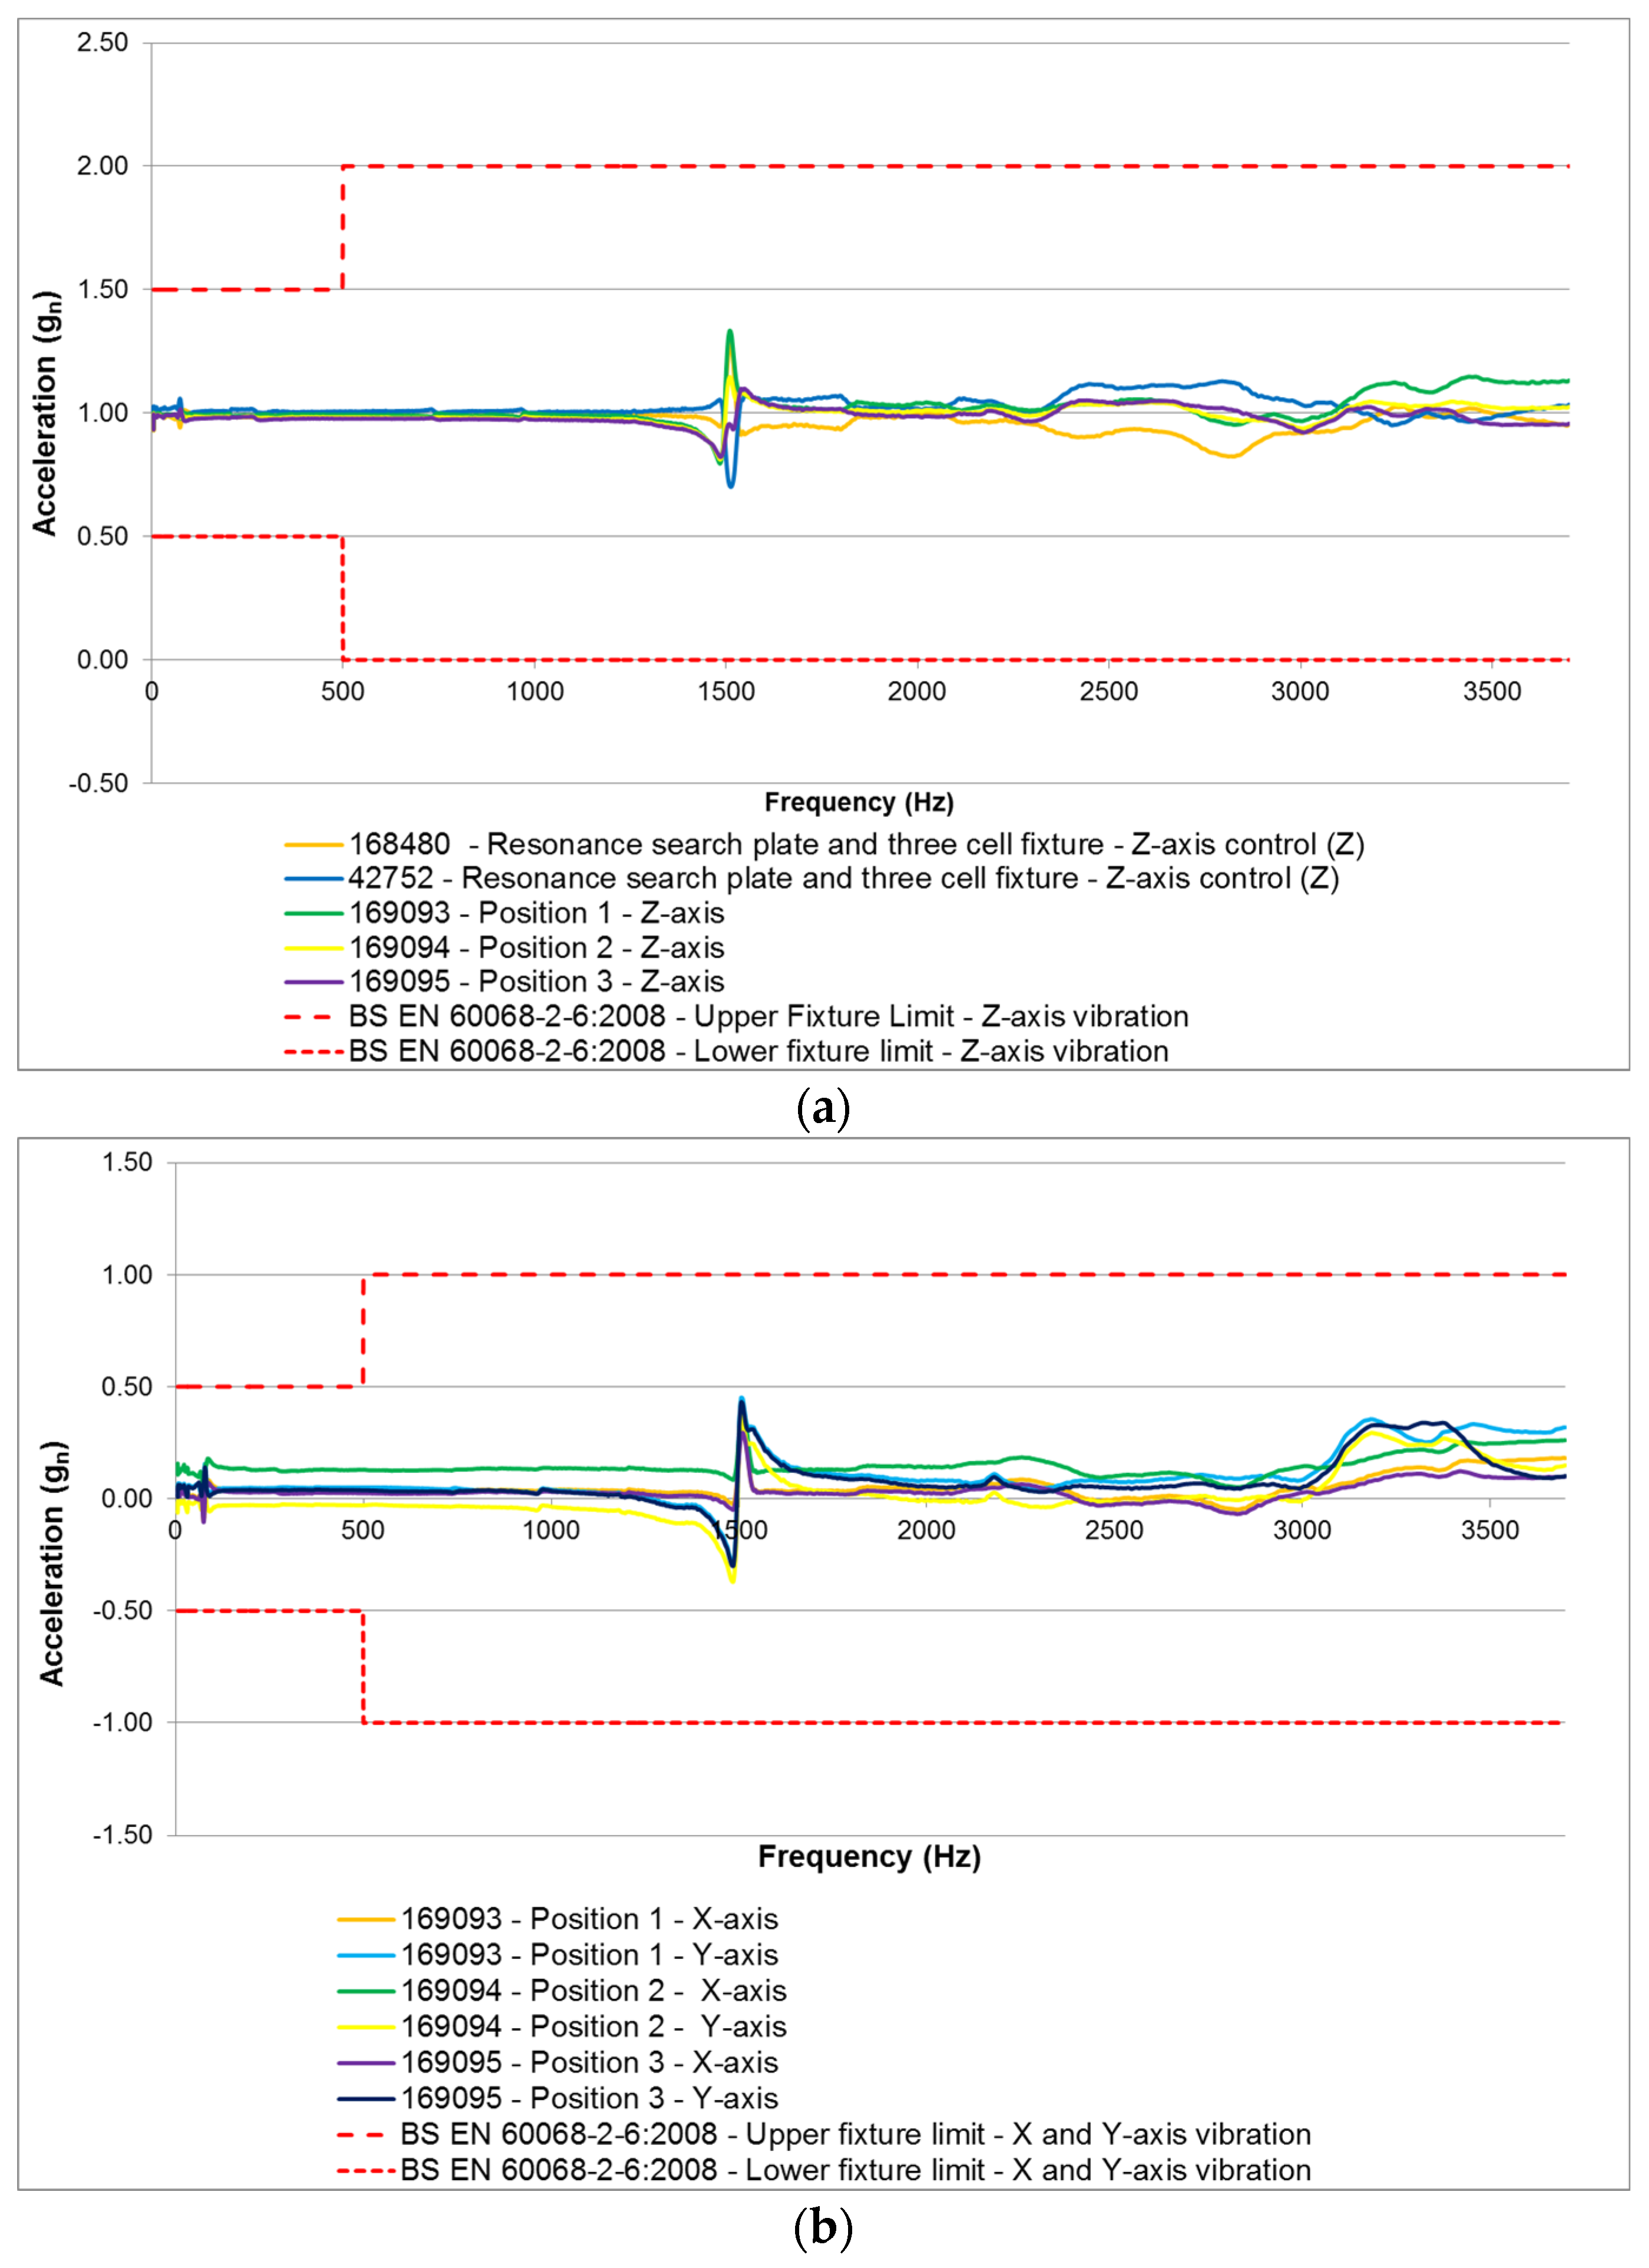
The resonance search plate fixture assembly as shown in Figure 4b was evaluated in accordance with BS EN 60068 (without test samples installed) and was excited in the Z axis via a 1 gn swept sine from 5 to 3700 Hz at a sweep rate of 1 octave/minute. To measure the vibration characteristics of the test fixture, accelerometers were placed in the X, Y and Z-axis of the assembled fixture, within or close to every cell mounting position. The resonance search plate with a single 18650 three cell fixture installed met the requirements of BS EN 60068 from 5 to 3700 Hz, however a 0.5 gn resonance (which is within the limits of BS EN 60068) was noted at 1500 Hz. The results from this assessment are shown in Figure 5.
Figure 4. (a) Cell resonance search plate (b) Cell resonance search plate with single 18650 three cell fixture installed on VP85 electromagnetic shaker (EMS).
Energies 09 00052 g004
Figure 5. BS EN 60068 Resonance evaluation of resonance search plate (a) Z-Axis of search plate (b) X and Y-Axis of search plate.
Energies 09 00052 g005

2.4. Test Samples

Twenty seven Samsung 2.2 Ah 18650 cells (NMC) were evaluated. Each cell was pre-conditioned to a defined SOC prior to durability testing and allocated a test orientation with respect to the vehicle Z-axis. The details of sample preparation, cell SOC and cell orientation are defined in Table 1.
Table 1. Test sample information.
Sample No.Test ProfileSOC (%)Cell Orientation (Vehicle Axis: Cell Axis)
1Control sample-In permanent storage25%Control
2Control sample-Followed J2380 test samples25%Control
3Control sample-Followed WMG/MBK profile test samples25%Control
4Control sample-In permanent storage50%Control
5Control sample-Followed J2380 test samples50%Control
6Control sample-Followed WMG/MBK profile test samples50%Control
7Control sample-In permanent storage75%Control
8Control sample-Followed J2380 test samples75%Control
9Control sample-Followed WMG/MBK profile test samples75%Control
10J238025%Z:Z
11J238025%Z:X
12J238025%Z:Y
13J238050%Z:Z
14J238050%Z:X
15J238050%Z:Y
16J238075%Z:Z
17J238075%Z:X
18J238075%Z:Y
19WMG/MBK25%Z:Z
20WMG/MBK25%Z:X
21WMG/MBK25%Z:Y
22WMG/MBK50%Z:Z
23WMG/MBK50%Z:X
24WMG/MBK50%Z:Y
25WMG/MBK75%Z:Z
26WMG/MBK75%Z:X
27WMG/MBK75%Z:Y
A detailed explanation of the two test profiles defined in Table 1 are discussed in Section 2.5, whilst the test orientation is discussed in greater detail in Section 2.7.

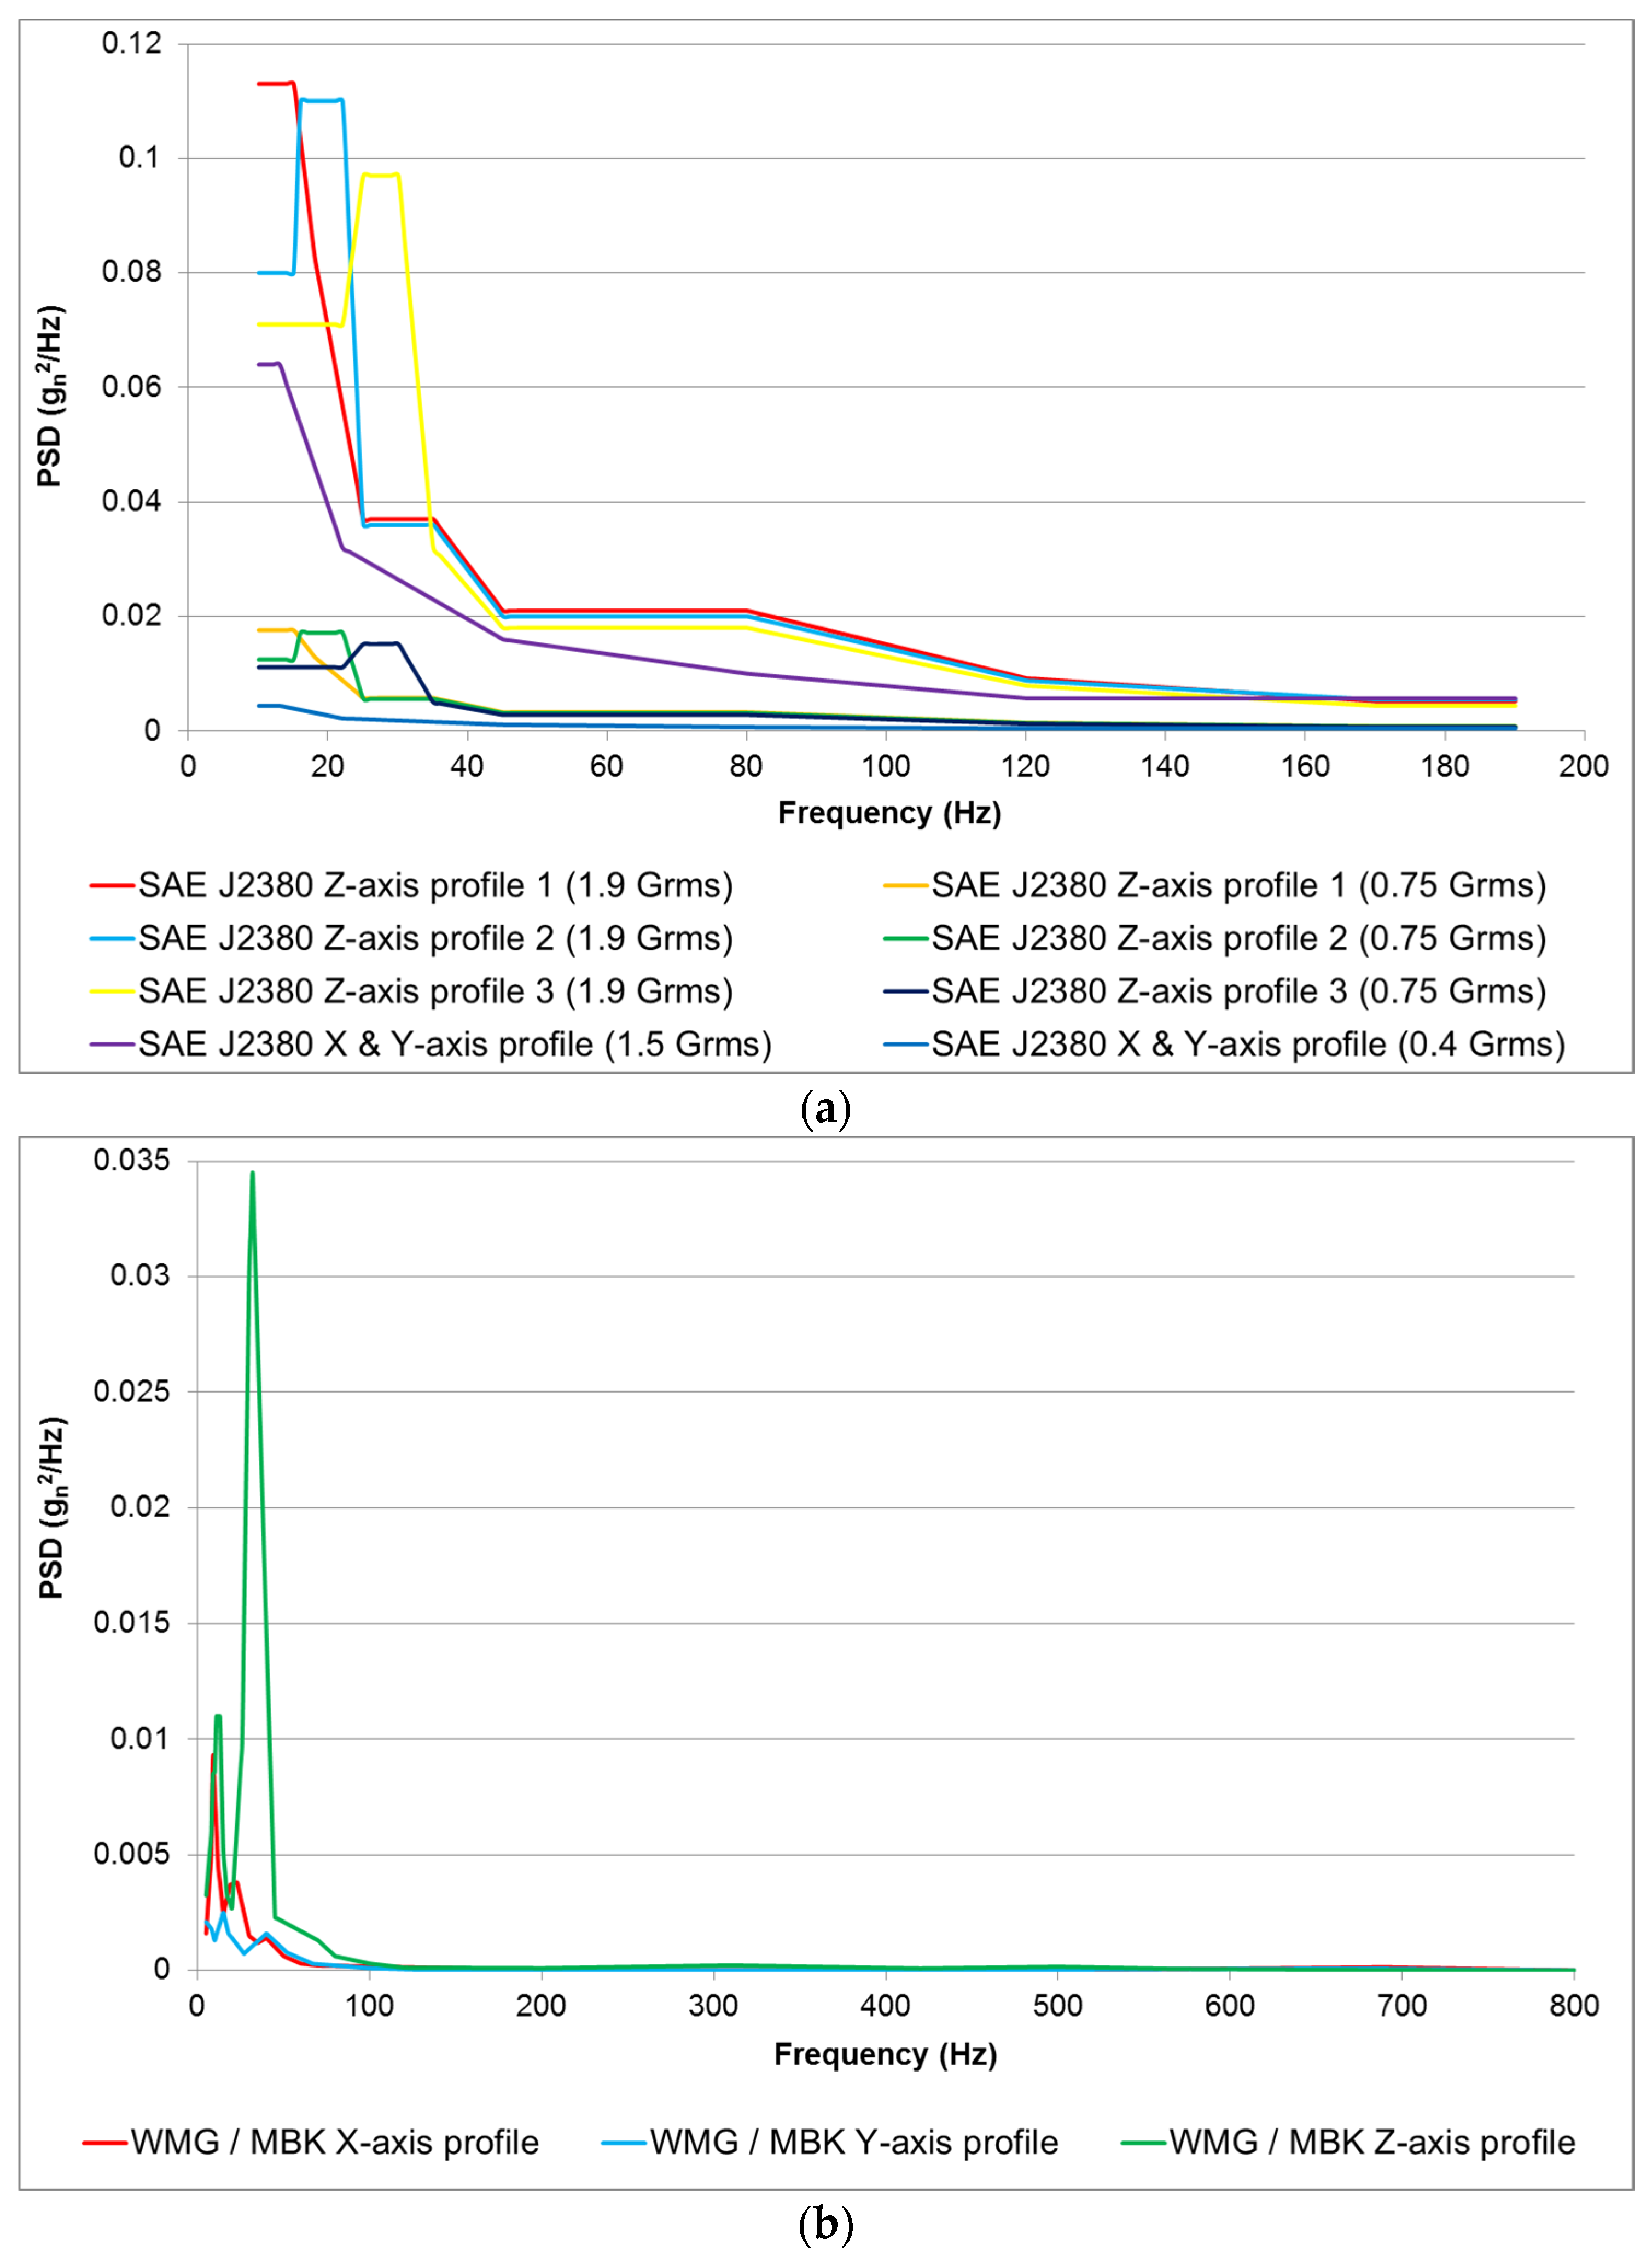
2.5. Vibration Cycles

Nine cells were subjected to the vibration profile defined in the SAE J2380 standard and nine were subjected to WMG/MBK vibration profile. Both test specifications utilized random vibration profiles. A full explanation of the derivation of both profiles can be found in [11,36,37,38,51]. For completeness, these profiles are presented in Figure 6 and the vibration profile used for each cell is presented in Table 1.
Figure 6. (a) SAE J2380 vibration power spectral density (PSD) profiles for testing samples 10 to 18; (b) Warwick Manufacturing Group/Millbrook Proving Ground WMG/MBK vibration PSD profiles for testing samples 19 to 27.
Energies 09 00052 g006
Whilst the WMG/MBK profile was developed through a previous study undertaken by the authors, SAE J2380 was selected as it is currently the only internationally recognized vibration test standard that has been correlated to 100,000 miles of road vehicle durability.

2.6. Mechanical and Electrochemical Testing

The following tests were performed on the cells at SOT and EOT (after vibration).

2.6.1. SOC Adjustment

The cell SOC was adjusted by fully charging the cells with a constant current of 1.1 A (C/3) to 4.2 V followed by a constant voltage phase at 4.2 V until the current fell to 0.05 A (C/65). At the end of charge, the cells were allowed to rest for 4 h prior to being discharged at 1C for 45, 30 and 15 min, to achieve a cell SOC of 25%, 50% or 75%, respectively. The cells were allowed to reach equilibrium for 4 h before the application of vibration energy.

2.6.2. 1C Capacity

The cells were fully charged using a constant current phase of 1.1 A (C/3) to 4.2 V followed by a constant voltage phase at 4.2 V until the current reduced to 0.05 A (C/65). The cells were allowed to rest for 4 h prior to being fully discharged at 1C to 2.75 V that represents the lower voltage threshold defined by the manufacturer. The energy extracted from the cells during the discharge was recorded as a measure of the 1C capacity.

2.6.3. Pulse Power

To determine the DC resistance of the cells (RDC), a series of pulses was applied to the cells when conditioned to 50% SOC. Each current pulse was of 10 s in duration, with a magnitude of 20%, 40%, 60%, 80% and 100% of the cell’s rated maximum discharge current. The maximum discharge current is defined by the manufacturer In the case of the Samsung 18650, the maximum discharge current is specified as 4400 mA. A rest interval of 30 min was employed between consecutive pulses. DC resistance was calculated as described in Equation 2. VOCV is the voltage prior the application of the current pulse (Imax), V10s is the cell voltage at the end of the 10 s current pulse at Imax:
R D C = ( V O C V   V 10   s )   I m a x

2.6.4. Open Circuit Voltage (OCV)

The OCV of the cells under evaluation was measured with the cell isolated from any electrical load using a standard laboratory voltmeter. The OCV was recorded at the start and end of test. It was also recorded prior to moving the samples on the durability fixture.

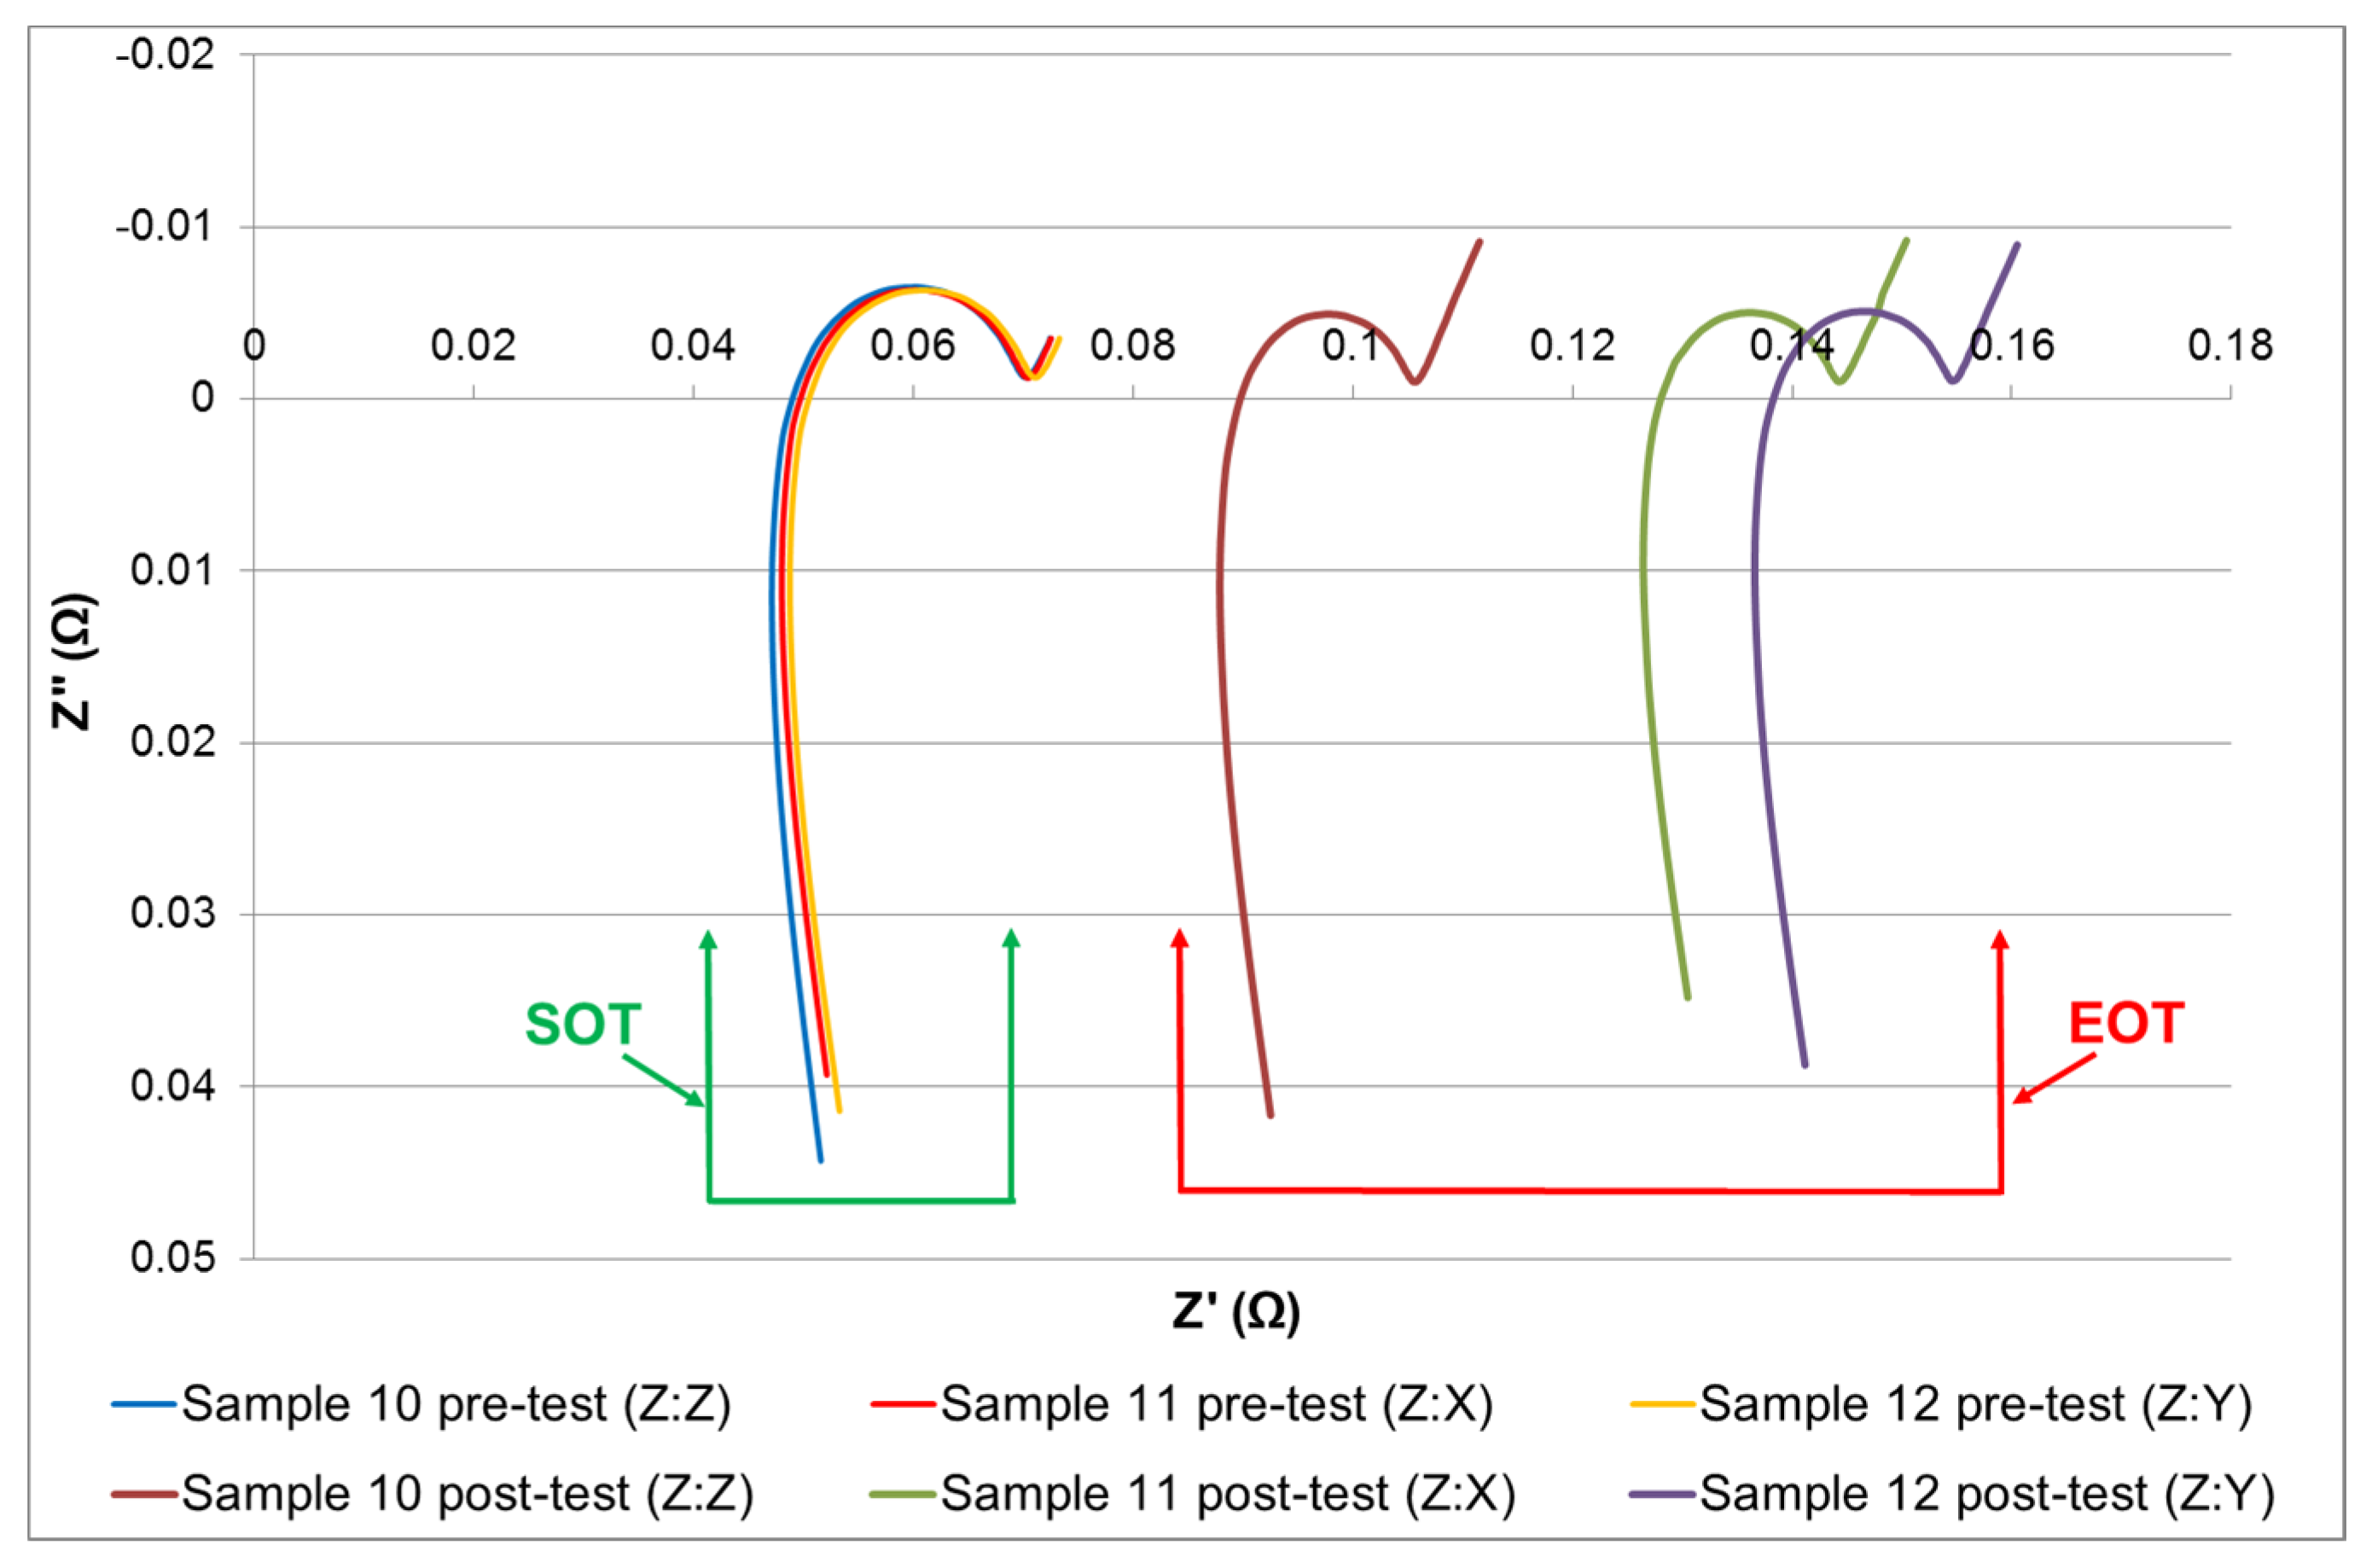
2.6.5. Electrochemical Impedance Spectroscopy (EIS)

EIS data was recorded 4 h after the last pulse of the pulse power tests, as suggested by Barai et al. [52] and was performed at 50% SOC. The EIS measurement was carried out in a galvanostatic mode using a ModuLab® (Solartron, Leicester, UK) electrochemical system model 2100 A fitted with a 2 A booster and driven by Modulab® ECS software. The EIS spectra were collected within the frequency range of 10 mHz to 10 kHz using 10 frequency points per decade. The amplitude of the applied current was 200 mA (RMS). No DC current was superimposed on the RMS value. The commercially available Z view® software was employed to fit the EIS spectra to an equivalent circuit model (ECM) of the cell, thereby facilitating the quantification of key cell parameters such as: DC and charge transfer resistance.

2.6.6. Natural Frequency

The cells natural frequency was recorded at SOT and EOT to quantify the mechanical characteristics of each cell. Changes in natural frequency can indicate a change in material properties (such as stiffness) through mechanisms such as cracking or work hardening. The natural frequency of each cell was measured by fastening the respective cell to the EMS table (as illustrated in Figure 4) and applying a swept sine wave from 5 to 3700 Hz, of amplitude 1 gn at a rate of 1 octave/min.
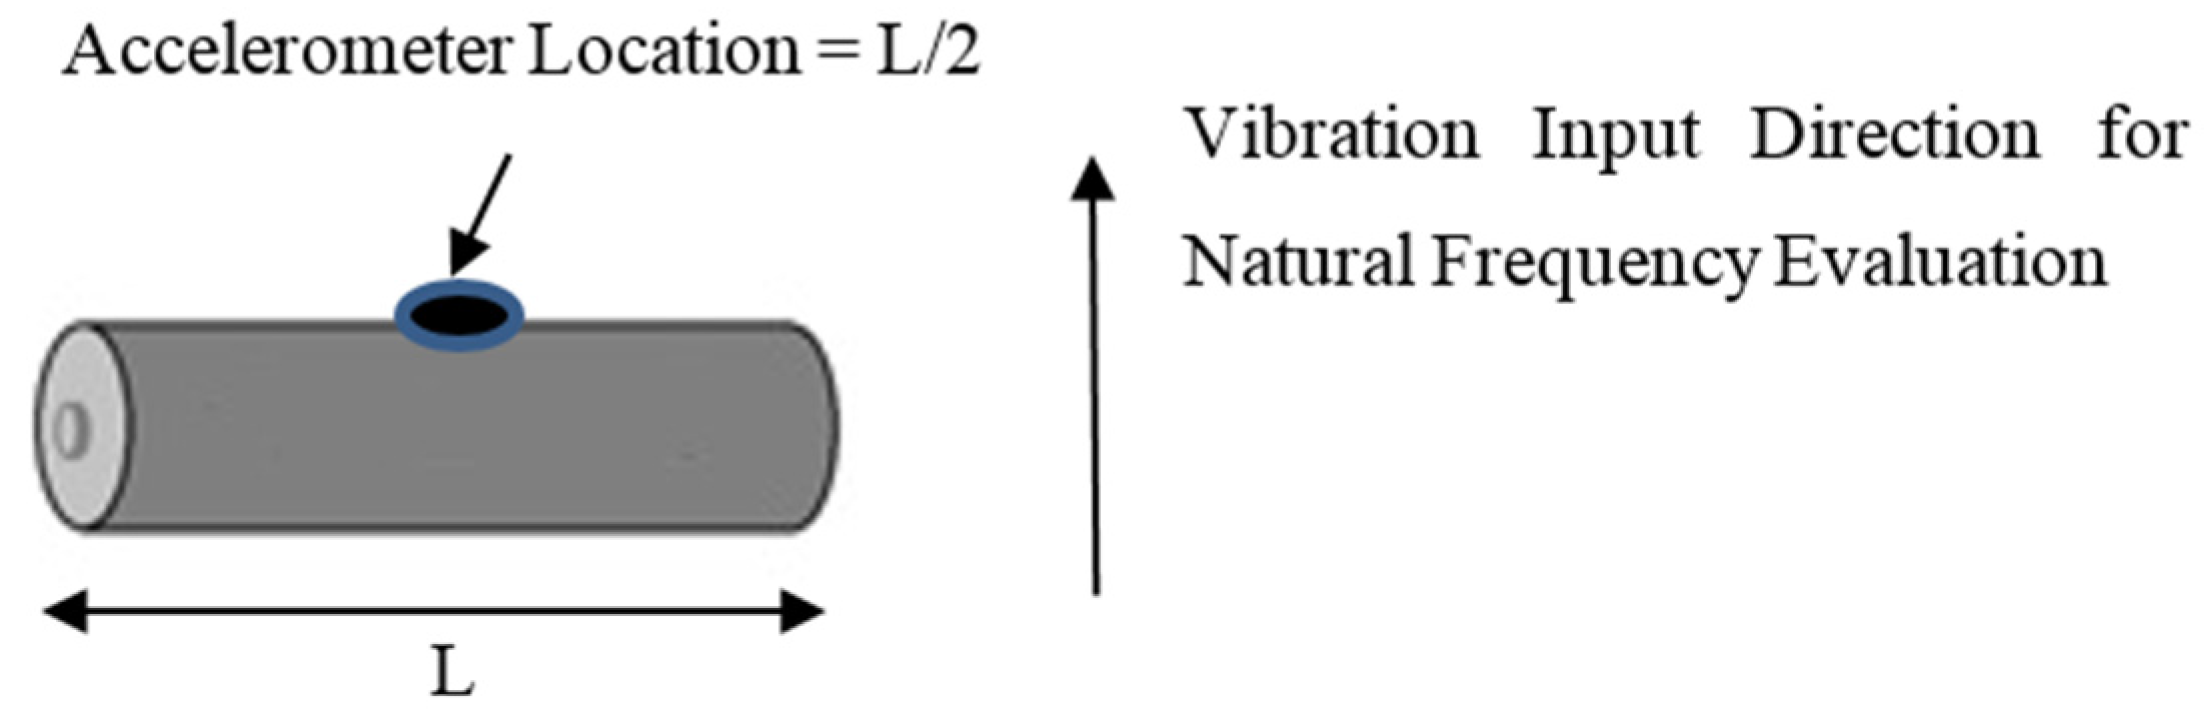
The response of the cell in relation to this 1 gn excitation, was recoded via a lightweight, single axis, accelerometer (PCB 352A24, PCB Piezotronics Inc, Depew, NY, USA) mounted as shown in Figure 7. These were secured to the center of the cell using a petro wax adhesive. With a weight of only 0.8 g (1.9% additional mass for each cell), their inclusion within the experimental set-up was not deemed to have any significant impact on test accuracy through the addition of extra mass.
Figure 7. Location of cell accelerometer for natural frequency measurement via swept sine frequency sweep.
Energies 09 00052 g007
Two control accelerometers were secured at opposite ends at the top of the test fixture. Each control accelerometer was mounted close to the specimens. An averaging control strategy was employed during the natural frequency measurement. Data was recorded at 2.5 times the desired peak frequency in accordance with Nyquist rate guidelines [53]. With this test program, the peak desired frequency was the maximum achievable frequency of the VP85 EMS, defined by the manufacturer as 3.7 kHz. Therefore, accelerometer data was measured at a frequency greater than 9.25 kHz. Post natural frequency measurement each cell was allowed to rest for a minimum of 3 h before commencing the vibration durability test profiles. It noteworthy that no control samples were measured during the natural frequency assessment, this was to ensure that they were not subjected to any mechanical loading.

2.7. Test Procedure

The 27 cells presented in Table 1 were characterized as described in 
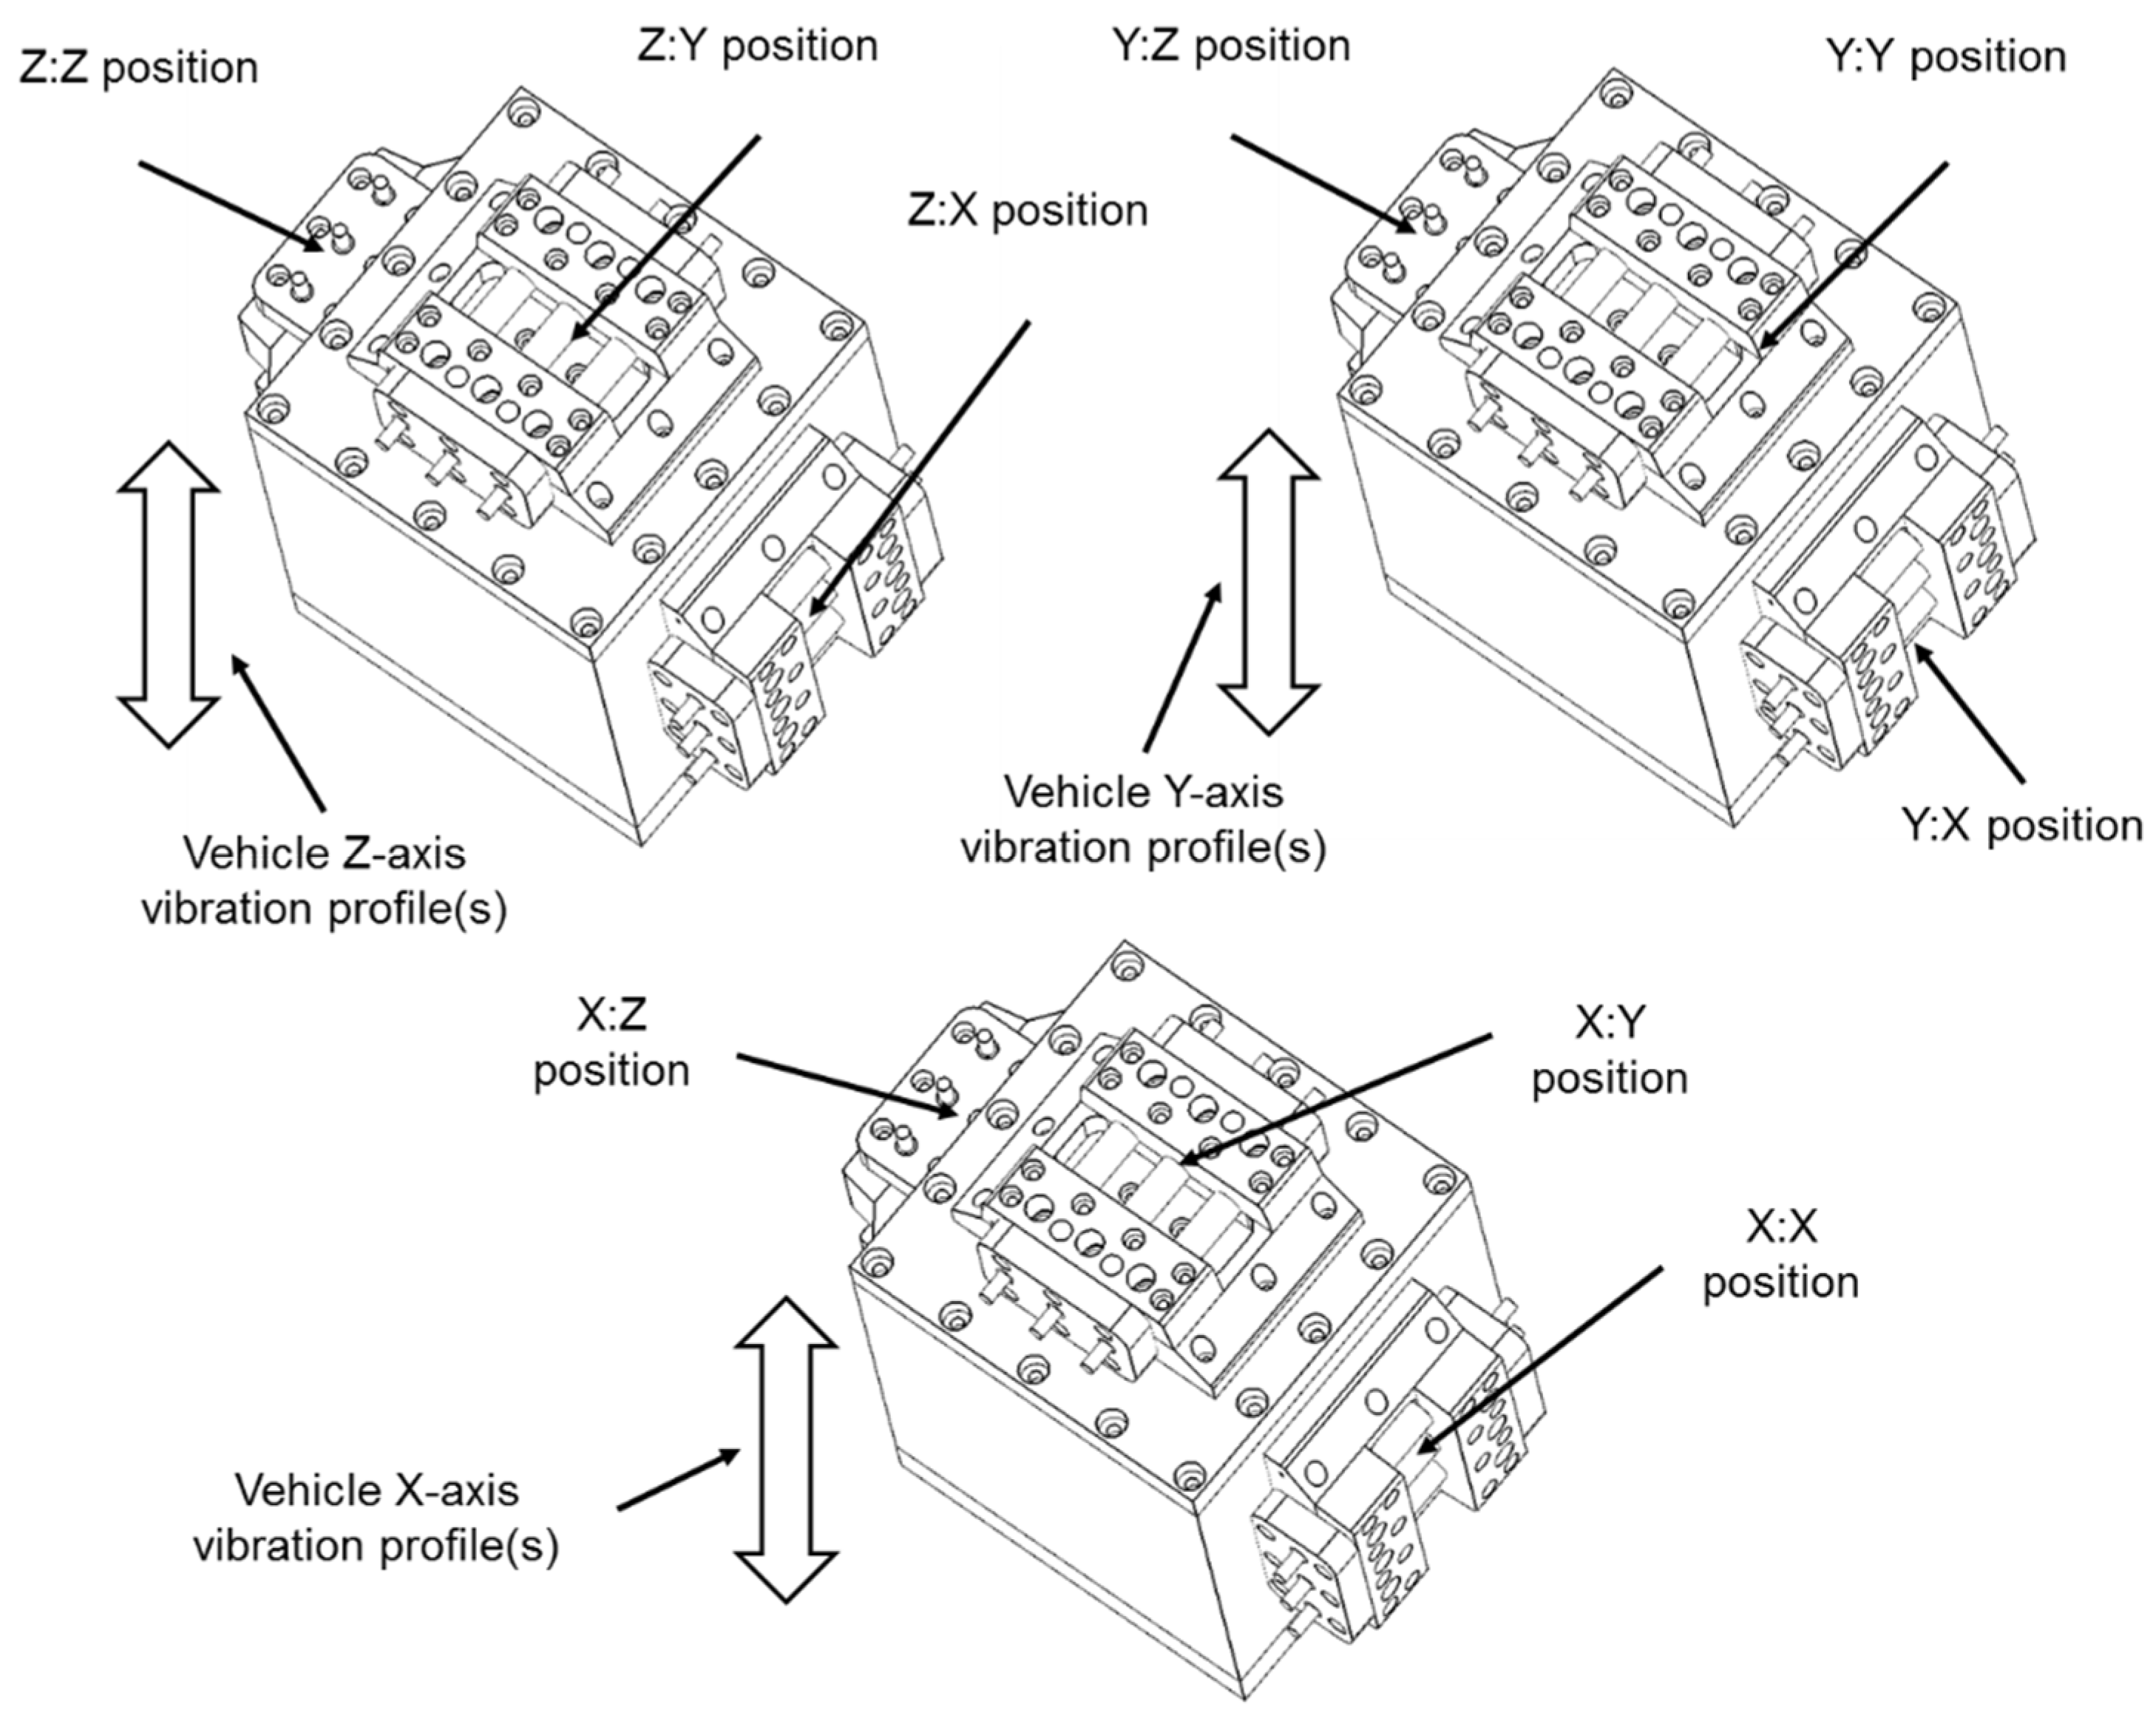
Section 2.6 (SOT characterization). They were then divided into three equal batches, comprising nine cells each. Batch 1 was subjected to the vibration profile defined in the SAE J2380 standard and batch 2 was subjected to WMG/MBK vibration profile. The remaining nine cells (batch 3) were defined as control samples. These were co-located within the same environmental conditions, but not subjected to any vibration loading. Both vibration tests comprise a vertical (Z-axis) profile in addition to vibration profiles defined for the horizontal plane (X-axis and Y-axis). As part of the experimental procedure, each profile is sequentially applied to the cells to achieve the desired 100,000 miles of representative EV life. For a complete execution of either J2380 or WMG/MBK, the three different combinations of vibration loads with respect to each cell orientation are defined below:
  • Z:Z to X:X to Y:Y
  • Z:X to X:Y to Y:Z
  • Z:Y to X:Z to Y:X
Using the above notation, for each pair of letters, the first letter refers to the vehicle axis, whilst the second refers to cell orientation. For simplicity this paper identifies the cell orientation in relationship to the vertical (Z axis) of the vehicle. For example a cell that was subjected to the vibration sequence of Z:X to X:Y to Y:Z, is referred to as being evaluated in the Z:X orientation. 
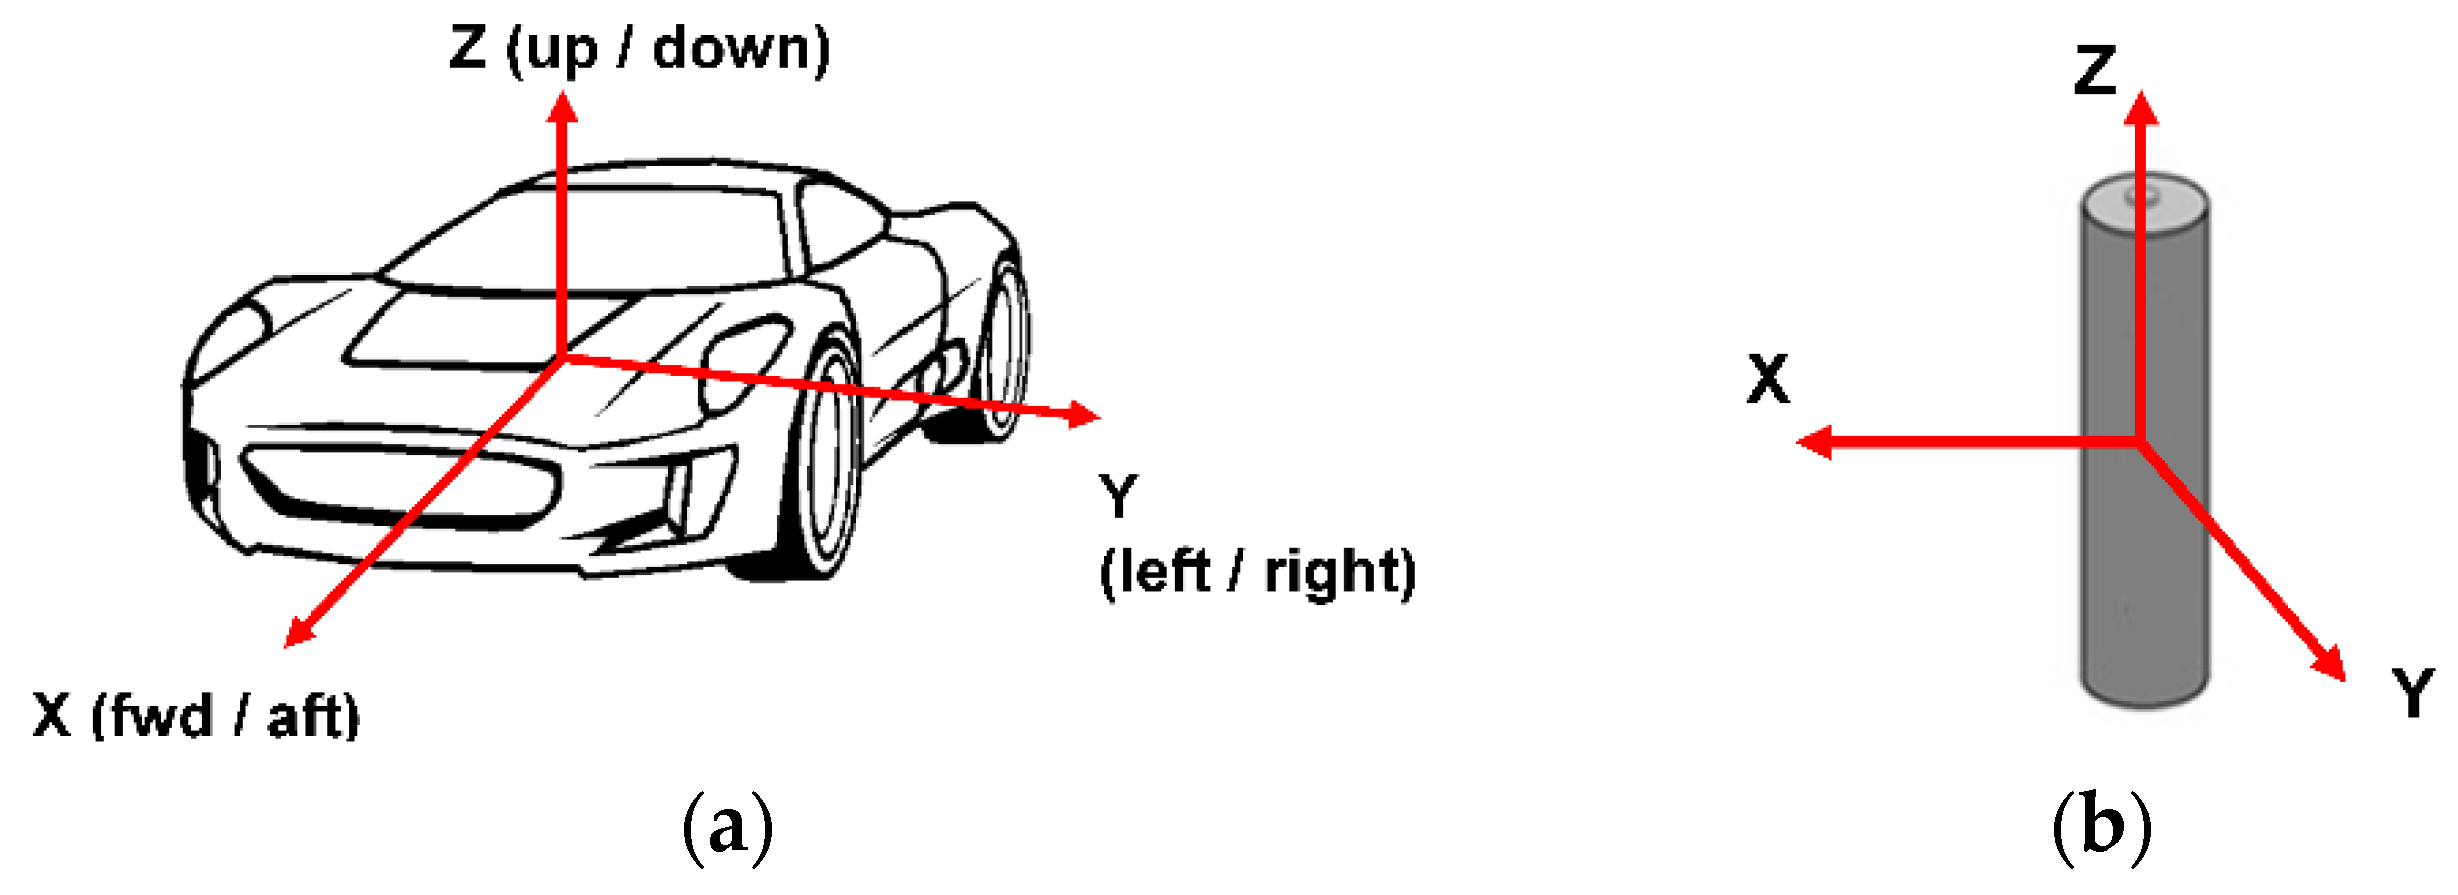
Figure 8a illustrates the axis convention for the vehicle axis, whilst Figure 8b illustrates the axis convention for the 18650 cell.
Figure 8. (a) Axis convention of vehicle vibration durability profiles, (b) Axis convention of cells.
Energies 09 00052 g008
Figure 9 presents the orientation of the nine cells mounted onto the durability fixture for the three orientation test conditions.
Figure 9. Experimental orientations and test positions on durability fixture.
Energies 09 00052 g009
Due to limited equipment availability, a single axis shaker was employed for the durability testing. Because the orientation of the EMS could not be changed, the cells had to be rotated on the durability fixture between X, Y and Z axis profile changes to achieve the correct loading. This test methodology is termed as not testing “with respect to gravity” and does not allow for changes in sample mass during the re-orientation of cells with respect to the input axis of vibration. While the authors believe that this limitation will not significantly impact the results, this limitation is discussed further in Section 5, where the authors propose to repeat the study using a multi-axis shaker to identify if any correlation does exists within the experimental data that can be attributed to experimental approach employed.
All testing was conducted within an air-conditioned room at a temperature of 21 ± 5 °C. The closed loop application of the vibration profile was achieved by using an averaging control strategy, as defined within [54] which included ±3 dB alarm limits and ±6 dB abort limits. Once the cells were installed to the durability fixture and mounted onto the EMS table, the Z-axis vibration profile of either J2380 or WMG/MBK was applied first (Table 2). The calculation of Grms levels (defined in Table 2, Table 3 and Table 4) is discussed in [51]. On completion, the cells were left to stabilize for a minimum of 4 h.
The cells were then moved on the durability fixture to the corresponding vehicle X-axis and subjected to the X-axis vibration profile (Table 3).
Finally, the cells were repositioned on the durability fixture to facilitate the application of the vehicle Y-axis vibration profile (Table 4). At the end of the vibration profile, the cells were left to stabilize for 4 h prior to visual inspection.
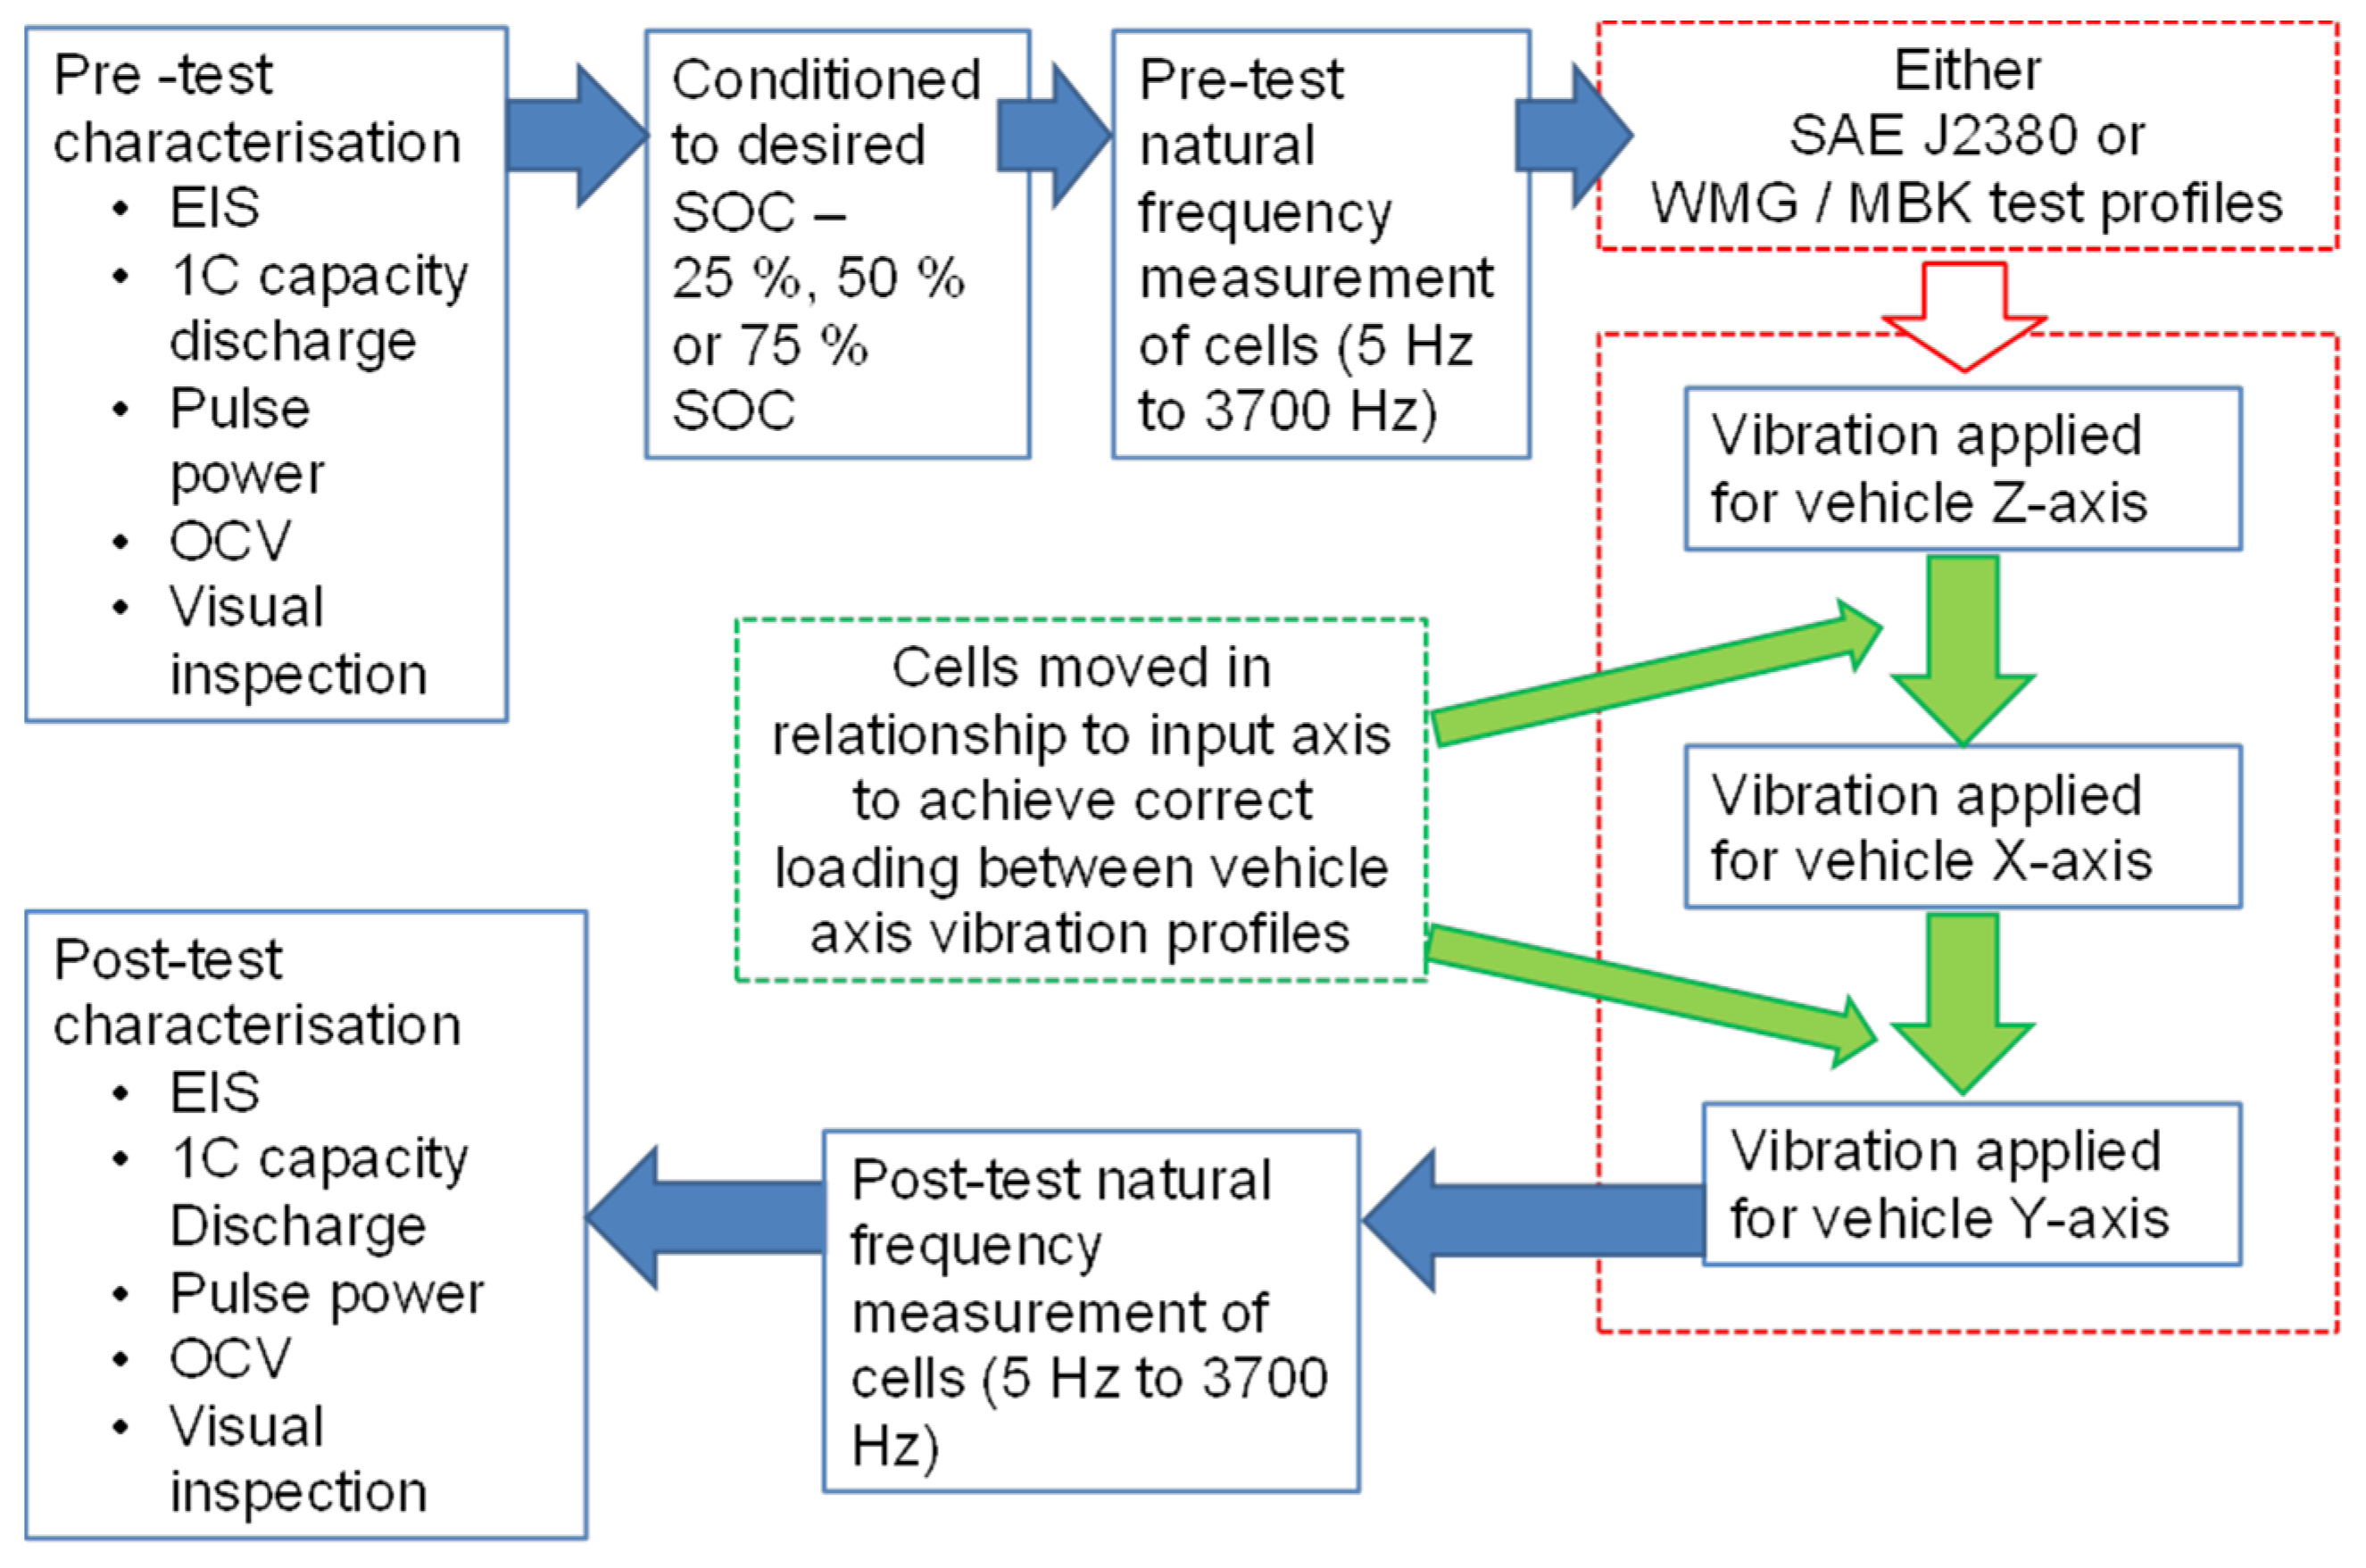
The cells were then characterized at EOT as described in 2.5. The complete experimental procedure followed during this test programme is summerized in Figure 10.
Table 2. Z axis vibration profiles schedule.
SAE J2380 (Samples 10 to 18)WMG/Millbrook (Samples 19 to 27)
Profile Description and Grms LevelDuration (HH:MM)Profile Description and Grms LevelDuration (HH:MM)
Subject cells to 9 min of Z-axis profile 1 at 1.9 Grms in the vertical orientation of the cells under assessment.00:09Subject cells to 150 h of Z-axis profile in the vertical axis orientation of the cells under assessment. Grms 0.67 for Z-axis.150:00
Subject cells to 5 h and 15 min of Z-axis profile 1 at 0.75 Grms in the vertical axis orientation of the cells under assessment.05:15
Subject cells to 9 min of Z profile 2 at 1.9 Grms in the vertical axis orientation of the cells under assessment.00:09
Subject cells to 5 h and 15 min of Z-axis profile 2 at 0.75 Grms in the vertical axis orientation of the cells under assessment.05:15
Subject cells to 9 min of Z-axis profile 3 at 1.9 Grms in the vertical axis orientation of the cells under assessment.00:09
Subject cells to 5 h and 15 min of Z-axis profile 3 at 0.75 Grms in the vertical axis orientation of the cells under assessment.05:15
Total for Z Axis16:12Total for Z Axis150:00
Table 3. X axis vibration profiles schedule.
SAE J2380 (Samples 10 to 18)WMG/Millbrook (Samples 19 to 27)
Profile Description and Grms LevelDuration (HH:MM) Profile Description and Grms LevelDuration (HH:MM)
Subject cells to 5 min of longitudinal X & Y-axis profile at 1.5 Grms in the X axis orientation of the cells under assessment.00:05Subject cells to 150 h of X-axis profile in the X-axis orientation of the cells under assessment. Grms 0.384 for X-axis.150:00
Subject cells to 19 h of longitudinal X & Y-axis profile at 0.4 Grms in the X axis orientation of the cells under assessment.19:00
Subject cells to 5 min of longitudinal X & Y-axis profile at 1.5 Grms in the X axis orientation of the cells under assessment.00:05
Subject cells to 19 h of longitudinal X & Y-axis profile at 0.4 Grms in the X axis orientation of the cells under assessment.19:00
Total for X Axis38:10Total for X Axis150:00
Table 4. Y axis vibration profiles schedule.
SAE J2380 (Samples 10 to 18)WMG/Millbrook (Samples 19 to 27)
Profile Description and Grms LevelDuration (HH:MM)Profile Description and Grms LevelDuration (HH:MM)
Subject cells to 5 min of longitudinal X & Y-profile at 1.5 Grms in the Y axis orientation of the cells under assessment.00:05Subject cells to 150 h of Y-axis profile in the Y-axis orientation of the cells under assessment. Grms 0.306 for Y-axis.150:00
Subject cells to 19 h of longitudinal X & Y-profile at 0.4 Grms in the Y axis orientation of the cells under assessment.19:00
Subject cells to 5 min of longitudinal X & Y-profile at 1.5 Grms in the Y axis orientation of the cells under assessment.00:05
Subject cells to 19 h of longitudinal X & Y-profile at 0.4 Grms in the Y axis orientation of the cells under assessment.19:00
Total38:10Total150:00
Figure 10. Schematic of test process.
Energies 09 00052 g010

3. Results

3.1. Mechanical Characterization via Natural Frequency Measurements

Table 5 and Table 6 present the natural frequency and amplitude of the first resonant mode of each cell, respectively. The results show that every cell subjected to a vibration ageing profile, irrespective of the type of profile used exhibited a reduction in its natural frequency. Similarly, the amplitude of the first resonant mode is also affected by the vibration ageing cycle.
Table 5. Summary of change in frequency of observed first cell resonance for all test samples.
Sample No. Test Profile SOC% OrientationFirst Natural Frequency Greater Than 2 gn (Hz)
SOT (Hz)EOT (Hz)Percentage Change (%)
10J238025%Z:Z2579187727.2
16J238075%Z:Z3400283416.6
11J238025%Z:X2335203912.7
15J238050%Z:Y320029139.0
14J238050%Z:X318929148.6
18J238075%Z:Y293731657.8
23WMG/MBK50%Z:X196220976.9
17J238075%Z:X194018166.4
13J238050%Z:Z320930116.2
26WMG/MBK75%Z:X335434673.4
27WMG/MBK75%Z:Y370035843.1
21WMG/MBK25%Z:Y306129703.0
25WMG/MBK75%Z:Z318231560.8
19WMG/MBK25%Z:Z364136140.7
22WMG/MBK50%Z:Z370036740.7
24WMG/MBK50%Z:Y306130700.3
12J238025%Z:Y257225790.3
20WMG/MBK25%Z:X369437000.2
SOTEOT
Standard deviation for J2380 samples (Hz)488.77522.61
Mean for J2380 samples (Hz)2817.892572.00
Standard deviation for WMG/MBK samples (Hz)558.97514.99
Mean for WMG/MBK samples (Hz)3261.673259.11
Table 6. Summary of change in amplitude of observed first cell resonance for all test samples.
Sample No. Test Profile SOC (%) OrientationAmplitude of First Natural Frequency Greater Than 2 gn (gn)
SOT (gn)EOT (gn)Percentage Change (%)
25WMG/MBK75%Z:Z1.622.9179.6
18J238075%Z:Y2.954.0135.9
14J238050%Z:X2.891.9034.3
19WMG/MBK25%Z:Z5.033.4631.2
26WMG/MBK75%Z:X2.962.2125.3
27WMG/MBK75%Z:Y4.093.0824.7
10J238025%Z:Z3.322.5124.4
20WMG/MBK25%Z:X4.523.6120.1
23WMG/MBK50%Z:X2.612.3011.9
15J238050%Z:Y2.853.1711.2
12J238025%Z:Y1.991.828.5
22WMG/MBK50%Z:Z3.633.897.2
16J238075%Z:Z3.313.516.0
11J238025%Z:X2.021.915.4
24WMG/MBK50%Z:Y2.802.703.6
17J238075%Z:X1.971.903.6
13J238050%Z:Z2.342.301.7
21WMG/MBK25%Z:Y3.012.961.7
SOTEOT
Standard deviation for J2380 samples (gn)0.550.81
Mean for J2380 samples (gn)2.632.56
Standard deviation for WMG/MBK samples (gn)1.060.57
Mean for WMG/MBK samples (gn)3.363.01
The change in natural frequency was previously attributed to a change in the material properties caused for example by internal cracking, delamination or fracture. The change in the amplitude of the acceleration at the natural frequency was found to indicate a change in the level component damping [12]. As none of the cells experienced any reduction in mass after either of the vibration ageing cycles, these results may indicate a reduction in the internal stiffness of each cell. More specifically, for the cells which underwent the J2380 vibration profiles, the cell orientated along the Z:Z axis and pre-conditioned at 25% SOC exhibited the greatest change in natural frequency, 27.2%. Likewise, the cell orientated along the Z:Y axis and pre-conditioned at 25% SOC exhibited the least change in natural frequency, 0.3%. In addition, it was observed that the cell positioned along the Z:Y axis and pre-conditioned at 75% SOC and the cell positioned along the Z:Z axis and pre-conditioned to 50% SOC showed the greatest and least change in amplitude, 35.9% and 1.7%, respectively. For the cells that underwent the WMG/MBK vibration profile, the cell placed along the Z:Z axis and pre-conditioned at 50% SOC exhibited the greatest change in natural frequency, 6.9%. Similarly, the cell orientated along the Z:X axis and pre-conditioned at 25% SOC exhibited the least change in natural frequency, 0.2%. Table 5 also shows that the shift in resonance frequency for the cells which underwent the WMG/MBK vibration profile is less pronounced than that observed for cells subjected to the J2380 vibration profile. Furthermore, the cell positioned along the Z:Z axis and pre-conditioned at 75% SOC and the cell positioned along the Z:Y axis and pre‑conditioned to 25% SOC showed the greatest and least change in amplitude, 79.6% and 1.7%, respectively. The effect of cell orientation and cell SOC on the resonance frequency and the amplitude of the cells that underwent the J2380 and WMG/MBK vibration ageing cycles are summarized in Table 7 and Table 8, respectively.
The data shows that the overall rankings for cell orientation and SOC are in reverse order when comparing both parameters. However, a larger spread of measurements for the change in amplitude of the first resonance than for the change in natural frequency can be observed. This may indicate that there are limitations in the measurement method employed to record these parameters. These may include the accuracy of the attachment of accelerometers to the cells or the amount of Petro wax used to attach the accelerometers to the cells. Equally, it may indicate an actual change in material properties. A more conclusive analysis that aims to determine the root cause of the results is discussed in Section 5.
Table 7. Assessment ranking of orientation by test.
AssessmentTestOrientation Ranking by Assessment and Test Profile
Least Change Energies 09 00052 i001Greatest Change
Electrical characterization
Pulse powerJ2380Z:ZZ:XZ:Y
WMG/MBKZ:YZ:XZ:Z
EIS (Ro)J2380Z:ZZ:XZ:Y
WMG/MBKZ:YZ:XZ:Z
EIS (RCT)J2380Z:ZZ:YZ:X
WMG/MBKZ:ZZ:XZ:Y
OCVJ2380Z:ZZ:XZ:Y
WMG/MBKZ:XZ:YZ:Z
Capacity—1C dischargeJ2380Z:XZ:YZ:Z
WMG/MBKZ:YZ:XZ:Z
Mechanical characterization
Resonance (change in frequency)J2380Z:YZ:XZ:Z
WMG/MBKZ:ZZ:XZ:Y
Resonance (change in amplitude)J2380Z:ZZ:XZ:Y
WMG/MBKZ:YZ:XZ:Z
Table 8. Assessment ranking of state of charge (SOC) by test.
AssessmentTestSOC Ranking by Assessment and Test Profile
Least Change Energies 09 00052 i001Greatest Change
Electrical characterization
Pulse powerJ238050%25%75%
WMG/MBK75%50%25%
EIS (Ro)J238025%50%75%
WMG/MBK50%75%25%
EIS (RCT)J238025%50%75%
WMG/MBK75%25%50%
OCVJ238050% = 25%75%
WMG/MBK25%75%50%
Capacity—1C dischargeJ238025%50%75%
WMG/MBK50%75%25%
Mechanical characterization
Resonance (change in frequency)J238050%75%25%
WMG/MBK25%75%50%
Resonance (change in amplitude)J238025%75%50%
WMG/MBK50%25%75%

3.2. Visual Inspection

At EOT, irrespective of the vibration profile, cell orientation or cell SOC, no mechanical damage was observed for any of the samples tested. None of the cells showed any change in dimensionality, leaked electrolyte or showed any sign of external fatigue (e.g., cracking). The one exception to this was a small external irregularity, approximately 3 mm in length, noted on the surface of cell sample 16, outside of the clamped area. It is believed that this is a manufacturing defect in the cell casing as the defect is not conducive to damage caused by excessive clamping loading.

3.3. Electrical Characterization

3.3.1. 1C Discharge Capacity

Table 9 presents the 1C discharge capacity for each cell at SOT and EOT. The results show a tendency for samples orientated in the Z:Z axis and pre-conditioned to 50% and 75% SOC to exhibit a higher capacity fade than other samples. The effect of cell orientation and cell SOC on the cell capacity for the cells which underwent the J2380 and WMG/MBK vibration ageing cycles are summarized in Table 7 and Table 8, respectively.
Table 9. Summary of change in 1C discharge capacity performance of all test cells.
Sample No.Test ProfileSOC (%)OrientationCell Capacity at SOT (Ah)Cell Capacity at EOT (Ah)Percentage Change in Ah (%)
16J238075%Z:Z2.211.94−12.22
18J238075%Z:Y2.212.06−6.79
22WMG/MBK50%Z:Z2.182.08−4.59
11J238025%Z:X2.152.10−2.33
15J238050%Z:Y2.182.14−1.83
13J238050%Z:Z2.232.19−1.79
26WMG/MBK75%Z:X2.102.07−1.43
17J238075%Z:X2.152.13−0.93
20WMG/MBK25%Z:X2.122.120.00
19WMG/MBK25%Z:Z2.112.110.00
21WMG/MBK25%Z:Y2.092.090.00
10J238025%Z:Z2.192.190.00
27WMG/MBK75%Z:Y2.092.090.00
12J238025%Z:Y2.182.190.46
14J238050%Z:X2.152.170.93
25WMG/MBK75%Z:Z2.072.101.45
23WMG/MBK50%Z:X2.052.133.90
24WMG/MBK50%Z:Y1.922.1210.42
8J238075%Control2.162.06−4.63
2J238025%Control2.202.13−3.18
9WMG/MBK75%Control2.132.12−0.47
3WMG/MBK25%Control2.142.140.00
5J238050%Control2.182.190.46
6WMG/MBK50%Control1.922.098.85
SOTEOT
Standard deviation for J2380 samples (Ah)0.030.08
Mean for J2380 samples (Ah)2.182.12
Standard deviation for WMG/MBK samples (Ah)0.070.02
Mean for WMG/MBK samples (Ah)2.082.10

3.3.2. Pulse Power Performance

Table 10 presents the DC resistance of the cells at SOT and EOT. It can be seen that irrespective of the vibration profile employed (including variations in cell SOC and orientation) each cell exhibits an increase in internal resistance. As discussed within [24], this potentially indicates a reduction in contact area within the current collectors or possible internal fatigue of components within the cell due to the mechanical load.
Sample 16 displays the greatest variation in resistance with a 128.1% increase from SOT to EOT. Conversely, sample 27 shows the least amount of increase (17.4%). Interestingly, both cells were pre-conditioned to 75% SOC. However; the vibration profiles employed were different, as was their respective orientation when mechanically loaded. Similarly, nine out of 10 of the cells that exhibit the greatest rise in resistance were pre-conditioned to either 25% or 75% SOC. This result correlates well with Section 3.3.1, that identified the same trend between cell SOC.
Table 10. Summary of change in pulse power performance resistance.
Sample No.Test ProfileSOC (%)OrientationDC Resistance (SOT) (mΩ)DC Resistance (EOT) (mΩ)Percentage Change in DC Resistance between SOT and EOT (%)
16J238075%Z:Z74.32169.55128.1
17J238075%Z:X73.41162.50121.4
12J238025%Z:Y72.73151.59108.4
20WMG/MBK25%Z:X72.27142.9597.8
25WMG/MBK75%Z:Z73.18142.9595.3
15J238050%Z:Y71.82138.1892.4
11J238025%Z:X72.27131.8282.4
18J238075%Z:Y73.18131.3679.5
19WMG/MBK25%Z:Z72.27126.5975.2
21WMG/MBK25%Z:Y72.05121.3668.5
10J238025%Z:Z71.14117.0564.5
14J238050%Z:X72.73116.3660.0
22WMG/MBK50%Z:Z72.73115.0058.1
24WMG/MBK50%Z:Y72.05109.3251.7
13J238050%Z:Z70.45102.2745.2
23WMG/MBK50%Z:X71.8293.6430.4
26WMG/MBK75%Z:X73.6490.0022.2
27WMG/MBK75%Z:Y73.1885.9117.4
5J238050%Control75.2386.1414.5
2J238025%Control72.2773.641.9
3WMG/MBK25%Control71.1471.821.0
6WMG/MBK50%Control72.0572.050.0
9WMG/MBK75%Control73.1872.73−0.6
8J238075%Control74.0973.41−0.9
SOTEOT
Standard deviation for J2380 samples (mΩ)1.1922.35
Mean for J2380 samples (mΩ)72.45135.63
Standard deviation for WMG/MBK samples (mΩ)0.6321.48
Mean for WMG/MBK samples (mΩ)72.58114.19
For the cells that underwent the J2380 vibration profile, the cell orientated along the Z:Z axis and pre-conditioned at 75% SOC exhibited the greatest change in DC resistance, 128.1%. Likewise, the cell orientated along the Z:Z axis and pre-conditioned at 50% SOC exhibited the least change in DC resistance, 17.4%. Moreover, for the cells which underwent the WMG/MBK vibration profile, the cell placed along the Z:X axis and pre-conditioned at 25% SOC exhibited the greatest change in DC resistance, 97.8%. Similarly, the cell orientated along the Z:Y axis and pre-conditioned at 75% SOC exhibited the least change in DC resistance, 45.2%. The effect of cell orientation and cell SOC on the cell DC resistance for the cells which underwent the J2380 and WMG/MBK vibration ageing cycles are summarized in Table 7 and Table 8.

3.3.3. OCV

Table 11 presents the measured OCV for each cell both at SOT and EOT. None of the tested cells displayed any significant change in OCV, irrespective of the vibration profile, the cell SOC or cell orientation employed. The voltage difference recorded is within the tolerance of the error of the equipment. This supports the results presented in [33,34] that also noted that OCV is not adversely affected by vibration loading.
Table 11. Start and end of test open-circuit voltage (OCV) measurements of all cells evaluated.
Sample No. Test Profile SOC OrientationVoltage (V)
SOTEOTPercentage Change (%)
27WMG/MBK75%Z:Y3.8823.8910.23
24WMG/MBK50%Z:Y3.6583.6660.22
25WMG/MBK75%Z:Z3.8783.8850.18
22WMG/MBK50%Z:Z3.6633.6700.19
23WMG/MBK50%Z:X3.6613.6680.19
3WMG/MBK25%Control3.5883.5950.2
19WMG/MBK25%Z:Z3.5843.5900.17
20WMG/MBK25%Z:X3.5873.5900.08
26WMG/MBK75%Z:X3.8833.8860.08
18J238075%Z:Y3.8973.8990.05
5J238050%Control3.6783.6760.05
21WMG/MBK25%Z:Y3.5813.5800.03
16J238075%Z:Z3.8943.8950.03
17J238075%Z:X3.8953.8960.03
2J238025%Control3.5993.5980.03
15J238050%Z:Y3.6743.6750.03
6WMG/MBK50%Control3.6683.6690.03
11J238025%Z:X3.5913.5900.03
8J238075%Control3.8973.8970
9WMG/MBK75%Control3.8893.8890
13J238050%Z:Z3.6743.6740
14J238050%Z:X3.6743.6740
10J238025%Z:Z3.5993.5990
12J238025%Z:Y3.5983.5980
SOTEOT
Standard deviation for J2380 samples (V)0.130.14
Mean for J2380 samples (V)3.723.72
Standard deviation for WMG/MBK samples (V)0.130.13
Mean for WMG/MBK samples (V)3.713.71

3.3.4. EIS

Table 12 and Table 13 show the ohmic resistance (Ro) and the charge transfer resistance (RCT) of the cells at SOT and EOT as measured by EIS. In addition, comparing Table 10 and Table 12, it can be seen that the increase in RDC of the cell is accompanied by an increase in Ro. Though the magnitude may differ from one technique to another, this concurs with the origin of these parameters. A complete explanation of EIS results is beyond the scope of this study and is already well documented in a number of academic and educational texts [55,56]. Figure 11 presents typical Nyquist plot of the cells pre and post vibration test.
Figure 11. Typical electrochemical impedance spectroscopy (EIS) pre and post test results.
Energies 09 00052 g011
Table 12. electrochemical impedance spectroscopy (EIS) ohmic resistance (Ro) results for all tested samples.
Sample No.Test ProfileSOCOrientationSOT (mΩ)EOT (mΩ)Percentage Change (%)
16J238075%Z:Z***
19WMG/MBK25%Z:Z46.7167.1257.82
15J238050%Z:Y46.4164.5254.53
25WMG/MBK75%Z:Z46.8155.0231.20
20WMG/MBK25%Z:X46.9153.5227.29
17J238075%Z:X46.2143.1209.74
18J238075%Z:Y46.5141.2203.66
12J238025%Z:Y47.7135.5184.07
11J238025%Z:X46.9126.0168.66
26WMG/MBK75%Z:X47.0114.3143.19
14J238050%Z:X47.3114.2141.44
21WMG/MBK25%Z:Y46.1102.2121.69
23WMG/MBK50%Z:X46.490.093.97
10J238025%Z:Z45.986.989.00
13J238050%Z:Z46.084.082.61
22WMG/MBK50%Z:Z50.084.969.80
24WMG/MBK50%Z:Y46.866.842.74
27WMG/MBK75%Z:Y47.064.938.09
5J238050%Control49.660.822.58
2J238025%Control46.249.36.71
9WMG/MBK75%Control46.347.52.60
3WMG/MBK25%Control46.747.31.40
6WMG/MBK50%Control46.246.81.30
8J238075%Control47.547.50.00
SOTEOT
Standard deviation for J2380 samples (mΩ)0.6428.05
Mean for J2380 samples (mΩ)46.61124.43
Standard deviation for WMG/MBK samples (mΩ)1.1339.02
Mean for WMG/MBK samples (mΩ)47.08110.97
* = No data available due to cell issue.
Table 13. EIS charge transfer resistance (RCT) results for all tested samples.
Sample No.Test ProfileSOCOrientationSOT (mΩ)EOT (mΩ)Percentage Change (%)
16J238075%Z:Z***
18J238075%Z:Y23.9015.5035.15
21WMG/MBK25%Z:Y24.0815.7534.59
22WMG/MBK50%Z:Z24.5016.1034.29
23WMG/MBK50%Z:X23.7315.7333.71
24WMG/MBK50%Z:Y23.9016.0632.80
19WMG/MBK25%Z:Z22.4315.6730.14
17J238075%Z:X24.5017.5028.57
20WMG/MBK25%Z:X21.6415.4728.51
26WMG/MBK75%Z:X22.9016.4328.25
27WMG/MBK75%Z:Y22.5616.2028.19
14J238050%Z:X24.7018.2026.32
13J238050%Z:Z23.1017.4024.68
15J238050%Z:Y23.7018.0024.05
25WMG/MBK75%Z:Z21.5016.5123.21
10J238025%Z:Z23.7218.7021.16
11J238025%Z:X23.0018.2320.74
12J238025%Z:Y22.8019.1016.23
9WMG/MBK75%Control28.8916.3843.30
2J238025%Control28.8016.7042.01
6WMG/MBK50%Control25.4415.7338.17
8J238075%Control24.6015.7036.18
3WMG/MBK25%Control22.5115.2532.25
5J238050%Control24.4017.5028.28
SOTEOT
Standard deviation for J2380 samples (mΩ)1.150.91
Mean for J2380 samples (mΩ)23.0416.40
Standard deviation for WMG/MBK samples (mΩ)0.701.36
Mean for WMG/MBK samples (mΩ)23.5917.27
* = No data available due to cell issue.
Table 12 highlights that irrespective of the vibration profile, SOC or cell orientation, all the cells exhibit a significant increase in Ro at EOT. For the cells that underwent the J2380 vibration profile, the cell orientated along the Z:Y axis and pre-conditioned at 50% SOC exhibited the greatest change in Ro, 254.53%. Moreover, the cell orientated along the Z:Z axis and pre-conditioned at 50% SOC exhibited the least change in Ro, 82.61%. Similarly, for the cells that underwent the WMG/MBK vibration profile, the cell positioned along the Z:Z axis and pre-conditioned at 25% SOC exhibited the greatest change in Ro, 257.82%. Likewise, the cell placed along the Z:Y axis and pre-conditioned at 75% SOC exhibited the least change in Ro, 38.09%. The increase in Ro was found to originate from an increase in cell contact resistance or delamination of the material layers [55,56]. Post vibration, it was observed that cell sample 16 could not undergo an EIS procedure. This is assumed to relate to internal fatigue damage within the cell. Further investigation into the exact nature of the failure mode, is beyond the scope of this study, but is discussed further in Section 5.
Table 13 shows that all cells that underwent vibration testing show a similar decrease in Rct as the control samples. Consequently, it suggests that this parameter is unaffected by vibration. The effect of cell orientation and SOC on the measured values of Ro and Rct is summarized in Table 7 and Table 8 respectively.

4. Discussion

The primary conclusion from this study is that both the electrical performance and the mechanical properties of the Li-ion cells are affected by exposure to vibration energy that is commensurate with a typical vehicle life. Experimental data suggests that the rate of degradation is not uniform and varies considerably with respect to cell SOC and orientation to the applied axis of vibration. Further, this investigation highlights that even cells that have comparable characteristics at SOT, key measure of performance, such as impedance, diverge considerably after the application of vibration energy. However, the results do not show a consistent trend. Consequently at this stage of the research, the magnitude and spread of that performance change is unpredictable. This is highlighted by Table 14.
Table 14. Comparison of cell performance ranking by post-test assessment.
Sample No. Test Profile SOC Orien -tationElectrical CharacterizationMechanical Characterization
Pulse PowerEIS: RoEIS: RCTOCVCapacityResonance FrequencyResonance Amplitude
10J238025%Z:Z111416151217
11J238025%Z:X7917134314
12J238025%Z:Y381815141711
13J238050%Z:Z151513156917
14J238050%Z:X121112151553
15J238050%Z:Y6314135410
16J238075%Z:Z111101213
17J238075%Z:X268108816
18J238075%Z:Y8729262
19WMG/MBK25%Z:Z927610144
20WMG/MBK25%Z:X45979188
21WMG/MBK25%Z:Y1012310111218
22WMG/MBK50%Z:Z13164331512
23WMG/MBK50%Z:X1613531779
24WMG/MBK50%Z:Y141762181615
25WMG/MBK75%Z:Z5415316131
26WMG/MBK75%Z:X17101077105
27WMG/MBK75%Z:Y181811113116
Ranking Key:
Greatest reduction in performance Least reduction in performance
123456789101112131415161718
The table shows that a series of complex interactions are potentially triggered whilst the cells are undergoing a vibration load that activates several failure modes and/or degradation mechanisms. The implications of these observations are further explored in Section 5. The remainder of this section discusses further the results obtained and highlights the implications of this research for the design of a RESS for future EV applications.

4.1. Impact of Cell Orientation

Table 7 collates the electromechanical EOT results and highlights, for each test-type, the individual cell ranking with respect to effect of vibration cycle on cell orientation. For cells subjected to the J2380 vibration profiles, the greatest overall change in electrical performance was experienced by the cell placed in the Z:Y orientation. Similarly, for the WMG/MBK dataset, the results suggest that cells orientated in the Z:Z axis experienced the greatest overall amount of electrical performance degradation. This cell behavior is also shown in the amplitude of the first resonance frequency. However, it is not present in the shift of the natural frequency of the cells. The differences in cell behavior, when exposed to the different vibration profiles, may be attributed to the difference in acceleration levels within the profiles. This in turn is related to the amount of time compression applied to synthesis the vibration standard from measured vehicle data [36]. The evidence tends to suggest that a correlation may exist between electrical performance degradation and a change in the mechanical properties of the cell post vibration.
In relation to the study discussed in [24] the WMG/MBK tested samples correlated well with the orientation conclusion from this study in that samples oriented in the Z:Z axis displayed a greater amount of performance decrease. However it must be noted, that the samples within [24] only accumulated vibration in one axis throughout the whole test, when this study has applied vibration in all three axis of the cell in a sequential fashion and therefore is more representative of the accumulation of damage that an automotive battery cell would achieve. This sequential axis vibration damage accumulation may also explain why the horizontally oriented samples in [24] were relatively unaffected by the application of vibration.

4.2. Impact of Cell State of Charge

Table 8 collates the electromechanical EOT results and presents the ranking with respect to the different values of SOC used to pre-condition each cell prior to subjecting them to the different vibration excitations. The results for the J2380 vibration profile show that the cells pre-conditioned to 75% SOC experienced the greatest level electrical performance degradation. Similarly, the results obtained from the WMG/MBK profile highlight that the cells pre-conditioned to 25% SOC displayed the greatest electrical performance degradation. Conversely, the cells pre-conditioned to 50% SOC exhibited the lowest levels of electrical performance degradation. It has previously been shown that a potential reason for this difference can be attributed to the changes that occur within the mechanical structure of the cell at the different levels of SOC [57,58]. However Table 14 indicates that no correlation can be established between the measured data for changes in mechanical properties and the degradation in electrical performance post vibration testing. This initial conclusion is supported by related research that reported the difficulty in correlating electromechanical ageing mechanisms [24,58,59,60,61,62].

4.3. Implications for Vehicle Design

The results from this study show that both the electrical performance and the mechanical properties of Li-ion cells can be affected by exposing the cell to vibration energy that is representative of a typical vehicle life. Whilst this is evident from the data presented, the underlying causality is not yet clear. As a result, it is not possible to quantify the relationship that defines cell ageing caused by vibration excitation. Irrespective of this limitation, both the electrical and mechanical data show that cells subject to vibration have a much greater spread in the internal resistance, energy capacity and natural frequency. Managing this diversity may potentially drive further complexity in the systems engineering functions required to scale individual cells into a complete RESS. A number of articles discuss the need to minimize cell-to-cell variations within the system as a mean to reduce the differential current flows and heat generation with the pack. This research highlights that even for a RESS that is initially well designed; the impact of vibration-induced ageing may require greater levels of cell balancing and thermal management.
The results summarized in Table 7, Table 8 and Table 14 highlight that both the SOC and orientation are as important parameters to consider when designing a RESS as the contribution of the vibration induced profile. It is expected that variations in SOC within the RESS will be observed, especially for an EV, where a large depth of discharge (DOD) is required to maximize vehicle range. Consequently, SOC may be a parameter that engineers consider more greatly than orientation. However, to maximize the volumetric energy density and minimize the footprint of the RESS, engineers may need to account for the impact of cell orientation on the performance of the RESS. Consequently, the authors suggest that as part of the technology selection process, OEMs should study the susceptibility of the chosen cells to mechanically induced vibration profiles at different SOC and cell orientation to mitigate their effects through improved system design.

5. Further Work

One of the limitations of the methodology employed within this study is that electrical and mechanical characterization data was only measured at SOT and EOT. As a result, no discussion or conclusions can be made about the rate of degradation throughout the vehicle’s life. It is recommended that a future study should characterize the cells at intermediate points during the test programme, e.g., intervals representative of 10,000 miles of vehicle use. This would facilitate further investigation into both the absolute value of degradation, but also the expected in-service rate of capacity and power fade over the life of the vehicle.
The experimental approach may also be improved, by revising the derivation of the vibration profile employed to exercise the cells. Both the J2380 standard and the WMG/MBK profiles are derived from real-world automotive data. Derivation of the WMG/MBK profile, as discussed within [36,37], used vibration data recorded directly from the battery packs of commercially available EVs. This vibration may not however directly correlate to that observed within the battery assembly, since cell restraints and packaging may induce further resonant modes and damping. Further research should measure directly the in-pack vibration. If significant differences exist between this data and that recorded externally to the vehicle RESS, then a new durability profile should be synthesized and the research repeated.
The results collected from this study imply that the rate of cell degradation is not uniform and varies considerably with cell orientation (relative to the axis of vibration) and SOC. However, given the limited dataset employed for this initial study, definitive conclusions regarding the underlying causality between the different ageing mechanisms cannot be made. The authors believe that these initial results warrant further research. Firstly, using novel cell imaging and autopsy methods, as discussed within [24], to better quantify the changes that occur within the material composition and structure of the cell post vibration. Secondly, to reduce the potential impact of cell-to-cell variations, by expanding the scope of the experimental study to encompass a greater number of cells of a given type. Expanding the experimental programme should also include using cells from a broader cross-section of manufacturers and chemistries. This will identify if the experimental results presented here are transferable to other cell technologies.
Due to the equipment availability at the time of testing, the experiment was conducted using a single axis EMS. As a result, the cells were not tested with respect to gravity. This could have caused unrepresentative loading due to the effects of mass loading associated with rotating the samples on the durability fixture. It is therefore recommended that a future experiment is conducted using either a multi-axis shaker table or single axis EMS with slip table capability so that the samples are evaluated with respect to gravity.

6. Conclusions

Both vibration profiles synthesized to represent 100,000 miles of vehicle operation resulted in a performance decrease within the tested Samsung 2.2 Ah 18650 cells. However the two different vibration profiles of SAE J2380 and WMG/MBK resulted in two different results with respect to the effect of SOC and cell orientation. Of the samples evaluated to SAE J2380, cells in the Z:Z orientation displayed the least amount of degradation, whilst cells in the Z:Y orientation displayed the greatest. Whilst samples evaluated to the Z:X and Z:Z orientation displayed the least and greatest amount of degradation when exposed to the WMG/MBK profile, respectively. Of the samples evaluated to SAE J2380, items conditioned to 75% SOC displayed the greatest degradation, whilst WMG/MBK, items conditioned to 25% SOC displayed the greatest degradation. Samples conditioned to 50% SOC typically displayed the least degradation regardless of the test profile.
In conclusion, the experimental results presented highlight the potential for key electrical and mechanical properties within the cell to diverge, over time, due to the application of vibration energy that is consummate with a typical road vehicle life. Unless this phenomenon is well understood at the design stage of the vehicle, it may drive further complexity into design of the RESS in addition to causing in-service warranty claims. At this stage, the underlying causality between the application of vibration energy and cell SOC and orientation are not fully understood. Defining these relationships is the focus of on-going research within the University. For example; by using novel cell imaging and autopsy methods to quantify changes in material composition and structure. Expanding the experimental programme to also include cells of different form-factor and chemistry will identify if the experimental results presented here are transferable to other cell technologies.

Acknowledgments

The research presented within this paper is supported by the Engineering and Physical Science Research Council (EPSRC—EP/I01585X/1) through the Engineering Doctoral Centre in High Value, Low Environmental Impact Manufacturing. The research was undertaken in collaboration with the WMG Centre High Value Manufacturing Catapult (funded by Innovate UK) and Jaguar Land Rover. The authors would also like to express their gratitude to Millbrook Proving Ground Ltd. (Component Test Laboratory) fortheir support and advice throughout the test program.

Author Contributions

James Michael Hooper—Primary researcher and lead author. James Marco—Academic research supervision and co-author. Gael Henri Chouchelamane—Experimental researcher (electrical characterisation) and co-author. Christopher Lyness—Industrial research support and peer-review.

Conflicts of Interest

The authors declare no conflict of interest.

References

  1. Jackson, N. Technology road map, R & D agenda and UK capabilities. In Cenex Low Carbon Vehicle Show 2010; Automotive Council UK: Bedford, UK, 2010; pp. 1–16. [Google Scholar]
  2. Parry-Jones, R. Driving Success—A Strategy for Growth and Sustainability in the UK Automotive Sector; Automotive Council UK: London, UK, 2013; pp. 1–87. [Google Scholar]
  3. Day, J. Johnson Controls’ Lithium-Ion Batteries Power Jaguar Land Rover’s 2014 Hybrid Range Rover. Available online: http://johndayautomotivelectronics.com/johnson-controls-lithium-ion-batteries-power-2014-hybrid-range-rover/ (accessed on 17 February 2015).
  4. Rawlinson, P.D. Integration System for a Vehicle Battery Pack. U.S. Patent 20120160583 A1, 28 June 2012. [Google Scholar]
  5. Berdichevsky, G.; Kelty, K.; Straubel, J.; Toomre, E. The Tesla Roadster Battery System; Tesla Motors: Palo Alto, CA, USA, 2007; pp. 1–5. [Google Scholar]
  6. Kelty, K. Tesla—The Battery Technology behind the Wheel; Tesla Motors: Palo Alto, CA, USA, 2008; pp. 1–41. [Google Scholar]
  7. Paterson, A. Our Guide to Batteries; Axeon: Aberdeen, UK, 2012; pp. 1–22. [Google Scholar]
  8. Anderman, M. Tesla Motors: Battery Technology, Analysis of the Gigafactory, and the Automakers’ Perspectives; The Tesla Battery Report; Advanced Automotive Batteries: Oregon House, CA, USA, 2014; pp. 1–39. [Google Scholar]
  9. Karbassian, A.; Bonathan, D.P. Accelerated Vibration Durability Testing of a Pickup Truck Rear Bed; 2009-01-1406; SAE International: Warrendale, PA, USA, 2009; pp. 1–5. [Google Scholar]
  10. Risam, G.S.; Balakrishnan, S.; Patil, M.G.; Kharul, R.; Antonio, S. Methodology for Accelerated Vibration Durability Test on Electrodynamic Shaker; 2006-32-0081; SAE International: Warrendale, PA, USA, 2006; Volume 1, pp. 1–9. [Google Scholar]
  11. Harrison, T. An Introduction to Vibration Testing; Bruel and Kjaer Sound and Vibration Measurement: Naerum, Denmark, 2014; p. 11. [Google Scholar]
  12. Hooper, J.; Marco, J. Experimental modal analysis of lithium-ion pouch cells. J. Power Sources 2015, 285, 247–259. [Google Scholar] [CrossRef]
  13. Moon, S.I.; Cho, I.J.; Yoon, D. Fatigue life evaluation of mechanical components using vibration fatigue analysis technique. J. Mech. Sci. Technol. 2011, 25, 611–637. [Google Scholar] [CrossRef]
  14. Halfpenny, A.; Hayes, D. Fatigue Analysis of Seam Welded Structures Using Ncode Designlife; nCode: Ahmedabad, India, 2010; pp. 1–21. [Google Scholar]
  15. Halfpenny, A. Methods for accelerating dynamic durability tests. In Proceedings of the 9th International Conference on Recent Advances in Structural Dynamics, Southampton, UK, 17–19 July 2006; pp. 1–19.
  16. Avdeev, I.; Gilaki, M. Structural analysis and experimental characterization of cylindrical lithium-ion battery cells subject to lateral impact. J. Power Sources 2014, 271, 382–391. [Google Scholar] [CrossRef]
  17. Zhang, X.; Wierzbicki, T. Characterization of plasticity and fracture of shell casing of lithium-ion cylindrical battery. J. Power Sources 2015, 280, 47–56. [Google Scholar] [CrossRef]
  18. Choi, H.Y.; Lee, J.S.; Kim, Y.M.; Kim, H. A Study on Mechanical Characteristics of Lithium-Polymer Pouch Cell Battery for Electrci Vehicle; 13-0115; Hongik University: Seoul, Korea, 2013; pp. 1–10. [Google Scholar]
  19. Berla, L.; Lee, S.W.; Cui, Y.; Nix, W. Mechanical behavior of electrochemically lithiated silicon. J. Power Sources 2015, 273, 41–51. [Google Scholar] [CrossRef]
  20. Greve, L.; Fehrenbach, C. Mechanical testing and macro-mechanical finite element simulation of the deformation, fracture, and short circuit initiation of cylindrical lithium ion battery cells. J. Power Sources 2012, 214, 377–385. [Google Scholar] [CrossRef]
  21. Oh, K.-Y.; Siegel, J.; Secondo, L.; Kim, S.U.; Samad, N.; Qin, J.; Anderson, D.; Garikipati, K.; Knobloch, A.; Epureanu, B.; et al. Rate dependence of swelling in lithium-ion cells. J. Power Sources 2014, 267, 197–202. [Google Scholar] [CrossRef]
  22. Sahraei, E.; Meiera, J.; Wierzbicki, T. Characterizing and modeling mechanical properties and onset of short circuit for three types of lithium-ion pouch cells. J. Power Sources 2014, 247, 503–516. [Google Scholar] [CrossRef]
  23. Feng, X.; Sun, J.; Ouyang, M.; Wang, F.; He, X.; Lu, L.; Peng, H. Characterization of penetration induced thermal runaway propagation process within a large format lithium ion battery module. J. Power Sources 2015, 275, 261–273. [Google Scholar] [CrossRef]
  24. Brand, M.; Schuster, S.; Bach, T.; Fleder, E.; Stelz, M.; Glaser, S.; Muller, J.; Sextl, G.; Jossen, A. Effects of vibrations and shocks on lithium-ion cells. J. Power Sources 2015, 288, 62–69. [Google Scholar] [CrossRef]
  25. Liu, X.; Stoliarov, S.; Denlinger, M.; Masias, A.; Snyder, K. Comprehensive calorimetry of the thermally-induced failure of a lithium ion battery. J. Power Sources 2015, 280, 516–525. [Google Scholar] [CrossRef]
  26. Spinner, N.; Field, C.; Hammond, M.; Williams, B.; Myers, K.; Lubrano, A.; Rose-Pehrsson, S.; Tuttle, S. Physical and chemical analysis of lithium-ion battery cell-to-cell failure events inside custom fire chamber. J. Power Sources 2015, 279, 713–721. [Google Scholar] [CrossRef]
  27. Nations, U. ECE R100—Battery Electric Vehicles with Regard to Specific Requirements for the Construction, Functional Safety and Hydrogen; United Nations: Lake Success, NY, USA, 2002. [Google Scholar]
  28. Economic Commission for Europe (ECE). Proposal for the 02 Series of Amendments to Regulation; No. 100 (Battery Electric Vehicle Safety), ECE/TRANS/WP.29/2012/102; United Nations Economic and Social Council: New York, NY, USA, 2013; pp. 1–54. [Google Scholar]
  29. The Tests Explained. Available online: http://www.euroncap.com/testprocedures.aspx (accessed on 9 February 2015).
  30. Nations, U. Transport of Dangerous Goods—Manual of Tests and Criteria, 5th ed.; Amendment 1; United Nations: Lake Success, NY, USA, 2011; p. 62. [Google Scholar]
  31. Pohl, D. Lithium iron phospahate: What factors influence the durability of storage systems. In Solar Energy Storage; Levran, A., Ed.; EES International: Pforzheim, Germany, 2014; Volume 2015, pp. 1–3. [Google Scholar]
  32. Suttman, A. Lithium Ion Battery Aging Experiments and Algorithm Development for Life Estimation; The Ohio State University: Columbus, OH, USA, 2011. [Google Scholar]
  33. Chapin, J.T.; Alvin, W.; Carl, W. Study of Aging Effects on Safety of 18650-Type Licoox Cells; Underwriters Laboratory Inc.: Northbrook, IL, USA, 2011. [Google Scholar]
  34. Wu, A. Study on Aging Effects on Safety of 18650 Type Licoox Cells; Product Safety Engineering Society: Austin, TX, USA, 2012. [Google Scholar]
  35. Svens, P. Methods for Testing and Analyzing Lithium-Ion Battery Cells Intended for Heavy-Duty Hybrid Electric Vehicles; KTH Royal Institute of Technology: Stockholm, Sweden, 2014. [Google Scholar]
  36. Hooper, J. Study into the Vibration Inputs of Electric Vehicle Batteries; Cranfield University: Cranfield, UK, 2012. [Google Scholar]
  37. Hooper, J.; Marco, J. Characterising the in-vehicle vibration inputs to the high voltage battery of an electric vehicle. J. Power Sources 2014, 245, 510–519. [Google Scholar] [CrossRef]
  38. Hooper, J.; Marco, J. Understanding vibration frequencies experienced by electric vehicle batteries. In Proceedings of the 4th Hybrid and Electric Vehicles Conference (HEVC 2013), London, UK, 6–7 November 2013; IET: London, UK, 2013; pp. 1–6. [Google Scholar]
  39. Kaw, A. Mechanics of Composite Materials, 2nd ed.; CRC Press: Boca Raton, FL, USA, 2006; p. 475. [Google Scholar]
  40. Buckley, K.; Chiang, L. Design Principles for Vibration Test Fixtures; MIT Lincoln Laboratory: Lexington, MA, USA, 2011; pp. 1–12. [Google Scholar]
  41. Coe, S. Fixtures for Vibration Testing; Data Physics: Hailsham, UK, 2013; pp. 1–47. [Google Scholar]
  42. Harrison, T. Resonance; Bruel and Kjaer: Naerum, Denmark, 2014; Volume 5, p. 11. [Google Scholar]
  43. Harrison, T. A practical Guide to Vibration Testing; Brüel & Kjær Royston: Hertfordshire, UK, 2014; p. 11. [Google Scholar]
  44. The British Standards Institution (BSI). BS EN 60068 Environmental Testing; BSI: London, UK, 2008. [Google Scholar]
  45. Reddy, T.S.; Reddy, K.V.K. Design and analysis of vibration test bed fixtures for space launch vehicles. Indian J. Sci. Technol. 2010, 3, 592–595. [Google Scholar]
  46. Harrison, T. Basic Fixture Design; Bruel and Kjaer: Naerum, Denmark, 2014; Volume 12, p. 15. [Google Scholar]
  47. Avitabile, P. Why you can’t ignore those vibration fixture resonances. Sound Vib. 1999, 3, 20–26. [Google Scholar]
  48. National Aeronautics and Space Administration (NASA). General Environmental Verfication Standard (GEVS)—For GSFC Flight Programs and Projects; NASA: NASA Goddard Space Flight Centre: Greenbelt, MD, USA, 2013. [Google Scholar]
  49. United States Department of Defence. MIL-STD-810f; United States Department of Defence: Fort Belvoir, VA, USA, 2000; pp. 1–539.
  50. Ministry of Defence (MoD). Ministary of Defence Standard 00-35, Environmental Handbook for Defence Materiel, Part 3; Ministry of Defence: Glasgow, UK, 2006.
  51. Harrison, T. Random Vibration Theory; Bruel and Kjaer Sound and Vibration Measurement: Naerum, Denmark, 2014. [Google Scholar]
  52. Barai, A.; Chouchelamane, G.H.; Guo, Y.; McGordon, A.; Jennings, P. A study on the impact of lithium-ion cell relaxation on electrochemical impedance spectroscopy. J. Power Sources 2015, 280, 74–80. [Google Scholar] [CrossRef]
  53. Coe, S. Vibration and Signal Processing; Data Physics: Hailsham, UK, 2006; pp. 1–33. [Google Scholar]
  54. Harrison, T. The Vibration System; Bruel and Kjaer Sound and Vibration Measurement: Naerum, Denmark, 2014; p. 15. [Google Scholar]
  55. Chouchelamane, G. Electrochemical Impedance Spectroscopy; University of Warwick: Coventry, UK, 2013; pp. 1–24. [Google Scholar]
  56. Birkl, C.; Howey, D. Model identification and parameter estimation for lifepo4 batteries. In Proceedings of the 4th Hybrid and Electric Vehicles Conference (HEVC 2013), London, UK, 6–7 November 2013; IET: London, UK, 2013; pp. 1–6. [Google Scholar]
  57. Wanga, J.; Liua, P.; Hicks-Garnera, J.; Shermana, E.; Soukiaziana, S.; Verbruggeb, M.; Tatariab, H.; Musserc, J.; Finamorec, P. Cycle-life model for graphite-LiFePO4 cells. J. Power Sources 2010, 196, 3942–3948. [Google Scholar] [CrossRef]
  58. Bourlot, S.; Blanchard, P.; Robert, S. Investigation of aging mechanisms of high power Li-ion cells used for hybrid electric vehicles. J. Power Sources 2011, 196, 6841–6846. [Google Scholar] [CrossRef]
  59. Bono, R. Transducer mounting and test setup configurations. In Proceedings of the IMAC XXVI: Conference & Exposition on Structural Dynamics—Technologies for Civil Structures, Orlando, FL, USA, 4–7 February 2008; The Modal Shop: Sharonville, OH, USA, 2011. [Google Scholar]
  60. Sujatha, C. Vibration and Acoustics, 1st ed.; Tata McGraw Hill Education Private Ltd.: Dehli, India, 2010; p. 513. [Google Scholar]
  61. Jeevarajan, J.; Duffield, B.; Orieukwu, J. Safety of lithium at different states of charge. In Space Safety is No Accident, Proceedings of the 7th IAASS Conference, Friedrichshafen, Germany, 20–22 October 2014; Sgobba, T., Rongier, I., Eds.; Springer: Friedrichshafen, Germany, 2015; pp. 131–134. [Google Scholar]
  62. Ramadass, P.; Haran, B.; White, R.; Popov, B.N. Mathematical modeling of the capacity fade of Li-ion cells. J. Power Sources 2003, 123, 230–240. [Google Scholar] [CrossRef]

