Article

Exergetic Analysis of an Integrated Tri-Generation Organic Rankine Cycle

1
School of Mechanical and Systems Engineering, Newcastle University, Newcastle Upon Tyne NE1 8ST, UK
2
Shinas College of Technology, Alqr, P.O. Box 77, Shinas 324, Oman
*
Author to whom correspondence should be addressed.
Energies 2015, 8(8), 8835-8856; https://doi.org/10.3390/en8088835
Submission received: 30 May 2015 / Revised: 9 July 2015 / Accepted: 30 July 2015 / Published: 20 August 2015
(This article belongs to the Special Issue Tri-Generation Cycles, Combined Heat, Power and Cooling (CHPC))

Abstract

:
This paper reports on a study of the modelling, validation and analysis of an integrated 1 MW (electrical output) tri-generation system energized by solar energy. The impact of local climatic conditions in the Mediterranean region on the system performance was considered. The output of the system that comprised a parabolic trough collector (PTC), an organic Rankine cycle (ORC), single-effect desalination (SED), and single effect LiBr-H2O absorption chiller (ACH) was electrical power, distilled water, and refrigerant load. The electrical power was produced by the ORC which used cyclopentane as working fluid and Therminol VP-1 was specified as the heat transfer oil (HTO) in the collectors with thermal storage. The absorption chiller and the desalination unit were utilize the waste heat exiting from the steam turbine in the ORC to provide the necessary cooling energy and drinking water respectively. The modelling, which includes an exergetic analysis, focuses on the performance of the solar tri-generation system. The simulation results of the tri-generation system and its subsystems were produced using IPSEpro software and were validated against experimental data which showed good agreement. The tri-generation system was able to produce about 194 Ton of refrigeration, and 234 t/day distilled water.

1. Introduction

One of the most profound problems recently facing the international community is climate change. Increasing fossil fuel consumption has caused much environmental degradation, and the dwindling reserves of fossil energy resources has led to escalating prices which impact on economic growth. Therefore, researchers and industry are now motivated to improve the use of sustainable clean energy sources, including for the production of electrical power [1]. The interest in renewable resources of energy such as solar, wind, and geothermal energy has intensified. Solar energy is one of the most attractive sources of sustainable energy and represents the most reliable source which uses the immense heat radiated by the sun. New energy conversion technologies are required to utilize solar energy for power generation without causing environmental pollution. Low-grade technologies such as the organic Rankine cycle (ORC), thermal desalination and the absorption chiller (ACH) are typical examples of new energy conversion technologies. These technologies can be working individually to produce useful energy such as power, cooling, and heating or together as one system. The system that produce simultaneously three types of energy as cooling, heating, and power based on the same energy source can be called tri-generation, or combined cooling, heating, and power (CCHP). 20%–40% of total energy consumption in municipal buildings is used for electrical power, heating, and cooling [2,3]. In this study, novel tri-generation system as shown in Figure 1 integrates solar energy into industrial processes to produce cooling, distilled water, and power instead of producing cooling, power and heating as usual.
Figure 1. Scheme of the proposed configuration.
Energies 08 08835 g001
Tri-generation is a thermal system that produces power and extracts the heat loss exiting from the steam turbine to produce the cooling, along with distilled water simultaneously from the same energy source without the need for extra fuel, and such a system powered by solar energy is considered to be very environmentally friendly. The heat loss in the tri-generation system from the prime mover is used to increase the efficiency of the system up to 85% [4]. Furthermore, it offers interesting potential for small to medium sized communities in developing areas. Most tri-generation systems are placed close to the area of consumption as a decentralized system to keep the heating and cooling energy from the loss. The solar thermal power generation technologies have attracted a great deal of attention and commercial applications have been released. These technologies require another source of energy to provide energy continuously. Therefore, this system is also connected to thermal storage to provide the system with energy during the night. Studies have been carried out to enhance the performance of these technologies. Nafey et al. [5] performed a comparison of an ORC energized by thermal energy absorbed by a parabolic trough collector, a flat plate collector and a compound parabolic concentrator using Matlab/SimuLink code. The electrical power generated from the ORC was supplied to operate reverse osmosis (RO) desalination, and the results showed that the parabolic trough collector, flat plate collector and compound parabolic concentrator are considered effective with toluene, butane and hexane respectively. The PTC system was to be found the most suitable choice among these systems. Mathkor et al. [6] investigated solar ORC system numerically through the energy and exergy analysis. Their system used a parabolic trough collector to absorb the heat to produce 3 MW of the power. The results showed that a large amount of exergy was destruction in the condenser and this gave possibilities of further cycle improvements by using rejected heat in the condenser in other low temperature technologies such as absorption chiller and thermal desalination. Kosmadakis et al. [7] proposed a supercritical ORC coupled with RO as a co-generation system to produce the electricity and the distilled water. The system integrated with PTC to produce 700 kw thermal energy and achieve 21% cycle efficiency. The system could be operated in a co-generation mode to produce the electricity and the distilled water as well as solar generation system to produce the electricity only dependent on the availability of the solar radiation. This system could decrease the negative effect of discontinuous solar energy without thermal energy storage by converting solar energy to desalinated water. The results showed that over a large range of solar radiation intensity the efficiency of the system was high due to the high effectivity of the PTC at low loads. The efficiency of the system optimized for wide range of solar radiation and found to be between 18%–20%. A numerical study was carried out by Al-Sulaiman et al. [8] to simulate the solar ORC with HCFC-123 as a working fluid and compound parabolic concentrators as collectors. The study presented a thermodynamic comparison and examined different parameters for three plants when there is electrical power only and to improve efficiency when there is tri-generation. The plants considered were SOFC-trigeneration, biomass-trigeneration, and solar-trigeneration. The results showed that electrical efficiency was highest for SOFC-tri-generation and tri-generation efficiency was highest for the solar and biomass systems (90%). The CO2 emissions per MWh were the highest for the biomass and SOFC-tri-generation plants. The same researchers extended the study to compare these three types of tri-generation system thermodynamically and economically [9]. The results showed that the solar-tri-generation system had the highest energy efficiency and the lowest cost per exergy unit, and it was concluded that the solar-tri-generation system gives the best thermo-economic performance. The use of thermal storage as a component of the tri-generation system was studied by Dharmadhikari et al. [10], who conducted an economic and environmental analysis of the tri-generation system with and without the thermal storage component. The results showed that the use of thermal storage in the tri-generation system had a positive effect. It mitigated the plant chiller capacity required, which led to decreased cost and power demand for the system. It is obvious from the literature that most research into tri-generation systems do not focus on the organic Rankine cycle as the prime mover, and less attention has been paid to exergy analysis in these studies compared to energy analysis. This study has three aims. Firstly the solar tri-generation energized by heat from the PTC in a Mediterranean climate such as Libya is modelled using IPSEpro software. Secondly confidence is gained concerning the PTC, ORC, ACH and SED models by validating the software output against experimental results. Finally the simulation results for the PTC, and solar tri-generation systems are used to carry out an energy and exergy analysis.

2. Background

Several prime movers can be used for a tri-generation system, such as internal combustion engines, gas turbines, fuel cells, Rankine cycles and Stirling engines. The Rankine cycle is the promising of these technologies movers [11]. There are two type of Rankine cycle, both of which convert heat into useful work. The first is the steam Rankine cycle, which uses water as a refrigerant, and the second type is the organic Rankine cycle which uses organic fluids as refrigerants [12]. Recently the ORC has received more consideration for domestic applications because it has low pressure and temperature workability [13]. Furthermore, the ORC can use heat from low-grade temperature sources such as geothermal, waste heat, and solar energy [14]. Using ORC as prime mover is one of the potential configurations of a tri-generation system which can produce power and use waste heat for useful work such as cooling and heating. This type of tri-generation system is energized by heat absorbed from a solar parabolic trough collector (PTC) with thermal storage, and consists of an organic Rankine cycle, single effect Li-Br/H2O absorption chiller, and single effect desalination. The system is able to produce electrical power, distilled water and cooling load simultaneously from the solar energy source. Solar tri-generation systems are promising because they use clean energy and have multiple productivity. Tri-generation systems have several benefits which have led to interest from the researchers and manufacturers. The most important benefits are low energy consumption, low maintenance and operation costs, reductions in environmental pollution and the energy loss due to transmission lines, enhanced the sustainability, increased thermal efficiency, improved energy sector security, increased the reliability, and the production of multiple products simultaneously without the need for extra fuel as in conventional plants [11]. Due to these benefits, the researchers have been encouraged to improve tri-generation systems.

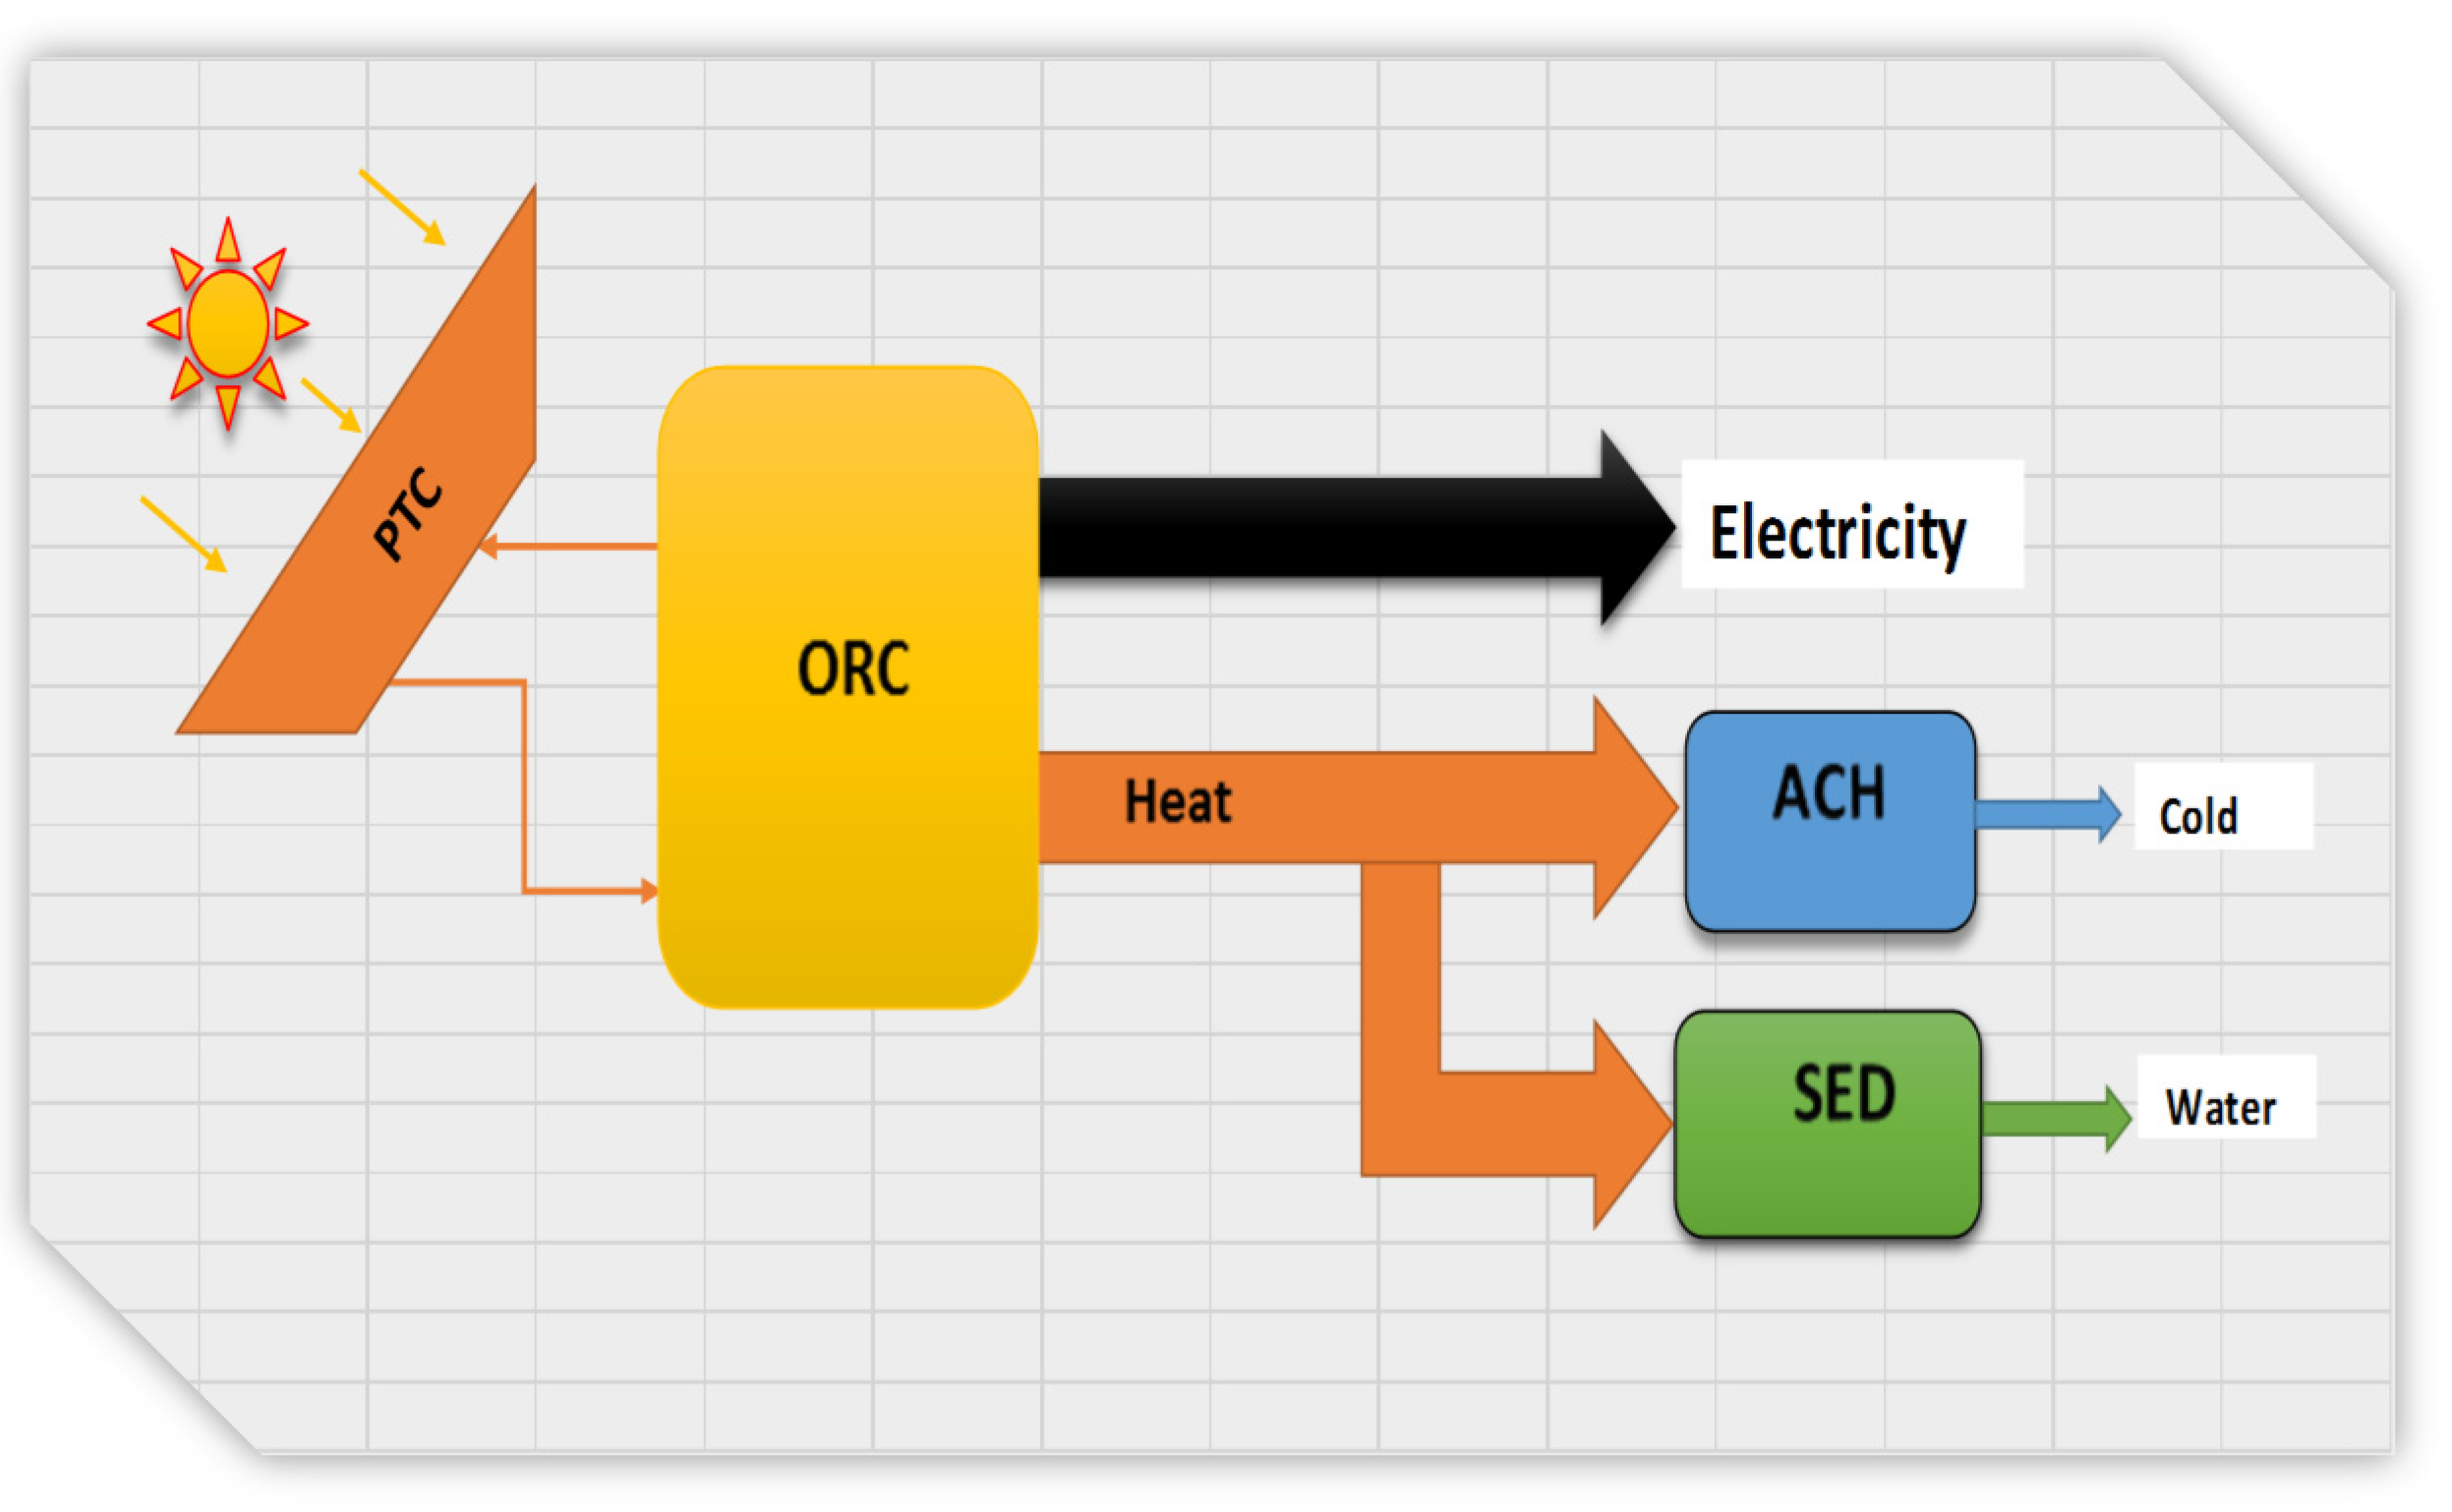
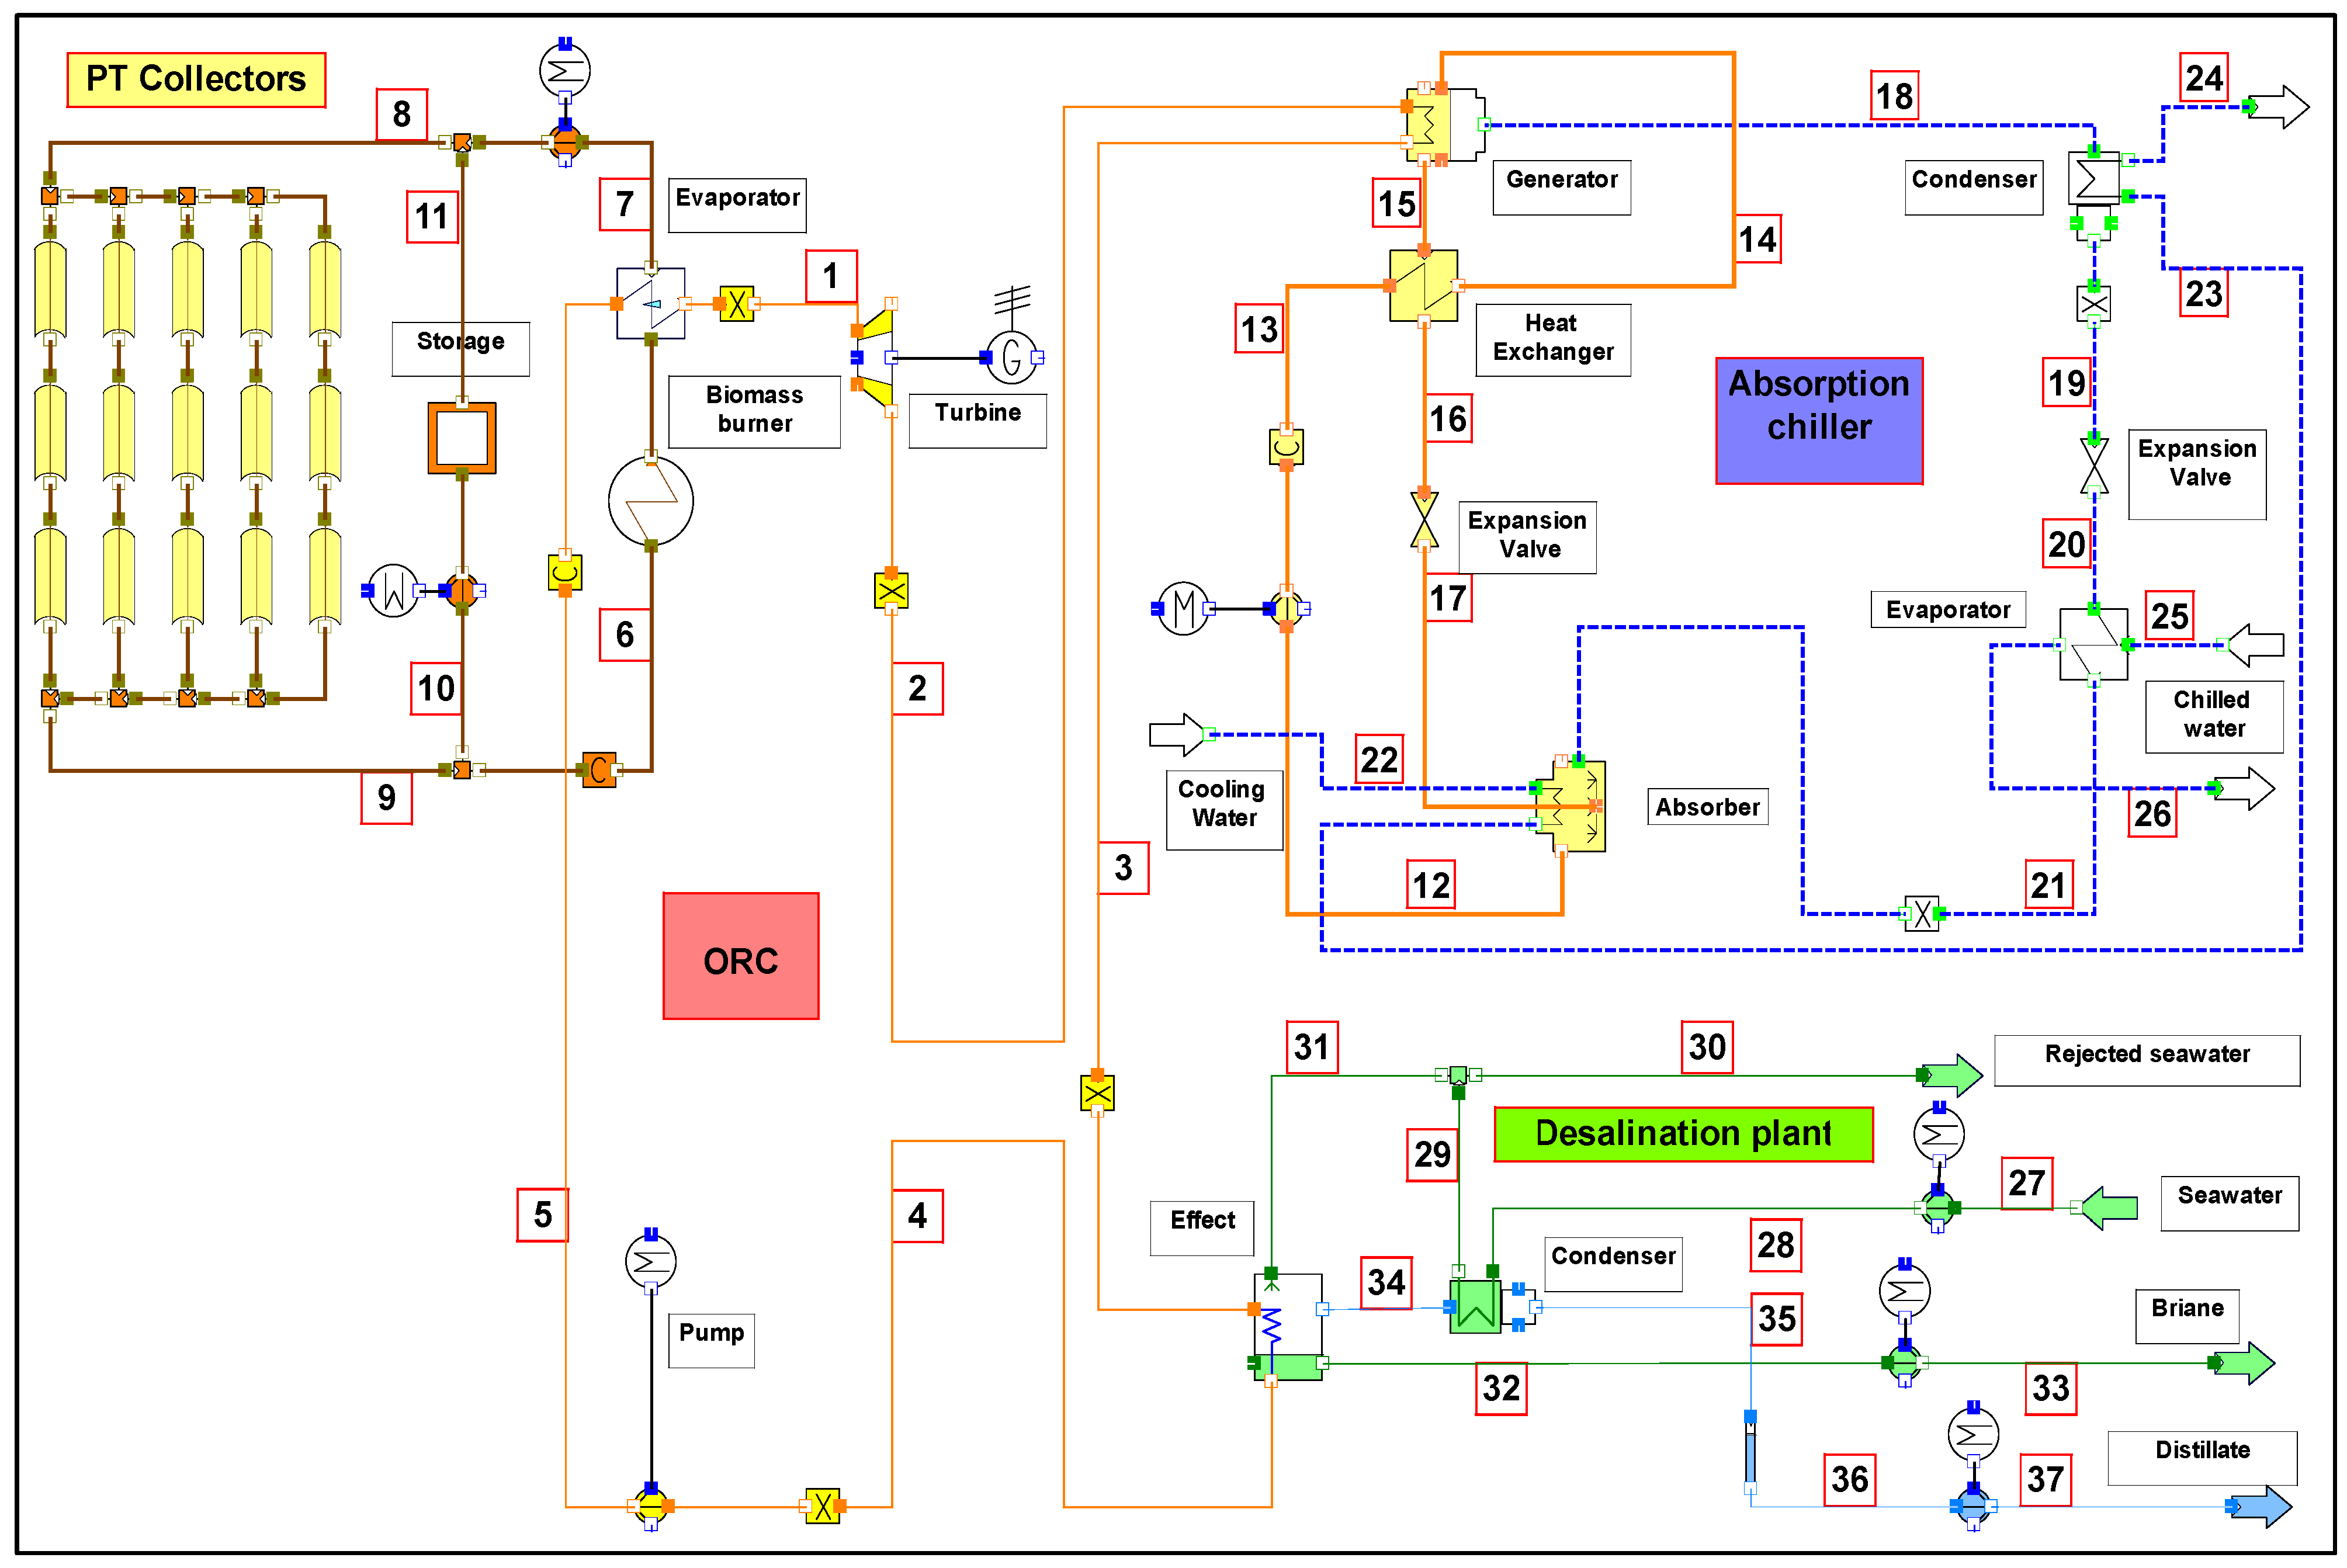
3. System Description

The integration of a parabolic trough collector with the tri-generation system using IPSEpro was modeled as shown in Figure 2. The tri-generation system consists of an ORC, ACH, and SED. The solar field considered in this model is comprised of 134 collectors which are single axis tracking and aligned on a north-south line. The heat transfer oil in the absorber tube for the collectors and the thermal storage was Therminol VP-1 [15] and cyclopentane was used as the refrigerant in the ORC [16,17,18]. Water was the working fluid and LiBr-H2O is the absorbent in the single absorption chiller used to produce the cooling load and the desalination used to produce the fresh water from seawater. The system is able to work during the night using the energy stored in the thermal storage. During the period of low solar radiation specifically during the winter session, the system was connected with a biomass backup burner to avoid intermittent production. As stated by De Falco et al. [19] the backup burner consumes a biomass amount equal to 20% of nominal solar plant power which is equal approximately in this tri-generation case to 0.2 MW/h.
Figure 2. The solar tri-generation IPSEpro model.
Energies 08 08835 g002

4. Thermal Analysis

The analysis of the tri-generation system components was carried out at a steady state condition and within the control volume. This analysis is based on the model design condition with an ambient temperature of 25 °C and was carried out for Derna, Libya, for direct normal irradiance DNI 810 W/m2 [20]. The PTC model contains collectors of type LS-2 and with an optical efficiency of 0.76 [21]. An aperture (W0) of 5 m and a length (L) of 49 m were the design parameters used for each collector. It is assumed that the fluid enters the collector at a temperature of 298 °C and a mass flow rate of 218 kg/s [22]. The outlet collector fluid temperature was found to be 337 °C. The sea water temperature was 27 °C, it is helpful if the seawater temperature is higher than the ambient temperature [23].

4.1. Energy Analysis

The energy received by the collector is:
Q i = I × N × A
where,
A = W 0 × L
The energy absorbed by the collector absorber is:
Q s = Q i × η 0
The first law of efficiency for the collector subsystem is:
η = Q s Q i
The useful energy delivered to the fluid in the receiver is:
Q u = N × m f × C p f × ( T f o T f i )
Energy loss in the receiver = Q s Q u
The energy loss  ( % ) = [ Q s Q u Q s ]   × 100
The first law of efficiency for the receiver subsystem is:
η = Q u Q s
The overall efficiency of the collector-receiver subsystem is:
η = Q u Q i
The net work done by the ORC is:
W n e t = W t W p
The steam table contains the values of enthalpy and entropy for water, whereas the values of enthalpy and entropy for LiBr based on experimental thermodynamic properties can be obtained from Feuerecker et al. [24] and Kaita [25] respectively.
h = n = 0 4 a n x n + T n = 0 3 b n x n + T 2 n = 0 2 c n x n + T 3 d n
S = i = 0 3 j = 0 3 B i j X j T i
The value of the correlation constants for LiBr are mentioned in Table A1 and Table A2 in Appendix.
The values of enthalpy and entropy for water and seawater in the desalination plant based on experimental thermodynamic properties can be obtained from [26] and [27] respectively.
The water enthalpy is obtained by:
h w = 141.355 + 4202.070 ( T ) 0.535 ( T 2 ) + 0.004 ( T 3 )
The seawater enthalpy is obtained by:
h s w = h w w s [ b 1 + b 2 w s + b 3 w s 2 + b 4 w s 3 + b 5 T + b 6 T 2 + b 7 T 3 + b 8 w s T + b 9 w s 2 T + b 10 w s T 2
Then the effect of the stream pressure on the enthalpy of the stream is added:
h s w ( T , p , w s ) = h s w ( T , p 0 , w s ) + ν ( p p 0 )
The entropy of the water is obtained by:
s w = 0.1543 + 15.383 ( T ) 2.996 × 10 2 ( T 2 ) + 8.193 × 10 5 ( T 3 ) 1.370 × 10 7 ( T 4 )
The entropy for seawater in obtained by:
s s w = s w w s [ c 1 + c w s + c 3 w s 2 + c 4 w s 3 + c 5 T + c 6 T 2 + c 7 T 3 + c 8 w s T + c 9 w s 2 T + c 10 w s T 2 ]
Constants used to calculate the enthalpy and entropy of seawater are mentioned in Table A3 Appendix.

4.2. Exergy Analysis

For any system, the total inlet and outlet exergy ( E ) can be calculated as a summation of chemical exergy ( E C H ), physical exergy ( E P H ), potential exergy ( E P O ), and kinetic exergy ( E K E ) [28]. The evaluation of exergy is carried out with respect to the dead state:
E ˙ x = E ˙ x c h + E ˙ x p h + E ˙ x p o + E ˙ x k e
If there is no change in the fluid composition the term for chemical exergy rate can be neglected [29]. The potential and kinetic exergy rates are also neglected due to the assumption that the elevations of the environment and the stream are equal, and for there is no velocity gradient in the process respectively. For this stream ( i ) , the specific physical exergy can be expressed as:
E ˙ x p h = m ˙ i [ ( h i h 0 ) T 0 ( s i s 0 ) ]
where m ˙ i , h i and s i are the mass flow rate (kg/s), specific enthalpy (kJ/kg.K), and specific entropy (kJ/kg) respectively. T 0 , h 0 and s 0 are temperature, specific enthalpy, and the specific entropy of the stream at the dead state. The exergy heat rate and exergy work rate can be expressed as:
E ˙ x h e a t = Q ˙ × ( 1 T 0 T )
E ˙ x w o r k = W ˙
Exergy destruction represents the loss in the system, and can be obtained from the definition F-P-L [30]. The resources needed to produce the energy are represented by the fuel used such as geothermal, wind, or solar energy. The desired output of this system is represented by the product, which can be expressed in terms of the exergy of the fuel and the system loss. Thus, the exergy destruction can be obtained from:
E x F = E x P + E x D + E x L
where E x F , E x P , E x D and E x L denotes to exergy fuel, exergy product, exergy destruction, and exergy loss. Product to fuel exergy ratio is denote to the exergy efficiency ε that can be expressed as:
ε = E x P E x F
Exergy destruction for the solar tri-generation system components are presented in Table 1.
Table 1. Fuel-product definition of the solar tri-generation system.
ComponentsFuel (MW)Product (MW)
Turbine E ˙ 1 E ˙ 2 W t
Evaporator E ˙ 6 E 7 E ˙ 1 E 5
Pump W p E ˙ 5 E 4
PTC E ˙ c o l l e c t o r E ˙ 9 E 8
Thermal storage E ˙ 10 E ˙ 11 -
Generator E ˙ 2 E ˙ 3 E ˙ 15 + E ˙ 18 E ˙ 14
Condenser E ˙ 18 E 19 E ˙ 24 E 23
Evaporator E ˙ 20 E 21 E ˙ 26 E 25
Absorber E ˙ 12 E ˙ 21 E ˙ 17 E ˙ 23 E 22
Expansion valve E ˙ 19 E 20 -
Heat exchanger E ˙ 15 E 16 E ˙ 14 E 13
Seawater pump W s w . p E ˙ 28 E 27
Effect E ˙ 3 E 4 E ˙ 34 + E ˙ 32 E ˙ 31
Condenser E ˙ 34 E 35 E ˙ 29 E 28
For the collector subsystem, the exergy received is:
E ˙ x i = Q i [ 1 ( T a T s ) ]
where T s = 6000 K is the sun temperature [31].
The exergy absorbed by the collector absorber is:
E ˙ x c = Q s [ 1 ( T a T r ) ]
Exergy loss = irreversibility
( I R ) = E ˙ x i E ˙ x c
Exergy loss (%) = ( I R E ˙ x c ) × 100
The second law of efficiency is:
ε = E ˙ x c E ˙ x i
For the receiver subsystem, the exergy absorbed by the collector is:
E ˙ x c = Q s [ 1 ( T a T s ) ]
Exergy loss (%) = ( I R E ˙ x c ) × 100
The useful exergy delivered is:
E ˙ x u = N × m ˙ f ( E ˙ x o E ˙ x i ) = N × m ˙ f [ ( h f 0 h f i ) T a ( s f o s f i ) ]
The second law of efficiency is:
ε = E ˙ x u E ˙ x c
The overall second law of efficiency for the collector-receiver is
ε = E ˙ x u E ˙ x i

5. Modeling and Validation

5.1. Parabolic Trough Collector (PTC)

The validation of the PTC model against experimental results was carried out to make sure of the correctness and reliability of the developed model. The PTC model results were validated against the experimental result for exergy delivered and exergy loss as shown in Table 2 [22]. This validation showed good agreement and the values compared had a maximum difference of 3.03% for receiver exergy loss.
Table 2. Validation of the PTC model with experimental data.
SubsystemDeveloped modelExperimental model [22]The difference
Exergy delivered (MW)Exergy loss (MW)Exergy delivered (MW)Exergy loss (MW)Exergy delivered (%)Exergy loss (%)
Collector44.9364.4444.9164.220.050.34
Receiver29.4115.5129.8715.041.563.03
Collector-Receiver29.4179.9529.8779.260.020.86

5.2. Organic Rankine Cycle (ORC)

The ORC is considered to be one of the most effective units in tri-generation systems, and it was modeled using the IPSEpro software. The validation of the ORC as standalone against the experimental results from a plant in Alaska, Chena [32] was carried out for the performance output as shown in Table 3. The comparison between the model and the experimental results showed good agreement and the highest difference between the values was 2.87% for refrigerant flow.
Table 3. Validation of the ORC standalone IPSEpro model with experimental results.
ParameterUnitExperimental resultModel resultDifference (%)
Gross powerkw2502541.60
Net powerkw2102120.95
Pump power consumptionkw40.041.74.07
ORC efficiency%8.208.081.46
Cooling water flowkg/s101.0099.641.35
Refrigerant flowkg/s12.2012.562.87
Evaporator outlet temperature54.454.40.00
Evaporator heat transferkw258026332.01
Condenser heat transferkw236023261.44

5.3. Single-Effect Desalination (SED)

IPSEpro software was used to model the single effect desalination. This model was validated aginst exprimental data for a standalone model [33]. The validation was carried out for water production, as shown in Table 4, and the results showed good agreement and the highest difference between the values was 3.49% for refrigerant flow.
Table 4. Validation of the SED IPSEpro model with experimental results.
Th,in (°C)Th,out (°C)mh (kg/s)Qe,1 (kw)mc (kg/s)Experimental (m3/d)Model (m3/d)Difference (%)
6554.31.38622.1822.07233.49
6554.42.761234.3444.10322.52
6557.75.001536.2455.01930.38
6557.36.652158.5177.06020.85
6557.29.3730710.211010.1431.41
6557.113.8646015.881515.1801.19

5.4. Single Effect H2O/LiBr Absorption Chiller (ACH)

The waste heat produced from the steam turbine in the ORC utilizing to power the absorption chiller. The validation of the ACH as a standalone model against experimental results [34] was carried out for the performance output data and the physical possibility confirmed on a Duhring chart, as shown in Table 5, and the results showed good agreement. Then the model was modified to suit Libyan climate conditions.
Table 5. Validation of the ACH IPSEpro model with experimental results.
ParameterUnitExprimentalModelDifference (%)
COP-0.740.751.33
Generator heat transferkw298730652.54
Generator outlet temperature°C8581.14.58
Generatore evaporator heat transferkw520053643.05
Absorber and Condenser heat transferkw519353643.18
Cooling water flowkg/s2112141.40
Chilled water flowkg/s52.654.73.83

6. Results and Discussion

The energy analysis of the PTC subsystems as standalone showed that the collector receiver was the highest contributor to energy losses among the subsystems. Furthermore, the ORC gross power and pumps power consumption were found to be 1286 kw and 271 kw respectively. The work done by the pump increased the enthalpy of the fluid; and the work done by the turbine decreased the enthalpy of the fluid; therefore, the work is the difference in the specific enthalpy multiplied by the mass flow rate of the fluid. Consequently, the net power of the ORC was 1015 kw. Validation of the trigeneration model lead to the use of some parameters as input date in the tri-generation system considered. The remaining data had to change due to the different operating conditions of the system considered in this study. Some input data were chosen from a new system and the whole input data is showed in Table A4 in Appendix. Table 6 shows the results of energy analysis and Table 7 shows a comparison of the exergy and energy analysis for the solar field based on energy (1 to 8) and exergy (21 to 32) equations. It is found from Table 6 and Table 7 that the main energy loss in the collector field takes place at the collector-receiver subsystem. The exergy analysis revealed that the second law of efficiency of the collector receiver was lower than the first law of efficiency. In addition, it was found that most of the exergy destruction in the PTC system was caused by the collector receiver (23.15 MW). Moreover, the total solar radiation incident on the collector subsystem was 26.59 MW, and the total energy absorbed by the absorbers was 20.21 MW. The useful heat available per collector was found to be 30.98 kw.
Table 6. The energy analyses for PTC.
SubsystemEnergy received (MW)Energy delivered (MW)Energy loss (MW)Energy loss (%)First law efficiency (%)
Collector26.5920.2106.3824.0076.00
Receiver20.2104.1516.0579.0020.54
Collector-receiver26.5904.1522.4484.0015.61
Table 7. Comparison of first and second law analysis.
SubsystemIrreversibility (MW)Exergy received (MW)Energy loss (%)Exergy loss (%)First law efficiency (%)Second law efficiency (%)
Collector15.6125.2724.0061.7776.0038.22
Receiver07.5409.6679.0078.0120.5421.98
Collector-receiver23.1525.2784.0091.5915.6108.40
According to the numbers in Figure 2, data of mass flow rate, temperature, and pressure, enthalpy, entropy, salinity, and LiBr concentration are given for cyclopentane, oil, LiBr, water, and seawater in Table 8. Furthermore, the exergy rate is calculated for each point in Figure 2 and shown in Table 8. Consequently, the exergy destruction as well as the exergy fuel, exergy production, exergy loss, and exergetic efficiency of the all components of the solar tri-generation system are calculated and shown in Table 9. Depending on the exergy rate shown in Table 8 and on the equations in Table 1, the exergy destruction in the solar tri-generation system components shown in Figure 2, were 5.91 MW, 4.89 MW, 2.71 MW, 0.50 MW, 0.44 MW, 0.91 MW, 0.21 MW, and 0.14 MW for the PTC, thermal storage, evaporator, effect, turbine, other components, pump, and generator respectively.
Table 8. The main properties at different points of the model of solar tri-generation.
StateFluidh0 (kj/kg)so (kj/kg.k)T0 (K)m (kg/s)T ( K )P barh (kj/kg)s (kj/kg.k)SalinityxEx (kw)
0Cyclo-pentane−45.47−0.15298.15-298.151.01−45.47−0.15---
0Oil38.580.31298.15-298.151.0138.580.31---
0LiBr68.830.15298.15-298.151.0168.830.15-0.57-
0LiBr92.730.13298.15-298.151.0192.730.13-0.61-
0Water104.930.37298.15-298.151.01104.930.37---
0Water113.290.40300.15-300.151.01113.290.40---
0Seawater107.440.37300.15-300.151.0199.480.370.04--
1Cyclo-pentane−45.47−0.15298.1521.25461.8322.30562.301.34--3521.85
2Cyclo-pentane−45.47−0.15298.1521.25388.153.21481.031.34--1795.04
3Cyclo-pentane−45.47−0.15298.1521.25362.433.20438.781.22--1613.34
4Cyclo-pentane−45.47−0.15298.1521.25362.433.2082.150.24--269.44
5Cyclo-pentane−45.47−0.15298.1521.25363.5822.4085.720.24--332.51
6Oil38.580.31298.15109.00610.3314.14661.811.68--23377.27
7Oil38.580.31298.15109.00571.0714.04568.911.55--17475.95
8Oil38.580.31298.15218.00571.1515.14569.111.55--34993.98
9Oil38.580.31298.15218.00610.3314.14661.811.68--46754.54
10Oil38.580.31298.15109.00610.3314.14661.811.68--23377.27
11Oil38.580.31298.15109.00571.1516.00569.111.55--17496.99
12LiBr68.830.15298.154.02317.650.01108.340.28-0.579.46
13LiBr68.830.15298.154.02317.650.07108.340.28-0.579.46
14LiBr68.830.15298.154.02344.450.07162.710.44-0.5734.39
15LiBr92.730.13298.153.73357.540.07205.600.47-0.6144.72
16LiBr92.730.13298.153.73326.660.07146.890.30-0.6114.42
17LiBr92.730.13298.153.73326.660.01146.890.30-0.6114.42
18Water104.930.37298.150.30352.640.072648.898.52--33.39
19Water104.930.37298.150.30311.530.07160.700.55--0.32
20Water104.930.37298.150.30285.160.01160.700.57--−1.10 a
21Water104.930.37298.150.30285.160.012461.108.63--−32.22 a
22Water104.930.37298.1539.82300.151.60113.350.40--9.23
23Water104.930.37298.1539.82305.231.47134.490.47--19.96
24Water104.930.37298.1539.82309.651.34153.030.53--34.09
25Water104.930.37298.1538.61291.352.3876.610.27--17.93
26Water104.930.37298.1538.61287.151.4058.930.21--37.47
27Seawater107.440.37300.15212.44300.151.01107.440.370.04-0.00
28Seawater107.440.37300.15212.44300.161.50107.510.370.04-10.08
29Seawater107.440.37300.15212.44307.651.50137.350.470.04-82.43
30Seawater107.440.37300.15202.97307.651.50137.350.470.04-78.76
31Seawater107.440.37300.159.47307.651.50137.350.470.04-3.68
32Seawater107.440.37300.156.77340.560.27263.640.860.05-77.01
33Seawater107.440.37300.156.77340.582.00263.880.860.05-78.23
34Water113.290.40300.152.71340.560.272621.847.81--767.66
35Water113.290.40300.152.71339.830.27279.130.91--26.09
36Water113.290.40300.152.71339.830.30279.130.91--26.10
37Water113.290.40300.152.71339.862.00279.380.92--26.61
a This becomes negative because both the pressure and temperature are below reference environment state.
Table 9. Calculated thermodynamic properties of the solar tri-generation system.
ComponentExergy fuel ExF (kw)Exergy production ExP (kw)Exergy destruction ExD (kw)Exergy loss ExL (kw)Exergetic efficiency (%)
Turbine1,726.811,286.14440.670.0074.48
Evaporator5,901.313,189.342,711.980.0054.04
Pump270.6063.08207.520.0023.31
PTC25,207.901,1760.565,910.757,536.6046.65
Thermal storage5,880.280.004,890.50989.780.00
Generator181.7143.71137.990.0024.06
Condenser33.0714.1318.940.0042.73
Evaporator31.1219.5411.580.0062.79
Absorber27.2610.7316.530.0039.37
Expansion valve1.420.001.420.000.00
Heat exchanger30.3024.935.370.0082.28
Seawater pump23.5610.0813.480.0042.79
Effect1,343.90840.99502.910.0062.58
Condenser741.5772.35669.210.009.76
Cooling process78.760.0078.760.000.00
Brine disposal65.450.0065.450.000.00
System41,572.5317,335.5915,710.578,526.3841.70
The exergy destruction analysis for the solar tri-generation system is illustrated in Figure 3. The PTC is the main source of this exergy destruction, accounting for 38% and followed by the thermal storage, evaporator, other components, effect, turbine, generator, and pump at 31%, 17%, 6%, 3%, 3%, 1%, and 1% respectively. The high exergy destruction in the PTC, thermal storage, and evaporator leads to the system being less efficient. Therefore, improvement efforts need to concentrate on these components to increase exergy efficiency and decrease exergy destruction. It can be seen from the results shown in Table 9 that the exergetic efficiency of the system is 41.7%, which means that the loss in exergy that is not utilized in the system is 58.3%. The largest source of the exergy destruction in the solar tri-generation system is the PTC, at 5.91 MW. This is because of the high quality of the solar energy which heats the fluid at low temperature. This leads to the creation of significant irreversibility between hugely different temperatures. The second largest source of exergy destruction is the thermal storage, at 4.89 MW, which is due to the loss in the storage process, which is 19.7% of the energy in the thermal storage system. The third source of exergy destruction is the evaporator, at 2.71 MW, which is due to the heat transfer between two different fluids, where the greatest irreversibility occurred. The fourth source of exergy destruction is that in the desalination plant at 0.50 MW. The main reason for the destruction in this component is the ineffectiveness due to leakage and friction. The remaining exergy destruction in the system occurs at small quantities in the remaining components due to low efficiency. Regarding the absorption chiller, the main contributor of the exergy destruction is the generator, at 0.14 MW. This is due to the temperature difference between the generator and the heat source from the ORC [35].
Figure 3. The exergy destruction rates of a solar tri-generation components.
Energies 08 08835 g003
Exergetic parameters for each components of the solar tri-generation system such as the exergetic factor, improvement potential, relative irreversibility, fuel depletion rate, and productivity lack are used to assess the performance of the system. The assessment is carried out under the steady state assumption and the results are shown in Table 10. The PTC has the highest exergy destruction with a lower value of exergy efficiency in the solar tri-generation system. Thus, the PTC has the highest value of improvement potential, as shown in Figure 3 and Figure 4. Therefore, a reduction in exergy destruction in the PTC as well as other components in the solar tri-generation system would lead increased thermal efficiency in the system.
Table 10. Results of solar tri-generation subsystem exergy analysis.
ComponentFuel depletion rate (%)Exergetic factor f (%)Productivity lack (%)Improvement potential IP (MW)Relative irreversibility (%)
Turbine1.064.152.540.112.80
Evaporator6.5214.2015.641.2517.26
Pump0.500.651.200.161.32
PTC14.2260.6434.103.1537.62
Thermal storage11.7614.1428.214.8931.13
Generator0.330.440.800.100.88
Condenser0.050.080.110.010.12
Evaporator0.030.070.070.000.07
Absorber0.040.070.100.010.11
Expansion valve0.000.000.010.000.01
Heat exchanger0.010.070.030.000.03
Seawater pump0.030.060.080.010.09
Effect1.213.232.900.193.20
Condenser1.611.783.860.604.26
Cooling process0.190.190.450.080.50
Brine disposal0.160.160.380.070.42
Figure 4. Exergy destruction and improvement potential rates for solar tri-generation components.
Energies 08 08835 g004
Figure 5 shows the relationship between the fuel depletion rate and productivity lack of the solar tri-generation system, which clarifies the results of the exergy analysis. From the values in Table 10, the fuel depletion rates of the turbine, evaporator, pump, PTC, thermal storage, generator, effect, and other components are 1.06%, 6.52% 0.50%, 14.22%, 11.76%, 0.33%, 1.21%, and 2.18 % respectively. The highest fuel depletion is in the PTC, depending on exergy destruction values. The values of productivity lack of the turbine, evaporator, pump, PTC, thermal storage, generator, effect, and other components are 2.54%, 15.64%, 1.20%, 34.10%, 28.21%, 0.80%, 2.90%, and 5.24% respectively. The highest productivity lack also occurs in the PTC because it has the highest value of exergy destruction. In evaluating the exergy destruction and exergetic efficiency, Table 9 shows that 58.3% of the exergy is lost in the system while the residual 41.7% of exergy is utilized in the system. The exergetic efficiency of the system is therefore 41.7%.
Figure 5. Fuel depletion rates and productivity lack for solar tri-generation components.
Energies 08 08835 g005
Figure 6 presents the effect of the turbine inlet pressure on the tri-generation system productivity. It can be noticed that the effect of varying pressure is insignificant on the desalination production but there is notable change on the power production which increased from 150 kw at 8 bar to about 1000 kw at 22 bar. On the other hand, the cooling load increased slowly from 50 TR at 8 bar to about 200 TR at 22 bar.
Figure 6. Effect of the turbine inlet pressure on the tri-generation productivity.
Energies 08 08835 g006
Figure 7. Exergy flow diagram for the tri-generation system.
Energies 08 08835 g007
Figure 7 shows the exergy flow diagram given as the percentage of total exergy input and it can be seen that 41.6 MW of the exergy entering the plant is lost while the remaining 17.3 MW is utilized. The highest exergy loss of 32.3% occurs in the collector. The second largest exergy destruction occurs from thermal storage with 14.1% of the total exergy input. The cause of exergy destruction in the thermal storage is the losses to the environment. The third largest exergy destruction occurs within the evaporator and amounts to 2.71 MW, which accounts for 6.5% of the total exergy input. Exergy destruction in this component is caused by irreversibilities. This is followed by the total exergy destruction from the pump and other components such the generator and the turbine, and amounts to be about 2.2 MW, which accounts for 5.3% of the total exergy input. Exergy destruction in these components is caused by heat transfer, losses, and friction.

7. Conclusions

In this paper, modeling, validation and exergetic analysis of a solar tri-generation system has been carried out for Libyan weather conditions. The tri-generation cycles modeled using IPSEpro were validated against experimental data. The heat absorbed by the PTC was used to energize an organic Rankine Cycle to produce electricity and the waste heat from the ORC turbine was used to operate the single absorption chiller and single effect desalination to produce the cooling load and distilled water respectively. The simulation results of tri-generation system obtained were used to perform the exergy analysis of the system. The results reveled that, in both the energy and exergy analyses collector receiver was the main contributor to the losses, with 84.39% for energy losses and 91.59% for exergy losses. Exergetic parameters such as the fuel depletion rate, exergetic factor, productivity lack, improvement potential, relative irreversibility, and exergetic efficiency were used to evaluate the solar tri-generation system thermodynamically. Moreover, the exergy destruction was quantified and identified in Table 9 and Figure 3, respectively. The conclusions that can be drawn are as follows:
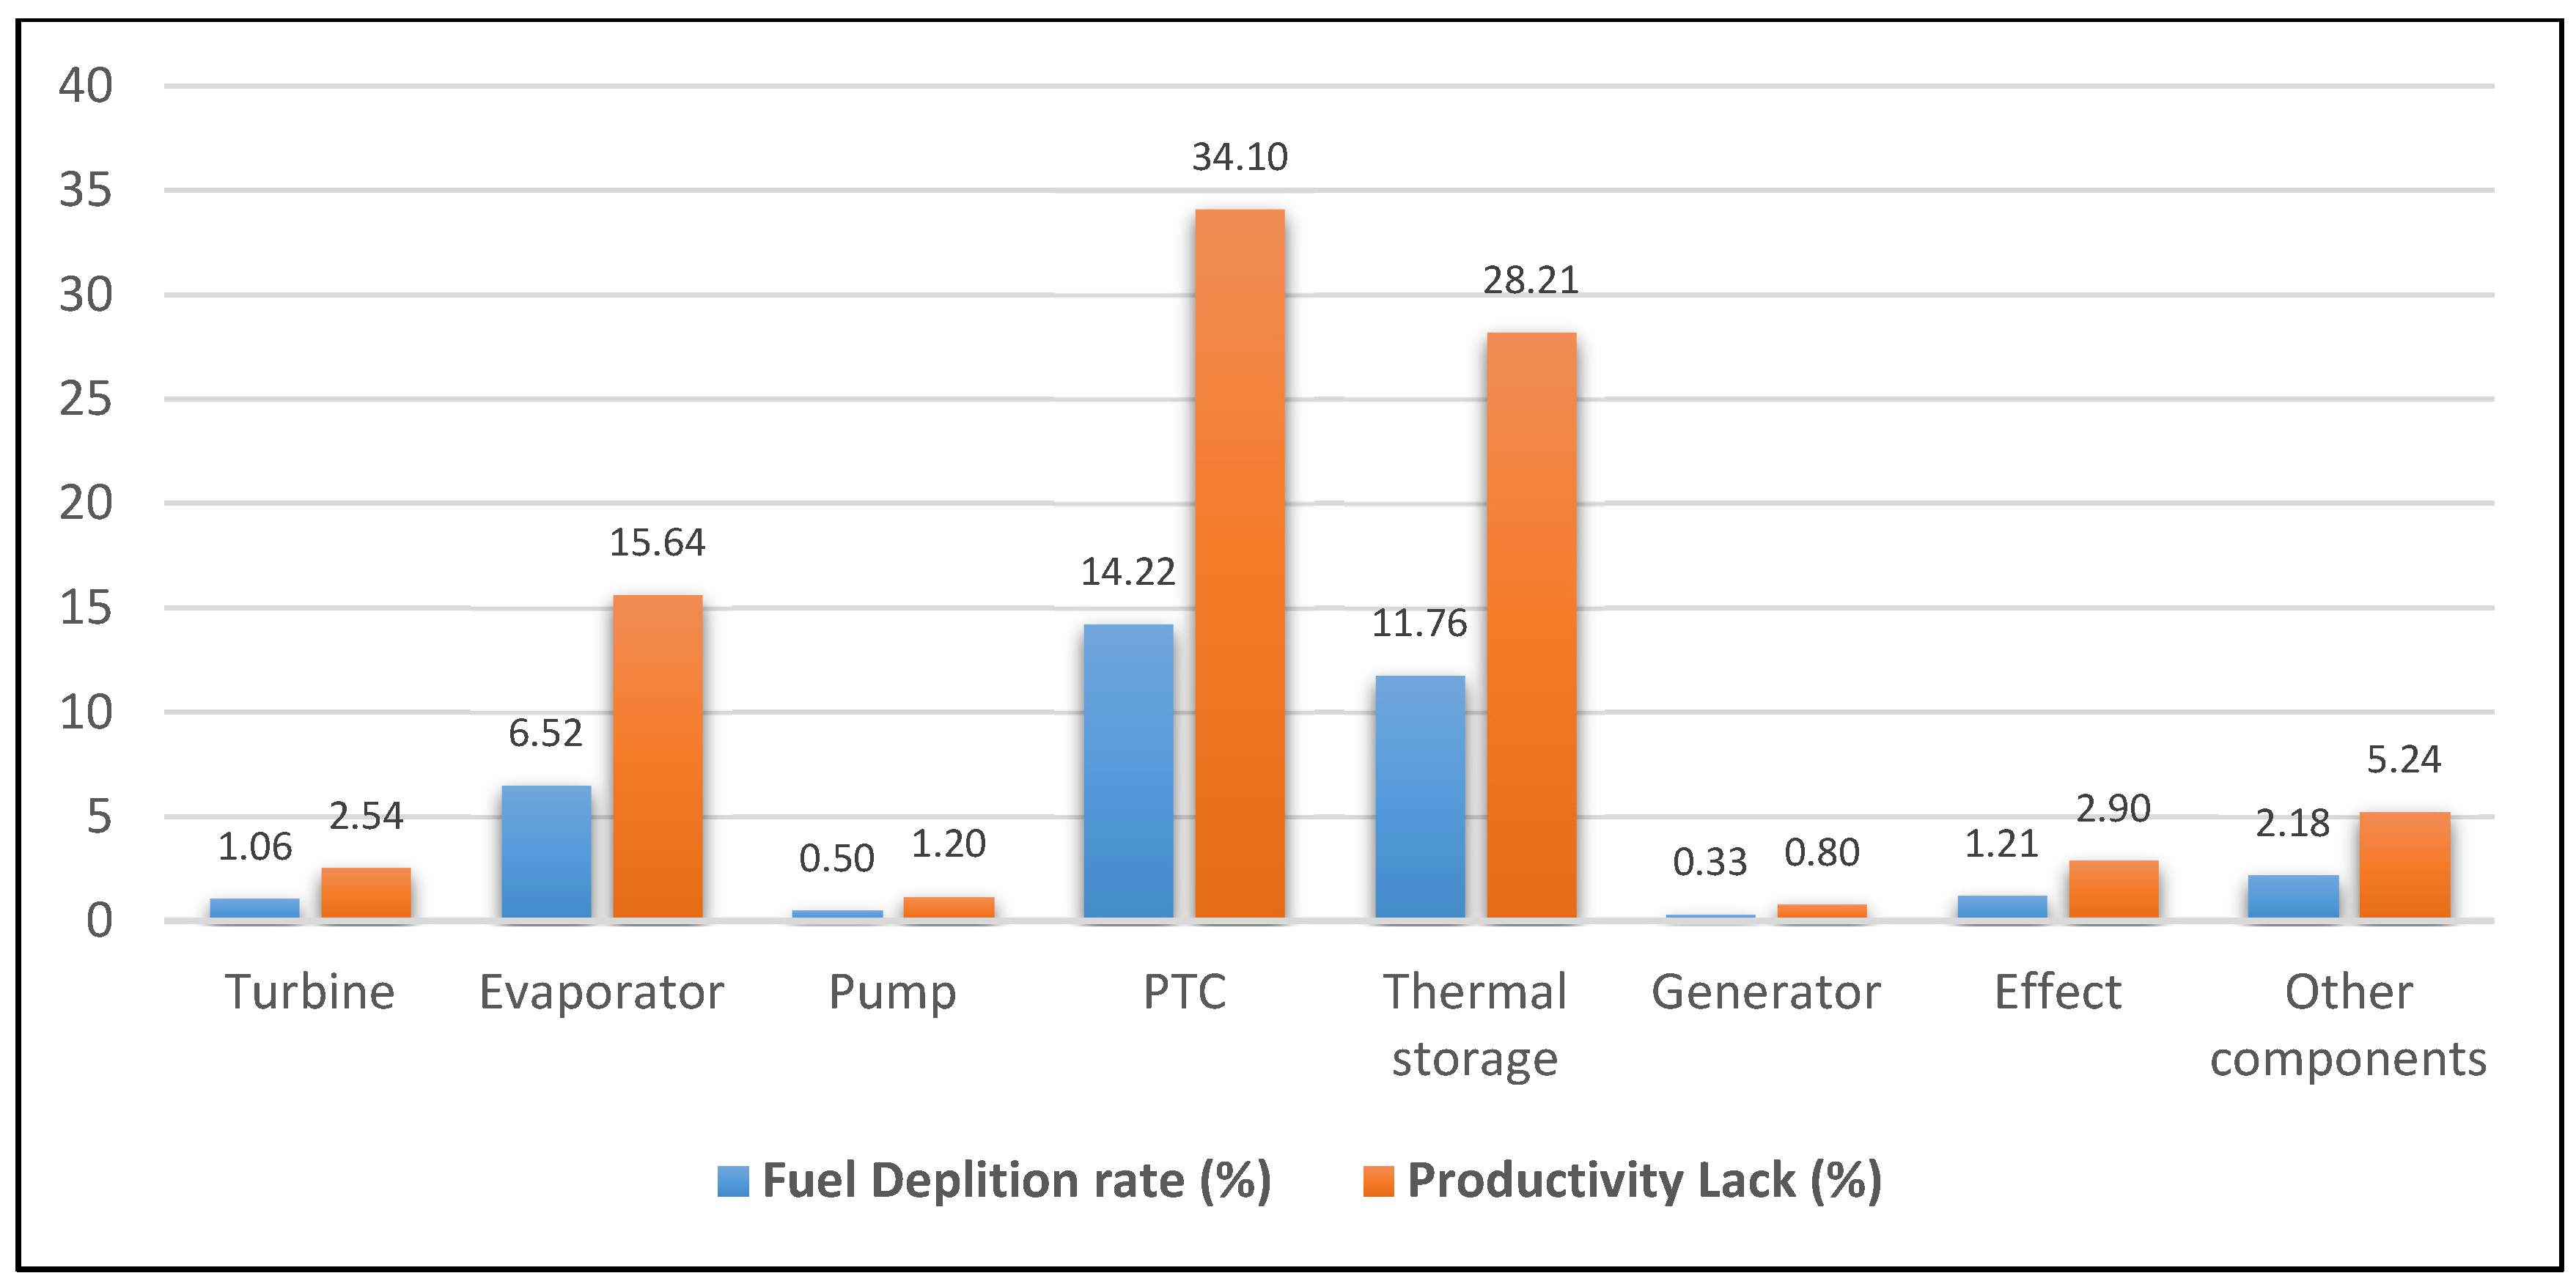
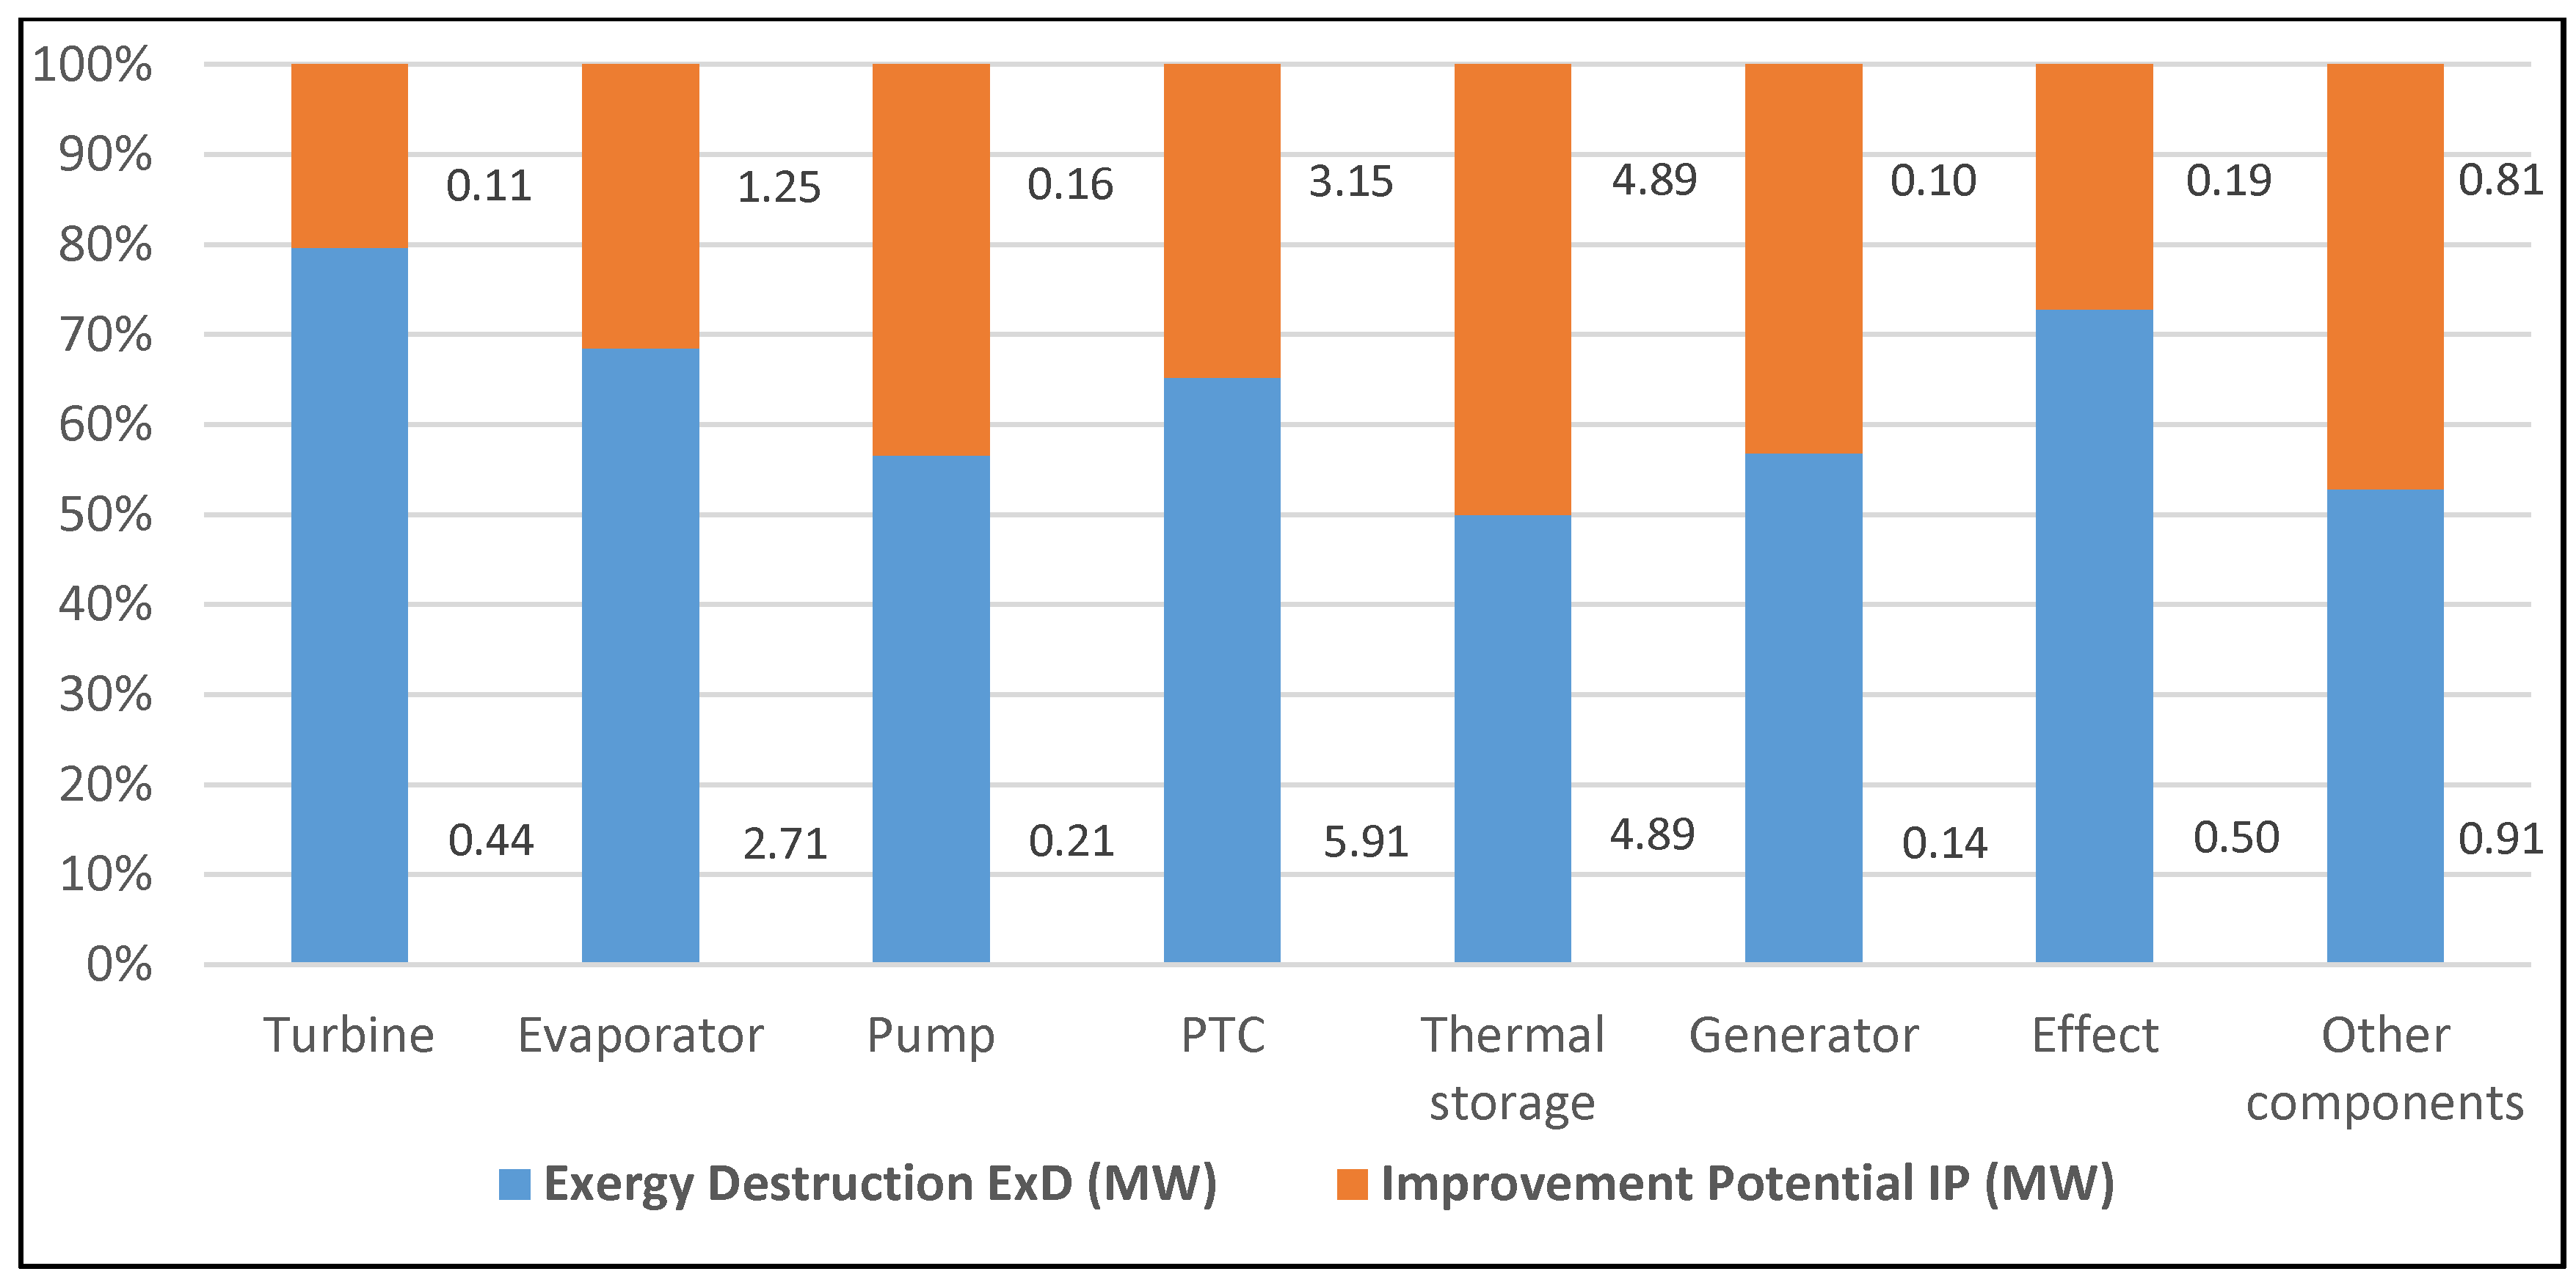
  • The highest exergy destruction value for the PTC leads to the improvement potential in terms of effectiveness. Moreover, PTC has the highest fuel depletion value, which is directly proportional to productivity lack.
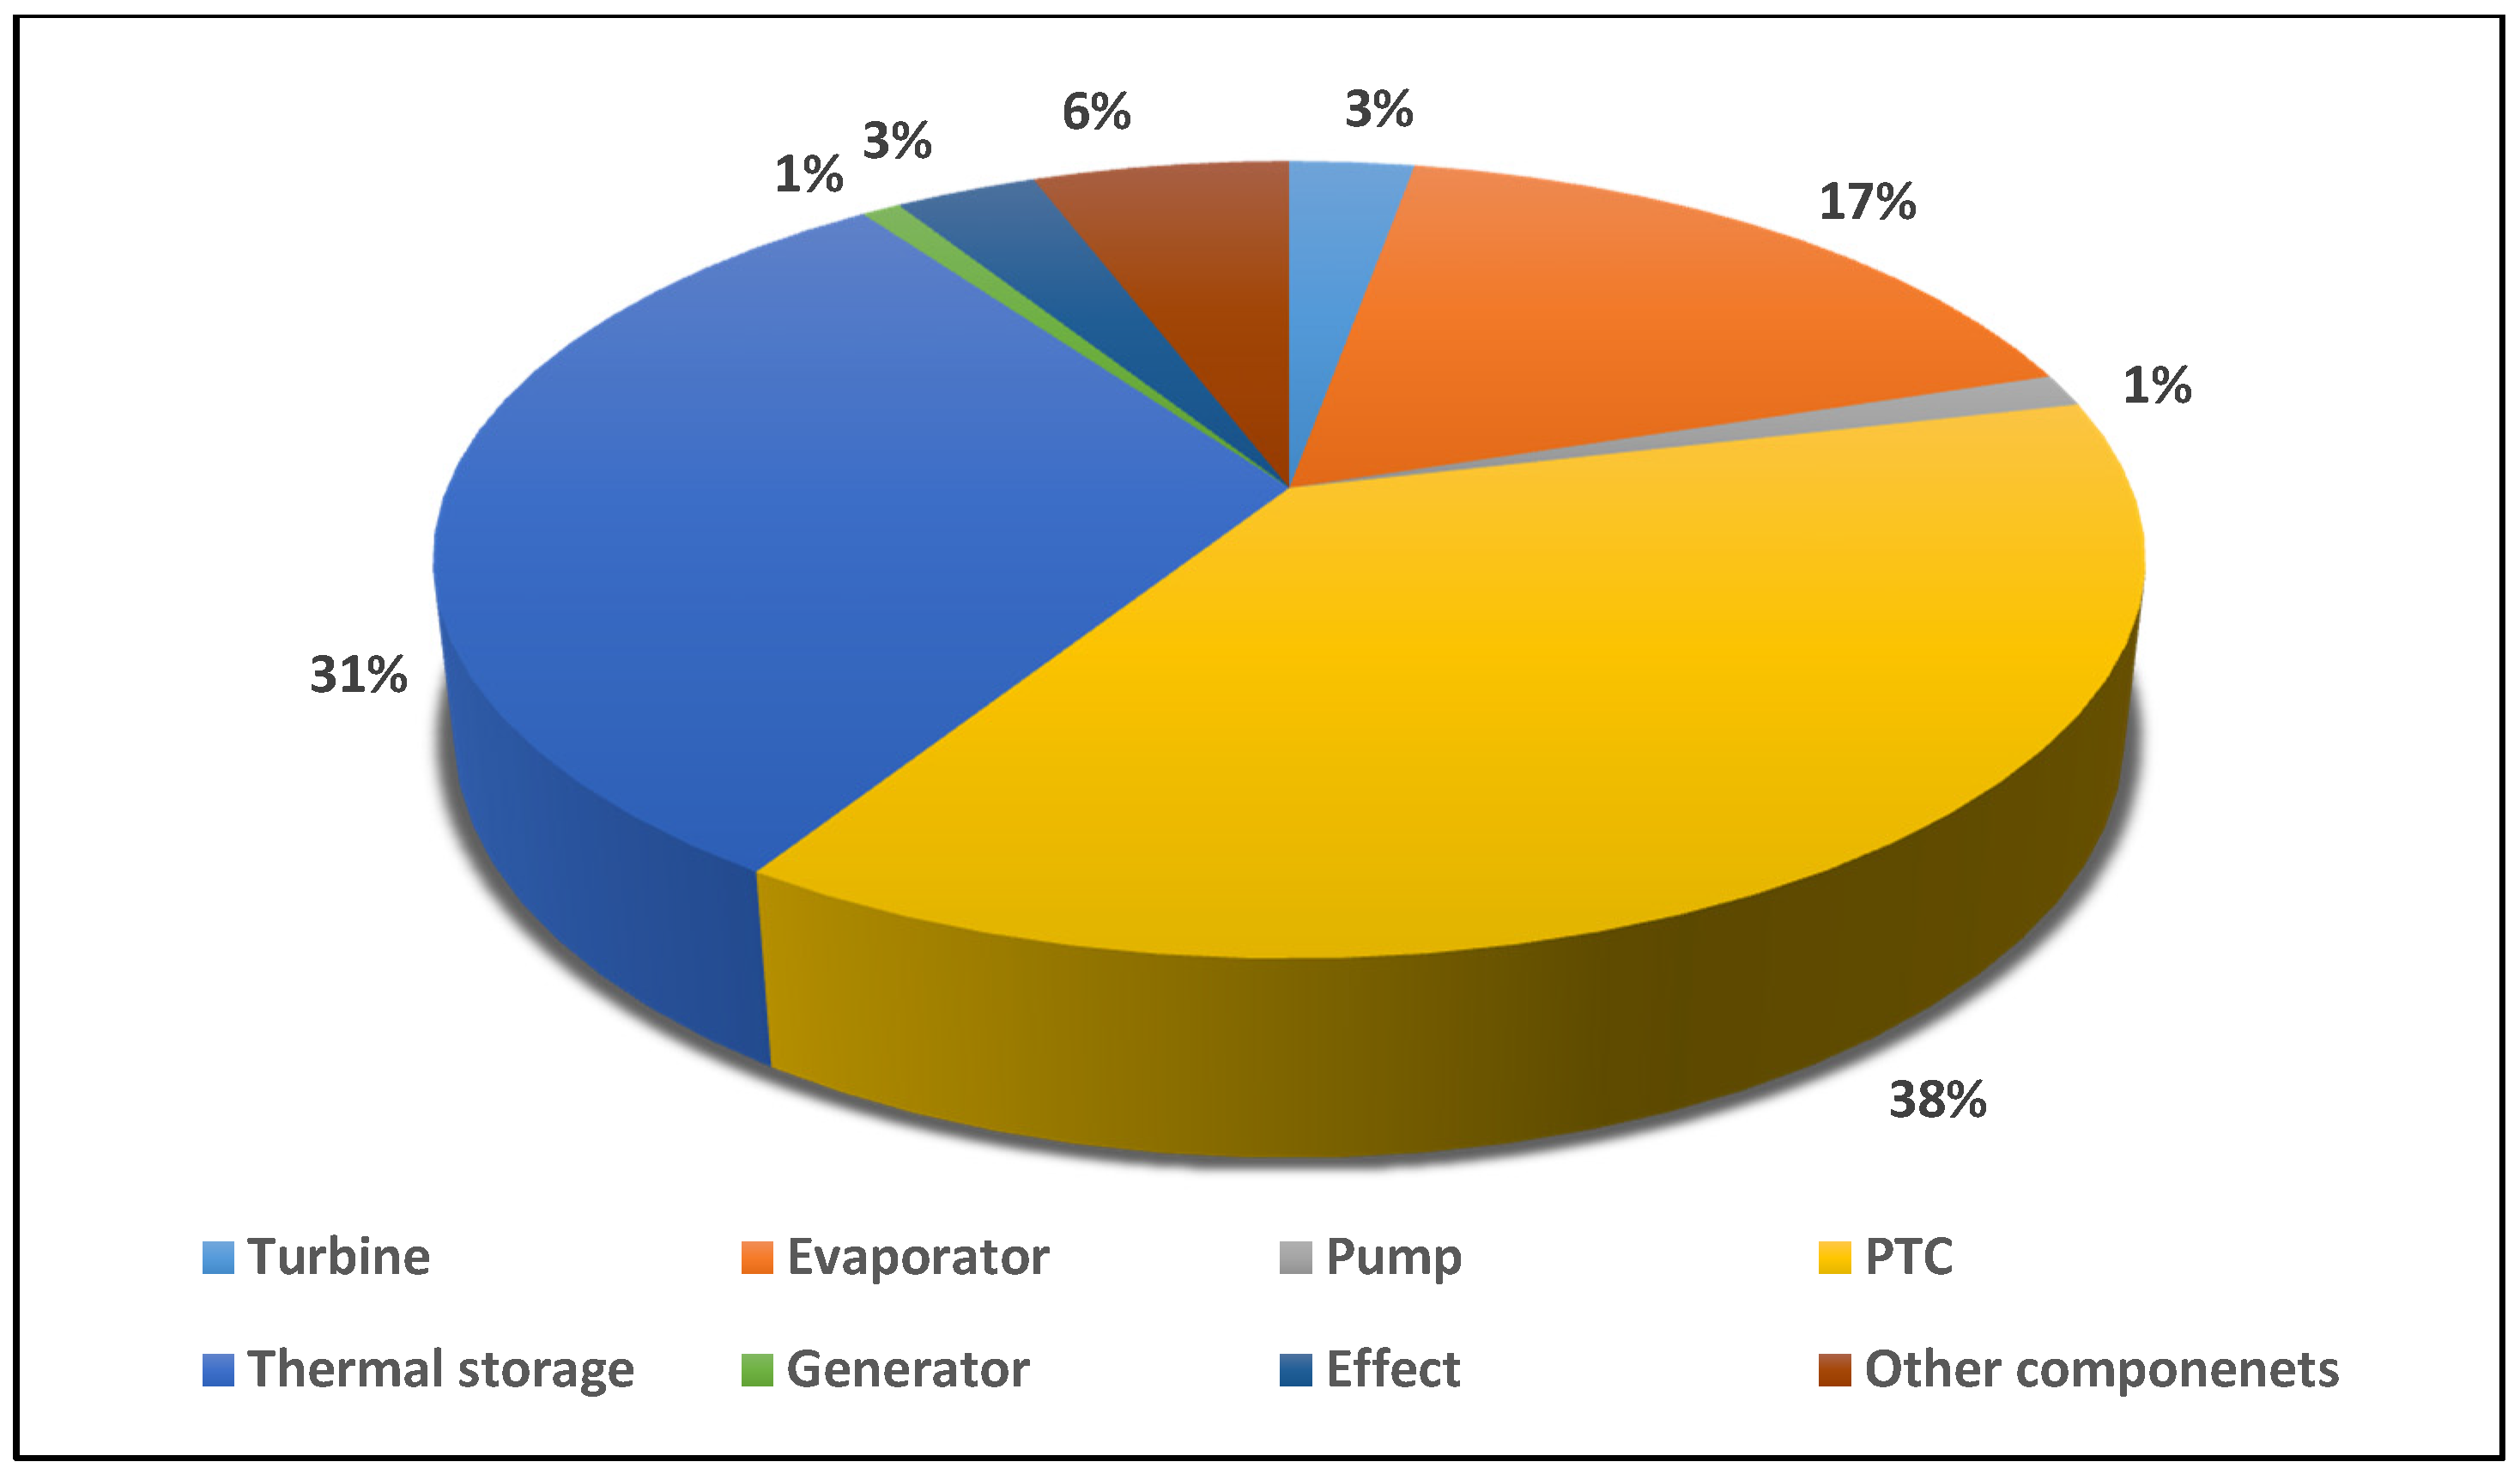
  • The highest exergy destruction values for the PTC, thermal storage, and evaporator in the solar tri-generation system mean that these components need to be improved.
  • From the analysis of exergy destruction in the solar tri-generation system, as illustrated in Figure 3, the PTC is the main source of exergy destruction at 38% followed by the thermal storage, evaporator, other components, effect, turbine, generator, and pump at 31%, 17%, 6%, 3%, 3%, 1%, and 1% respectively.
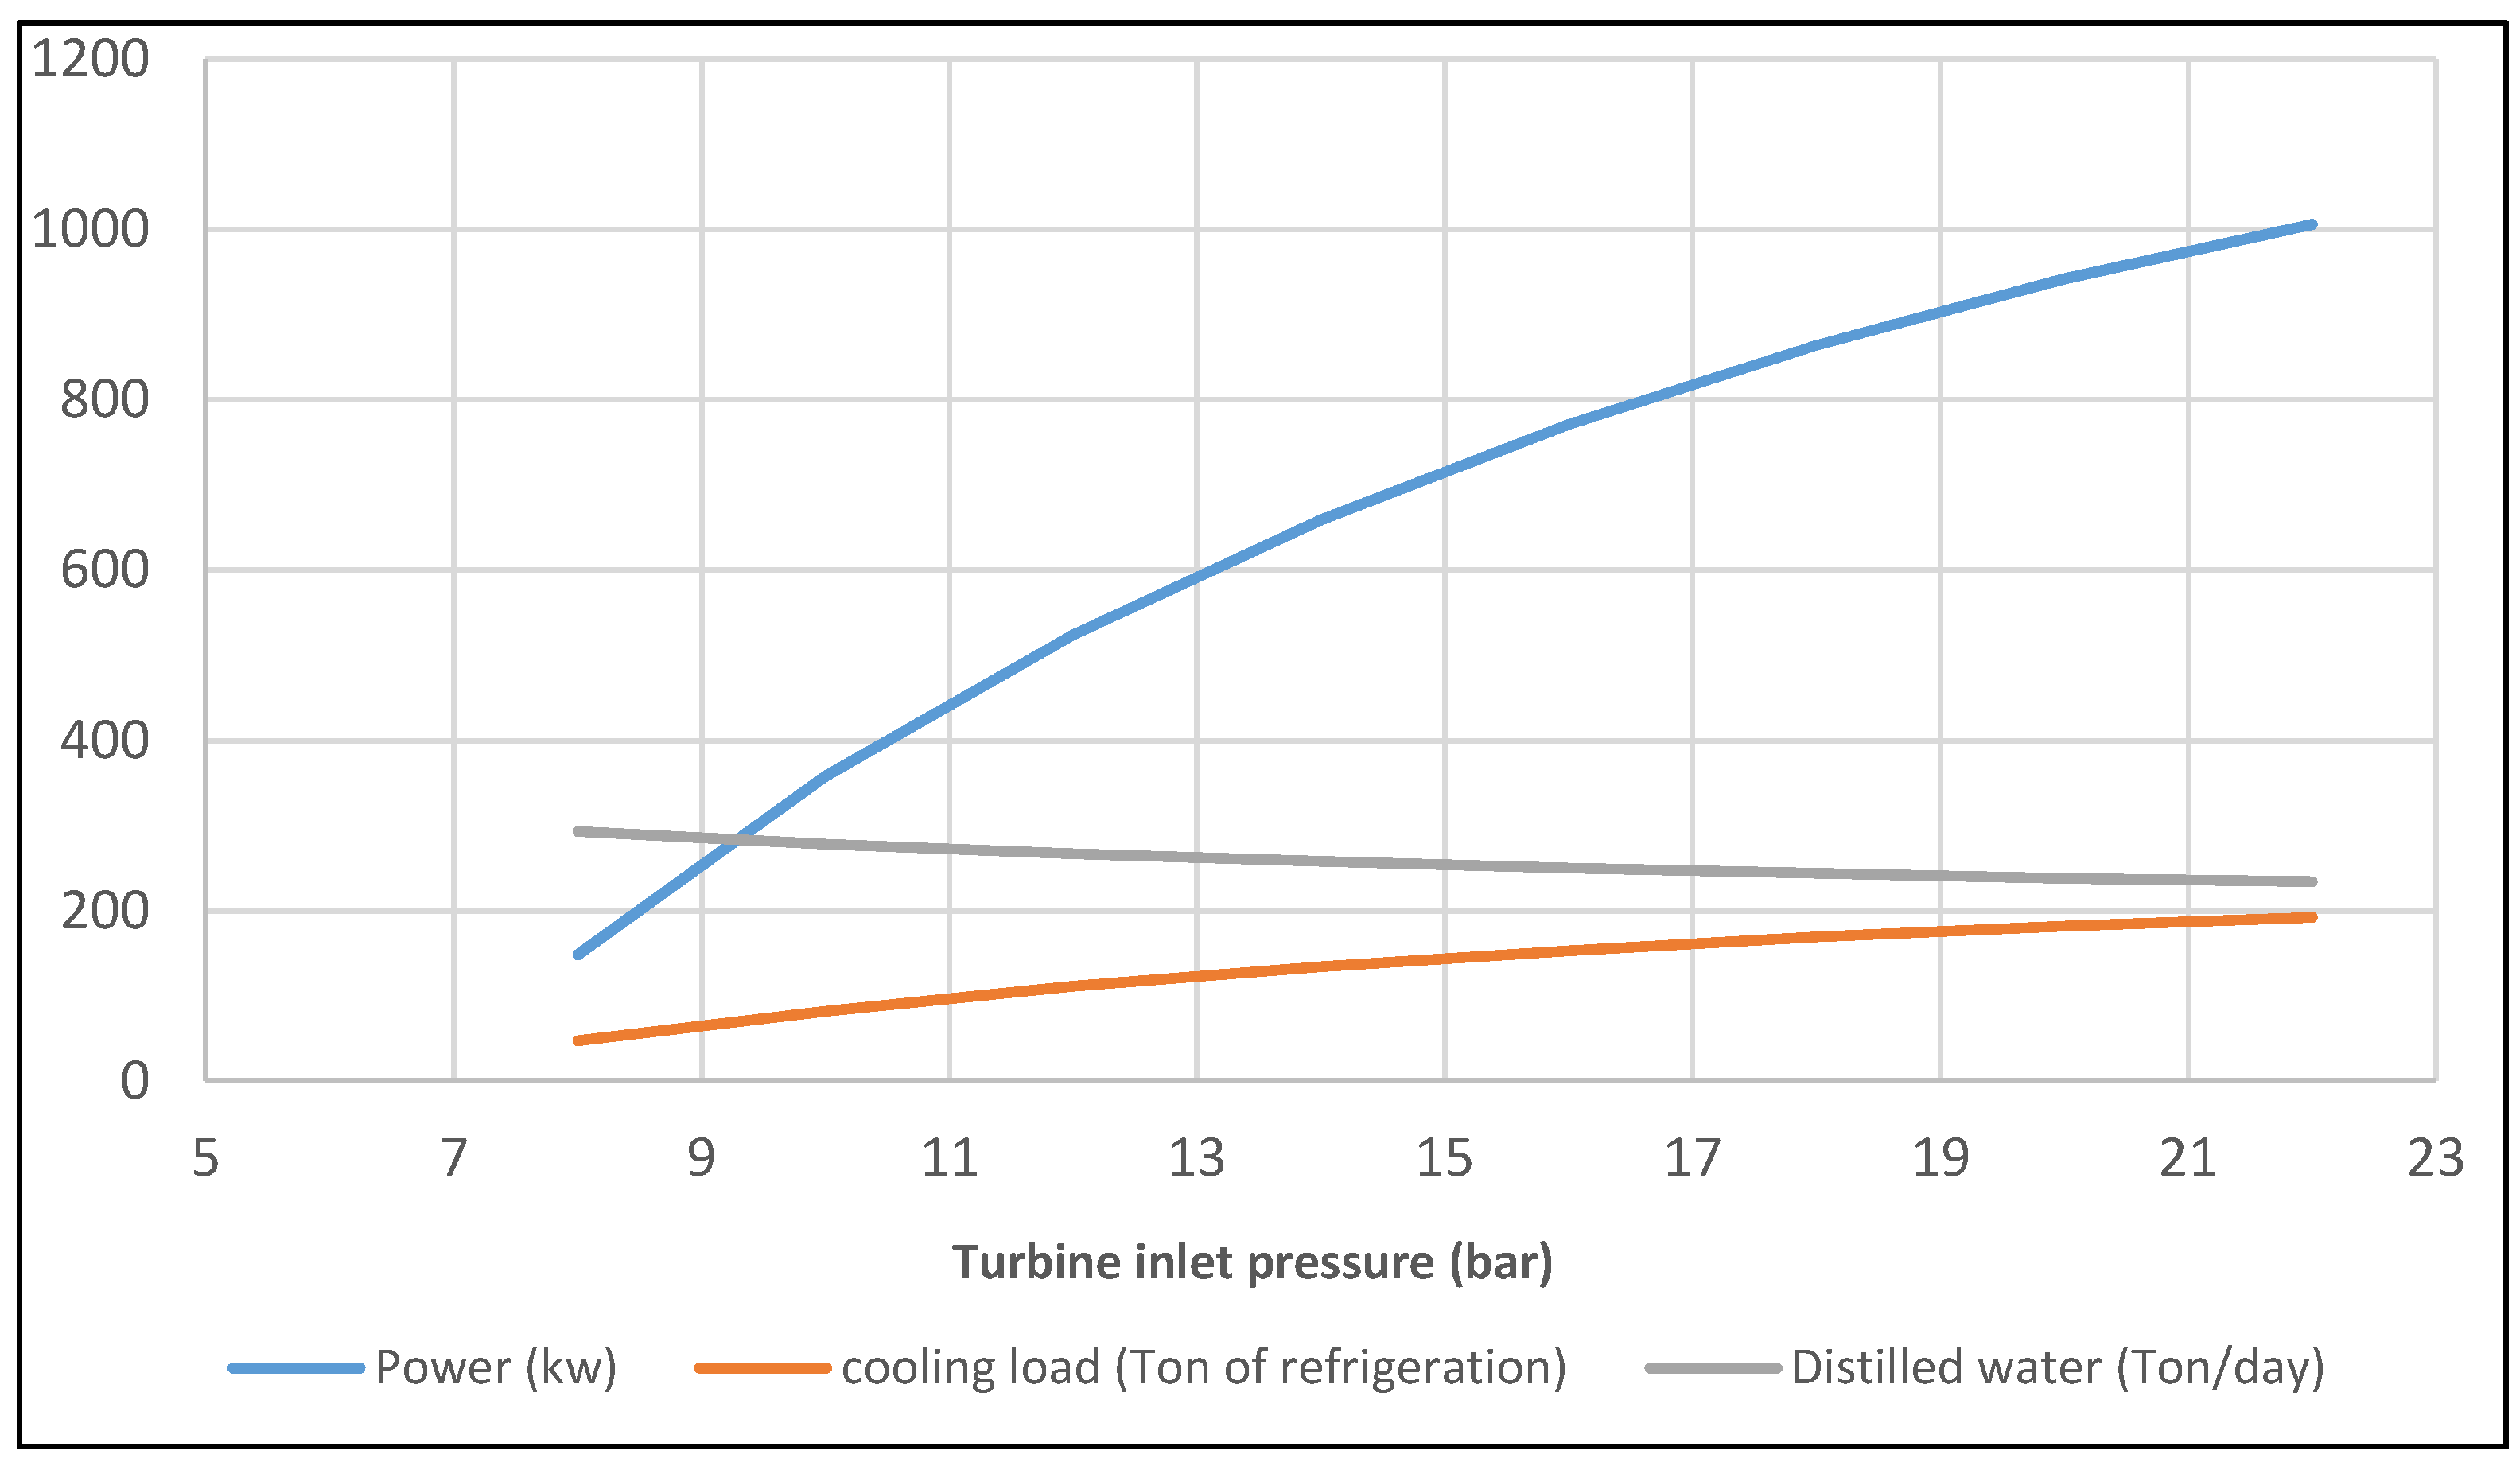
  • The optimum value for inlet turbine pressure is 22.3 bar for this tri-generation case.
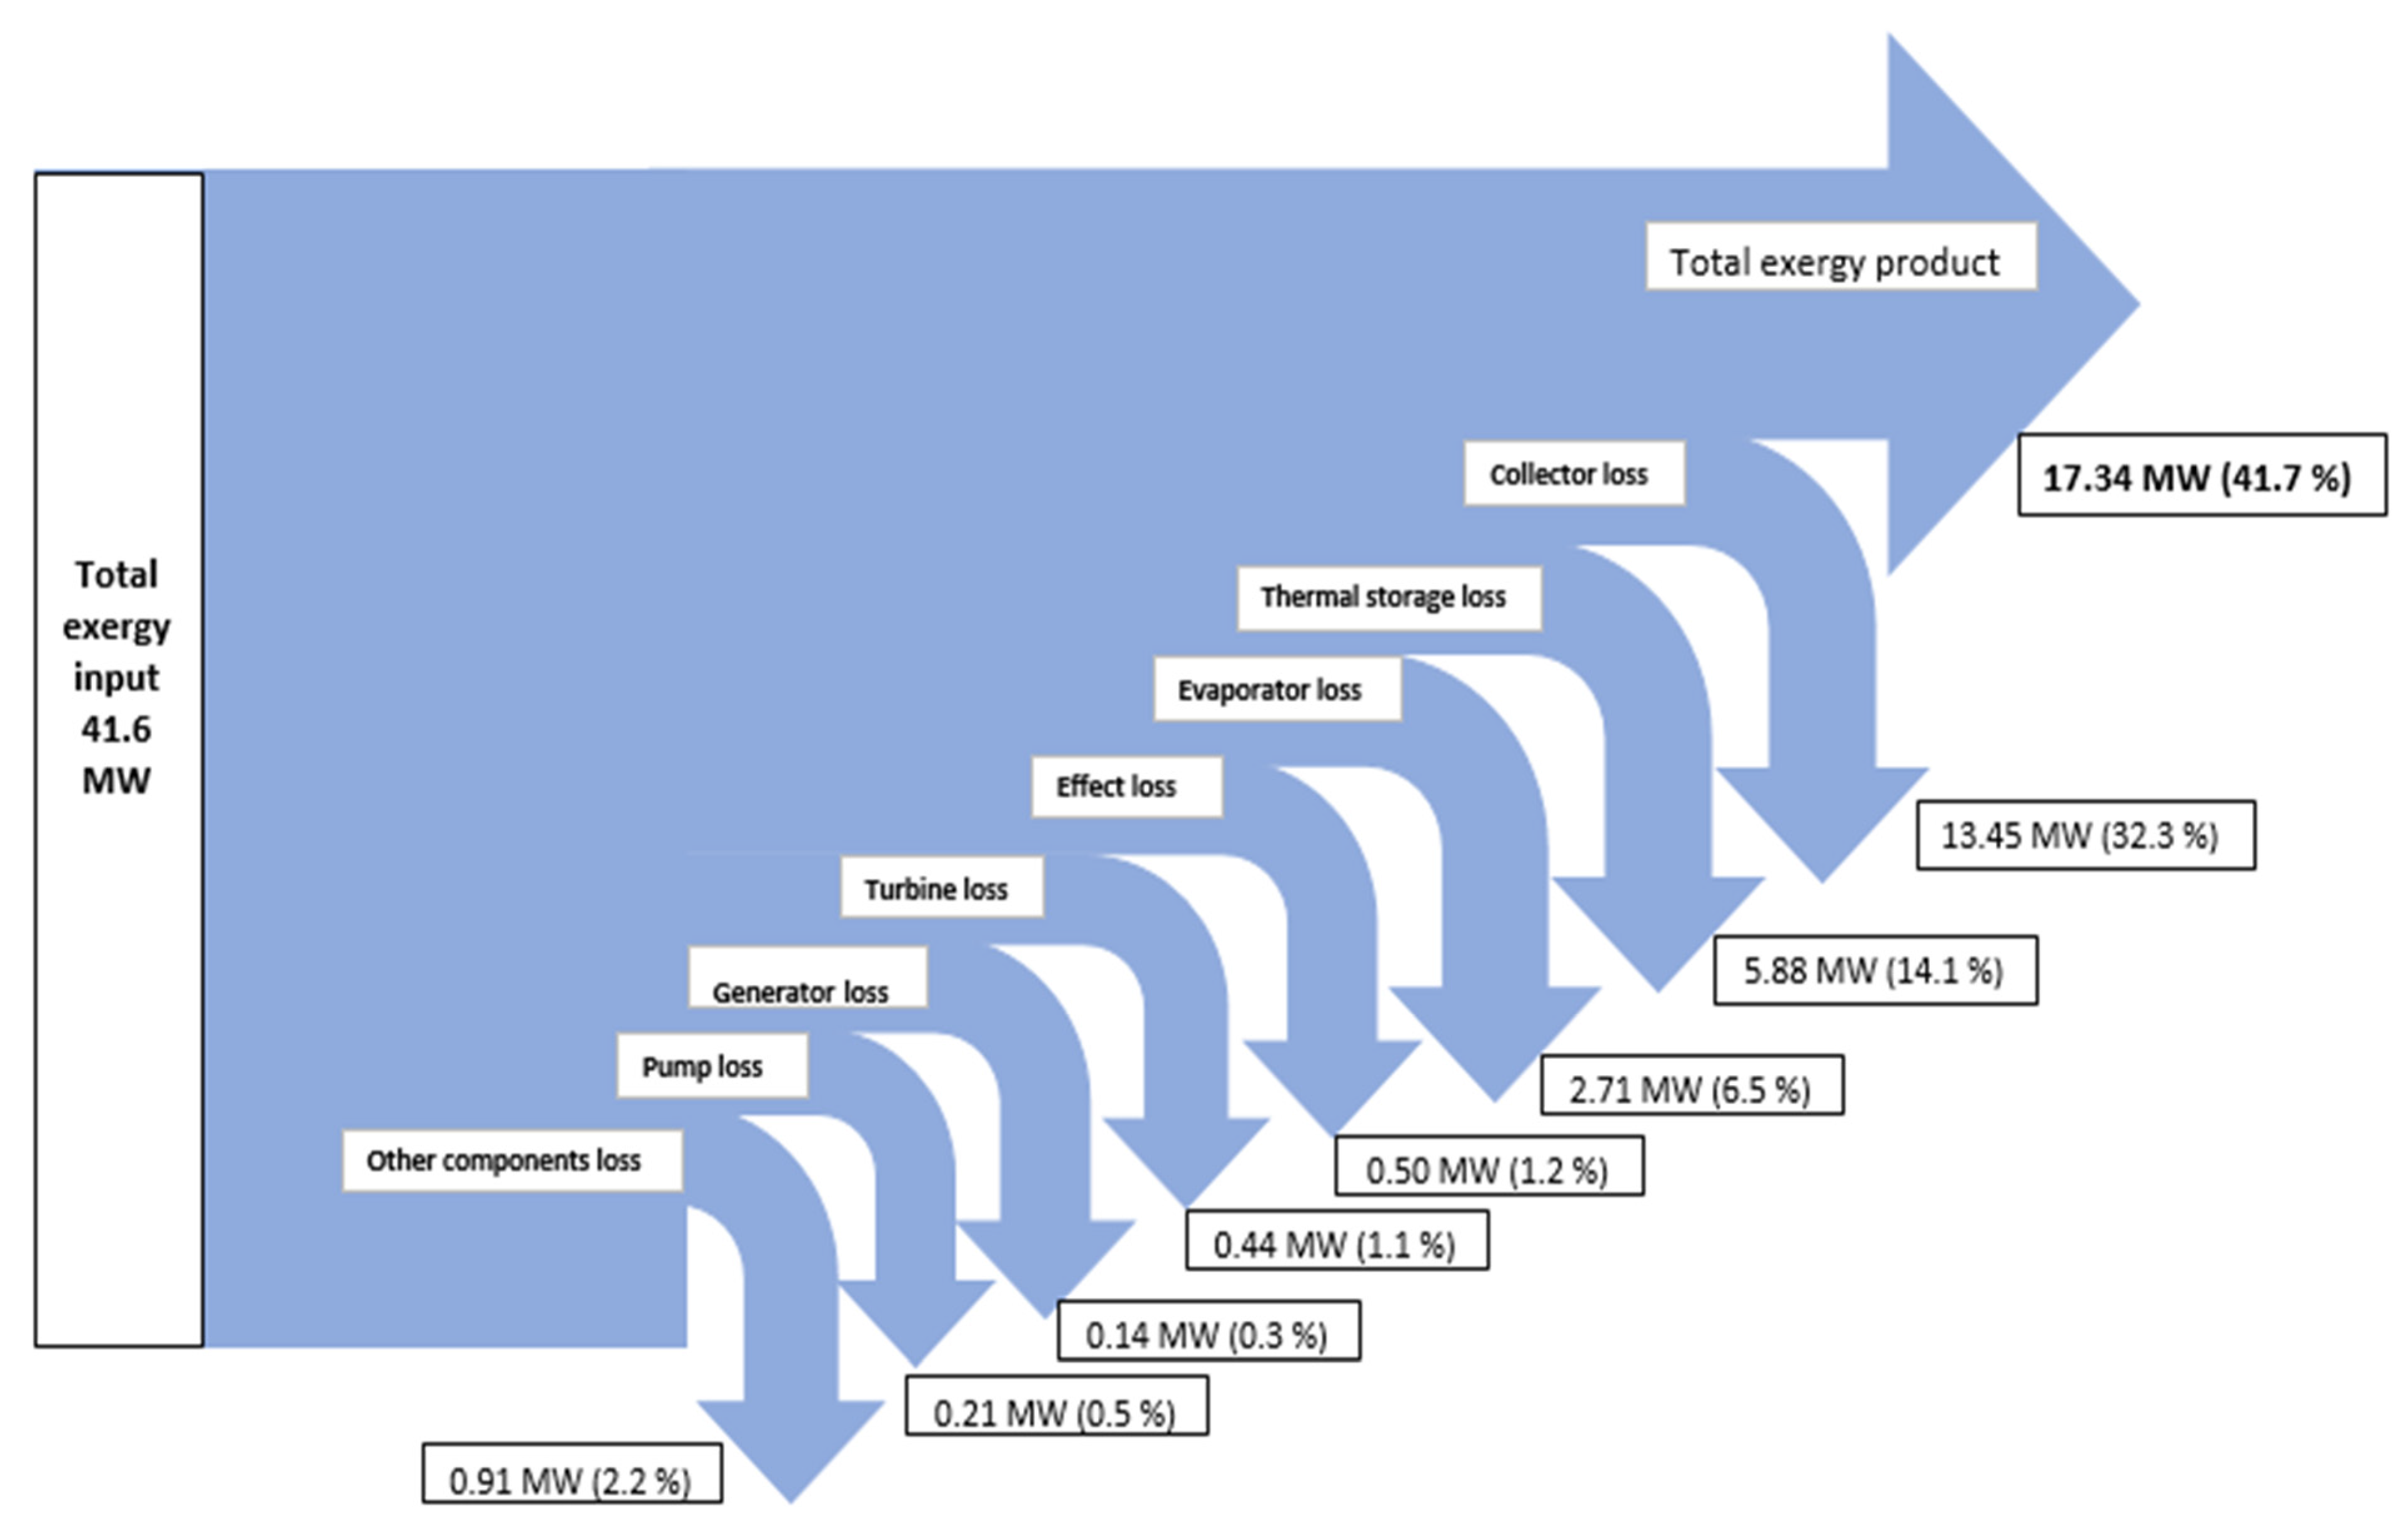
  • The exergy efficiency of the solar tri-generation system is 41.7% and for this specific system, the ORC, single absorption chiller, and single effect desalination were able to produce about 1 MW of electrical power, 194 Ton of refrigeration cooling load, and 234 t/day distilled water.

Author Contributions

This paper is the result of PhD studies at Newcastle University under the supervision of Professor Agnew. It is a composite produced from the research activities of the other authors. The authors have contributed equally to this paper in their own way.

Conflicts of Interest

The authors declare no conflict of interest.

Nomenclature

A
area (m2)
E x
Exergy (kw)
h
Specific enthalpy (kJ/kgK)
I
solar intensity(W/m2)
I R
Irreiversibility (kw)
L
length (m)
m
mass flow rate (kg/s)
P
pressure (bar)
N
number of collector
Q
heat transfer rate (kw)
S
Specific entropy (kJ/kgK)
T
temperature (°C)
W o
aperture (m)
W
Work input/work transfer rate (kw)
w
Salinity
Χ
Concentration
Z
Elevation(m)

Abbreviations

ACH
Absorption Chiller
COP
Coefficient of Performance
H2O
Water
H T O
Heat Transfer Oil
GWP
Global warming potential
LiBr
Lithium Bromide
LiBr/H2O
Lithium bromide water mixture
O R C
Organic Rankine Cycle
ODP
Ozone depletion potential
P T C
Prabolic Trough Collector
SED
Single Effect Desalination
TR
Ton of refrigeration

Greek Symbols

η
thermal efficiency
ε
exergy efficiency
ΔT
Temperature difference

Subscripts

a
ambient temperature
Ab
Absorber
co
Condenser
c.v.
Control volume
cwp
Cooling water pump
ev
Evaporator
F
Fuel
f
fluid
G
generator
H
hot
i
inlet
L
loss
m
Mechanical
o
outlet
p
pump
r
recieiver
s
solar
ss
Strong solution
t
Thermal
w
Water
Wf
Working fluid
wfp
Working fluid pump
ws
Weak solution

Appendix

Table A1. Constants used to calculate the enthalpy and entropy of Lithium bromide.
n a n b n c n d n
0−945.8−0.32937.43 × 10−3−2.27 × 10⁻⁶
14.78 × 1024.08 × 10−2−1.51 × 10⁻⁴-
2−1.59235−1.36 × 10−51.36 × 10−6-
32.09 × 10⁻²−7.14 × 10⁻⁶--
4−7.69 × 10⁻⁵---
Table A2. Constants used to calculate the enthalpy and entropy of Lithium bromide.
i B i 0 B i 1 B i 2 B i 3
00.5127558−0.013939542.92415 × 10−59.0357 × 10⁻⁷
10.01225678−9.15682 × 10−51.82045 × 10−8−7.99181 × 10⁻¹⁰
2−1.3649 × 10−51.0689 × 10−7−1.38111 × 10−91.52978 × 10−11
31.0215 × 10−8000
Table A3. Constants used to calculate the enthalpy and entropy of seawater.
Correlations for equations (13) and (16)
b 1 = 2.348 × 10 4 b 6 = 4.417 × 10 1 c 1 = 4.231 × 10 2 c 1 = 1.443 × 10 1
b 2 = 3.152 × 10 5 b 7 = 2.139 × 10 1 c 2 = 1.463 × 10 4 c 7 = 5.879 × 10 4
b 3 = 2.803 × 10 6 b 8 = 1.991 × 10 4 c 1 = 9.880 × 10 4 c 8 = 6.111 × 10 1
b 4 = 1.446 × 10 7 b 9 = 2.778 × 10 4 c 4 = 3.0951 × 10 5 c 9 = 8.041 × 10 1
b 5 = 7.826 × 10 3 b 10 = 9.728 × 10 1 c 5 = 2.562 × 10 1 c 10 = 3.035 × 10 1
Table A4. Input data for solar trigeneration systems.
Parabolic trough collector (PTC)
Length49m[21]
Aperture5m[21]
Optical efficiency0.76%[21]
Direct normal irradiance810W/m2[20]
Number of collector134--
Organic rankine cycle (ORC)
Organic cycle turbine efficiency80%[32]
Organic cycle pump efficiency85%[32]
Turbine inlet pressure22.3bar[36]
Electrical generator efficiency95%[37]
Electrical motor efficiency95%[37]
Single effect desalination (SED)
Seawater temperature27°C[38]
Salinity0.038-[39]
Absorption chiller (ACH)
Inlet evaporator temperature18.2°C[40]
Outlet condenser temperature36.5°C[41]
Cooling water temperature27°C[29]
Mechanical efficiency75%[29]
Pump efficiency90%[29]

References

  1. Rowe, D.M. Modules, Systems, and Applications in Thermoelectrics; CRC Press: Boca Raton, FL, USA, 2012. [Google Scholar]
  2. Liu, H.; Shao, Y.; Li, J. A biomass-fired micro-scale CHP system with organic Rankine cycle (ORC)—Thermodynamic modelling studies. Biomass Bioenerg. 2011, 35, 3985–3994. [Google Scholar] [CrossRef]
  3. Dincer, I. Renewable energy and sustainable development: A crucial review. Renew. Sustain. Energy Rev. 2000, 4, 157–175. [Google Scholar] [CrossRef]
  4. Carayannis, E.G. Planet Earth 2011—Global Warming Challenges and Opportunities for Policy and Practice; InTech: Rijeks, Croatia, 2011; p. 656. [Google Scholar]
  5. Nafey, A.S.; Sharaf, M.A. Combined solar organic Rankine cycle with reverse osmosis desalination process: Energy, exergy, and cost evaluations. Renew. Energy 2010, 35, 2571–2580. [Google Scholar] [CrossRef]
  6. Mathkor, R.Z.; Agnew, B.; Al-Weshahi, M.A.; Etaig, S. Thermal analysis of a solar powered ORC in Libya. Appl. Mech. Mater. 2015, 789–790, 389–395. [Google Scholar]
  7. Li, C.; Kosmadakis, G.; Manolakos, D.; Stefanakos, E. Performance investigation of concentrating solar collectors coupled with a transcritical organic Rankine cycle for power and seawater desalination co-generation. Desalination 2013, 318, 107–117. [Google Scholar] [CrossRef]
  8. Al-Sulaiman, F.A.; Dincer, I.; Hamdullahpur, F. Exergy modeling of a new solar driven trigeneration system. Sol. Energy 2011, 85, 2228–2243. [Google Scholar] [CrossRef]
  9. Al-Sulaiman, F.A. Thermodynamic Modeling and Thermoeconomic Optimization of Integrated Trigeneration Plants Using Organic Rankine Cycles. Ph.D. Thesis, Mechanical Engineering, University of Waterloo, Waterloo, ON, Canada, 2010. [Google Scholar]
  10. Dharmadhikari, S.; Principaud, F. Contribution of stratified thermal storage to cost-effective trigeneration project. ASHRAE Trans. 2000, 106, 912–919. [Google Scholar]
  11. Jradi, M.; Riffat, S. Tri-generation systems: Energy policies, prime movers, cooling technologies, configurations and operation strategies. Renew. Sustain. Energy Rev. 2014, 32, 396–415. [Google Scholar] [CrossRef]
  12. Drescher, U.; Brüggemann, D. Fluid selection for the Organic Rankine Cycle (ORC) in biomass power and heat plants. Appl. Therm. Eng. 2007, 27, 223–228. [Google Scholar] [CrossRef]
  13. Karellas, S.; Schuster, A. Supercritical fluid parameters in organic rankine cycle applications. Int. J. Thermodyn. 2008, 11, 101–108. [Google Scholar]
  14. Maraver, D.; Sin, A.; Royo, J.; Sebastian, F. Assessment of CCHP systems based on biomass combustion for small-scale applications through a review of the technology and analysis of energy efficiency parameters. Appl. Energy 2013, 102, 1303–1313. [Google Scholar] [CrossRef]
  15. Dudley, V.E.; Slon, M.; Kearney, D. Test Results SEGS LS-2 Solar Collector. Technical Report for Sandia National Laboratories: Washington, DC, USA, December 1994. [Google Scholar]
  16. Ginosar, D.M.; Petkovic, L.M.; Guillen, D.P. Thermal stability of cyclopentane as an organic Rankine cycle working fluid. Energy Fuels 2011, 25, 4138–4144. [Google Scholar] [CrossRef]
  17. Pierobon, L.; Nguyen, T.V.; Larsen, U.; Haglind, F. Multi-objective optimization of organic Rankine cycles for waste heat recovery: Application in an offshore platform. Energy 2013, 58, 538–549. [Google Scholar] [CrossRef]
  18. Pasetti, M.; Invernizzi, C.M.; Iora, P. Thermal stability of working fluids for organic Rankine cycles: An improved survey method and experimental results for cyclopentane, isopentane and n-butane. Appl. Therm. Eng. 2014, 73, 764–774. [Google Scholar] [CrossRef]
  19. De Falco, M.; Giaconia, A.; Marelli, L.; Tarquini, P. Enriched methane production using solar energy: An assessment of plant performance. Int. J. Hydrog. Energy 2009, 34, 98–109. [Google Scholar] [CrossRef]
  20. Aldali, Y.; Morad, K. Thermal performance improvement of Derna electric power station (unit5) using solar energy. J. Sustain. Dev. 2014, 7, 60–71. [Google Scholar] [CrossRef]
  21. Price, H.; Lupfert, E.; Kearney, D. Advances in parabolic trough solar power technology. J. Sol. Energy Eng. 2002, 124, 109–125. [Google Scholar] [CrossRef]
  22. Baghernejad, A.; Yaghoubi, M. Exergy analysis of an integrated solar combined cycle system. Renew. Energy 2010, 35, 2157–2164. [Google Scholar] [CrossRef]
  23. Al-Weshahi, M.A.; Anderson, A.; Tian, G. Organic Rankine Cycle recovering stage heat from MSF desalination distillate water. Appl. Energy 2014, 130, 738–747. [Google Scholar] [CrossRef]
  24. Feuercker, G.; Scharfe, J.; Greiter, I.; Frank, C.; Alefeld, G. Measurement of thermophysical properties of aqueous LiBr solution at high temperatures and concentrations. In Proceedings of the International Absorption Heat Pump Conference ASME, New Orleans, LA, USA, 1993; pp. 493–499.
  25. Kaita, Y. Thermodynamic properties of lithium bromide-water solutions at high temperatures. Int. J. Refrig. 2001, 24, 374–390. [Google Scholar] [CrossRef]
  26. Sharqawy, M.H.; Lienhard, V. On exergy calculations of seawater with applications in desalination systems. Int. J. Therm. Sci. 2011, 50, 187–196. [Google Scholar] [CrossRef]
  27. Sharqawy, M.H.; Lienhard, V.; Zubair, J.H.; Syed, M. The thermophysical properties of seawater: A review of existing correlations and data. Desalination Water Treat. 2010, 16, 354–380. [Google Scholar] [CrossRef]
  28. Bejan, A.; Tsatsaronis, G.; Moran, M. Thermal Design and Optimization, 1st ed.; Wiley: New York, NY, USA, 1996. [Google Scholar]
  29. Misra, R.D.; Sahoo, P.K.; Sahoo, S.; Gupta, A. Thermoeconomic optimization of a single effect water/LiBr vapour absorption refrigeration system. Int. J. Refrig. 2003, 26, 158–169. [Google Scholar] [CrossRef]
  30. Lozano, M.A.; Valero, A. Theory of the exergetic cost. Energy 1993, 18, 939–960. [Google Scholar] [CrossRef]
  31. Petela, R. Exergy analysis of the solar cylindrical-parabolic cooker. Sol. Energy 2005, 79, 221–233. [Google Scholar] [CrossRef]
  32. Holdmann, G. The Chena hot springs 400 KW geothermal power plant: Experience gained during the first year of operation. In Proceedings of the Geothermal Resources Council Annual Meeting, Sparks (Reno), NV, USA, 30 September–3 October 2007; pp. 515–519.
  33. Wang, X.; Christ, A.; Regenauer-Lieb, K.; Hooman, K. Low grade heat driven multi-effect distillation technology. Int. J. Heat Mass Transf. 2011, 54, 5497–5503. [Google Scholar] [CrossRef]
  34. Zabala, E. S. Technological and Economic Evaluation of District Cooling with Absorption Cooling Systems. Master’s Thesis, University of Gävle, Gävle, Sweden, 2009. [Google Scholar]
  35. Talbi, M.M.; Agnew, B. Exergy analysis: An absorption refrigerator using lithium bromide and water as the working fluids. Appl. Therm. Eng. 2000, 20, 619–630. [Google Scholar] [CrossRef]
  36. Price, H. Parabolic trough Organic Rankine Cycle solar power plant. In Proceedings of the 2004 DOE Solar Energy Technologies Program Review Meeting, Denver, CO, USA, 25–28 October 2004.
  37. Al-Sulaiman, F.A.; Hamdullahpur, F.; Dincer, I. Performance comparison of three trigeneration systems using Organic Rankine Cycles. Energy 2011, 36, 5741–5754. [Google Scholar] [CrossRef]
  38. Fath, H.E.S.; Ismail, M.A. Operational performance of 2 × 5000 m3/day MSF Sidi Krir desalination plant—Part I—enhancement of chemical cleaning and brine heater condensate process. In Proceedings of the 7th International Water Technology Conference, Cairo, Egypt, 1–3 April 2009; pp. 603–615.
  39. Hamza, A. Towards a Representative Network of Marine Protected Areas in Libya; Interim Report; IUCN: Gland, Switzerland; Málaga, Spain, 2011. [Google Scholar]
  40. Buru, M.M. A Geographical Study of the Eastern Jebel Akhdar, Cyrenaica. Ph.D. Thesis, Durham University, Durham, UK, 1960. [Google Scholar]
  41. Mehrabian, M.A.; Shahbeik, A.E. Thermodynamic modelling of a single-effect LiBr-H2O absorption refrigeration cycle. Proc. Inst. Mech. Eng. Part E: J. Process Mech. Eng. 2005, 219, 261–273. [Google Scholar] [CrossRef]

