1. Introduction
The centrifugal compressor is used for wide variety of applications in oil and gas industry including gas transport, gas lift, and gas injection. In such applications, the high efficiency and the wide stable operating range are essential requirements to reduce life cycle costs [
1]. One of the main factors that influence compressor efficiency and stability is the process gas composition. The change in the physical properties of the flowing gas obviously affects the compressor aerodynamic and thermodynamic performance characteristics. This impact becomes more significant while dealing with radial compressors and hydrocarbons. Moreover, the change in the gas composition alters the required polytropic head to achieve the desired discharge pressure, which in turn affects the required number of mechanical stages, as will be investigated further. Besides, the substantial fluctuation in the gas properties can cause the compressor to run into the surge region, leading to a sharp reduction in the compressor performance in addition to the high vibration altitude. This, in consequence, affects the mechanical strength and the availability of the compressor and can cause catastrophic damage to the compressor internals. This obviously explains the importance of reviewing the compressor design at the preliminary stage based on the expected variation in the gas composition.
The Schultz [
2] method determines the off-design efficiency as a function of the averaged gas properties. However, the effect of flow coefficient, Mach number, and work coefficient has not been considered so it cannot be used to predict the entire compressor map. The determination of the performance curve at various flow rates and speeds is important to investigate the consequential bearing on the stable operating range. In addition, some of the used assumptions to derive this model are valid only for ideal gas conditions. Several studies have been conducted using this approach such as Mallen
et al. [
3], Nathoo
et al. [
4], and Huntington [
5]. Hundseid
et al. [
6] investigated the effect of using the average polytropic exponent value on the accuracy of the determined performance characteristics. The proposed approach by ASME PTC-10 [
7] is in fact based on the Schultz model [
2] with a larger number of required meter readings. Yuanyuan
et al. [
8] improved the previous model by reducing the required measurements and by introducing a systematic approach to determine the off-design efficiency. However, this method does not consider the effect of the thermodynamic parameters on the polytropic efficiency and density ratio.
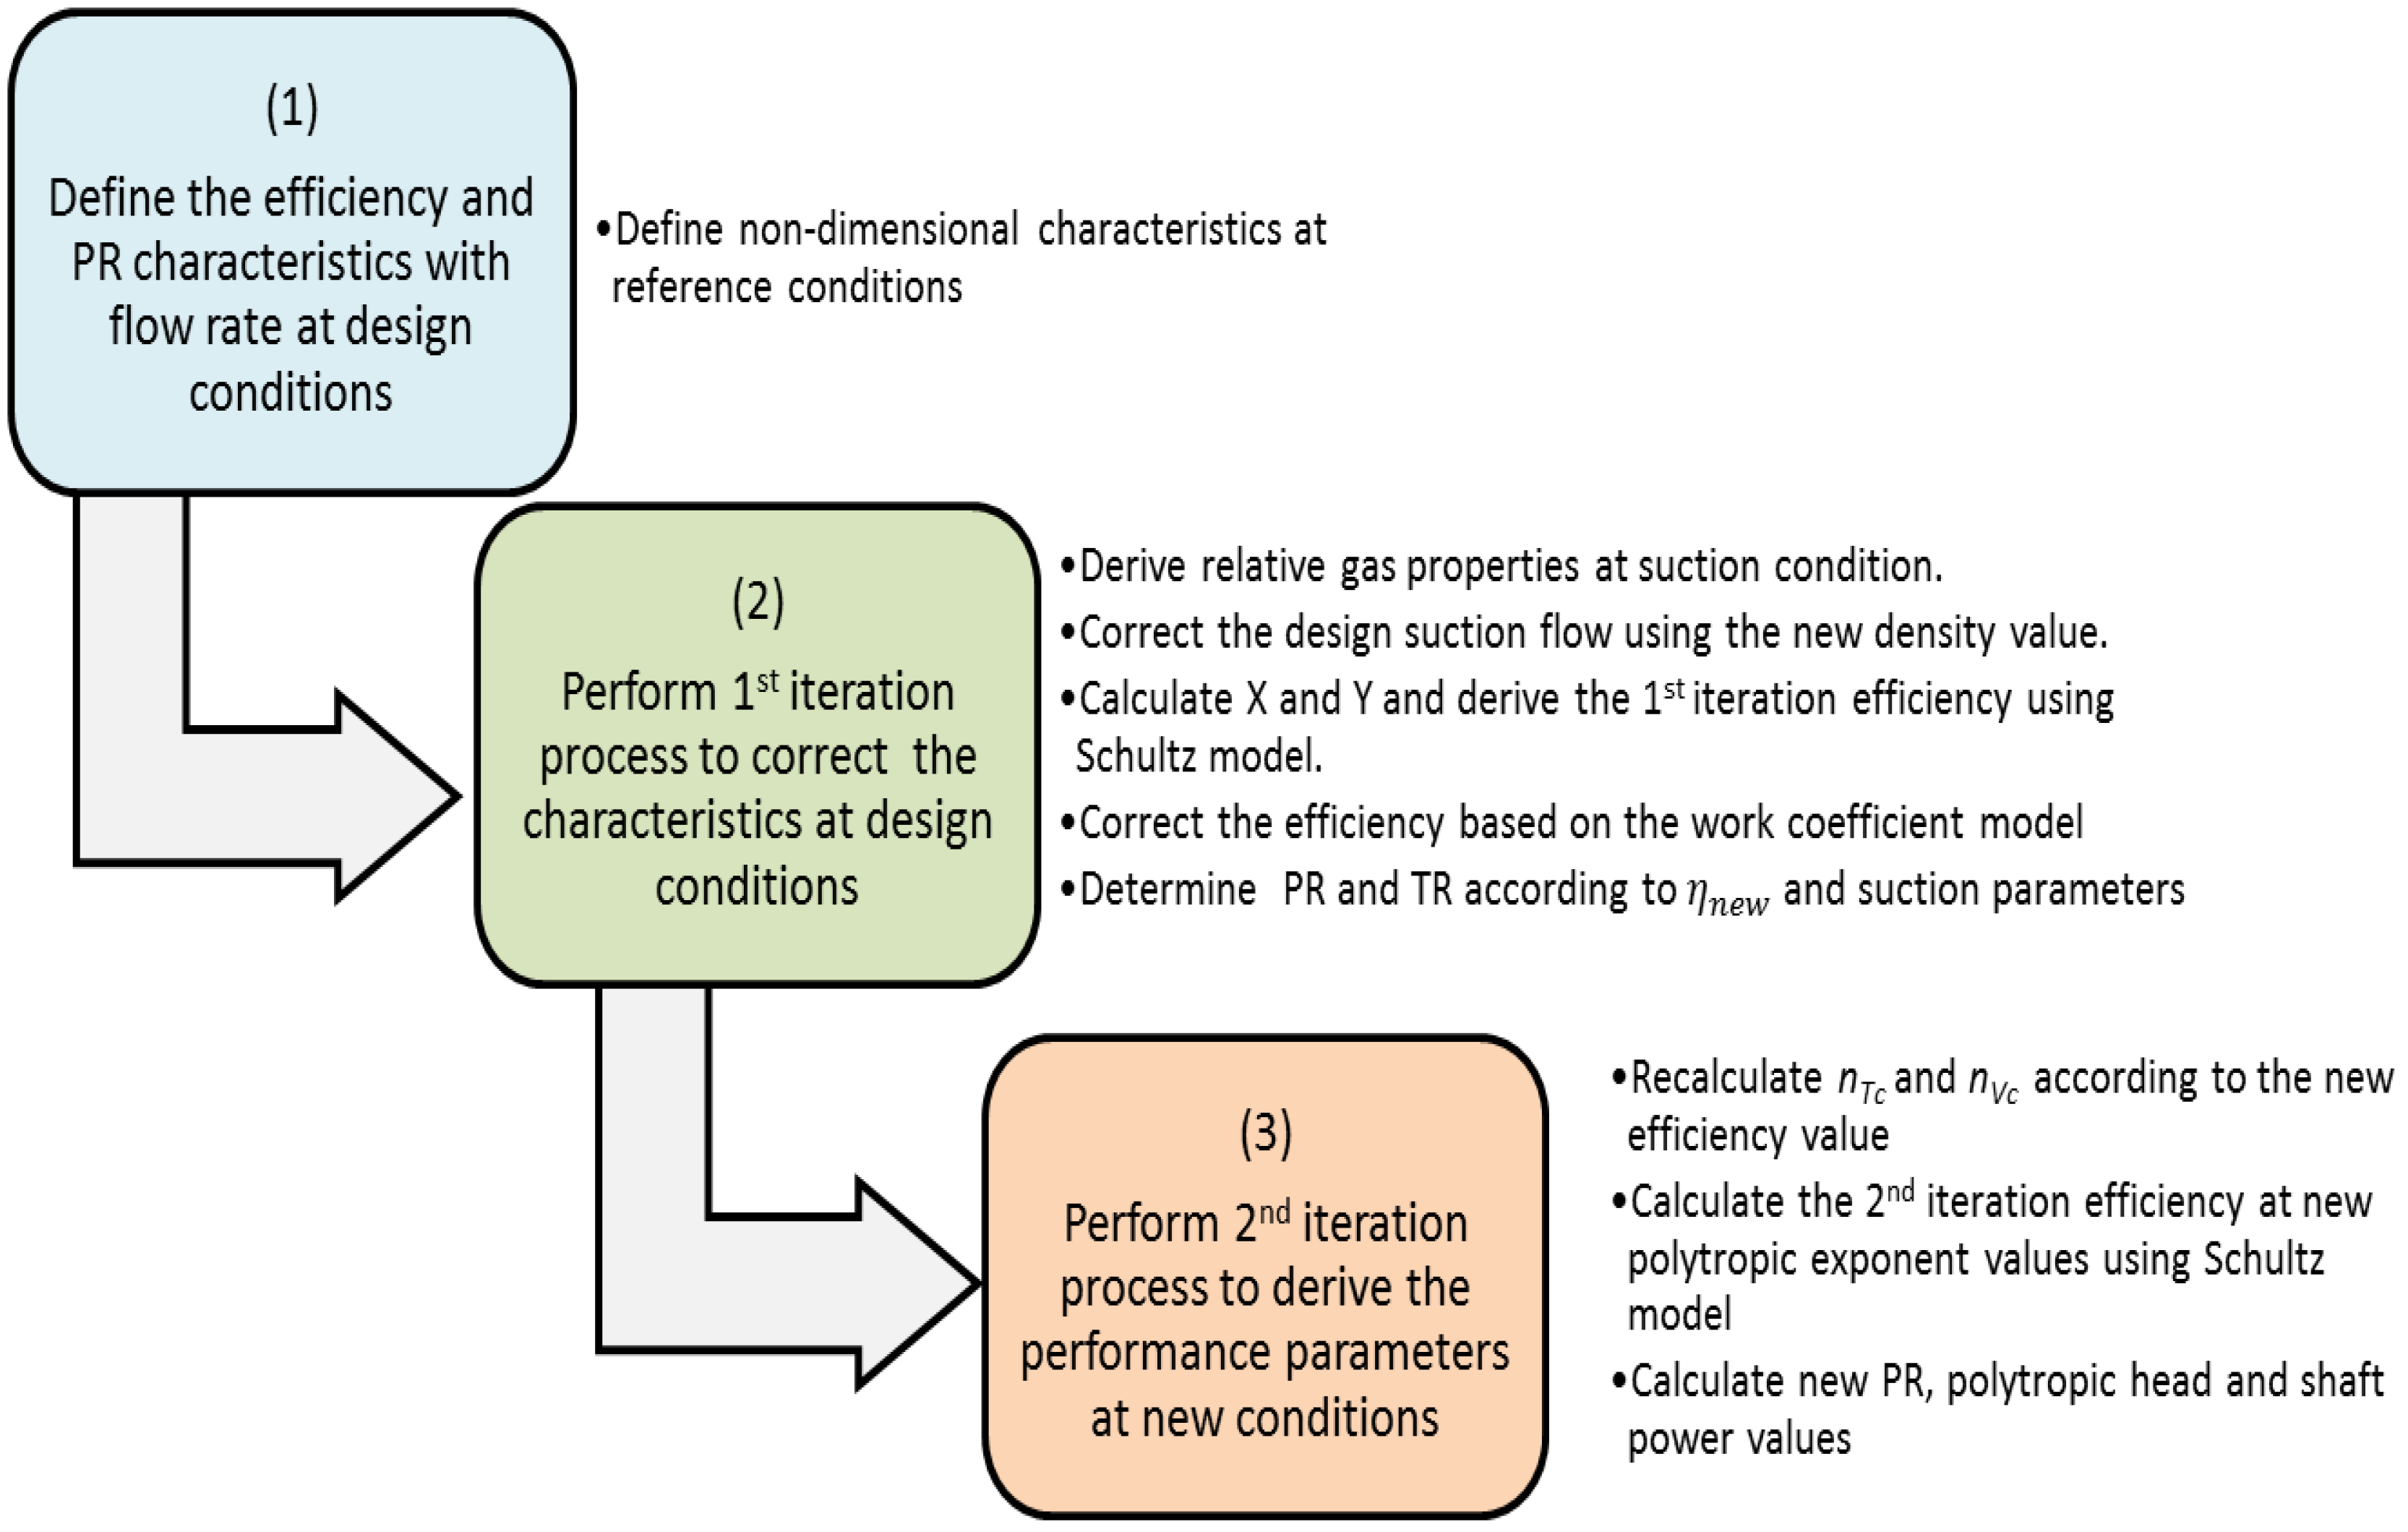
Therefore, a new model has been derived in the previous part in order to consider the variation in the suction pressure and temperature, gas properties, and stage efficiency. This method consists of four main steps, as shown in
Figure 1. The basic principle of this model is to consider the performance characteristics at design conditions as reference points to obtain the equivalent parameters at various operating conditions by performing an iteration process. There are three main features of this approach:
The efficiency is calculated based on four basic parameters: Mach number, gas properties, and work and flow coefficients. Hence, it can be used to derive the entire compressor map at various flow rates and rotating speeds.
The variation in the stage efficiency and gas properties has been taken into account in order to improve the accuracy of the obtained parameters.
The derived set of algebraic equations has fewer empirical coefficients and less dependency on the geometrical features. Therefore, it can be used at the preliminary design phase when detailed information on stage geometry is still not known.
Figure 1.
Developed iterative approach.
Figure 1.
Developed iterative approach.
The efficiency is determined initially using Equation (1) as a function of compressibility functions (
X,
Y), specific heat ratio (
k), and volume polytropic exponent (
):
However, when there is a variation in the flow rate at off-design conditions, the obtained efficiency has to be corrected further based on the new flow coefficient. Equation (2) has been derived from the work coefficient equation and the Casey-Robinson model [
9]:
Accordingly, the pressure ratio is calculated using Equation (3), based on the derived polytropic efficiency:
Moreover, the corresponding polytropic head and shaft power are determined from Equations (4) and (5), respectively:
Hence, this paper will emphasize the capability of this method to predict the performance at various gas mixtures and the obtained characteristics are compared against measured data. Moreover, the conducted optimization study will verify the validity of the new model for the design evaluation of new centrifugal compressor units based on the expected variation in the process gas compositions. Furthermore, this approach can be implemented for operation diagnosis of installed machines, so a unique approach has been introduced in the included case study to assess the contribution of the unanticipated gas composition change in the inefficient and unstable operation of the compression system.
The paper is structured in three main parts. The first section tests the validity of the new approach for the performance prediction of multistage centrifugal compressors at various gas compositions. This is followed by a sensitivity study in order to investigate the effect of the physical gas properties on the compressor aerothermodynamic parameters, including stage efficiency, compressor structure, and surge margin. The influence of each property has been investigated and optimized separately by keeping the rest of the factors constant in order to determine the significance of each one. This becomes more useful for the compressor design evaluation at various suction conditions. The third part includes an operation case study to describe the overall impact of the gas properties’ change on the aerodynamic and rotordynamic stabilities of the compression system. In order to achieve that, a new approach is introduced to assess the contribution of the gas properties’ variation to compressor performance based on the available operational data.
2. Method Validation at Various Gas Compositions
To demonstrate the validity of the derived method when there is a change in the gas properties, it has been implemented to estimate the performance of a three-process stages centrifugal compressor driven by a 2.95 MW gas turbine. The first two stages consist of six impellers arranged in series with the aftercoolers and scrubbers while the third casing accommodates eight impellers.
The compressor has been in service for about 32 years so the gas composition obviously varied from the design values.
Figure 2 shows the recoded change in the measured properties of the gas sample comparing with the initial design values.
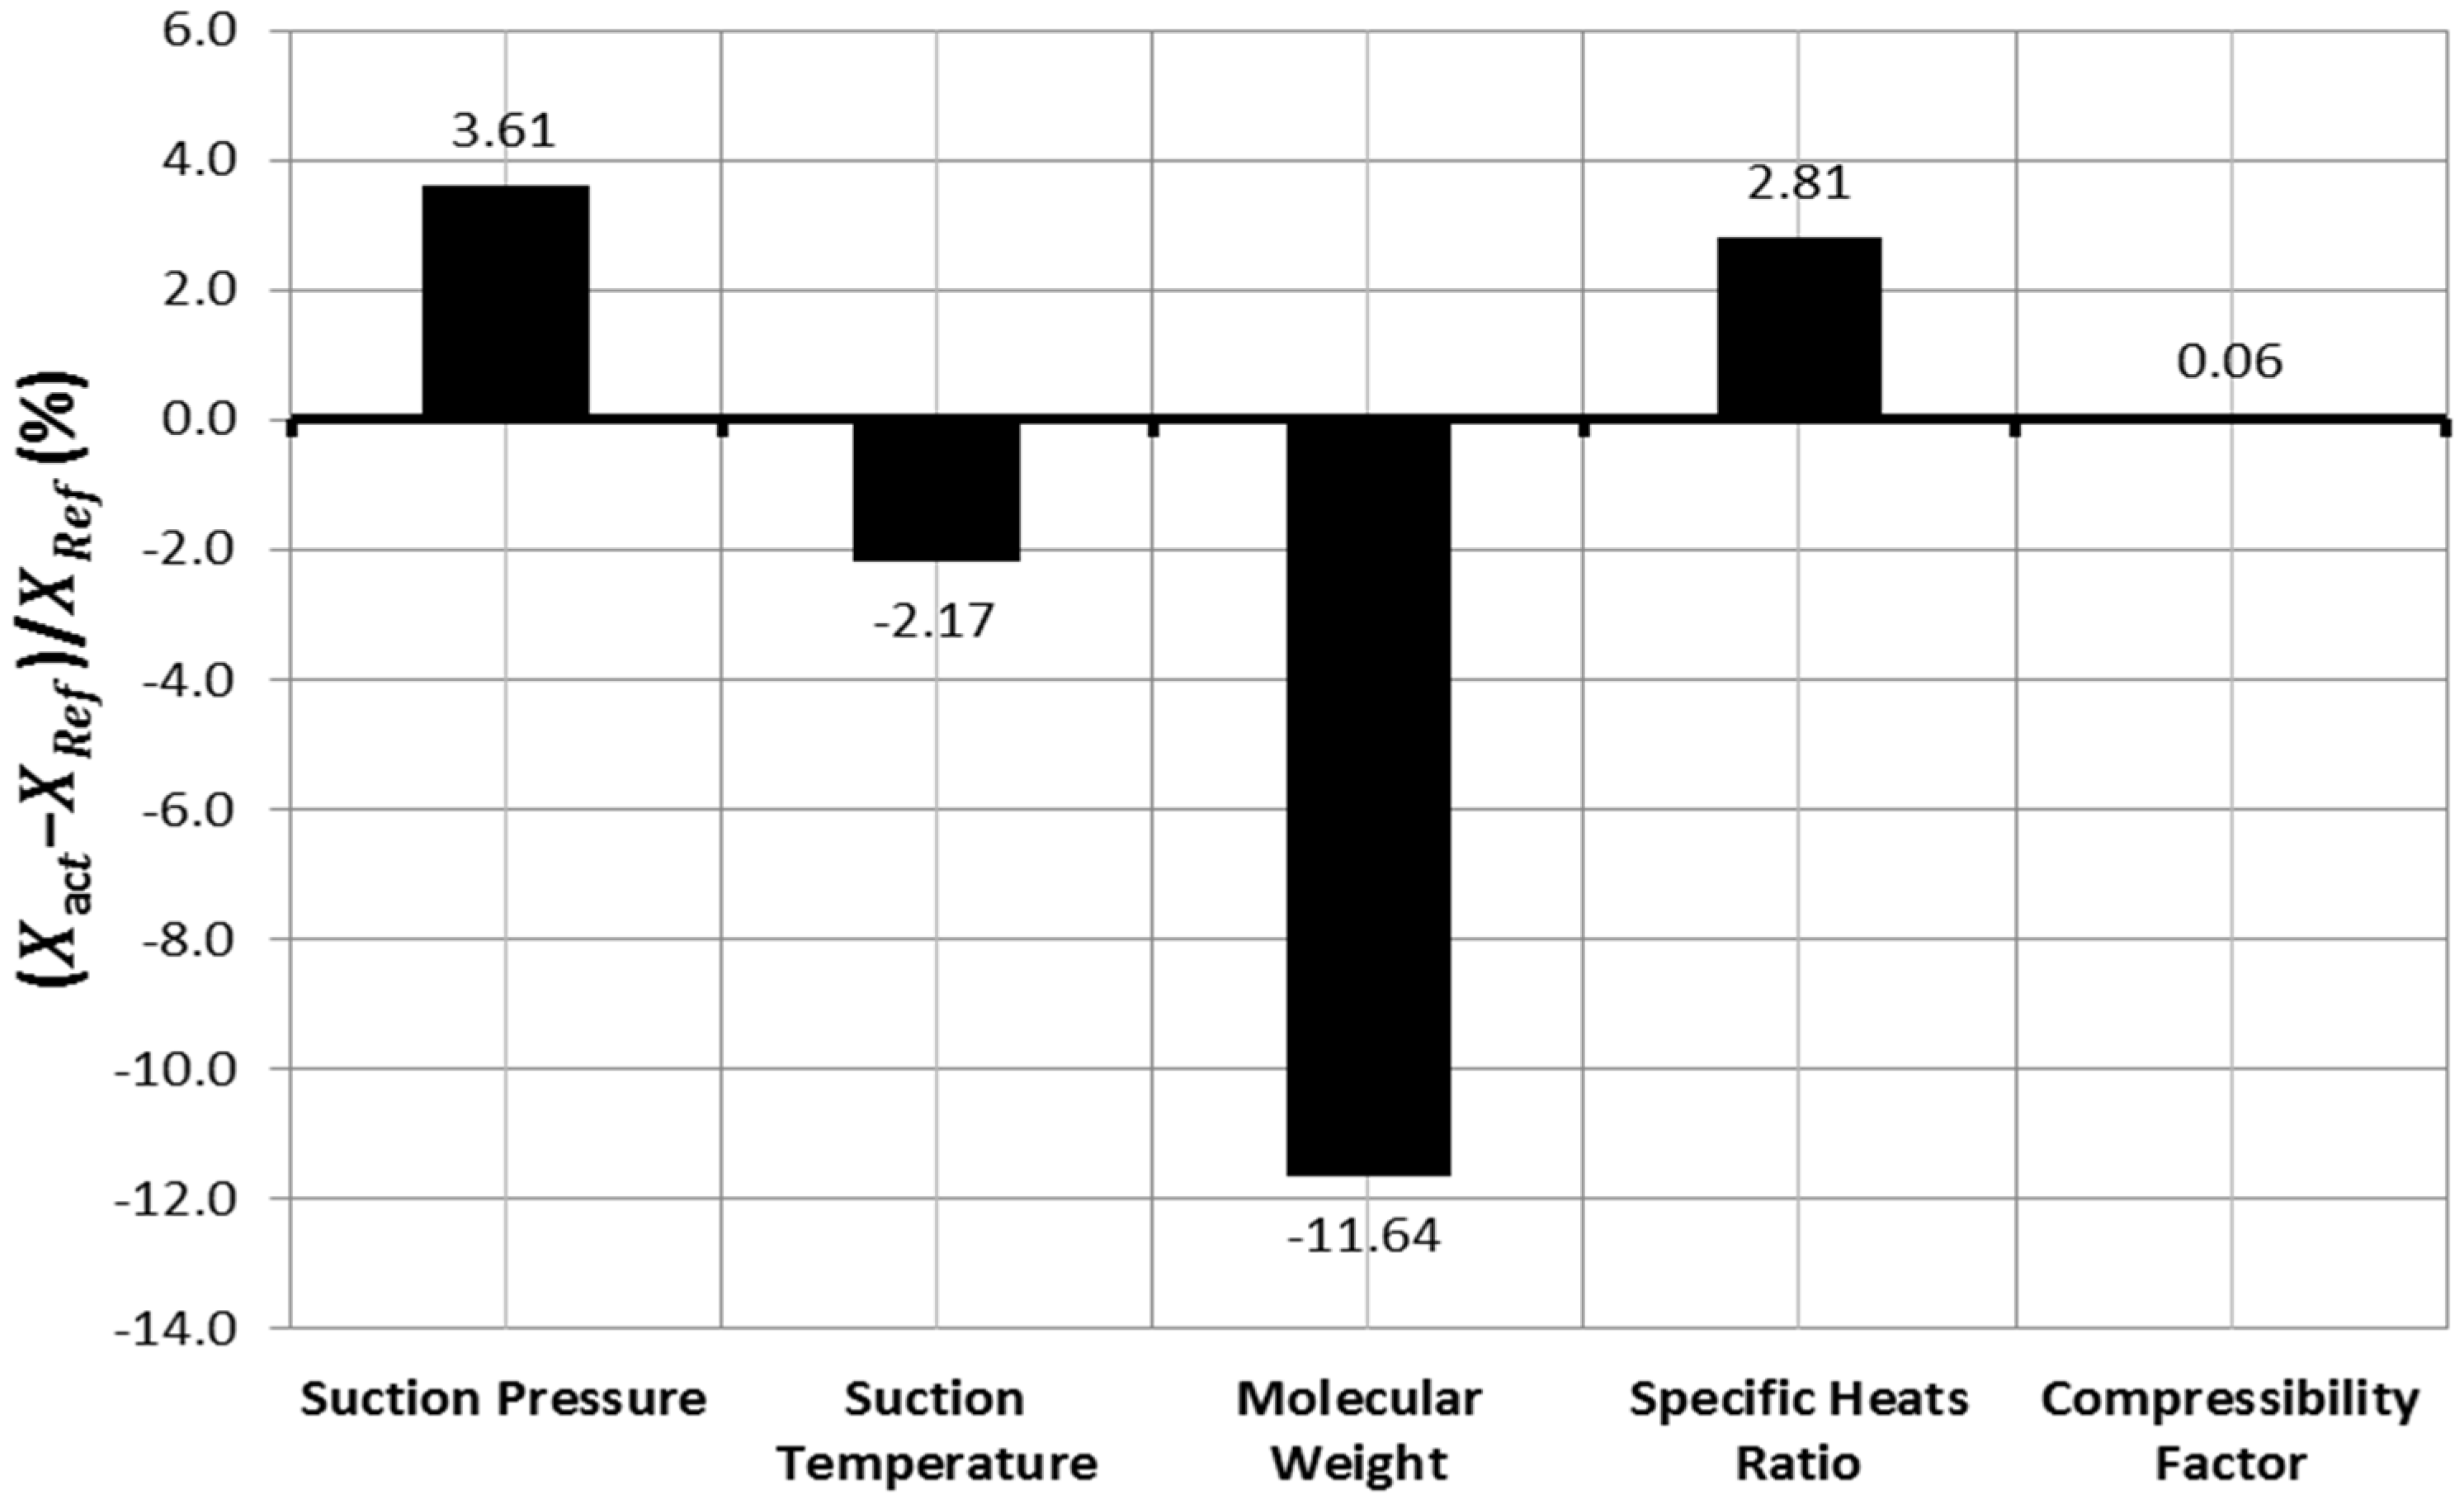
Since these properties have been measured in the laboratory, it is necessary to check the uncertainty of the measurement methods to improve the quality of the measurements. Unfortunately, the exact uncertainty of each measurement method is not specified. However, the uncertainty of the gas density measurement is estimated to be about ±0.3251%, which will be considered for the rest of the properties. The gas sample test demonstrates a significant reduction in the gas molecular weight and a slight increase in the
Z-factor and
k-value. This obviously affects the performance characteristics, as illustrated in
Figure 3 and
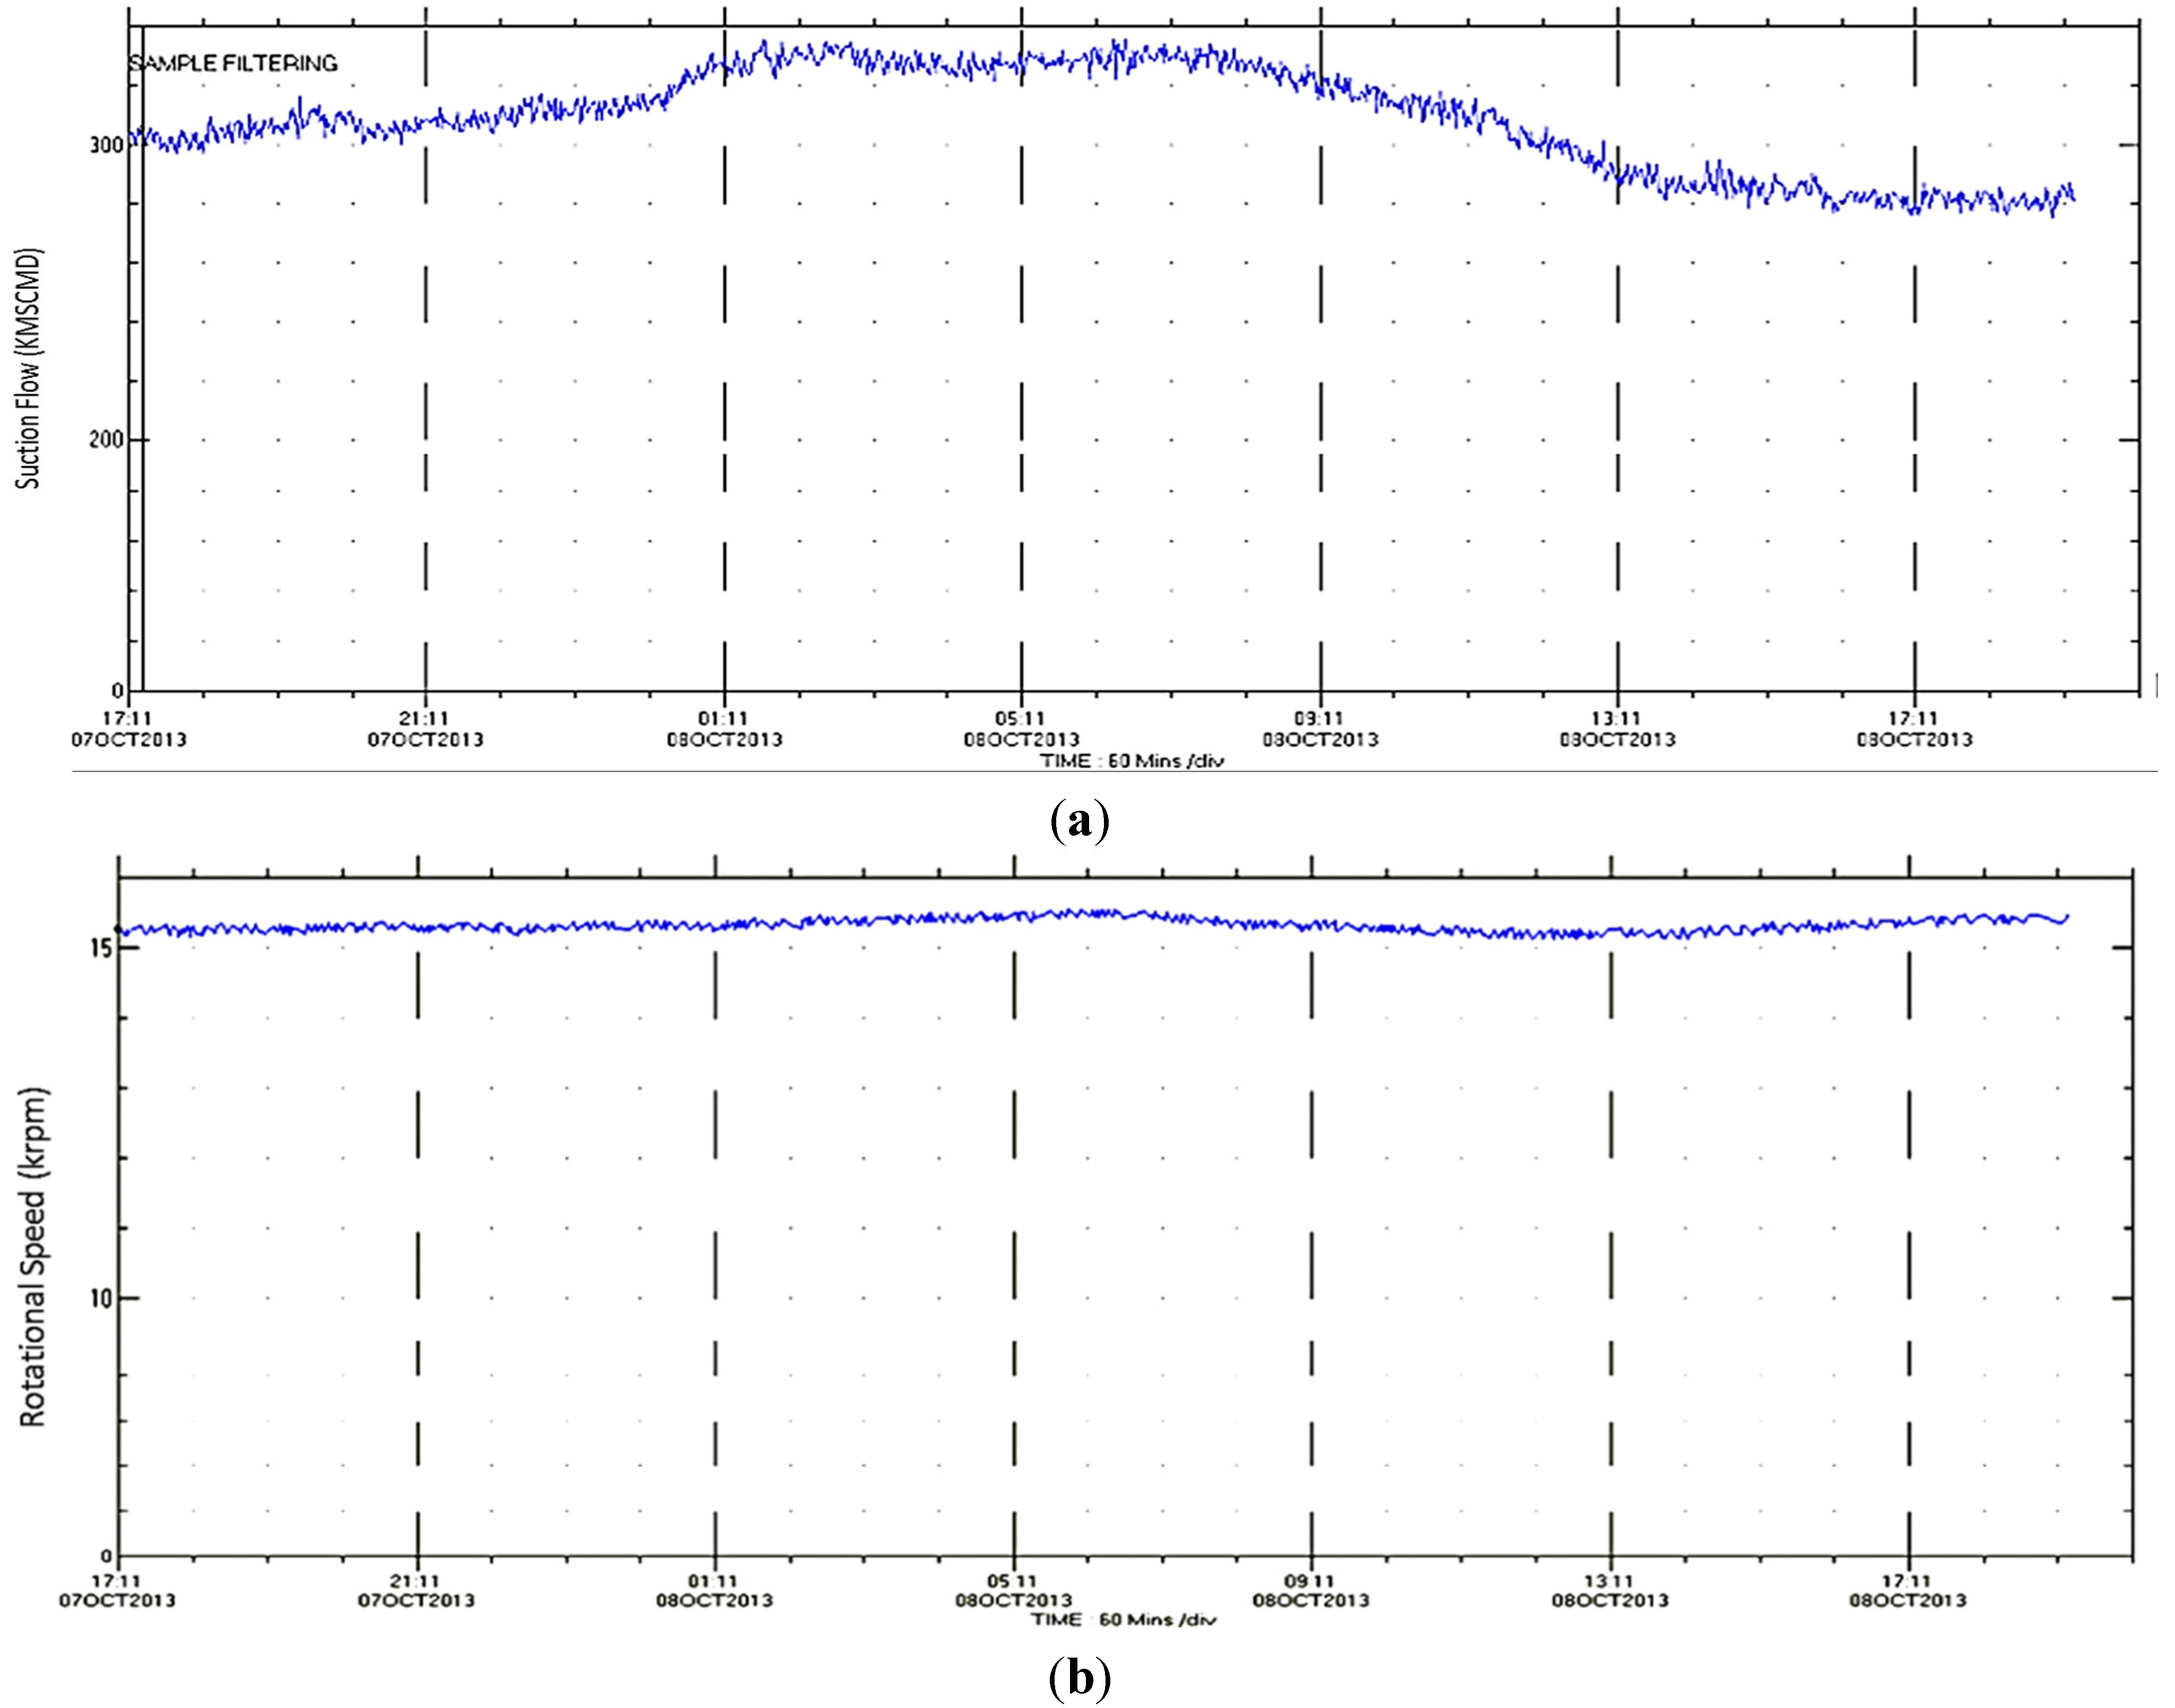
Figure 4. The measured discharge pressure of the first process stage was found to be lower than the relative actual design value at the same rotational speed. Hence, the derived approach is used to obtain the equivalent performance of the first process stage with respect to the new gas properties.
Figure 2.
Measured change in suction parameters relative to initial design values.
Figure 2.
Measured change in suction parameters relative to initial design values.
Figure 3.
Measured performance parameters of the first process stage: (a) suction flow; (b) rotational speed.
Figure 3.
Measured performance parameters of the first process stage: (a) suction flow; (b) rotational speed.
Figure 4.
Measured suction and discharge parameters of the first process stage: (a) suction Pressure and temperature; (b) discharge pressure and temperature.
Figure 4.
Measured suction and discharge parameters of the first process stage: (a) suction Pressure and temperature; (b) discharge pressure and temperature.
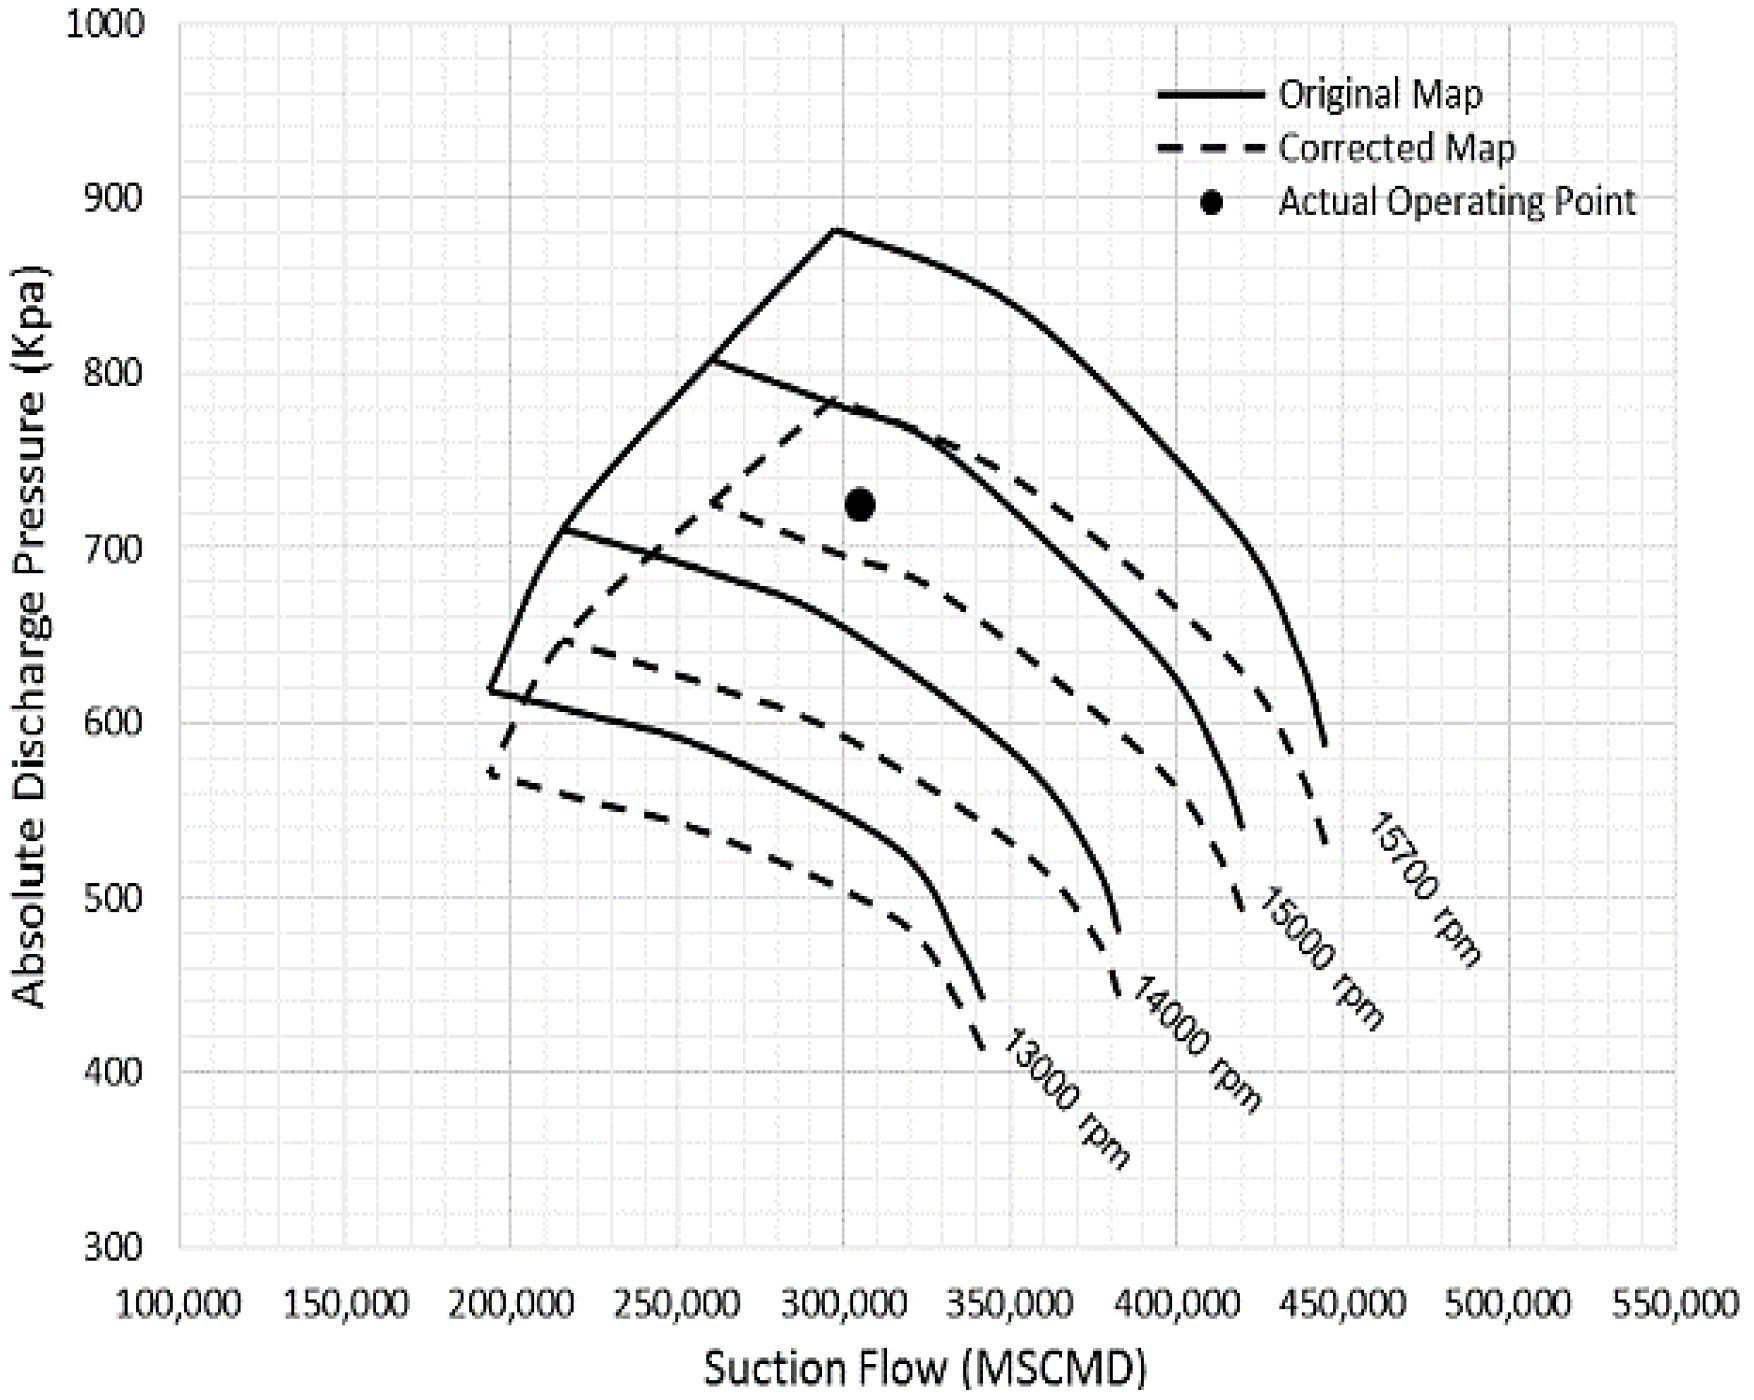
The rotational speed corresponding to the measured suction and discharge parameters is determined and compared with the actual value. It is clear from
Figure 5 that the operating point suits between the constant speed lines of 15,700 rpm and 15,000 rpm and at approximately 15,251 rpm.
Figure 5.
Validation of developed method to predict the new rotational speed of first stage.
Figure 5.
Validation of developed method to predict the new rotational speed of first stage.
This is close enough to the actual rotational speed in
Figure 3b, with a relative error of about 0.085% only. Moreover, it was observed that the pressure ratio trend moves down to lower pressure ratio regions, driven by the substantial reduction in the molecular weight, which was the dominant effect in this case. This finding confirms the fact that the variation in the gas properties was the key factor behind the low discharge pressure.
3. Demonstration of New Method Validation for Design Evaluation
The centrifugal compressor head is highly dependent on three key properties of the gas mixture: molecular weight (MW), compressibility factor (Z), and specific heats ratio (k). These three factors cause the required kinetic energy to compress the flowing gas, which is then converted to pressure in the diffuser. Furthermore, these characteristics influence the required number of stages to achieve the desired head, as will be investigated here. This can be performed in the preliminary design stage in order to avoid the high aerodynamic and thermal loads on the compressor blades. Despite the fact that the change in gas compositions causes a variation in these three properties simultaneously, the impact of every single property on the stage performance will be considered separately, assuming that the rest of the features remain constant in order to assess the effect of each property. Besides, at constant molecular weight value, the change in specific heats ratio and gas compressibility can be owing to the change in the gas temperature and pressure. This offers a great advantage in evaluating a new compressor design corresponding to the expected variation in the gas compositions.
3.1. Impact of Gas Molecular Weight
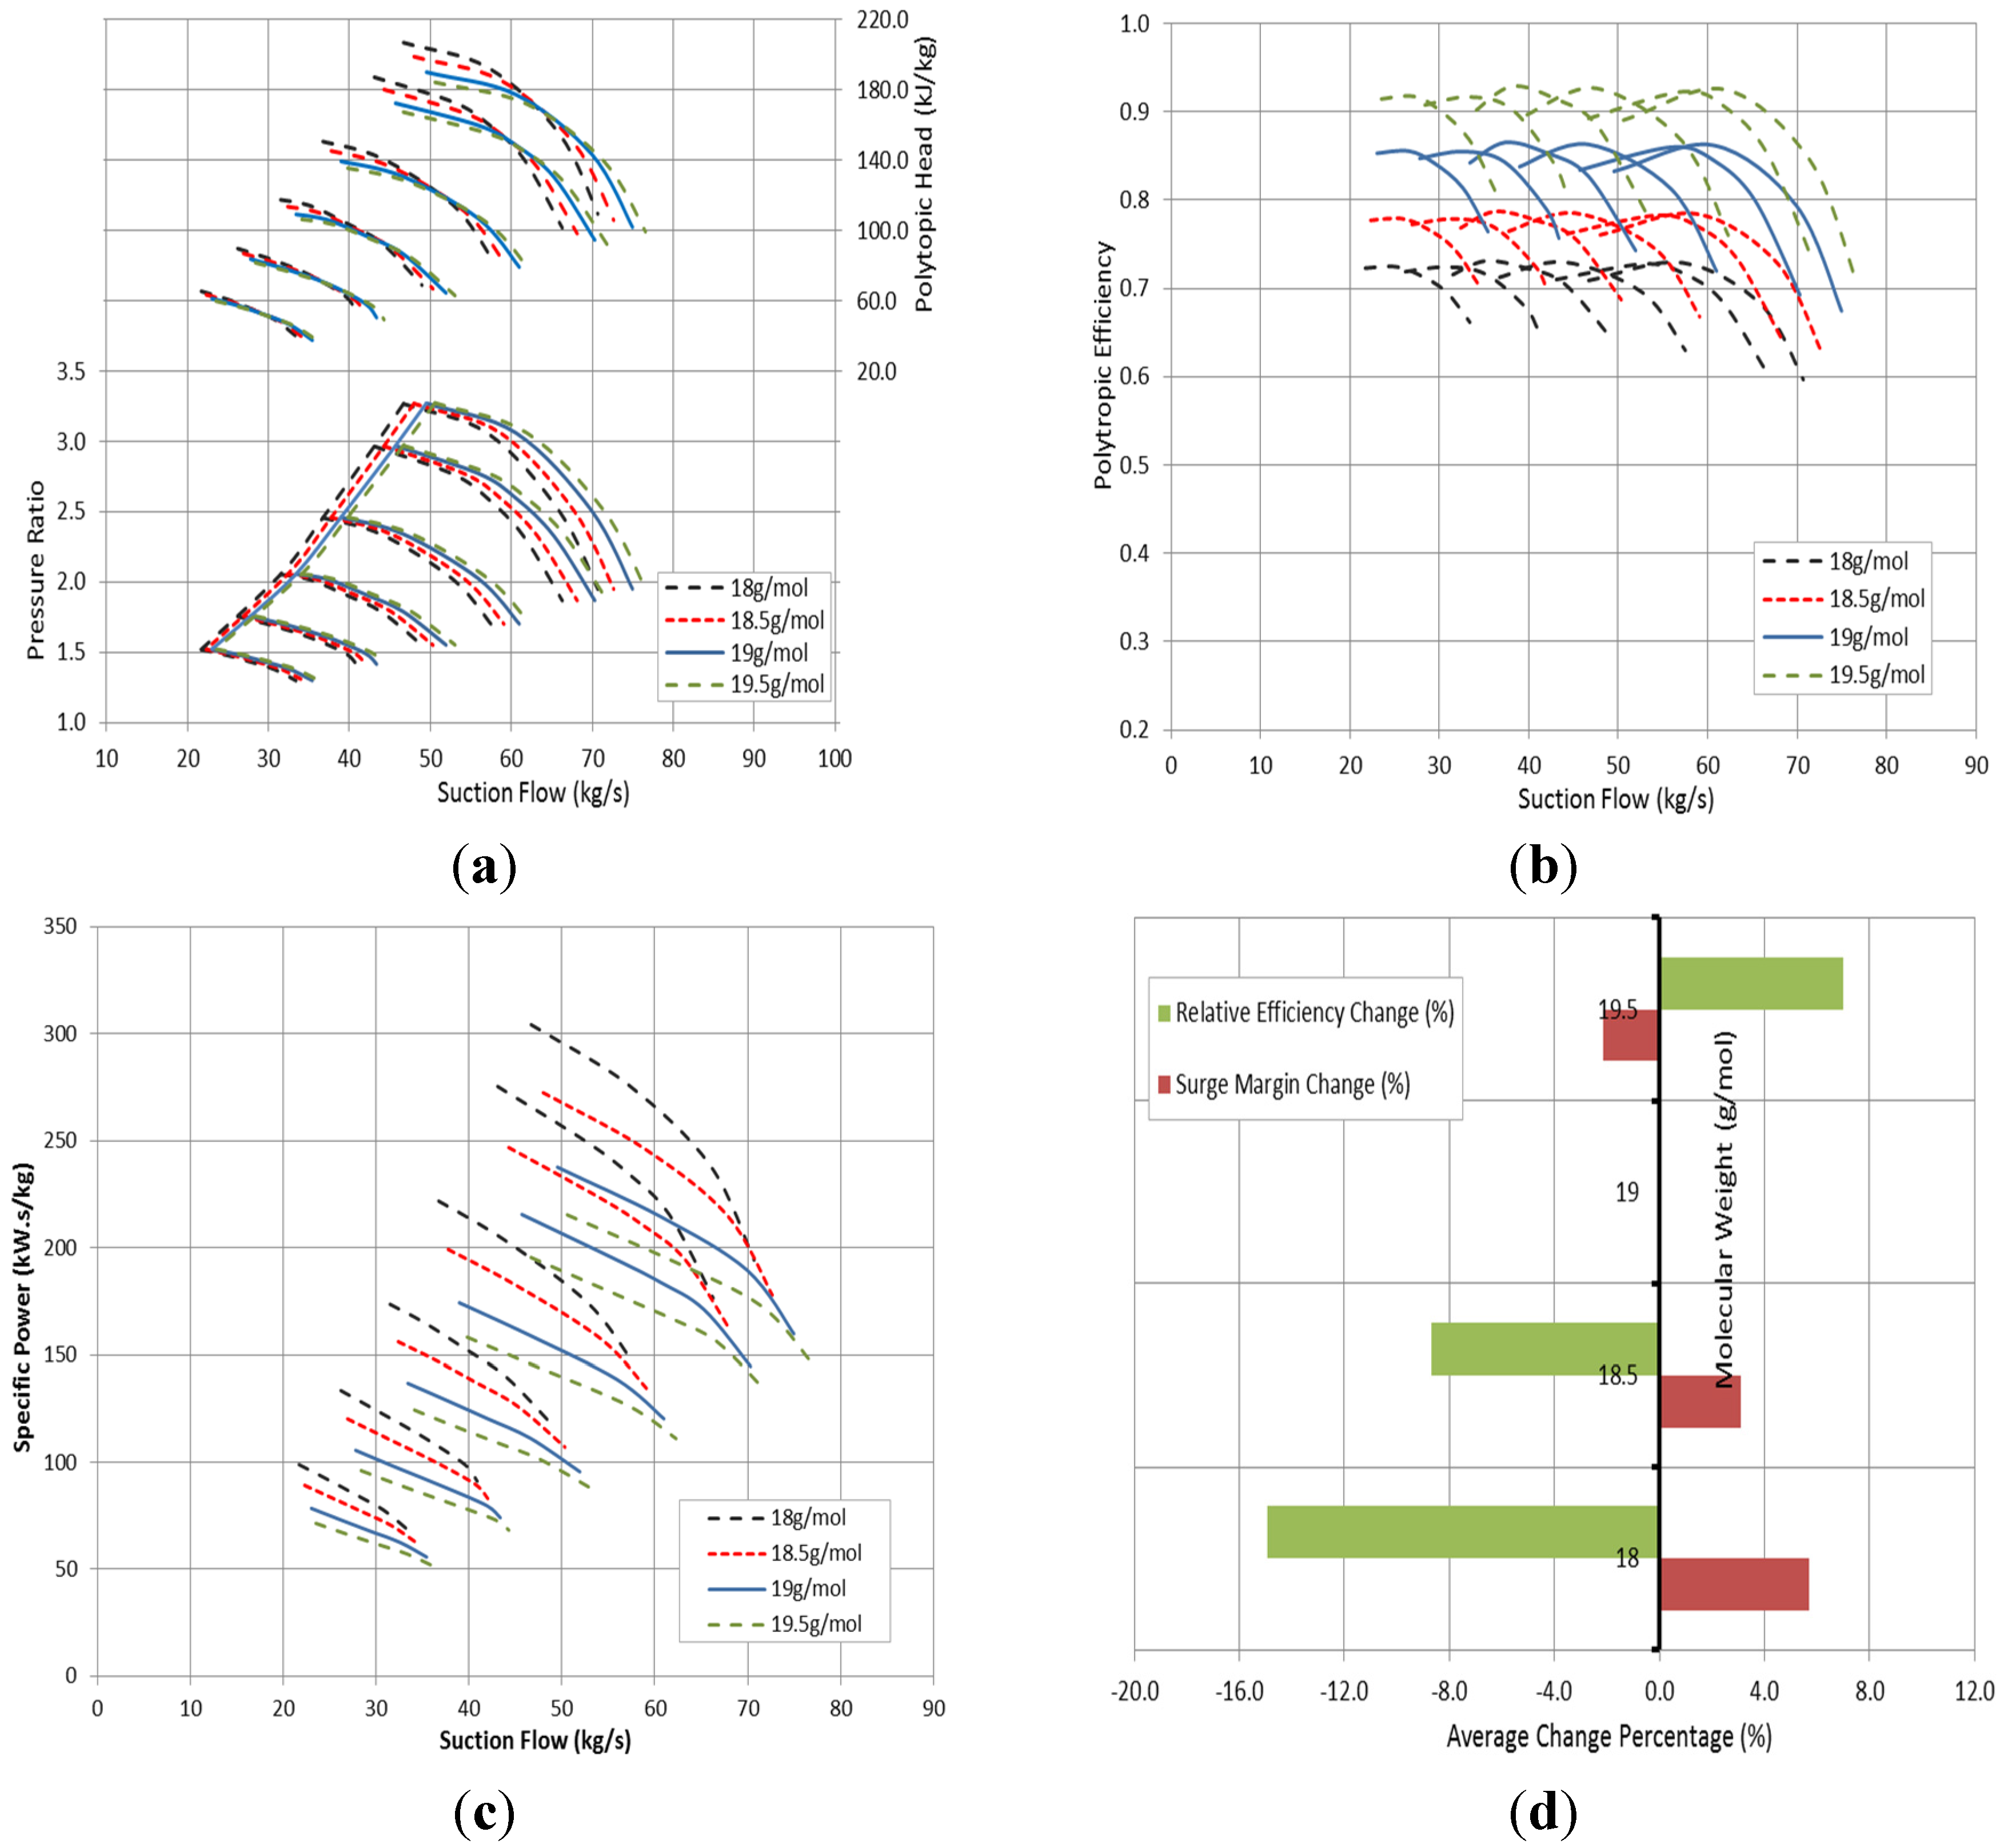
The variation in the molecular weight for air-water vapor mixtures is usually small so it can be ignored. However, the gas compressors are designed to be capable to deal with wide ranges of molecular weight, which makes the effect of this variable quite significant. The gas density is greatly affected by the molar mass of its compositions. So, the presence of light compositions reduces the relative gas density, which in turn yields lower flow rates. Consequently, the developed pressure ratio decreases as gas molecular weight reduces, if the rest of the gas properties are kept constant. However, the pressure ratio rise starts to decline gradually as the flow goes down since the heavy gases tend to surge earlier and at higher flow rates.
The polytropic head is increasing proportionally with the gas molar mass driven by the rise in the pressure ratio. As the operating point moves towards the surge line, the increase in the pressure ratio at high molecular weight starts to decrease, causing the head value to drop. By looking to the centrifugal compressor head equation, it is clear that the polytropic head is also influenced by the gas constant, which decreases as the molecular weight increases. So, the reduction in the gas constant was the dominant factor that offsets the effect of a high pressure ratio. The other reason behind this sort of head curve behavior is due to the fact that the head is increasing exponentially with the pressure ratio raised to the power of (n − 1)/n. This makes the impact of pressure ratio variation negligible when compared with the gas constant impact.
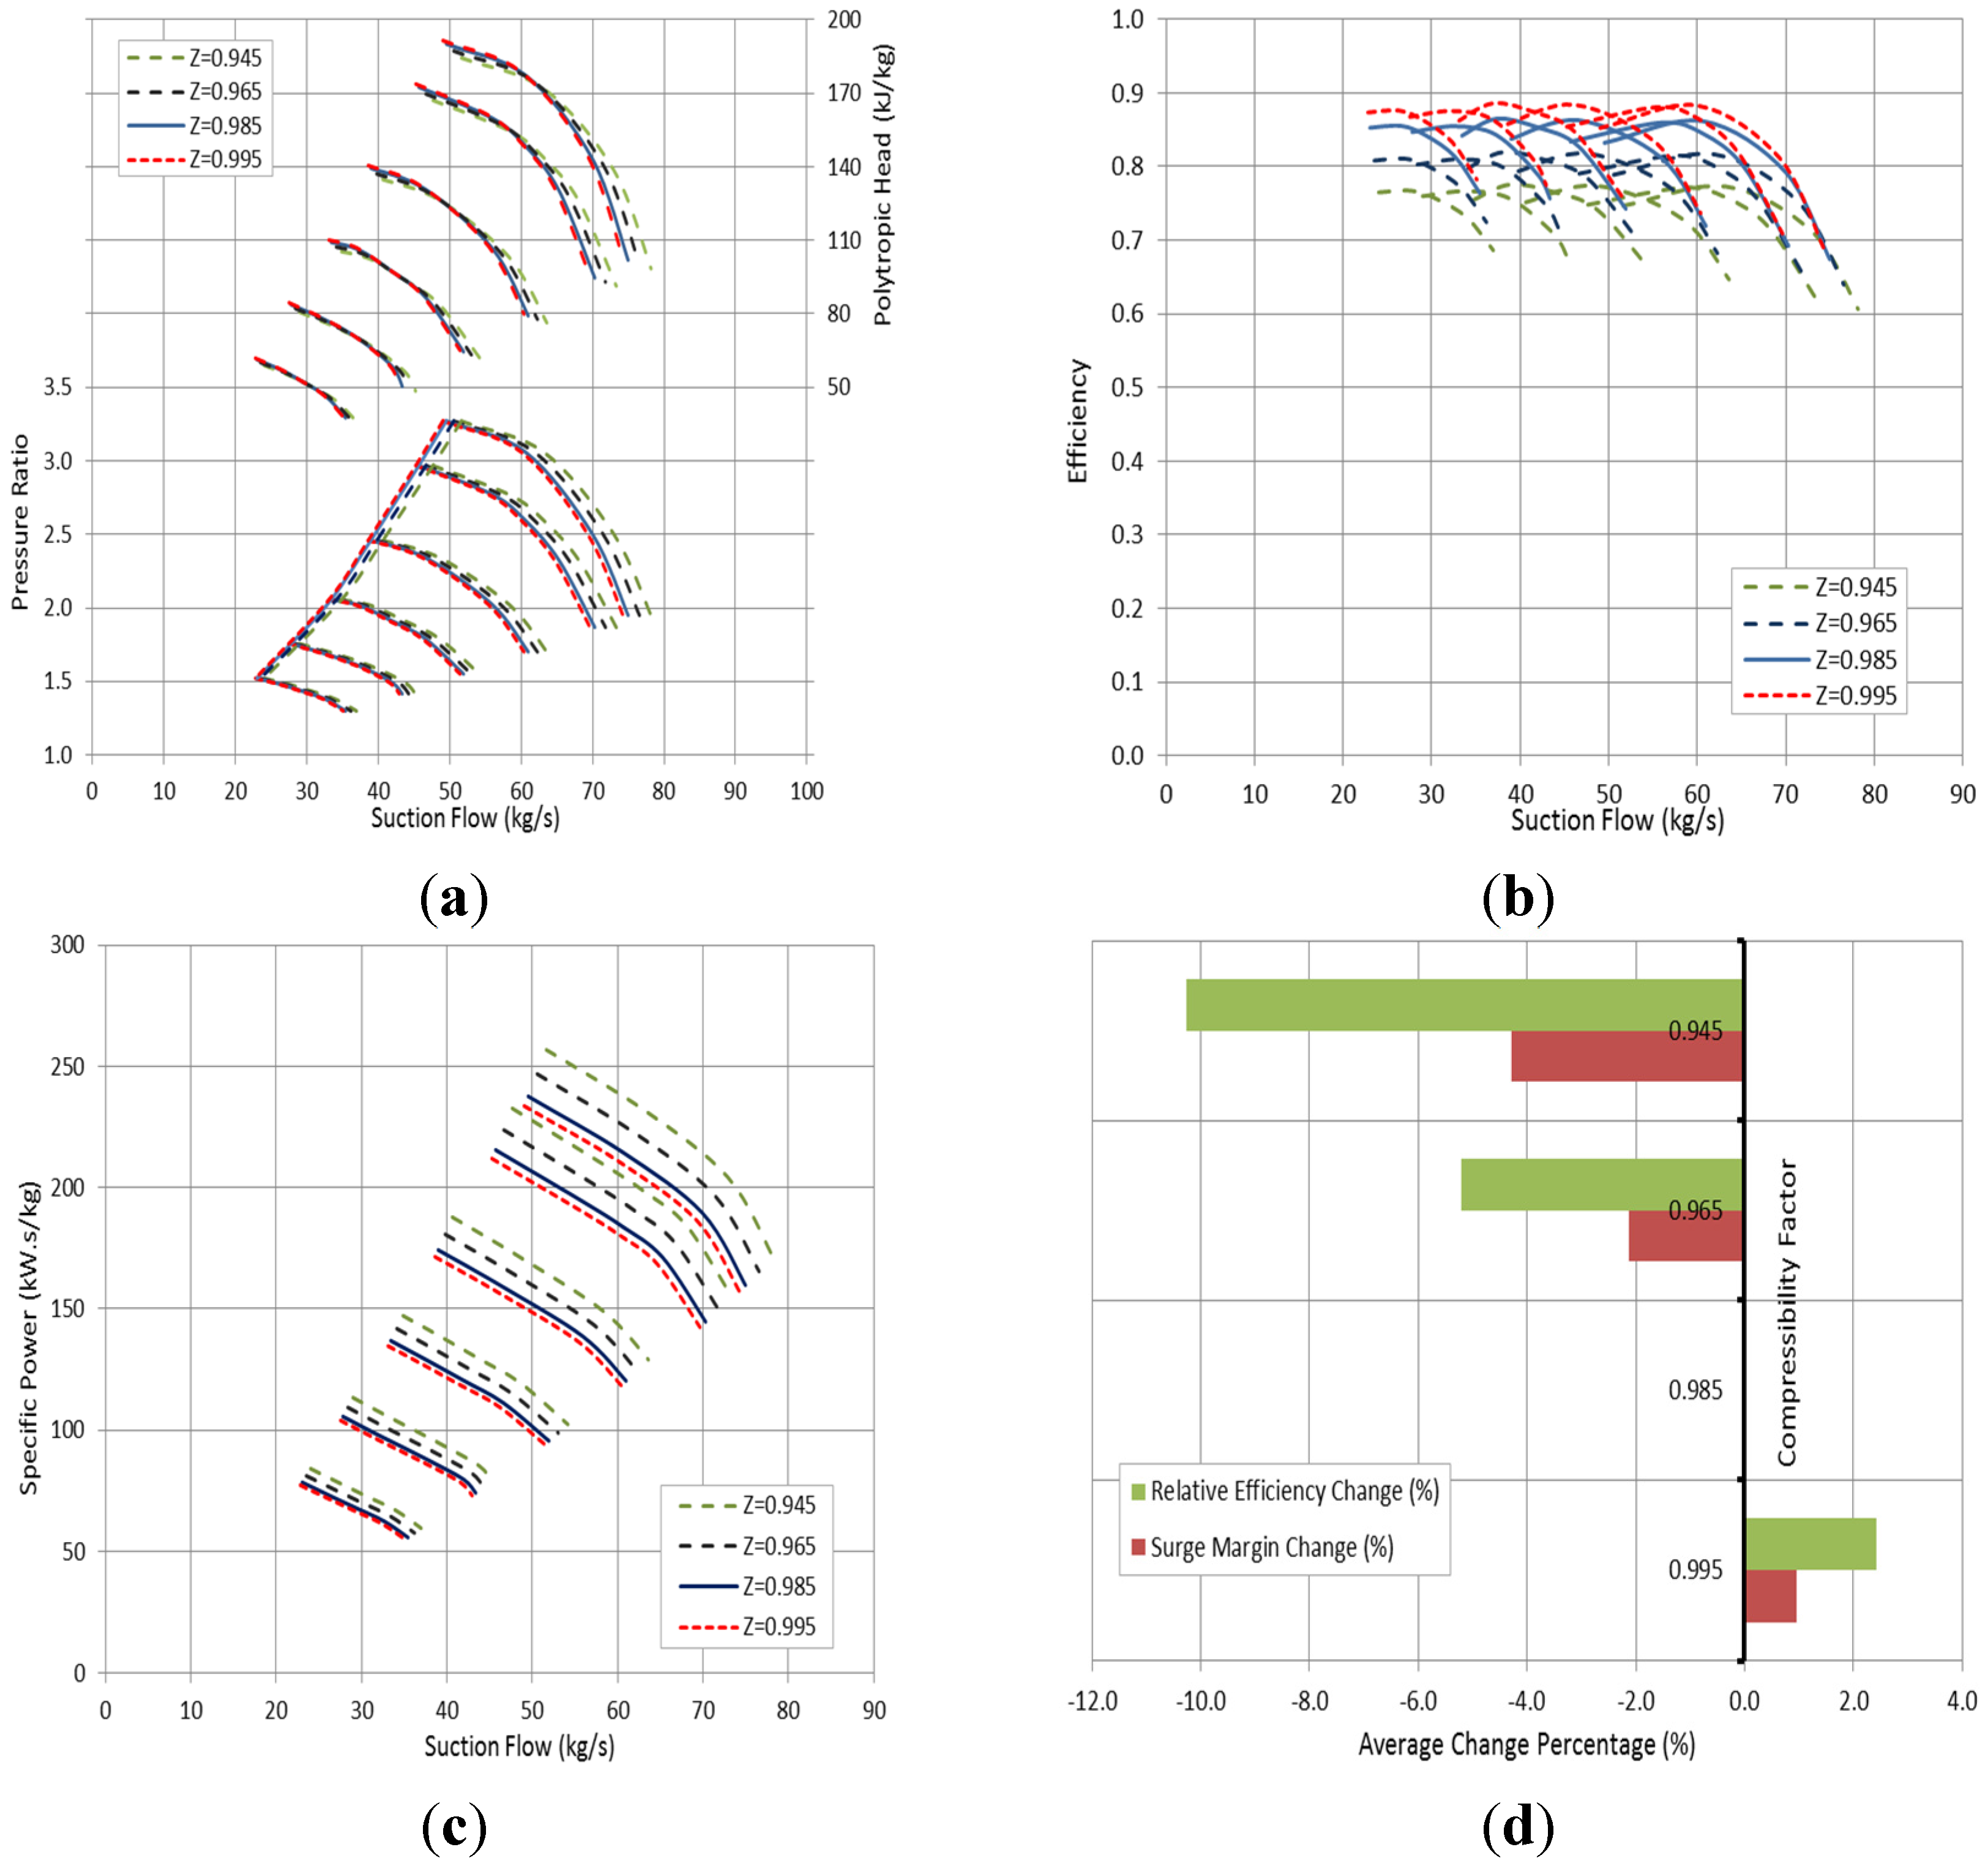
Figure 6a demonstrates a reduction in the surge margin as the gas molecular weight increases, yielding a shorter stability range. The required polytropic head of low molecular weight tends to increase as the flow rate reduces. This indicates higher frictional losses, associated with low gas density and viscosity. Furthermore, the surge intensity is increasing proportionally with the gas density, which can happen as a result of a rise in pressure and molecular weight or as a consequence of the temperature reduction. The compressor efficiency is also affected by the gas constant. The high molecular weight value leads to a reduction in the gas constant (R) yielding a lower volume polytropic exponent, which is inversely related to the stage efficiency.
As the gas density decreases, the compression ratio through the impeller is reduced, which will result in a higher discharge volume flow acting on the same vane area. This in turn leads to a lower tangential velocity and correspondingly lower generated head. In addition to Mach number, the gas density influences the gas Reynolds number, which decreases proportionally with the molecular weight, leading to higher frictional losses and lower efficiency as shown in
Figure 6b. There is an increase in the power consumption when handling the low density gases despite the reduction in the discharge pressure.
One interesting observation that stands out from
Figure 6c is the dramatic variation in the specific power due to the gas molecular weight at the low flow region. This effect becomes more substantial at high rotational speeds. The significance of this finding appears when dealing with a centrifugal compressor with a wide operating molecular weight range.
Figure 6d illustrates the average change in the stage efficiency and surge margin as a result of molecular weight variation with respect to the design values at a fixed flow rate. It is clear that there is an opposite effect on the efficiency and surge margin. Operating the compressor with heavy gases leads to an increase in the stage efficiency and pressure ratio but simultaneously reduces the surge margin value. More substantial impact can be observed on the efficiency value.
Figure 6.
Effect of gas molecular weight on: (a) compressor head and pressure ratio; (b) compressor efficiency; (c) specific power; and (d) efficiency and surge margin at a fixed flow rate.
Figure 6.
Effect of gas molecular weight on: (a) compressor head and pressure ratio; (b) compressor efficiency; (c) specific power; and (d) efficiency and surge margin at a fixed flow rate.
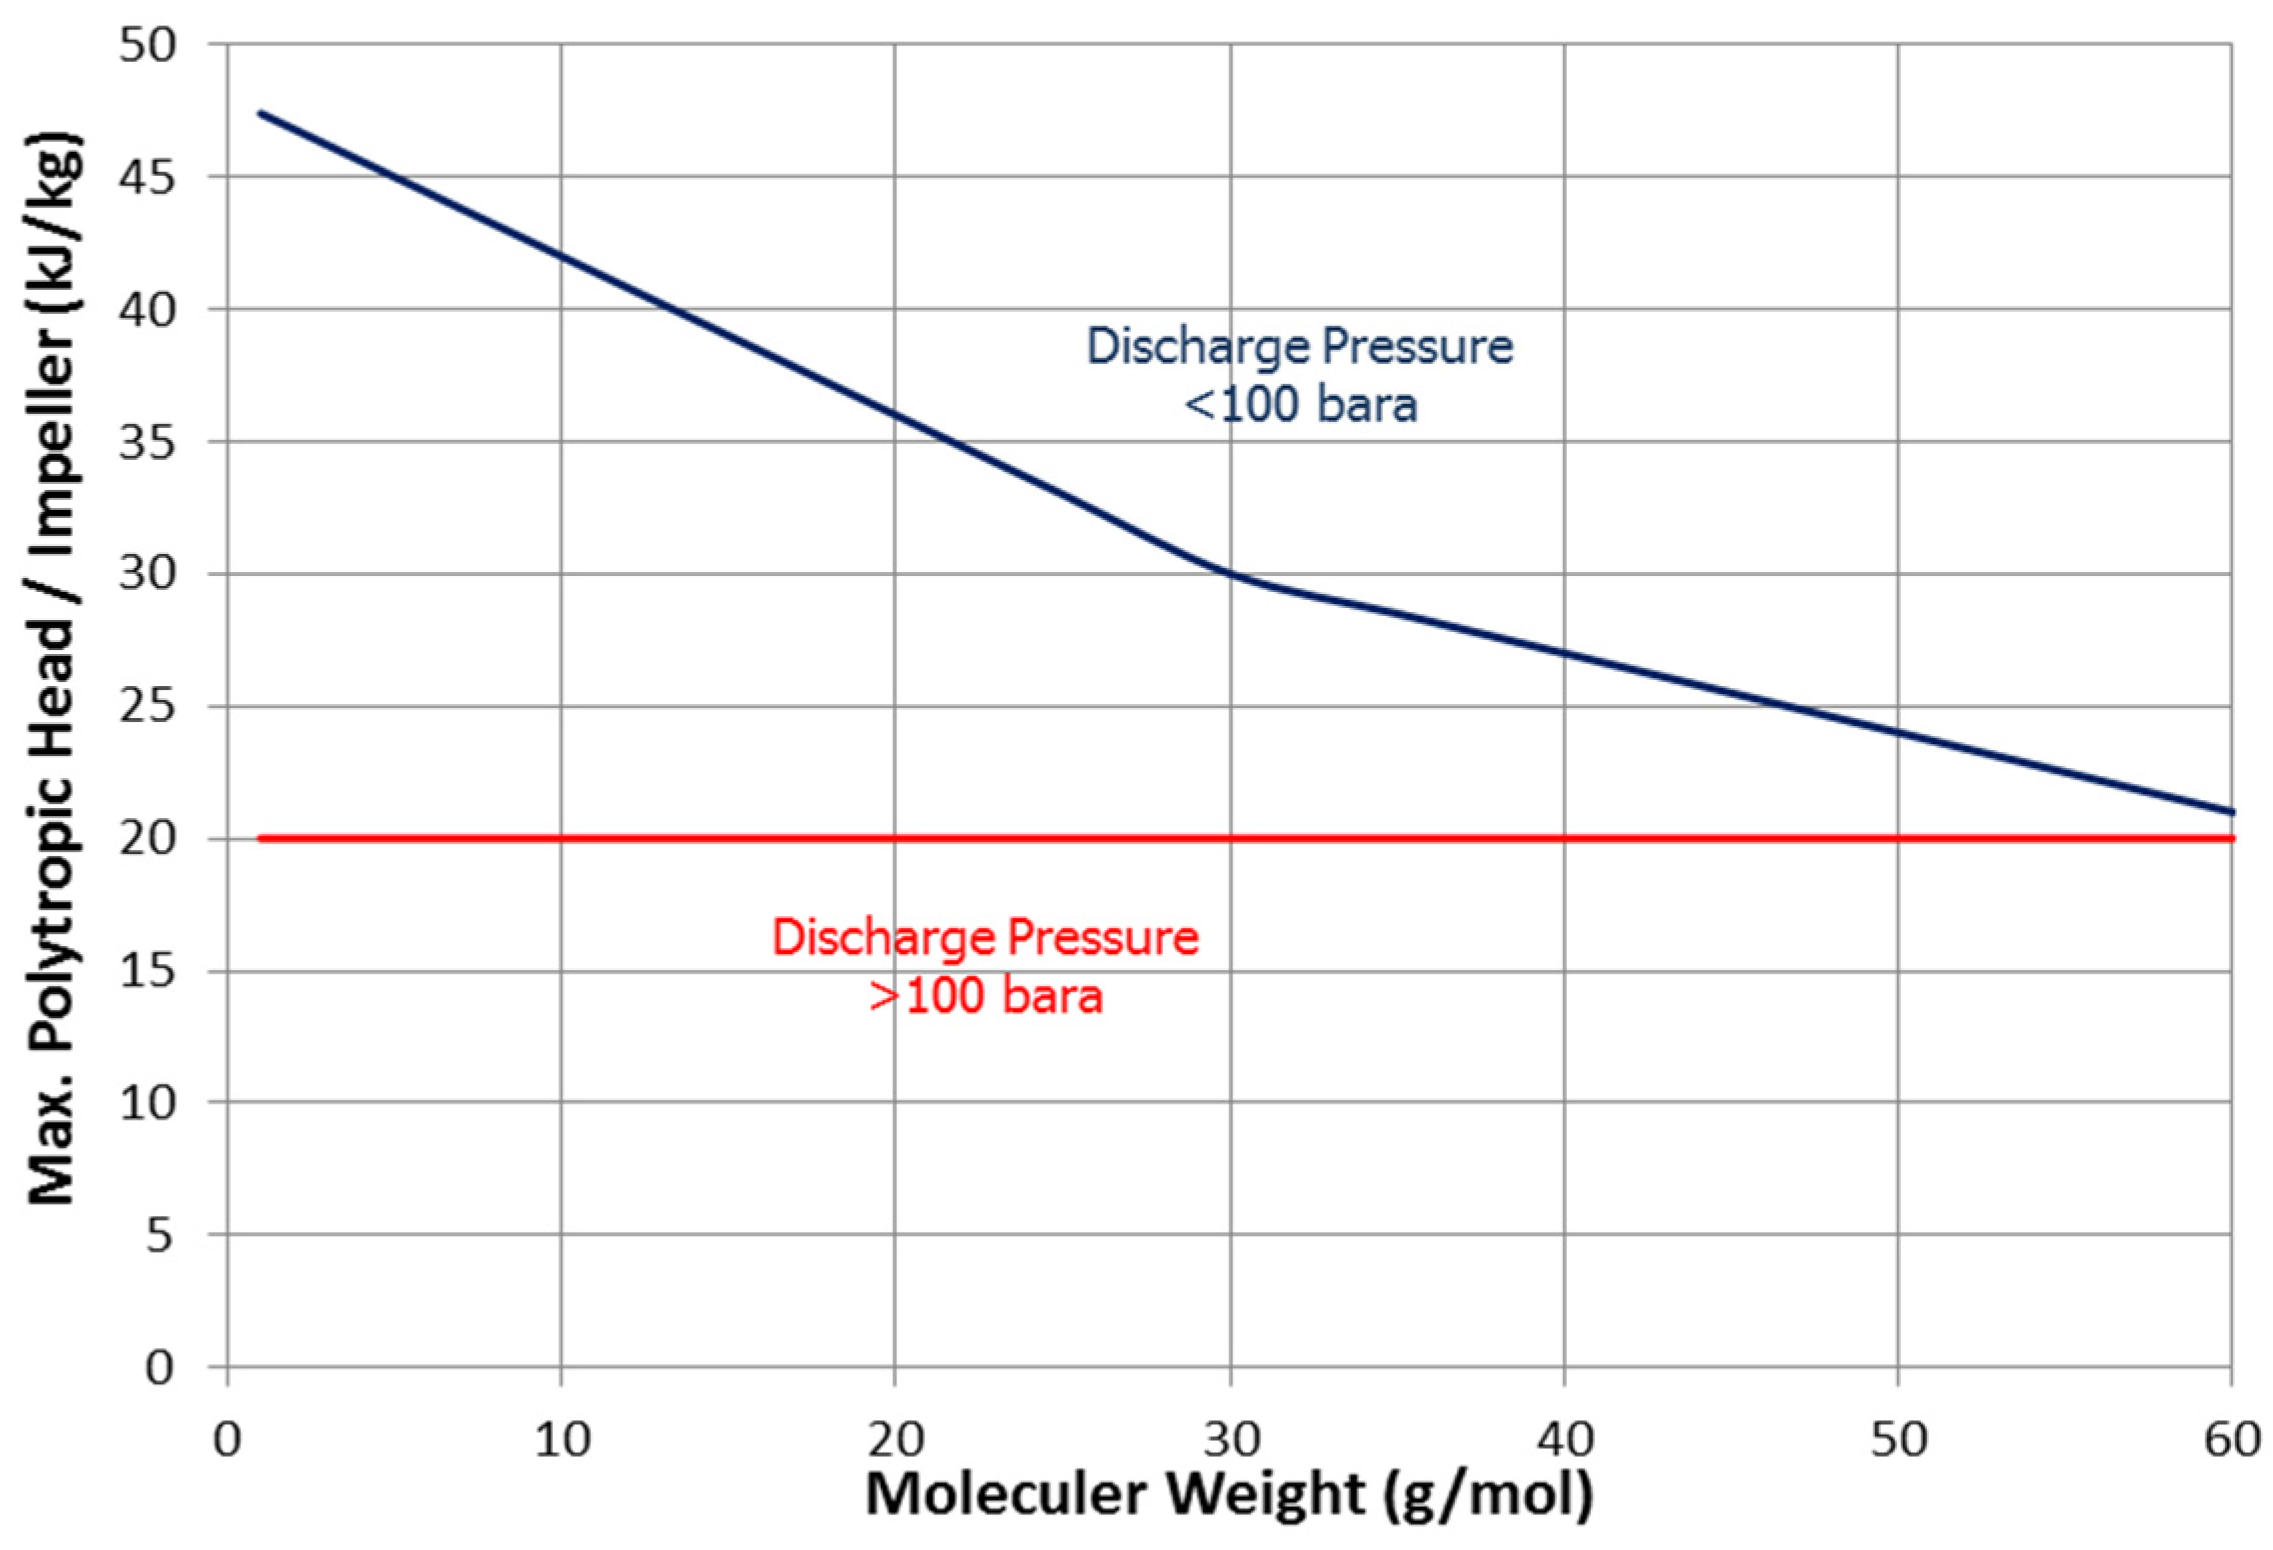
This study uses a different approach to specify the maximum developed polytropic head per impeller by considering two parameters, the molecular weight and discharge pressure, as shown in
Figure 7. So, the maximum allowed polytropic head per impeller is specified at the beginning according to the discharge pressure based on Simmons’s method [
10]. When the discharge pressure is lower than 100 bara, the obtained value is then corrected according to the molecular weight of the process gas using Royce-Brown method [
11].
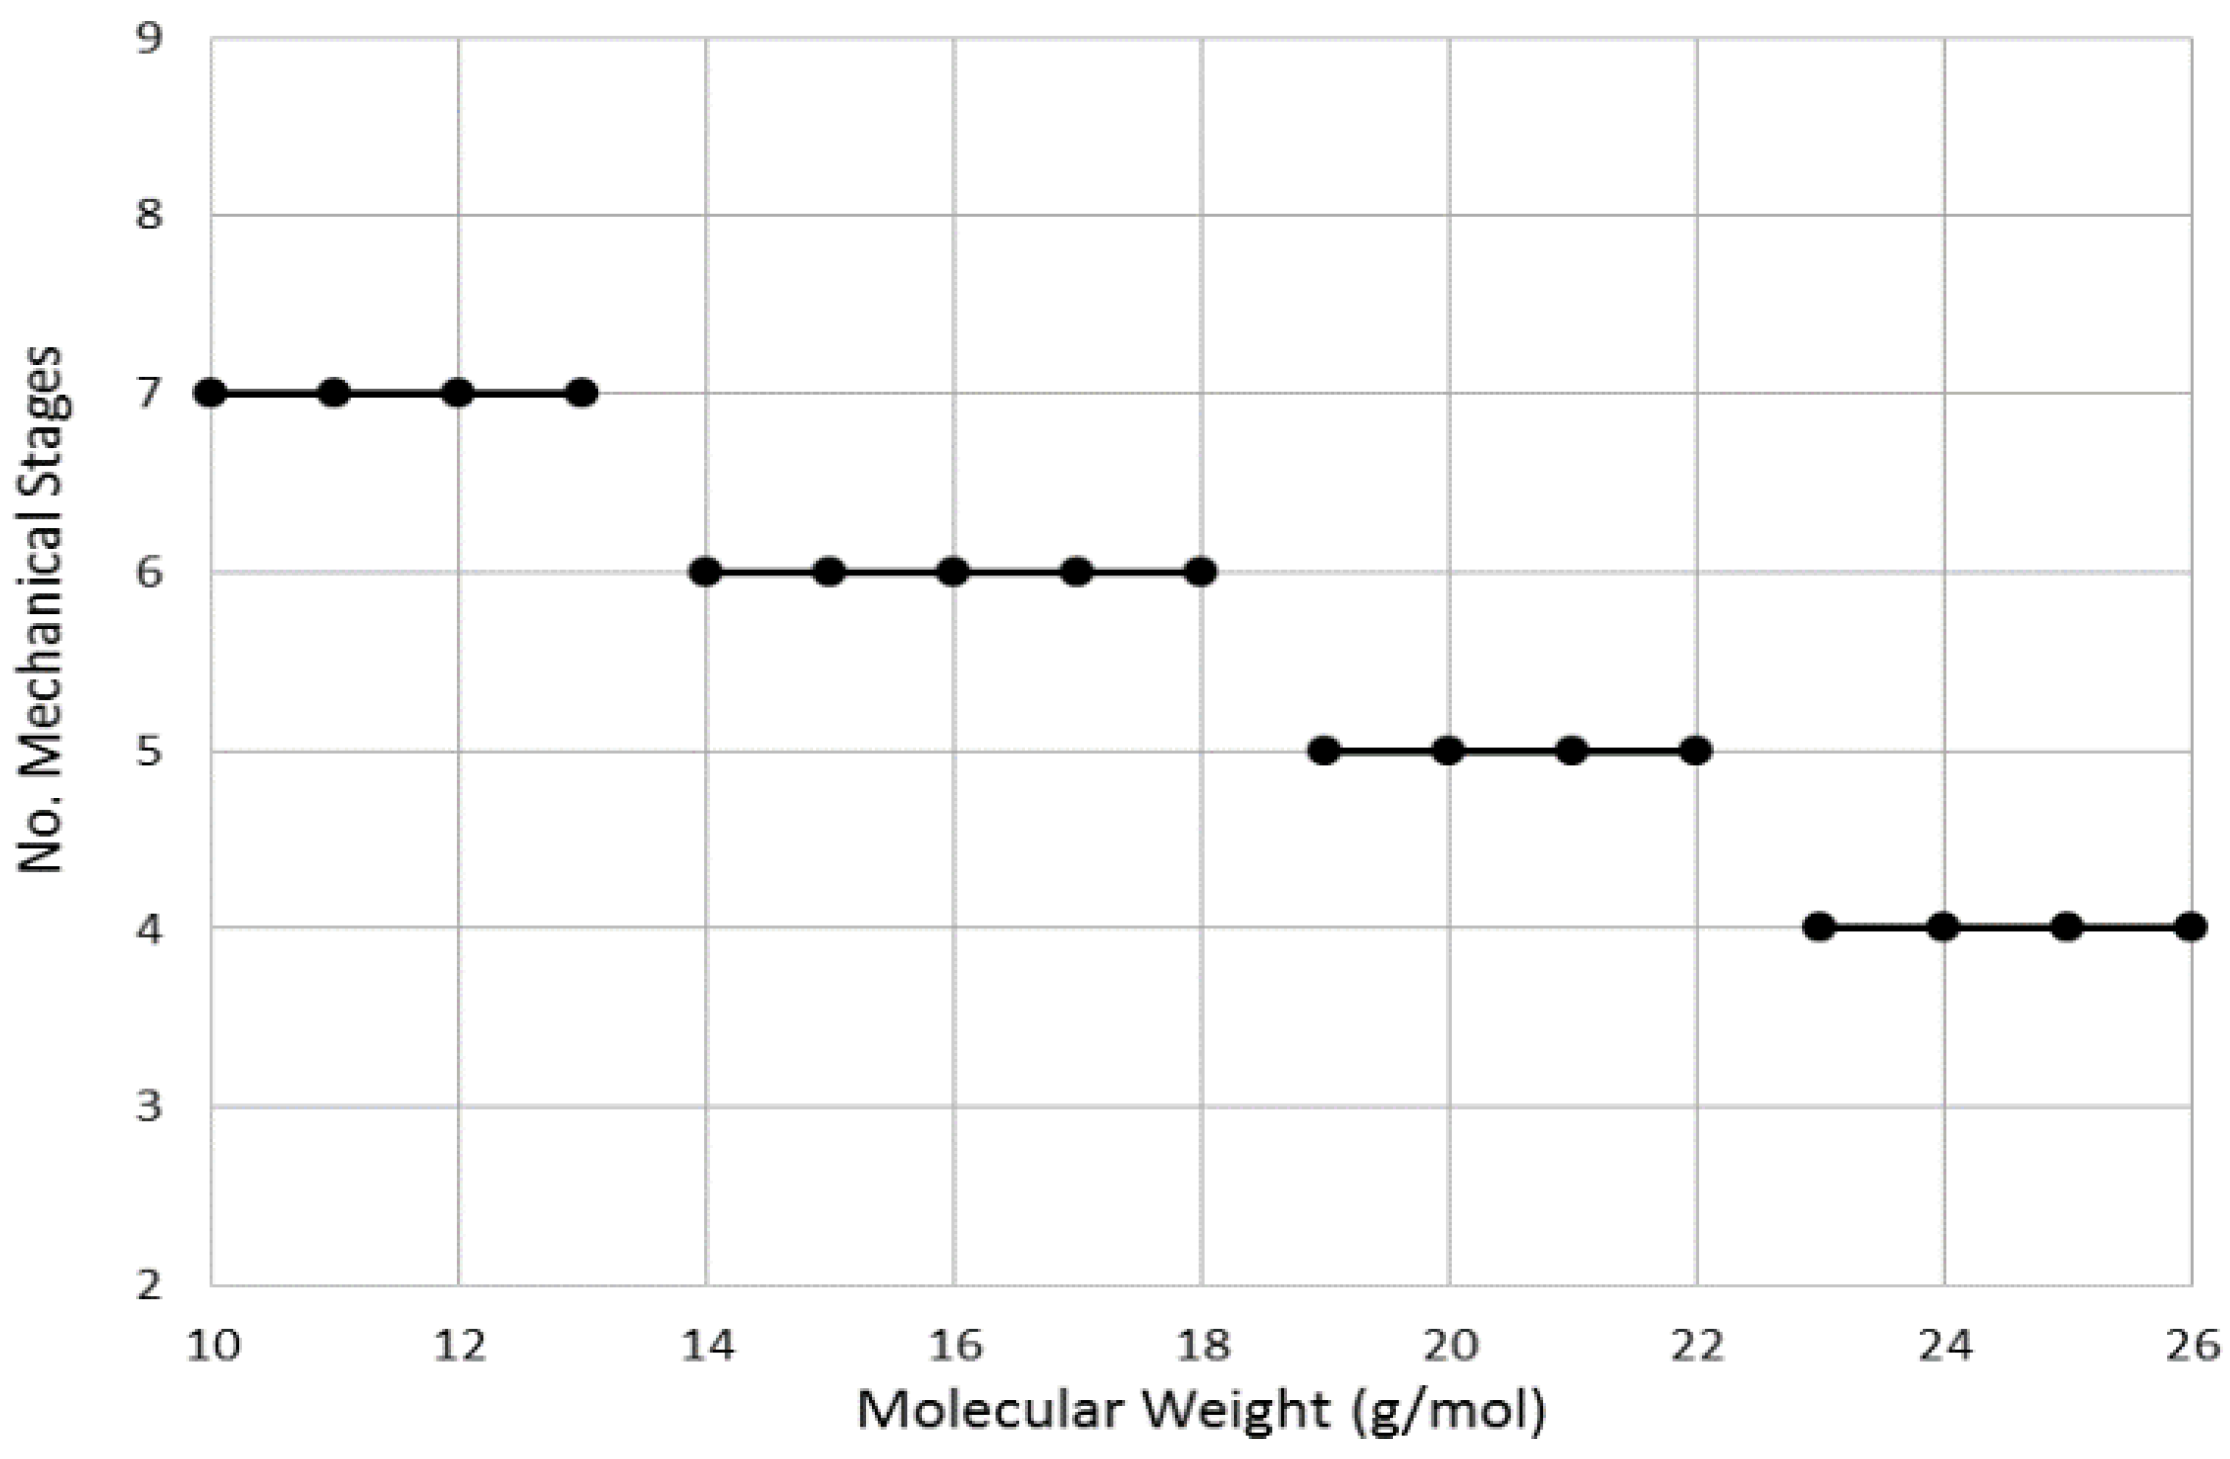
Figure 8 demonstrates the impact of the molecular weight on the compressor structure. The effect of gas molar mass on the compressor head causes the required number of mechanical stages to vary. The low molecular weight gas raises the required head to achieve the desired discharge pressure, leading to greater pressure coefficient on the impeller blades. Therefore, the required number of impellers has to be reviewed at an early stage to consider the expected variation in gas relative density.
Figure 7.
Maximum polytropic head per impeller based on molecular weight and discharge pressure.
Figure 7.
Maximum polytropic head per impeller based on molecular weight and discharge pressure.
Figure 8.
Effect of gas molecular weight on compressor structure.
Figure 8.
Effect of gas molecular weight on compressor structure.
3.2. Effect of Gas Compressibility (Z)
The compressibility factor is determined according to the gas compositions and the instant temperature and pressure values. At a fixed inlet pressure and temperature, the increase in the critical properties leads reduced pressure and temperature, yielding a lower compressibility factor.
Figure 9a illustrates the effect of the compressibility factor on the compressor pressure ratio and polytropic head when the rest of the gas properties are fixed. Since the pressure ratio is actually a function of top-speed Mach number, the low compressibility causes the gas to flow at a higher Mach number, yielding a greater pressure ratio. This is indeed due to the greater inlet expansion from flange to impeller eye and increased pressure recovery in the diffuser at a high Mach number. However, the reduction in compressibility factor leads to lower peak efficiency, as shown in
Figure 9b. This offsets the effect of the Mach number on the pressure ratio rise, with a more pronounced impact near surge point. The greater decrease in the part-load efficiency causes the pressure ratio trend to be flatter near surge flow.
Furthermore, a slight reduction in the operating range was observed at a low compressibility factor value. The high pressure ratio at high flow region raises the required polytropic head. This increase in the head is obviously influenced by the pressure ratio rise. However, the high surge flow of low compressibility gases pushes the polytropic head to drop earlier.
Figure 9c illustrates an increase in the specific power at a low gas compressibility factor. Unlike the gas molecular weight, the change in the specific power is almost constant at all speed lines and throughout the flow range. In terms of efficiency and surge margin,
Figure 9d demonstrates a similar trend for both stage efficiency and surge margin. The high
Z value shifts the pressure ratio curve to lower values, leading to a lower pressure ratio value and simultaneously to higher surge margin and greater efficiency value.
Figure 9.
Effect of gas compressibility on (a) compressor head; (b) compressor efficiency; (c) specific power; (d) surge margin and efficiency change at fixed flow rate.
Figure 9.
Effect of gas compressibility on (a) compressor head; (b) compressor efficiency; (c) specific power; (d) surge margin and efficiency change at fixed flow rate.
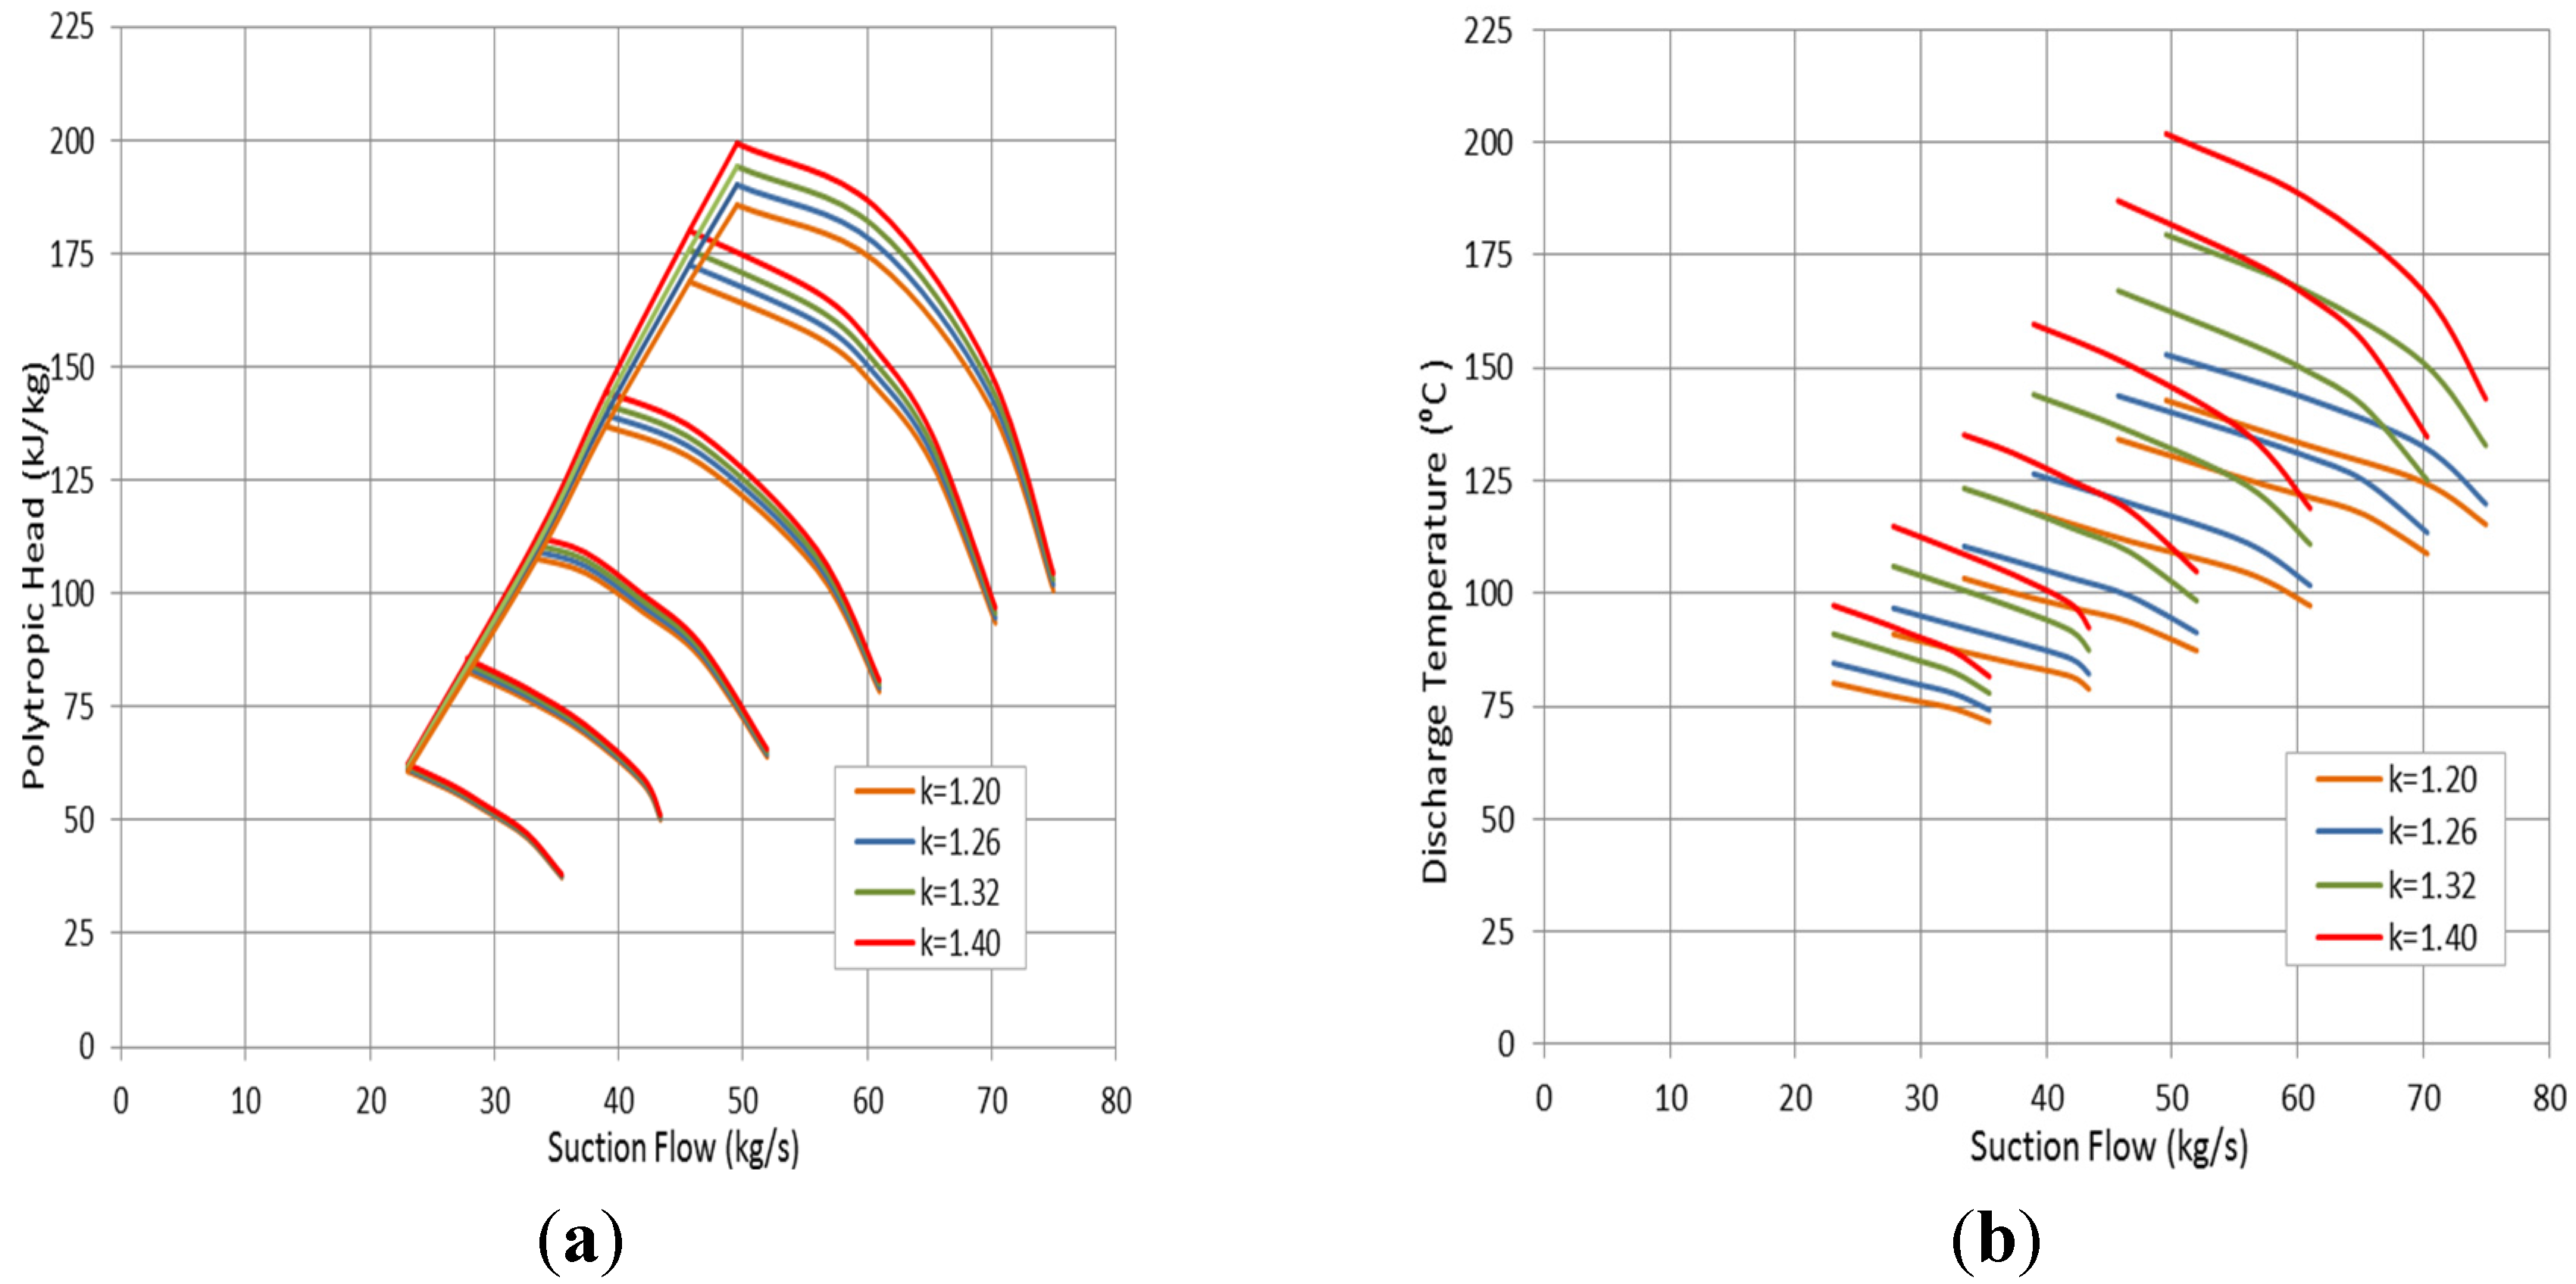
3.3. Effect of Specific Heats Ratio (k)
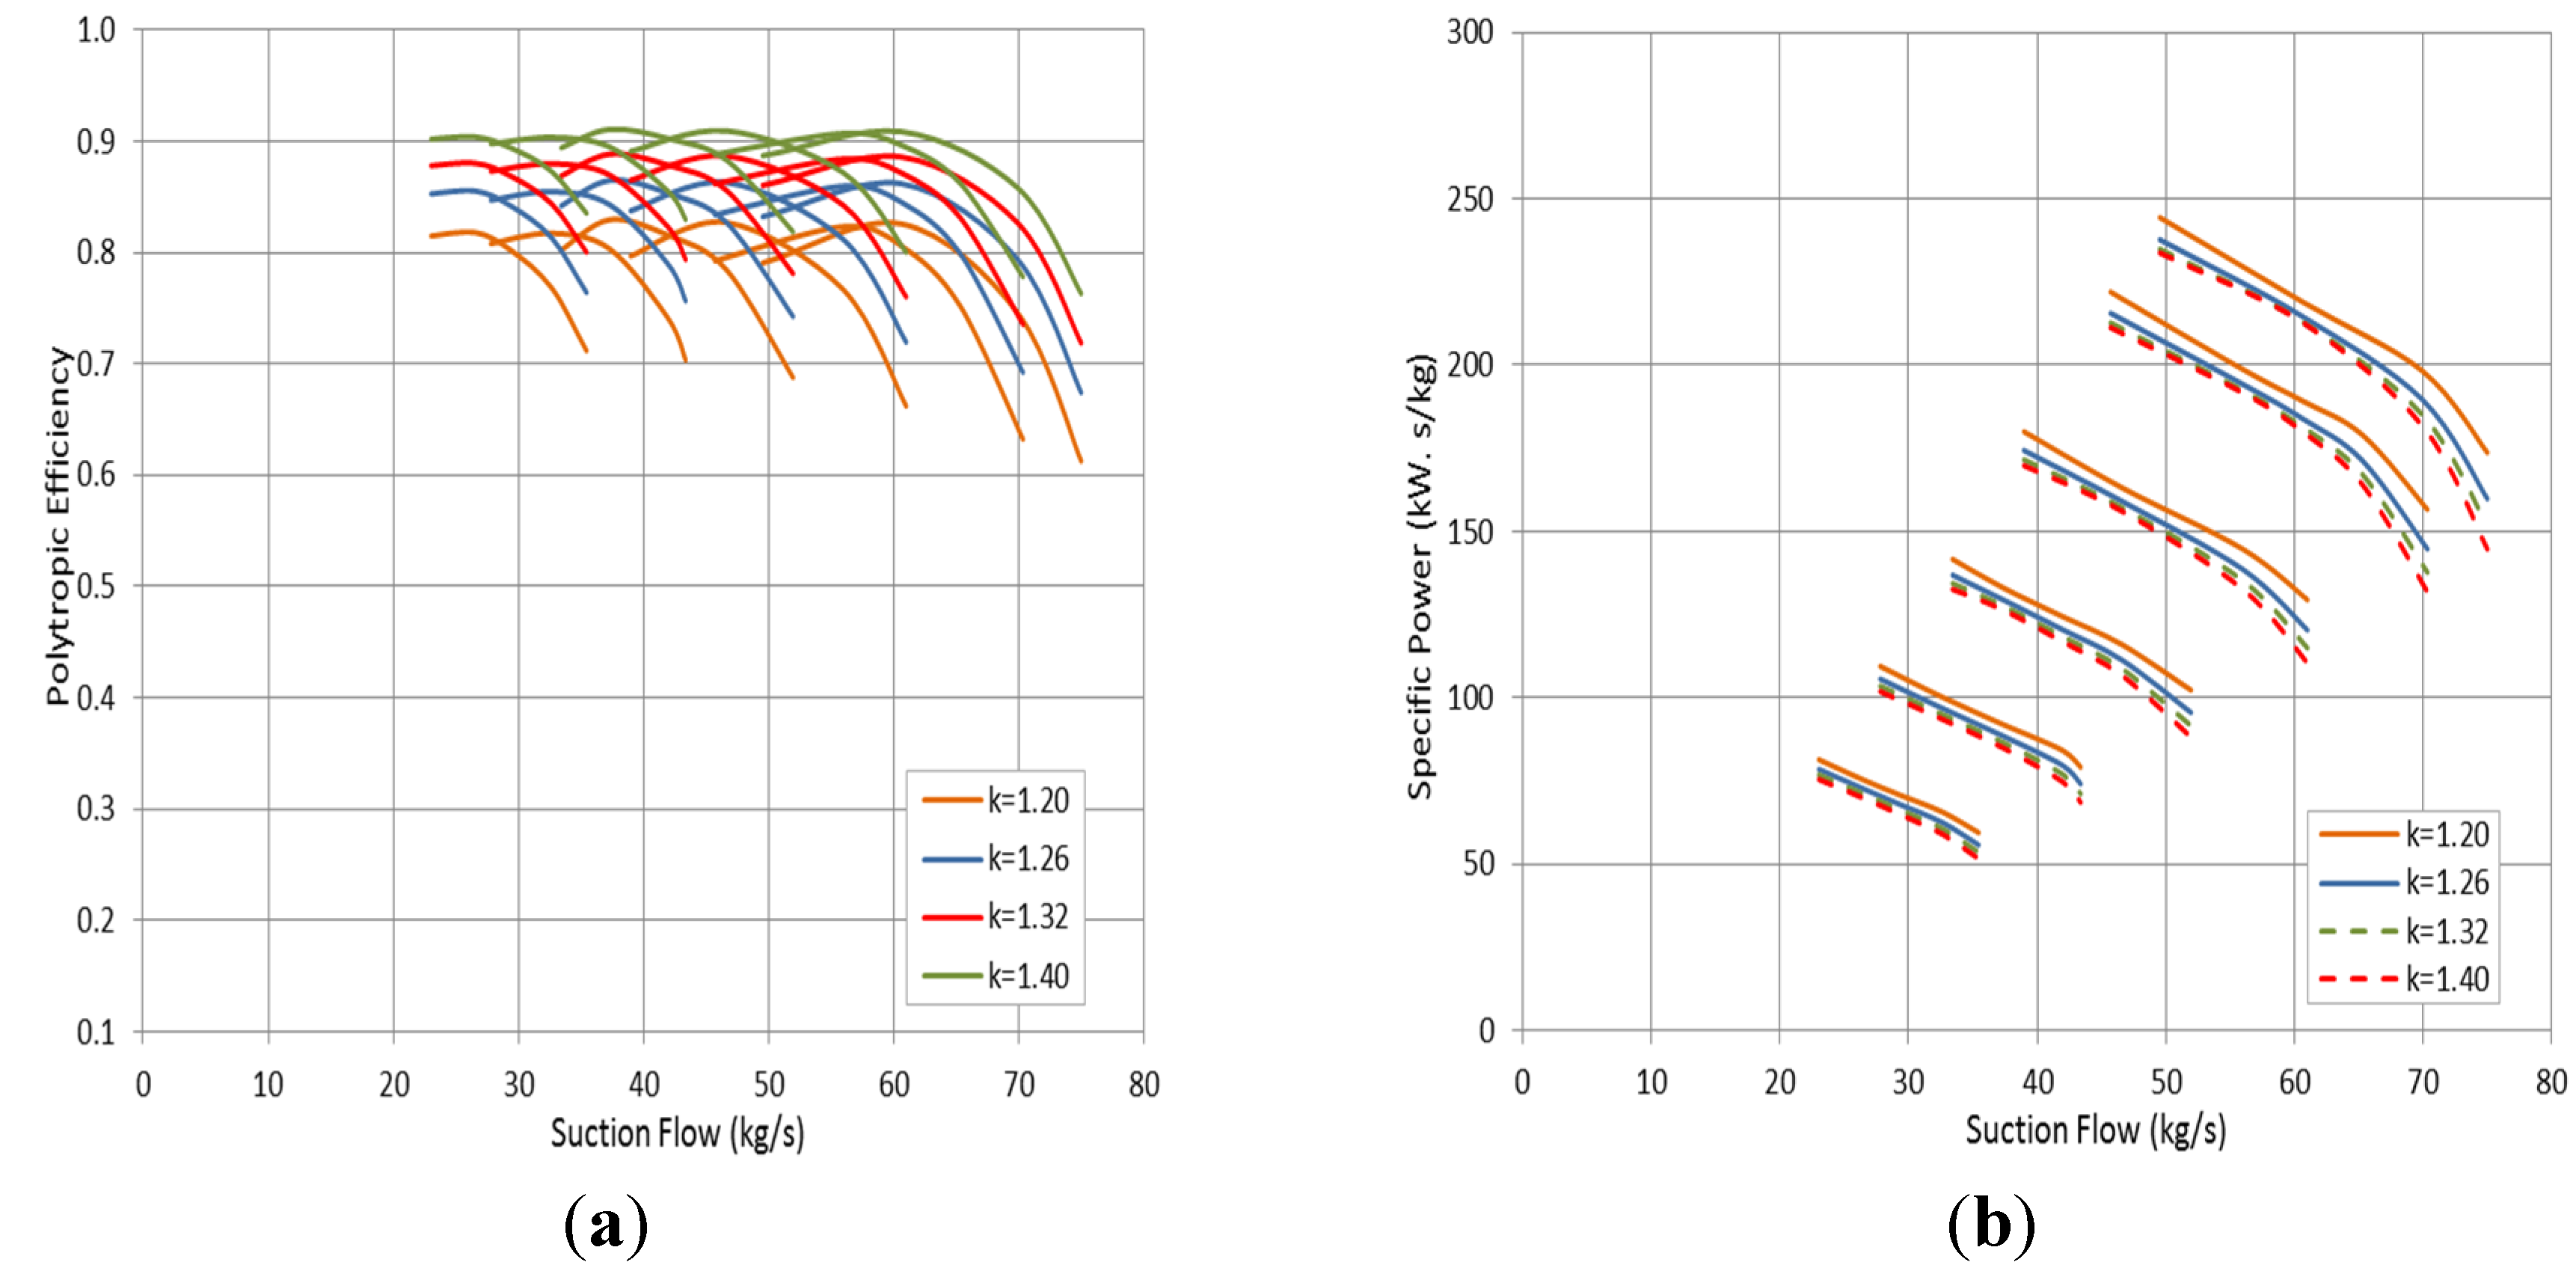
A slight decrease in the pressure ratio was observed at a high specific heats ratio when the molecular weight is constant. On the other hand, the polytropic head has an upward trend with the
k value rise, as demonstrated in
Figure 10a. The head is increasing proportionally with the volume polytropic exponent, which in turn increases as the specific heats ratio goes up. However, the influence of the pressure ratio on the head value is less significant when it is compared with the volume polytropic exponent effect. Additionally, it was found that the impact of gas heats ratio on the compressor head becomes more pronounced at high rotational speed. Furthermore, the operating range is decreasing as the specific heats ratio of the handled gas reduces.
There is another effect of the high specific heats ratio gases, illustrated in
Figure 10b. The high specific heats ratio (
k) causes the temperature polytropic exponent to rise, yielding a higher discharge temperature at the same pressure ratio. This can elucidate the slight reduction in the discharge pressure value at a high specific heats ratio. Similar to gas compressibility effect, the efficiency curve in
Figure 11a shows a reduction at a low specific heats ratio (
k) driven by the rise in the Mach number. This in fact indicates higher frictional losses and lower pressure recovery, which dissipated a part of the shaft power. In order to confirm that, the specific power curve is derived as illustrated in
Figure 11b. This demonstrates an increase in the specific power value at low specific heats ratio gases, which in turn donates a higher power consumption when the low
k-value gases are used.
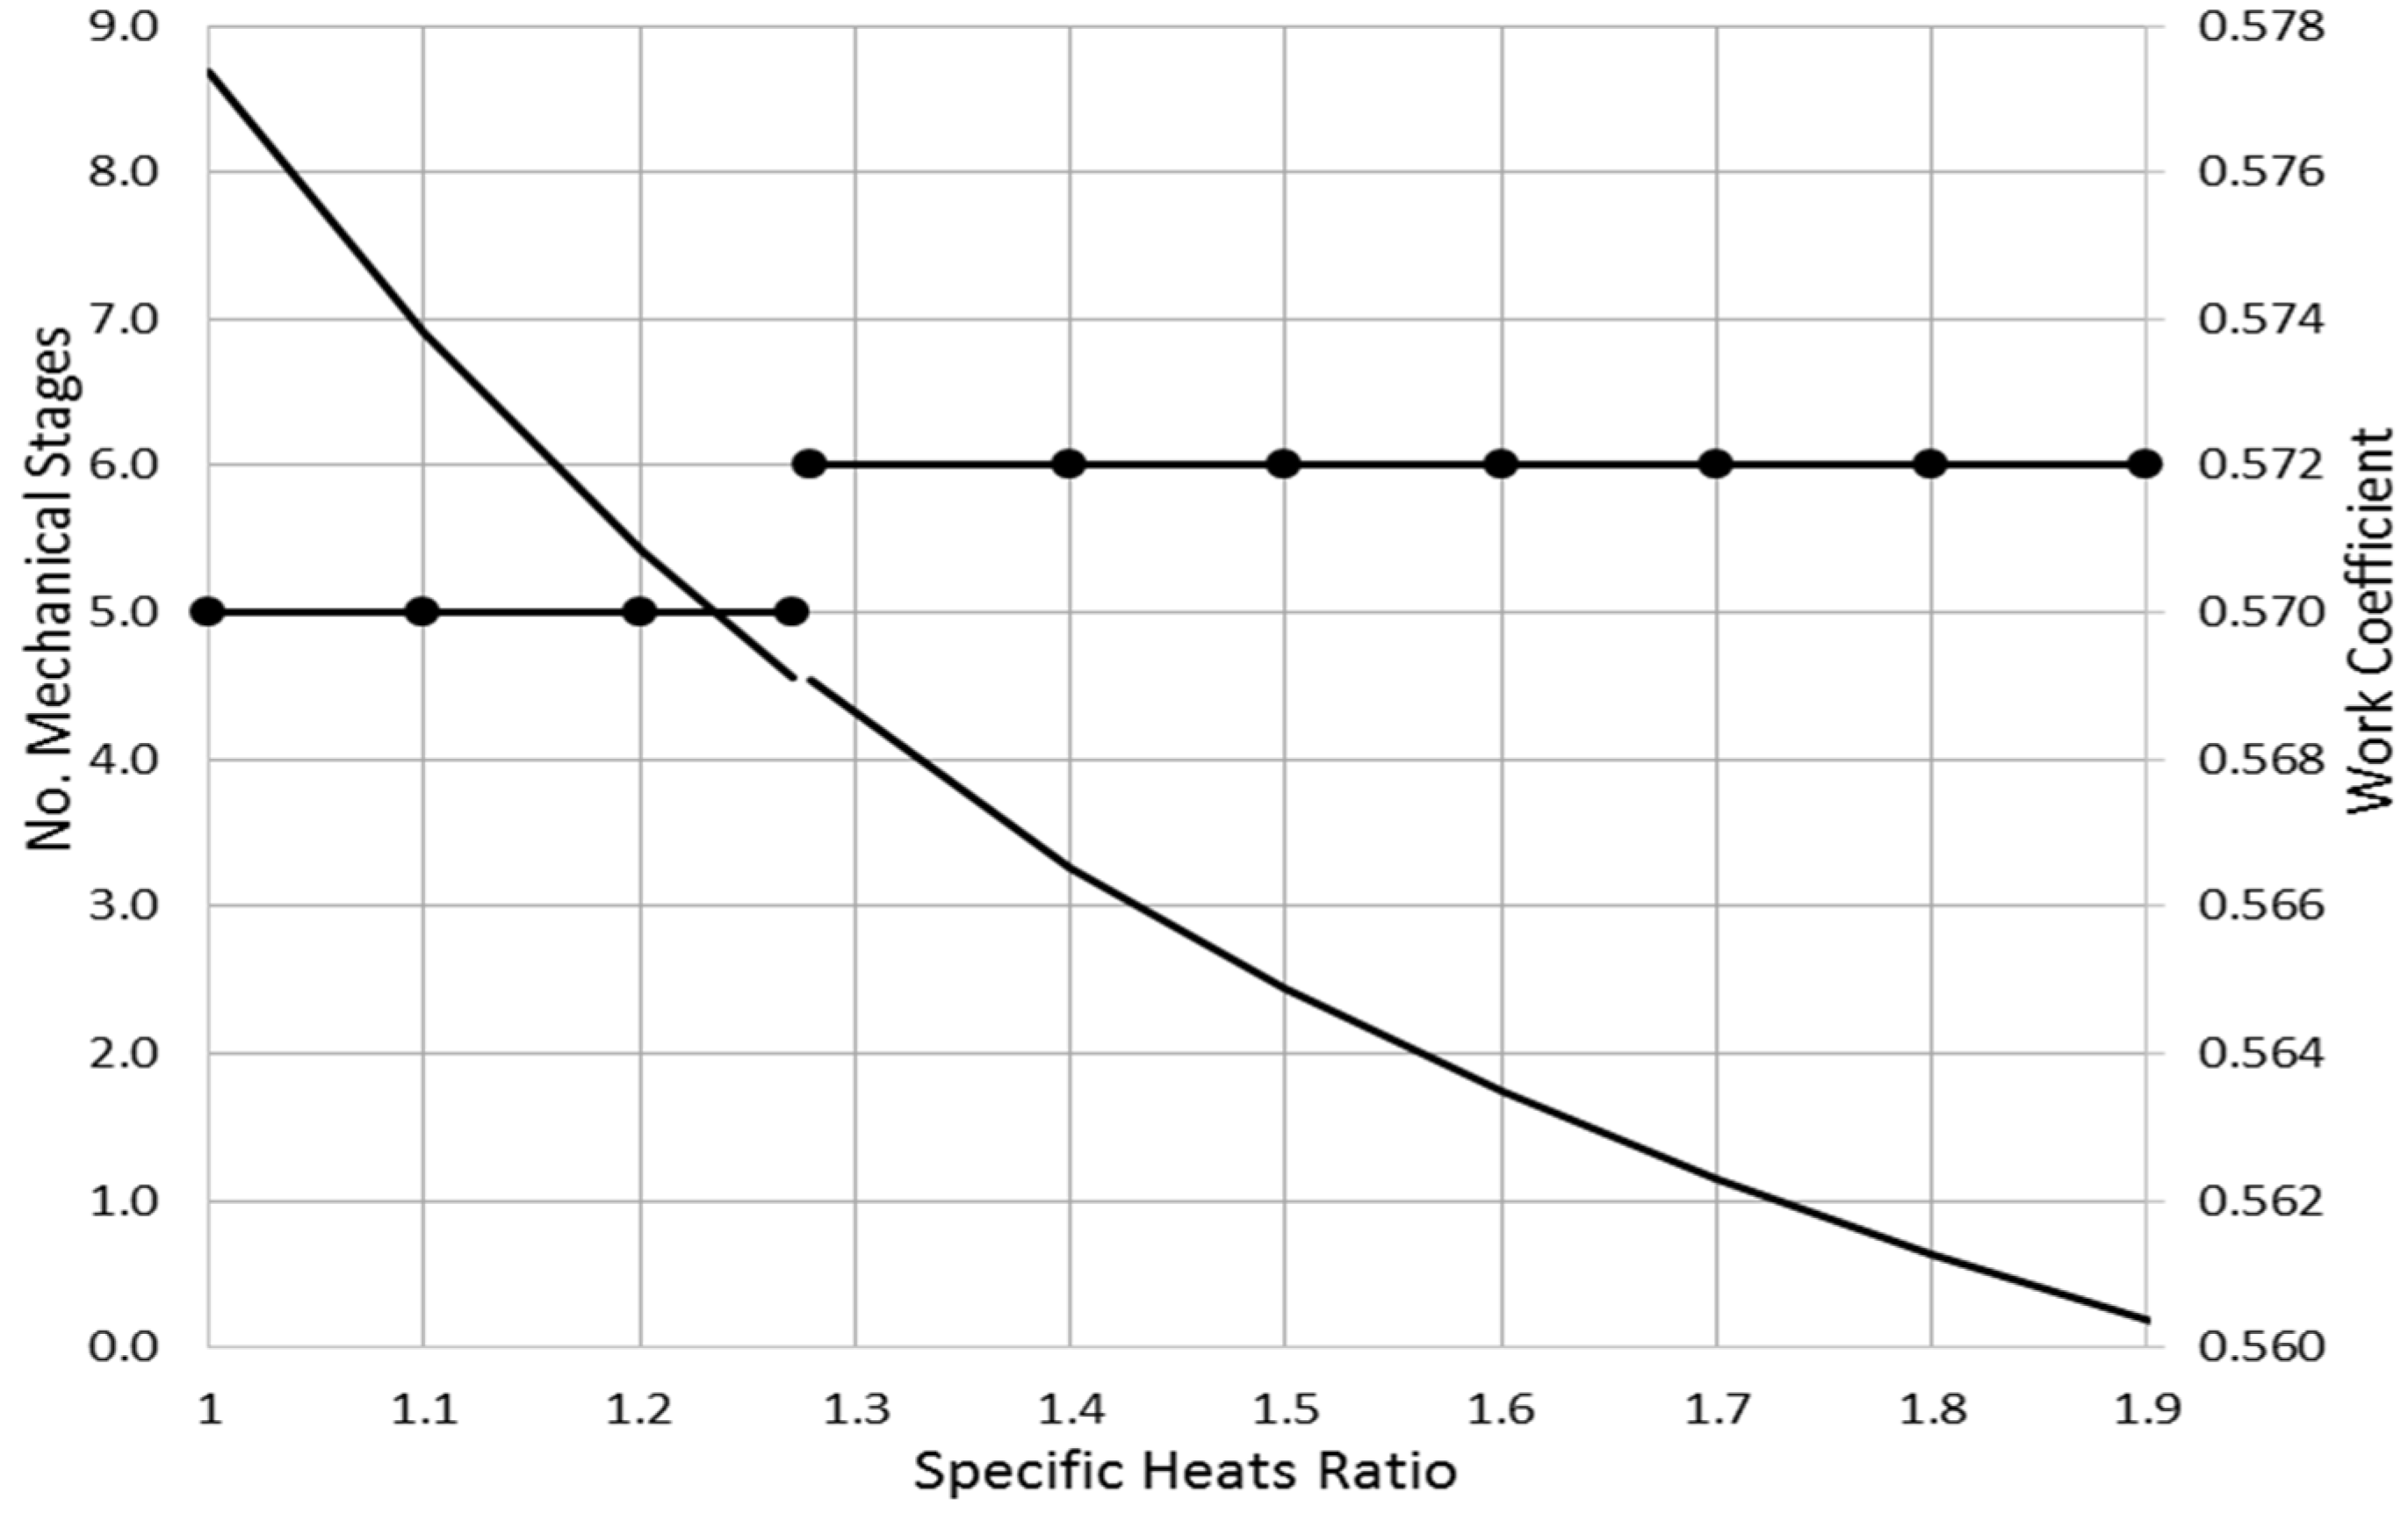
Figure 12 shows a gradual reduction in the work coefficient as the specific heats ratio (
k) increases. The limitation in the pressure rise at a high specific heats ratio pushes the compressor designers to accommodate more mechanical stages while handling the high
k-value gases.
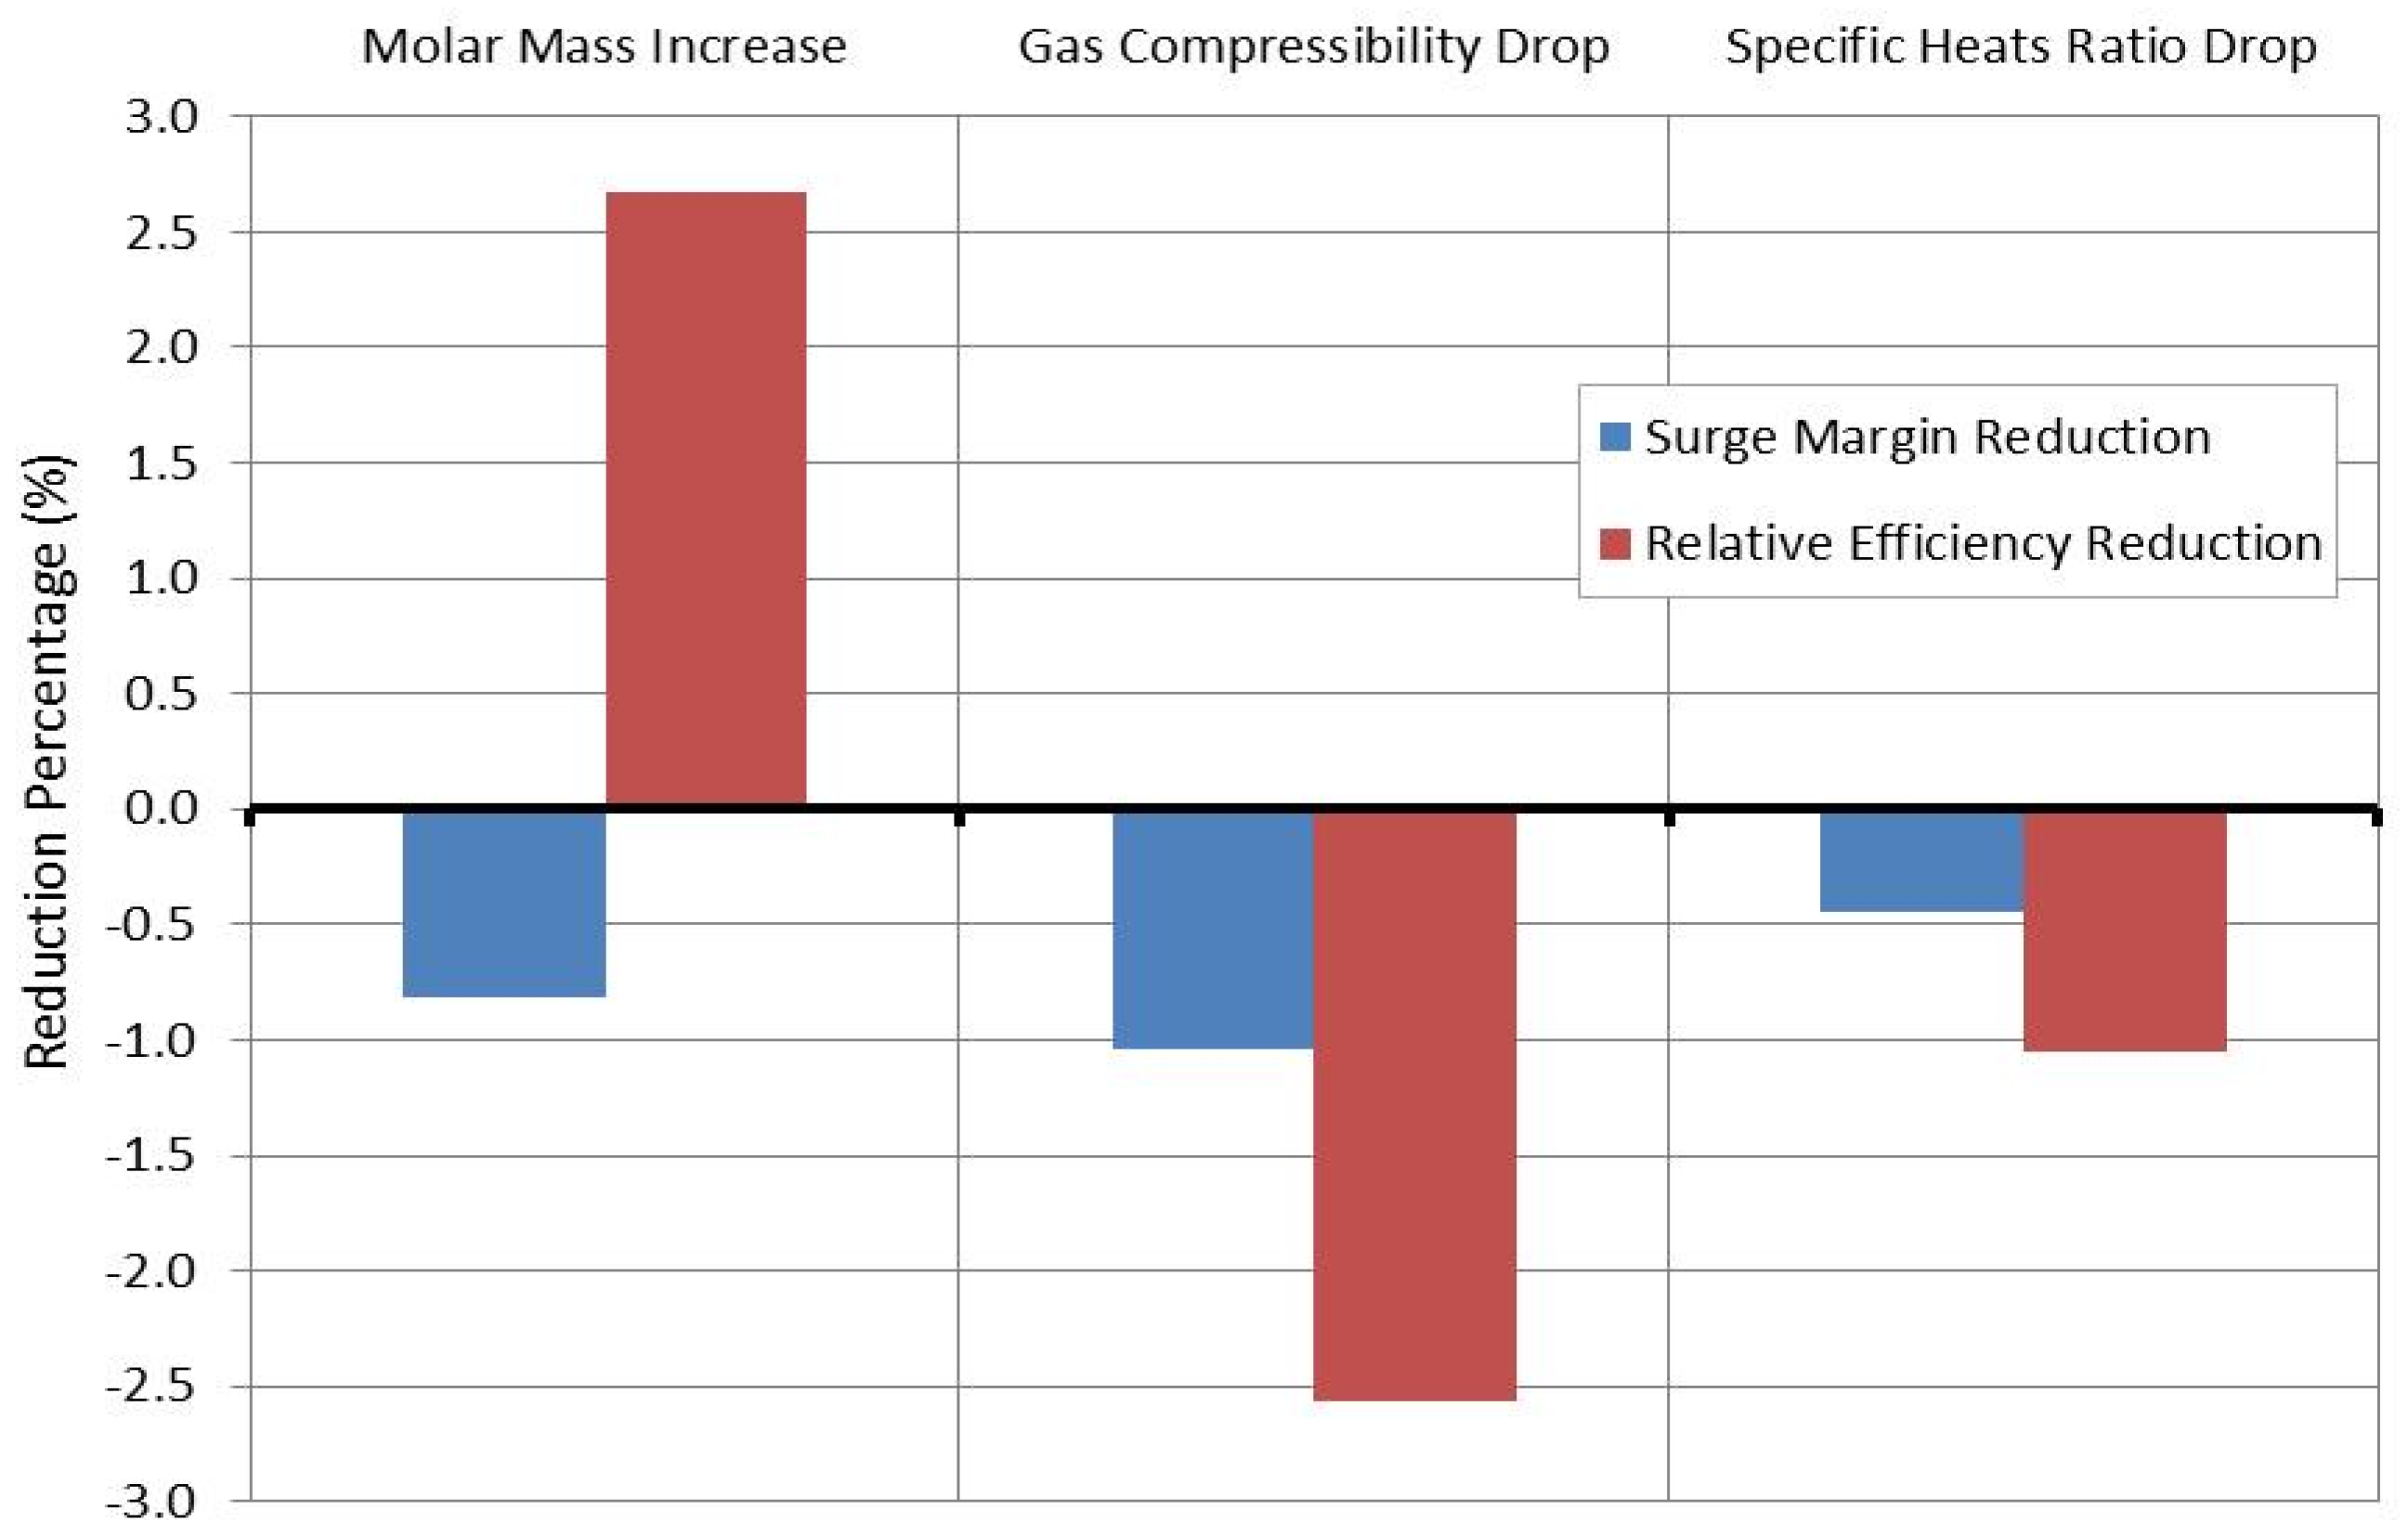
Figure 13 illustrates the estimated reduction in surge margin and efficiency at a low specific heats ratio. A more significant drop was detected in the efficiency value. Compared with the molecular weight and gas compressibility effect, the impact of
k-value drop on efficiency and surge margin is less substantial. The largest reduction in surge margin was observed with a gas compressibility drop while the highest difference in stage efficiency was caused by a molecular weight increase.
Figure 10.
Effect of gas specific heats ratio on: (a) polytropic head; (b) discharge temperature.
Figure 10.
Effect of gas specific heats ratio on: (a) polytropic head; (b) discharge temperature.
Figure 11.
Effect of gas specific heats ratio on: (a) Compressor efficiency; (b) Specific power.
Figure 11.
Effect of gas specific heats ratio on: (a) Compressor efficiency; (b) Specific power.
Figure 12.
Effect of gas specific heats ratio on compressor structure.
Figure 12.
Effect of gas specific heats ratio on compressor structure.
Figure 13.
Comparison between gas properties’ effect on efficiency and surge margin.
Figure 13.
Comparison between gas properties’ effect on efficiency and surge margin.
4. Compressor Operation Diagnosis Using the Developed Model (Case Study)
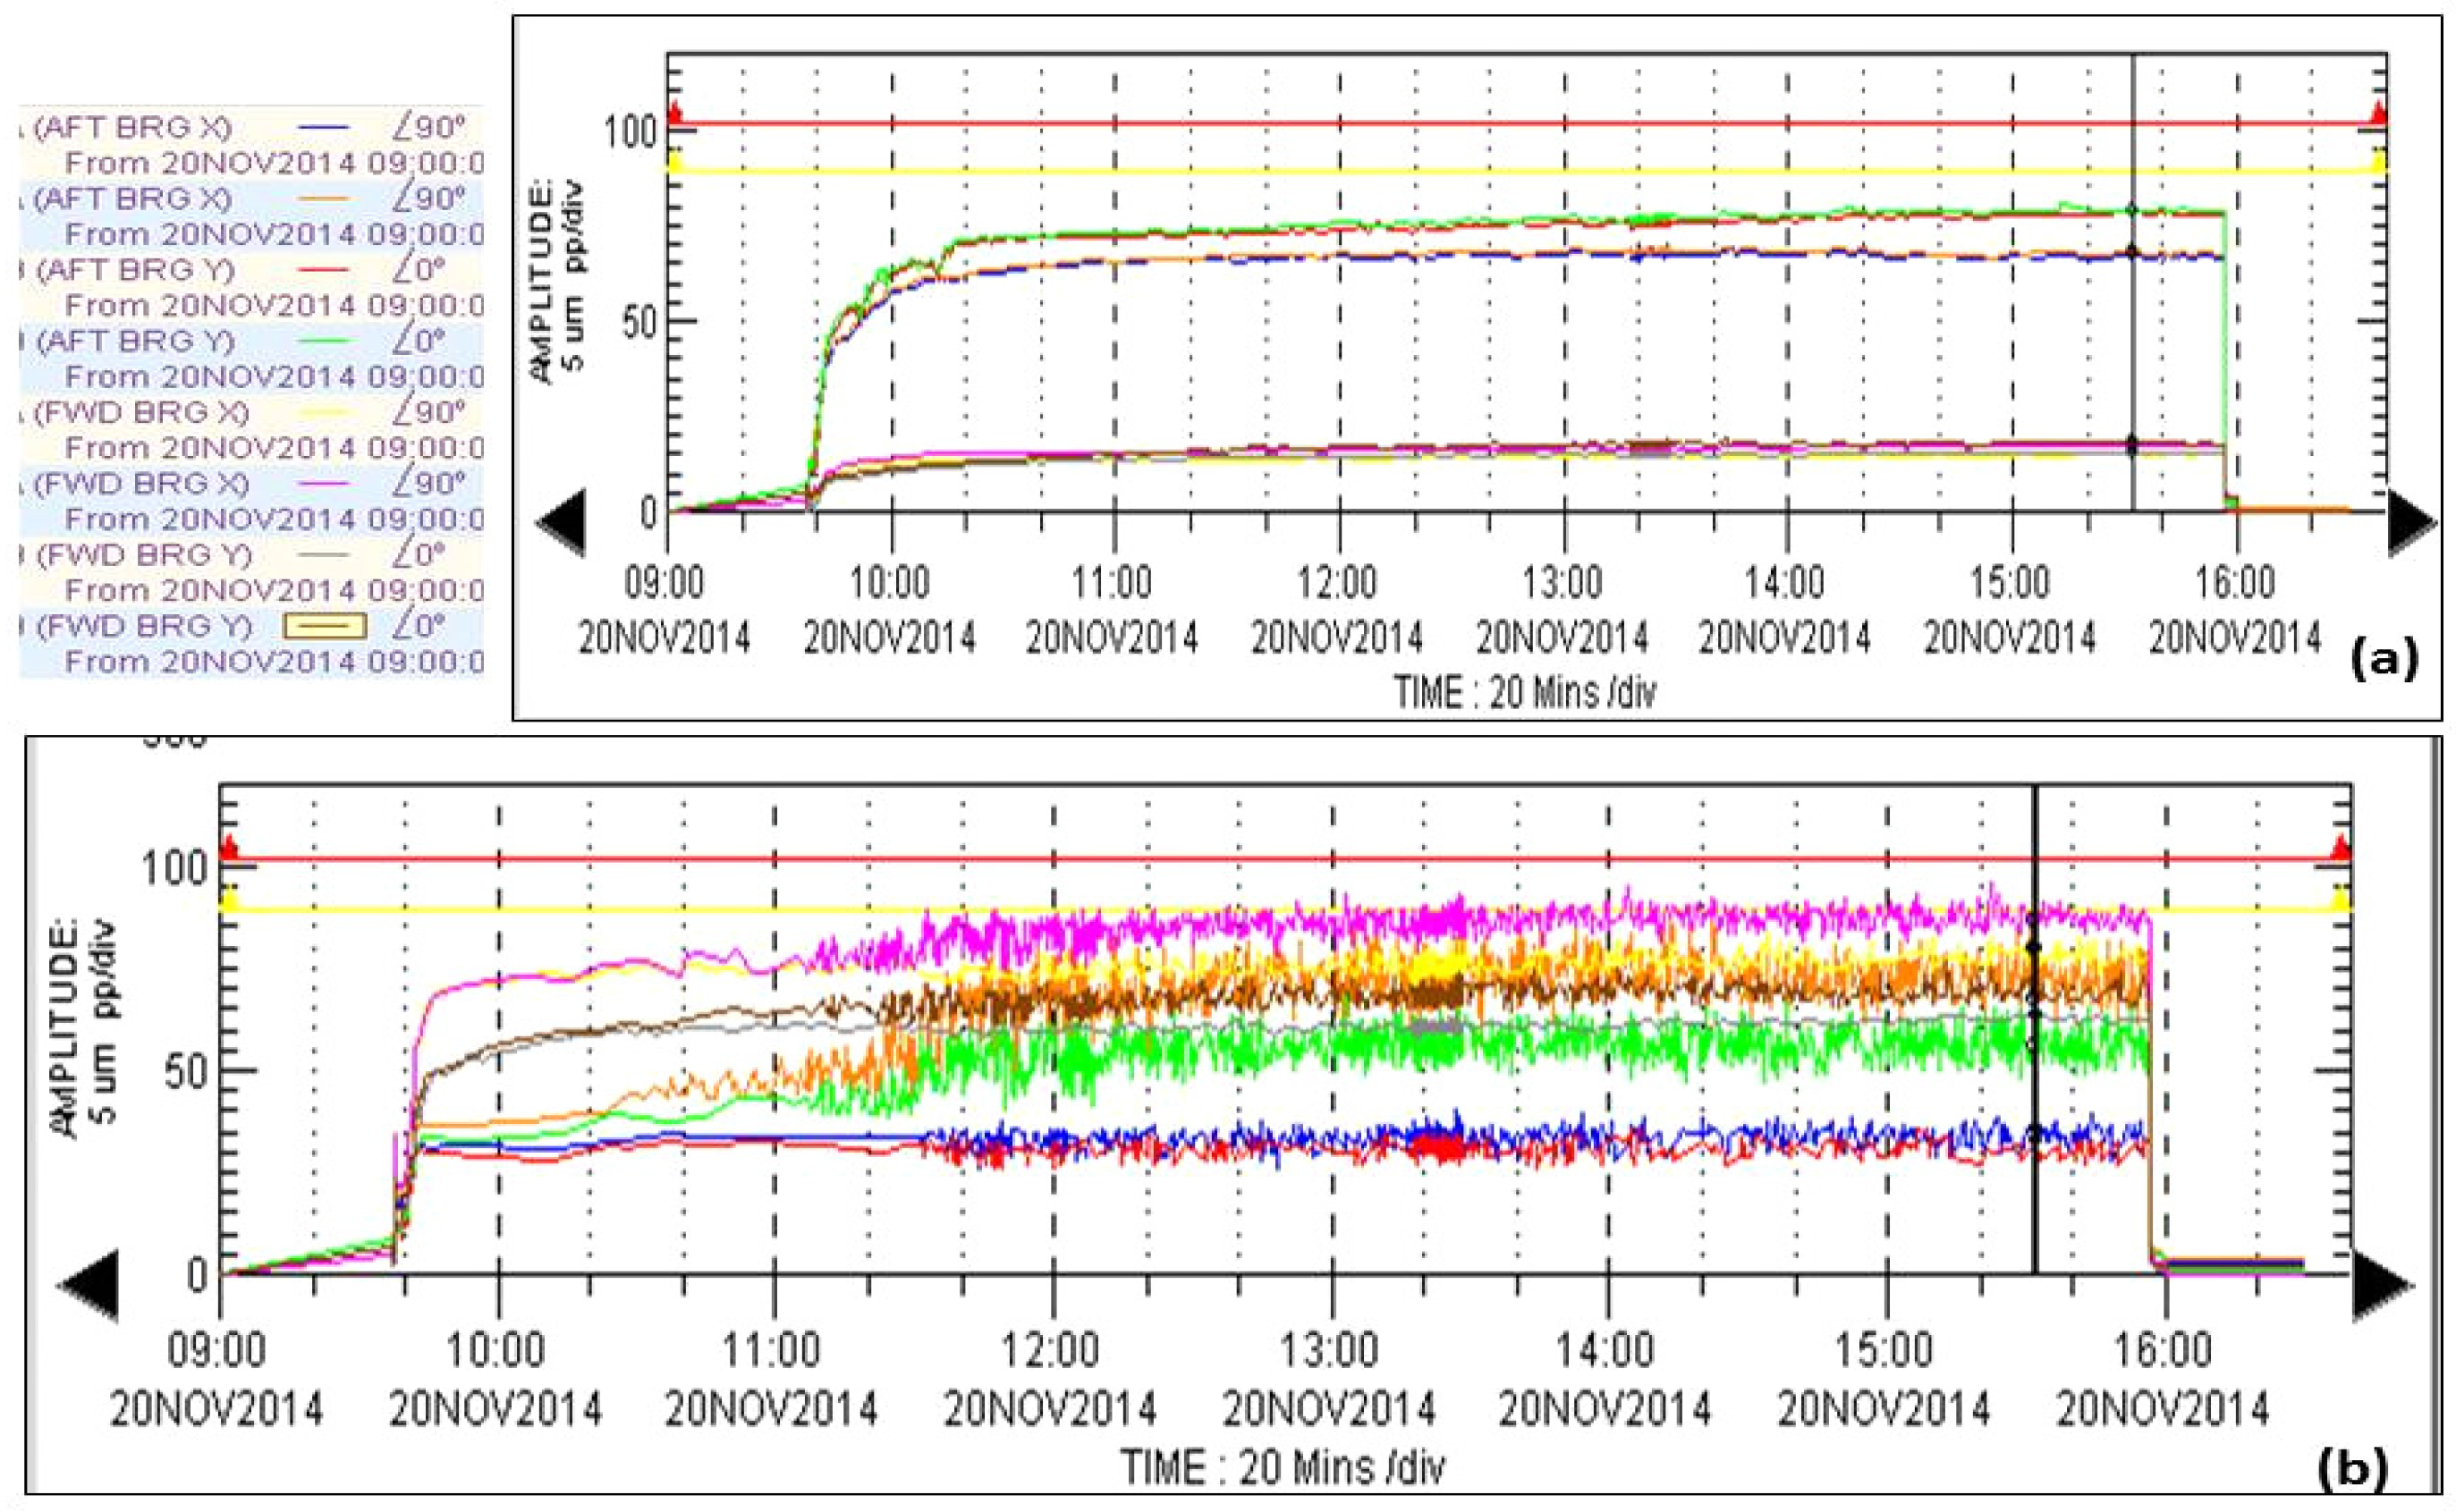
A high vibration level was detected with the 2.95 MW centrifugal compressor in
Section 2, reaching the alarm level and causing the machine to shut down. The vibration trend at the afterward bearings of the first stage demonstrates higher levels of amplitude reaching 79 μm. However, that vibration value was still below the trip level, as illustrated in
Figure 14a. Furthermore, the vibration trend in
Figure 14b indicates a high vibration level at the forward bearing reaching to the alarm level while the vibration at the afterward bearings remained steady at 35 μm.
Figure 14.
Recorded vibration trends at forward and afterward bearings of: (a) First process stage; (b) Intermediate process stage.
Figure 14.
Recorded vibration trends at forward and afterward bearings of: (a) First process stage; (b) Intermediate process stage.
Before analyzing the recorded data, it is necessary to check that the conditions of all instrumentations around the compressor to ensure they gave the actual readings. By reviewing the operational data in
Figure 15,
Figure 16 and
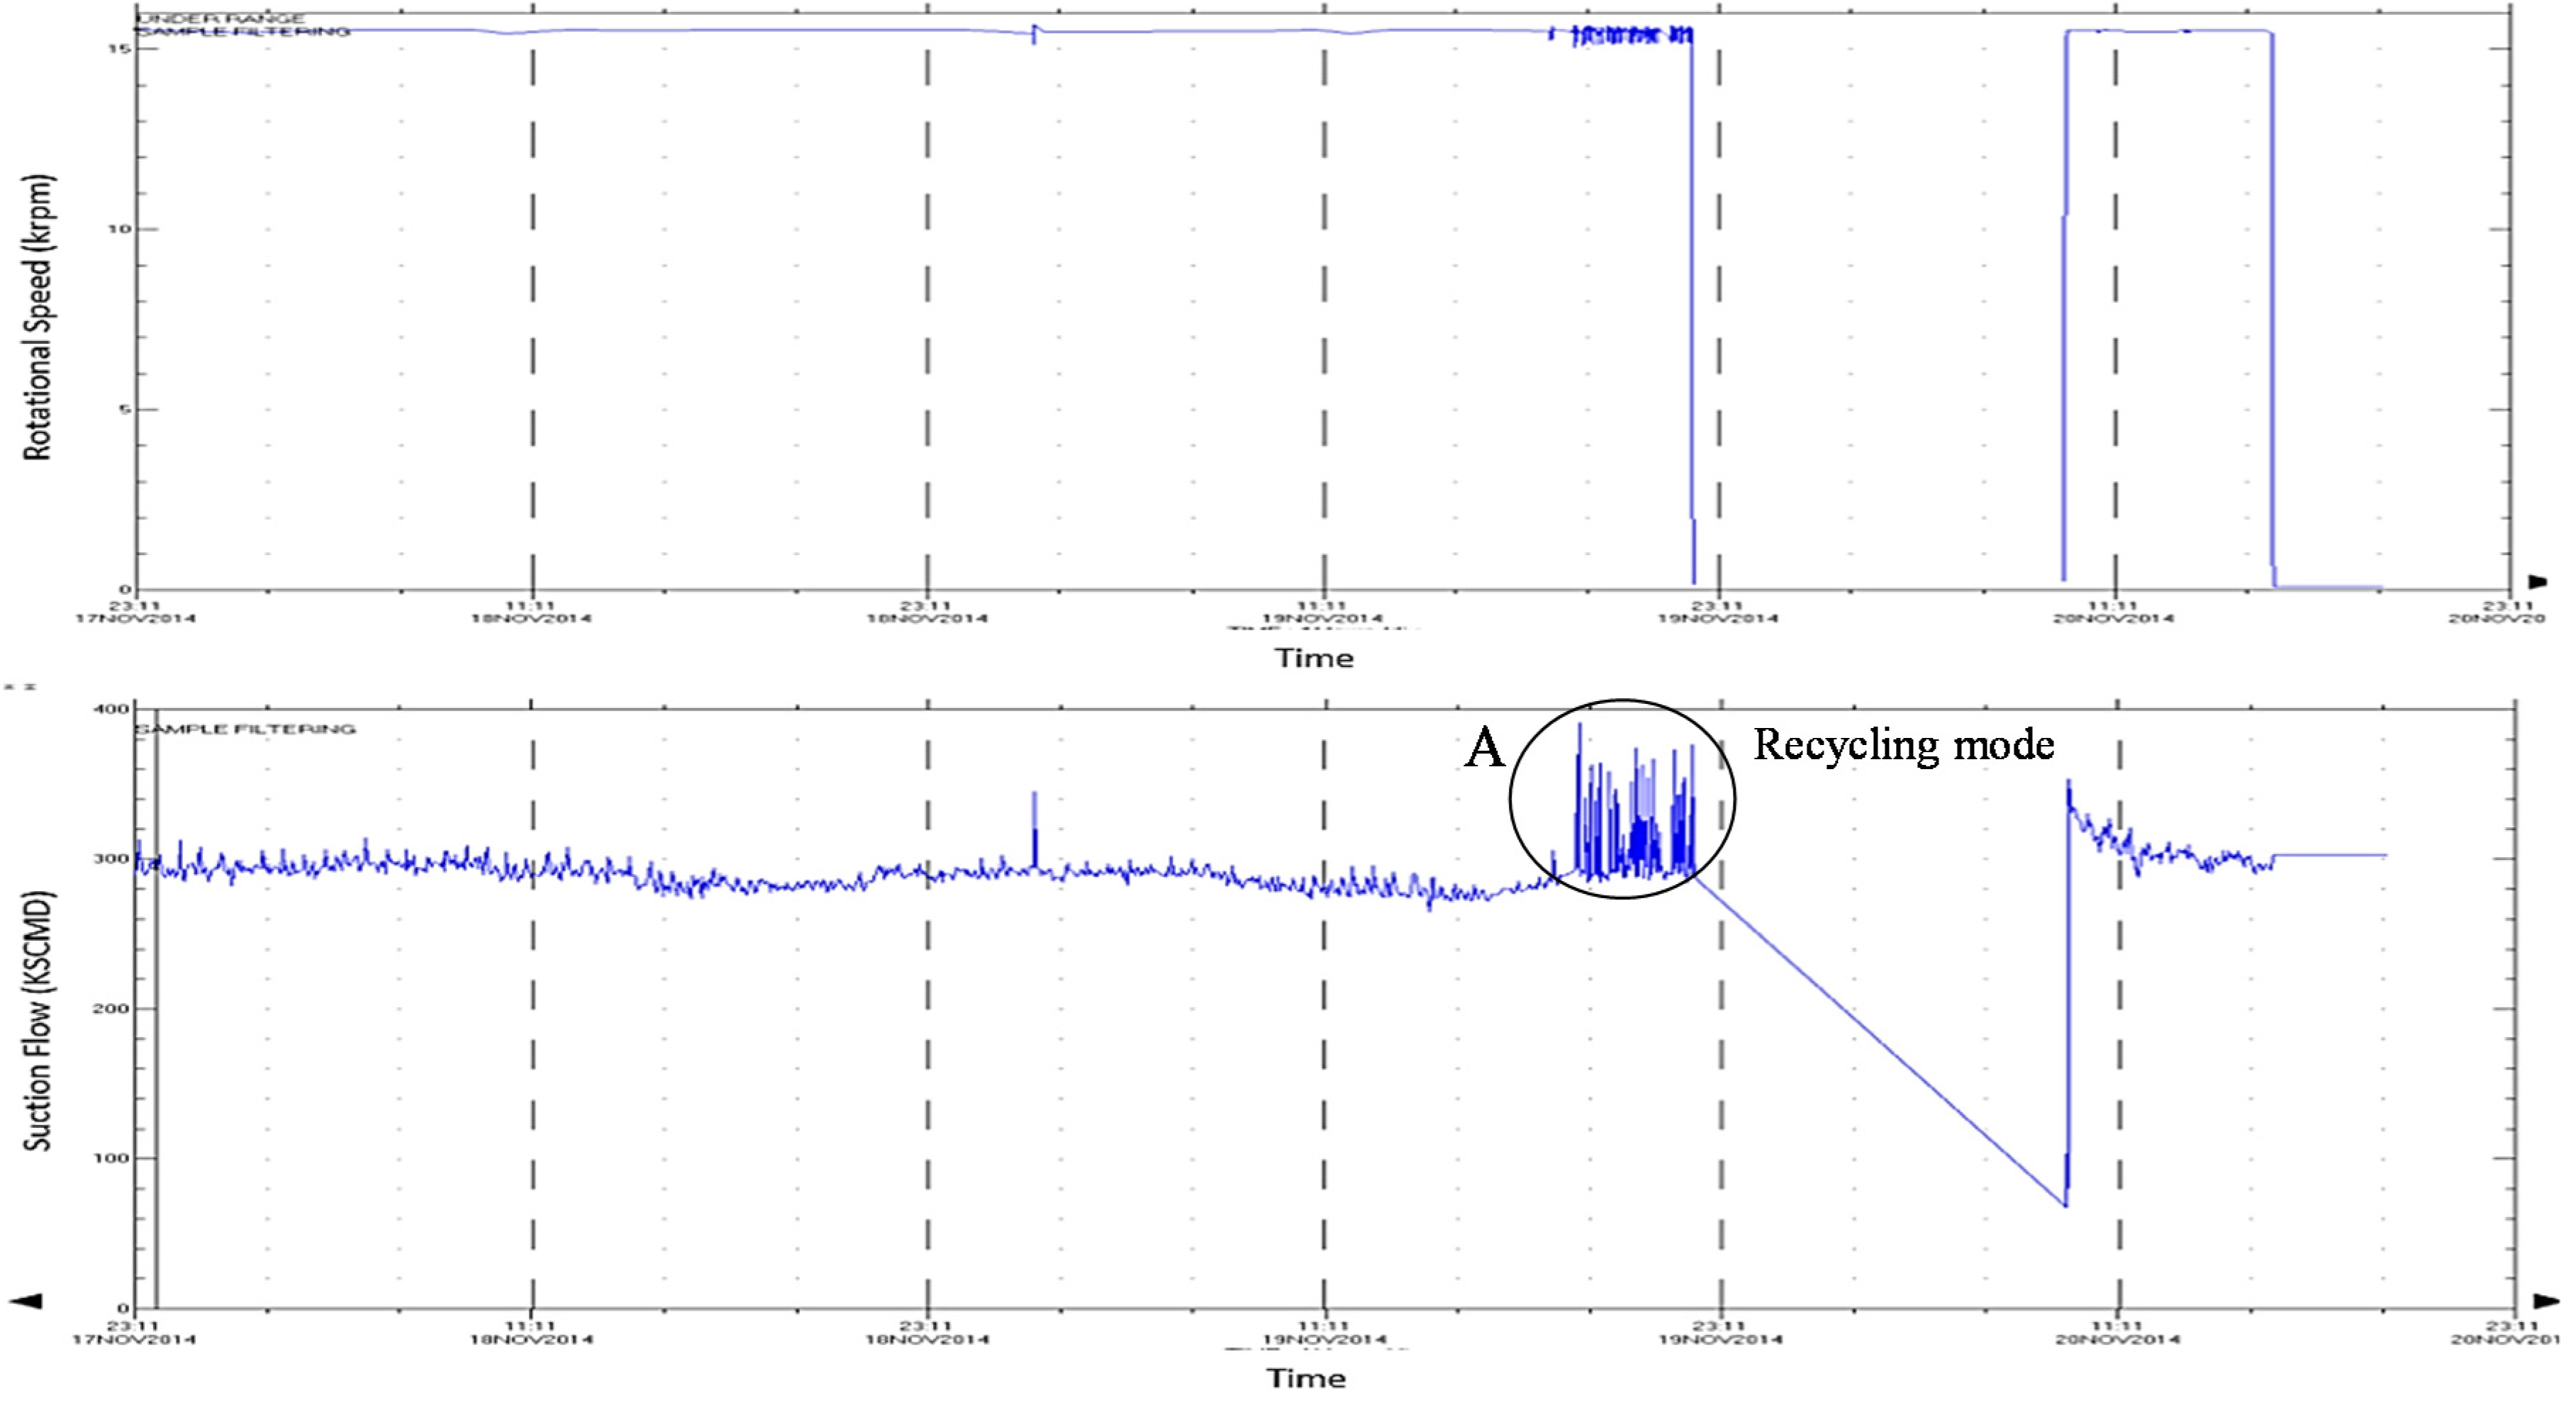
Figure 17, the first stage is working with a relatively higher pressure ratio reaching 3.15, against only 2.88 at equivalent corrected inlet gas properties. Continuing operating this machine at the same conditions will lead to greater fluctuation in the discharge pressure, as was observed in region (A), yielding to a higher vibration level. In this region, the high increase in the discharge pressure drives the machine into the recycle mode in order to pull the operating pressure ratio away from the surge control line. This can be observed clearly from the suction flow trend in
Figure 15. Furthermore, it was also found that the surge margin of the overall compression system dropped from 25% to 10%. However, the compressor is rotating with one percent higher rotational speed than the design value.
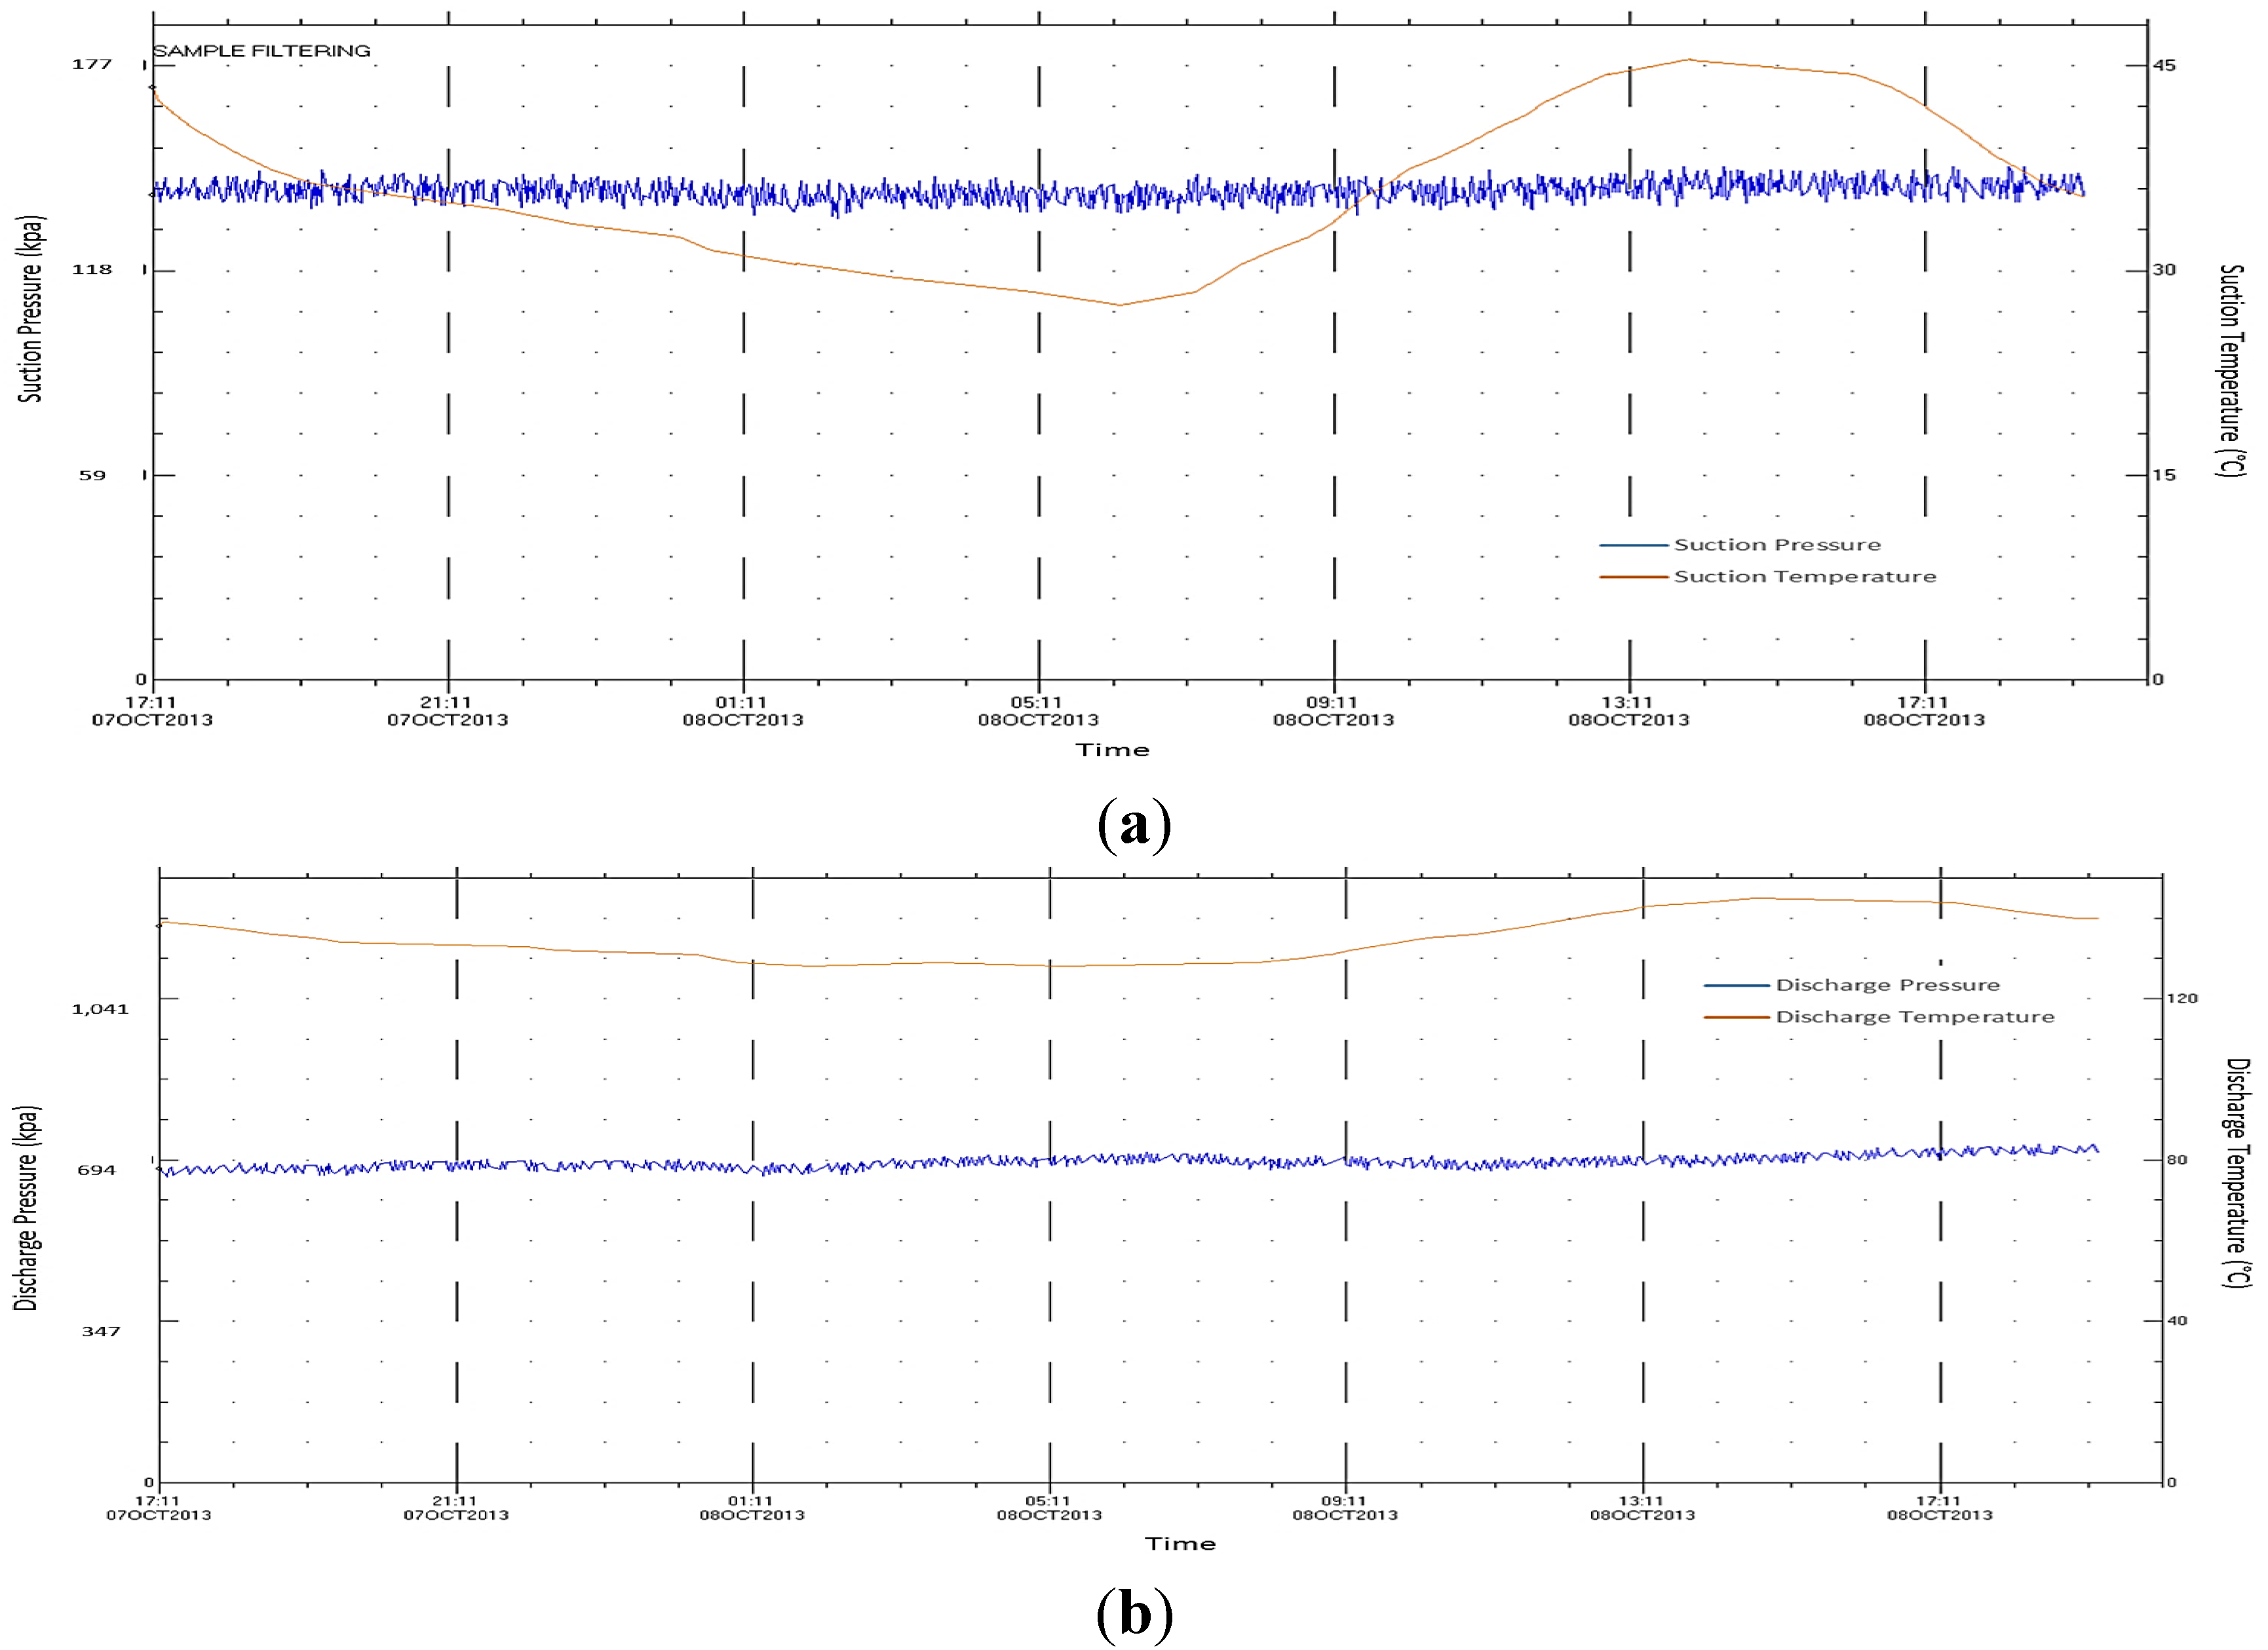
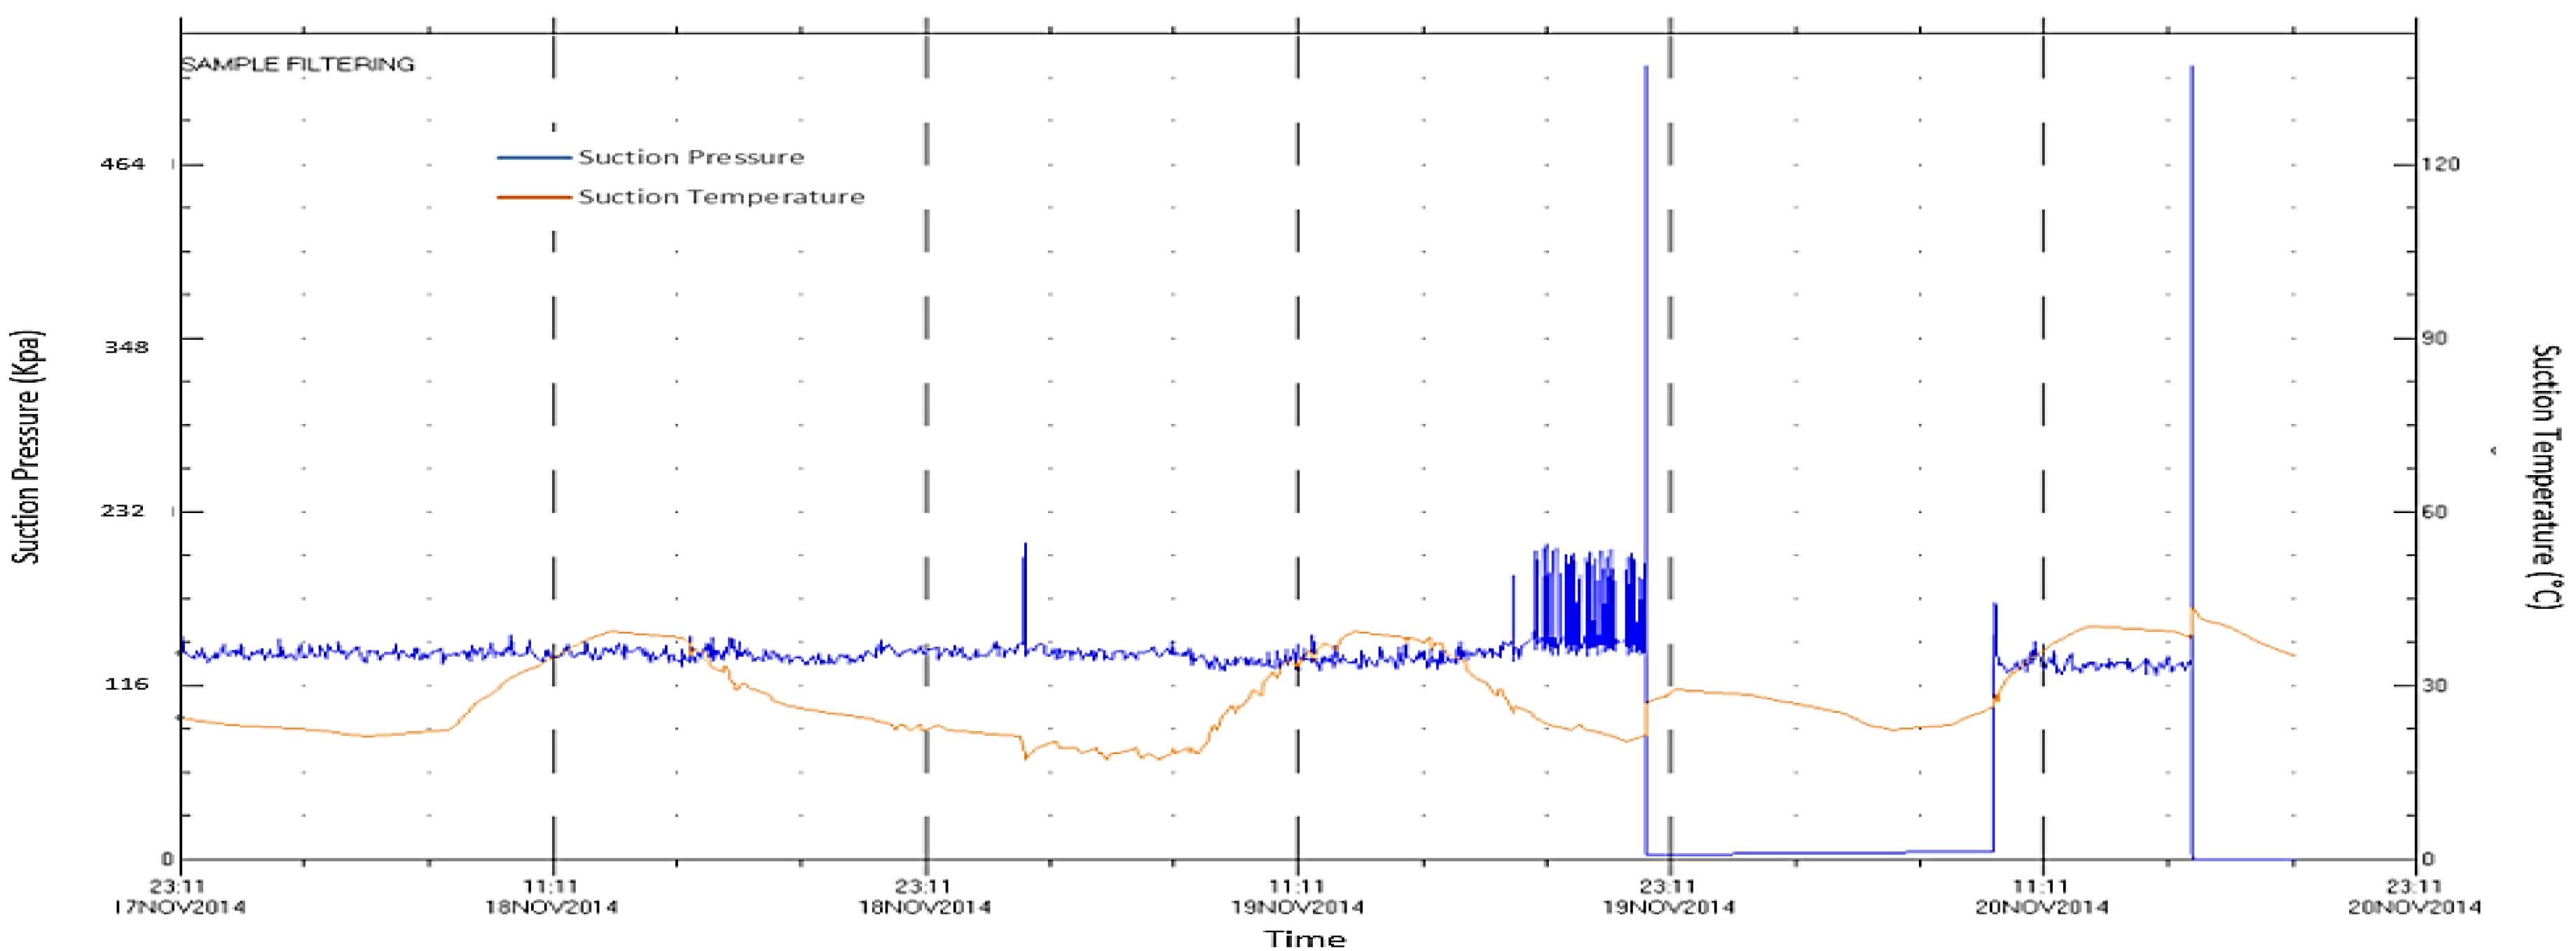
From the performance curve, the compressor operates at a low suction flow and high rotational speed to satisfy the required rise in the polytropic head due to high pressure ratio. When the speed reached a very high value only one percent lower than the maximum speed point, the increase in the polytropic head is compensated by suction flow reduction. The recorded suction temperature before the machine trip was lower than the design temperature by about 10 °C. Besides, the suction pressuretrend in
Figure 16 demonstrates a slight fluctuation in the absolute suction pressure ranging between 2.28 and 2.40 bara. This value is still close to the design operating value of 2.41 bara. The low suction temperature raises the suction flow density, leading to a higher pressure ratio. On the other hand, the low inlet pressure reduces the gas density, pushing it to a lower pressure ratio. However, the impact of low suction temperature was more significant than the low inlet pressure, yielding a slight rise in the pressure ratio but still lower than the detected value.
Figure 15.
Recorded rotational speed and suction flow in the gas plant.
Figure 15.
Recorded rotational speed and suction flow in the gas plant.
Figure 16.
Recorded suction pressure and temperature.
Figure 16.
Recorded suction pressure and temperature.
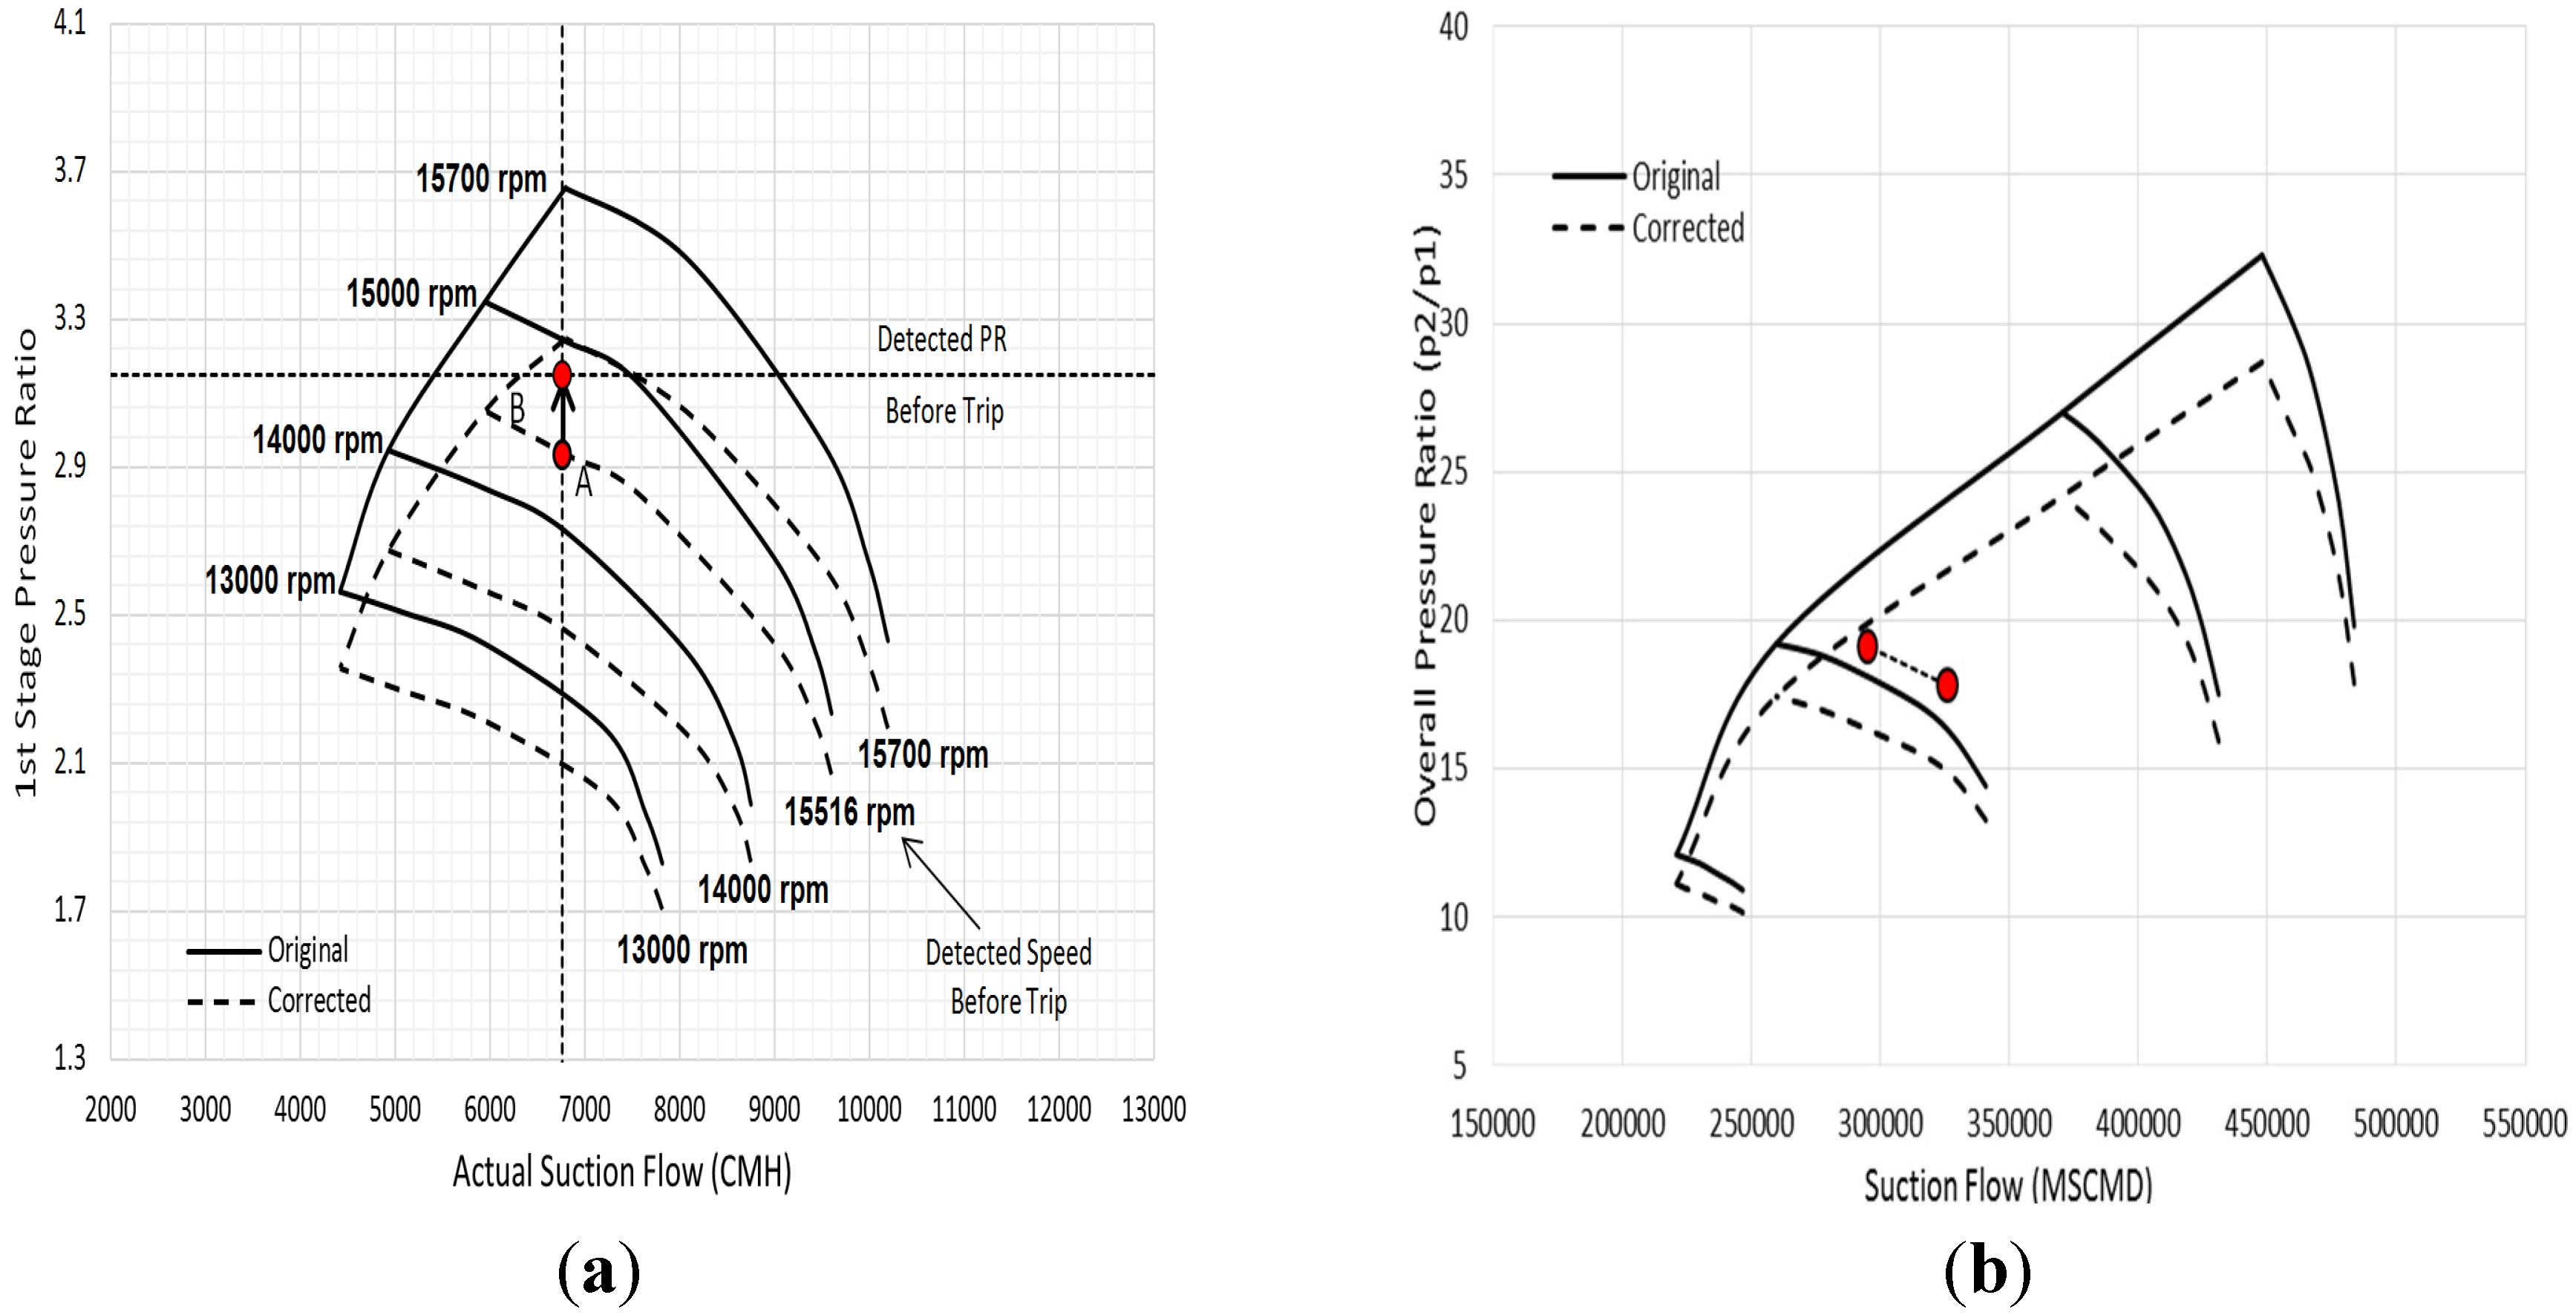
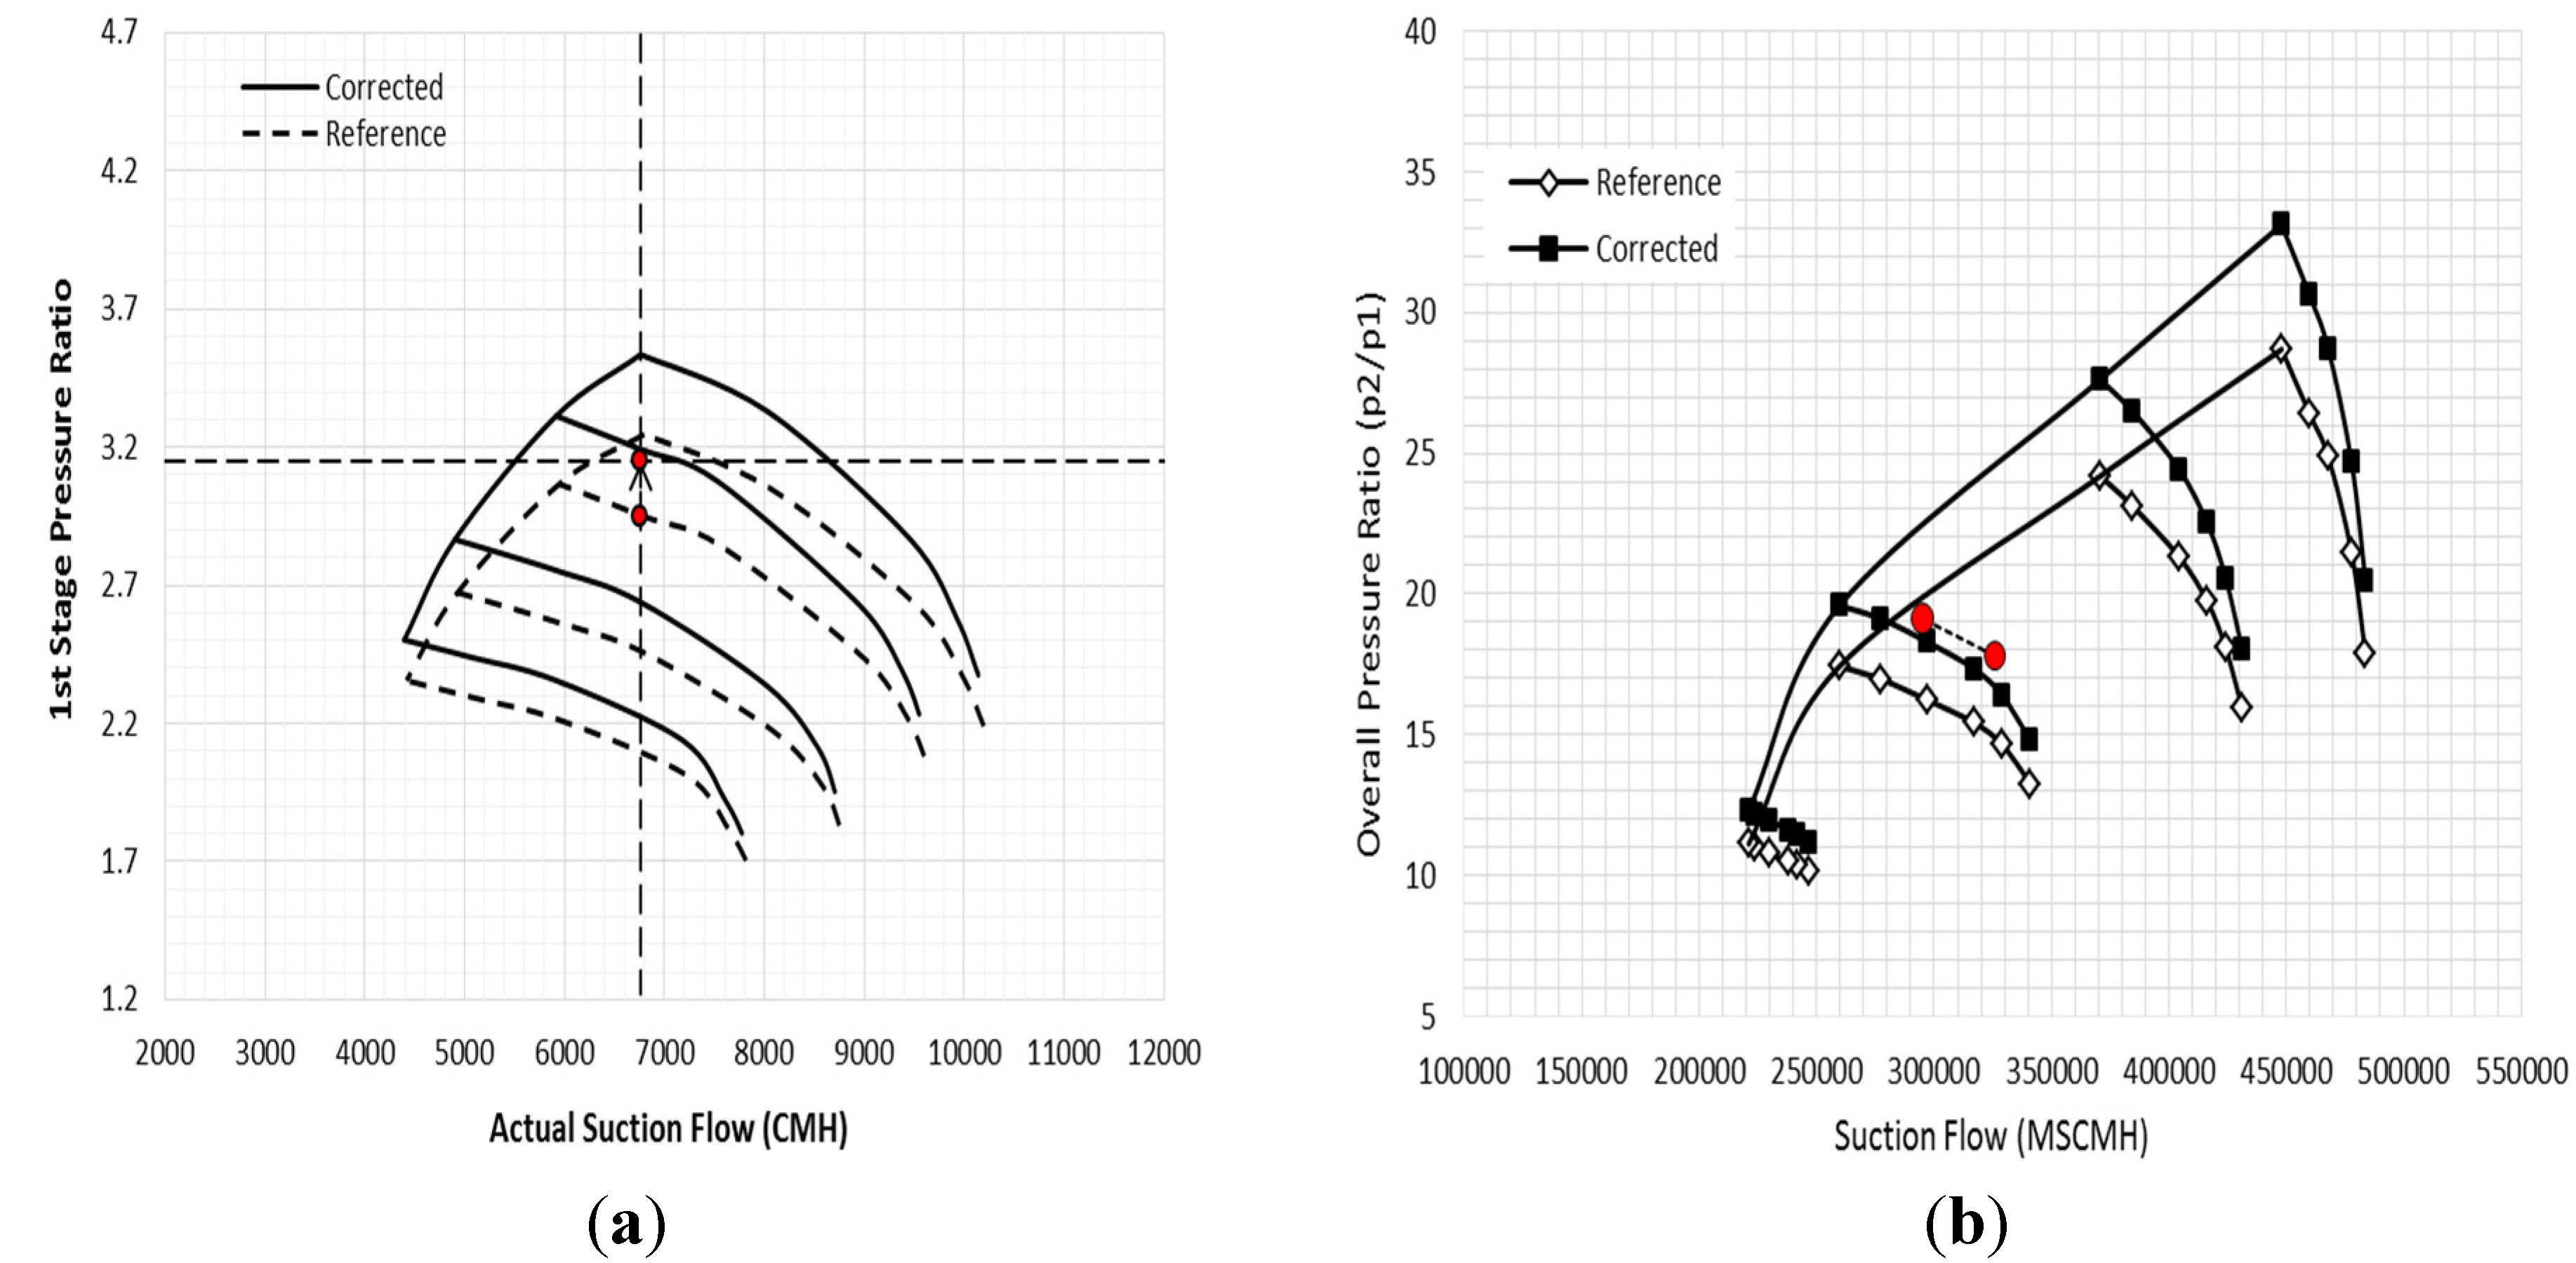
Considering the gas properties, the design compressor map has been corrected based on the recorded gas properties one year before the trip date, as indicated in
Figure 10. It is clear that the running envelope (
Figure 18a) shifts down towards a lower pressure ratio. This makes the deviation between the predicted pressure ratio and the actual value greater. Point (A) in this figure indicates the normal operating pressure ratio at the same detected speed and suction flow just before the machine failure while point (B) denotes the actual measured pressure ratio value in the field. The pressure rise from point A to B causes the surge margin to drop substantially from 12.04% to 2.45%. Any further increase in the pressure ratio will cause the compressor to run into the recycling mode, which is what happened in the previous shutdown, as indicated in region (A) in
Figure 15.
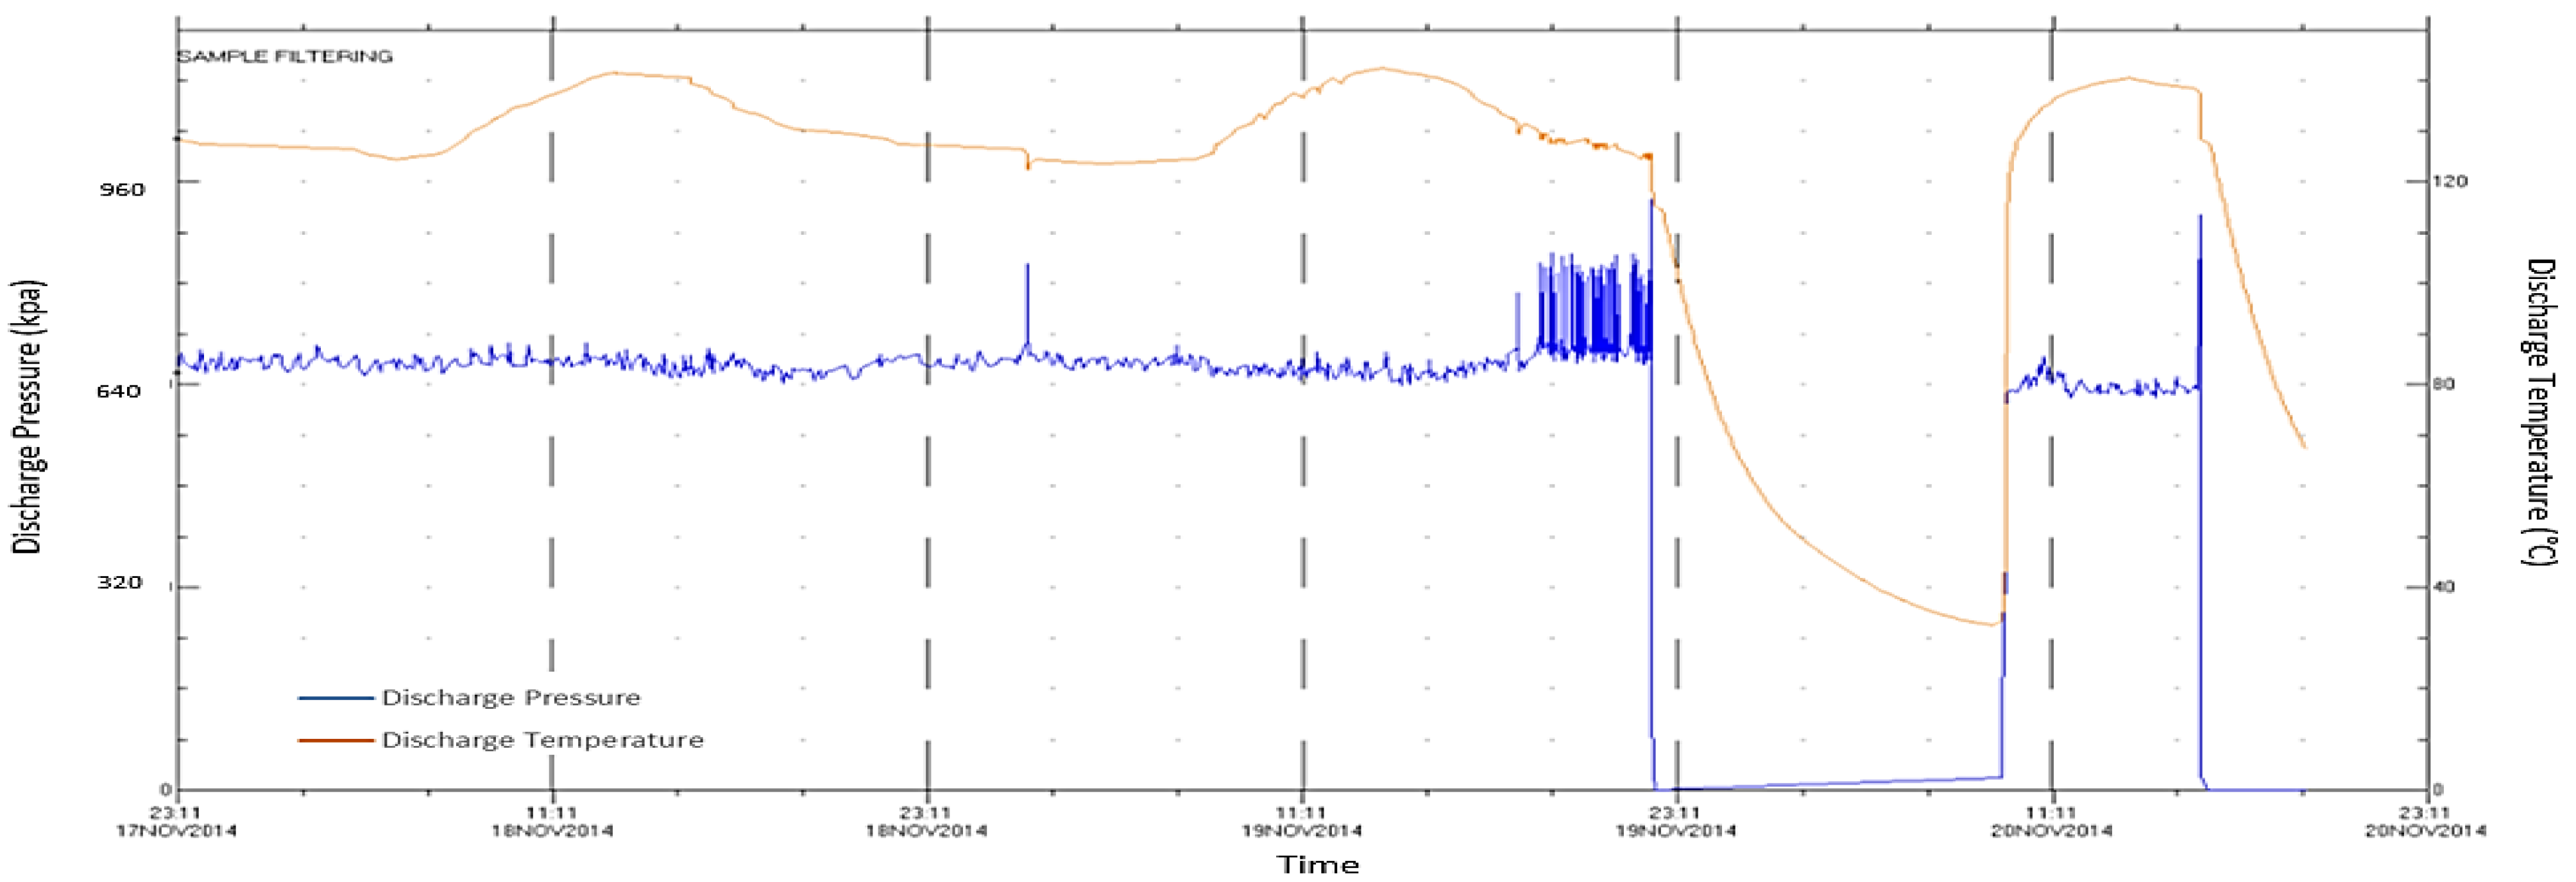
Figure 17.
Recorded discharge pressure and temperature.
Figure 17.
Recorded discharge pressure and temperature.
The change in the overall pressure ratio of the entire compression system is illustrated in
Figure 18b. The predicted surge margin of the new point is approximately 11.77% and 1.75% based on the design surge line and the corrected one, respectively. However, the measured surge margin in the field just before the trip was around 10%, which lies between these two values. Considering the high generated level of vibration, it indicates that the operating point is very close to the unstable region and supports the determined surge margin value in this study. Furthermore, the predicted surge margin reveals the fact that the machine was running into stall condition for longer than 3 h, which affects the compressor stability and the internal component lives.
Figure 18.
Prediction of actual and normal operating points at reference conditions of: (a) First process stage; (b) Overall compression system.
Figure 18.
Prediction of actual and normal operating points at reference conditions of: (a) First process stage; (b) Overall compression system.
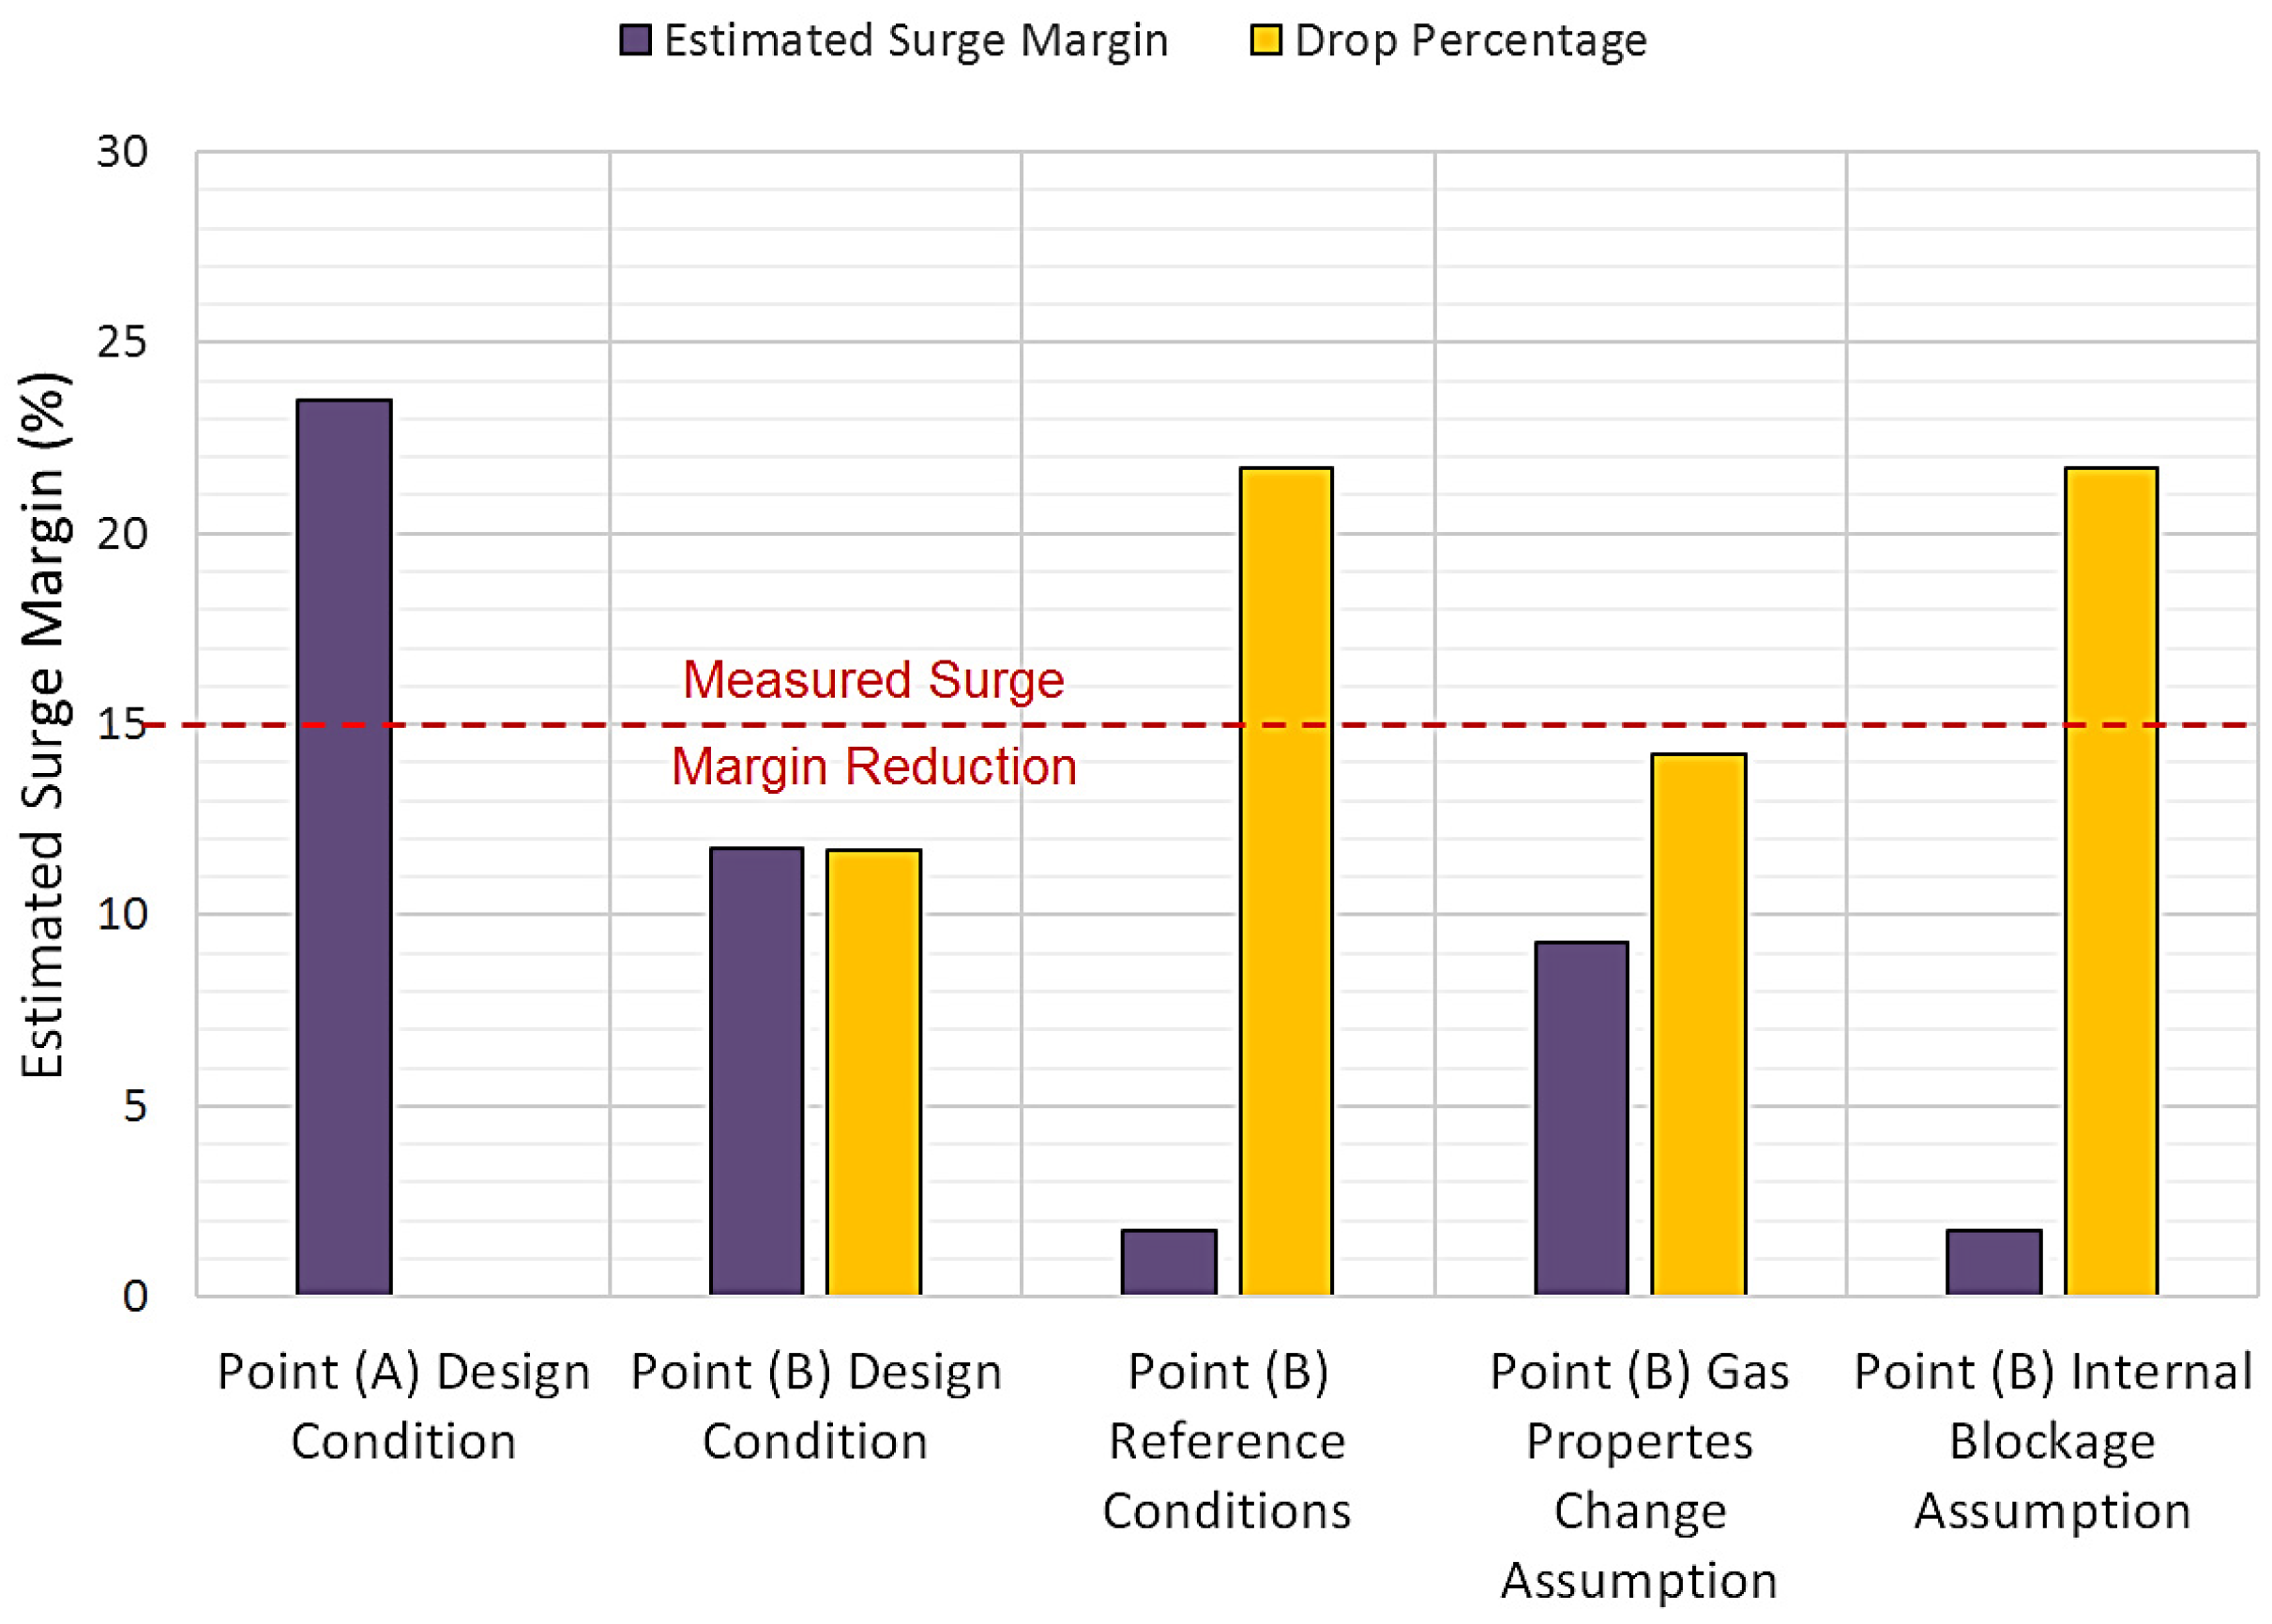
For more precise results, the surge margin reduction is compared with the measured value. The estimated drop was about 11.7% and 21.7% with respect to the design and corrected maps, respectively, compared with the measured value of around 15%. The actual value clearly falls between the predicted range, which obviously indicates a change in the compressor performance curve due to either a sudden change in the gas properties or a flow blockage in the downstream system.
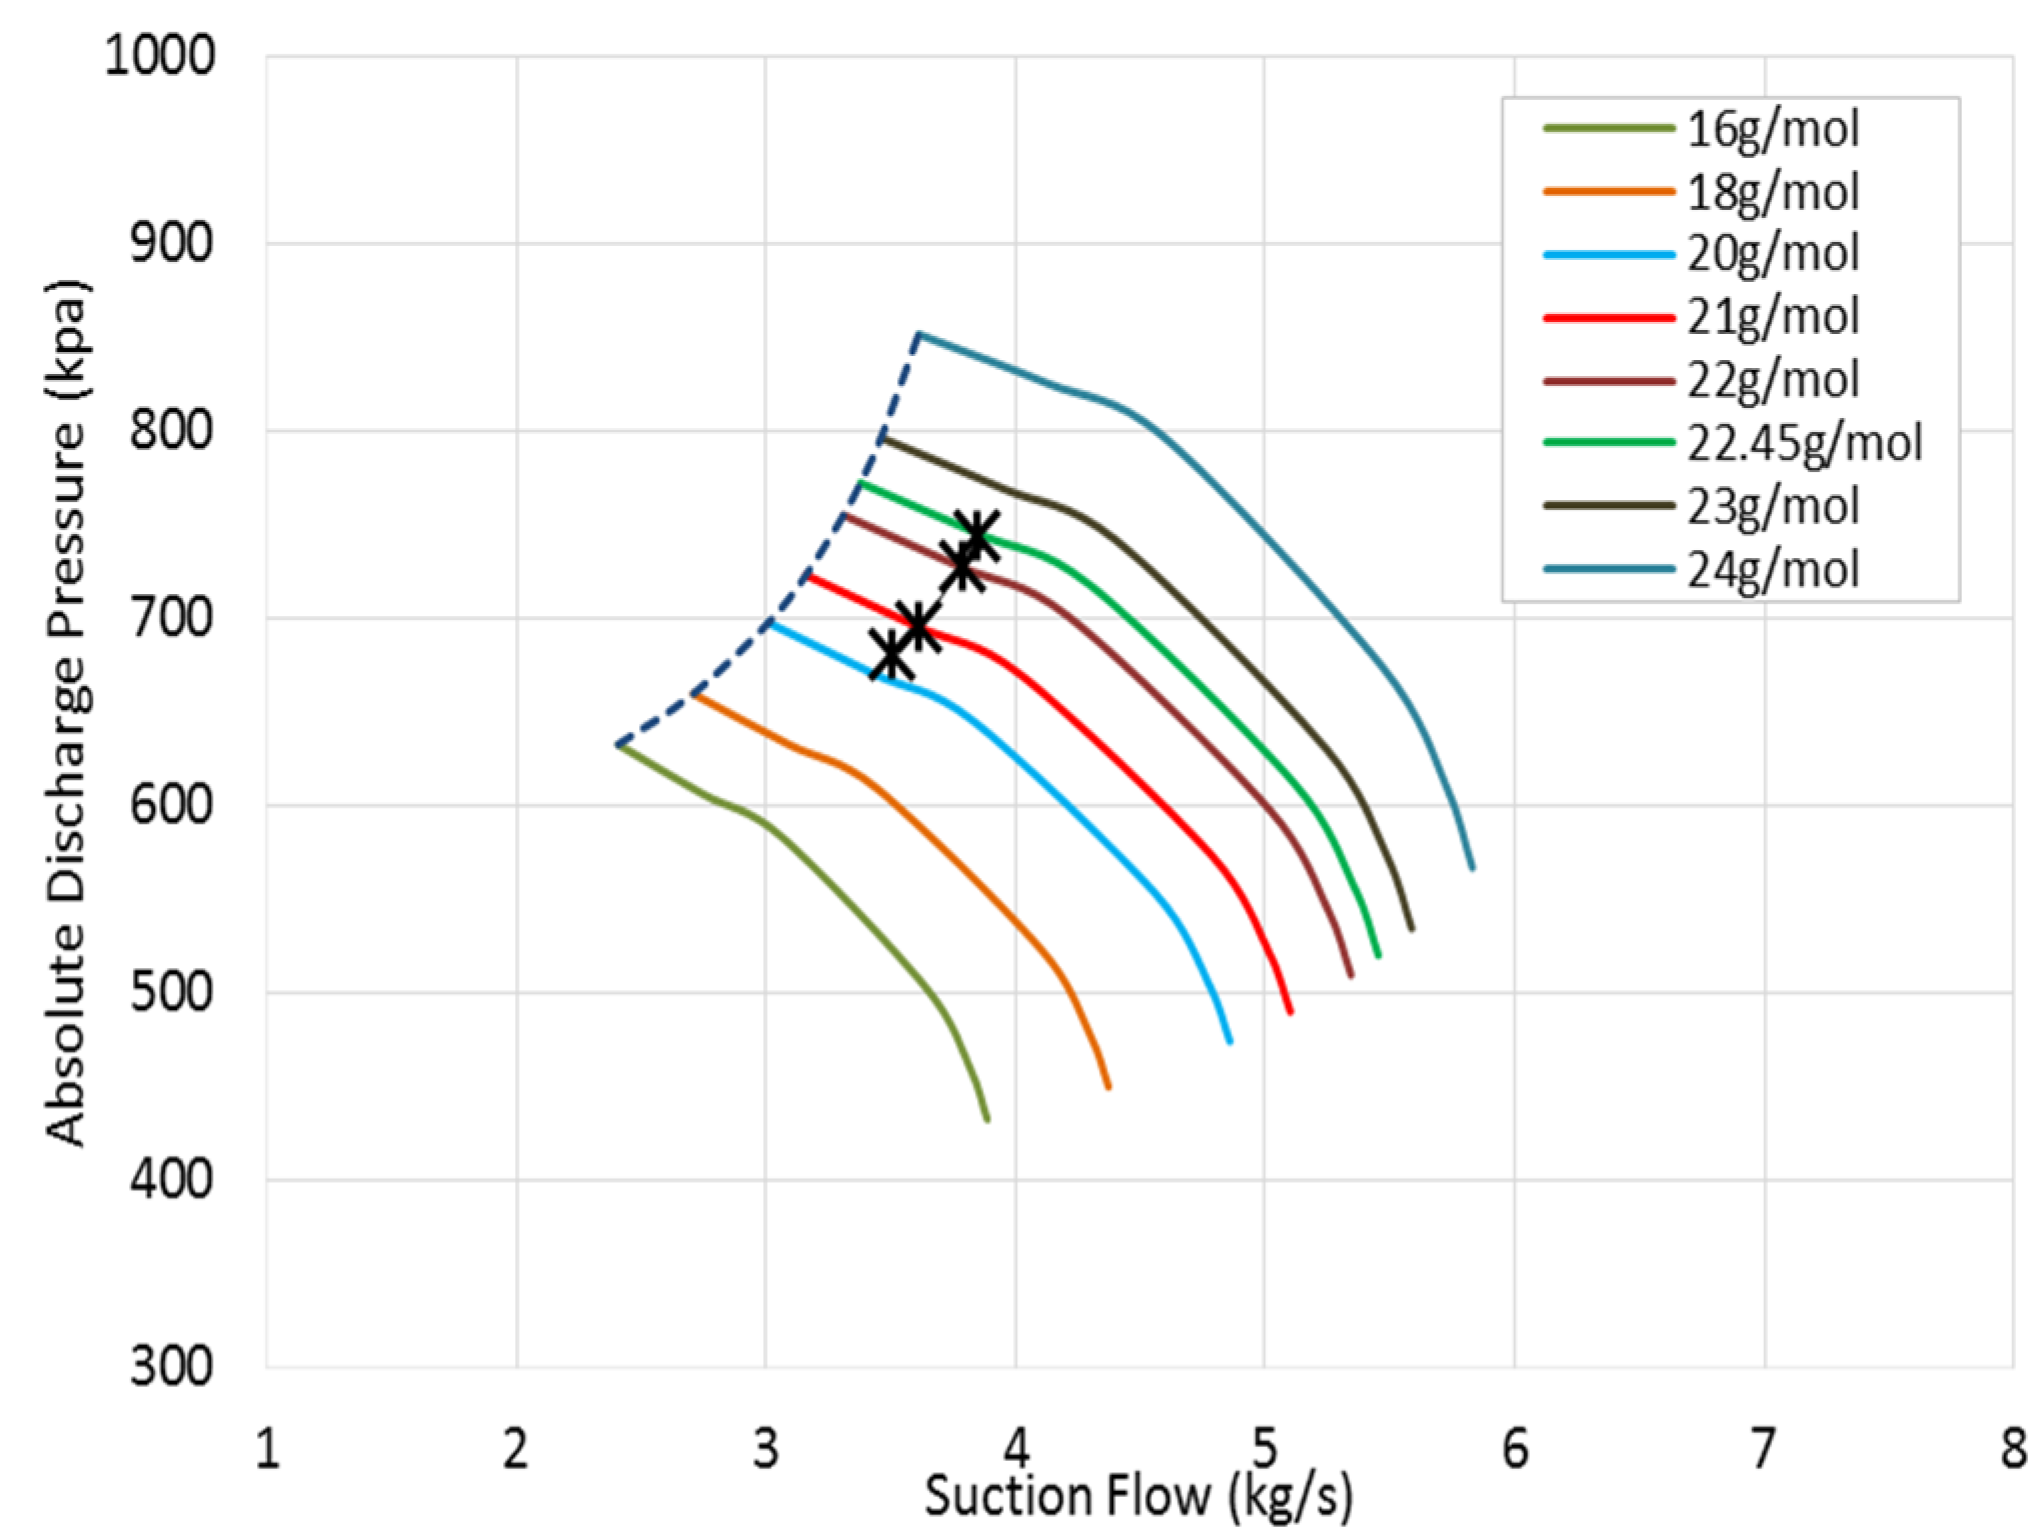
Based on the unanticipated gas properties’ change assumption,
Figure 19 illustrates the effect of the molecular weight variation on the discharge pressure at the detected speed line. It is shown that an increase in the molar mass of around 1.57 g/mol over the design value can generate the same recorded discharge pressure before the machine shutdown.
Figure 19.
Prediction of gas molecular weight to match the detected discharge pressure at measured speed.
Figure 19.
Prediction of gas molecular weight to match the detected discharge pressure at measured speed.
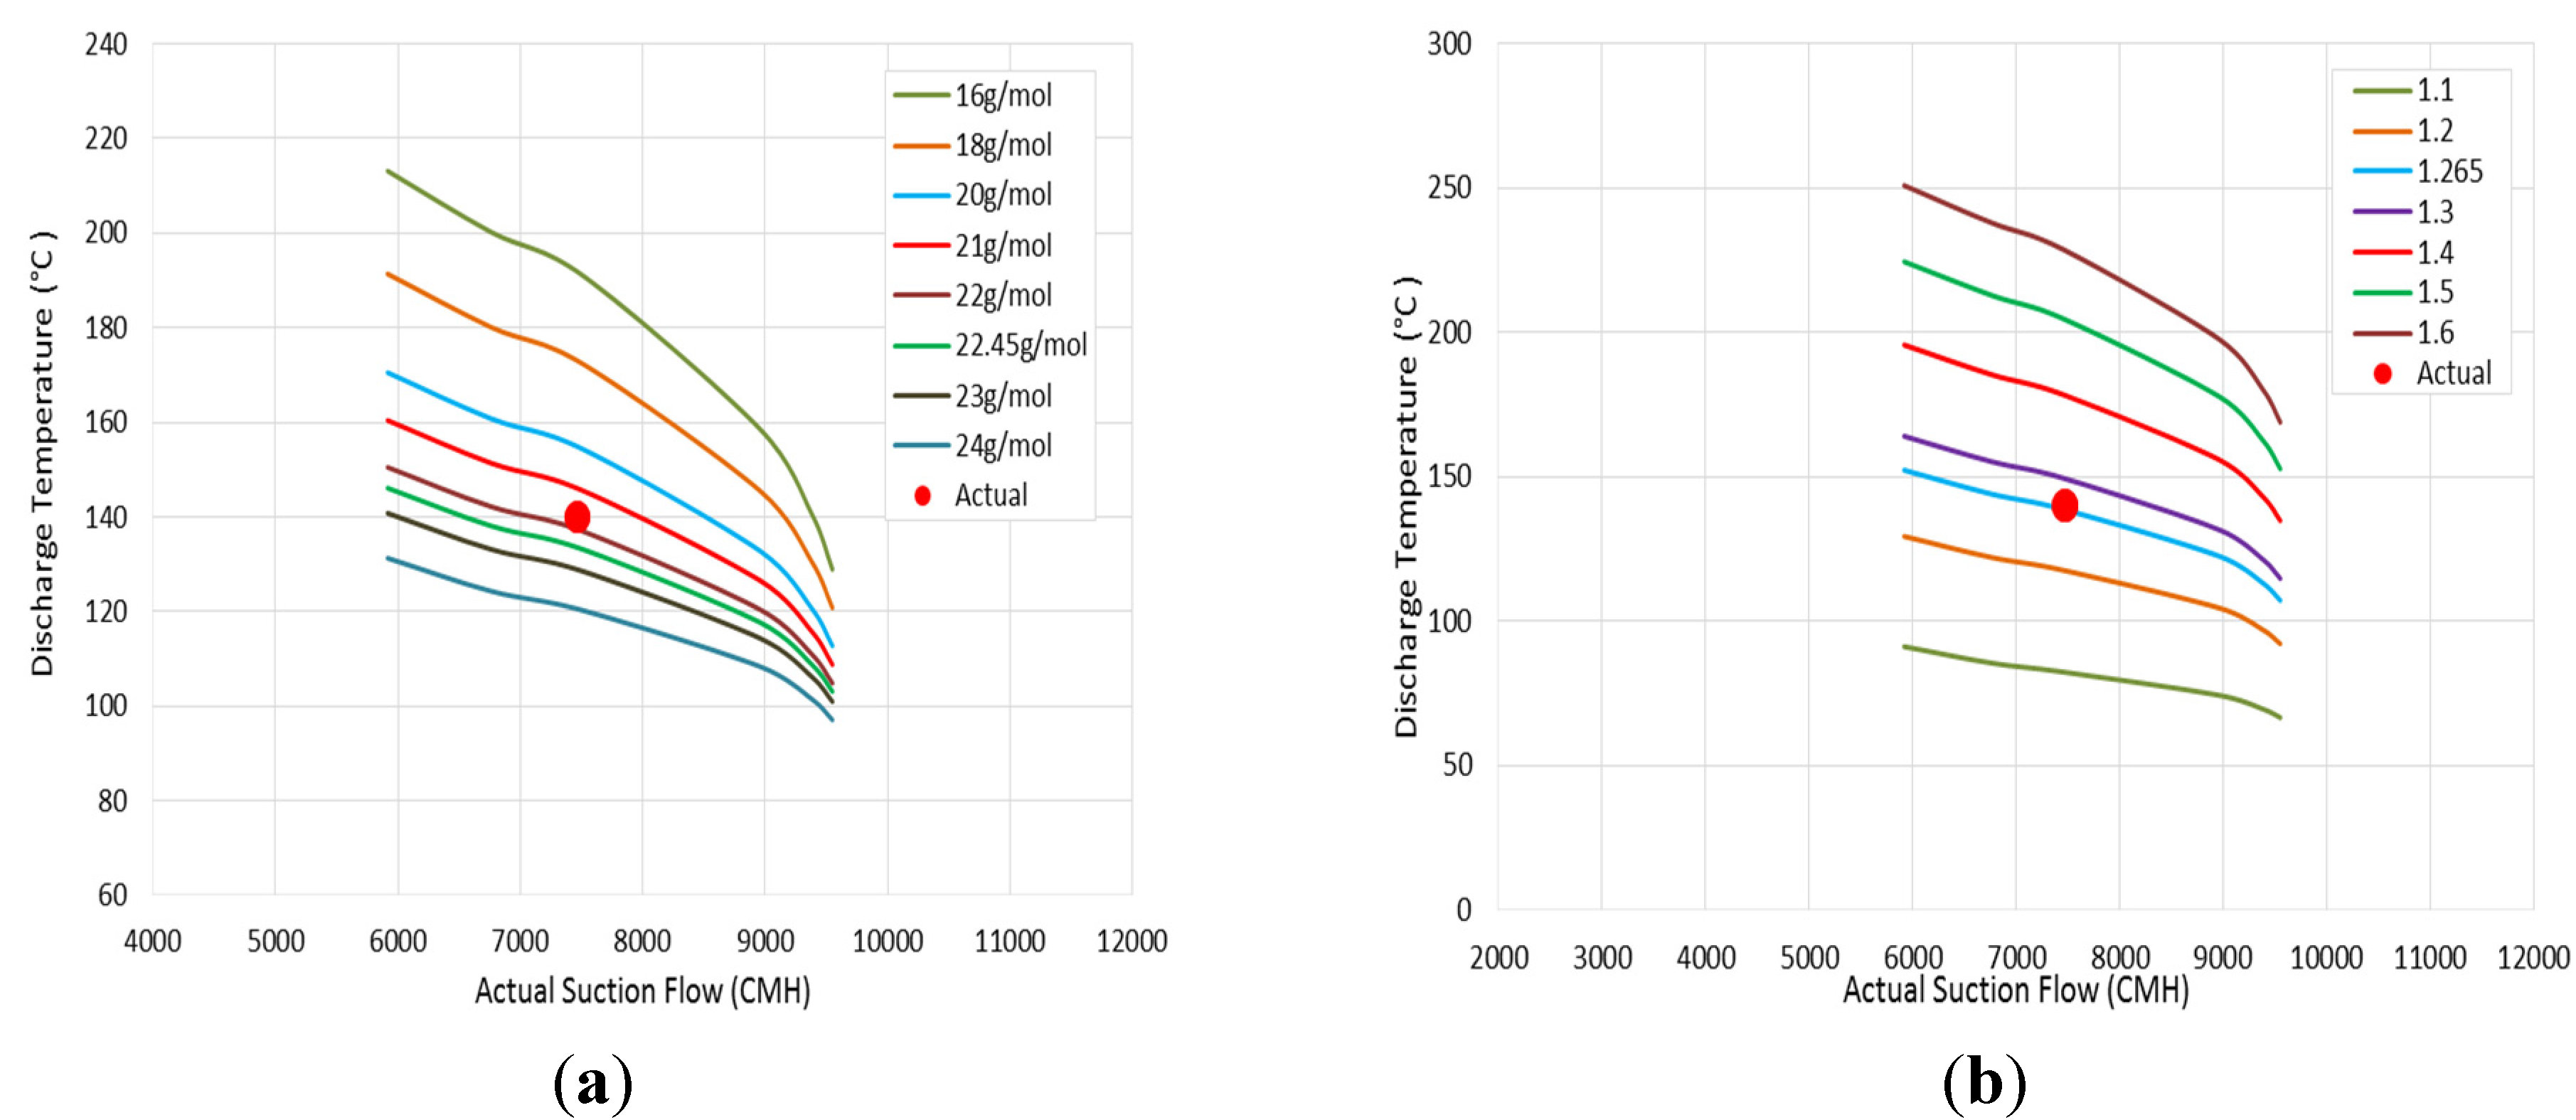
In order to assess this hypothesis, the predicted discharge temperature at 22.45 g/mol is compared to the measured value, as shown in
Figure 20a. It was found that the estimated discharge temperature corresponding to this specific gravity value was lower than the actual temperature by approximately 7 °C. This difference, which is still acceptable and is lower than ±5%, might be caused by the estimation error or the increase in the specific heats ratio, as illustrated in
Figure 20b.
Figure 20.
Comparison between estimated and measured discharge temperature at: (a) Variable molecular weight; (b) 22.45 g/mol.
Figure 20.
Comparison between estimated and measured discharge temperature at: (a) Variable molecular weight; (b) 22.45 g/mol.
The conducted analysis revealed that a specific heats ratio of about 1.265 can generate roughly the same detected discharge temperature, with a rise of about 1.56% over the initial
k-value. Although this specific heats ratio is relatively high, it is still within the expected range for this molecular weight. To validate the predicted change in the suction gas properties, the change in the surge margin has to be considered.
Figure 21 compares the operating envelopes of the first process stage at reference and predicted gas properties, where the reference map represents the performance at the measured conditions in
Figure 8.
Figure 22 demonstrates an estimated surge margin of approximately 9.29% at the determined gas properties. It is interesting to observe that the estimated value is very close to the measured one with less than 1% difference. This clearly supports the first hypothesis regarding the unanticipated change in the properties of the process gas.
Figure 21.
Prediction of performance map based on estimated gas properties (22.45 g/mol and k = 1.265) of: (a) First stage performance; (b) Overall compression system.
Figure 21.
Prediction of performance map based on estimated gas properties (22.45 g/mol and k = 1.265) of: (a) First stage performance; (b) Overall compression system.
Figure 22.
Estimated drop in surge margin at different assumptions.
Figure 22.
Estimated drop in surge margin at different assumptions.
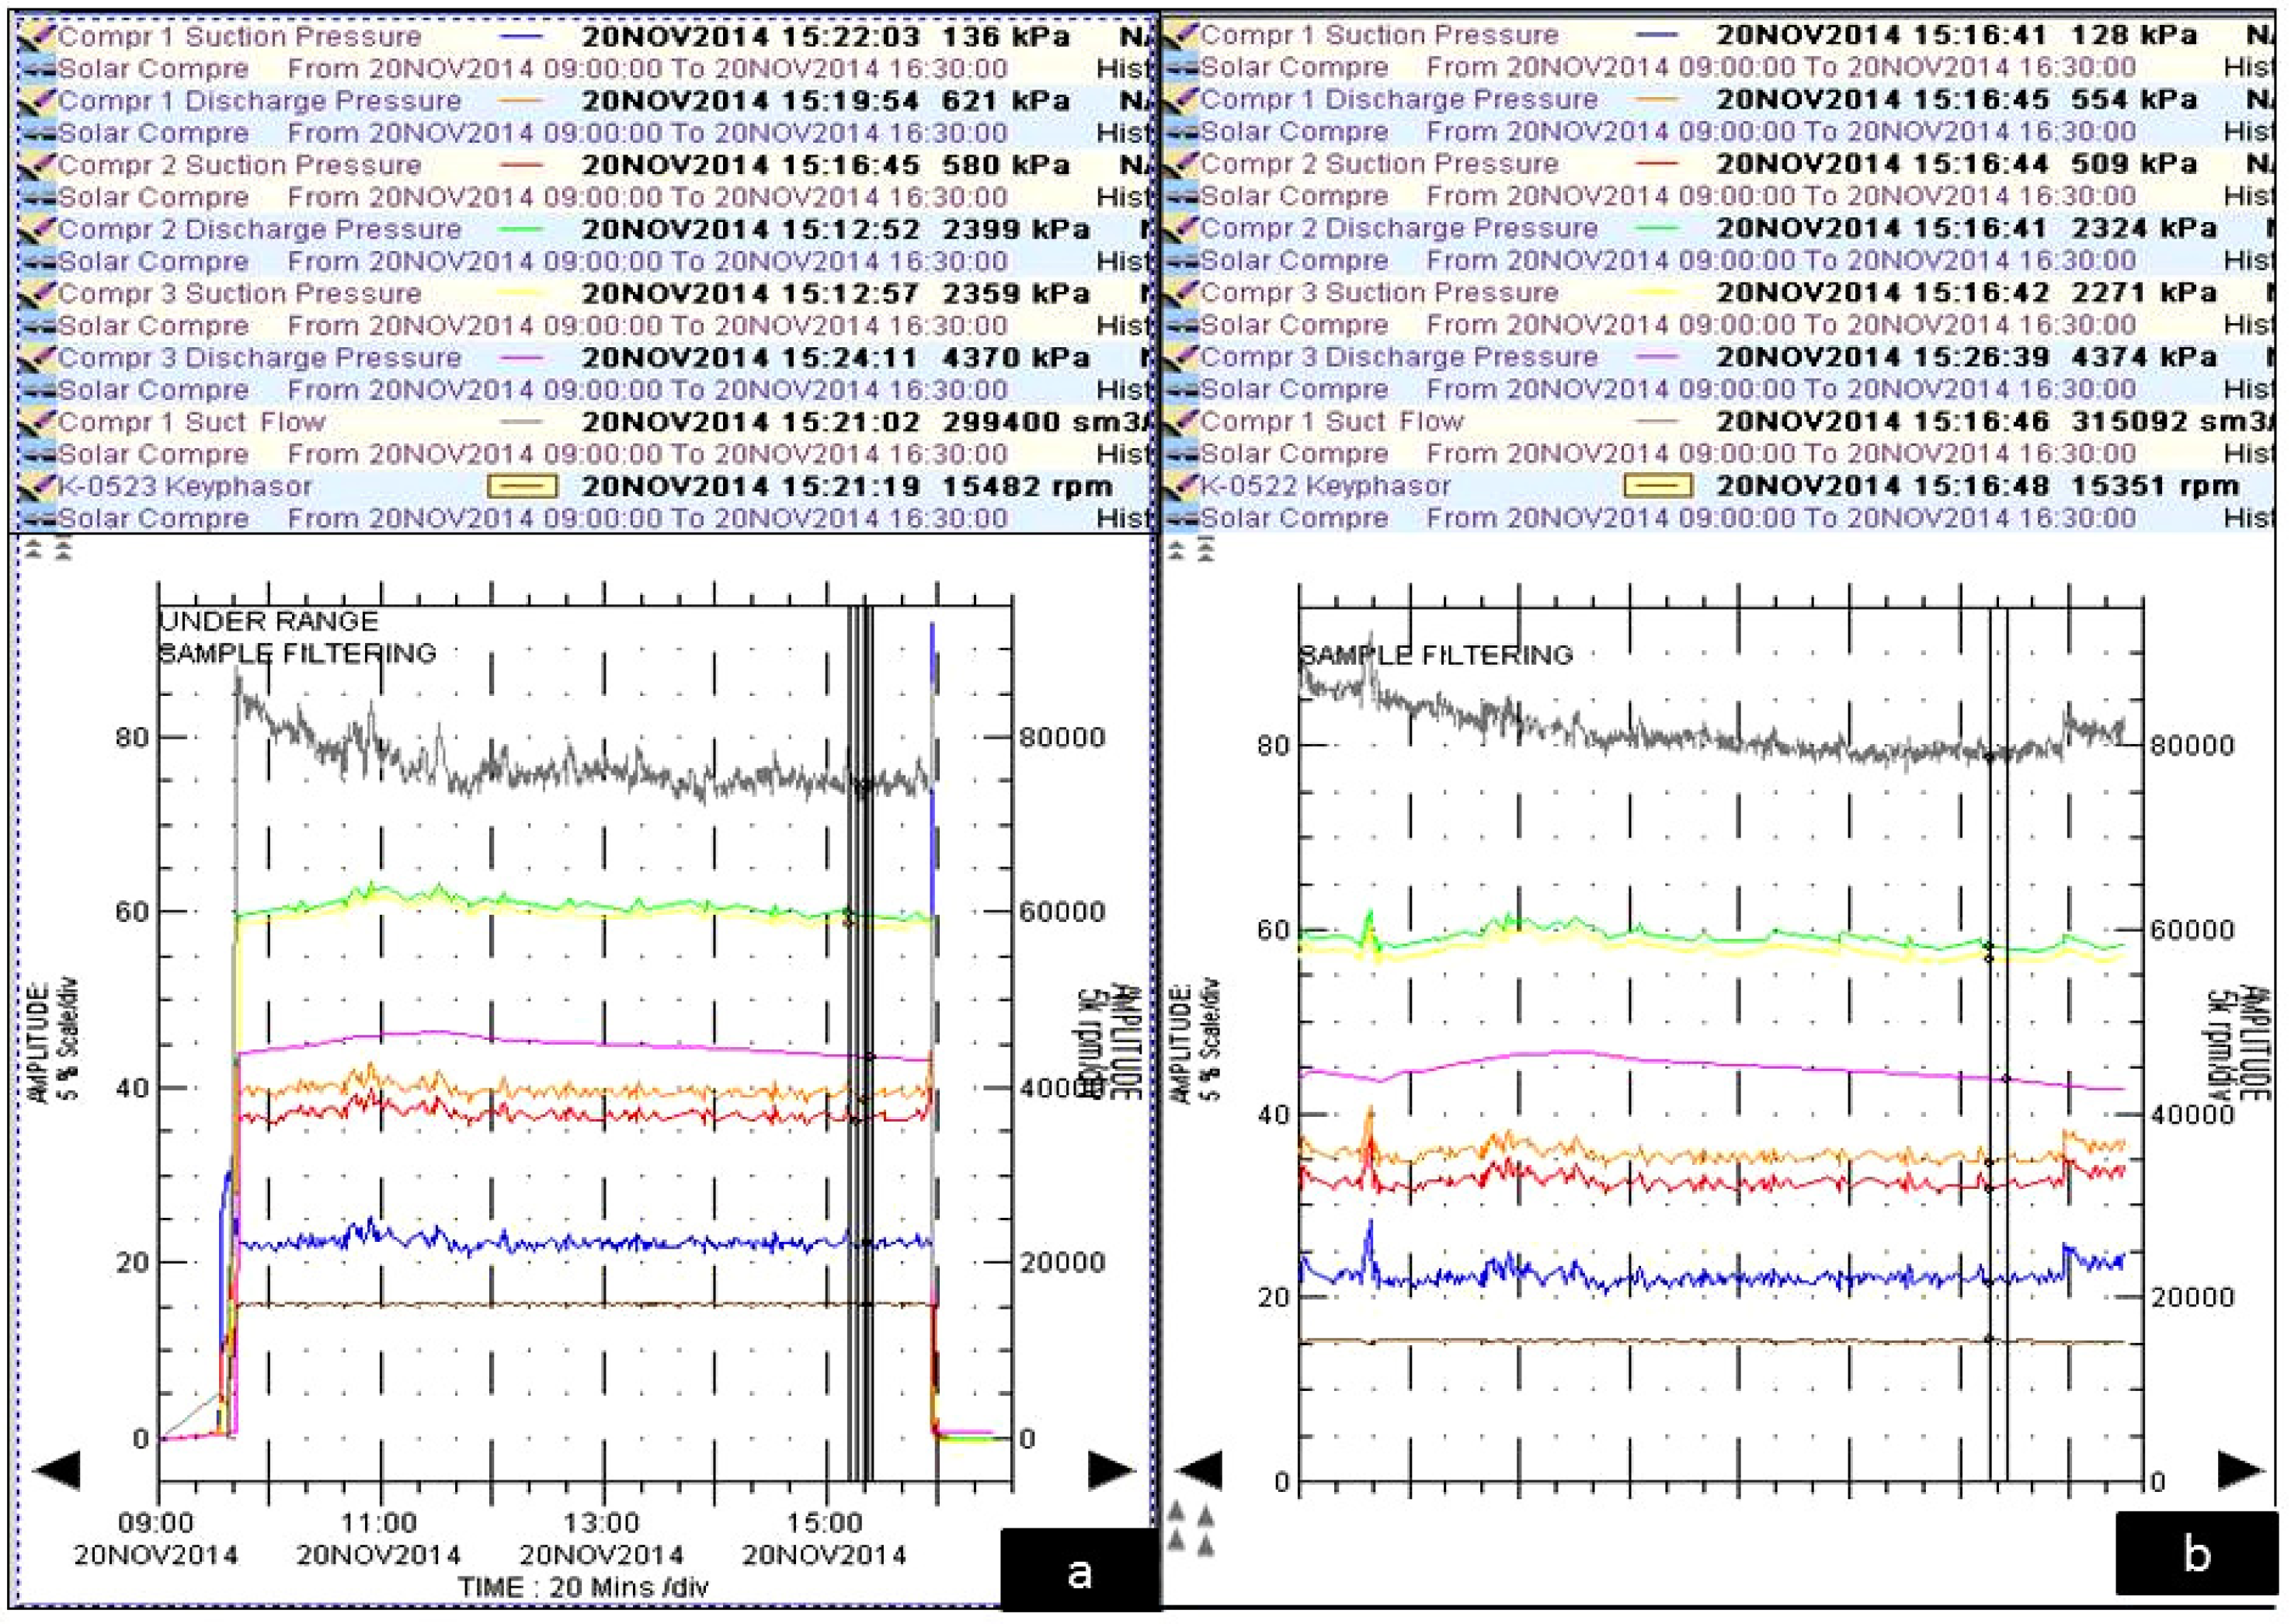
The high pressure at the first stage discharge can also be caused by the internal blockage in the gas bath of the downstream equipment of the first stage including: the aftercooler, scrubber, check valve, and intermediate process stage. One way to assess the possibility of a flow blockage inside the aftercooler, scrubber, and check valve is by monitoring the pressure drop and temperature difference between the IPC inlet and LPC exit gas. Looking to
Figure 23a, the recorded pressure difference between the discharge of the first stage and the suction of the second stage is around 41 kpa, which is very close to the normal value in
Figure 23b.
Figure 23.
Comparison between the recorded suction and discharge performance parameters in the gas station at (a) actual operation before the compressor failure and (b) normal operation.
Figure 23.
Comparison between the recorded suction and discharge performance parameters in the gas station at (a) actual operation before the compressor failure and (b) normal operation.
So, there is no indication for fouling across the second stage scrubber and the check valve. Considering the temperature change, the inlet temperature of the intermediate stage agrees with the measured value at normal operation conditions. Besides, the pressure rise across the intermediate pressure compressor is relatively normal, so there is no sign of blockage inside the second stage. Furthermore, the pressure and temperature difference between the first stage exit and the second stage inlet does not give any sign of a fouled first stage aftercooler.
In brief and by reviewing the operational data, it was found that the instable operation of the compression system was due to the sudden change in the gas properties. The predicted discharge parameters and the reduction in the surge margin matched the measured values. The compression system was operating very close to the surge line with a surge margin of only 9.2%, which is enough to run the compressor into the recycling mode. However, the first process stage was running in the stall condition for the last three hours with only 1.75% surge margin, yielding unstable flow behavior and a high level of vibration. This conclusion has been verified by conducting an internal inspection of the inlet guide vanes (IGVs) and the first impeller blades, which do not show any sign of deposit accumulation or corroded surface.
This operating case also elucidates the importance of testing a gas sample frequently and correcting the performance map to avoid any catastrophic damages to the compressor internals. Moreover, since the correct measurement is critical for the map correction accuracy, the uncertainty of the measurement method has to be checked in order to improve the accuracy of gas property measurement. However, when the gas sample is taken at high temperature, some of the heavy gas particles may condense onto the container walls when they cool down; thus it is recommended to heat up the sample before testing. Besides, when the gas sample is taken at the compressor inlet, there is a possibility of the gas stream carrying some liquid. This condensed liquid may remain in the container unless it is heated before testing. For more precise measurement, the gas sample should be taken from both the suction and the discharge stream of the compression system.

