Article

Comparative Study of Surface Temperature Behavior of Commercial Li-Ion Pouch Cells of Different Chemistries and Capacities by Infrared Thermography

1
Mobility, Logistic and Automotive Technology Research Center (MOBI), Department of Electrical Engineering and Energy Technology (ETEC), Vrije Universiteit Brussel, Pleinlaan 2, Brussel 1050, Belgium
2
Department of Industrial Engineering (INDI), Vrije Universiteit Brussel, Nijverheidskaai 170, Anderlecht 1070, Belgium
*
Author to whom correspondence should be addressed.
Energies 2015, 8(8), 8175-8192; https://doi.org/10.3390/en8088175
Submission received: 1 May 2015 / Revised: 20 July 2015 / Accepted: 30 July 2015 / Published: 5 August 2015
(This article belongs to the Special Issue Electrical Power and Energy Systems for Transportation Applications)

Abstract

:
The non-uniform surface temperature distribution of a battery cell results from complex reactions inside the cell and makes efficient thermal management a challenging task. This experimental work attempts to determine the evolution of surface temperature distribution of three pouch type commercial cells: Nickel Manganese Cobalt oxide (NMC)-based 20 Ah cell, Lithium Iron Phosphate (LFP) 14 Ah, and Lithium Titanate Oxide (LTO) 5 Ah battery cell by using contact thermistor and infrared (IR) thermography. High current (up to 100 A) continuous charge/discharge and high current (80 A) micro pulse cycling profile were applied on the cells. It was found that thermistor based temperature profile varied cell to cell, especially the LTO cell. Among the investigated cells, the NMC cell shows highest temperature rise and the LTO cell the lowest rise. IR (Infrared) images revealed the spatial distribution of surface temperature, in particular the location of the hottest region varies depending not only on the geometrical and material properties of the cell, but also the type of loads applied on the cells. Finally, a modeling perspective of the cell temperature non-uniformity is also discussed.

Graphical Abstract

1. Introduction

As an alternative to gasoline fuel, rechargeable energy storage systems (RESS) have garnered the attention of automotive industries since the last decade. A growing number of electric vehicles (EV) and hybrid electric vehicles (HEV) in the present market depicts the rapid growing demand [1,2,3]. Being of superior performance in terms of high power and energy density, EV and HEV manufacturers largely depends on lithium-ion batteries as the rechargeable energy source nowadays. However, automotive application requires batteries with high performance as well as with a high level of safety. For instance, heat generated within the cell is one of the major concerns for safety and performance of the battery cell. Total heat generation within the cell can generally be attributed to the contributions of reversible heat (entropic heat components related to the electrochemical reactions) and irreversible heat (ohmic and polarization resistance heat components). On the one hand, high cell temperature, even locally, can have a detrimental influence on the cell performance. For instance, cycle life of the cell can be heavily influenced leading to accelerated ageing of the cell [4,5]. On the other hand, excessive and uncontrolled heat can lead to thermal runway and ultimately may lead to explosion of the cell [6]. Therefore, monitoring and optimizing the operating temperature of the cell during operation are of crucial importance.
It has been well established that modeling of the thermal behavior of battery cells can play a vital role in cell temperature monitoring and can also provide scopes for the development of battery cells for better thermal management and improved thermal safety of, not only a single battery cell, but also a battery pack consisting several cells [7,8]. In reality, a precise validation process of these thermal models can be complex and extremely difficult. Validation through comparing cell surface temperature obtained from model and physical measurements is, comparatively, a less complex and faster method of model validation [9]. However, due to the complexity of electrochemical reactions (e.g., effect of side reactions) and uneven current density distribution inside the cell, the spatial distribution of cell surface temperature can be non-uniform [10,11,12,13,14,15], in particular, for large format pouch cells for automotive applications. Moreover, the pattern of the heat distribution, e.g., location of maximum and average temperature, can be different depending on the type of applied load profile [15]. This particular behavior of temperature non-uniformity makes the thermal management of a battery pack more challenging in order to maintain a uniform temperature inside the battery pack during operation. Improvements have to be made in battery cells design, and the location oriented active/passive cooling system of battery pack has to be incorporated to overcome this challenge [16,17,18].
Now, among the different methods of measuring cell surface temperature, the single point (minute area) measurement (e.g., contact thermocouple, thermistor, etc.) is not adequate to measure the spatially non-uniform temperature distribution. In this case, thermal infrared (IR) imaging is a potential tool that can be used to observe and measure this spatially non-uniform temperature distribution with reasonable high accuracy. Additionally, battery cell surface temperature distribution information obtained as such can be used for monitoring surface temperature locations of interest (maximum and/or average temperature) through single point measurements for a large number of cells during performance-characterization testing. Despite the high importance of non-uniform battery cell surface temperature measurement, to the authors’ knowledge, very few works have been published dedicated to this topic using IR thermography [12,14,19]. Veth et al. have analyzed surface temperature evolution through IR thermography in their work [14]. However, the work was performed on an NMC cell only and the thermal behavior was studied only under a continuous charge and discharge load profile.
In this experimental work, non-uniform surface temperature evolution of three commercial pouch cells, of different chemistries and capacities, were studied through both infrared thermography and contact thermistor measurements. Continuous charge and discharge current, ranging from 10 A up to 100 A, and pulse current up to 80 A, were applied to determine the evolution of surface temperature distribution.

2. Experimental Procedures

The chemistries of three lithium-ion commercial pouch type battery cells that were used are: Lithium Nickel Manganese Cobalt oxide (NMC), Lithium Iron Phosphate (LFP), and Lithium Titanate Oxide (LTO). The nominal capacities of these cells are 20 Ah, 14 Ah, and 5 Ah, respectively. Two types of load profiles were applied on the cells. One type consisted of several consecutive continuous complete charge (constant current, CC) and discharge (CC) cycles with currents of 10 A, 20 A, 40 A, 60A, 80 A, up to 100 A. Sufficient rest time (1–3 h depending on the current rate) was incorporated between successive operations (charge/discharge) and cycles in order to allow the cell surface temperature to return to ambient temperature. The complete charge and discharge were performed according to the conditions presented in Table 1. On the other type of load profile, high-current micro-pulse cycling was incorporated. The micro-pulse cycling load profile consisted of ~1000 cycles of charge and discharge current pulses. Each of these cycles sequentially consisted of a charge pulse for 2 s at 80 A, 2 s rest (zero current), a discharge pulse for 2 s at 80 A, and 2 s rest. All the tests were performed by using an ACT 0550 (80 channels) battery tester (PEC®, Leuven, Belgium). Surface temperature was logged by using an NTC 5K thermistor (EPCOS®, Munich, Germany) with a measuring range of 0–100 °C and a tolerance of 1%. Simultaneously, IR images were captured by a Ti25 thermal imager (FLUKE®, Everett, WA, USA) at regular time intervals. In order to achieve accurate results from the IR thermography, cells were placed in a semi-closed (to observe behavior at natural heat transfer) and dark environment (to avoid visible light interference). Moreover, the cell surfaces were painted uniformly with a dull black paint in order to minimize the effect of the visible light reflections. The IR camera was calibrated within the range 0–120 °C, with a maximum error of 2% by the manufacturer. The thermal sensitivity, noise-equivalent temperature difference (NETD) was ≤0.09 °C at a 30 °C target temperature (≤90 mK). For the calibration of the experiment, emissivity correction was performed by measuring a known uniform surface temperature painted with the same dull black paint as used on the cell surface. Emissivity was set to ~0.99. A comparative test was carried out to compare the measurement taken by the thermistor and the IR camera during a continuous discharge at 100 A of a NMC cell. The cell surface was divided into 16 equal rectangular portions and two points were selected at two points of intersection of the dividing lines, as shown in Figure 1a,b, which shows the temperature profile of the corresponding two positions on the cell surface. It was found that, throughout the process, the maximum difference between the measurements made by the thermistor and the IR camera was ~1 °C. By means of this comparative test measurement, the accuracy of the IR temperature measurement has been quantified and validated over the complete measurement range.
Table 1. Mechanical and electrical properties of the NMC, LFP and LTO Cells.
PropertiesNMCLFPLTO
Mechanical
BodyLength, mm217216235
Width, mm130130173
Thickness, mm7.17.14
TabLength, mm404040
Width, mm304585
Weight, g428380262
Electrical
Nominal Voltage, V3.653.22.2
Nominal Capacity, Ah20145
End of Charge Voltage, V4.23.652.8
End of Discharge Voltage, V321.5
Ac Impedance (1 KHz), mΩ<3<50.7
Specific energy, Wh/kg17412042
Energy Density, Wh/L37023090
Specific Power (DoD 50%, 10 S), W/kg230025002250
Power Density (DoD 50%, 10 S), W/L460045004400
Maximum Charge Current, A150
Maximum Discharge Current, A100140150
Figure 1. (a) Two locations on the cell surface subjected to measurement comparison; (b) Temperature profile measured by the IR camera and the thermistor at the corresponding locations of the cell surface during a discharge at 100 A of an NMC, 20 Ah cell.
Energies 08 08175 g001

3. Cell Characteristics

Internal resistance values of the three cells have been measured by means of the standardized hybrid pulse power capability (HPPC) test. The pulse currents for this HPPC test were adapted to be the same as the currents used for surface temperature measurements, in particular 20, 40, 60, 80, and 100 A. The pulses were performed at three different SoC levels, namely at an 80%, 50%, and 20% SoC level. Figure 2 shows the internal resistance trend for all three cells.
Figure 2. Internal resistances measured by HPPC test at an 80%, 50% and 20% SoC level with pulse currents of 20, 40, 60, 80, 100 A of (a) NMC discharge pulses; (b) LFP discharge pulses; (c) LTO discharge pulses; (d) LTO charge pulses.
Energies 08 08175 g002
From these graphs, we can see that in the case of discharging, and for all three chemistries, higher internal resistance is observed at a low state of charge of the cell. Further, the lowest internal resistance is observed at a high state of charge, in combination with the higher current values. In the case of the LTO chemistry charging pulses, the lowest internal resistance is found at the mid value of the state of charge.

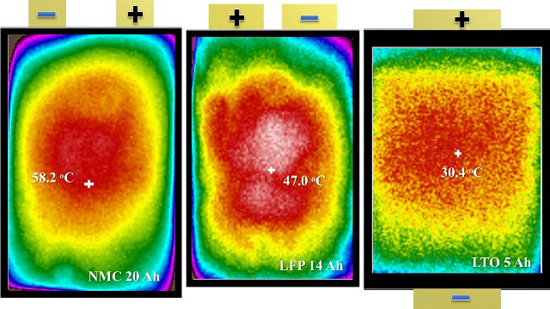
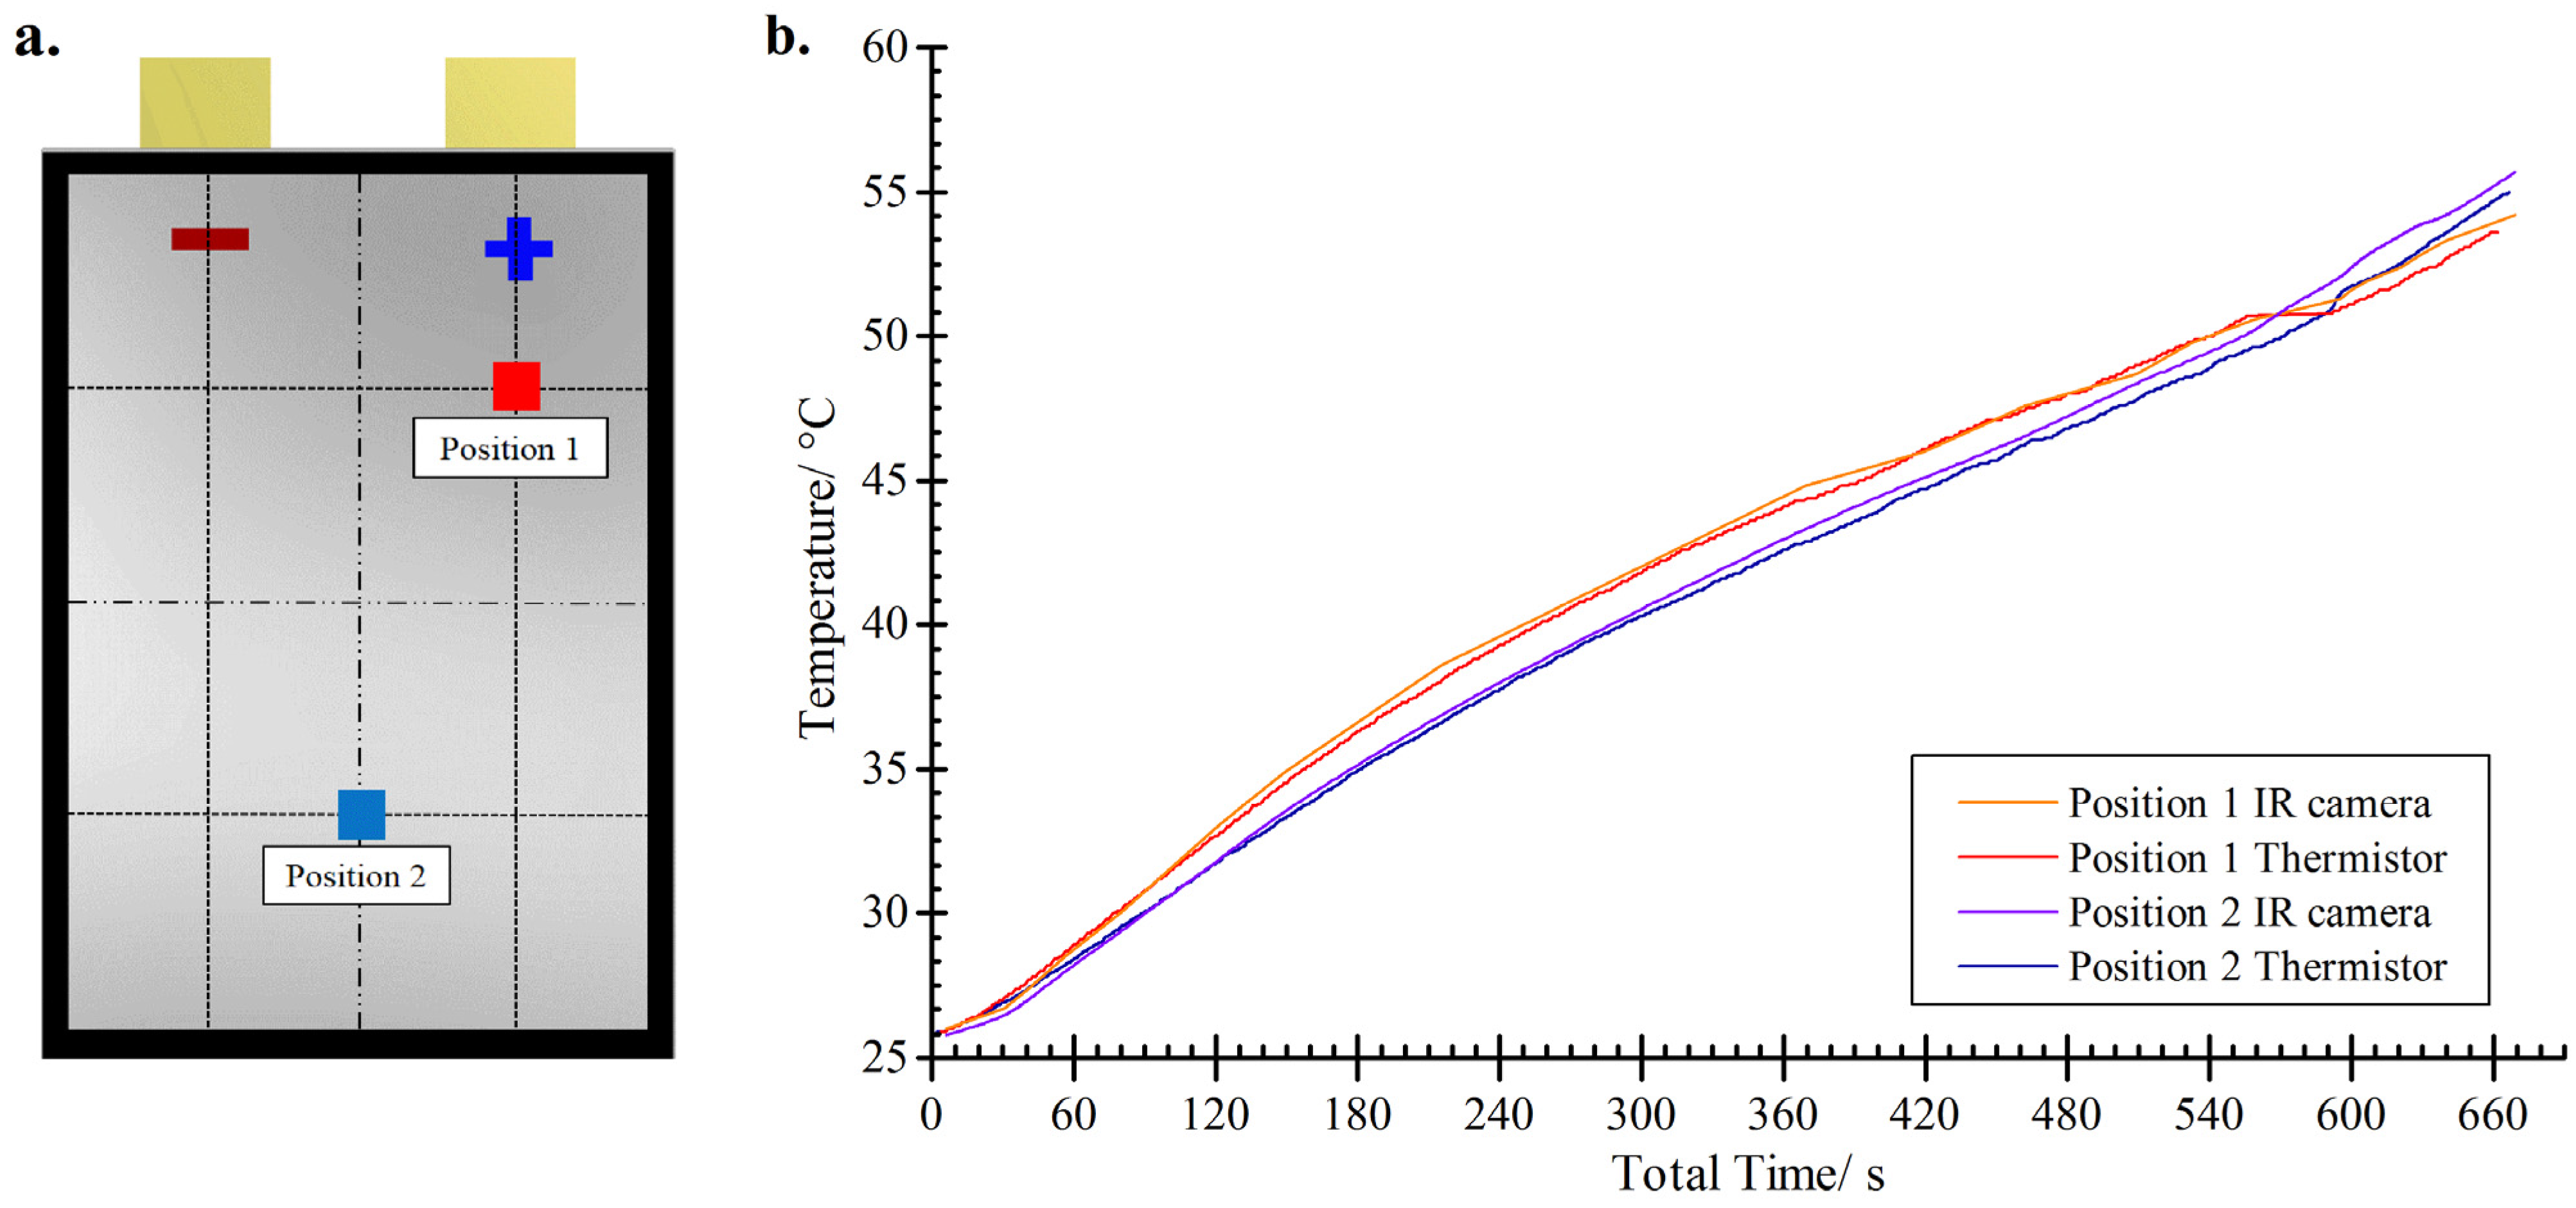
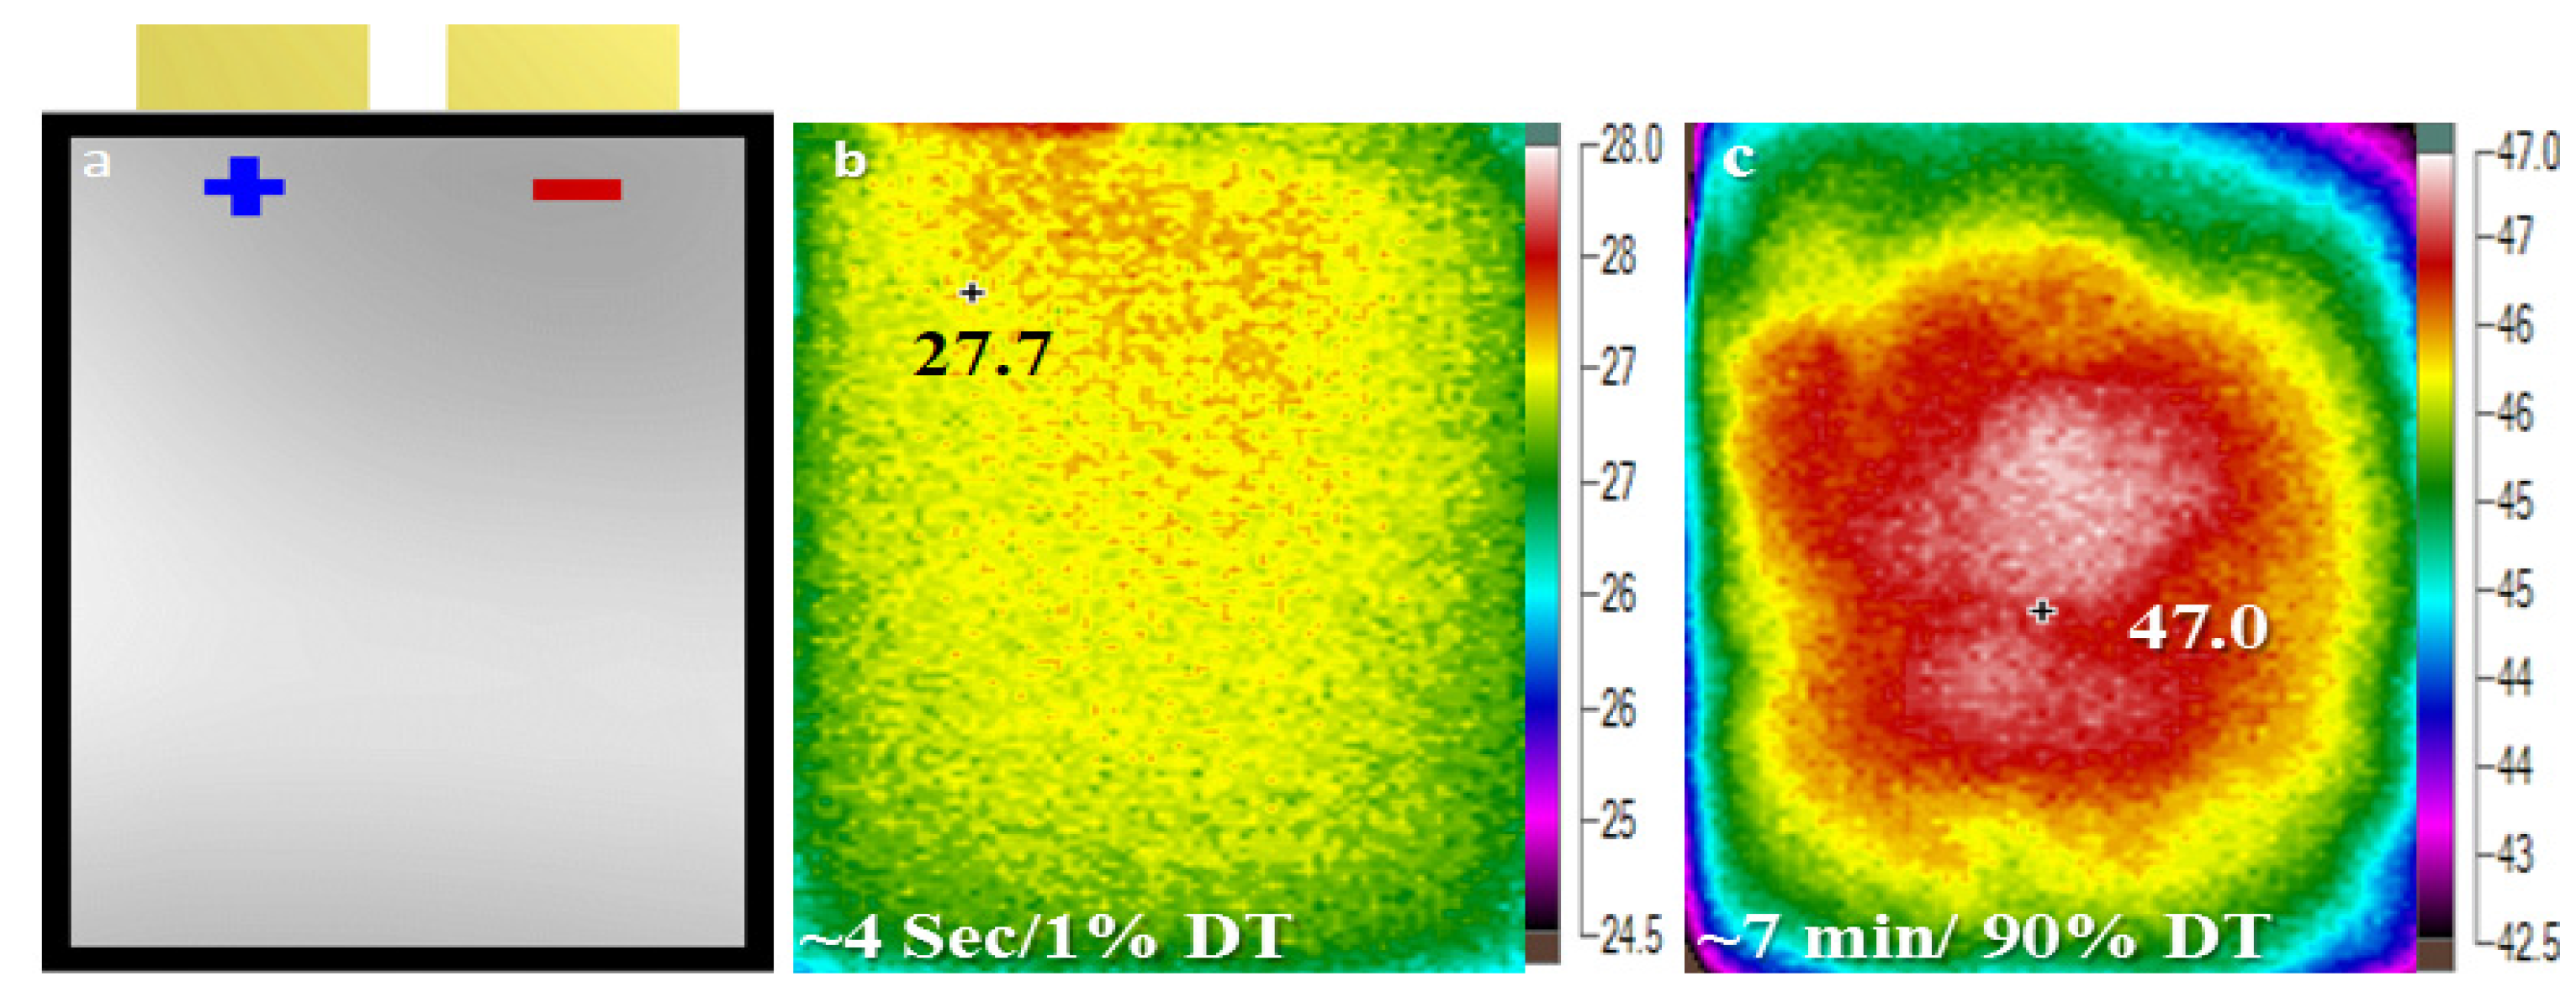
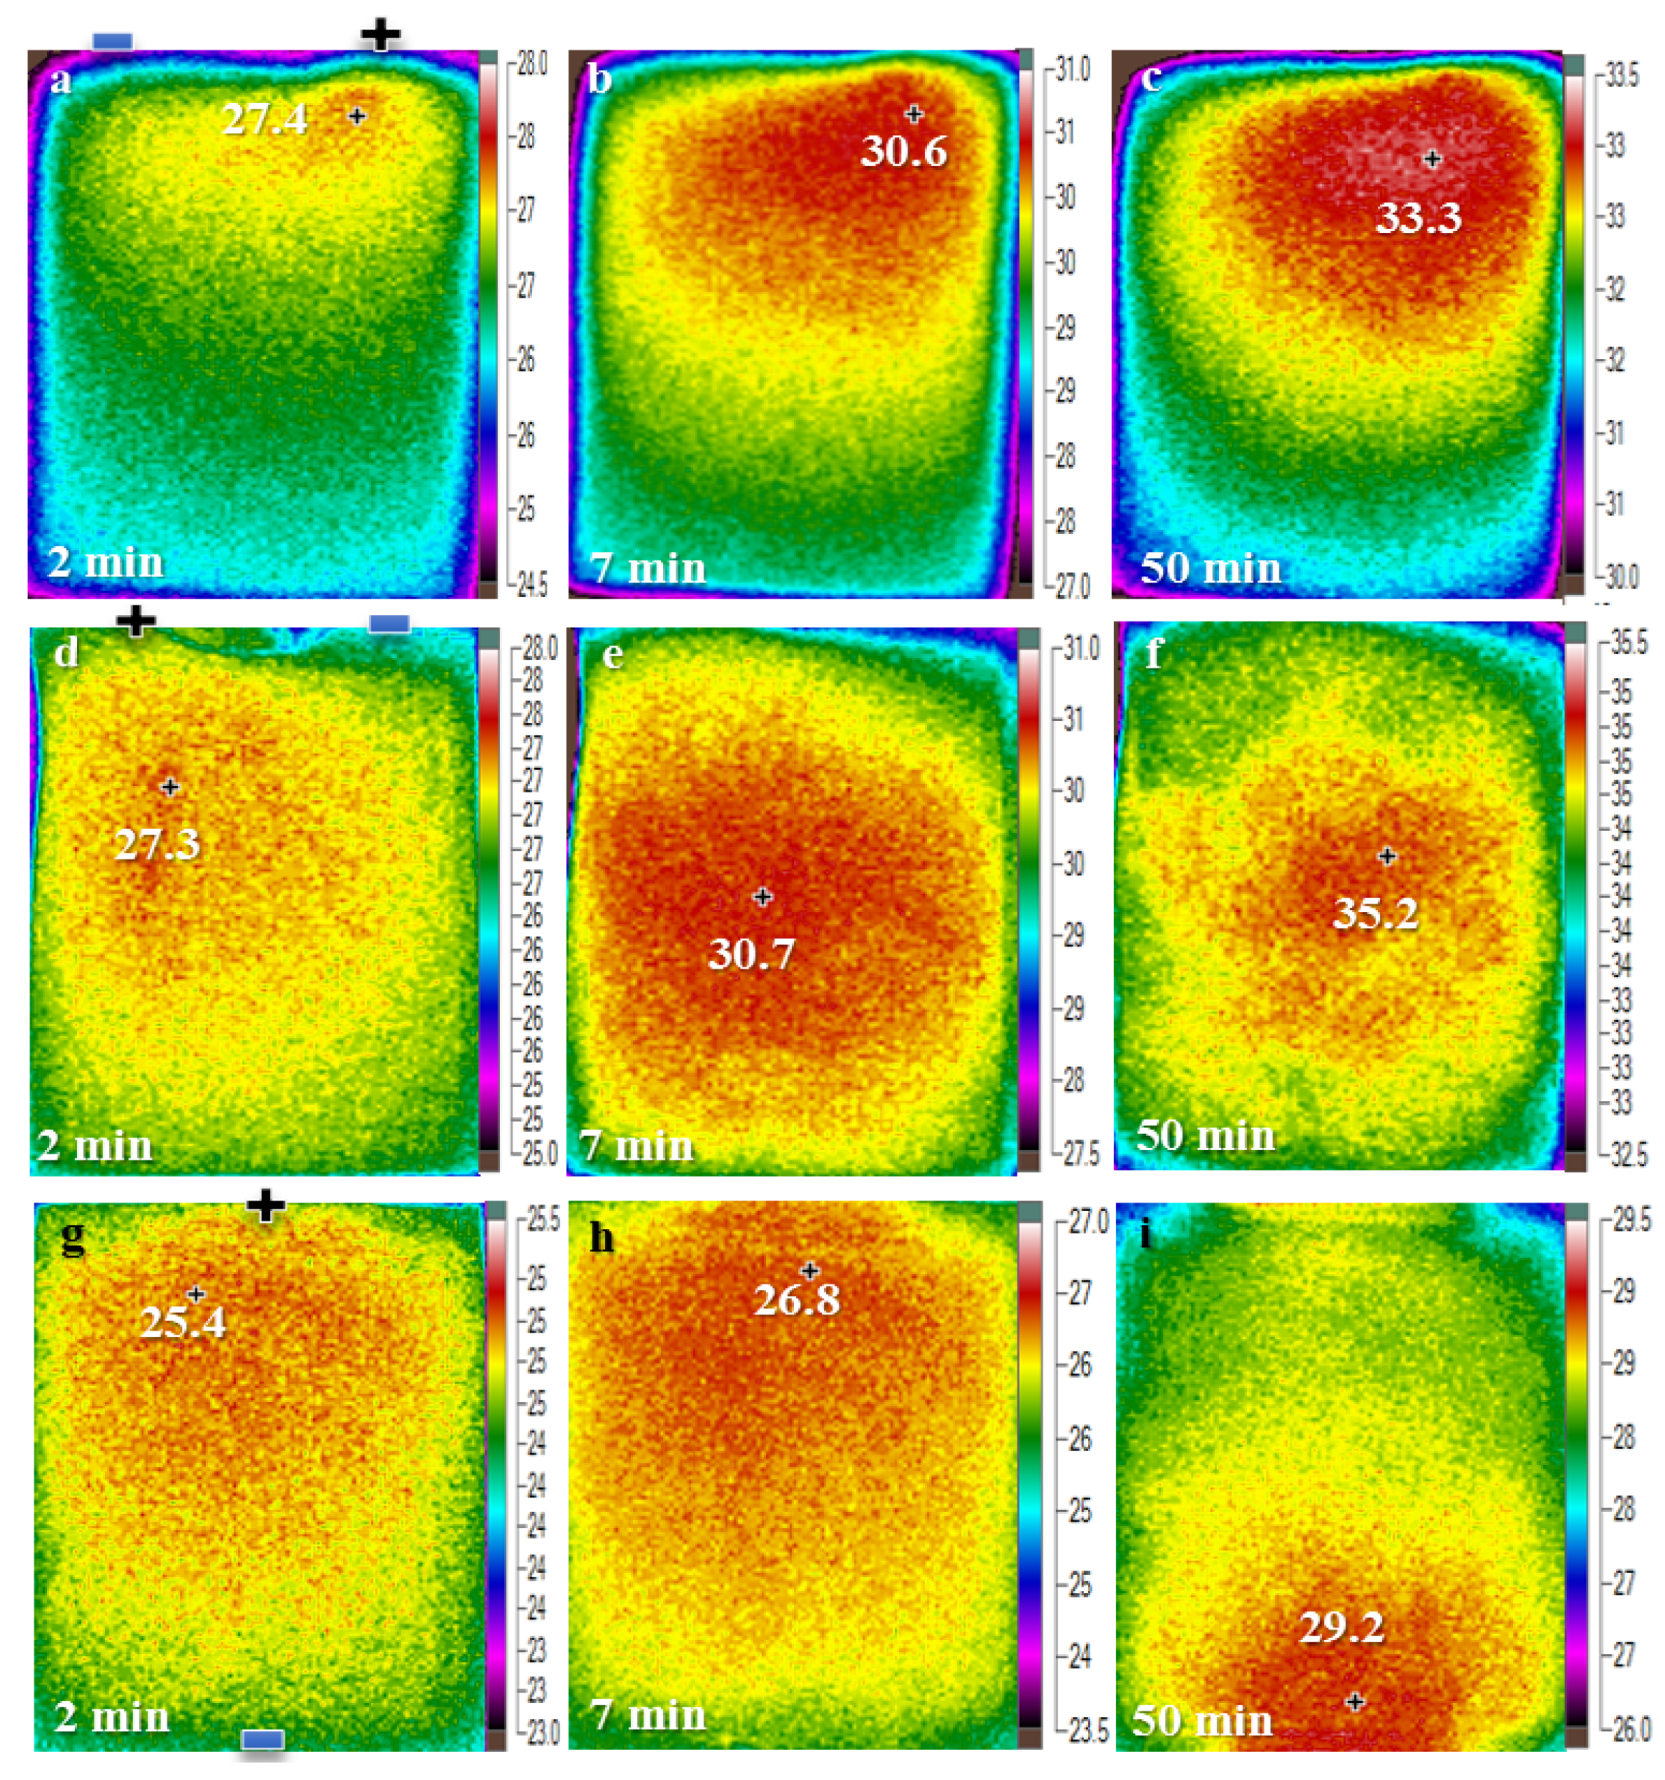
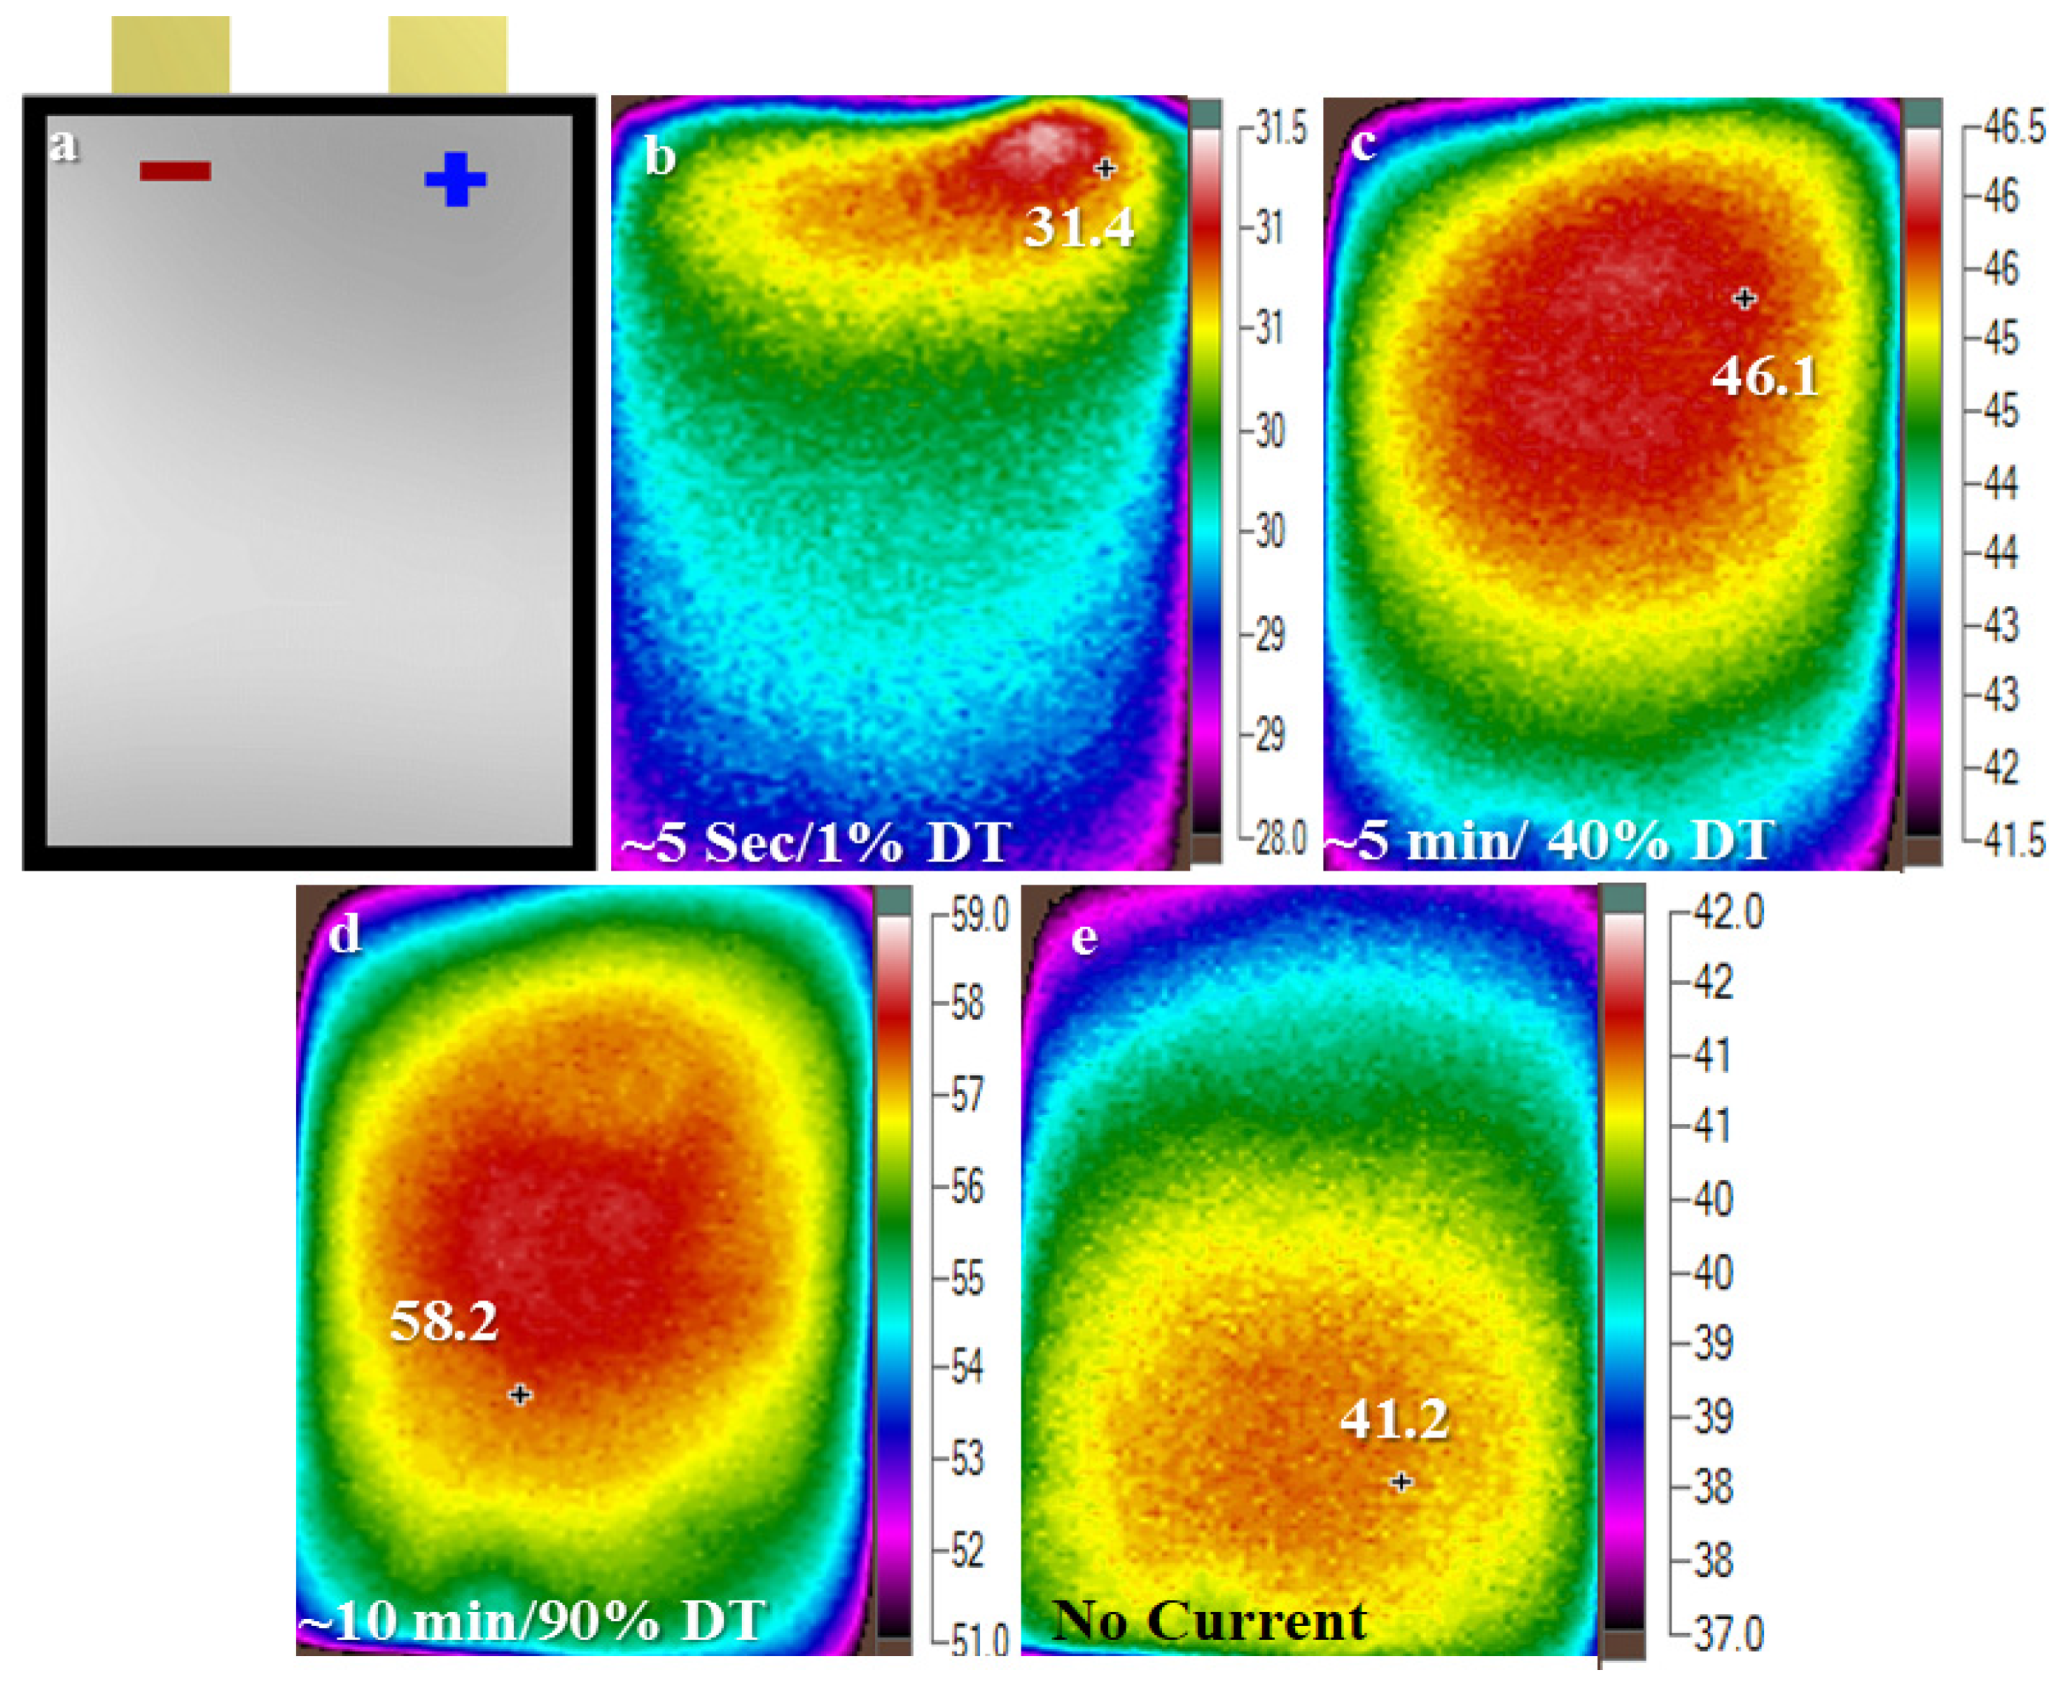
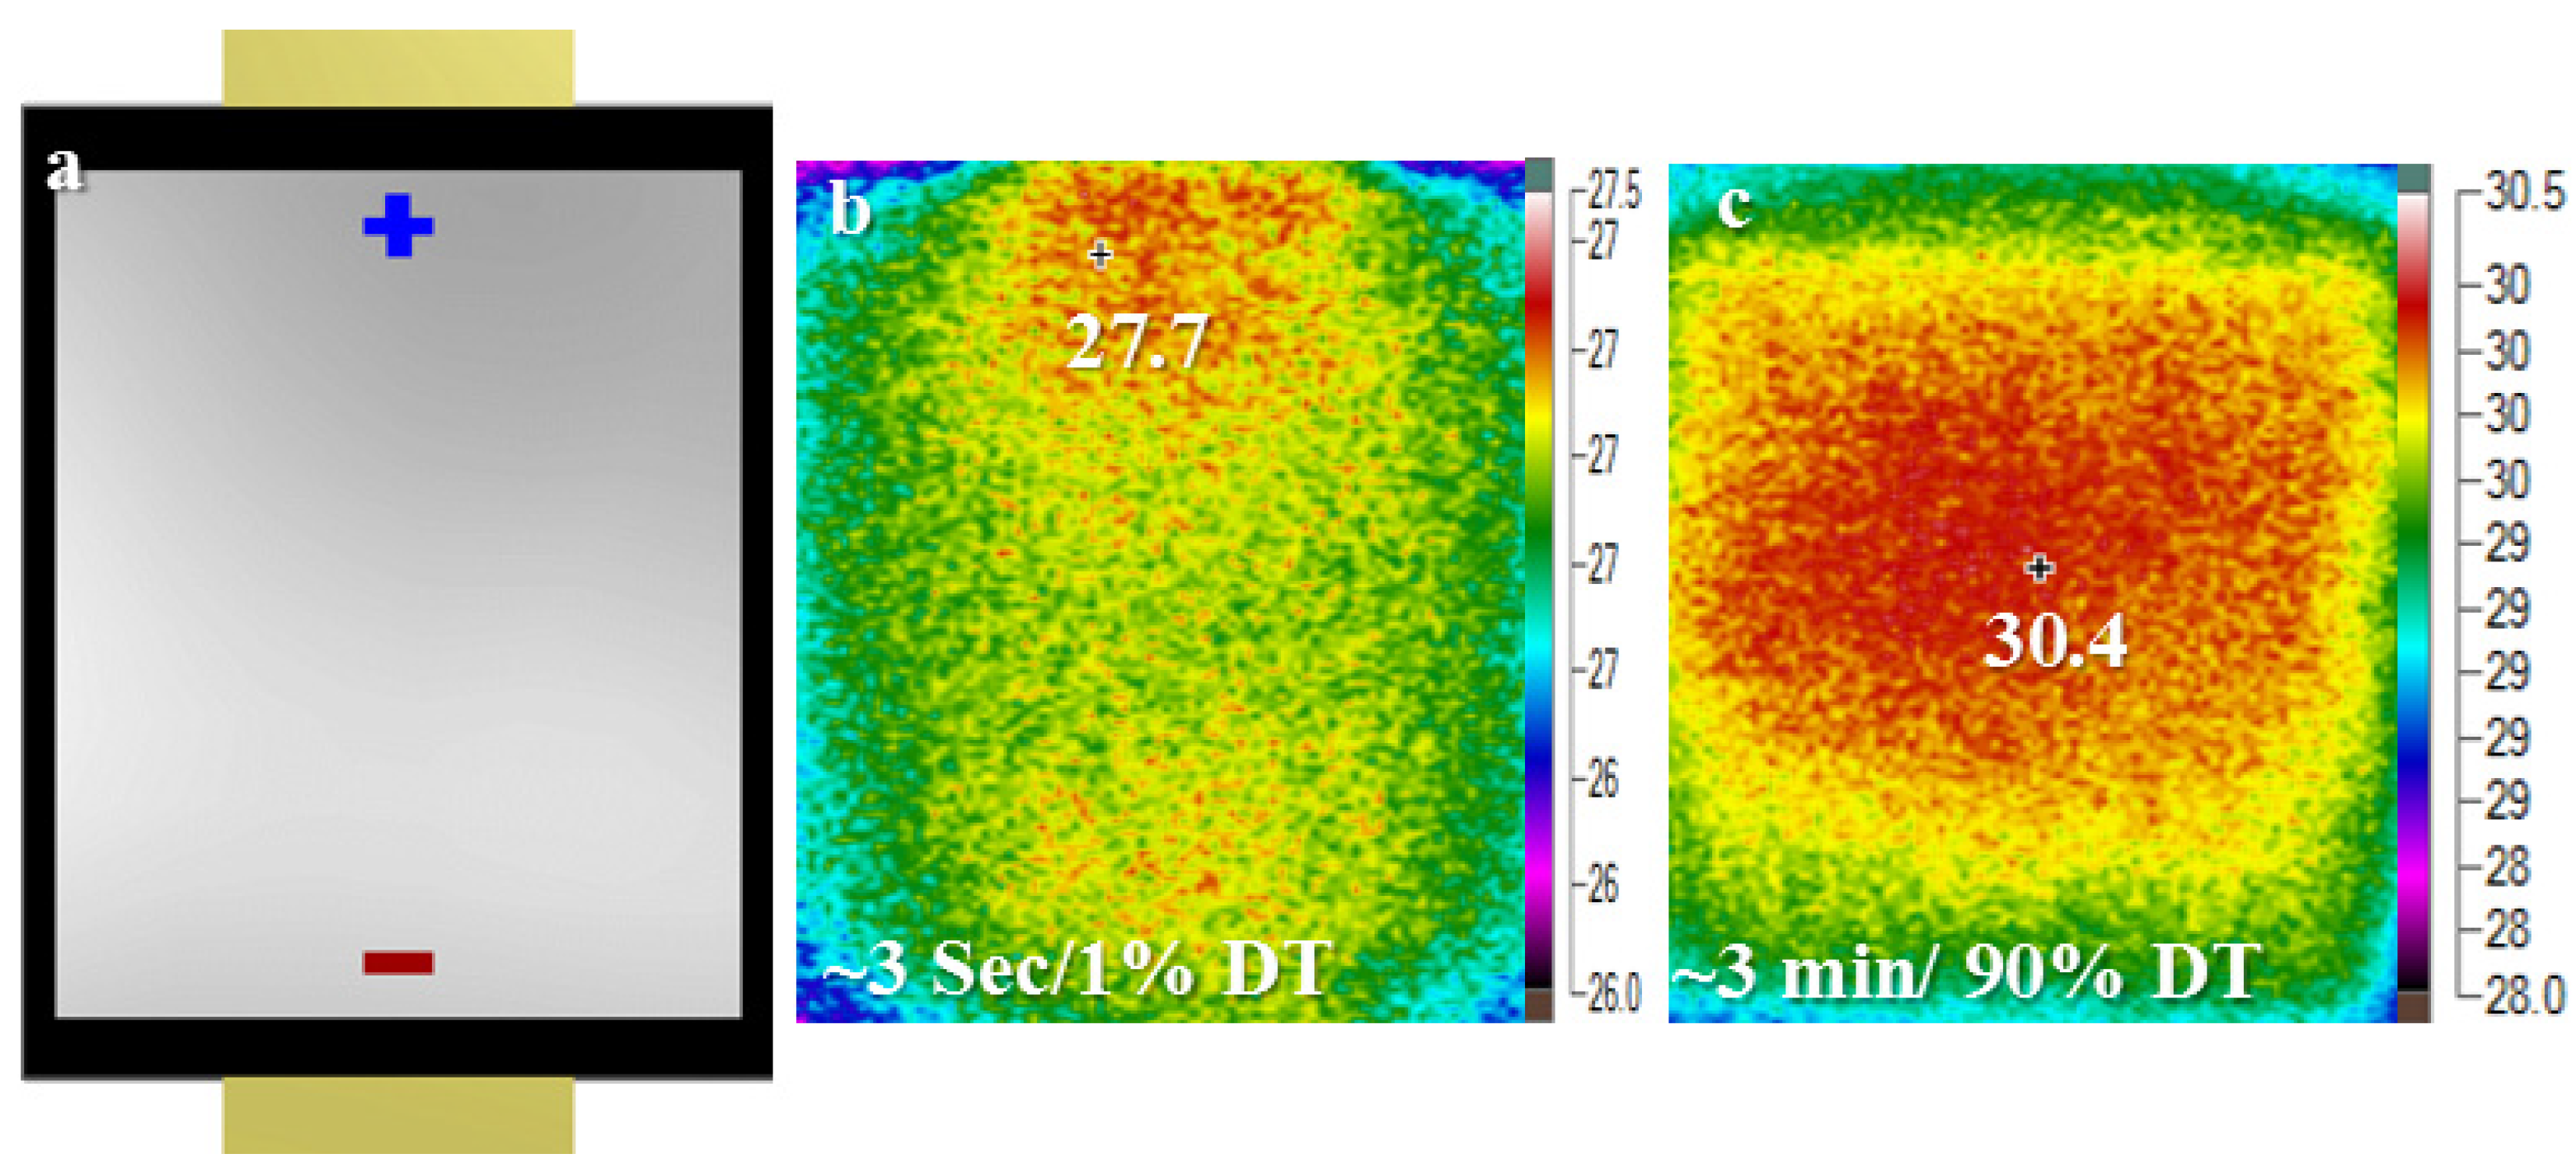
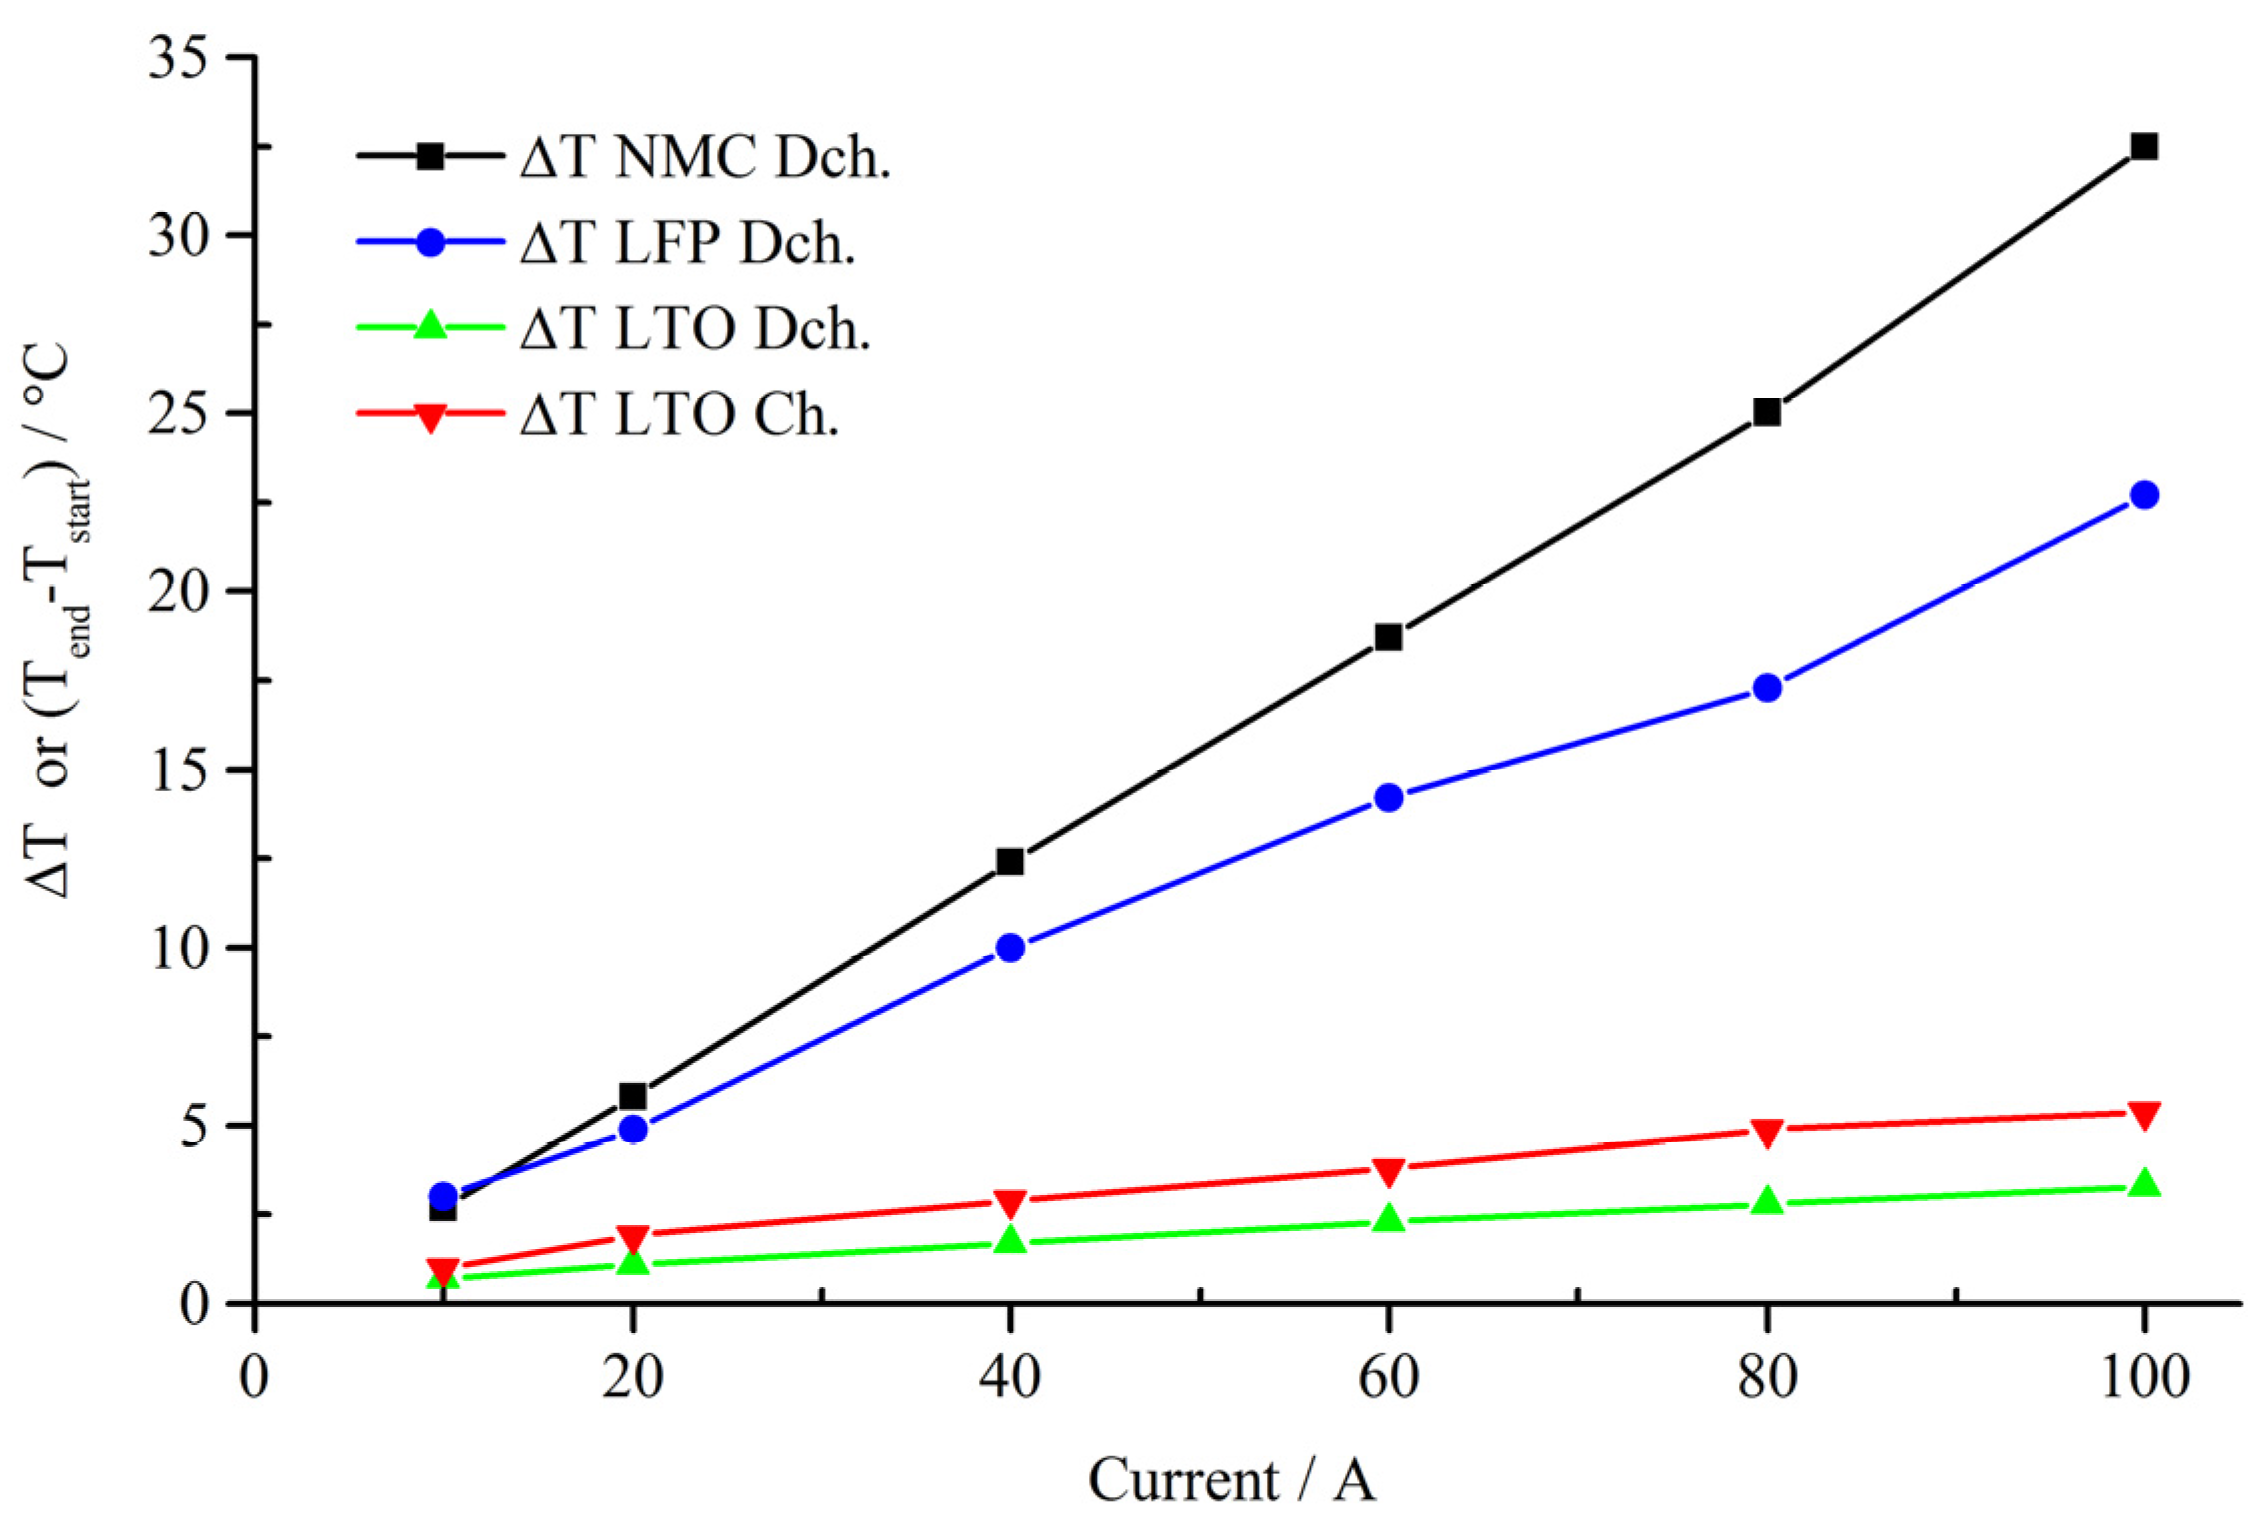
4. Results and Discussion

4.1. Continuous Charge and Discharge

Figure 3 shows the surface temperature profile of the 20 Ah NMC cell obtained by a thermistor placed near the positive tab during complete charge at 20 A and complete discharge at 10 A, 20 A, 40 A, 60 A, 80 A and 100 A respectively. The temperature profile according to this thermistor measurement during charging showed an initial rise until the state of charge (SoC) level reaches ca. 50%. Following, the temperature remains fairly steady until it reaches a 100% SoC level (4.2 V). Discharge at different rates showed, comparatively, a different trend in the temperature profile. For instance, during discharge at 10 A, the temperature rose until a ca. 70% SoC level was reached and was followed by a drop until it rose sharply again after it reached a ca. 30% SoC level.
Figure 3. Thermistor (placed near the positive tab of the cell) based temperature profile (red line) of NMC cell and corresponding load profile (blue line) during continuous charge at 20 A and discharge at 10 A, 20 A, 40 A, 60 A, 80 A, and 100 A. Discharge is denoted by negative current.
Energies 08 08175 g003
In order to explain the phenomenon of temperature drop, one may consider the relative dominance of reversible and irreversible heat contributions. It was found that endothermic entropy change is the result of phase change in the electrode material at a certain SoC level range [20]. Both of the electrodes may undergo volume and phase changes. At the cathode, these changes are based on the ratio of lithium and other elements (e.g., Cobalt) at the cathode. Additionally, at the anode, these changes are based on the ratio of lithium and carbon during intercalation/deintercalation of lithium [20,21,22]. However, at a higher current rate, the contribution of irreversible heat (i.e., polarization resistance heat and ohmic resistance heat) becomes dominant. Therefore, temperature drop due to entropy change became comparatively less significant at 20 A discharge. At higher current of 40 A and 60 A, this effect became trivial, shown by a slight change in the steepness (slope) of the temperature profile. At 80 A and 100 A the effect is negligible.
The IR images of Figure 4 depict the spatial distribution of the cell surface temperature during a discharge at 100 A. Figure 4a shows the schematic of the relative size and orientation of the tabs of the NMC cell. The black border represents the extruded pouch of the cell. The following IR images were represented according to the orientation of the schematic. Now, it is clear from the temperature distribution pattern of the IR images that, initially, the most heated regions were at the adjacent areas of the tabs of the cell and slightly higher near the positive tab. This can be attributed to the comparatively higher resistance of the aluminum positive tab and current collector (compared with the copper negative tab). However, this finding is inconsistent with the findings of Veth et al., who observed that the maximum temperature was initially near the negative tab [14]. Apparently, this inconsistency appeared because of the variation in commercial battery cell design (e.g., surface area of the tabs and current collectors, etc.) [16]. Nonetheless, with the progression of the discharge towards ending, the temperature distribution became more spatially uniform over the whole surface of the cell (Figure 4c,d), with the most heated region located in the center region of the cell. This observation of the shifting of hottest point is in congruence with the observation of Li et al. [23], who investigated cell temperature by inserting sensors inside the cell. This observation can be attributed to the faster depletion of the active species near the positive area due to the higher current density. Similar patterns were observed with charge and discharge at other current rates. It is important to mention here that individual IR images have different temperature scales. Here, the principal objective was to observe the spatial non-uniform temperature distribution of a cell at a certain state. By incorporating a different temperature scale, it was possible to observe and show the distinguishable non-uniformity of surface temperature distribution at a particular stage of operation. Figure 4d shows the temperature distribution of heat dissipation at rest (no applied current). This pattern suggests that the heat dissipation rate was higher at the upper half region of the cell (the half that contains the tabs), apparently because of higher heat transfer through the tabs.
The LFP cell consisted of a similar graphite based anode, therefore, the thermistor (placed at adjacent area of the positive tab) based surface temperature profile shows similar trend as the trend of the NMC cell (see Figure 5), particularly during discharge at all current rates. However, the temperature profile during charge showed a slight variation. At the beginning of the charge process, a small drop in temperature was observed, followed by a sharp rise until the SoC reached a level of ca. 50%–60%. After that, again, a small drop appeared, followed by a rise until the end of charge.
In order to explain this variation from the NMC cell, the following factors can be considered. (i) It was found that the entropy of an LFP cathode does not change significantly during the charge/discharge process [21], therefore, a major portion of the entropy related heat is contributed by the graphite anode; (ii) an LFP cell operates within a lower voltage window compared to NMC; (iii) LFP shows a two phase system of LiFePO4 and FePO4 during Li+ intercalation/deintercalation [24]. Additionally, it was also shown that the distribution of these two phases, which vary across the electrode, are at a certain SoC level [25]. Additionally, the geometrical attributes of the cell also had to be considered. The LFP cell is slightly smaller than the NMC cell with comparatively wider tabs (see Figure 6a). Although, despite of this geometrical variation, spatial temperature distribution showed similar evolution of the contour, as shown in Figure 6a–c.
Figure 4. (a) Schematic of the NMC 20 Ah cell. IR images during discharge at 100 A along with the location of respective maximum temperature; (b) after ~5 s of discharge or ~1% of total discharge time (DT); (c) after 5 min or ~40% DT; (d) after 10 min or ~90% DT; (e) during rest (zero current). Different temperature scales were used here to show distinguishable non-uniformity of surface temperature distribution.
Energies 08 08175 g004
Figure 5. Thermistor (placed near the positive tab of the cell) based temperature profile (red line) of an LFP cell and the corresponding load profile (blue line) during a continuous charge at 10 A and discharge at 10 A, 20 A, 40 A, 60 A, 80 A and 100 A. Discharge is denoted by negative current.
Energies 08 08175 g005
Figure 6. (a) Schematic of the LFP 14 Ah cell. IR images during discharge at 100 A along with the location of respective maximum temperature; (b) after ~4 s of discharge or ~1% of discharge time (DT); (c) after 7 min or ~90% DT.
Energies 08 08175 g006
The LTO anode based cells have a distinct difference compared to the other two cells (i.e., the NMC and LFP cells). Titanate based anode has a higher electrical conductivity and a bigger surface area, thus, it shows lower impedance compared to graphite anode (see Figure 2 and Table 1). One of the reasons behind this variation is the distinction of solid-electrolyte interface (SEI) layer formation and the thickness characteristics between graphite and tianate anodes [3,26]. Thus, the net heat generation in the LTO cells is much lower, which makes the LTO cell a potential candidate for a cell with higher thermal safety, even during very fast charging (within less than 30 min). It was also found that the entropy change is insignificant in an LTO based commercial full cell [22]. These properties were reflected in the surface temperature profile of the LTO cell (see Figure 7). Discharge at different rates showed a sharp rise without any noticeable drop in the surface temperature (Figure 7a). However, charge at a low current (10 A) showed a change of slope in the rising temperature profile, approximately at the middle of the charge process, which further diminished gradually during charging at high current rates (20–100 A) (Figure 7b). Additionally, the LTO battery cell had different geometrical attributes. For instance, much wider tabs were located at the opposite side of the cell (see Figure 8a). Despite of the difference in material and geometrical properties, the spatial temperature distribution of the cell surface showed similar contours to the NMC and LFP cells (see Figure 8b,c).
Figure 7. Thermistor (placed near the positive tab of the cell) based temperature profile (red line) of LTO cell and corresponding load profile (blue line) during (a) continuous charge at 10 A and discharge at 10 A, 20 A, 40 A, 60 A, 80 A and 100 A, respectively; (b) continuous charge at 10 A, 20 A, 40 A, 60 A, 80 A and 100 A and discharge at 10 A, respectively. Discharge is denoted by negative current.
Energies 08 08175 g007aEnergies 08 08175 g007b
Figure 8. (a) Schematic of the LTO 5 Ah cell. IR images during discharge at 100 A along with the location of respective maximum temperature; (b) after ~3 s of discharge or ~1% of discharge time (DT); (c) after 3 min or ~90% DT.
Energies 08 08175 g008
A summary of surface temperature rise of all the three cells is presented in Figure 9. Here, ∆T represent the temperature rise for each process (charge/discharge) based on the measurement by the thermistor. In addition, it was calculated as follows:
T = T e n d T s t a r t
where, T e n d = Temperature at the end of the process (charge/discharge), T s t a r t = Temperature at the start of the process (charge/discharge).
Figure 9. Temperature rise evolution in the NMC cell (during discharge), the LFP cell (during discharge) and the LTO cell (during both charge and discharge) at different current rates.
Energies 08 08175 g009

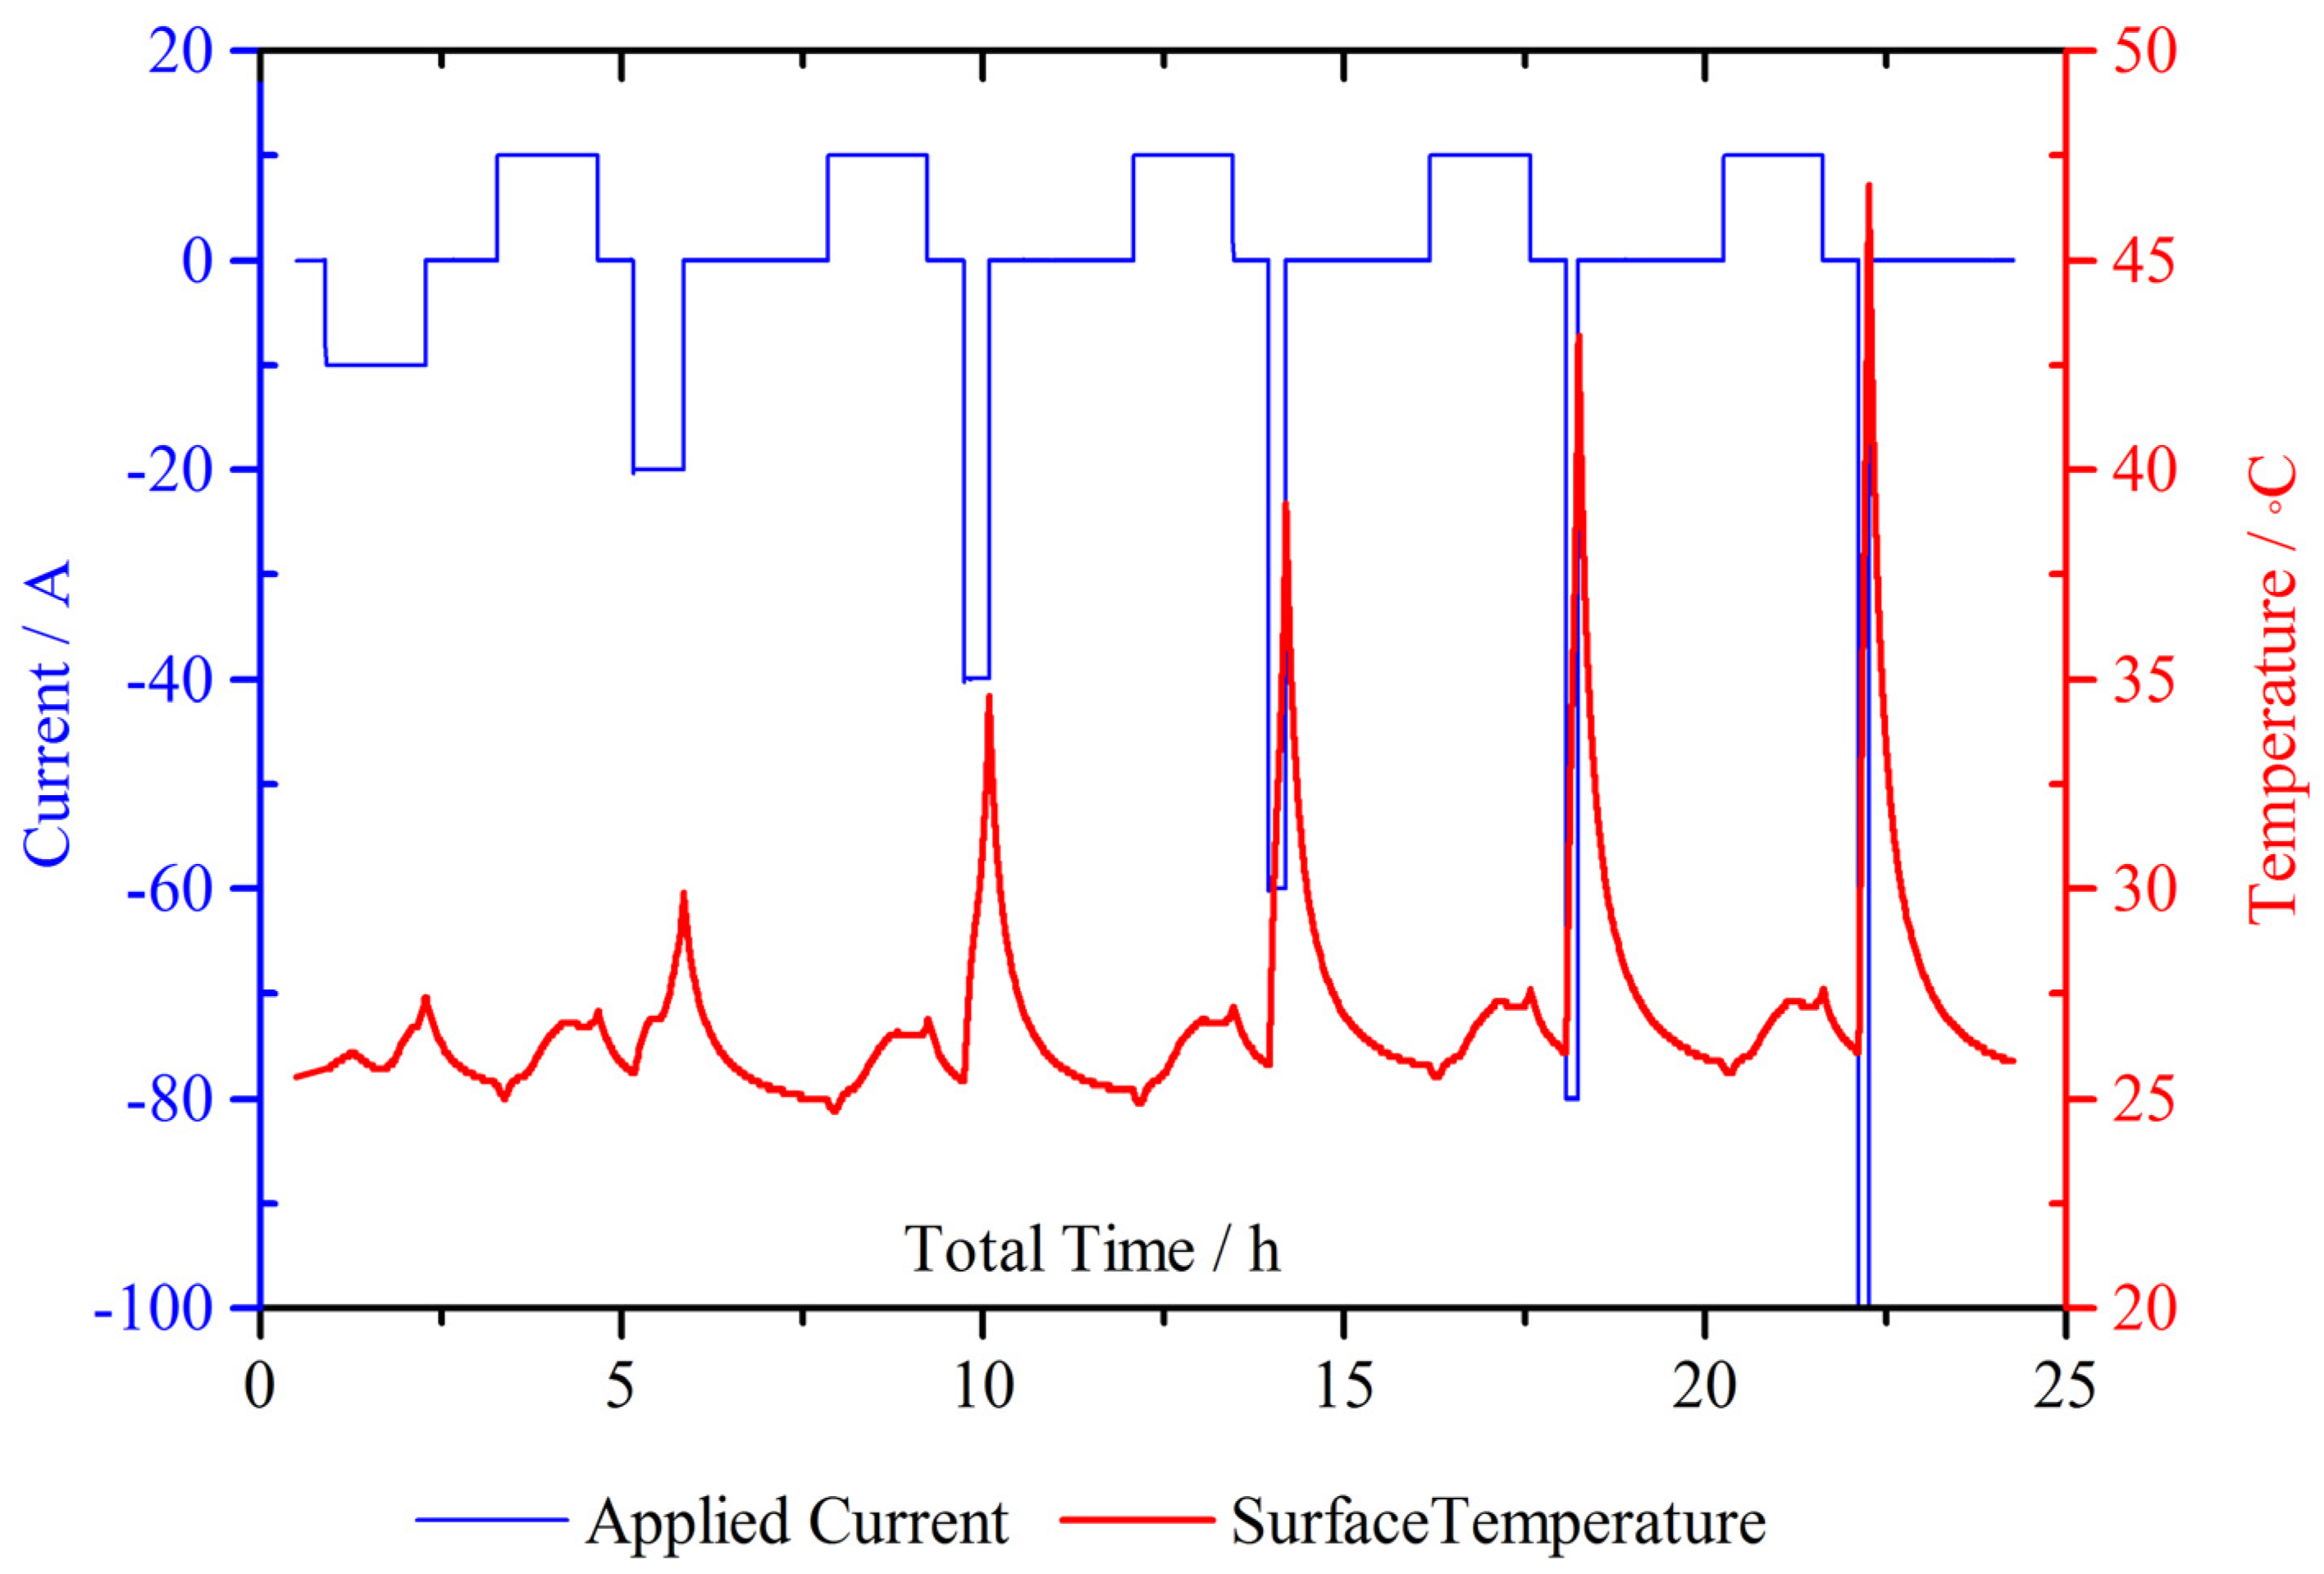
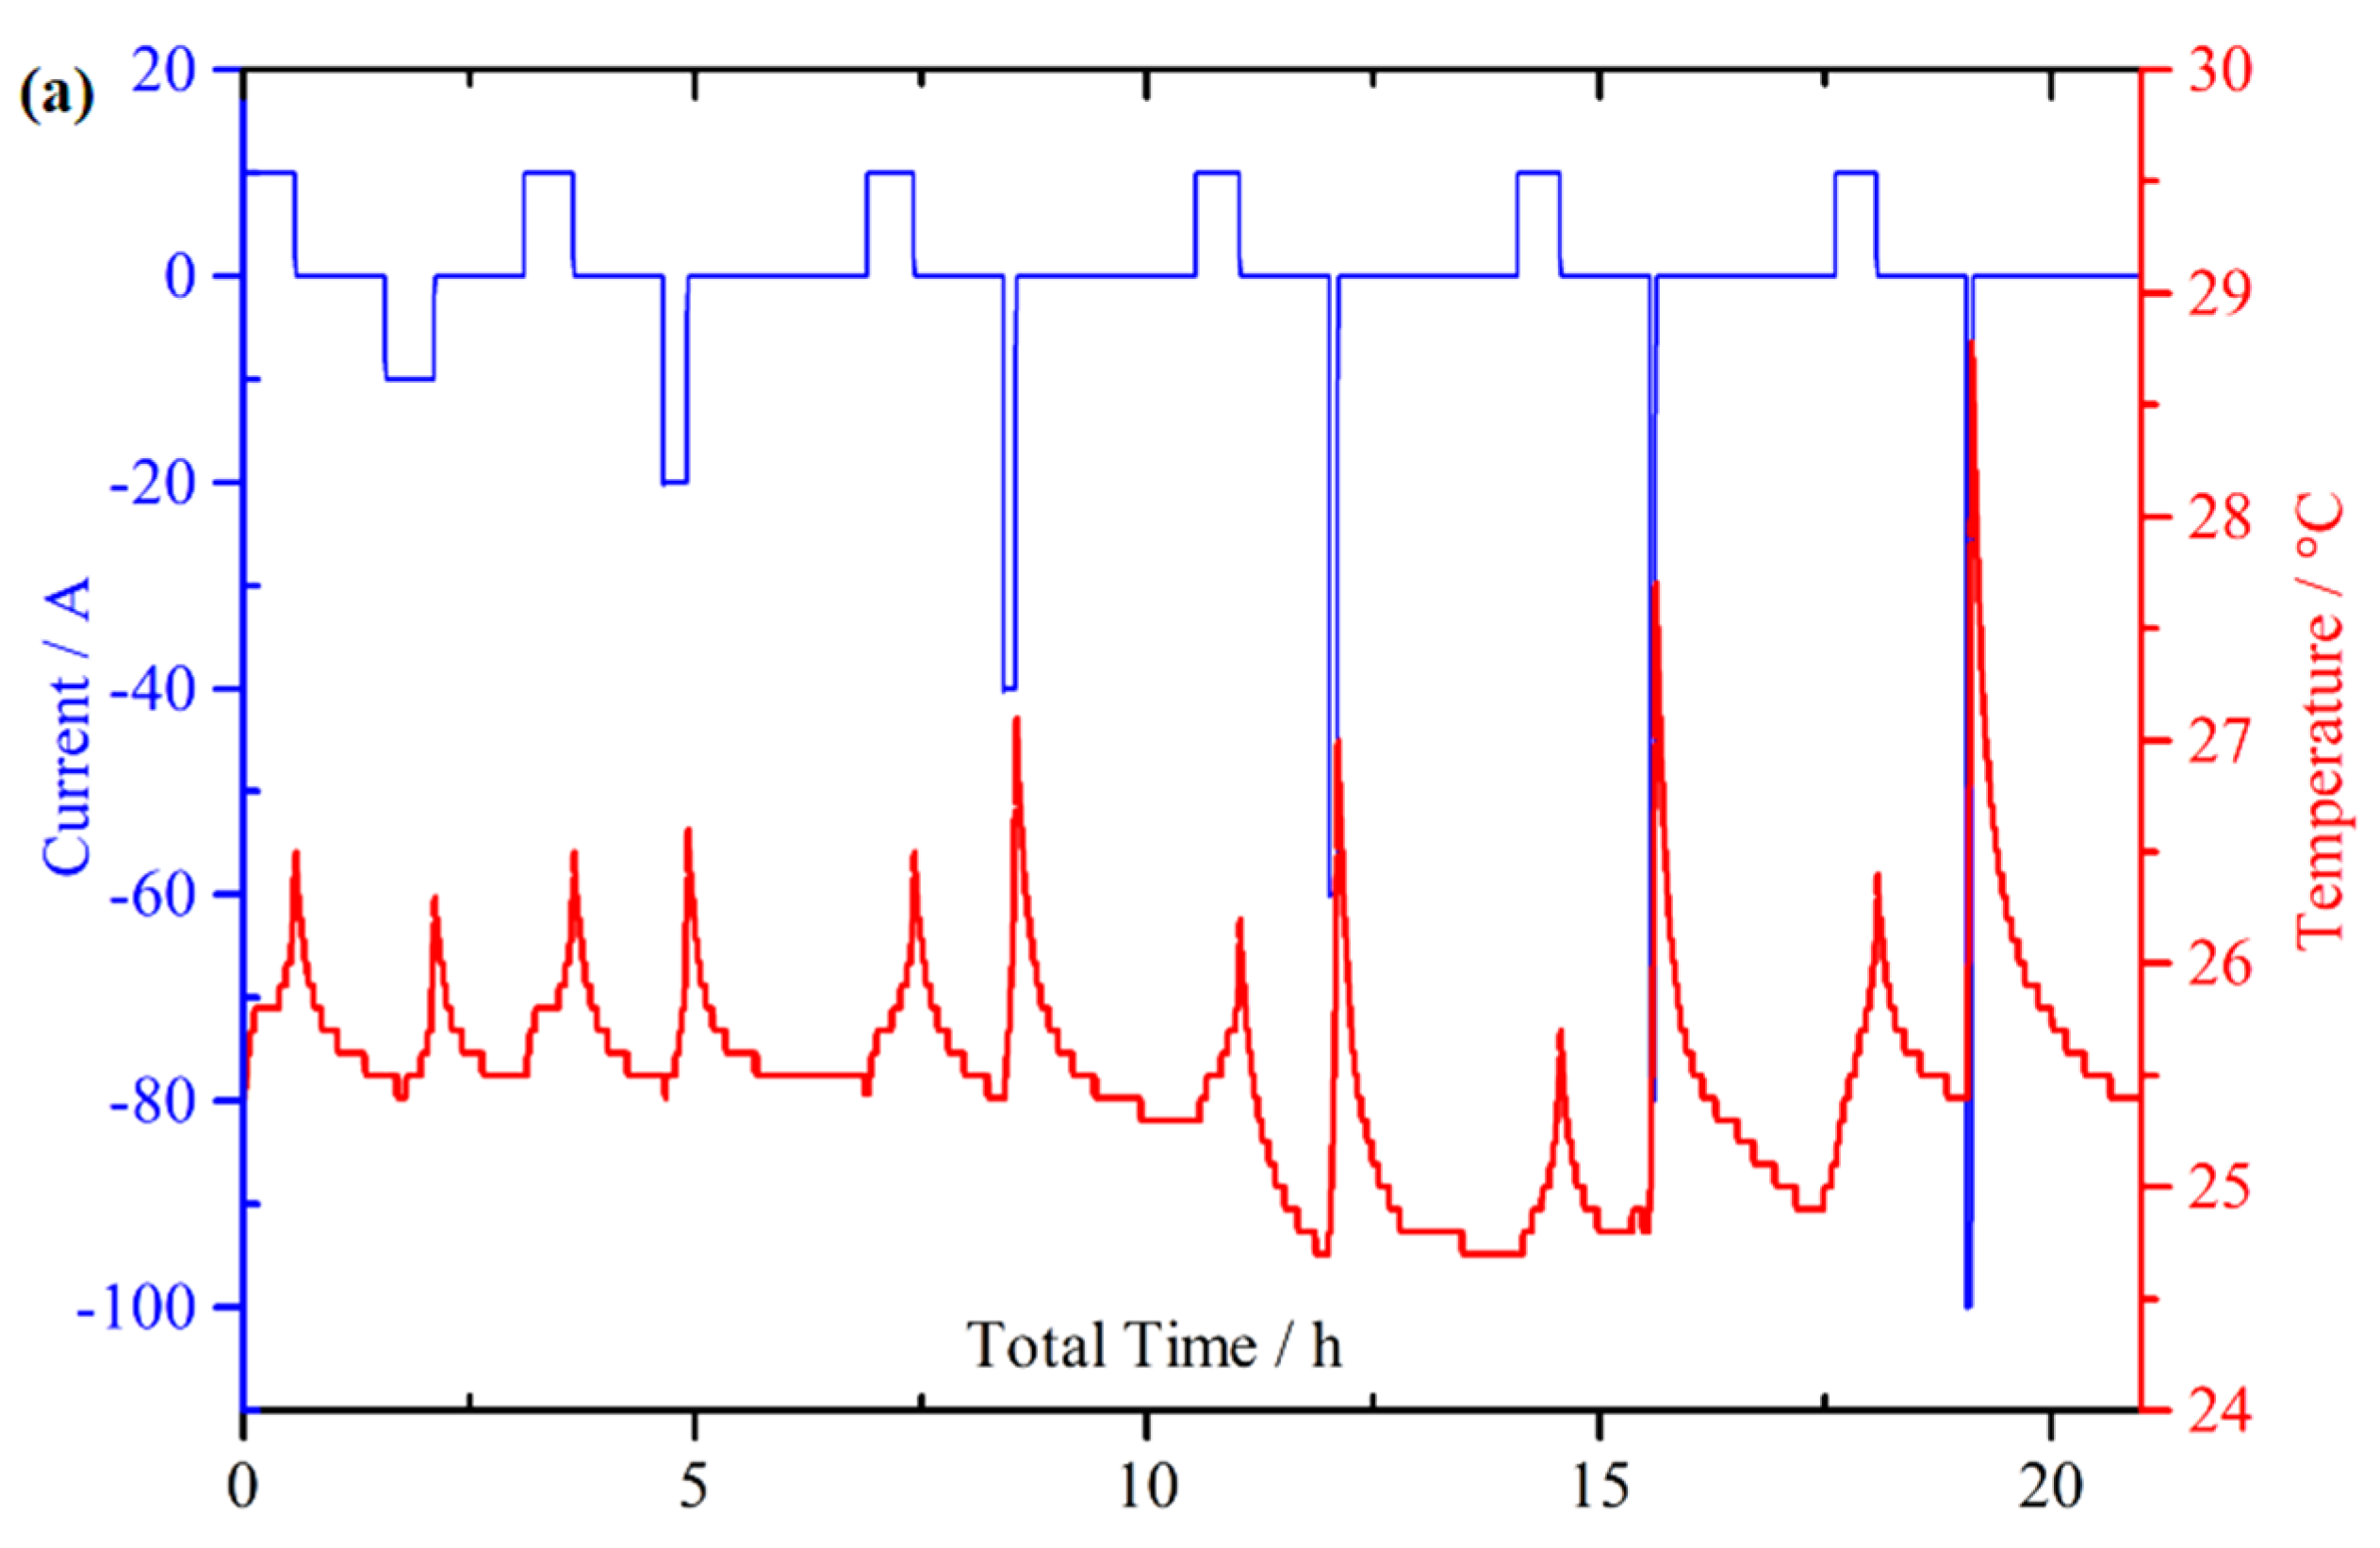
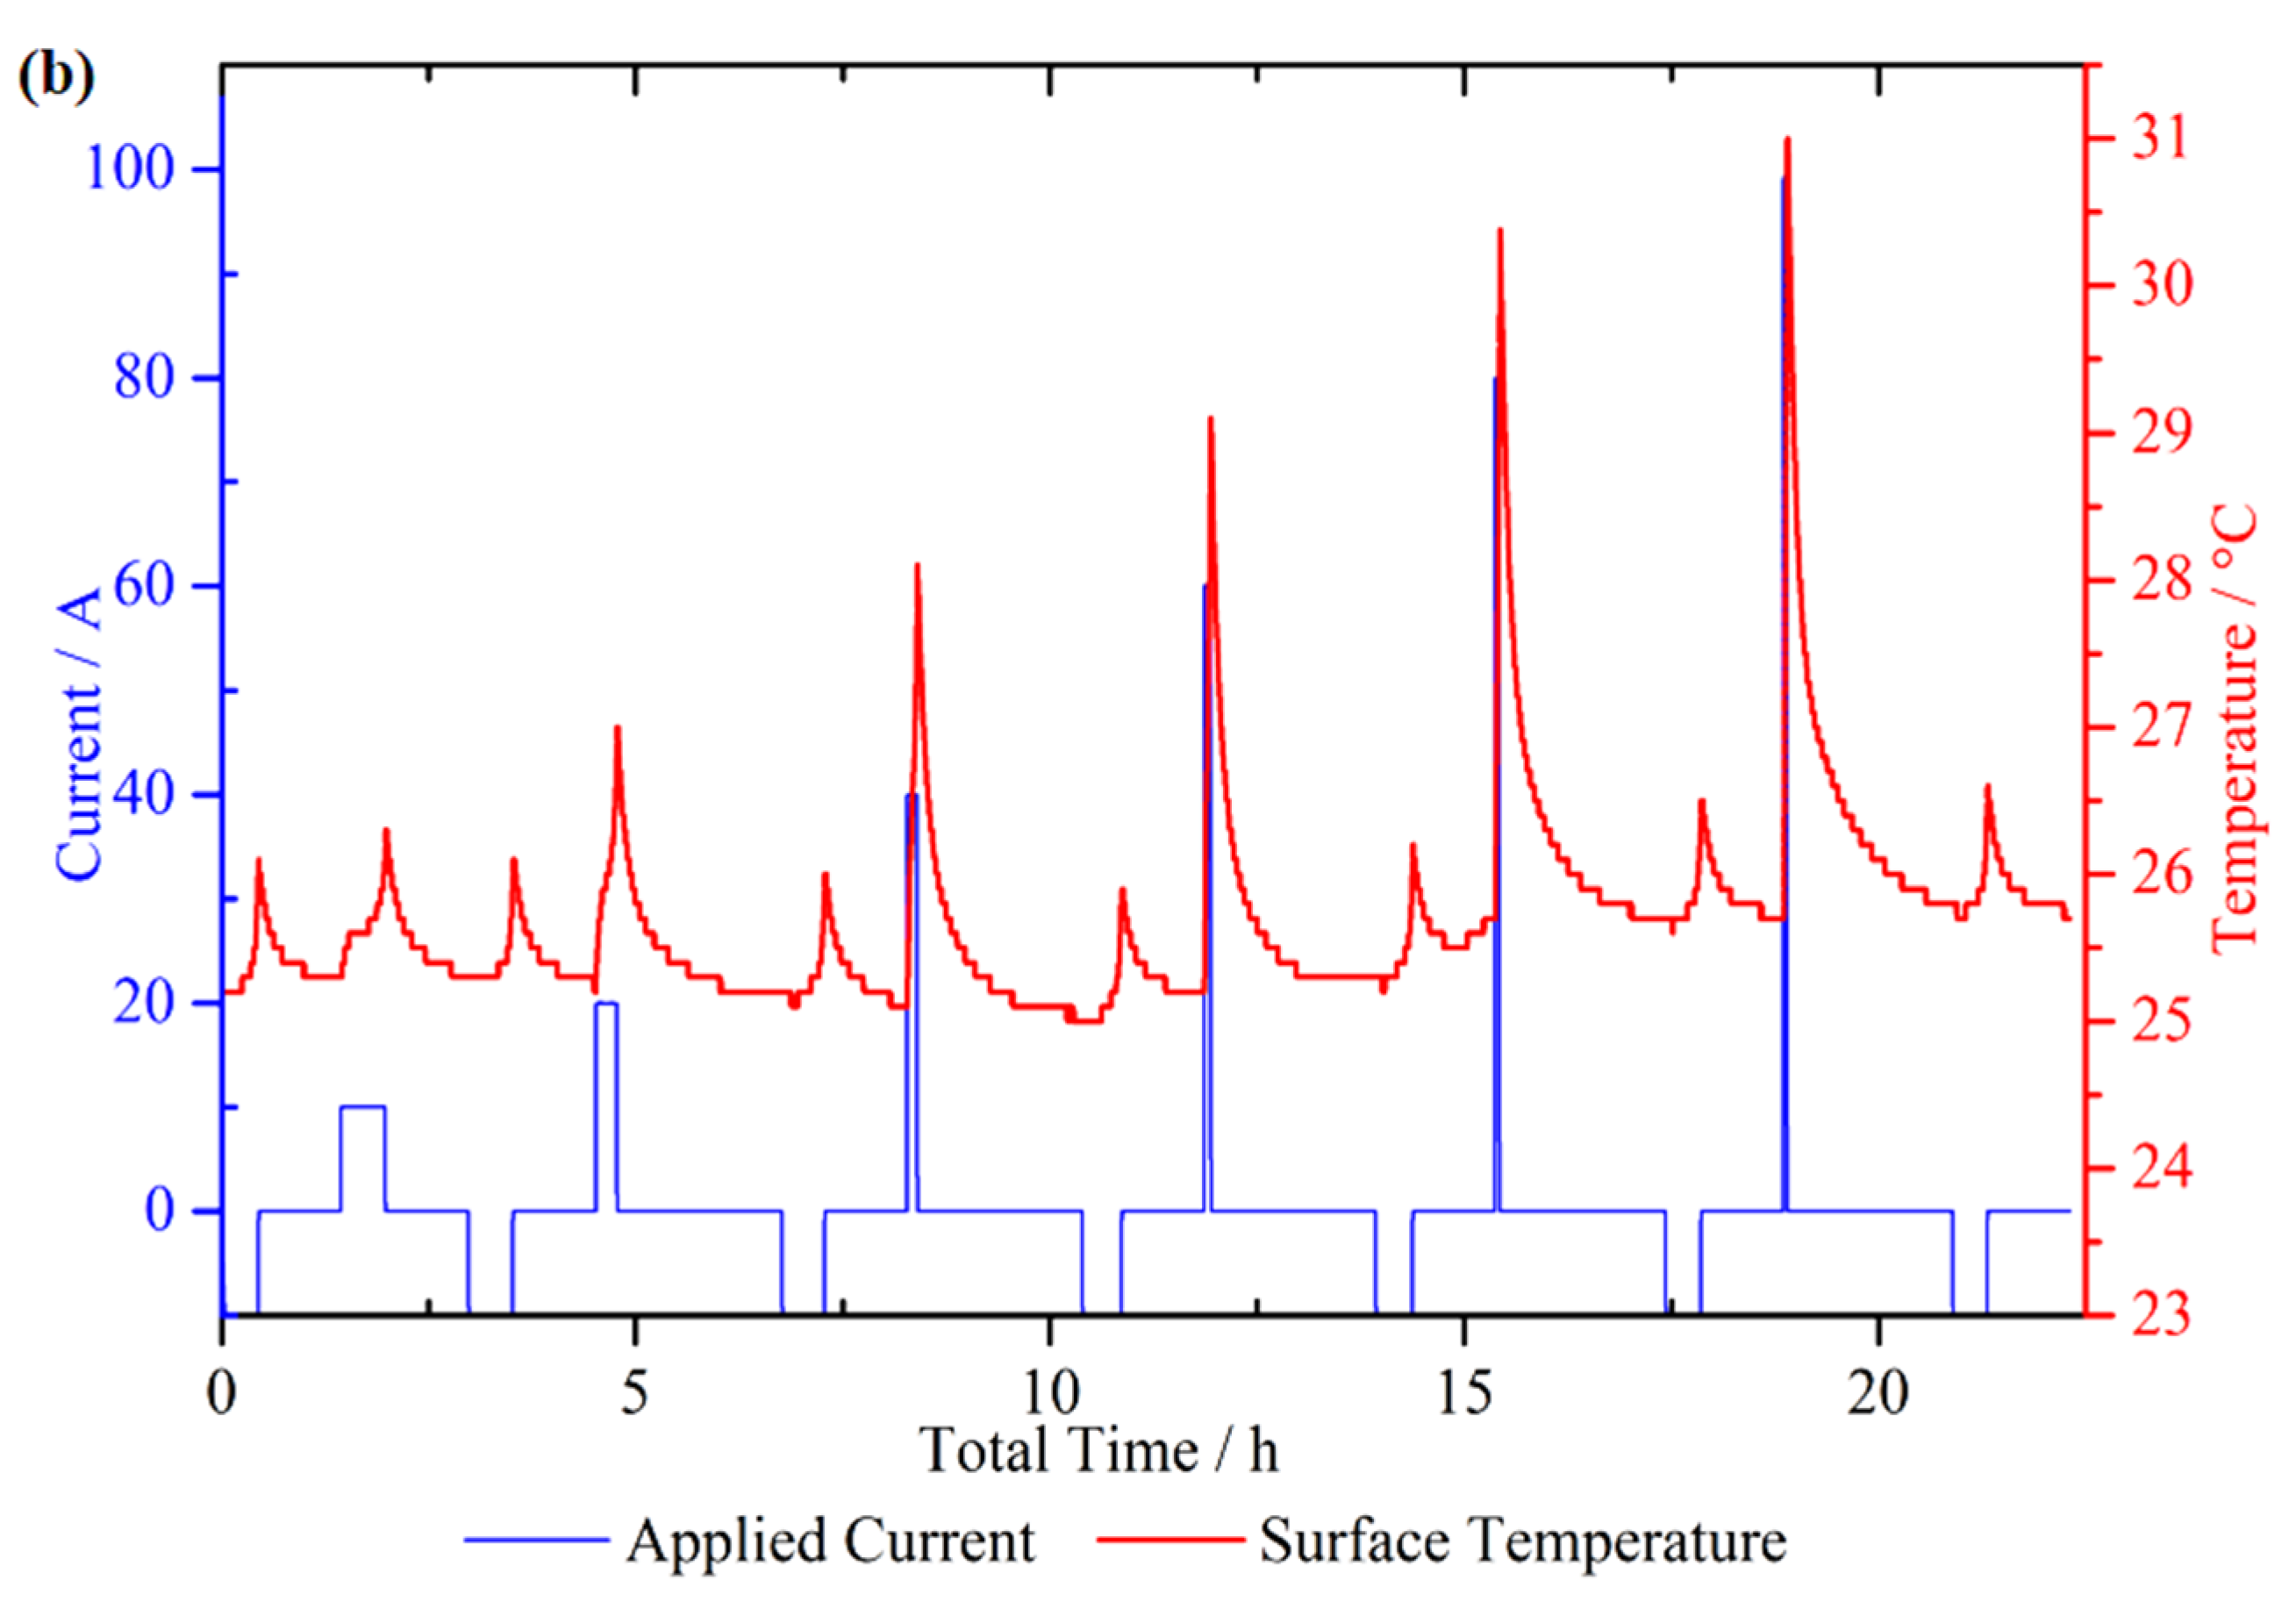
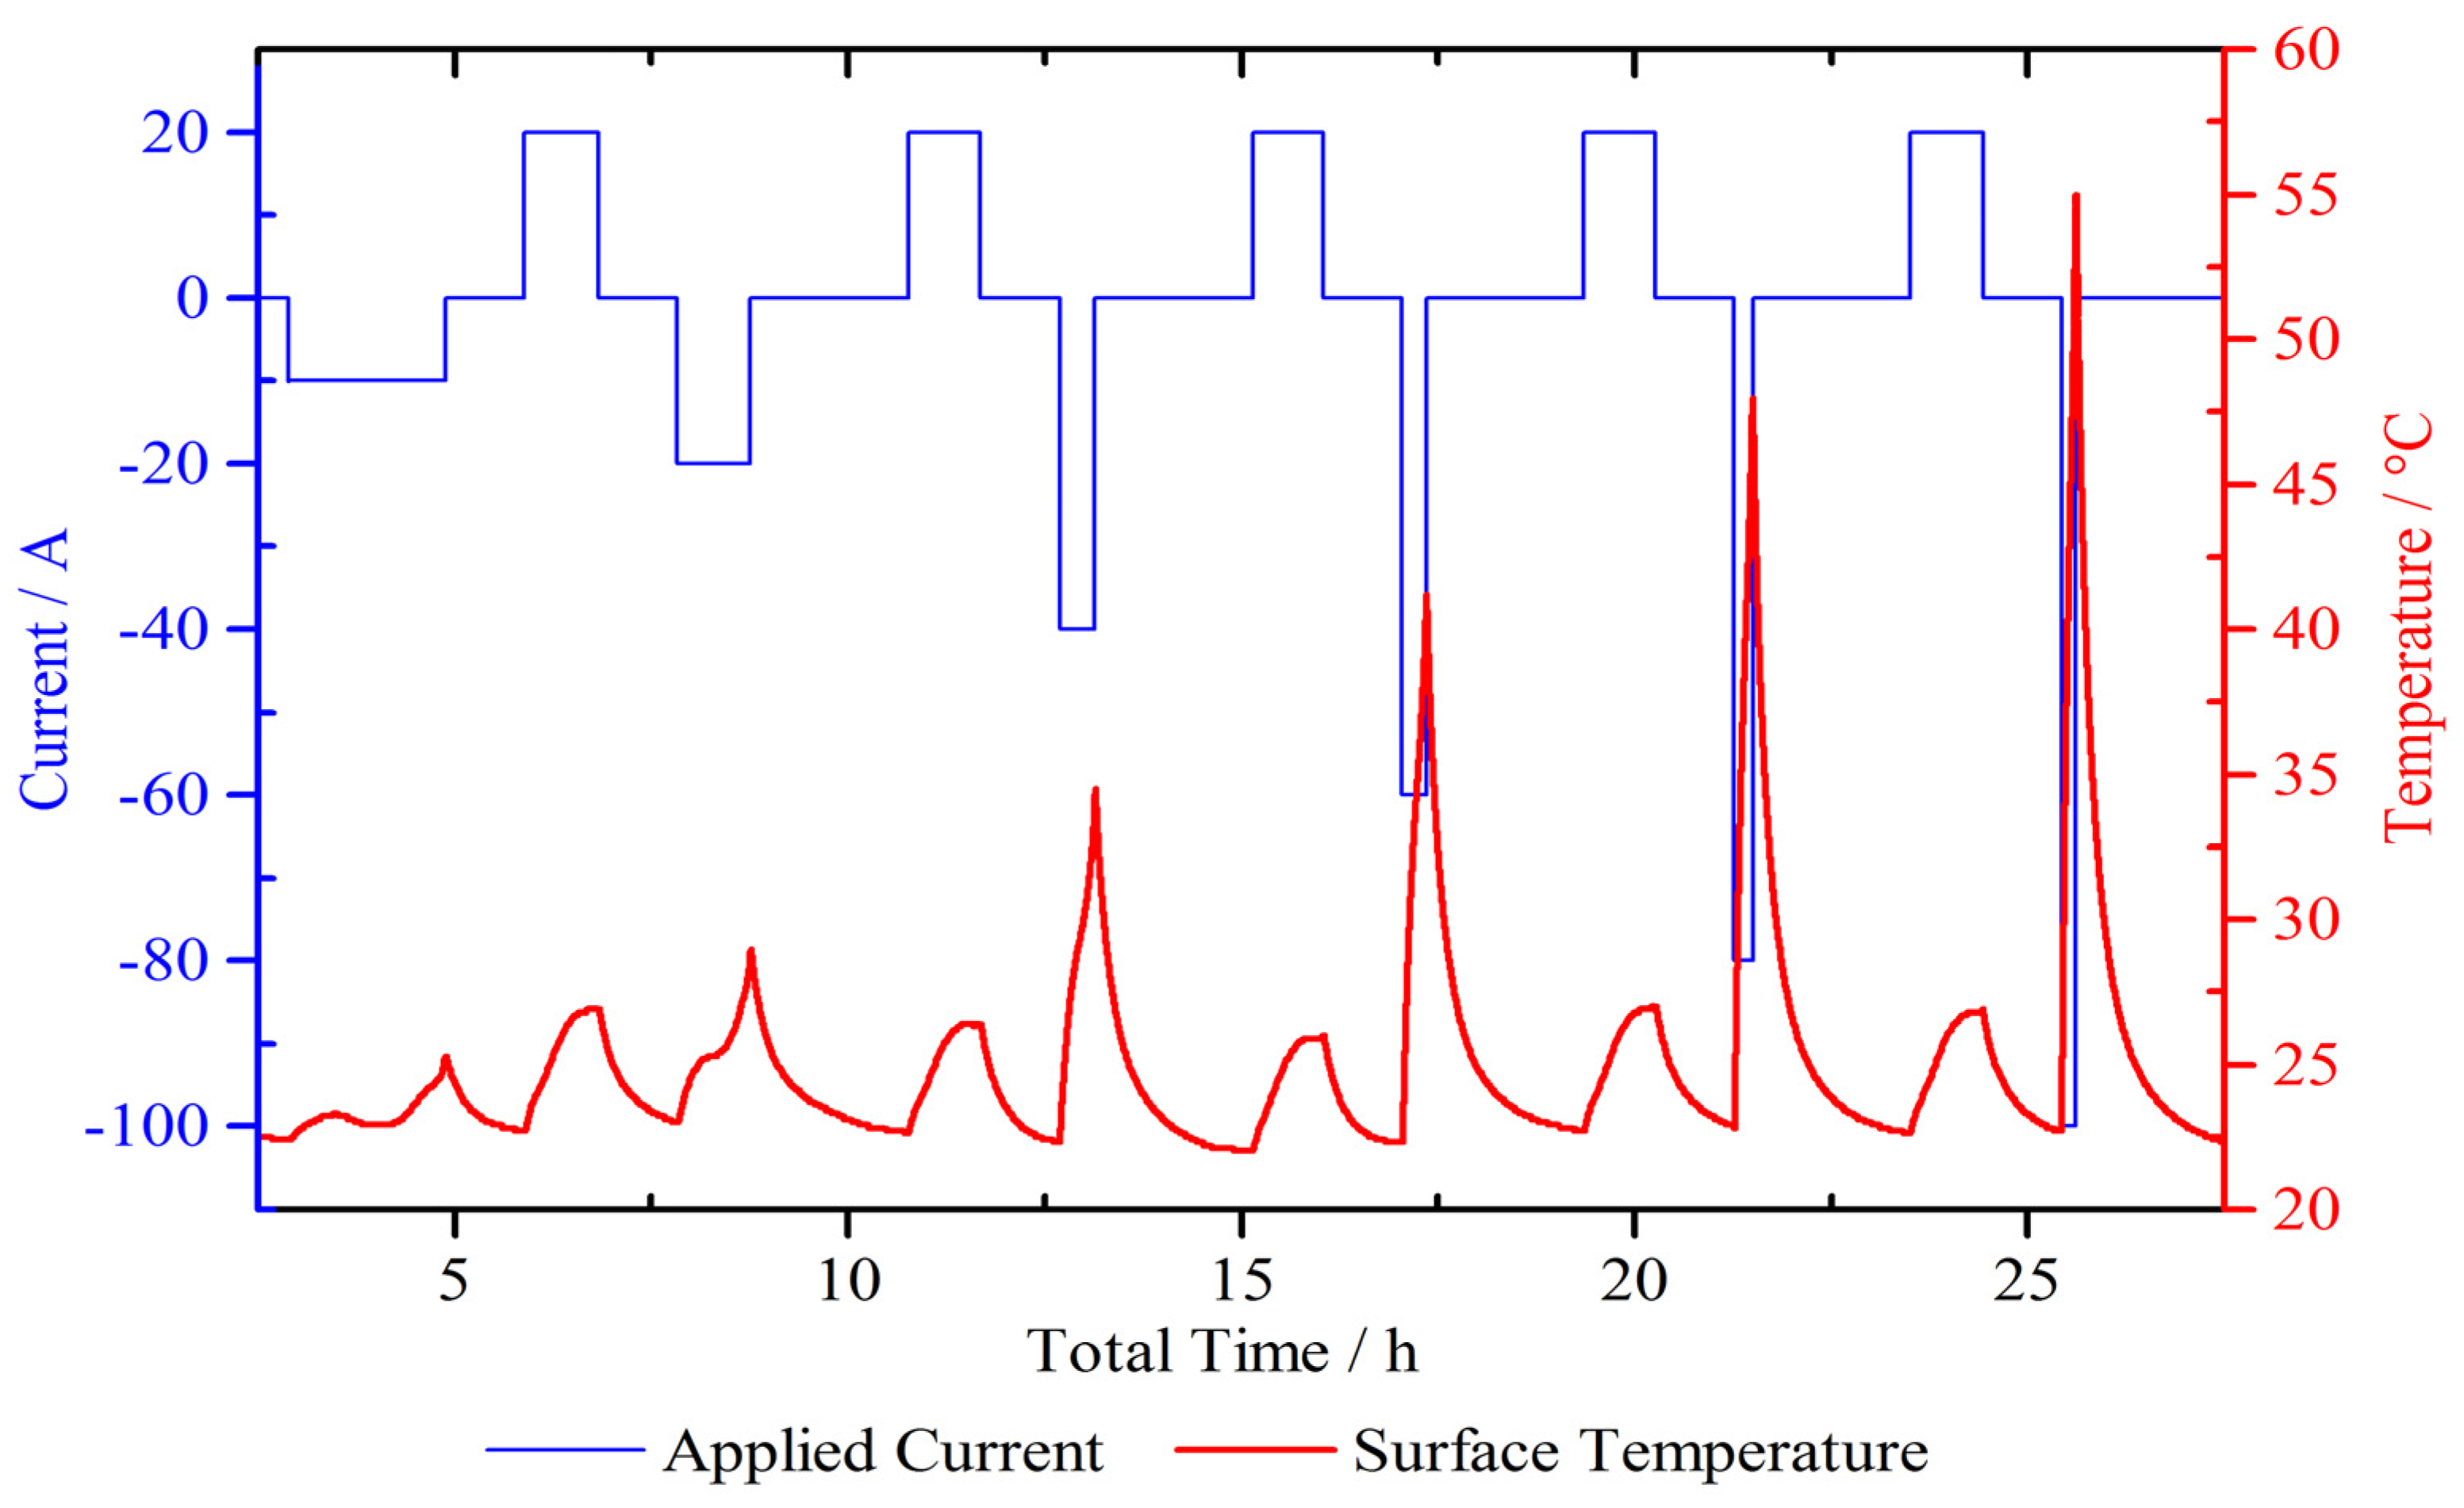
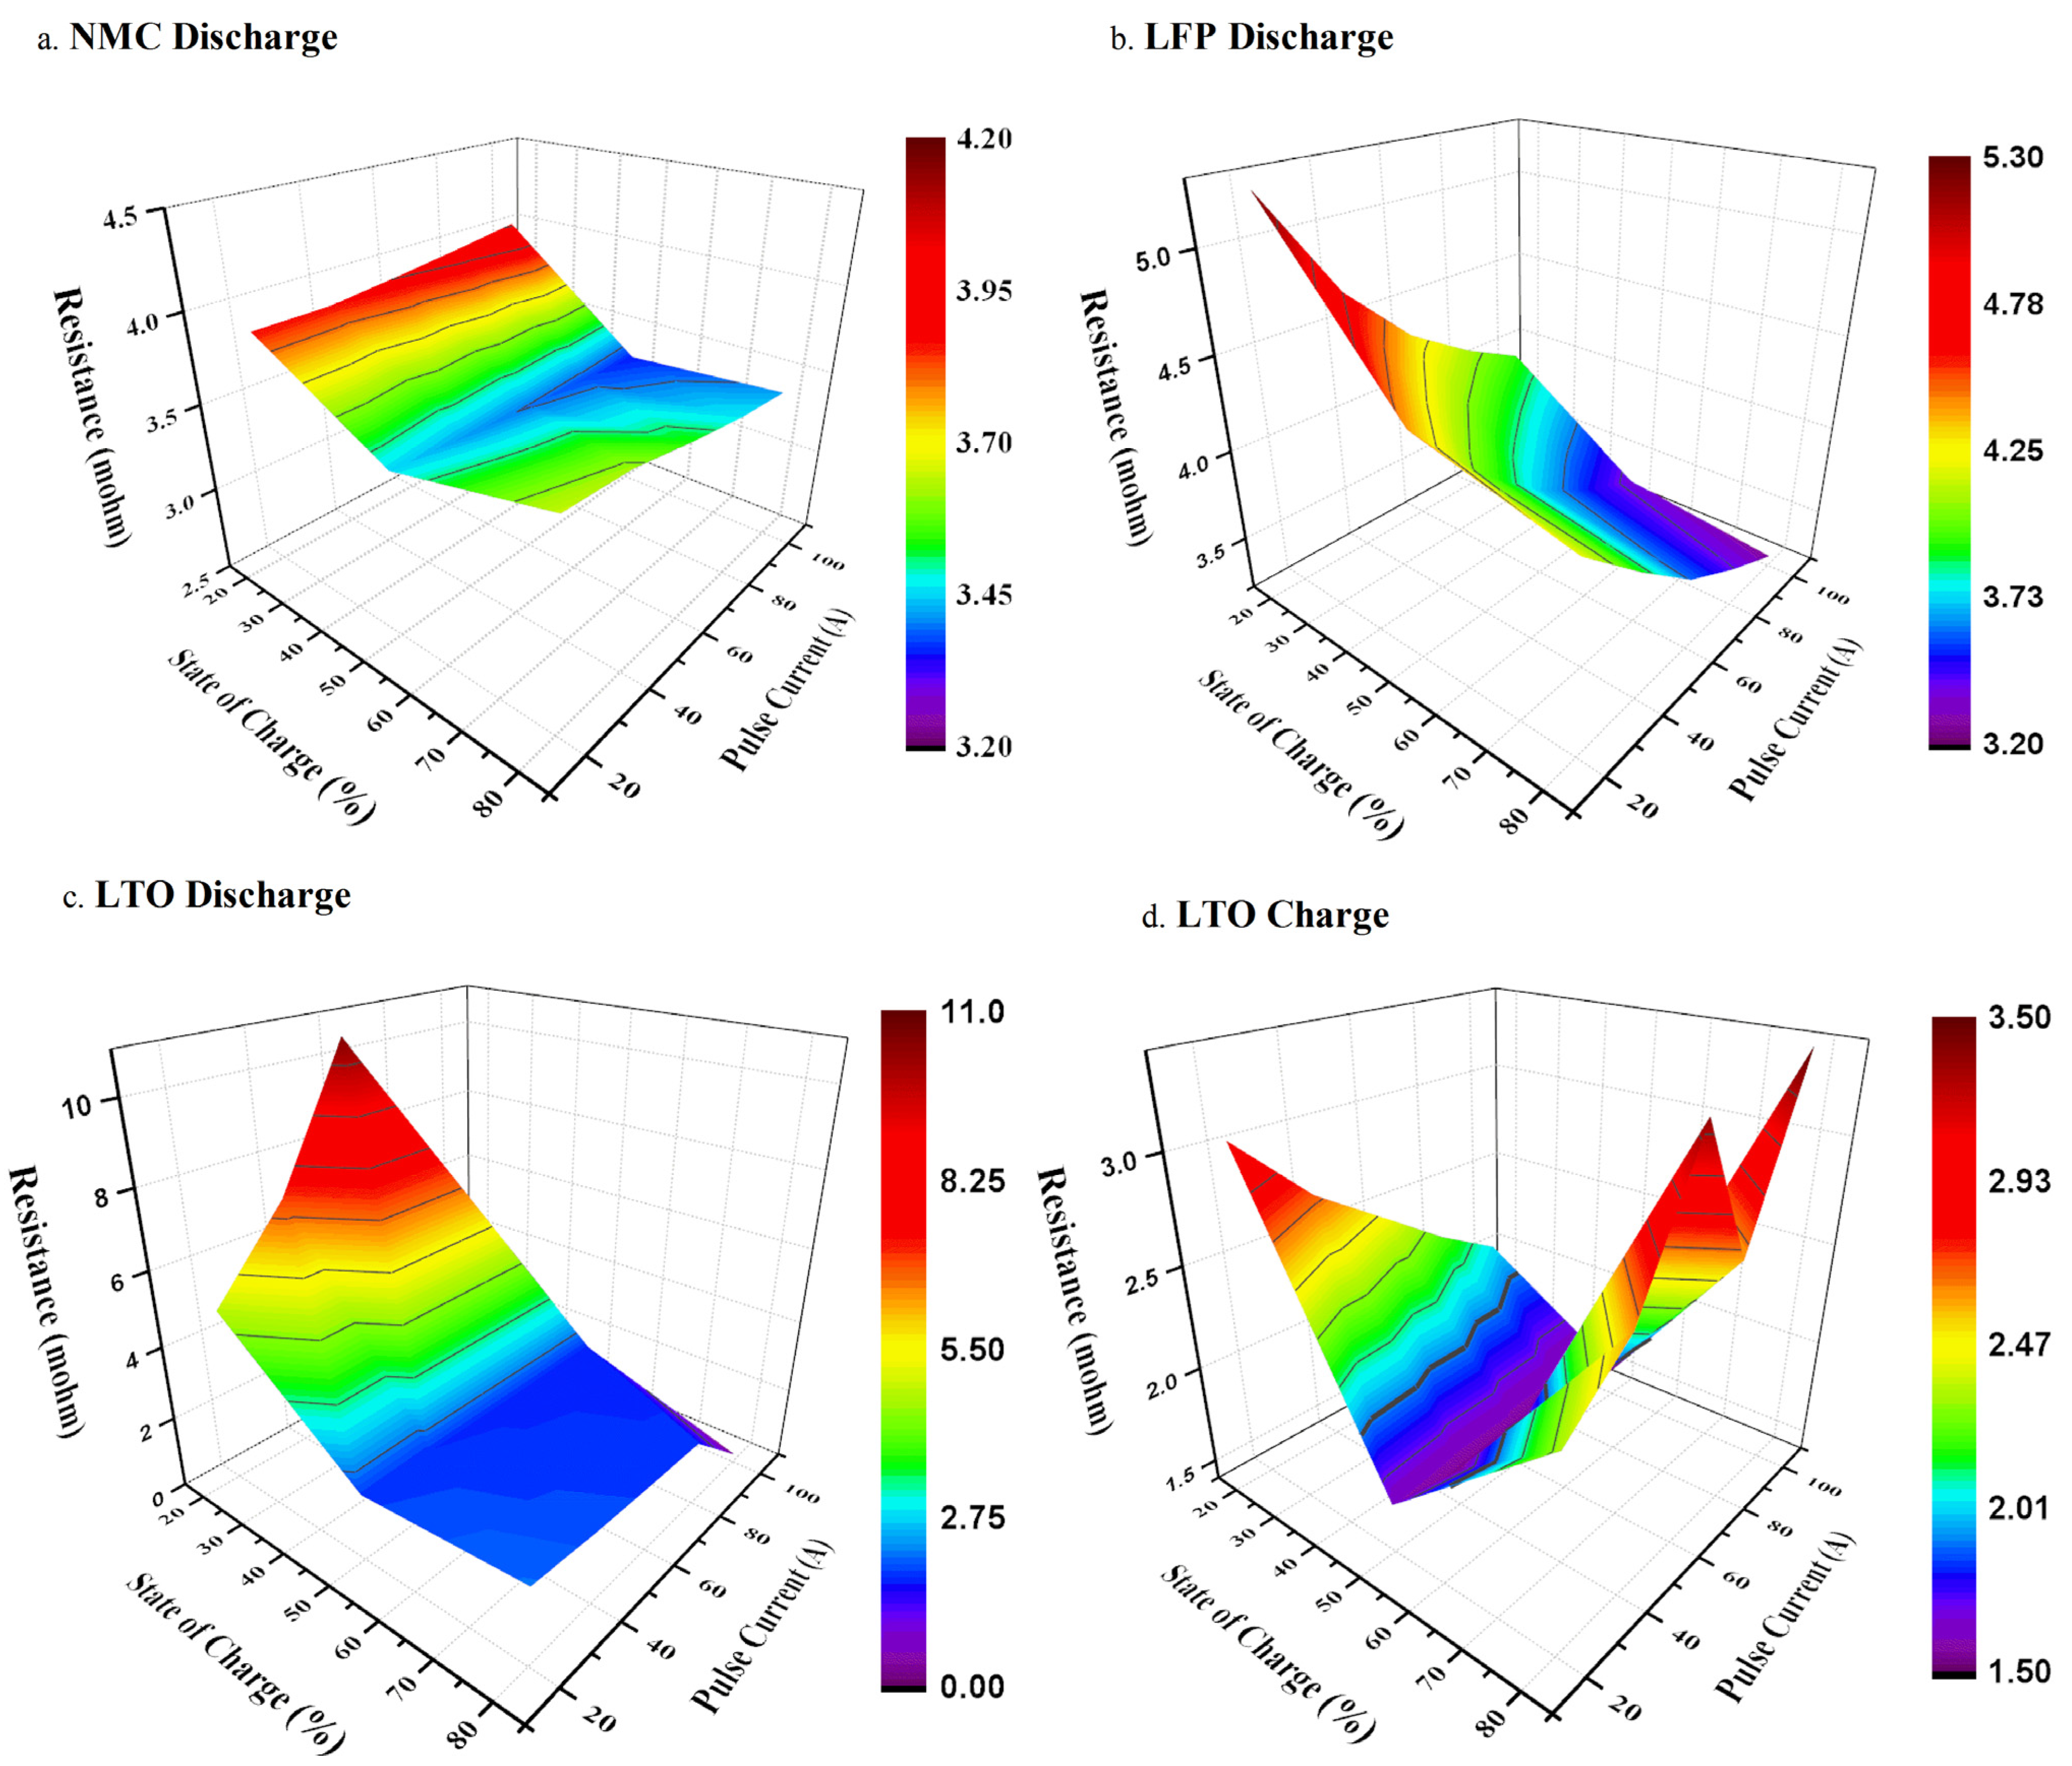
4.2. Micro Pulse Cycling

Thermistor (placed at the adjacent area of the positive tab) based surface temperature profile of the three cells showed a similar trend during high current (80 A) micro pulse cycling (see Figure 10). The inset of Figure 10 shows one complete cycle of ~1000 micro pulses of charge and discharge cycles. At the beginning, the temperature followed a sharp rise. Approximately after ~500 cycles or ~1 h, the temperature reached a steady state condition (i.e., variation <1 °C per 5 min). Micro pulse cycling was performed on all the cells, which were at an 80% SoC level. In previous work, we showed that micro pulse cycling performed at different SoC levels showed similar surface temperature profiles. Additionally, the temperature rise did not change significantly at different SoC levels [15].
Figure 10. Thermistor based surface temperature profile of NMC, LFP, and LTO cells at 80% SoC during micro pulse cycling (~1000 cycles) at 80 A. Inset shows one single micro pulse cycle.
Energies 08 08175 g010
According to the IR images (Figure 11a–c) of NMC during micro pulse cycling, it was observed that, as the cell surface temperature proceeded towards a steady state, the spatial temperature distribution over the surface became non-uniform. In addition, the upper half portion of the cell, which is near the tabs, was comparatively hotter than the other half. It is also visible from the IR images that the hottest point is mostly located near the positive tab of the cell. Local high current density at the adjacent areas of the tab, for a very short time, can be attributed to this localization of the hottest region. However, evolution of the surface temperature contour in the case of the LFP cell showed a different pattern compared to the contour of the NMC cell (Figure 11e–f). In this case, the location of the hottest region was observed around the center region of the cell throughout the cycling. This evolution pattern is more similar to the pattern during continuous charge/discharge of the LFP cell (Figure 6). Relative spatial distribution of two phases (LiFePO4/FePO4) over the electrode, which changes during the charge/discharge process, might be related to this surface temperature distribution evolution [25]. In the case of the LTO cell, at the beginning of the cycling, the hottest region appeared at the upper half of the cell (the half that contains the positive tab) (Figure 11g,h). However, at a steady state, the hottest region shifted towards the lower half of the cell (Figure 11i). It is important to mention here, that, at the steady state, the highest temperature difference over the complete surface was less than 2 °C. Variation in geometrical attributes (size and position of the tabs) and material properties (LTO based anode) can be considered in order to explain this variation compared to other to cells. Further, individual IR images contains different temperature scales in order to show the distinguishable non-uniformity of the cell surface temperature at a certain stage of operation.
Figure 11. IR images during micro pulse cycling at 80 A of NMC, LFP and LTO cells at an 80% SoC at different points of time along with the location of respective maximum temperature. (a) NMC after 2 min; (b) NMC after 7 min; (c) NMC after 50 min; (d) LFP after 2 min; (e) LFP after 7 min; (f) LFP after 50 min; (g) LTO after 2 min; (h) LTO after 7 min; (i) LTO after 50 min. Different temperature scales were used here to show the distinguishable non-uniformity of surface temperature distribution.
Energies 08 08175 g011

5. Modeling Perspective

A large number of works have been published on the modeling of Li-ion batteries [8,27,28,29,30,31,32,33]. These models were created to predict electrical, electrochemical, thermal and mechanical behavior of the battery system, either independently or in combination (coupled). According to the literature, the scale of these models may vary from the microscopic level (molecular level quantum behavior based) to the mesoscopic level (electrochemical process and transport phenomenon based) or to the macroscopic level (based on the distribution of current and voltage on electrodes) to blackbox system level (empirical, data fit based). A comprehensive review in this regard can be found in Reference [8].
Thermal models generally describe the thermal behavior in terms of heating of the battery and are built on the energy conservation of the system as follows:
ρ   C p T t = K 2 T + Q
where, T—temperature of the system domain, ρ—density of the system component, Cp—specific heat capacity, K—thermal conductivity and Q—volumetric heat source.
Depending on the level of the modeling, Equation (2) can be applied on the separate domain of the battery. For instance, for macroscopic level the battery can be divided in three domains: electrode, tab and casing. Thus, Equation (2) for the three domains will be:
ρ  C p T t = K 2 T ,   for casing as there is no heat source
ρ  C p T t = K 2 T + Q ,   for electrode and tab domain
At the boundaries of the domains heat transfer to the surroundings by radiation and convection,
Q transfer = ( h conv + h rad ) ( T - T amb )
where, hconv—convection coefficient, hrad—radiation coefficient and Tamb—ambient temperature.
Now, the variation between the existing modeling principal lies in the determination of the volumetric heat Q. Q can be formulated as:
Q = Q Ech + Q J
where, QEch and QJ are electrochemical heat and joule heating, respectively.
For modeling at the system level, considering the system as a blackbox, the right side of Equation (6) can be formulated as:
Q = ε e T ( d V ocv d T ) I + R I 2 , for the electrode domain
Q = ε t R I 2 , for the tab domain
where, εe, εt are the volume ratio factors of electrodes and tabs respectively, R is the internal resistance of the cell, R is the resistance of the tab, Vocv and I are the charge/discharge currents.
To model the non-uniformity of the heat across the area of the cell a thermal equivalent circuit model can be assumed in the different direction of the cell. The circuit generally consists of several thermal resistance and thermal capacitance network. Through electrical characterization, relative amount of heat generation in different direction can be can be modeled. For instance, in Reference [9], a first order Cauer model was considered and found in fair agreement between the modeled and real thermal behaviors. Due to the simplicity and low number of parameters, this modeling is efficient in terms of computational power. As shown previously, the LTO cell has a lesser degree of temperature non-uniformity compared to the NMC cell and the LFP cell, a thermal equivalent circuit model can be very effective in this case. However, as the model is built based on characterization data at a sets of test conditions, the model accuracy can be low in dynamic conditions, especially in the case of a cell with severe temperature non-uniformity, as the NMC and LFP cells presented above.
In order to overcome the accuracy limitations, the model can be extended to macroscopic level, taking into account the potential gradient over the surface of the electrodes [29,30,33]. In this model formulation, charge balance can be applied to a pair of electrode as:
σ j 2 V j + J n δ j = 0 [ j = positive (p) , negative (n) ]
where, σj is the electrical conductivity of the current collector σ, Vj is the potential distribution on the current collector, J is the transvers current density perpendicular to the electrode surface, n is the unit normal vector, δj is the thickness of the current collector and the subscript j corresponds to the positive and negative electrode. In this case, Equations (6) and (7) become as follows:
Q = J pe s ne ) T d V ocv d T + J pe s ne ) ( V ocv V p + V n ) + σ j  ( V j ) 2 δ j
where, δpe, δs and δne are the thickness of positive electrode, separator and negative electrode respectively.
The transverse current density can be expressed in terms of open circuit voltage and voltage of the electrodes [29] as:
J = V ocv ( V p - V n ) R
Here, Vocv and R can be determined experimentally. With this model, the thermal behavior of any pouch type cell can be modeled with very high accuracy during constant charge or discharge. However, against dynamic current profile such as micro cycle as presented previously, this model may show less accuracy. In order to overcome this limitation, the non-faradic component of the transverse current can be taken into account. As suggested by Taheri et al. [34], the transvers current density can be expressed as:
J = J faradic + J non-faradic = Y ( V p - V n - U ) + C dl d ( V p V n ) d t
where, in the faradic component, Y and U are fitting parameters and expressed in terms of depth of discharge (DoD). Additionally, in the non-faradic component, Cdl is the lumped double layer capacitance.
As presented above, a macroscopic level modeling, assumption was made that electrochemical reactions are homogenous over the electrode area. At the mesoscopic level, modeling the inhomogeneity of electrochemical reaction parameters, such as charge balance in the liquid and solid phases, can be incorporated to improve the accuracy of the model [30]. For instance, in order to model the shifting of the hottest point at the end of a continuous discharge process, a mesoscopic electrochemical-thermal model can be incorporated for higher accuracy. However, this kind of modeling is computationally challenging. Moreover, the parameters needed for the model are very difficult to determine.

6. Conclusions

Battery cell surface temperature distribution under high current continuous charge and discharge up to 100 A, as well as under high current micro-pulse cycling at 80 A, were studied for three different commercial pouch type cells: NMC cathode based 20 Ah cell, LFP cathode based 14 Ah cell, and LTO anode based 5 Ah cells, by using both contact thermistor measurements and infrared thermography. Variations in temperature profiles between the different types were observed during continuous charge/discharge. However, the spatial distribution patterns of the surface temperature were observed to be similar in the case of these three types of cells. At the beginning of the continuous charge/discharge test, the hottest region appeared near the positive tab but as the process progressed towards the end, the temperature distribution became more uniform with the hottest region located at the center region of the cell’s surface. Comprised of a titanate based anode, the LTO cell showed a very low temperature rise, which proved it as the best option from the thermal safety point of view. On the other hand, during micro pulse cycling, a similar trend of the thermistor based temperature profiles was observed. According to this trend, the temperature rose sharply until a common point in time and became steady without any significant rise until the end of the cycling. The location of the hottest region was observed near the positive tab throughout the micro pulse cycling in the case of the NMC cell. The pattern of the surface temperature distribution throughout the micro pulse cycling in the case of the LFP cell was similar to the pattern observed during continuous charge and discharge, showing the hottest region in the center area of the cell. While in the case of the LTO cell, although the hottest region was located at the upper half (towards positive tab) at the beginning of cycling, it shifted towards the area adjacent to the negative tab of the cell at the steady state.
Non-uniformity of the surface temperature cannot be attributed to a single independent factor. It is a result of a combined influence of electrochemical properties, such as the inhomogeneity of the reactions across the electrode, of electrical properties, such as localization of current density and SoC, and of physical properties, such as the cell size and the geometry, and locations of the tabs. In most cases those factors are interdependent. This makes it very cumbersome to point out the most influencing factor. In order to model the non-uniformity of the cell temperature, several modeling methods have been adopted by researchers. These methods have been discussed in this work. Moreover, the effectiveness and limitations of these methods were concisely discussed from the point of view of the thermal behavior of the investigated cells.
Nevertheless, as temperature is one of the major factors in battery cell ageing, non-uniformity of the temperature distribution may lead to imbalanced ageing, and, ultimately, may lead to the degradation and imbalance of cell performance. In order to avoid such undesirable behaviors, improvements needs to be made at both the cell level and pack level. At the cell level, material properties and physical properties can be improved, whereas at the pack level, improvements in cooling architecture can be incorporated.

Acknowledgments

This research has been made possible, thanks to the research project “Battle” and was funded by the Flemish Agency for Innovation by Science and Technology (IWT130019). Further, we acknowledge Flanders Make for the support to our research team.

Author Contributions

Shovon Goutam set up and conducted all the experimental work and analysis and wrote the manuscript. Jean-Marc Timmermans designed and supervised the experimental work, the analysis and writing of the manuscript. Noshin Omar, Peter Van den Bossche and Joeri Van Mierlo provided guidance and technical advice.

Conflicts of Interest

The authors declare no conflict of interest.

References

  1. International Energy Agency (IEA). Technology Roadmap: Electric and Plug-in Hybrid Electric Vehicles; IEA: Paris, France, 2011. [Google Scholar]
  2. Scrosati, B.; Garche, J. Lithium batteries: Status, prospects and future. J. Power Sources 2010, 195, 2419–2430. [Google Scholar] [CrossRef]
  3. Omar, N.; Daowd, M.; van den Bossche, P.; Hegazy, O.; Smekens, J.; Coosemans, T.; van Mierlo, J. Rechargeable Energy Storage Systems for Plug-in Hybrid Electric Vehicles—Assessment of Electrical Characteristics. Energies 2012, 5, 2952–2988. [Google Scholar] [CrossRef]
  4. Barré, A.; Deguilhem, B.; Grolleau, S.; Gérard, M.; Suard, F.; Riu, D. A review on lithium-ion battery ageing mechanisms and estimations for automotive applications. J. Power Sources 2013, 241, 680–689. [Google Scholar] [CrossRef]
  5. Omar, N.; Monem, M.A.; Firouz, Y.; Salminen, J.; Smekens, J.; Hegazy, O.; Gaulous, H.; Mulder, G.; van den Bossche, P.; Coosemans, T.; et al. Lithium iron phosphate based battery—Assessment of the aging parameters and development of cycle life model. Appl. Energy 2014, 113, 1575–1585. [Google Scholar]
  6. Bandhauer, T.M.; Garimella, S.; Fuller, T.F. A critical review of thermal issues in lithium-ion batteries. J. Electrochem. Soc. 2011, 158. [Google Scholar] [CrossRef]
  7. Van den Bossche, P.; Omar, N.; Al Sakka, M.; Samba, A.; Gualous, H.; van Mierlo, J. The challenge of PHEV battery design and the opportunities of electrothermal modeling. In Lithium-Ion Batteries; Pistoia, G., Ed.; Elsevier: Amsterdam, The Netherlands, 2014; pp. 249–271. [Google Scholar]
  8. Ramadesigan, V.; Northrop, P.W.C.; De, S.; Santhanagopalan, S.; Braatz, R.D.; Subramanian, V.R. Modeling and simulation of lithium-ion batteries from a systems engineering perspective. J. Electrochem. Soc. 2012, 159, R31–R45. [Google Scholar] [CrossRef]
  9. Samba, A.; Omar, N.; Gualous, H.; Firouz, Y.; van den Bossche, P.; van Mierlo, J.; Boubekeur, T.I. Development of an advanced two-dimensional thermal model for large size lithium-ion pouch cells. Electrochim. Acta 2014, 117, 246–254. [Google Scholar] [CrossRef]
  10. Strobridge, F.C.; Orvananos, B.; Croft, M.; Yu, H.-C.; Robert, R.; Liu, H.; Zhong, Z.; Connolley, T.; Drakopoulos, M.; Thornton, K.; et al. Mapping the inhomogeneous electrochemical reaction through porous LiFePO4-electrodes in a standard coin cell battery. Chem. Mater. 2015, 27, 2374–2386. [Google Scholar]
  11. Zhao, W.; Luo, G.; Wang, C.-Y. Effect of tab design on large-format Li-ion cell performance. J. Power Sources 2014, 257, 70–79. [Google Scholar] [CrossRef]
  12. Eddahech, A.; Briat, O.; Vinassa, J.-M. Thermal characterization of a high-power lithium-ion battery: Potentiometric and calorimetric measurement of entropy changes. Energy 2013, 61, 432–439. [Google Scholar] [CrossRef]
  13. Robinson, J.B.; Darr, J.A.; Eastwood, D.S.; Hinds, G.; Lee, P.D.; Shearing, P.R.; Taiwo, O.O.; Brett, D.J.L. Non-uniform temperature distribution in Li-ion batteries during discharge—A combined thermal imaging, X-ray micro-tomography and electrochemical impedance approach. J. Power Sources 2014, 252, 51–57. [Google Scholar] [CrossRef]
  14. Veth, C.; Dragicevic, D.; Merten, C. Thermal characterizations of a large-format lithium ion cell focused on high current discharges. J. Power Sources 2014, 267, 760–769. [Google Scholar] [CrossRef]
  15. Goutam, S.; Timmermans, J.M.; Omar, N.; van den Bossche, P.; van Mierlo, J.; Rodriguez, L.; Nieto, N.; Swierczynski, M. Surface temperature evolution and the location of maximum and average surface temperature of a lithium-ion pouch cell under variable load profiles. In Proceedings of the EEVC European Electric Vehicle Congress EEVC-2014, Brussels, Belgium, 3–5 December 2014.
  16. Samba, A.; Omar, N.; Gualous, H.; Capron, O.; van den Bossche, P.; van Mierlo, J. Impact of tab location on large format lithium-ion pouch cell based on fully coupled tree-dimensional electrochemical-thermal modeling. Electrochim. Acta 2014, 147, 319–329. [Google Scholar] [CrossRef]
  17. Lin, C.; Xu, S.; Chang, G.; Liu, J. Experiment and simulation of a LiFePO4 battery pack with a passive thermal management system using composite phase change material and graphite sheets. J. Power Sources 2015, 275, 742–749. [Google Scholar] [CrossRef]
  18. Karimi, G.; Li, X. Thermal management of lithium-ion batteries for electric vehicles. Int. J. Energy Res. 2013, 37, 13–24. [Google Scholar] [CrossRef]
  19. Mulder, G.; Omar, N.; Pauwels, S.; Meeus, M.; Leemans, F.; Verbrugge, B.; de Nijs, W.; van den Bossche, P.; Six, D.; van Mierlo, J. Comparison of commercial battery cells in relation to material properties. Electrochim. Acta 2013, 87, 473–488. [Google Scholar] [CrossRef]
  20. Takano, K.; Saito, Y.; Kanari, K.; Nozaki, K.; Kato, K.; Negishi, A.; Kato, T. Entropy change in lithium ion cells on charge and discharge. J. Appl. Electrochem. 2002, 32, 251–258. [Google Scholar] [CrossRef]
  21. Jalkanen, K.; Aho, T.; Vuorilehto, K. Entropy change effects on the thermal behavior of a LiFePO4/graphite lithium-ion cell at different states of charge. J. Power Sources 2013, 243, 354–360. [Google Scholar] [CrossRef]
  22. Viswanathan, V.V.; Choi, D.; Wang, D.; Xu, W.; Towne, S.; Williford, R.E.; Zhang, J.-G.; Liu, J.; Yang, Z. Effect of entropy change of lithium intercalation in cathodes and anodes on Li-ion battery thermal management. J. Power Sources 2010, 195, 3720–3729. [Google Scholar] [CrossRef]
  23. Li, Z.; Zhang, J.; Wu, B.; Huang, J.; Nie, Z.; Sun, Y.; An, F.; Wu, N. Examining temporal and spatial variations of internal temperature in large-format laminated battery with embedded thermocouples. J. Power Sources 2013, 241, 536–553. [Google Scholar] [CrossRef]
  24. Orikasa, Y.; Maeda, T.; Koyama, Y.; Murayama, H.; Fukuda, K.; Tanida, H.; Arai, H.; Matsubara, E.; Uchimoto, Y.; Ogumi, Z. Transient phase change in two phase reaction between LiFePO4 and FePO4 under battery operation. Chem. Mater. 2013, 25, 1032–1039. [Google Scholar] [CrossRef]
  25. Robert, D.; Douillard, T.; Boulineau, A.; Brunetti, G.; Nowakowski, P.; Venet, D.; Bayle-Guillemaud, P.; Cayron, C. Multiscale phase mapping of LiFePO4-based electrodes by transmission electron microscopy and electron forward scattering diffraction. ACS Nano 2013, 7, 10887–10894. [Google Scholar] [CrossRef] [PubMed]
  26. Chen, Z.; Belharouak, I.; Sun, Y.-K.; Amine, K. Titanium-based anode materials for safe lithium-ion batteries. Adv. Funct. Mater. 2013, 23, 959–969. [Google Scholar] [CrossRef]
  27. Kwon, K.H.; Shin, C.B.; Kang, T.H.; Kim, C.S. A two-dimensional modeling of a lithium-polymer battery. J. Power Sources 2006, 163, 151–157. [Google Scholar] [CrossRef]
  28. Li, J.; Cheng, Y.; Ai, L.; Jia, M.; Du, S.; Yin, B.; Woo, S.; Zhang, H. 3D simulation on the internal distributed properties of lithium-ion battery with planar tabbed configuration. J. Power Sources 2015, 293, 993–1005. [Google Scholar] [CrossRef]
  29. Wu, B.; Li, Z.; Zhang, J. Thermal design for the pouch-type large-format lithium-ion batteries: I. Thermo-electrical modeling and origins of temperature non-uniformity. J. Electrochem. Soc. 2014, 162, 181–191. [Google Scholar]
  30. Guo, M.; White, R.E. A distributed thermal model for a Li-ion electrode plate pair. J. Power Sources 2013, 221, 334–344. [Google Scholar] [CrossRef]
  31. Gerver, R.E.; Meyers, J.P. Three-dimensional modeling of electrochemical performance and heat generation of lithium-ion batteries in tabbed planar configurations. J. Electrochem. Soc. 2011, 158, 835–843. [Google Scholar] [CrossRef]
  32. Yazdanpour, M.; Taheri, P.; Mansouri, A.; Bahrami, M. A distributed analytical electro-thermal model for pouch-type lithium-ion batteries. J. Electrochem. Soc. 2014, 161, 1953–1963. [Google Scholar] [CrossRef]
  33. Yi, J.; Lee, J.; Shin, C.B.; Han, T.; Park, S. Modeling of the transient behaviors of a lithium-ion battery during dynamic cycling. J. Power Sources 2015, 277, 379–386. [Google Scholar] [CrossRef]
  34. Taheri, P.; Mansouri, A.; Yazdanpour, M.; Bahrami, M. Theoretical analysis of potential and current distributions in planar electrodes of lithium-ion batteries. Electrochim. Acta 2014, 133, 197–208. [Google Scholar] [CrossRef]

