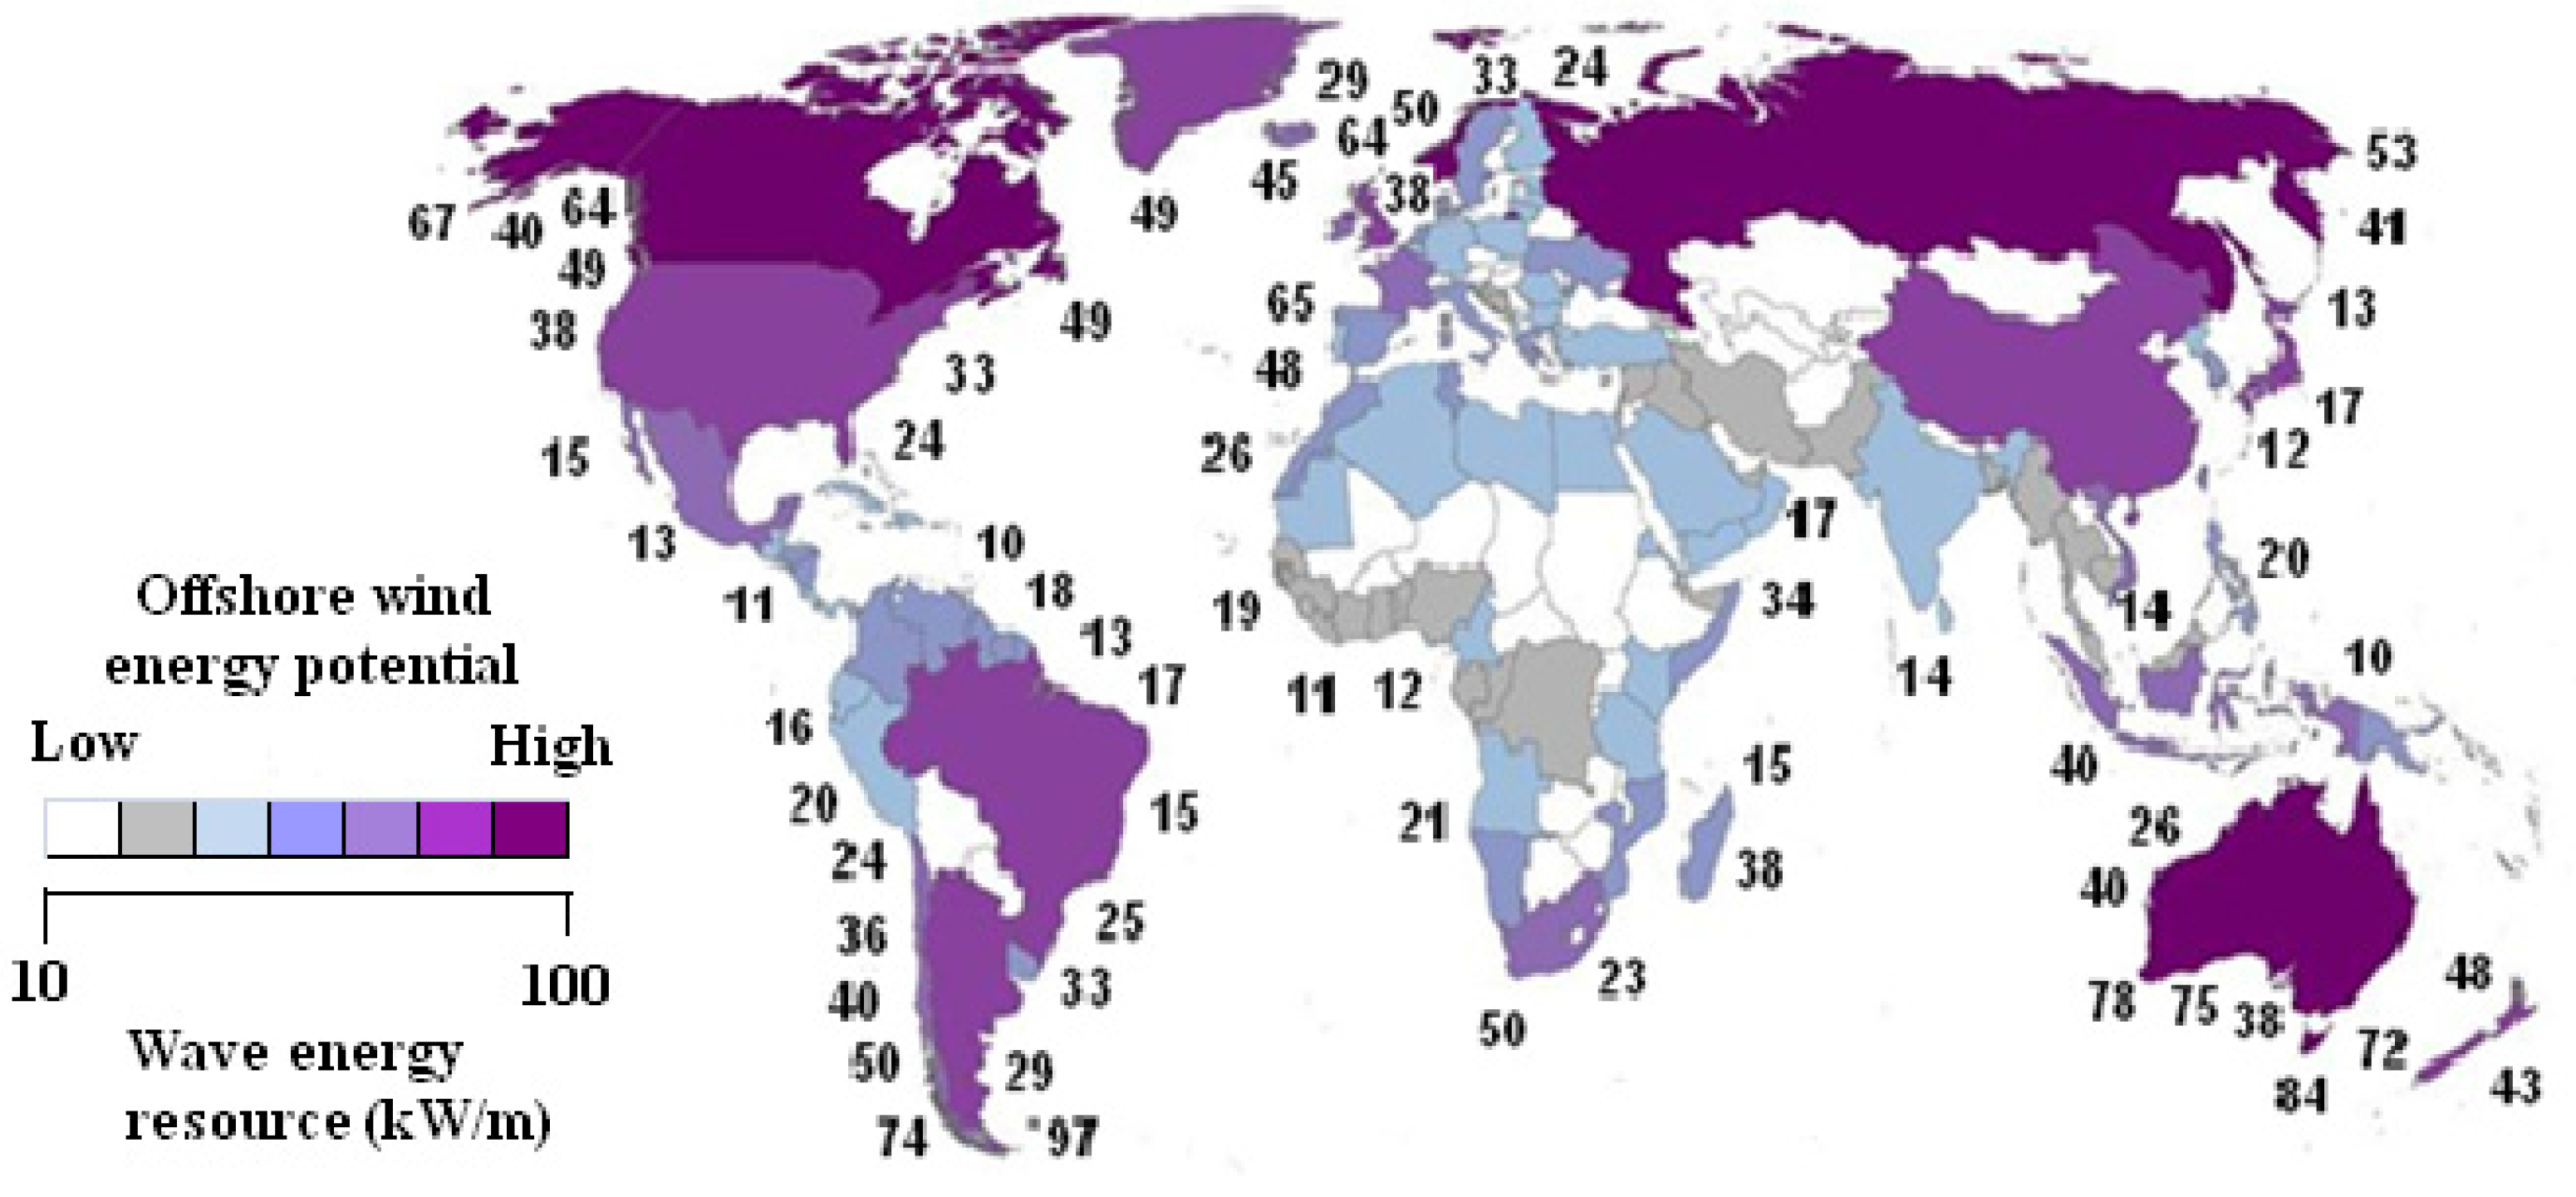
Figure 3.
Global distribution of offshore wind and wave energy resources. The former is reflected through the colour scale and the latter by means of the energy density (kWm−1): 10 kWm−1 is the minimum needed for a commercial scale wave energy project.
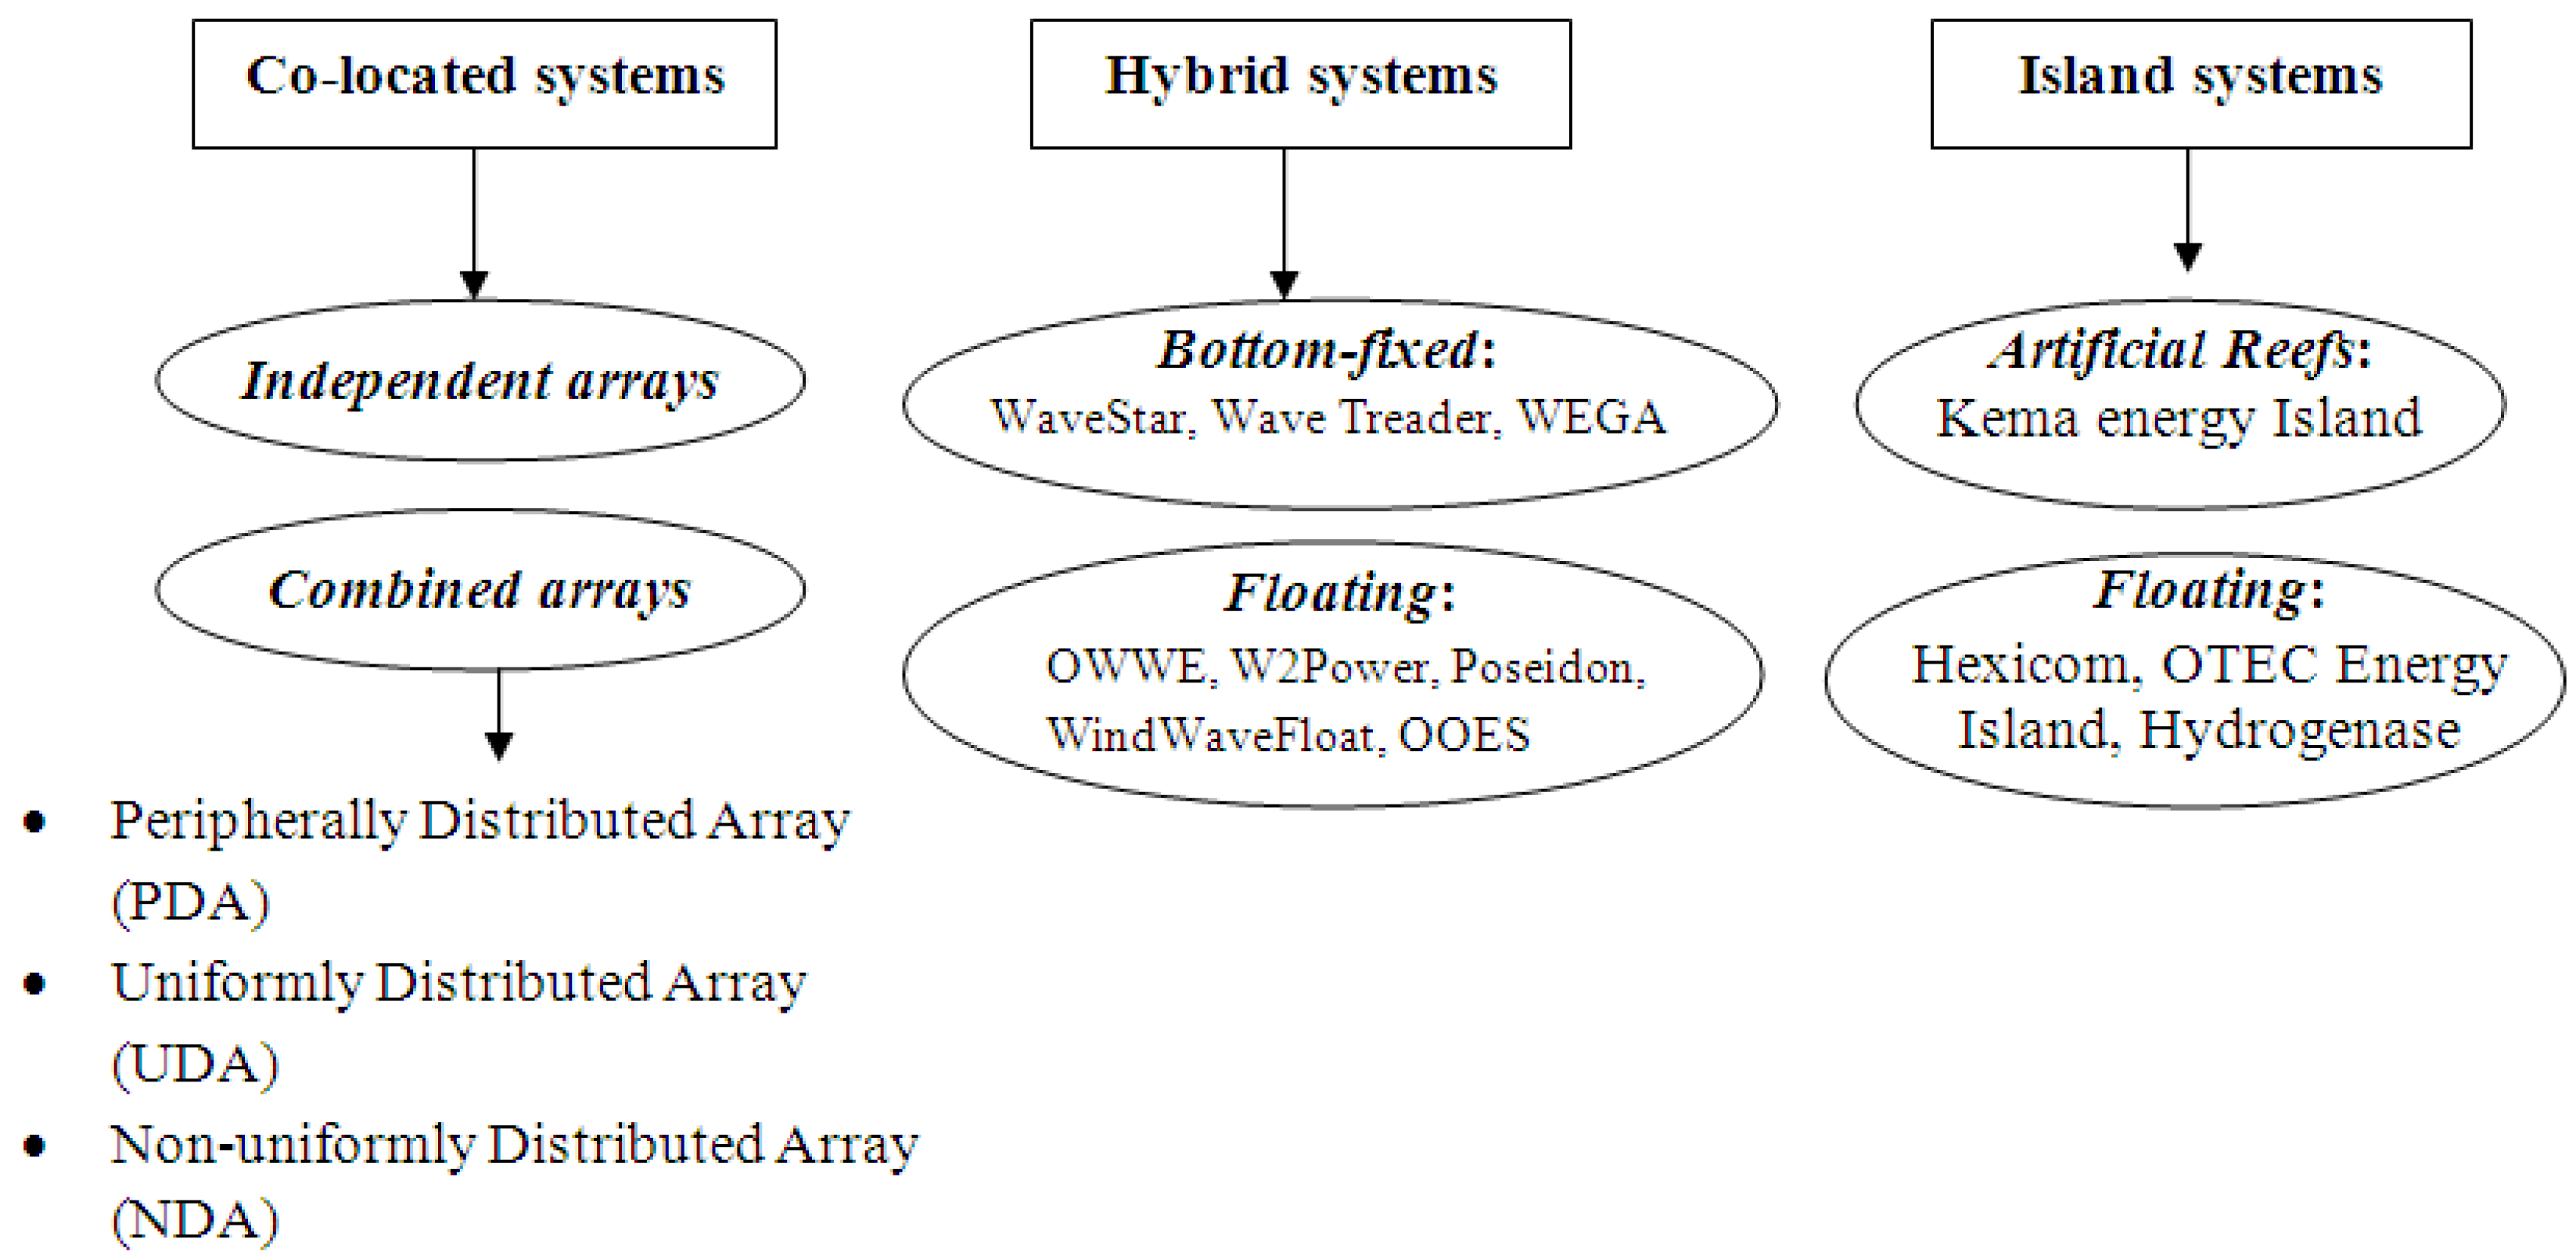
There are different possibilities for a combined wave and wind array [
53]: (i) co-located wind-wave energy; (ii) hybrid converters; and (iii) energy islands (
Figure 4). This work focuses on the former, co-located systems [
87,
88], since they are the simplest option at the present stage of development of wave and offshore wind technologies [
30,
89,
90]. These systems combine an offshore wind farm with a WEC array with independent foundation systems but sharing: The same marine area, grid connection, O & M equipment and personnel, port structures,
etc. [
51].
Figure 4.
Classification of combined wave-wind technologies.
There are many synergies that could be exploitable to overcome some of the barriers that marine energies could present to entry into the market. First of all, important cost savings could be achieved during the setup of the energy farms because of common elements and coordinated strategies [
54,
91,
92,
93]. The largest savings would be achieved in the electrical connection, since the offshore station and the export cable can be the same for both installations. When hybrid technology was developed, important cost reductions in the substructure foundation system would be achieved as hybrid wave converter systems share the same substructure or foundation with the offshore wind turbine [
89,
91]. Moreover, the cost of O & M tasks can be reduced in co-located farms since the scheduled maintenance of wave and wind energy can be organised to be done at the same time or in continuous length of time [
53]. A recent study [
94] achieved cost savings around 25% in the capital costs and up to 14% in the maintenance costs of combined wave and wind energy farms. Moreover, offshore developers pay for leases according to the area occupied, so covering the same area with two sources of electricity generation reduces these costs.
Besides, the combination of two different technologies harnessing different sources of energy at a single array site will increase the global energy yield per array unit and thereby contribute to a more sustainable use of the natural resources [
53]. In this sense, combined energy farms would reduce the feasible environmental impact of these offshore energy installations since the affected area will be smaller than in the case of wave and wind farms as separate installations. Furthermore, recent studies have concluded that introducing WECs in offshore wind energy parks compensates the power variability and, thus, smoothes the power output [
87,
95,
96,
97]. This way, balancing cost could be reduced up to 35% [
98]. Moreover, a recent work [
99] found that waves and the power output of WECs are 23% and 35%, respectively, more predictable than winds and the wind turbine power output. Finally, wave energy developers can eliminate part of the financial risk in this unproven technology by coordinating with wind projects. As a consequence, the learning curve effect would lead to faster reductions in the cost of wave energy, enhancing its competitiveness.
Enlarged Weather Windows
In addition to the above benefits, other technological synergies would be realised through combined wave and wind energy farms, such as the so-called
shadow effect. The operational limit of workboats for O & M tasks—the most cost-effective access system—is a significant wave height of 1.5 m [
100,
101]. When this threshold is exceeded delays in maintenance and repairs ensue, and the resulting downtime causes earnings to be missed. Co-located WECs deployed at the periphery of the wind farm could produce a shielding effect over the offshore wind farm that enlarges the weather windows for O & M. This increase in the accessibility to the wind turbines brings in reduced downtime and, thus, in considerable cost savings—around 25% of the O & M costs that would lead to an reduction in the overall project cost of energy of 2.3 percent [
102]. The analysis of the shadow effect provided by co-located WECs at the periphery of a wind farm was investigated in previous studies [
55,
103,
104] through four real wind farms currently in operation, whose locations and characteristics are presented in
Figure 5 and
Table 5, respectively. Comparing this information, it can be stated that these four wind farms encompass a wide variety of characteristics on which to establish a comparative analysis. The third-generation numerical wave model SWAN (Simulating WAves Nearshore) was used to simulate wave propagation. In all simulations, high-resolution results were obtained as the model was implemented by grids with resolution higher than 40 m. Both WECs and wind turbines were represented in the model by a transmission coefficient, whose value can vary from 0% (
i.e., 100% of incident wave energy absorbed) to 100% [
17,
18,
20,
27,
30,
105,
106,
107,
108].
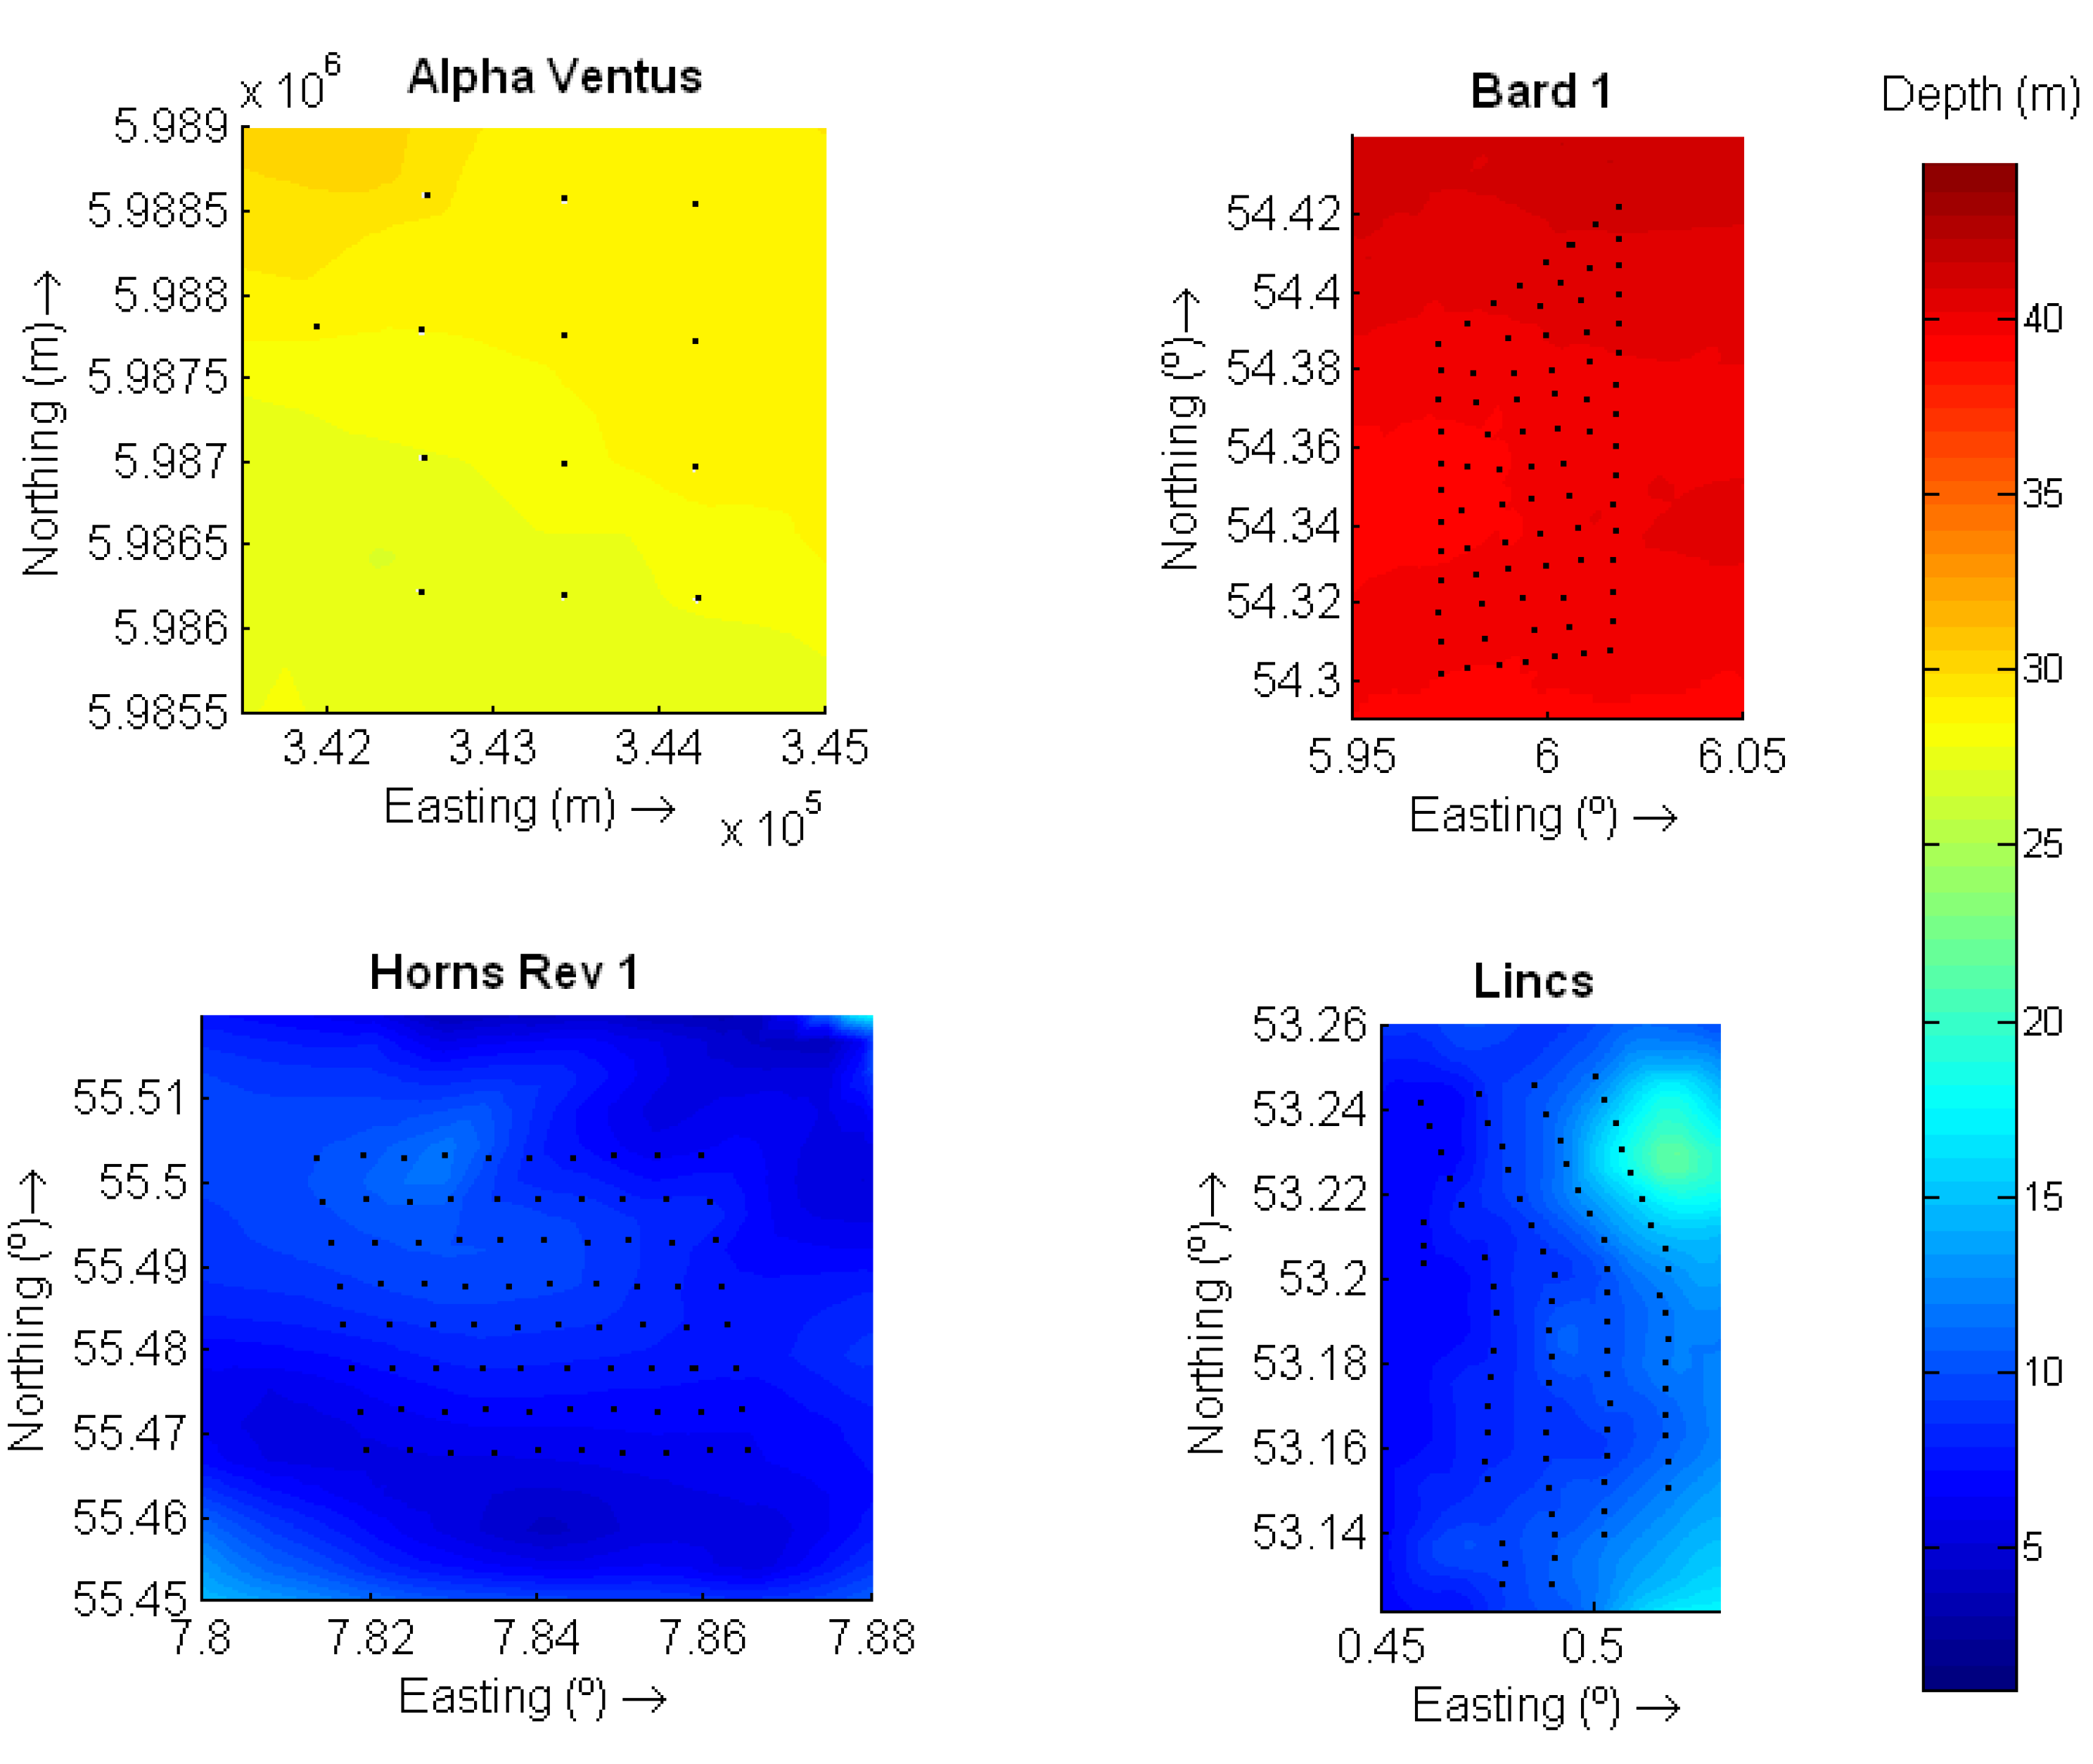
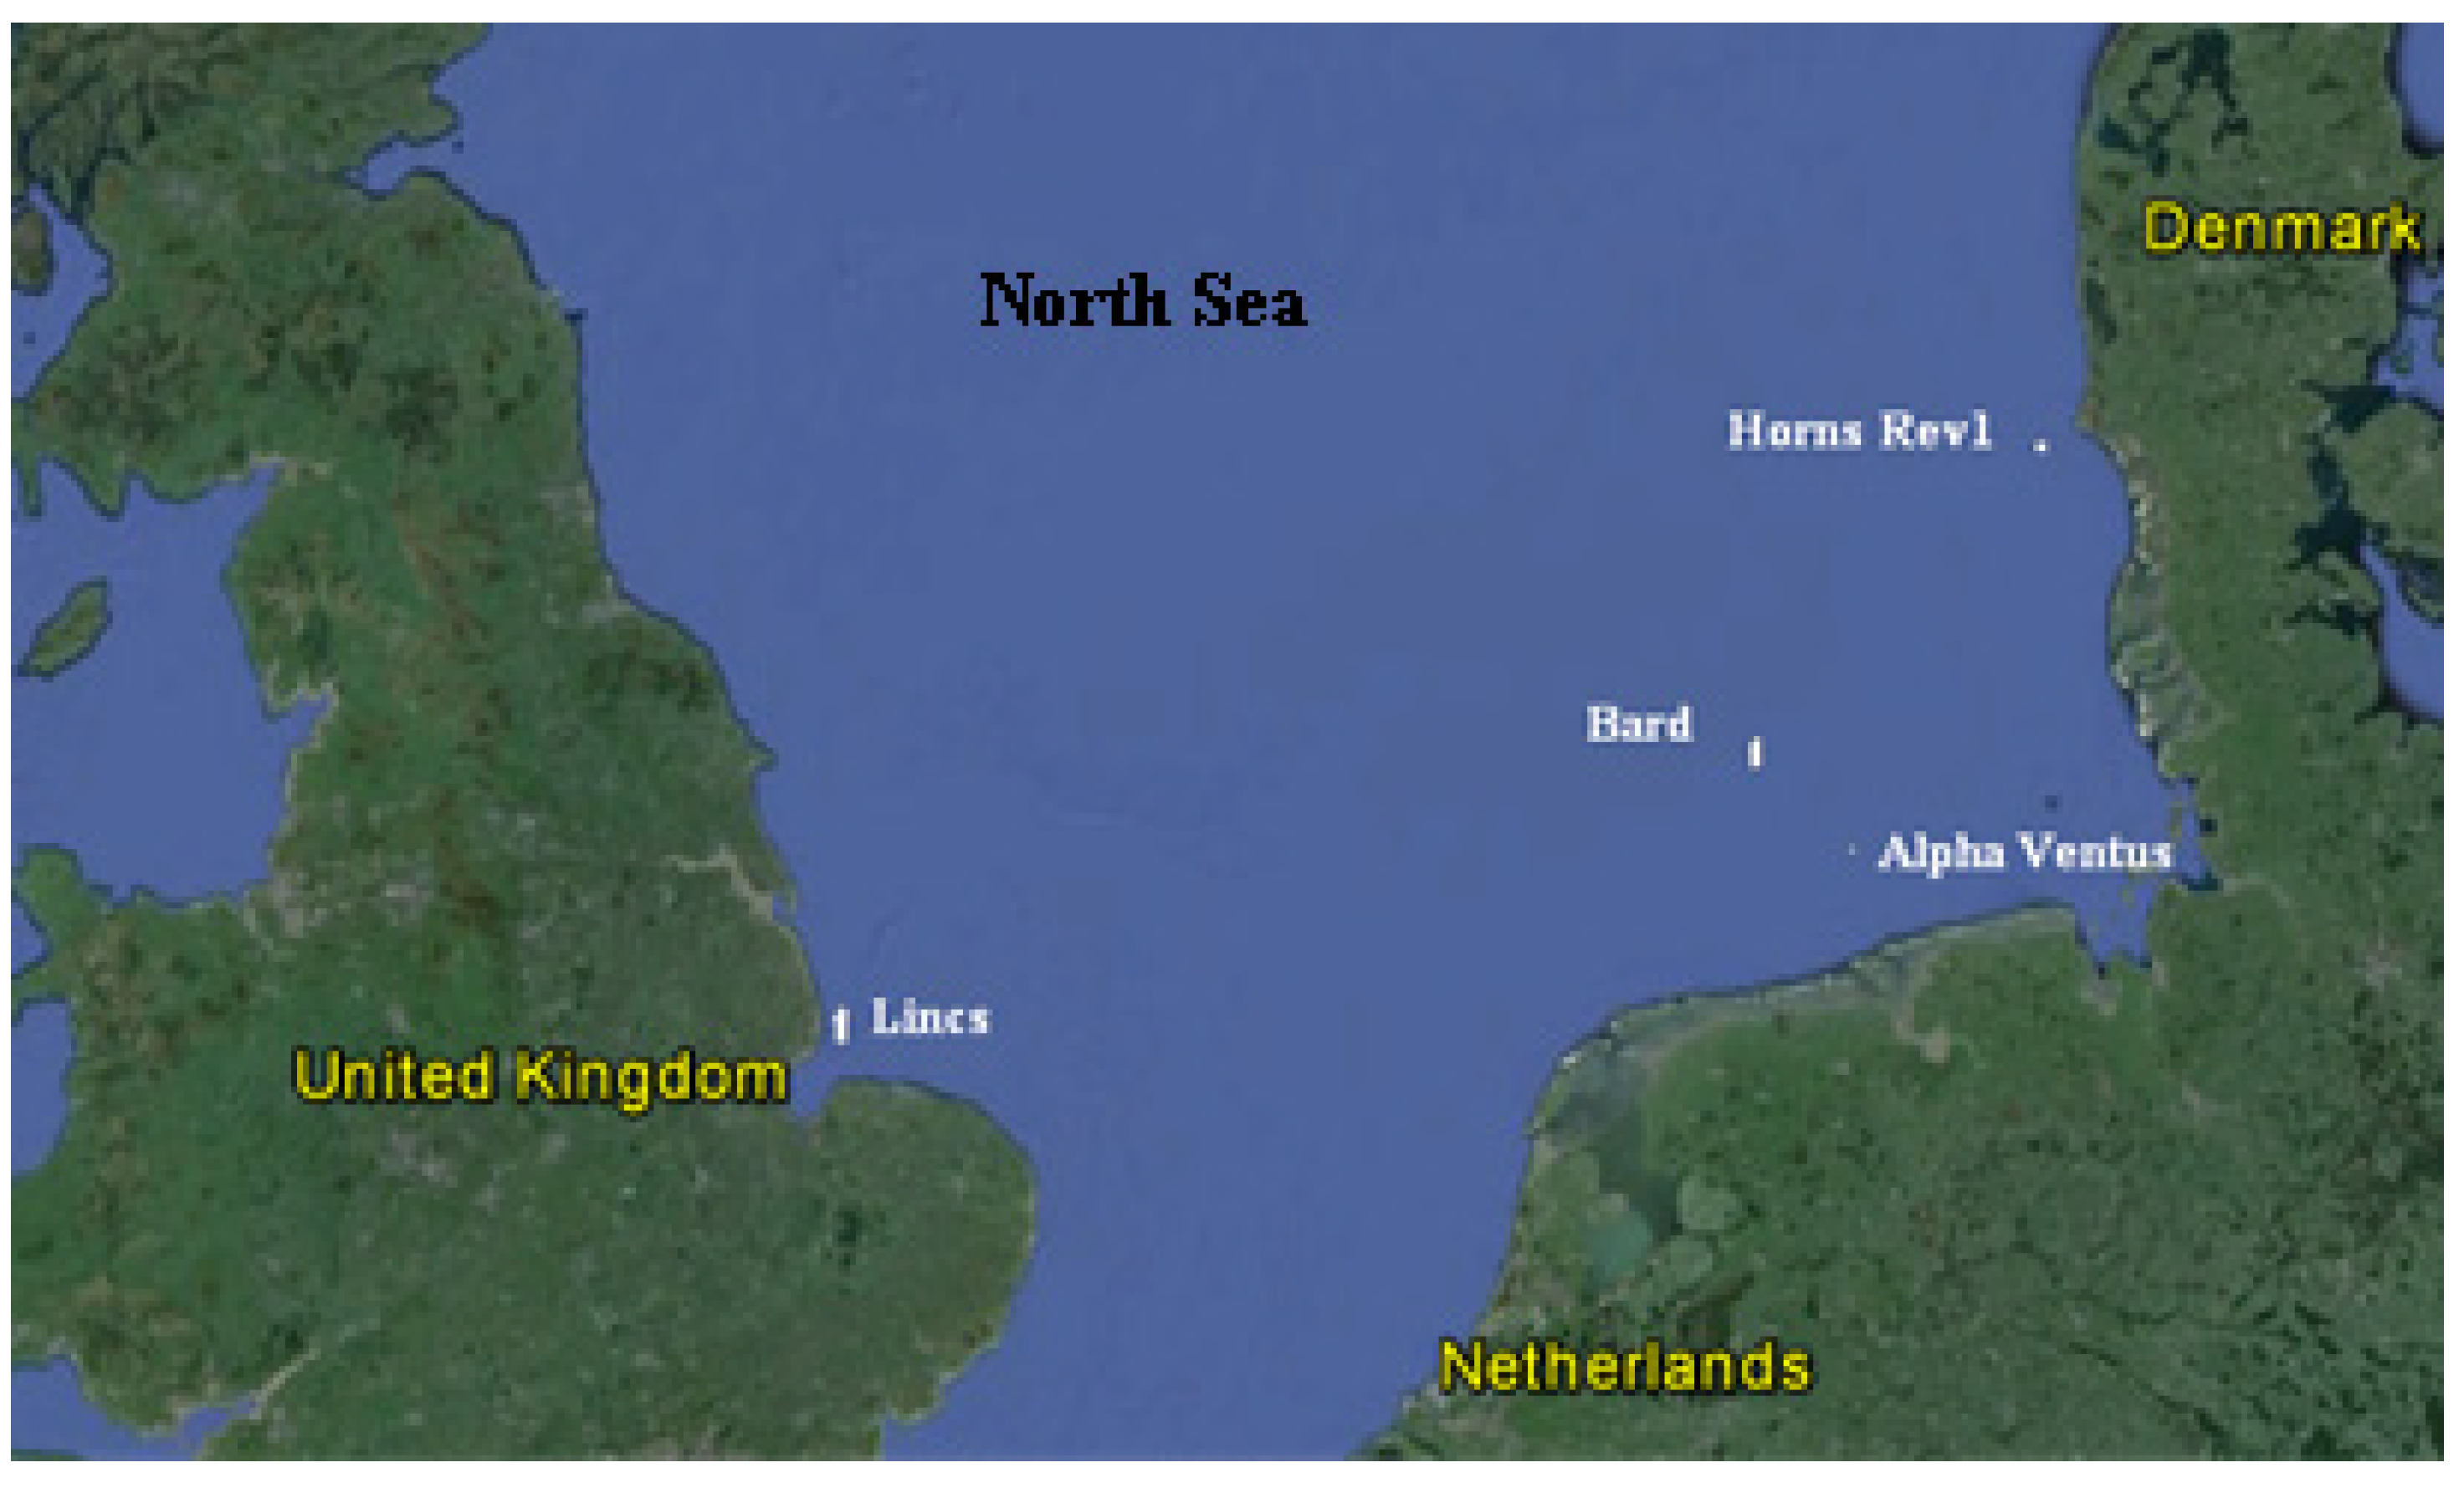
Figure 5.
Location of the four wind farms: Alpha Ventus, Bard 1, Horns Rev 1 and Lincs. (Reprinted with permission from [
103]. Copyright 2015 Elsevier Science Ltd.).
Figure 5.
Location of the four wind farms: Alpha Ventus, Bard 1, Horns Rev 1 and Lincs. (Reprinted with permission from [
103]. Copyright 2015 Elsevier Science Ltd.).
Table 5.
Characteristics of the offshore wind farms. (Reprinted with permission from [
103]. Copyright 2015 Elsevier Science Ltd.)
Table 5.
Characteristics of the offshore wind farms. (Reprinted with permission from [103]. Copyright 2015 Elsevier Science Ltd.)
| Wind Farm | Depth (m) | Distance from Shore (km) | Installed Capacity (MW) | Number Turbines | Area (km2) | |
|---|
| Alpha Ventus | 33–45 | 56 | 60 | 12 | 4 | |
| Bard 1 | 39–41 | 90–101 | 400 | 80 | 59 | |
| Horns Rev 1 | 6–14 | 14–20 | 160 | 80 | 21 | |
| Lincs | 8–16 | 8 | 270 | 75 | 41 | |
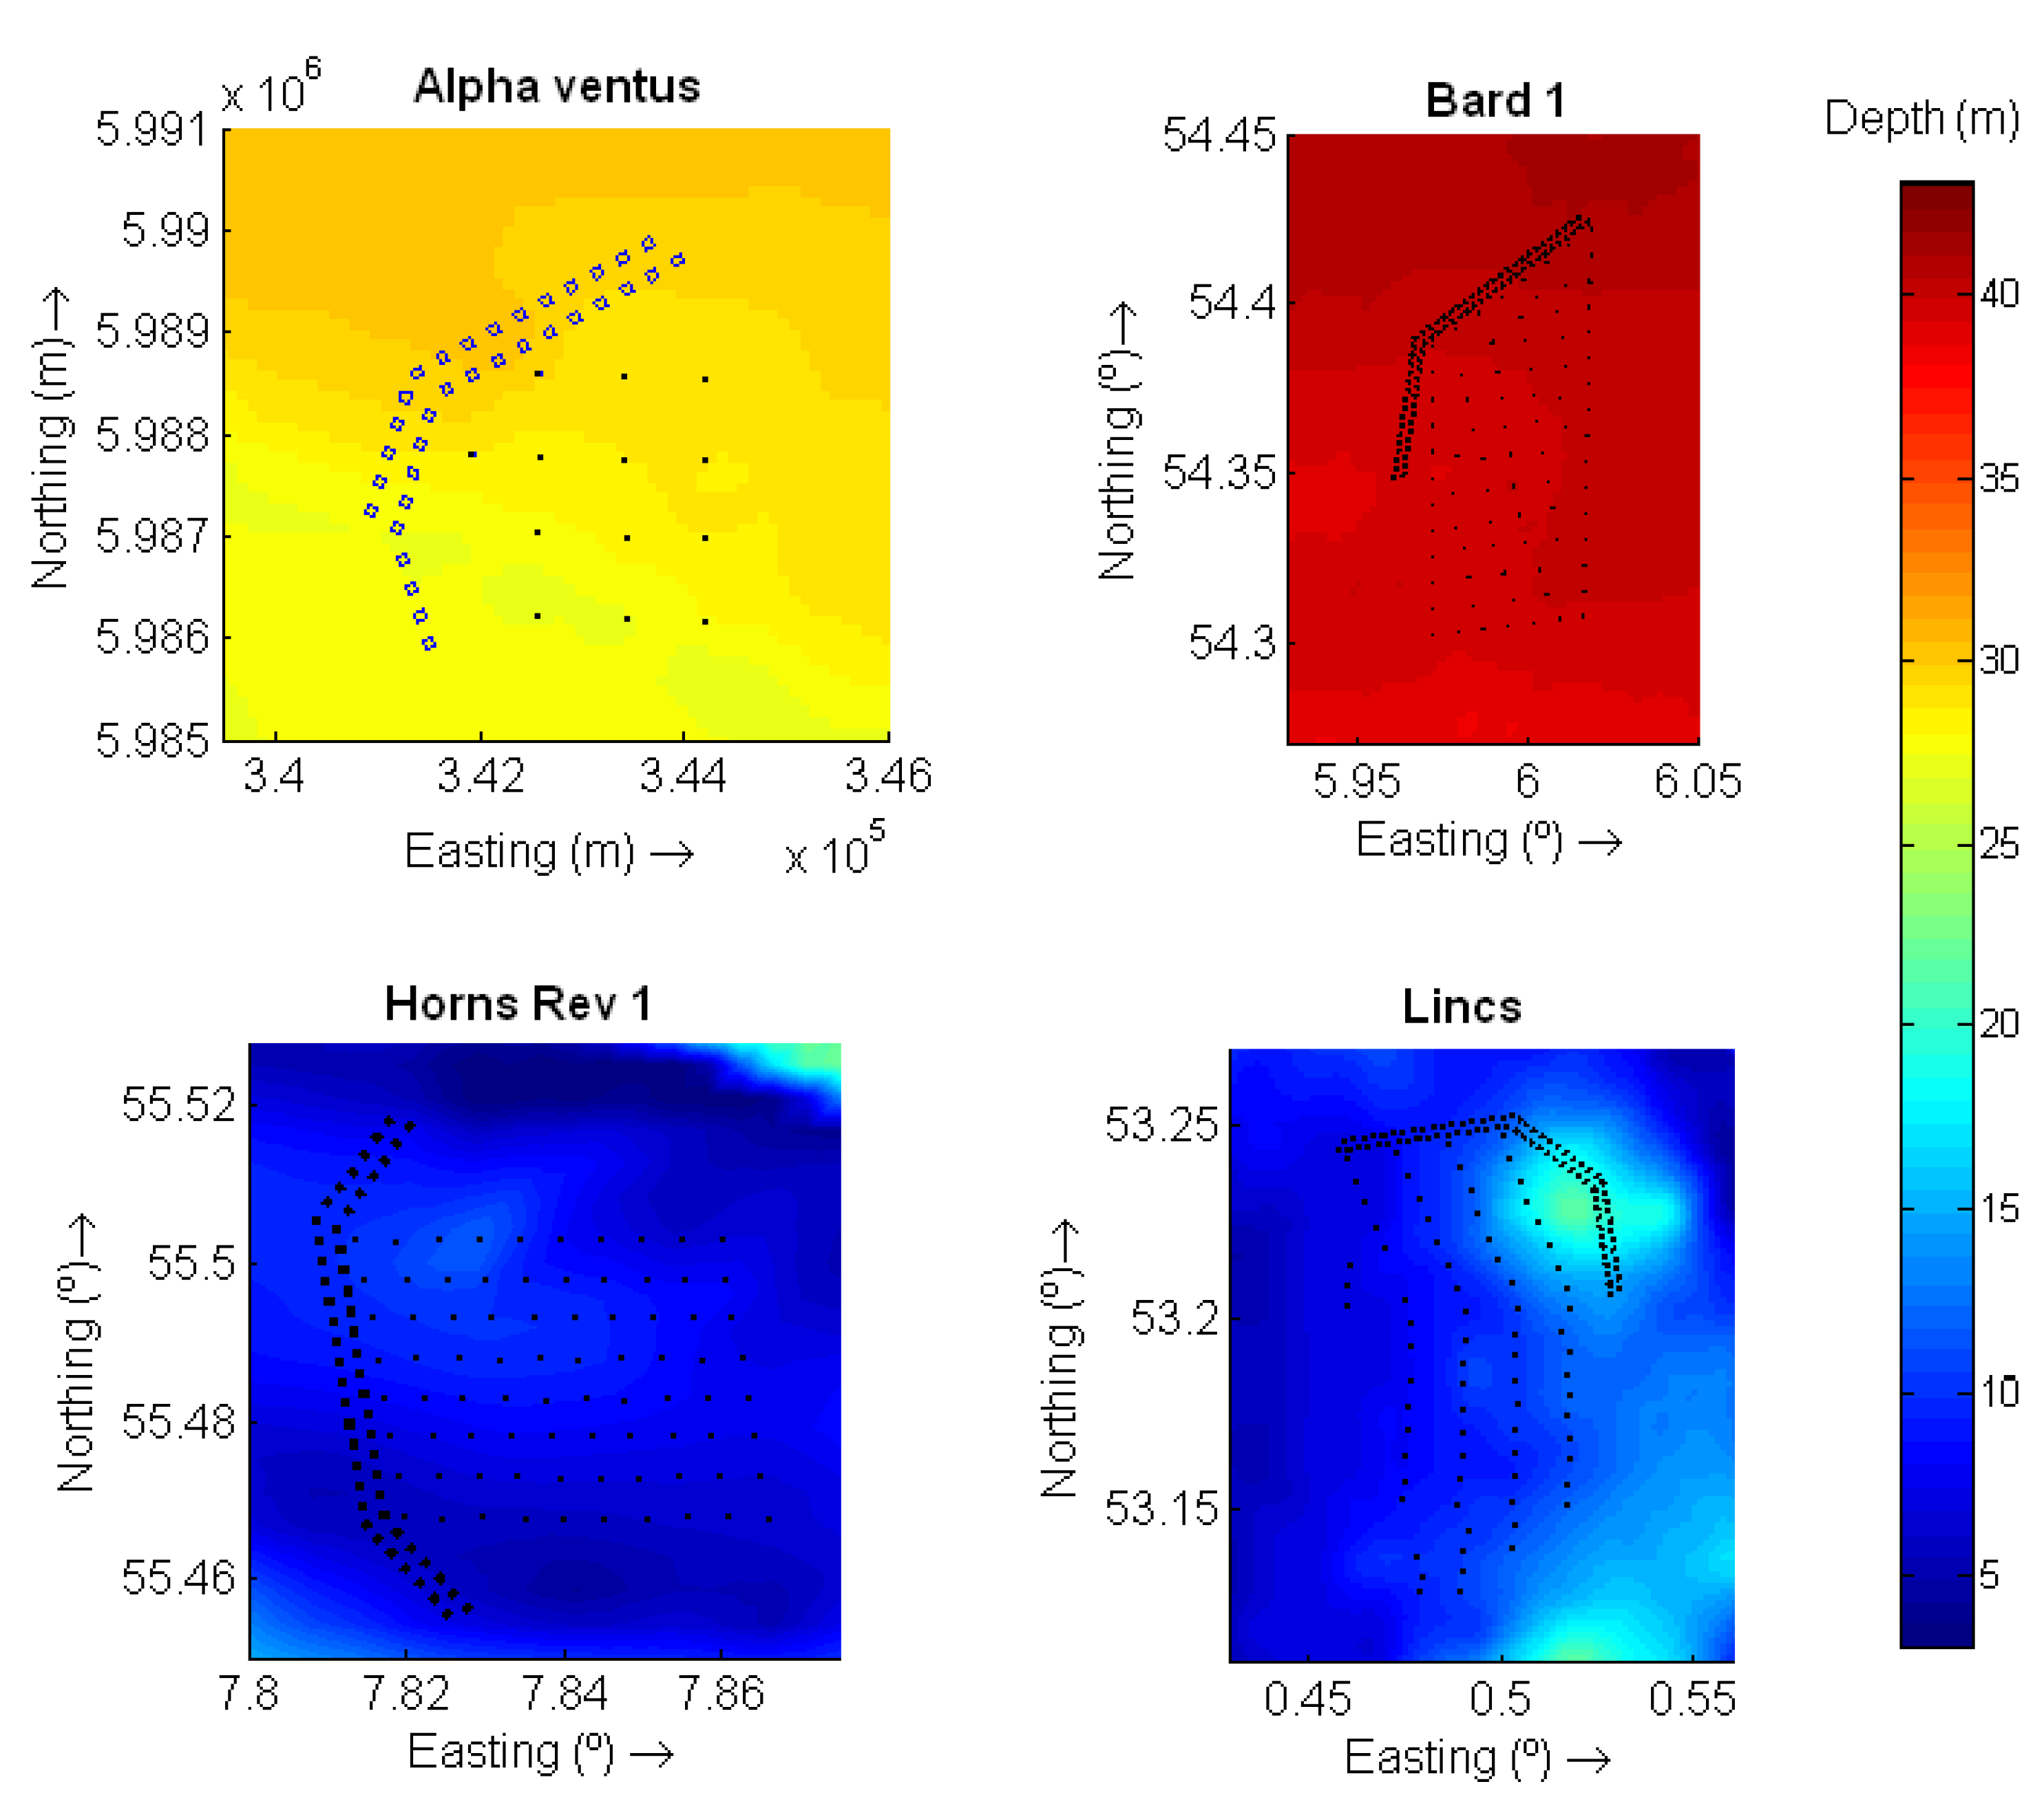
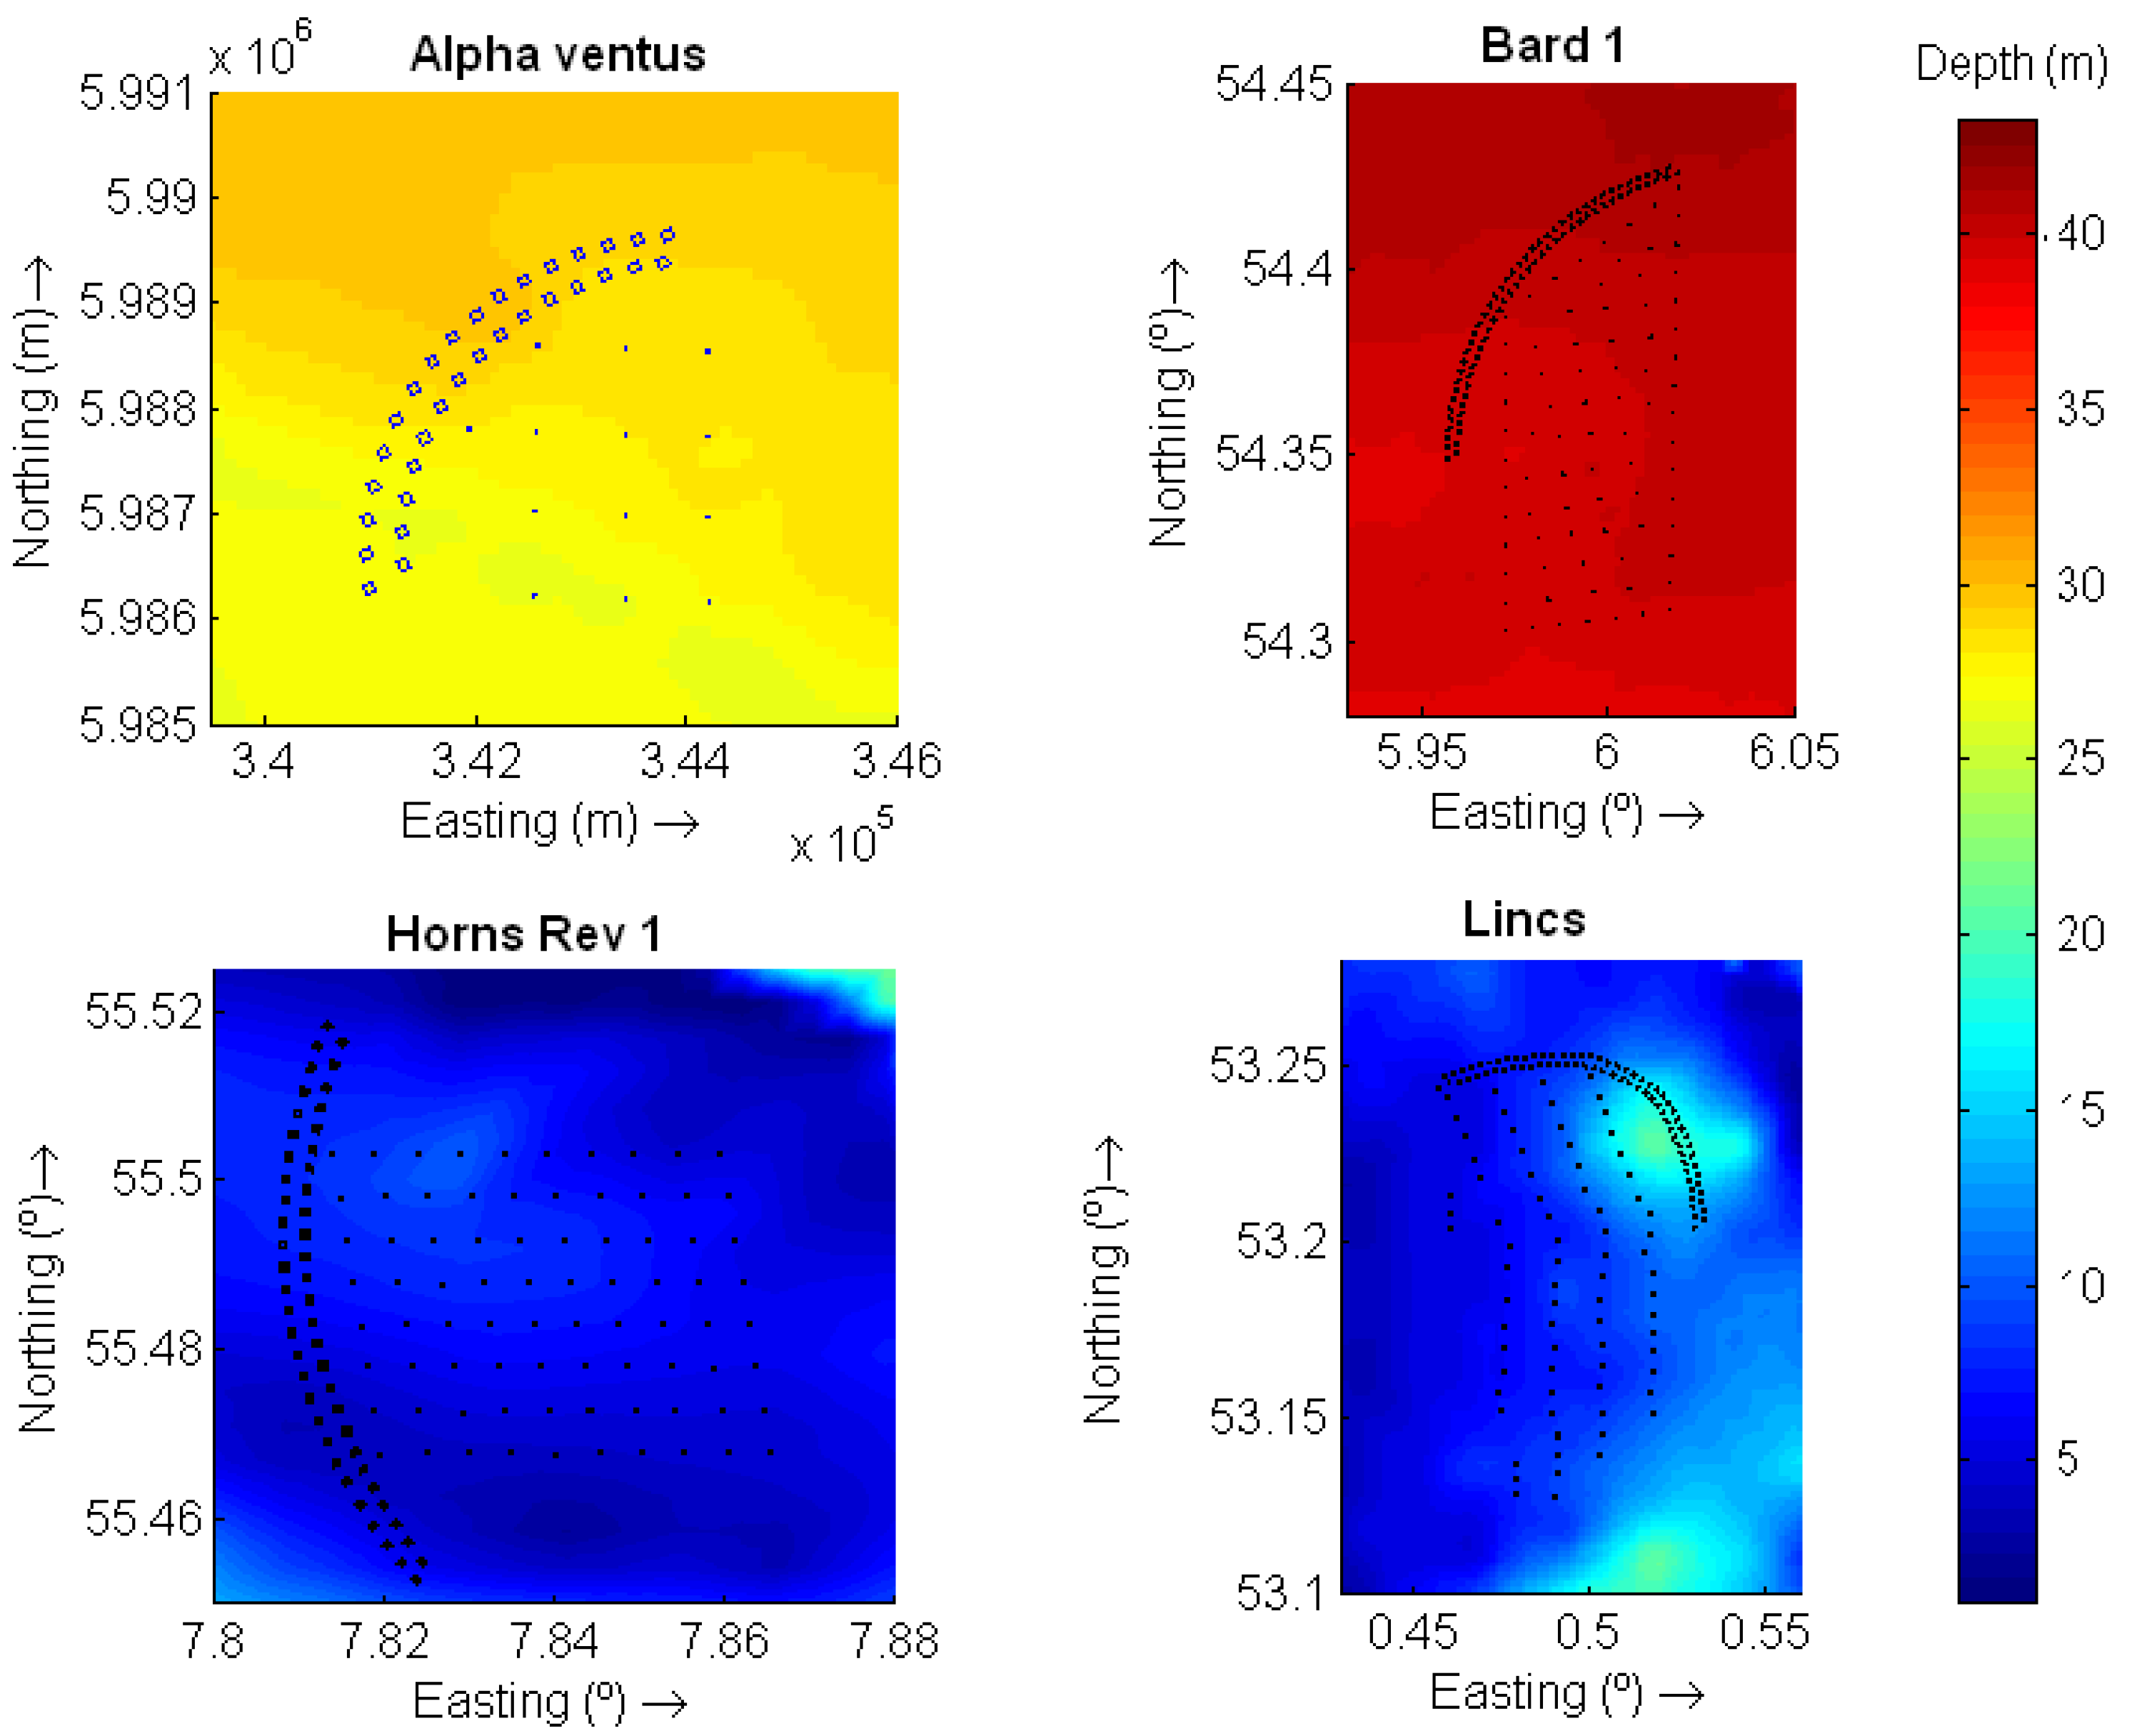
With regard to the wind farm layout (
Figure 6), the Alpha Ventus wind farm is composed by 12 turbines: six AREVA turbines with a tripod substructure and six Repower 5 M turbines with a jacket-frame substructure [
109]. For their part, Bard 1 has 80 wind turbines of 5 MW (Bard 5.0) and a tripod substructure [
110,
111,
112], Horns Rev 1 has 80 turbines (Vestas V80-2MW) with a monopile substructure erected on a grid of 10 rows [
113] and Lincs is composed of 75 wind turbines Siemens 3.6 MW with monopile substructure [
114,
115]. At Alpha Ventus and Horns Rev 1 the wind turbines are ordered on a Cartesian grid, whereas in Bard 1 and Lincs they are not organised in clearly defined rows, and the distance between turbines varies in each case.
The wind farms selected as baseline scenarios presented levels of accessibility to the wind turbines—percentage of time when the significant weight height within the wind farm is under the workboat limit, 1.5 m—between 57% and 74% during the study period (
Table 6), whereas a level of accessibility around 82% is required to ensure an availability—the percentage of time that the farm is able to produce electricity—of 90% [
116]. This is in well concordance with the general panorama, since while modern onshore wind turbines show availability levels of 98% [
117], this level is significantly reduced in offshore installations [
117,
118,
119,
120].
Figure 6.
Layout and bathymetry of Alpha Ventus, Bard 1, Horns Rev 1 and Lincs (water depths in m). (Reprinted with permission from [
103]. Copyright 2015 Elsevier Science Ltd.)
Figure 6.
Layout and bathymetry of Alpha Ventus, Bard 1, Horns Rev 1 and Lincs (water depths in m). (Reprinted with permission from [
103]. Copyright 2015 Elsevier Science Ltd.)
Table 6.
Accessibility to the wind turbines in the baseline scenario for the annual period analysed. (Reprinted with permission from [
103]. Copyright 2015 Elsevier Science Ltd.)
Table 6.
Accessibility to the wind turbines in the baseline scenario for the annual period analysed. (Reprinted with permission from [103]. Copyright 2015 Elsevier Science Ltd.)
| Wind Farm | Accessibility (%) |
|---|
| Alpha Ventus | 67.53 |
| Bard 1 | 56.99 |
| Horns Rev 1 | 59.86 |
| Lincs | 74.11 |
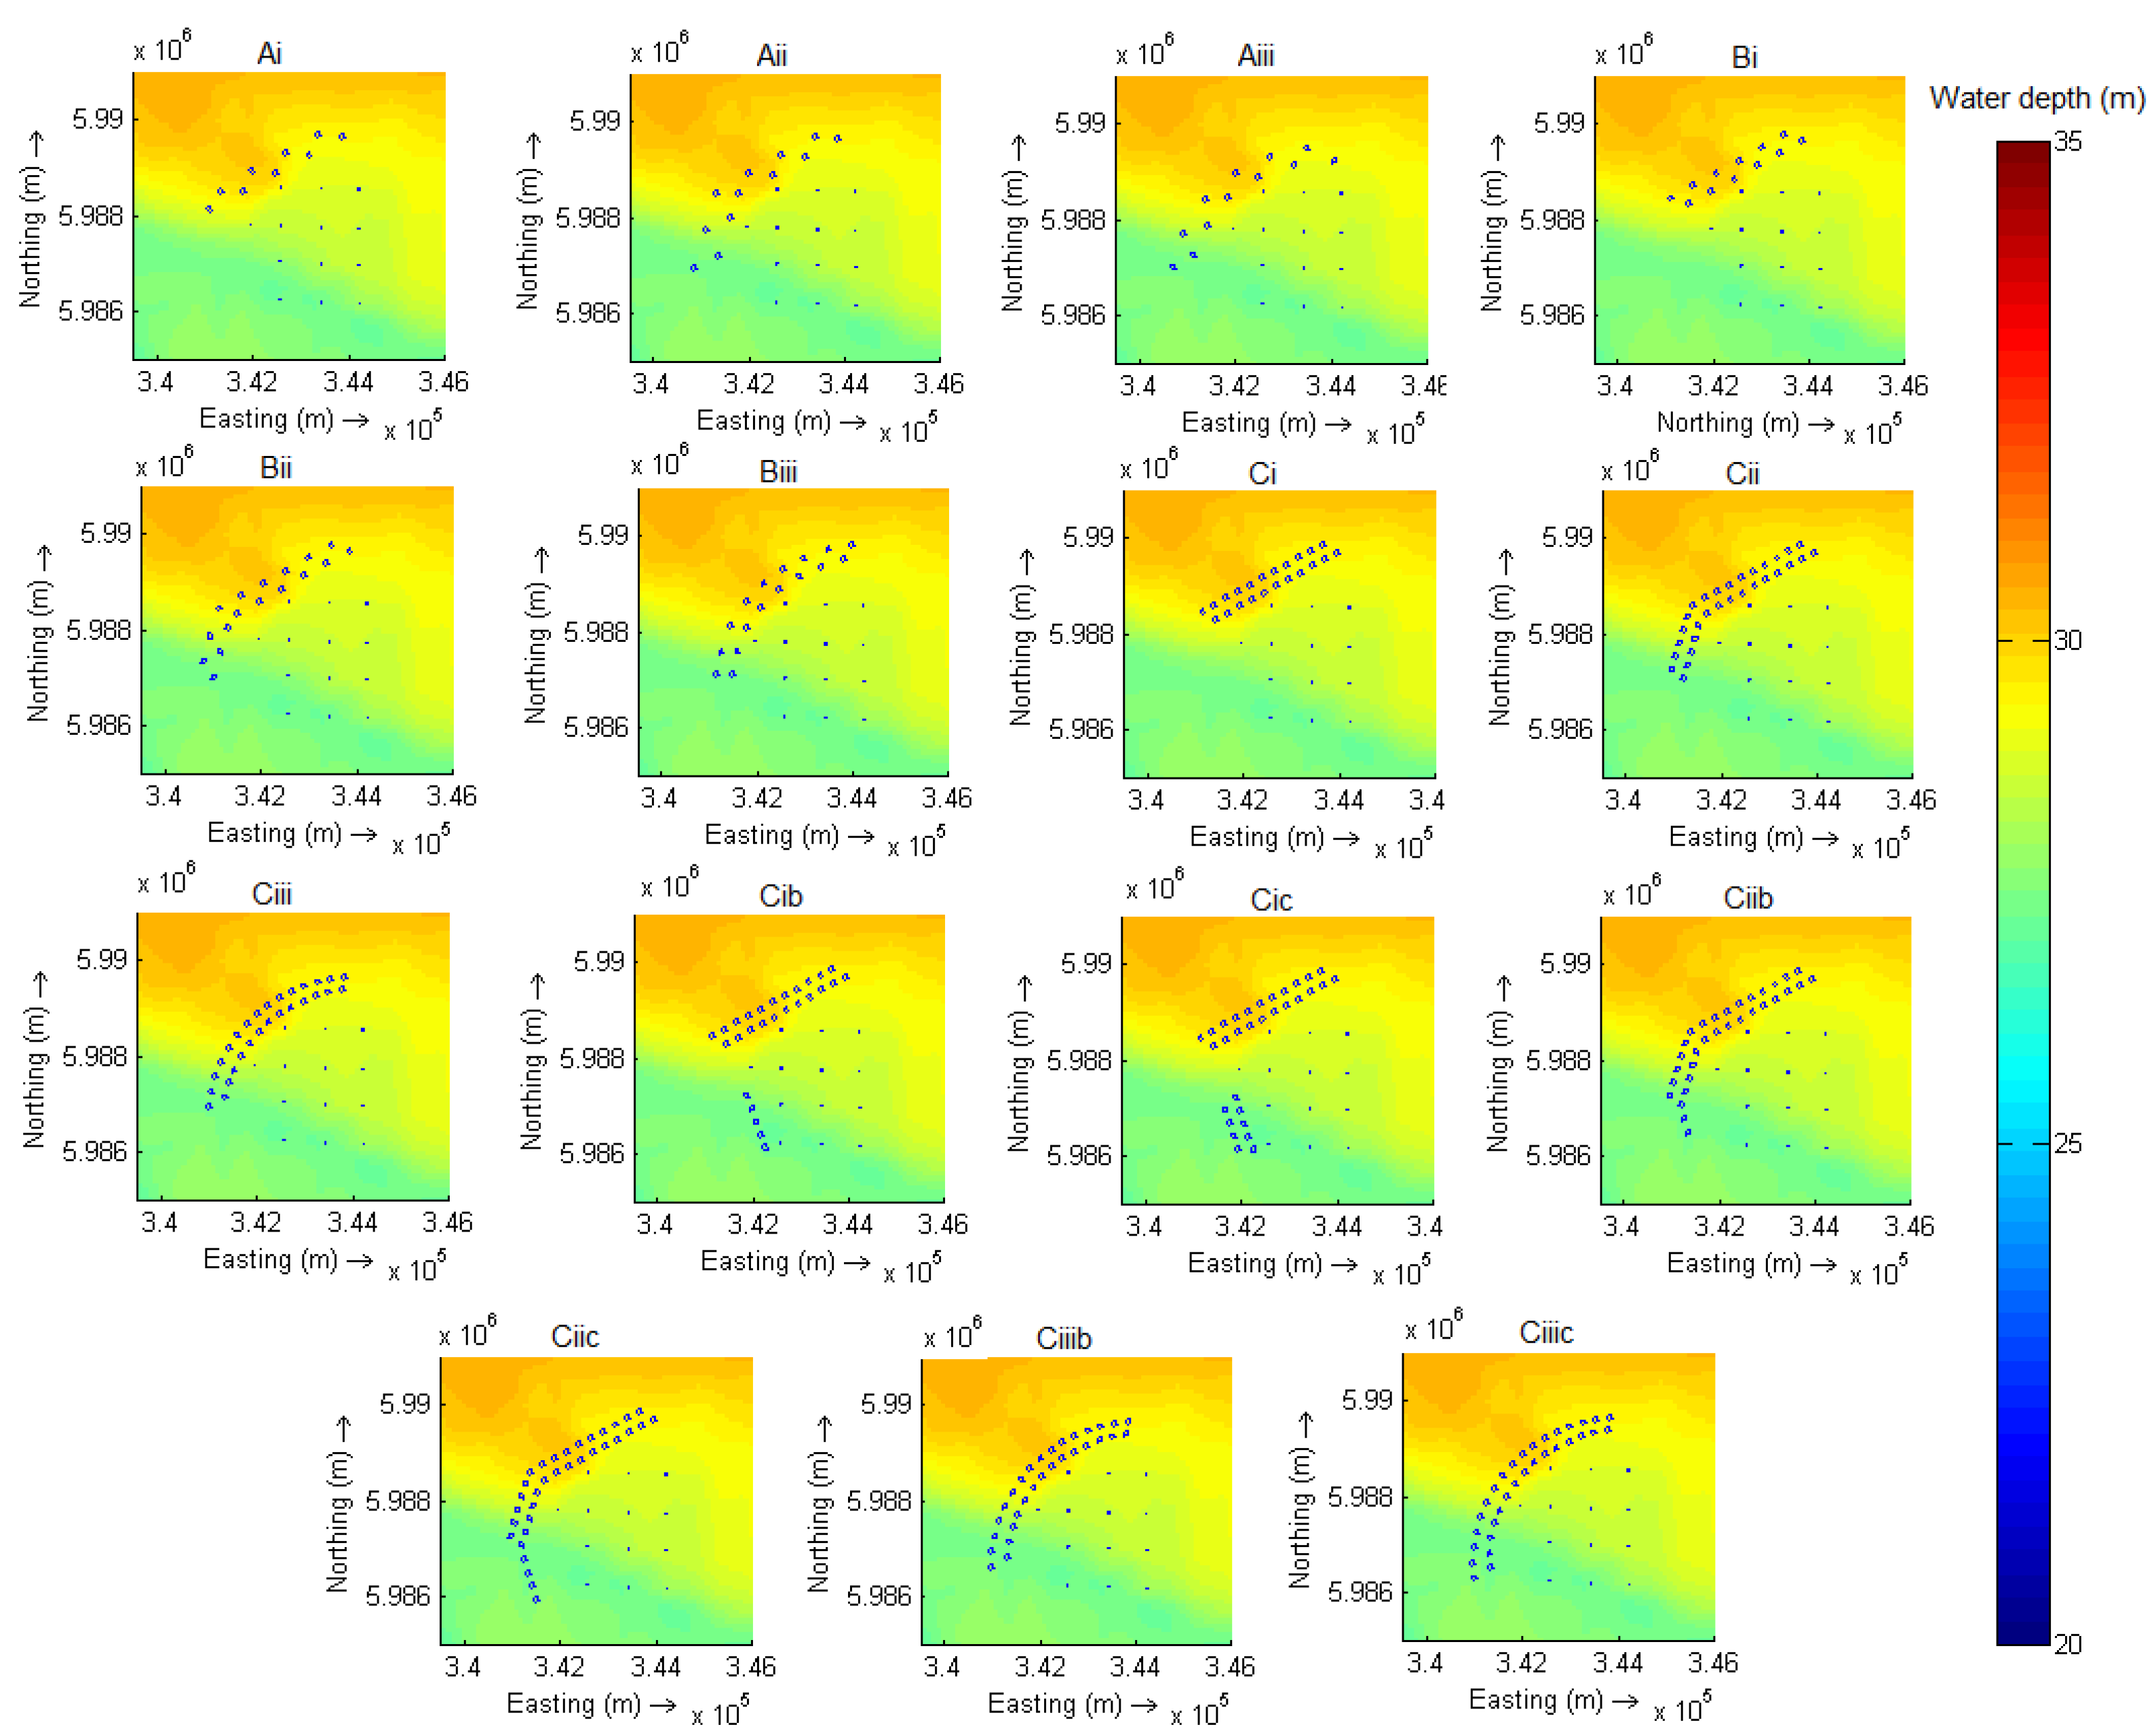
In the light of this situation, a wide variety of co-located wave farm layouts were analysed in Alpha Ventus (
Table 7,
Figure 7) in order to identify the configurations that maximise the wave height reduction. They are characterised by different spacing between WECs, disposition and number of devices, with the aim of providing shelter not only from NW waves (the prevailing wave direction) but also from W and SW waves, which are relatively frequent in the area. In all cases, WaveCat, a floating offshore WEC, whose principle of operation is wave overtopping with a hull length of 90 m [
121], was the WEC employed. The simulations were carried out considering the predominant sea state in the Alpha Ventus site:
Hs = 1.5 m,
Tp = 6.5 m and θ = 330°.
Table 7.
Characteristics of the WEC layouts, with
nWECs the total number of WECs. (Reprinted with permission from [
55]. Copyright 2015 Elsevier Science Ltd.)
Table 7.
Characteristics of the WEC layouts, with nWECs the total number of WECs. (Reprinted with permission from [55]. Copyright 2015 Elsevier Science Ltd.)
| No. | Spacing (m) | Configuration | nWECs | Short Description |
|---|
| 1 | 750 | Ai | 9 | 2 rows to the NW. |
| 2 | Aii | 12 | 2 rows to the NW and 2 more rows to the W, at an angle of 45°. |
| 3 | Aiii | 12 | Arch to the NW. |
| 4 | 450 | Bi | 12 | 2 rows to the NW. |
| 5 | Bii | 17 | 2 rows to the NW and 2 more rows to the W, at an angle of 45°. |
| 6 | Biii | 17 | Arch to the NW. |
| 7 | 198 | Ci | 22 | 2 rows to the NW |
| 8 | Cii | 30 | 2 rows to the NW and 2 more rows to the W. |
| 9 | Ciii | 28 | Arch to the NW. |
| 10 | 198 | Cib | 27 | 2 rows to the NW and 1 row to the SW of the farm constituted by 5 additional WECs. |
| 11 | Cic | 31 | 2 rows to the NW and 2 more rows to the SW of the farm constituted by 9 additional WECs. |
| 12 | Ciib | 32 | 2 rows to the NW and 2 more rows to the W, at an angle of 45°. (2 additional WECs) |
| 13 | Ciic | 34 | 2 rows to the NW and 2 more rows to the W, at an angle of 45°. (4 additional WECs) |
| 14 | Ciiib | 30 | Arch to the NW with 2 additional WECs. |
| 15 | Ciiic | 32 | Arch to the NW with 4 additional WECs. |
Figure 7.
Co-located wave-wind farm layouts (configurations A
i to C
iiic). (Reprinted with permission from [
55]. Copyright 2015 Elsevier Science Ltd.)
Figure 7.
Co-located wave-wind farm layouts (configurations A
i to C
iiic). (Reprinted with permission from [
55]. Copyright 2015 Elsevier Science Ltd.)
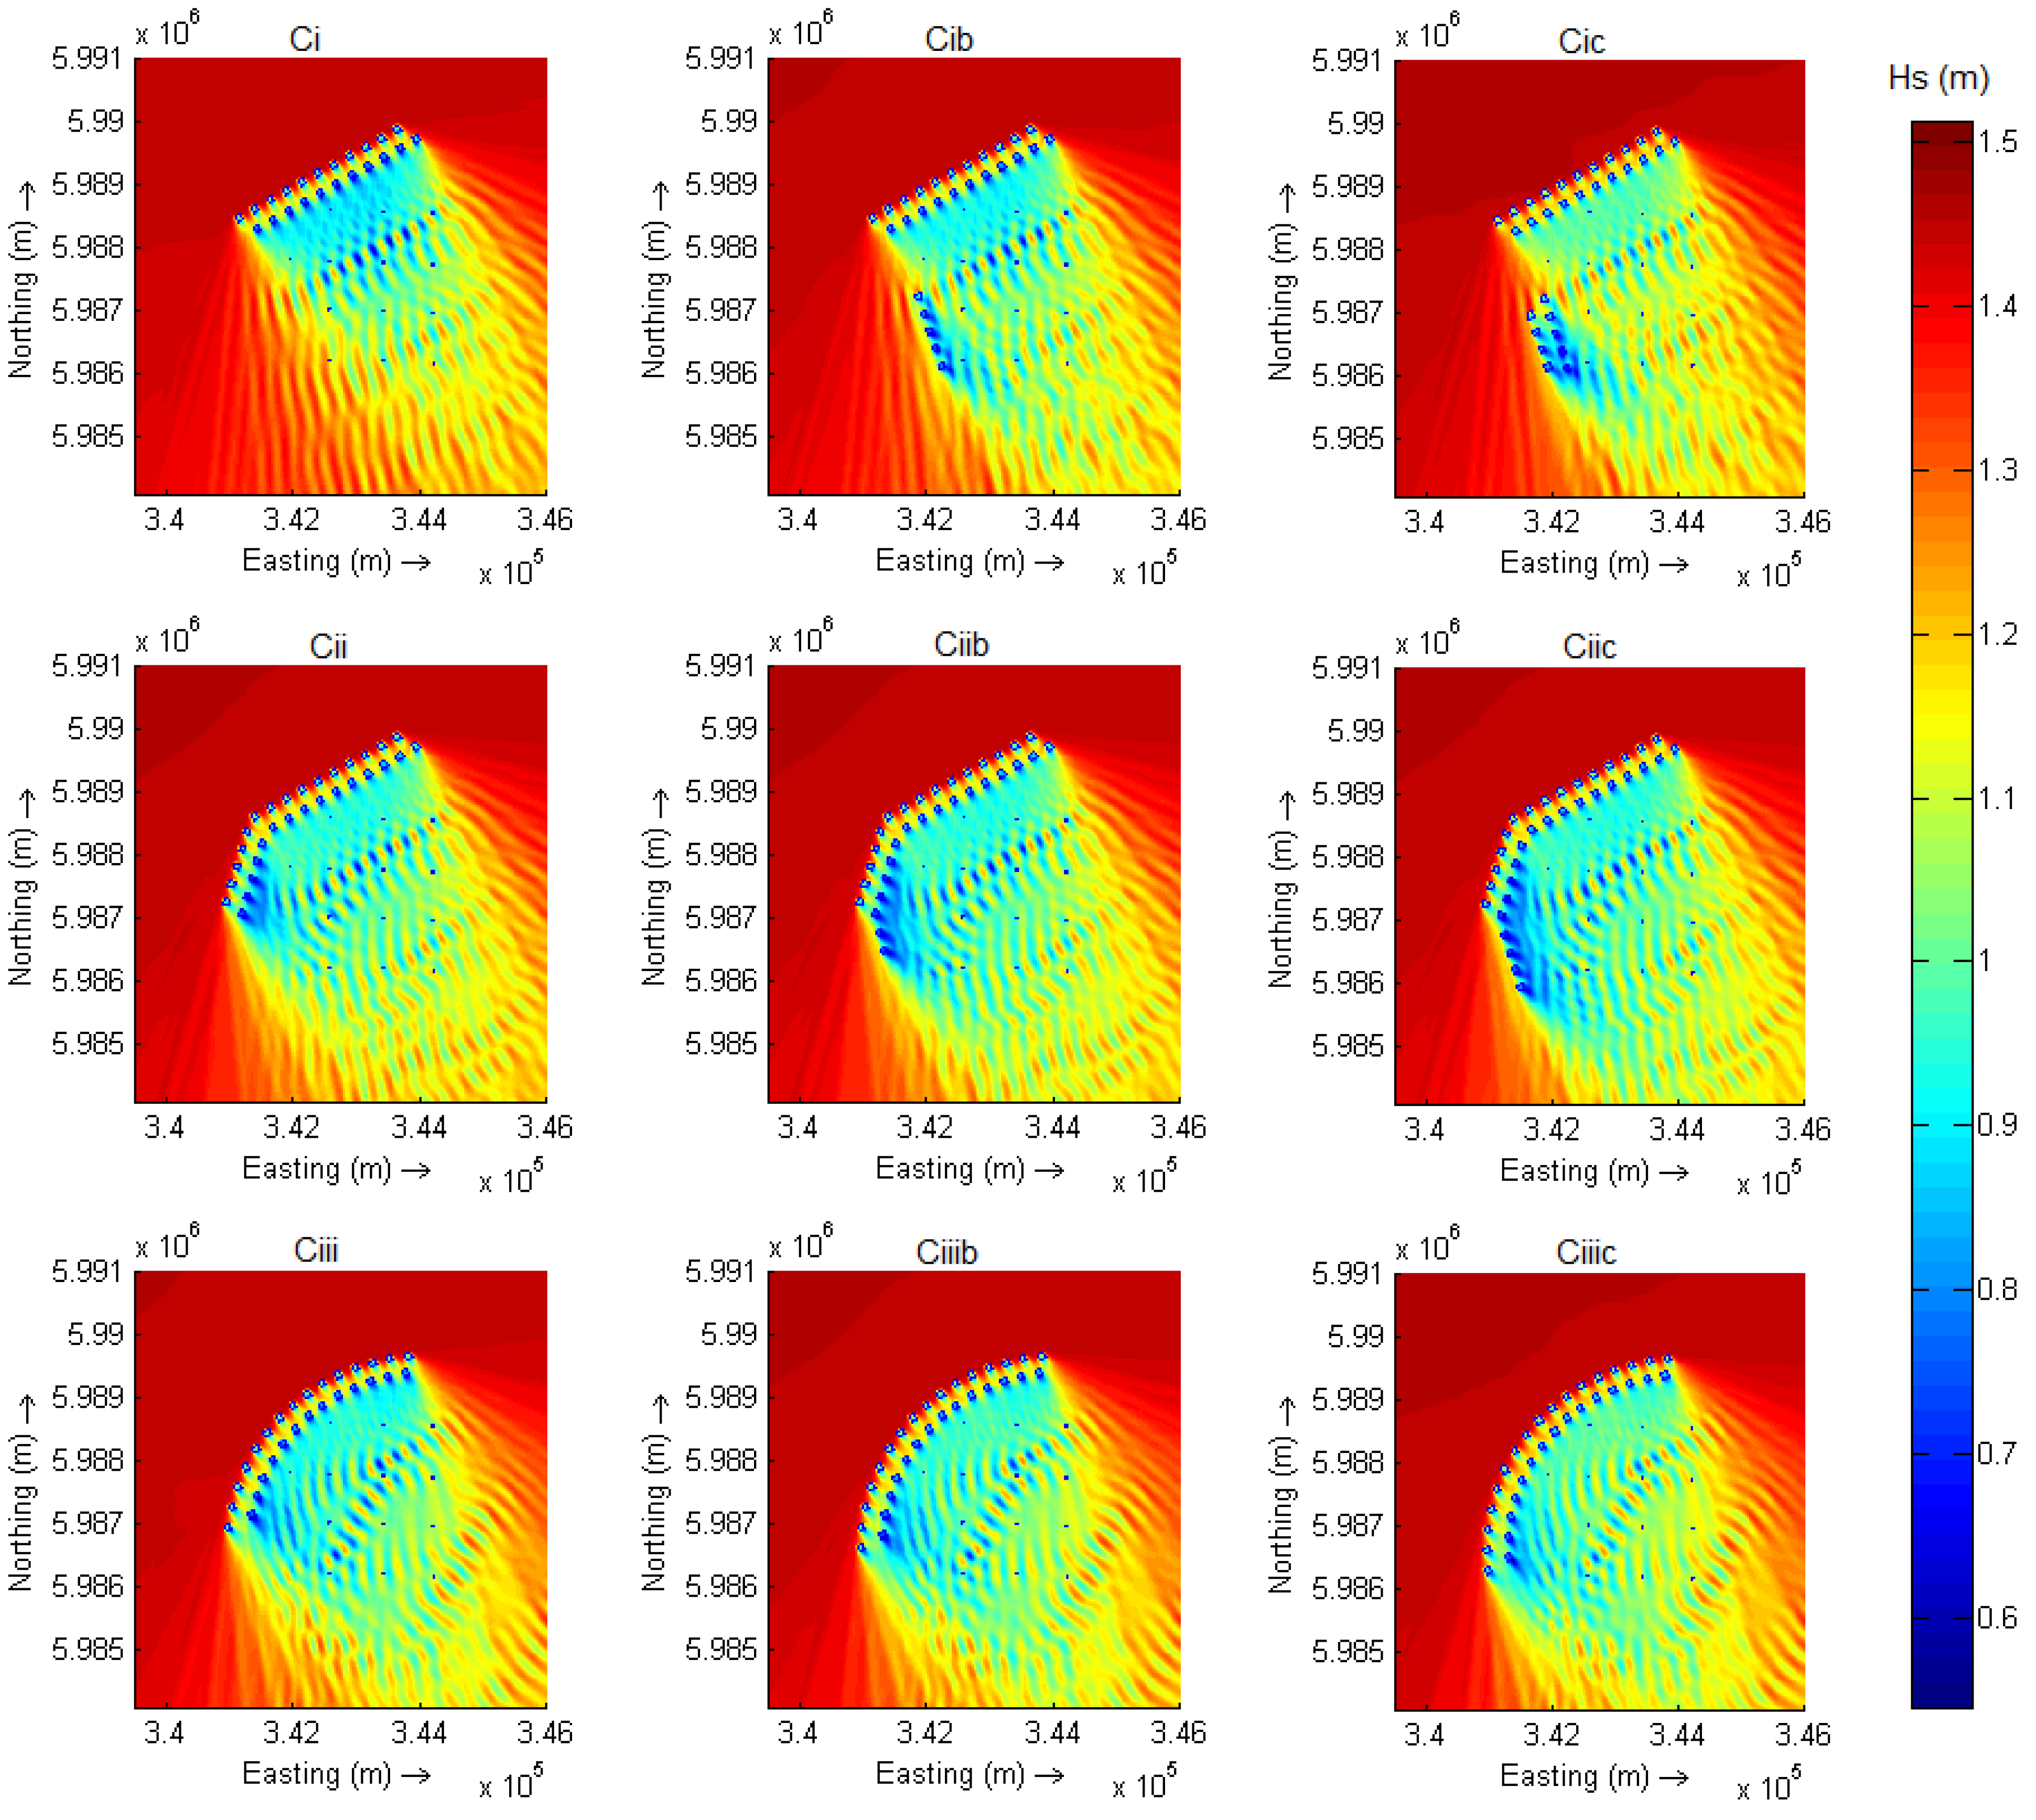
In view of the results, the highest wave height reductions were obtained in the configurations with low spacing between devices, not only due to the larger number of WECs but also by the aggregation of the shadow effect provided by each devices, reaching average wave height reductions up to 24.91% in the whole farm. Among these layouts, C
i, C
ib and C
ic should be rejected since they leave part of the wind farm unprotected (
Figure 8). Therefore, the best WECs layouts were C
iic and C
iiic which corresponds with: Two main rows of WECs with a spacing of 198 m orientated towards the prevailing wave direction and other two rows of devices to face secondary waves deployed in an angular configuration in the first case and forming an arch in the latter.
Figure 8.
Wave height reduction within the Alpha Ventus wind farm for the predominant sea state in this site:
Hs = 1.5 m,
Tp = 6.5 m and θ = 330° and configurations C
i to C
iiic. (Reprinted with permission from [
55]. Copyright 2015 Elsevier Science Ltd.)
Figure 8.
Wave height reduction within the Alpha Ventus wind farm for the predominant sea state in this site:
Hs = 1.5 m,
Tp = 6.5 m and θ = 330° and configurations C
i to C
iiic. (Reprinted with permission from [
55]. Copyright 2015 Elsevier Science Ltd.)
On this basis, these both configurations (
Figure 9 and
Figure 10) were analysed in depth in the four wind farms—Alpha Ventus, Bard 1, Horns Rev 1 and Lincs—by considering annual measured wave data during 2012 and 2013 by buoys located in the vicinities of the wind farms [
103]. The number of WECs and the rate with the number of wind turbines is shown in
Table 8.
Figure 9.
Co-located wind farm layouts with WECs at an angle. (Reprinted with permission from [
103]. Copyright 2015 Elsevier Science Ltd.)
Figure 9.
Co-located wind farm layouts with WECs at an angle. (Reprinted with permission from [
103]. Copyright 2015 Elsevier Science Ltd.)
Figure 10.
Co-located wind farms with an arched WEC layout. (Reprinted with permission from [
103]. Copyright 2015 Elsevier Science Ltd.)
Figure 10.
Co-located wind farms with an arched WEC layout. (Reprinted with permission from [
103]. Copyright 2015 Elsevier Science Ltd.)
Table 8.
Total number of co-located WECs, number of devices in each i-th Vertical Row (VRi) of co-located WECs and rate between the total number of WECs and wind turbines (r).
Table 8.
Total number of co-located WECs, number of devices in each i-th Vertical Row (VRi) of co-located WECs and rate between the total number of WECs and wind turbines (r).
| Wind Farm | Layout in Angle | Layout in Arch |
|---|
| VR1 | VR2 | Total | r | VR1 | VR2 | Total | r |
|---|
| Alpha Ventus | 19 | 15 | 34 | 2.83 | 17 | 15 | 32 | 2.67 |
| Bard 1 | 40 | 39 | 79 | 0.99 | 40 | 39 | 79 | 0.99 |
| Horns Rev 1 | 28 | 27 | 55 | 0.69 | 27 | 26 | 53 | 0.66 |
| Lincs | 41 | 40 | 81 | 1.01 | 40 | 40 | 80 | 1 |
In all cases, important wave height reductions were obtained, especially in Bard 1 with an average wave reduction between 17% and 19%, thanks to the good interception of the incoming waves (
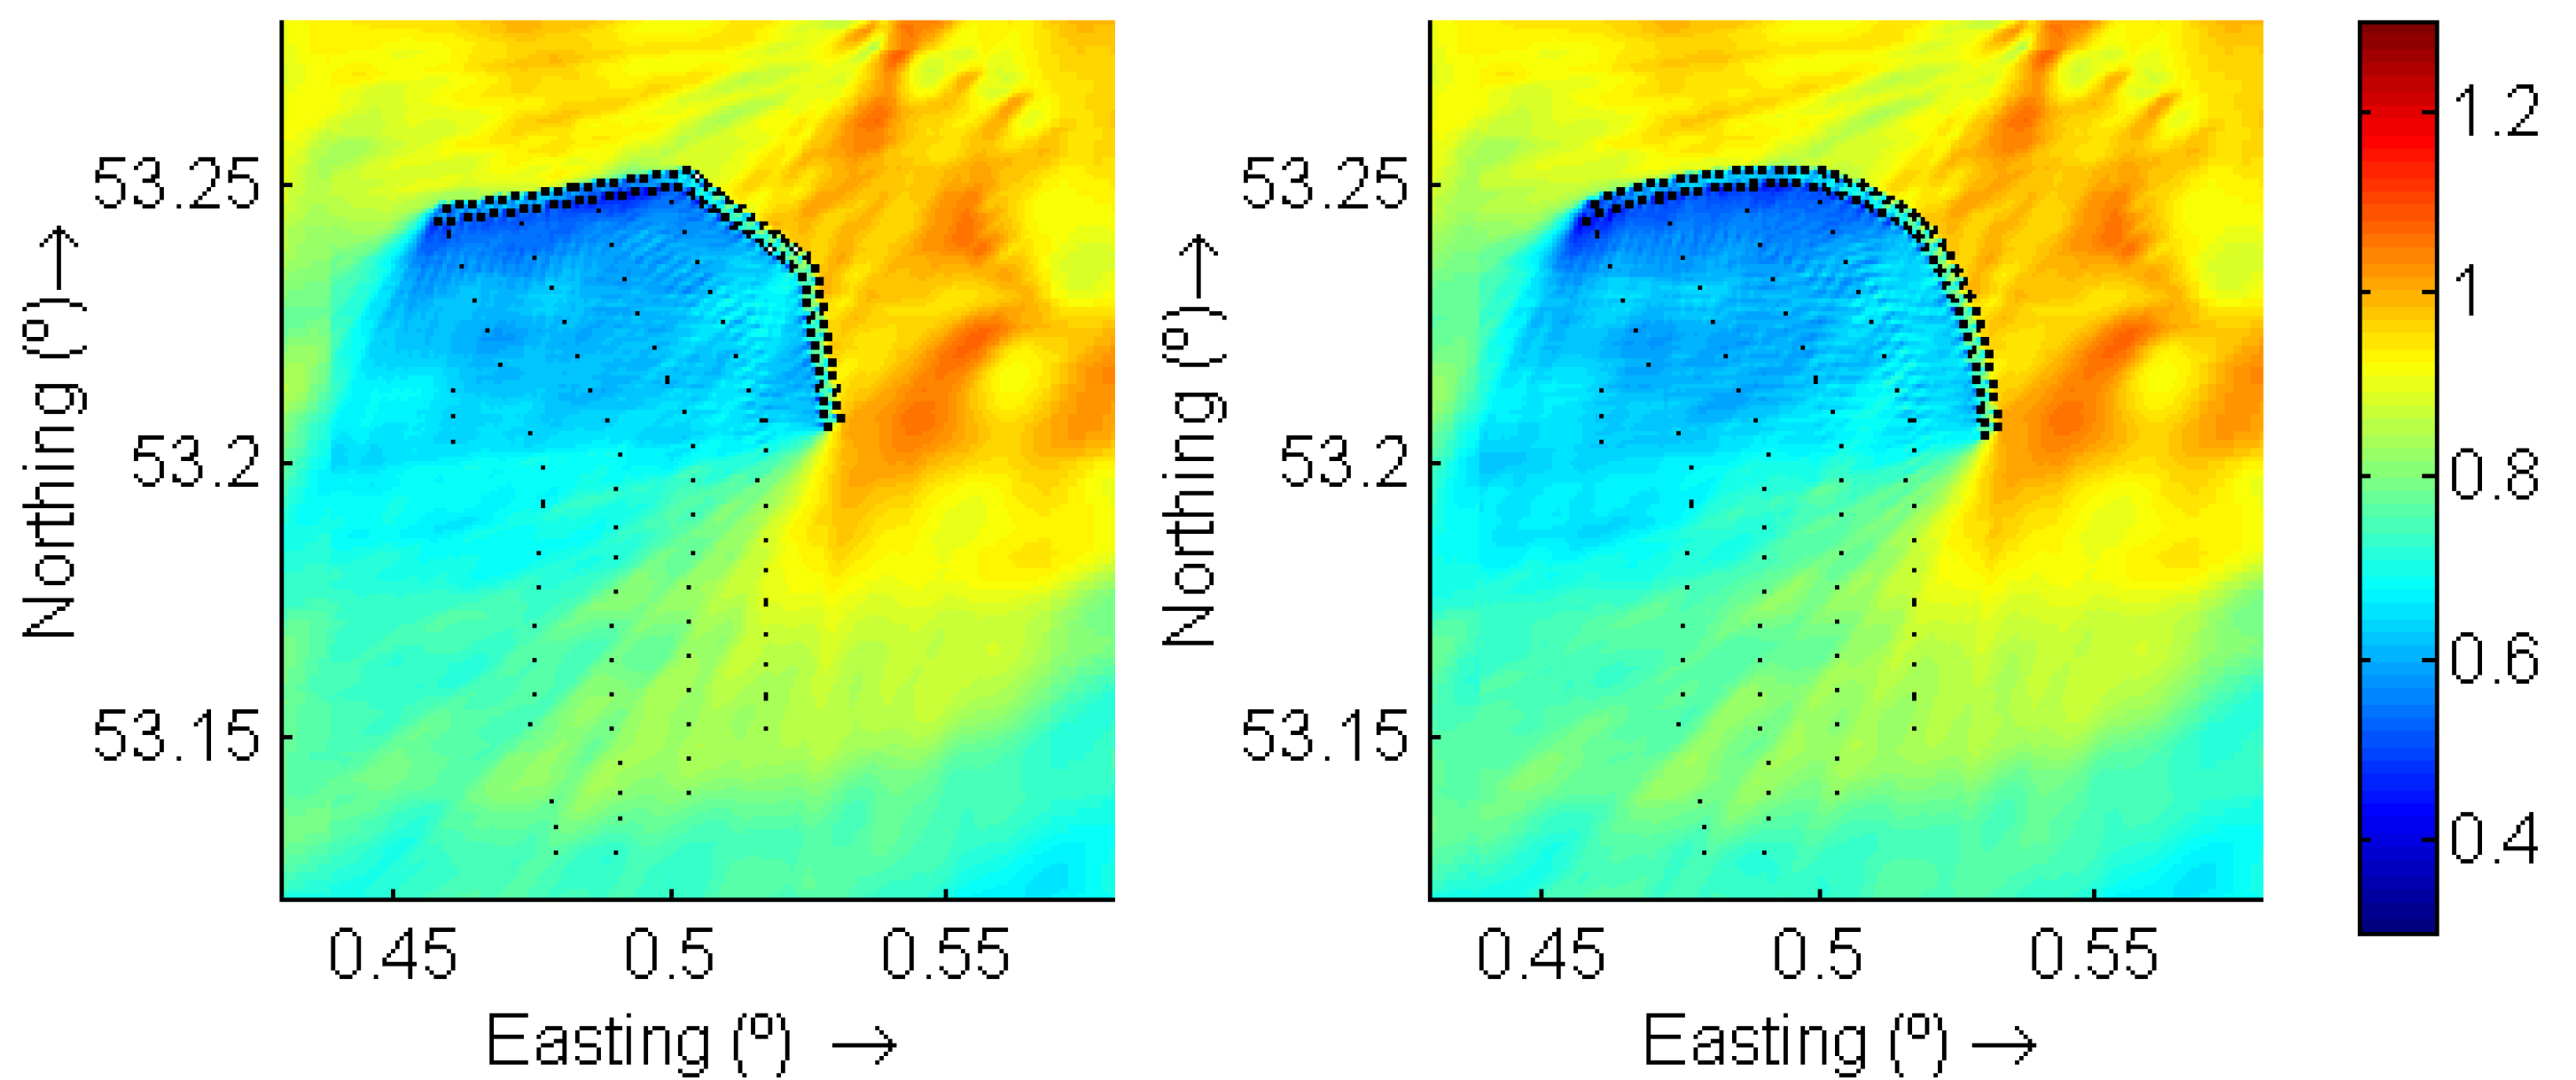
Figure 11). These results were followed very closely by those obtained in Alpha Ventus (around 17%) and Horns Rev 1 (between 15% and 17%), whereas the wave height reduction achieved at Lincs was smaller (around 13%) since part of the farm remained unprotected against incoming waves from secondary directions due to its elongated shape (
Figure 12). This fact was supported when the spatial variation in the wave height reduction was analysed, since in the case of Lincs the wave height reduction decreased from 40% in the wind turbines just behind the co-located WECs to 5% in the further turbines [
103]. In fact, the most homogeneous reduction throughout the wind farm was achieved in the case of wind farms with geometry similar to a square and smaller spacing between wind turbines, such as Horns Rev 1. Moreover, this kind of farms would require fewer WECs to protect the whole farm from incoming waves. Another important factor in the results is the distance from the coast: Being closer to land is not a positive factor to implement co-located WECs, since it normally implies lower water depths and a milder sea climate, and consequently there is less available wave energy to be extracted by the WECs [
103].
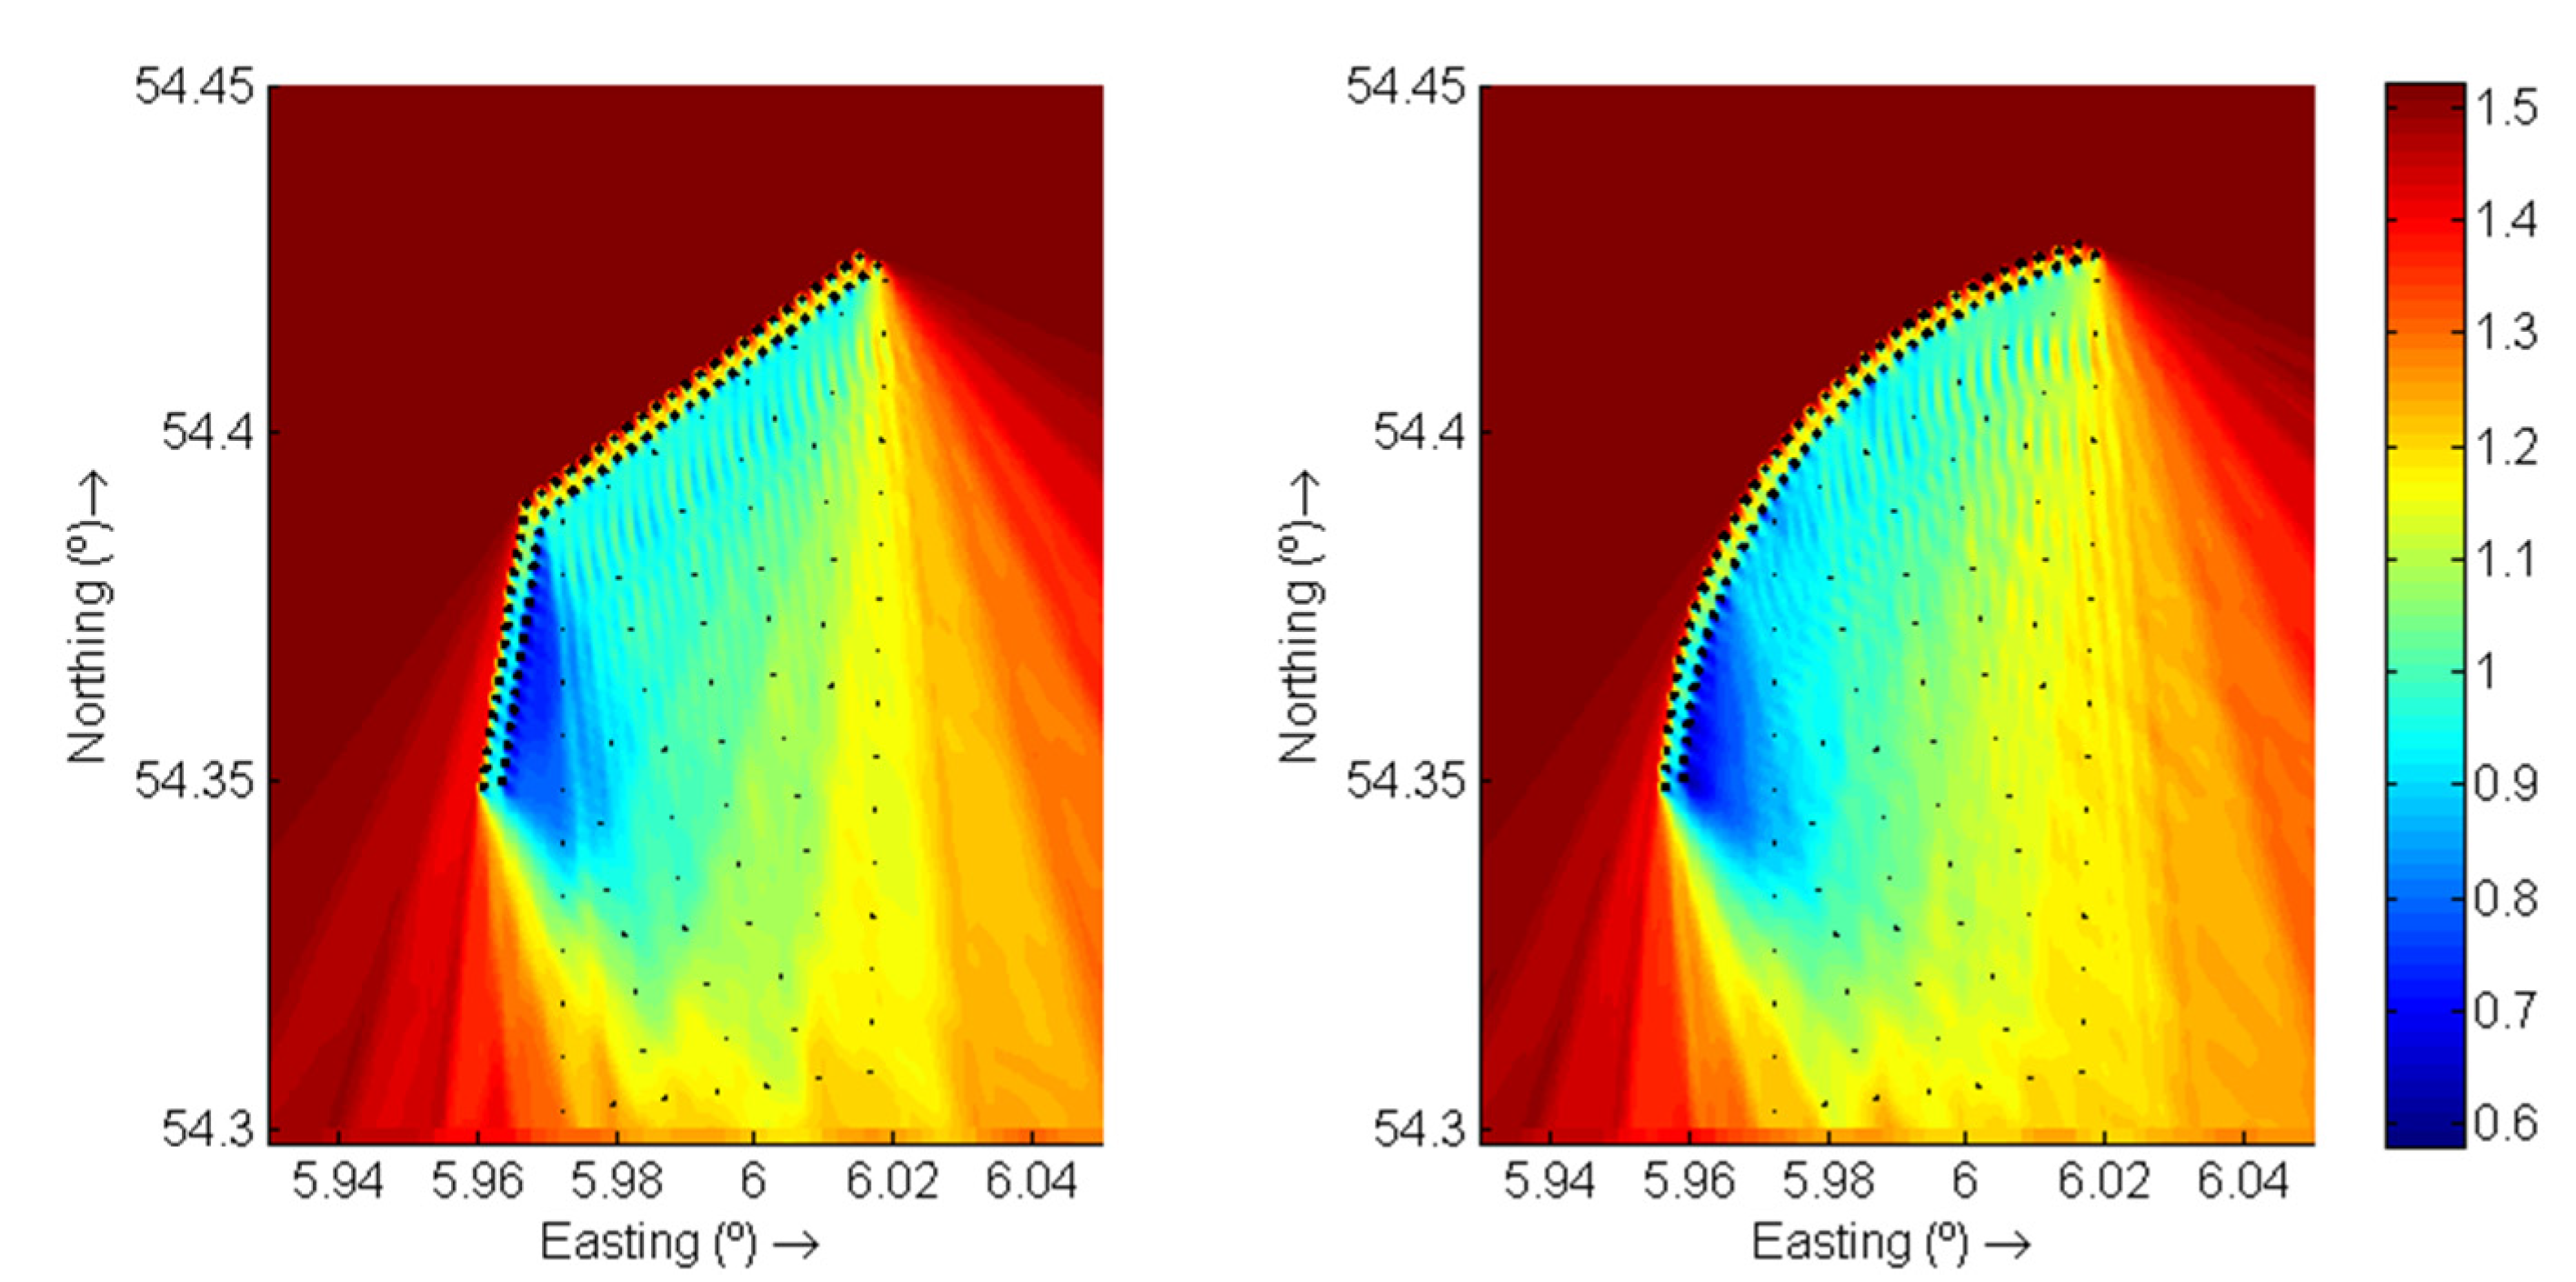
Figure 11.
Wave height reduction due to co-located WECs at Bard 1 under a sea state with: Hs = 1.71 m, Tp = 6.09 s and θ: 229.6°. The colour scale represents the significant wave weight, Hs (m).
Figure 11.
Wave height reduction due to co-located WECs at Bard 1 under a sea state with: Hs = 1.71 m, Tp = 6.09 s and θ: 229.6°. The colour scale represents the significant wave weight, Hs (m).
Figure 12.
Wave height reduction obtained with co-located WECs at Lincs under a sea state with: Hs = 1.18 m, Tp = 6.03 s and θ = 60.16°. The colour scale represents the significant wave weight, Hs (m).
Figure 12.
Wave height reduction obtained with co-located WECs at Lincs under a sea state with: Hs = 1.18 m, Tp = 6.03 s and θ = 60.16°. The colour scale represents the significant wave weight, Hs (m).
Although the combination of wave and wind energy farms presents better results in some cases than in others, the wave height reductions achieved bring in important improvements of the accessibility to the wind turbines for all the cases analysed (
Table 9). In fact, the accessibility raised over 82% for two of the farms, which is the reference value to maintain a farm availability of above 90% [
116]. In order to translate this increase of time accessibility into monetary terms, it could be considered an estimated cost (or lost earnings) of delayed repairs about 300 €/h [
122,
123].
Table 9.
Accessibility of the co-located farms and the increase (
∆) in comparison with the baseline scenarios. (Reprinted with permission from [
103]. Copyright 2015 Elsevier Science Ltd.)
Table 9.
Accessibility of the co-located farms and the increase (∆) in comparison with the baseline scenarios. (Reprinted with permission from [103]. Copyright 2015 Elsevier Science Ltd.)
| Wind Farm | Layout | Accessibility (%) | Δ (%) |
|---|
| Alpha Ventus | in angle | 82.33 | 17.97 |
| in arch | 82.19 | 17.83 |
| Bard 1 | in angle | 69.66 | 18.19 |
| in arch | 69.04 | 17.46 |
| Horns Rev 1 | in angle | 70.89 | 15.56 |
| in arch | 69.52 | 13.89 |
| Lincs | in angle | 81.30 | 8.85 |
| in arch | 81.10 | 8.61 |
Further, given that the wave height reduction within the wind farm decreases with the distance from the WECs barrier towards the periphery, it is interesting to analyse the accessibility to each individual wind turbine apart from the accessibility in the entire farm. The most remarkable thing is that a quite homogeneous level of accessibility is achieved within the entire farm, since around 50% of the wind turbines experienced an increase in the accessible timeframe of 20%, and the remaining part an increase of at least 10%, with the exception of Lincs where waves recover more quickly throughout the farm due to the soft climate and enlarged shape of the farm, and only the turbines of the first half of the farm experienced an increase in the accessibility over 10% [
103]. Indeed, in the case of Alpha Ventus, Bard and Horns Rev the ratio between the wave reduction in the most distant area and the average within the farm is over 60%, whereas it is around 38% in Lincs.
In order to translate the increase of time accessibility into monetary terms, it could be considered an estimated cost (or lost earnings) of delayed repairs about 300 €/h [
122,
123]. The aggregate failure rate per wind turbines is approximately five failures per year [
124], and they occur particularly in the winter months due to the storm periods [
125]. Therefore, it is likely that when these failures occur do sea conditions overtake the operational workboats limit, having to wait until the end of the storm—winter storm periods have an average duration between three and four days in the North Sea [
126]. Thus, avoiding one of this downtime periods would involve cost savings around 25,000 € per turbine.


