
Energy Performance Database of Building Heritage in the Region of Umbria, Central Italy


Abstract
:1. Introduction
2. State of Art
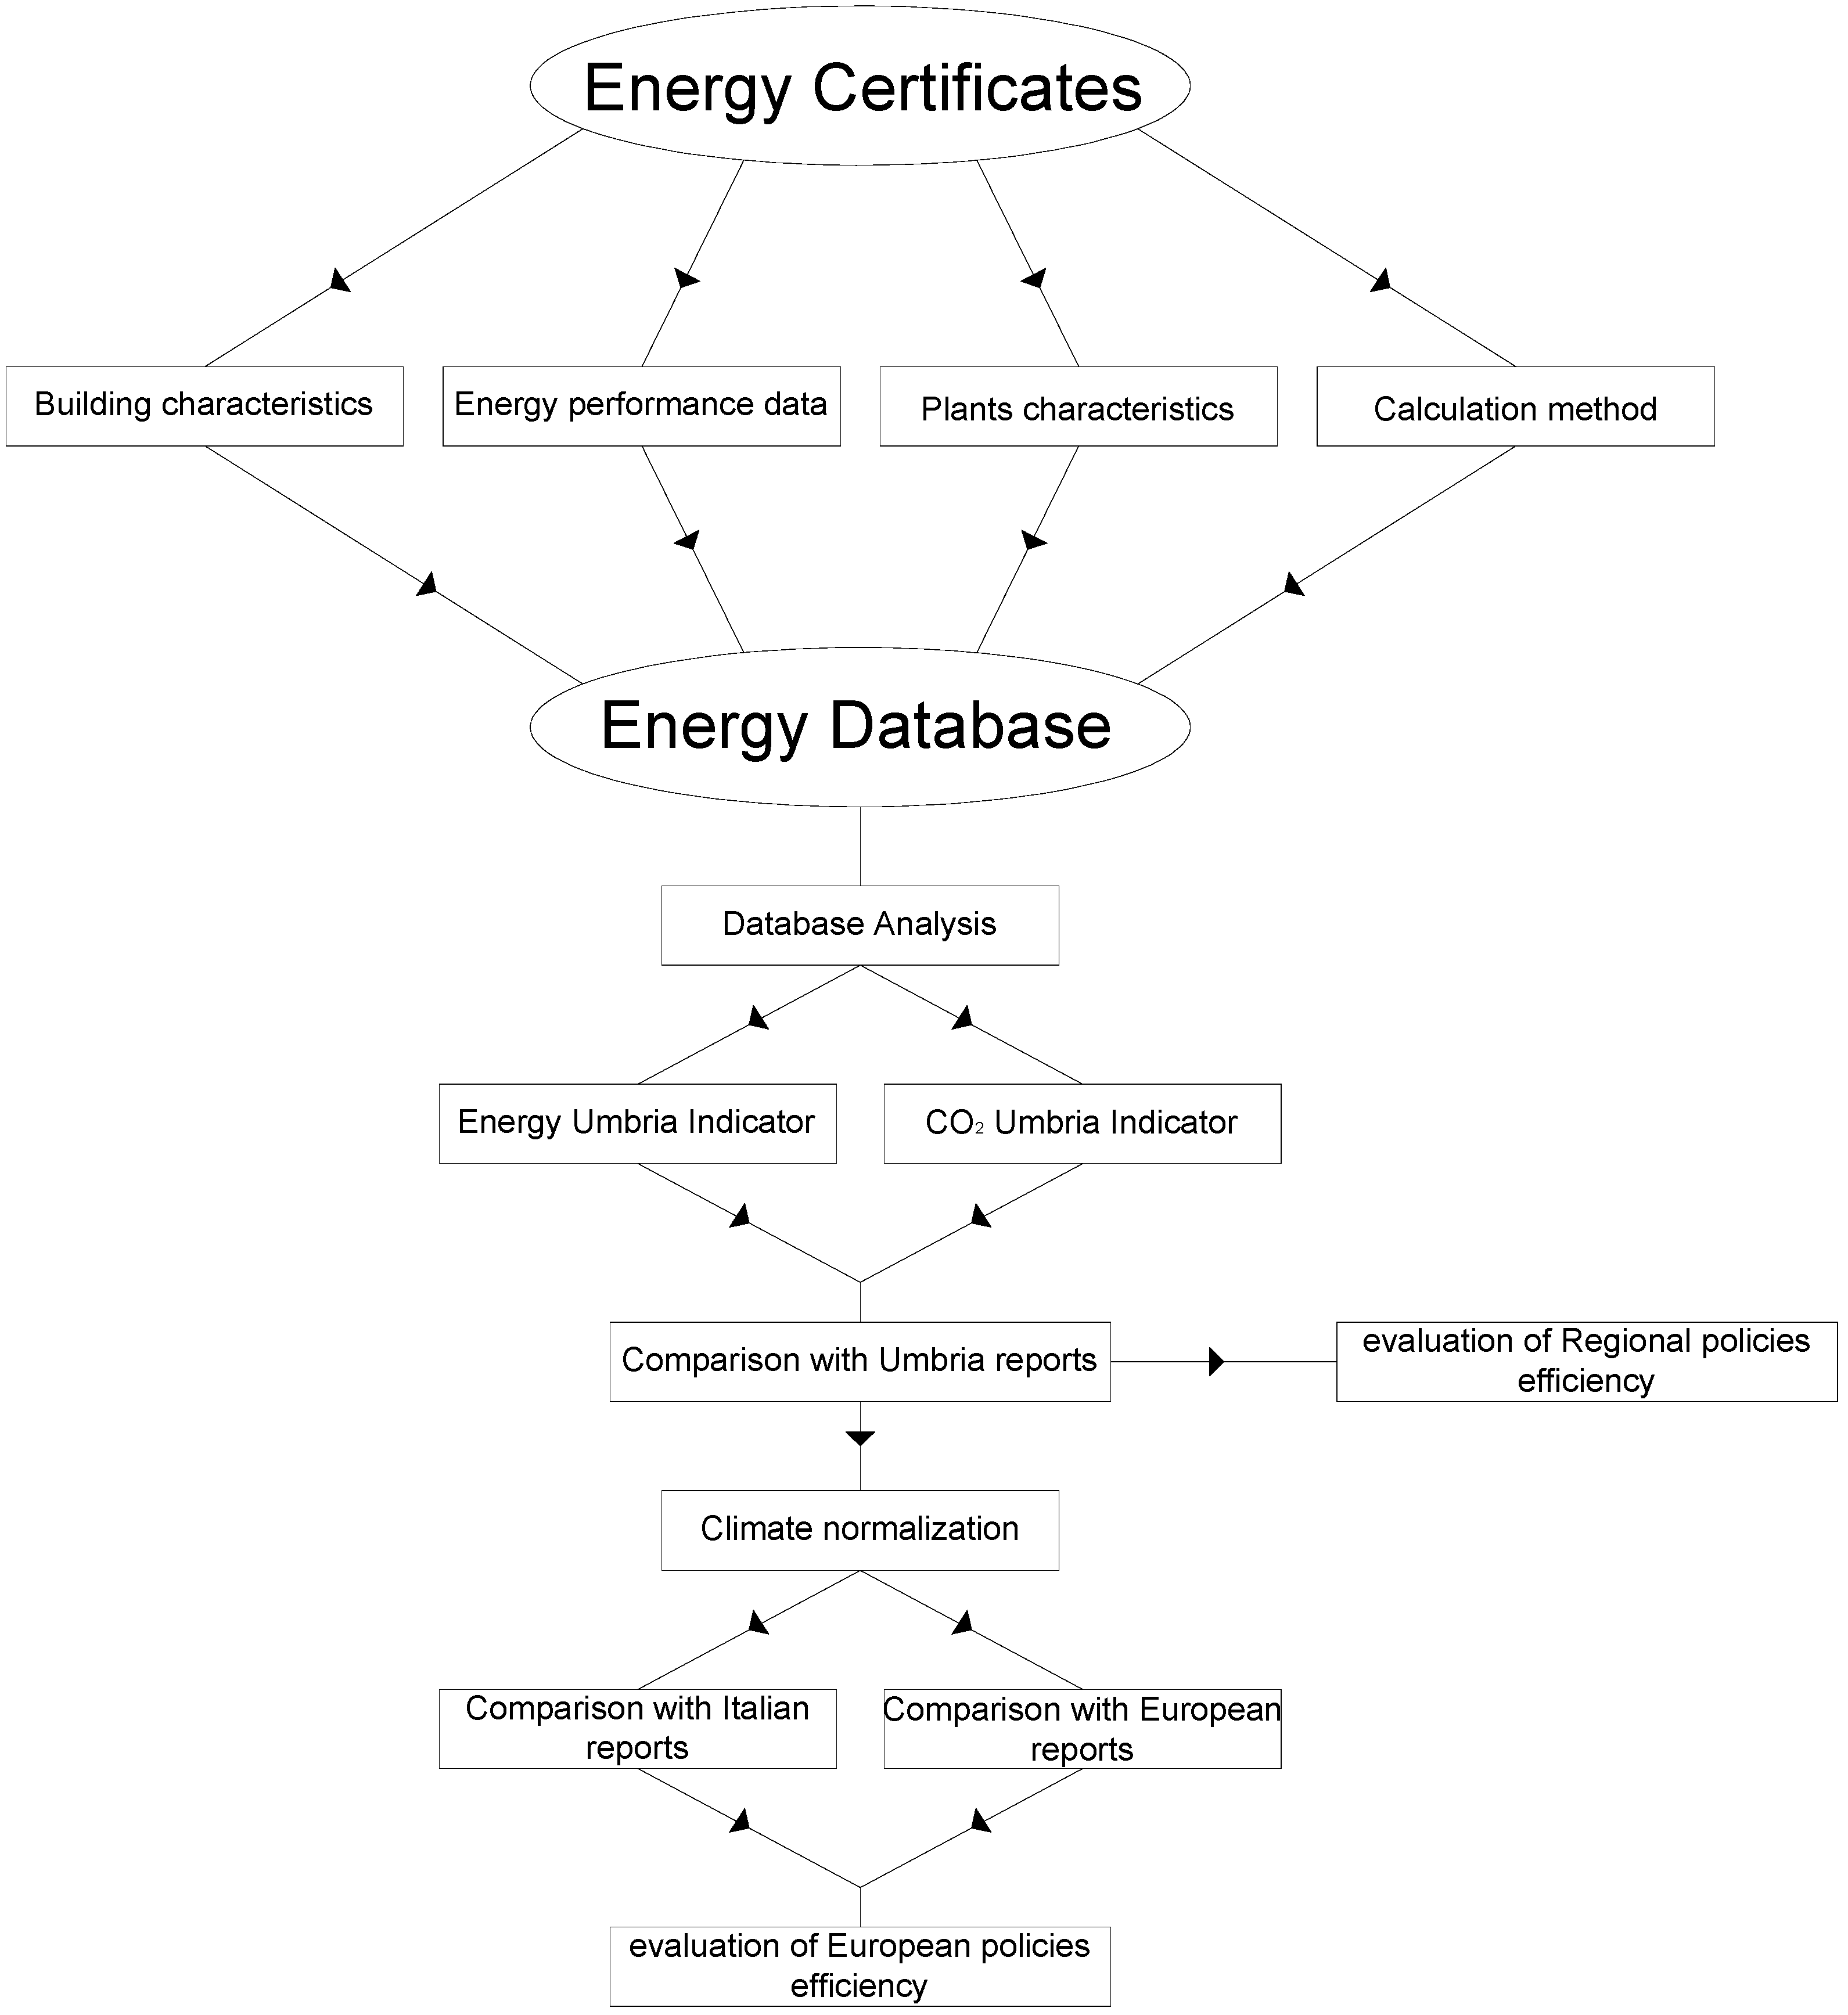
3. Methodology
- building characteristics;
- energy performance;
- advice to improve the energy performance of the buildings;
- plant characteristics;
- data and calculation methodology.

| Zone | Design Indoor Air Temperature (°C) | Mean Heating Degree-Day (HDD) |
|---|---|---|
| Umbria | 20 | 2282 |
| Umbria | 18 | 1920 |
| Italy | 18 | 1968 |
| Europe | 18 | 3420 |
4. Results
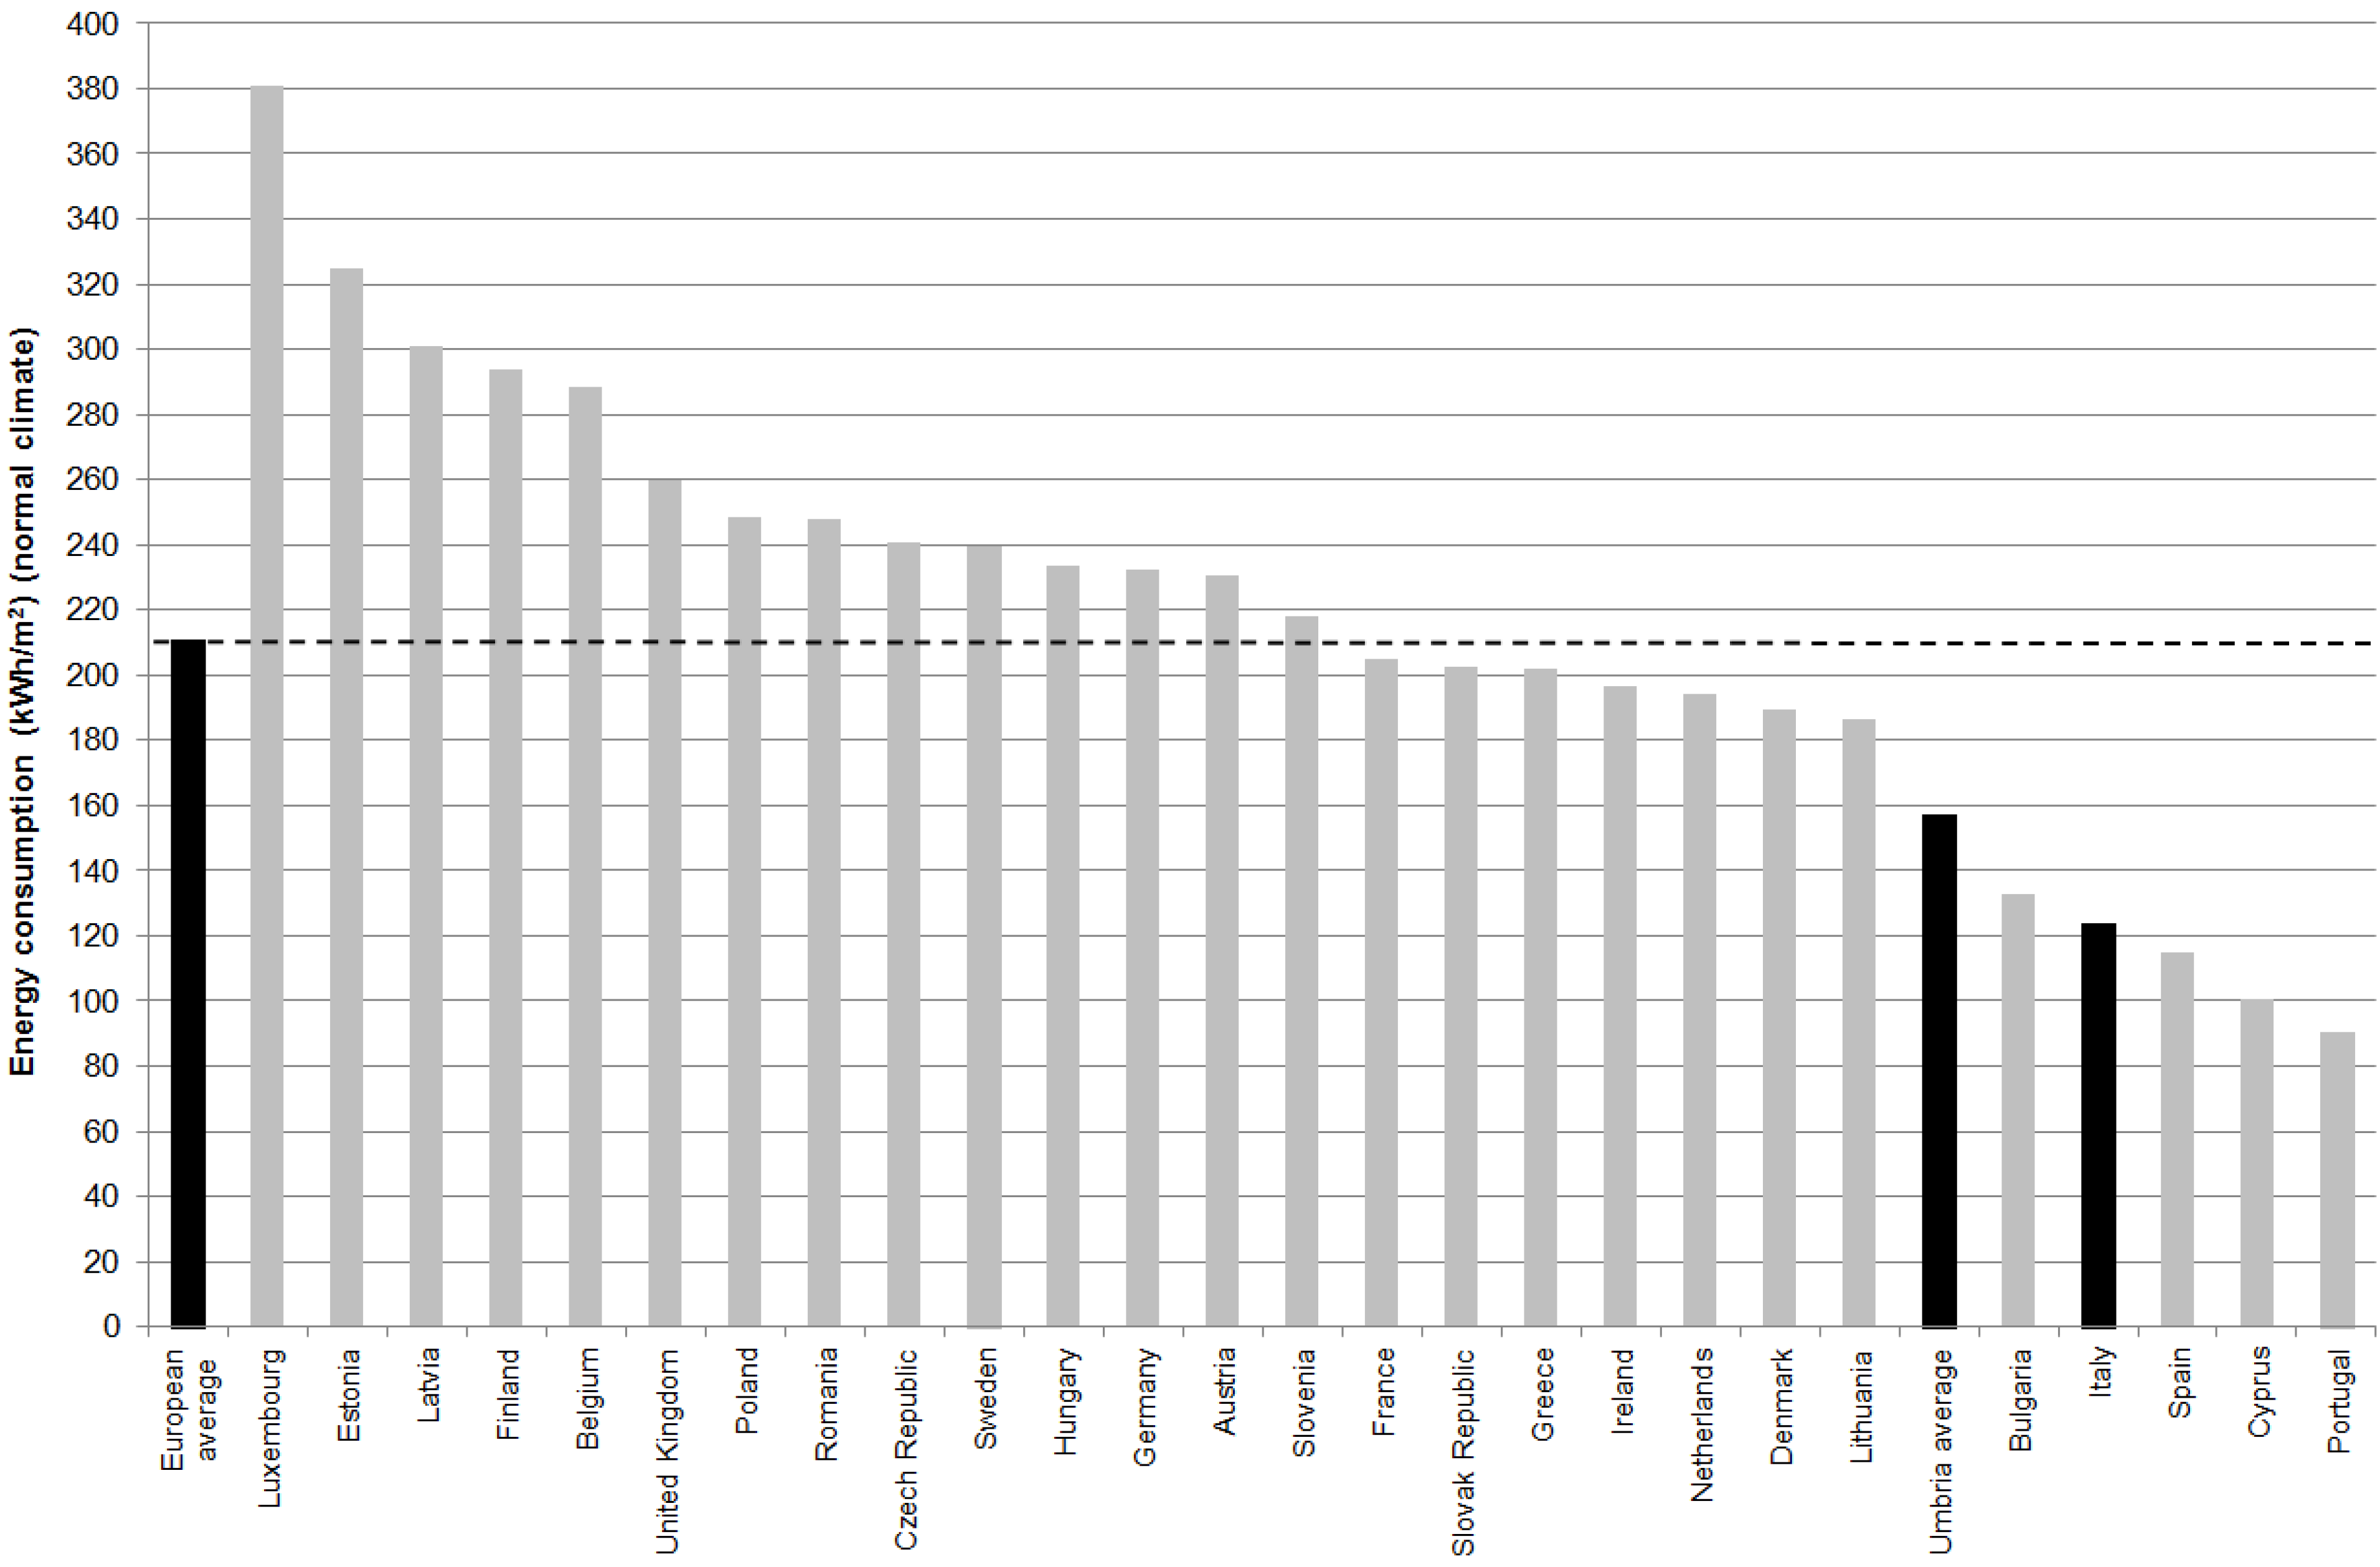
4.1. Energy Performance
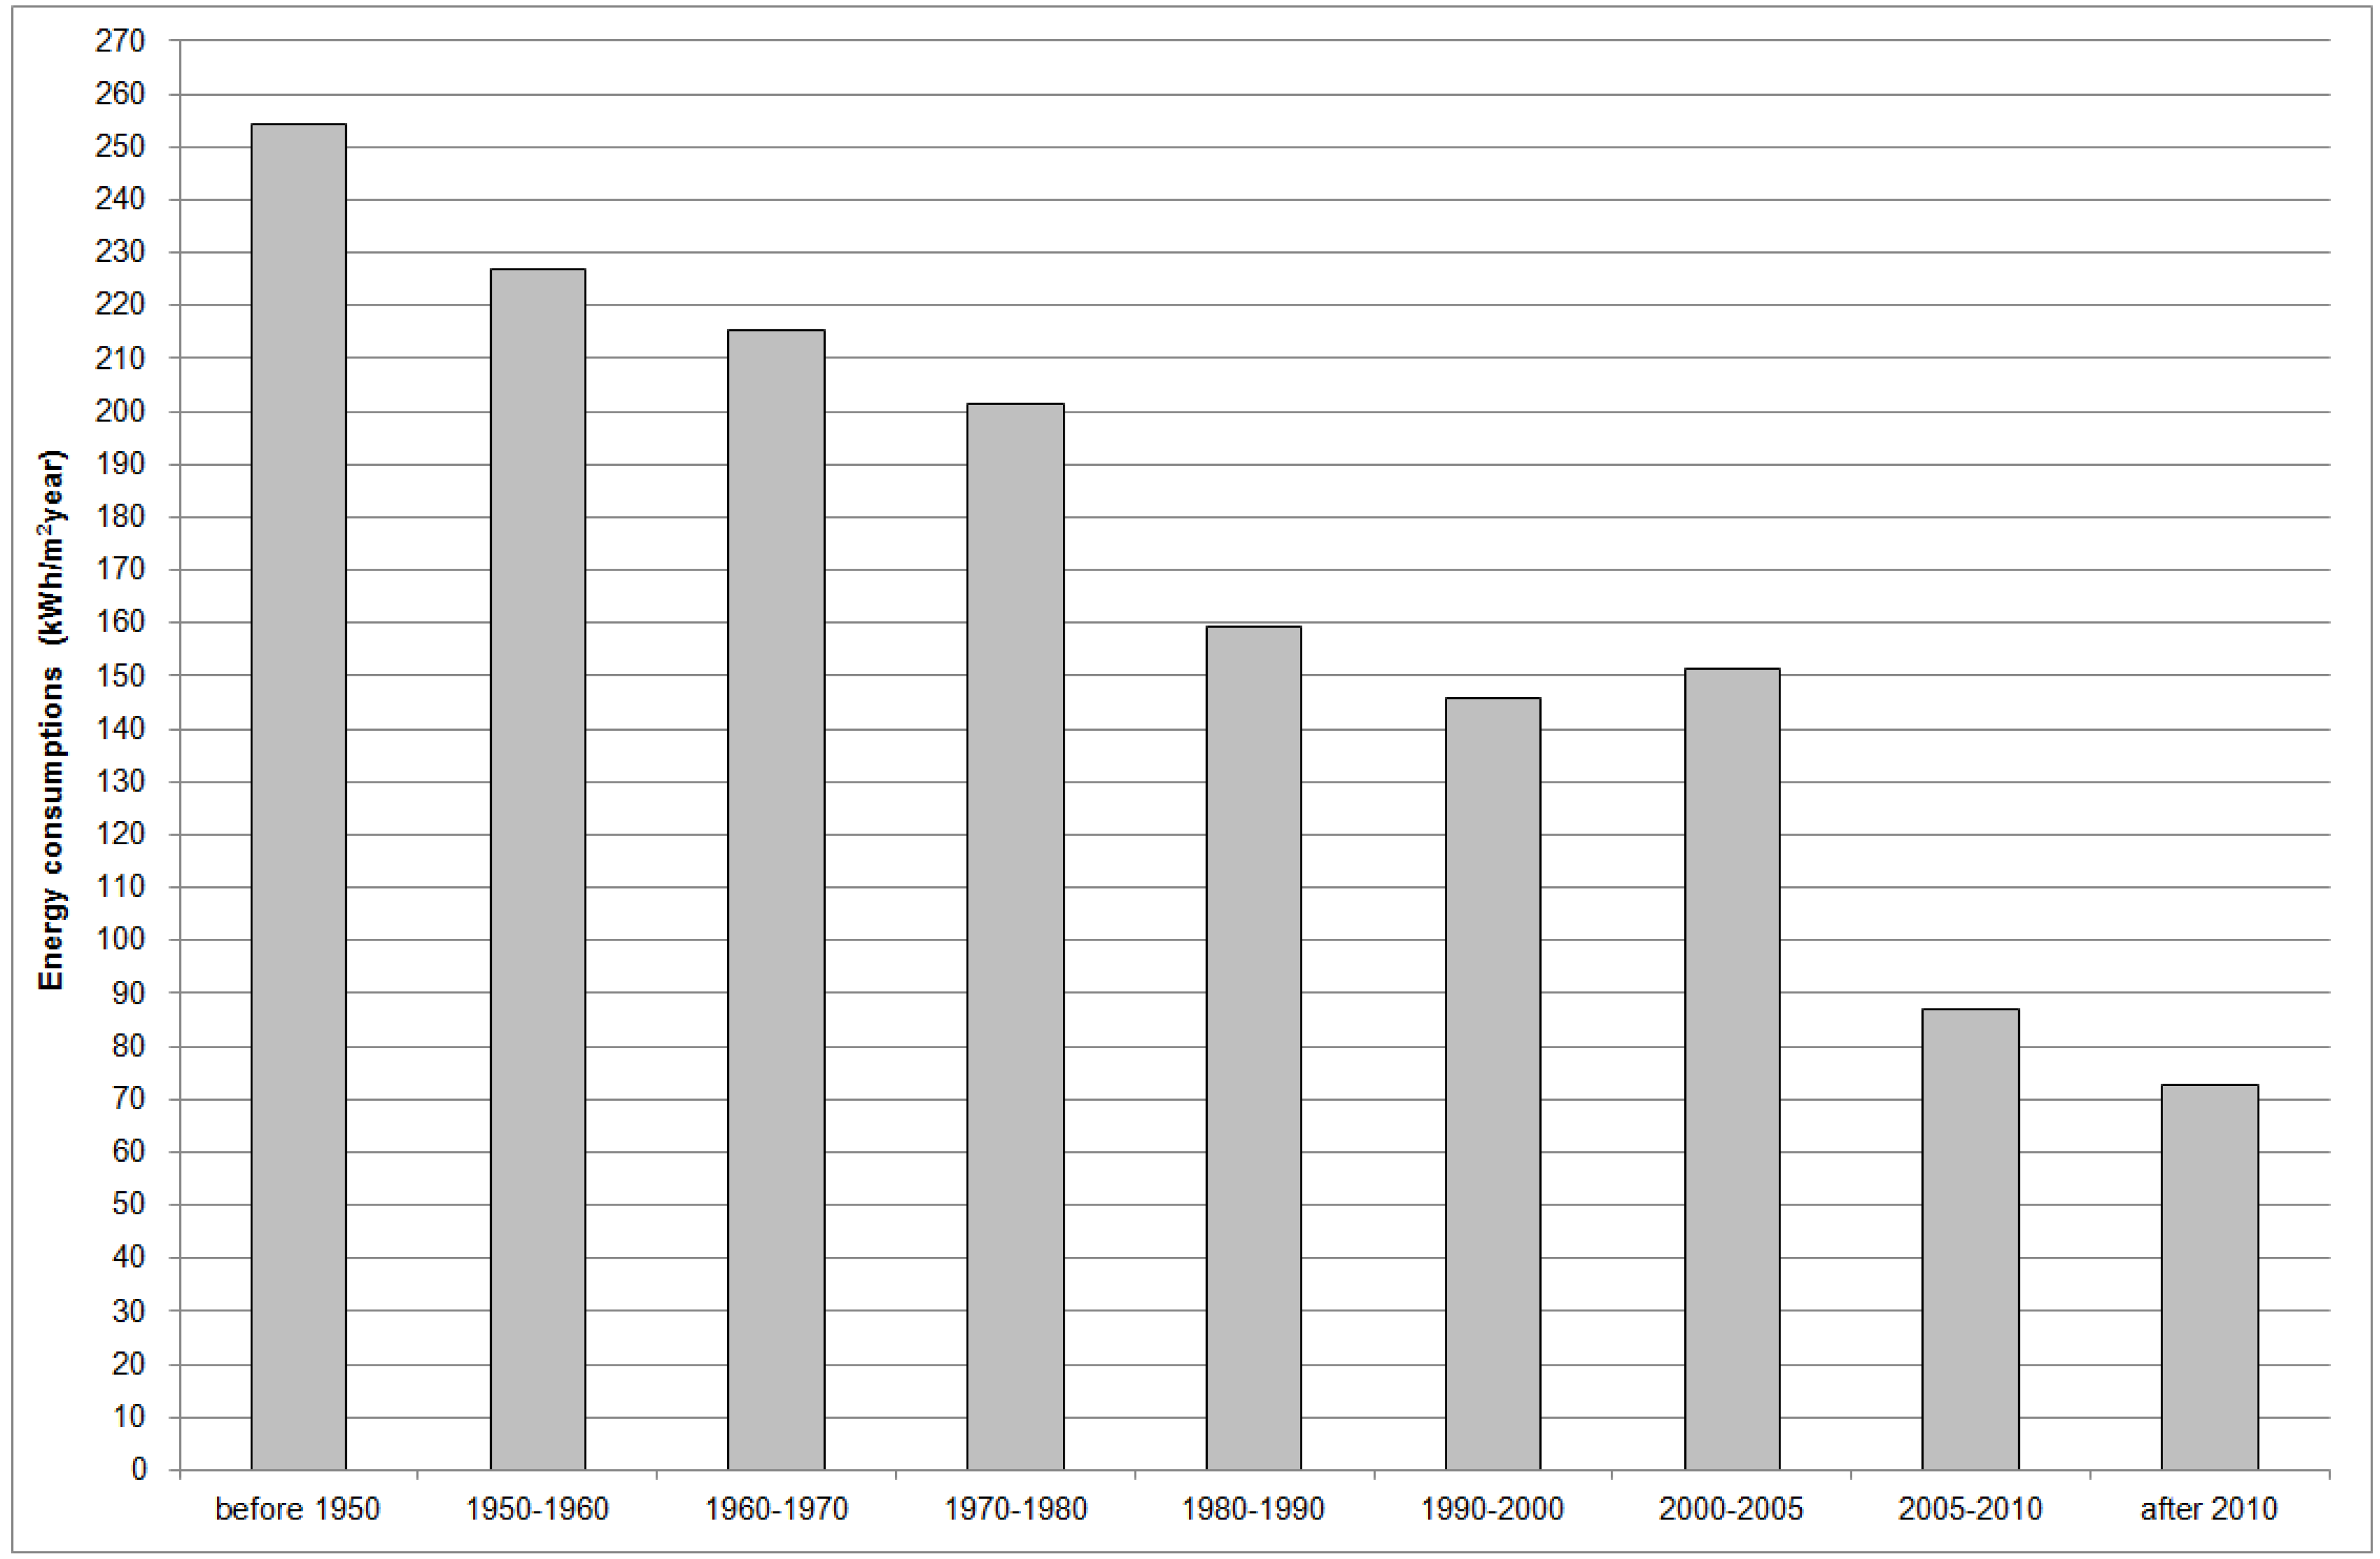
| Year of Construction | Energy Certificates (%) | Heated Volume (m3) * | Floor Area (m2) * | Heat Transmission Surface (m2) * | Heat Transmission Surface/Heated Volume Ratio—S/V (m−1) * |
|---|---|---|---|---|---|
| <1950 | 6.0% | 457.41 | 115.32 | 281.67 | 0.86 |
| 1950–1960 | 2.5% | 387.06 | 104.52 | 222.78 | 0.77 |
| 1960–1970 | 4.9% | 503.52 | 130.71 | 267.31 | 0.67 |
| 1970–1980 | 4.2% | 434.50 | 120.05 | 251.97 | 1.18 |
| 1980–1990 | 3.7% | 387.32 | 105.31 | 225.14 | 0.75 |
| 1990–2000 | 6.3% | 351.18 | 94.07 | 201.22 | 0.67 |
| 2000–2005 | 5.2% | 320.29 | 375.81 | 228.72 | 0.92 |
| 2005–2010 | 49.7% | 312.81 | 92.77 | 182.12 | 1.15 |
| >2010 | 12.2% | 314.73 | 127.46 | 199.66 | 0.61 |
| Other ** | 5.3% | 372.20 | 97.63 | 239.69 | 0.91 |
| Type | Share | Type | Share |
|---|---|---|---|
| Apartment building | 49.10% | Terraced house | 4.70% |
| Multi-family house | 13.30% | Multi-story building | 3.10% |
| Tower house | 7.90% | Historic building | 1.40% |
| Detached house | 6.20% | Undeclared * | 14.30% |
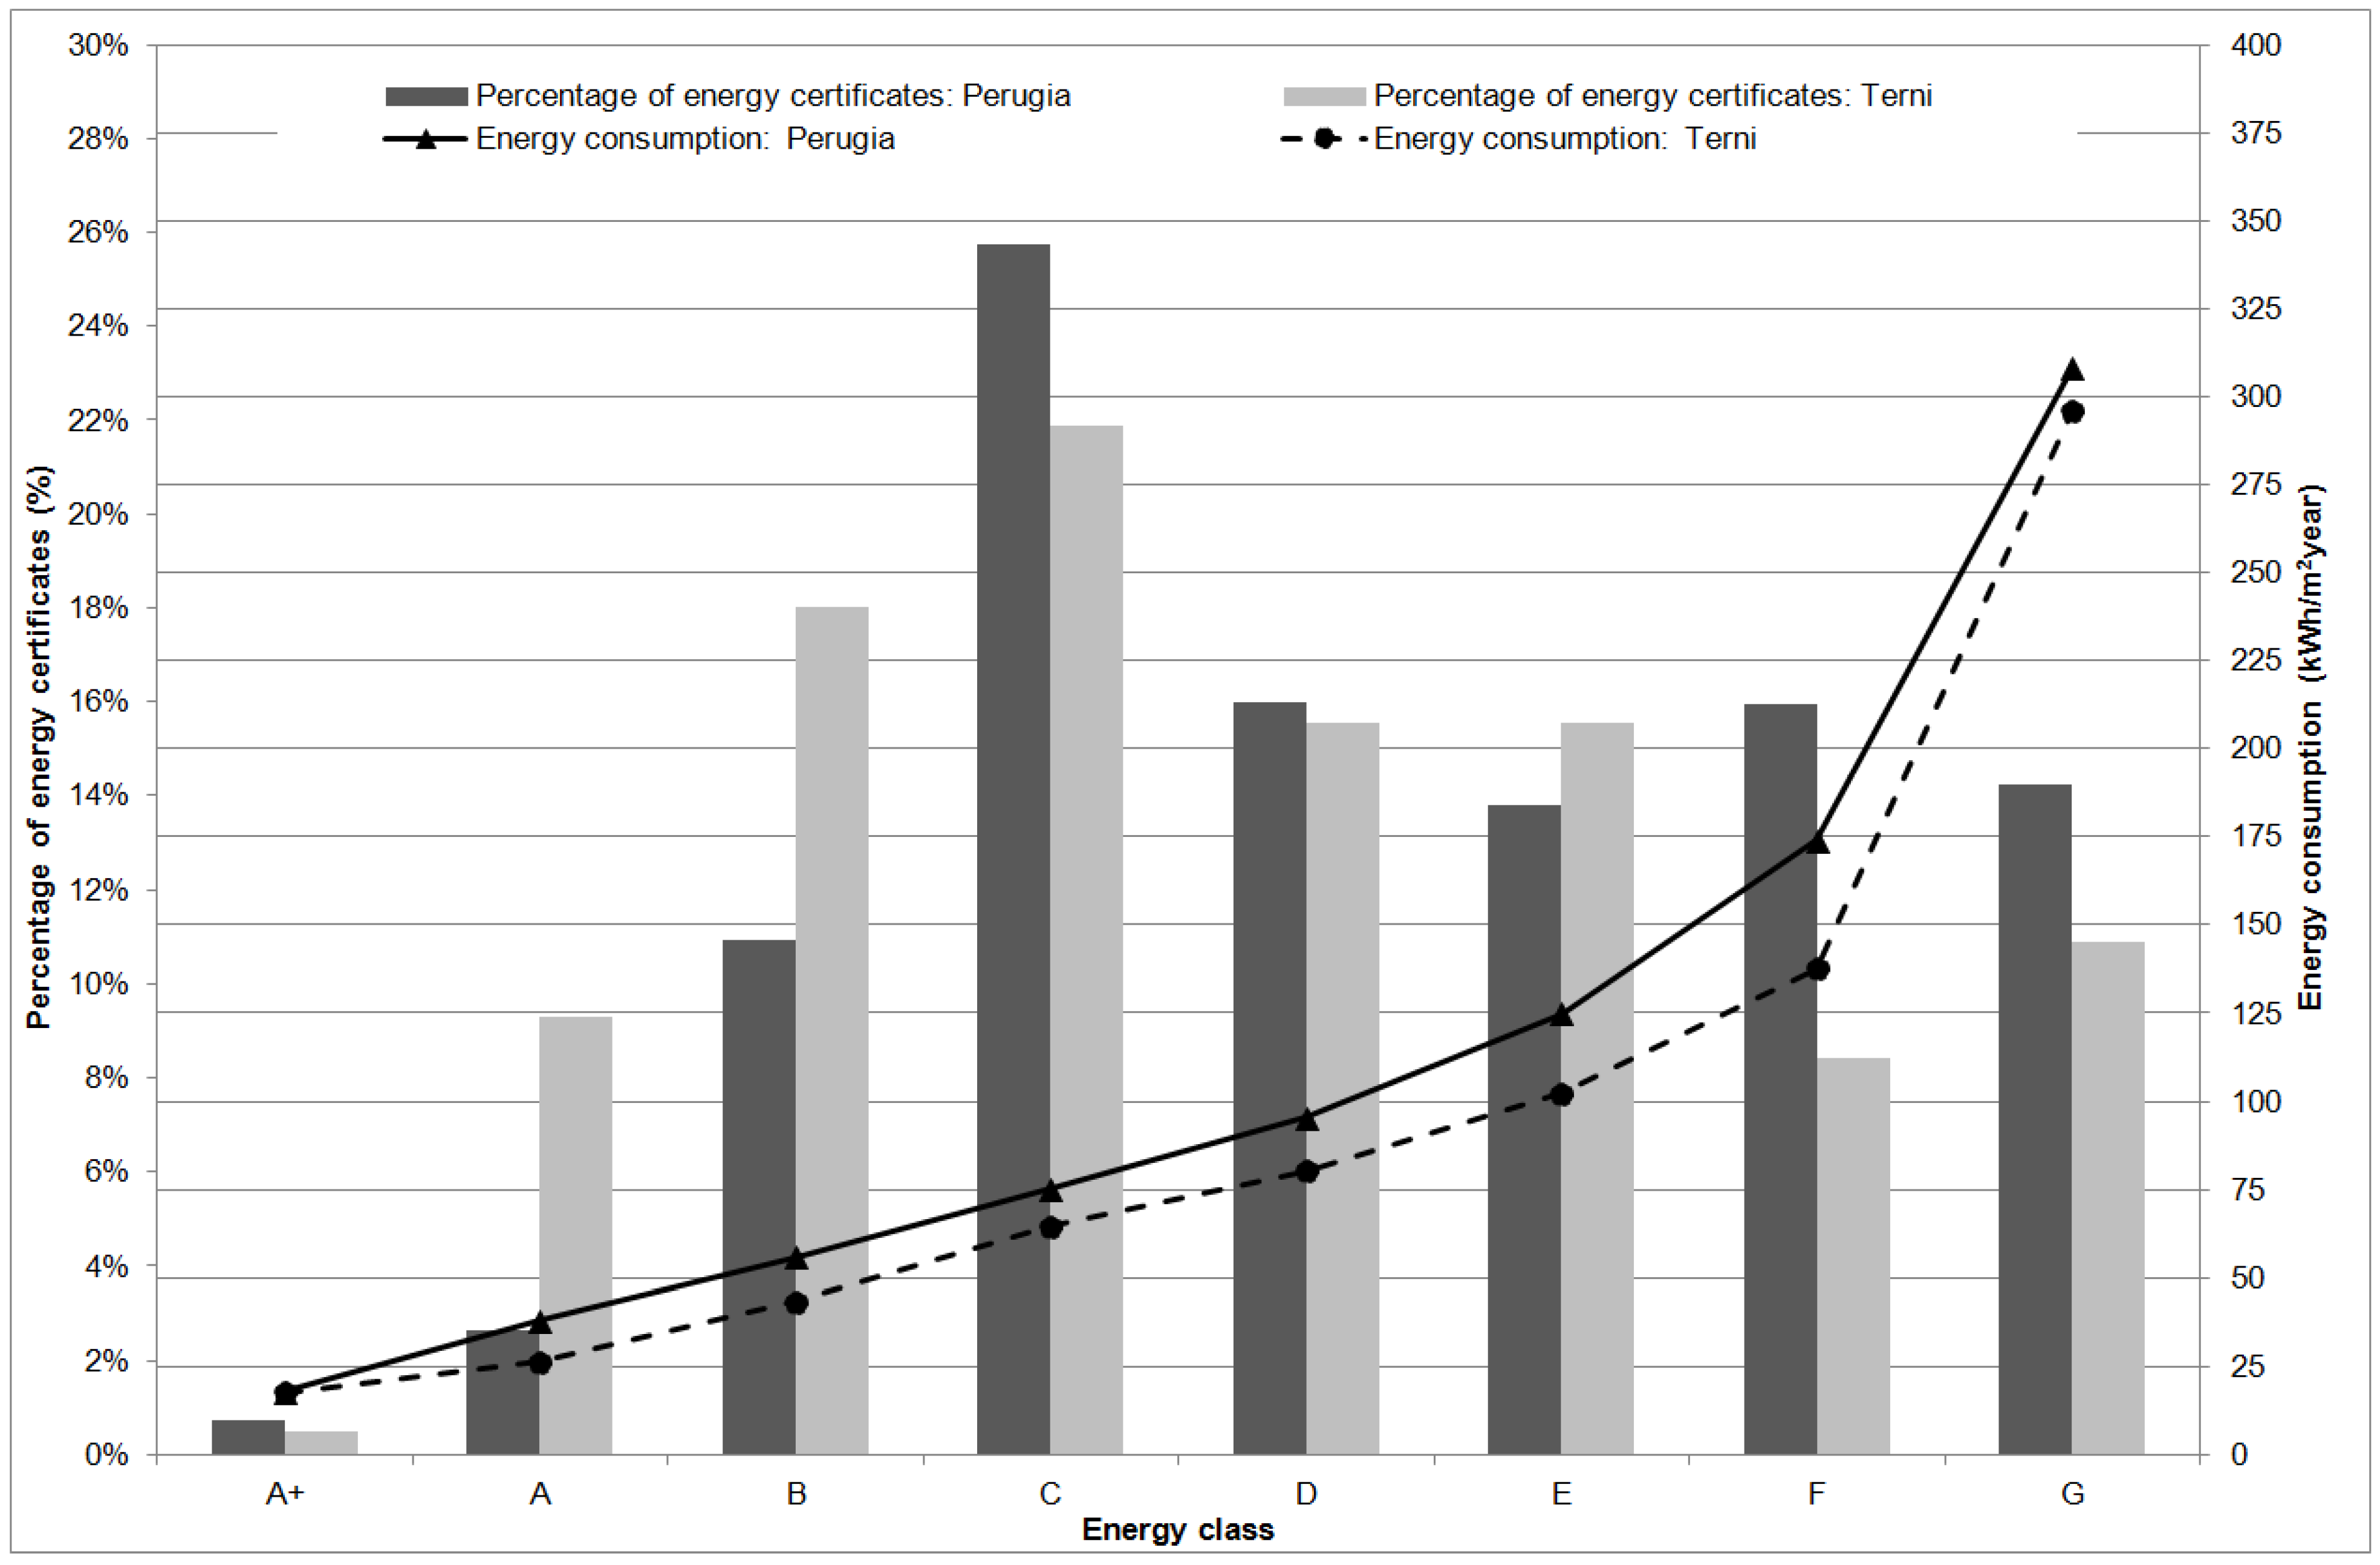
| Province | Regional Consumptions [30] | Umbria Energy Database | Difference (%) | ||
|---|---|---|---|---|---|
| Natural Gas for Heating (Nm3) | Energy (kWh/(m2Year)) | Natural Gas (Nm3) | Energy (kWh/(m2Year)) | ||
| Perugia | 9.87 | 103.59 | 11.94 | 125.33 | +17.3% |
| Terni | 7.83 | 82.21 | 8.54 | 89.64 | +8.3% |

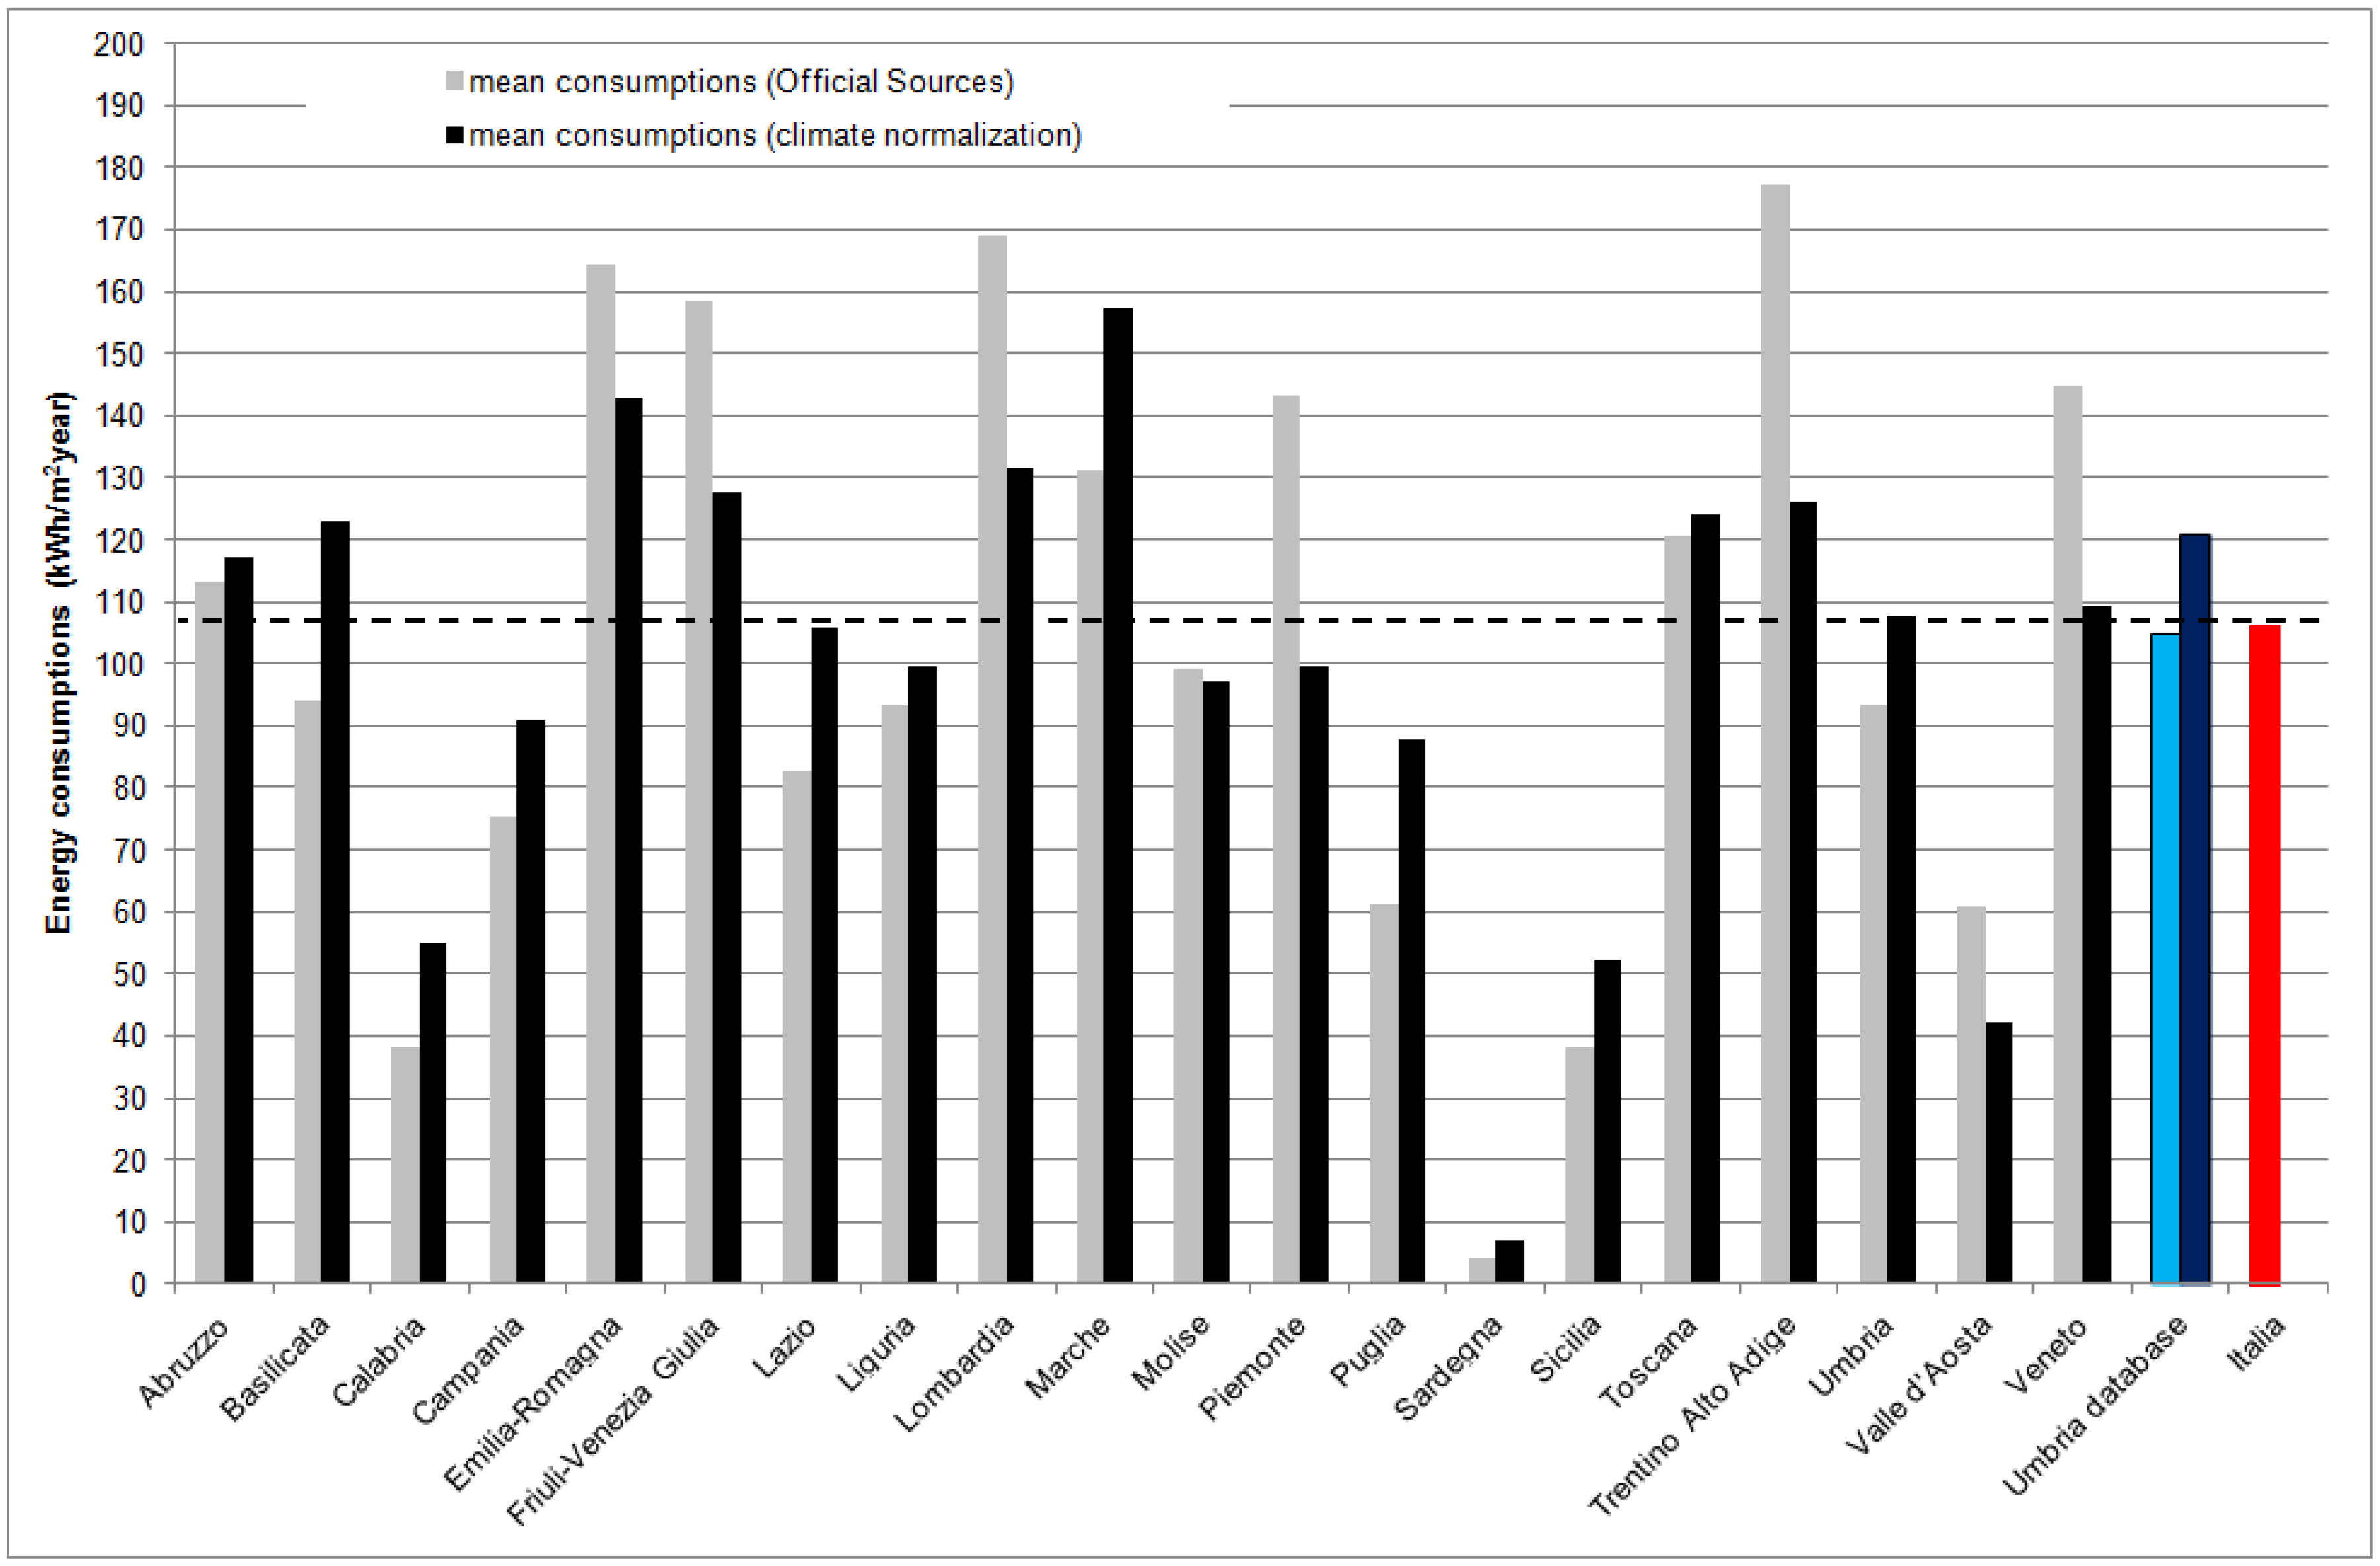
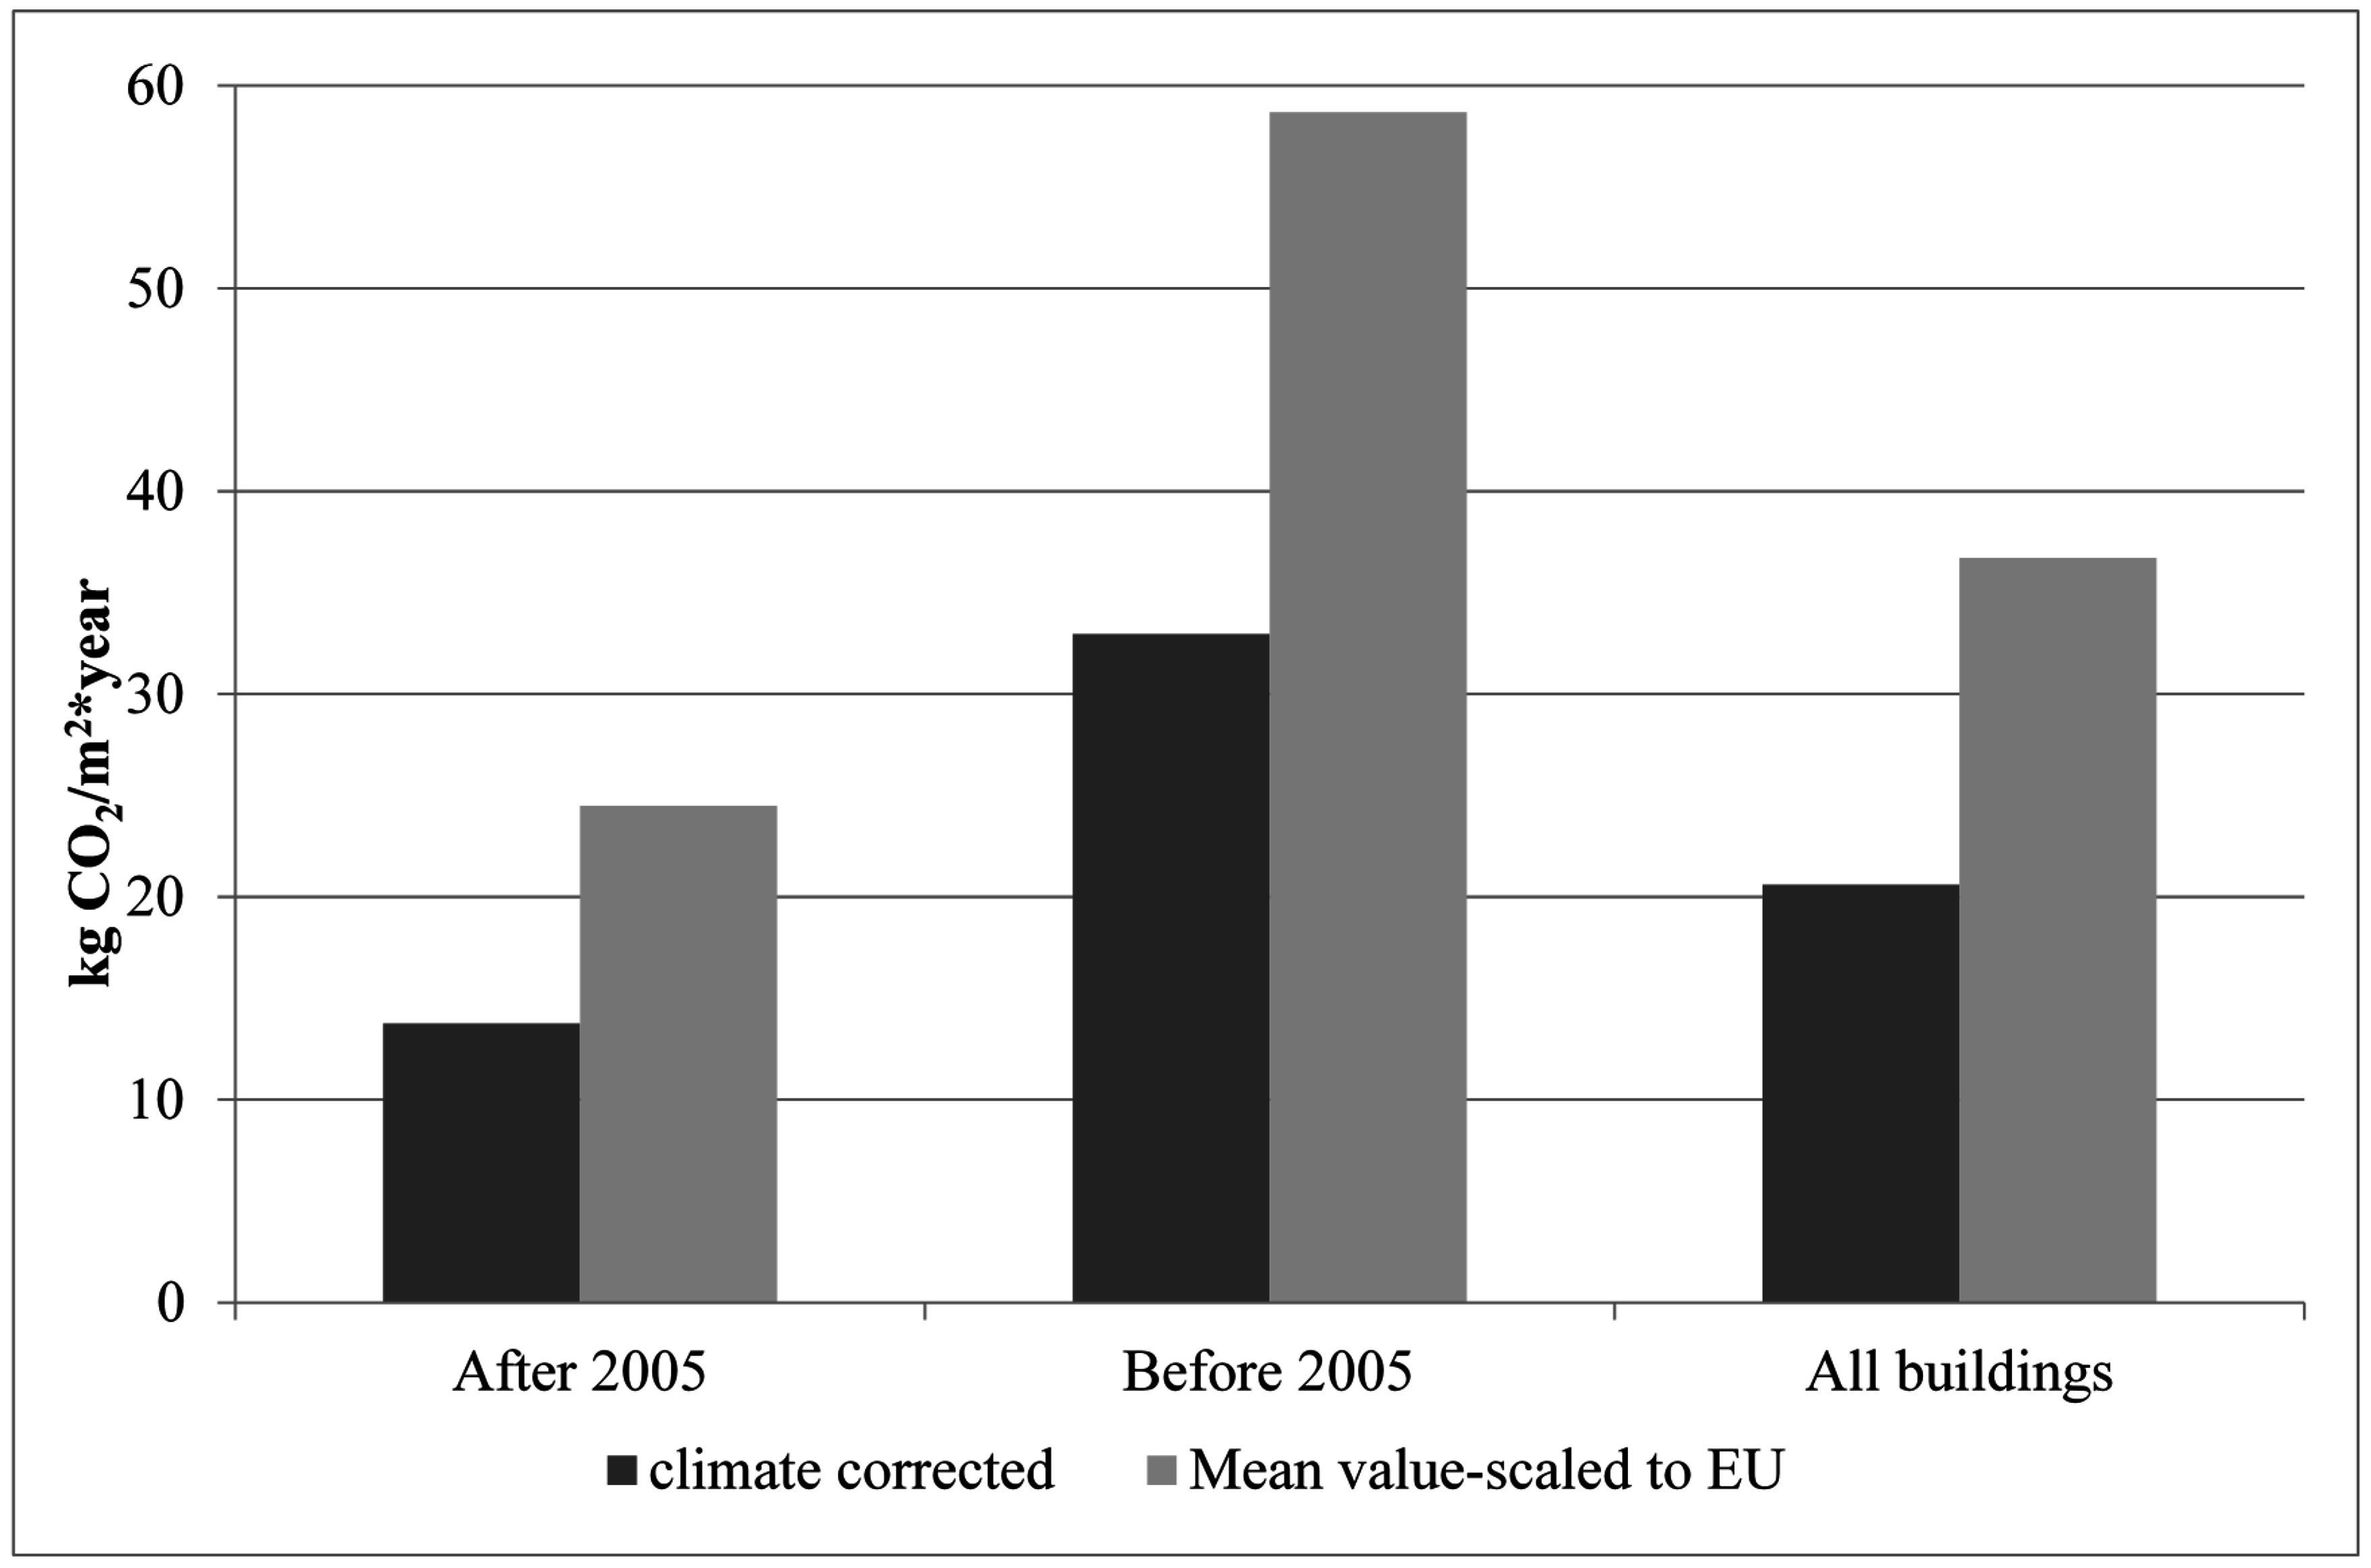
| Zone | Mean Heating Degree-Day (DD) | Mean Energy Consumption (kWh/(m2Year)) |
|---|---|---|
| Umbria mean value | 2282 | 104.85 |
| Umbria mean value climate corrected | 1920 | 88.22 |
| Umbria mean value climate scaled to Italy | 1968 | 90.43 |
| Umbria mean value climate scaled to Europe | 3420 | 157.1 |


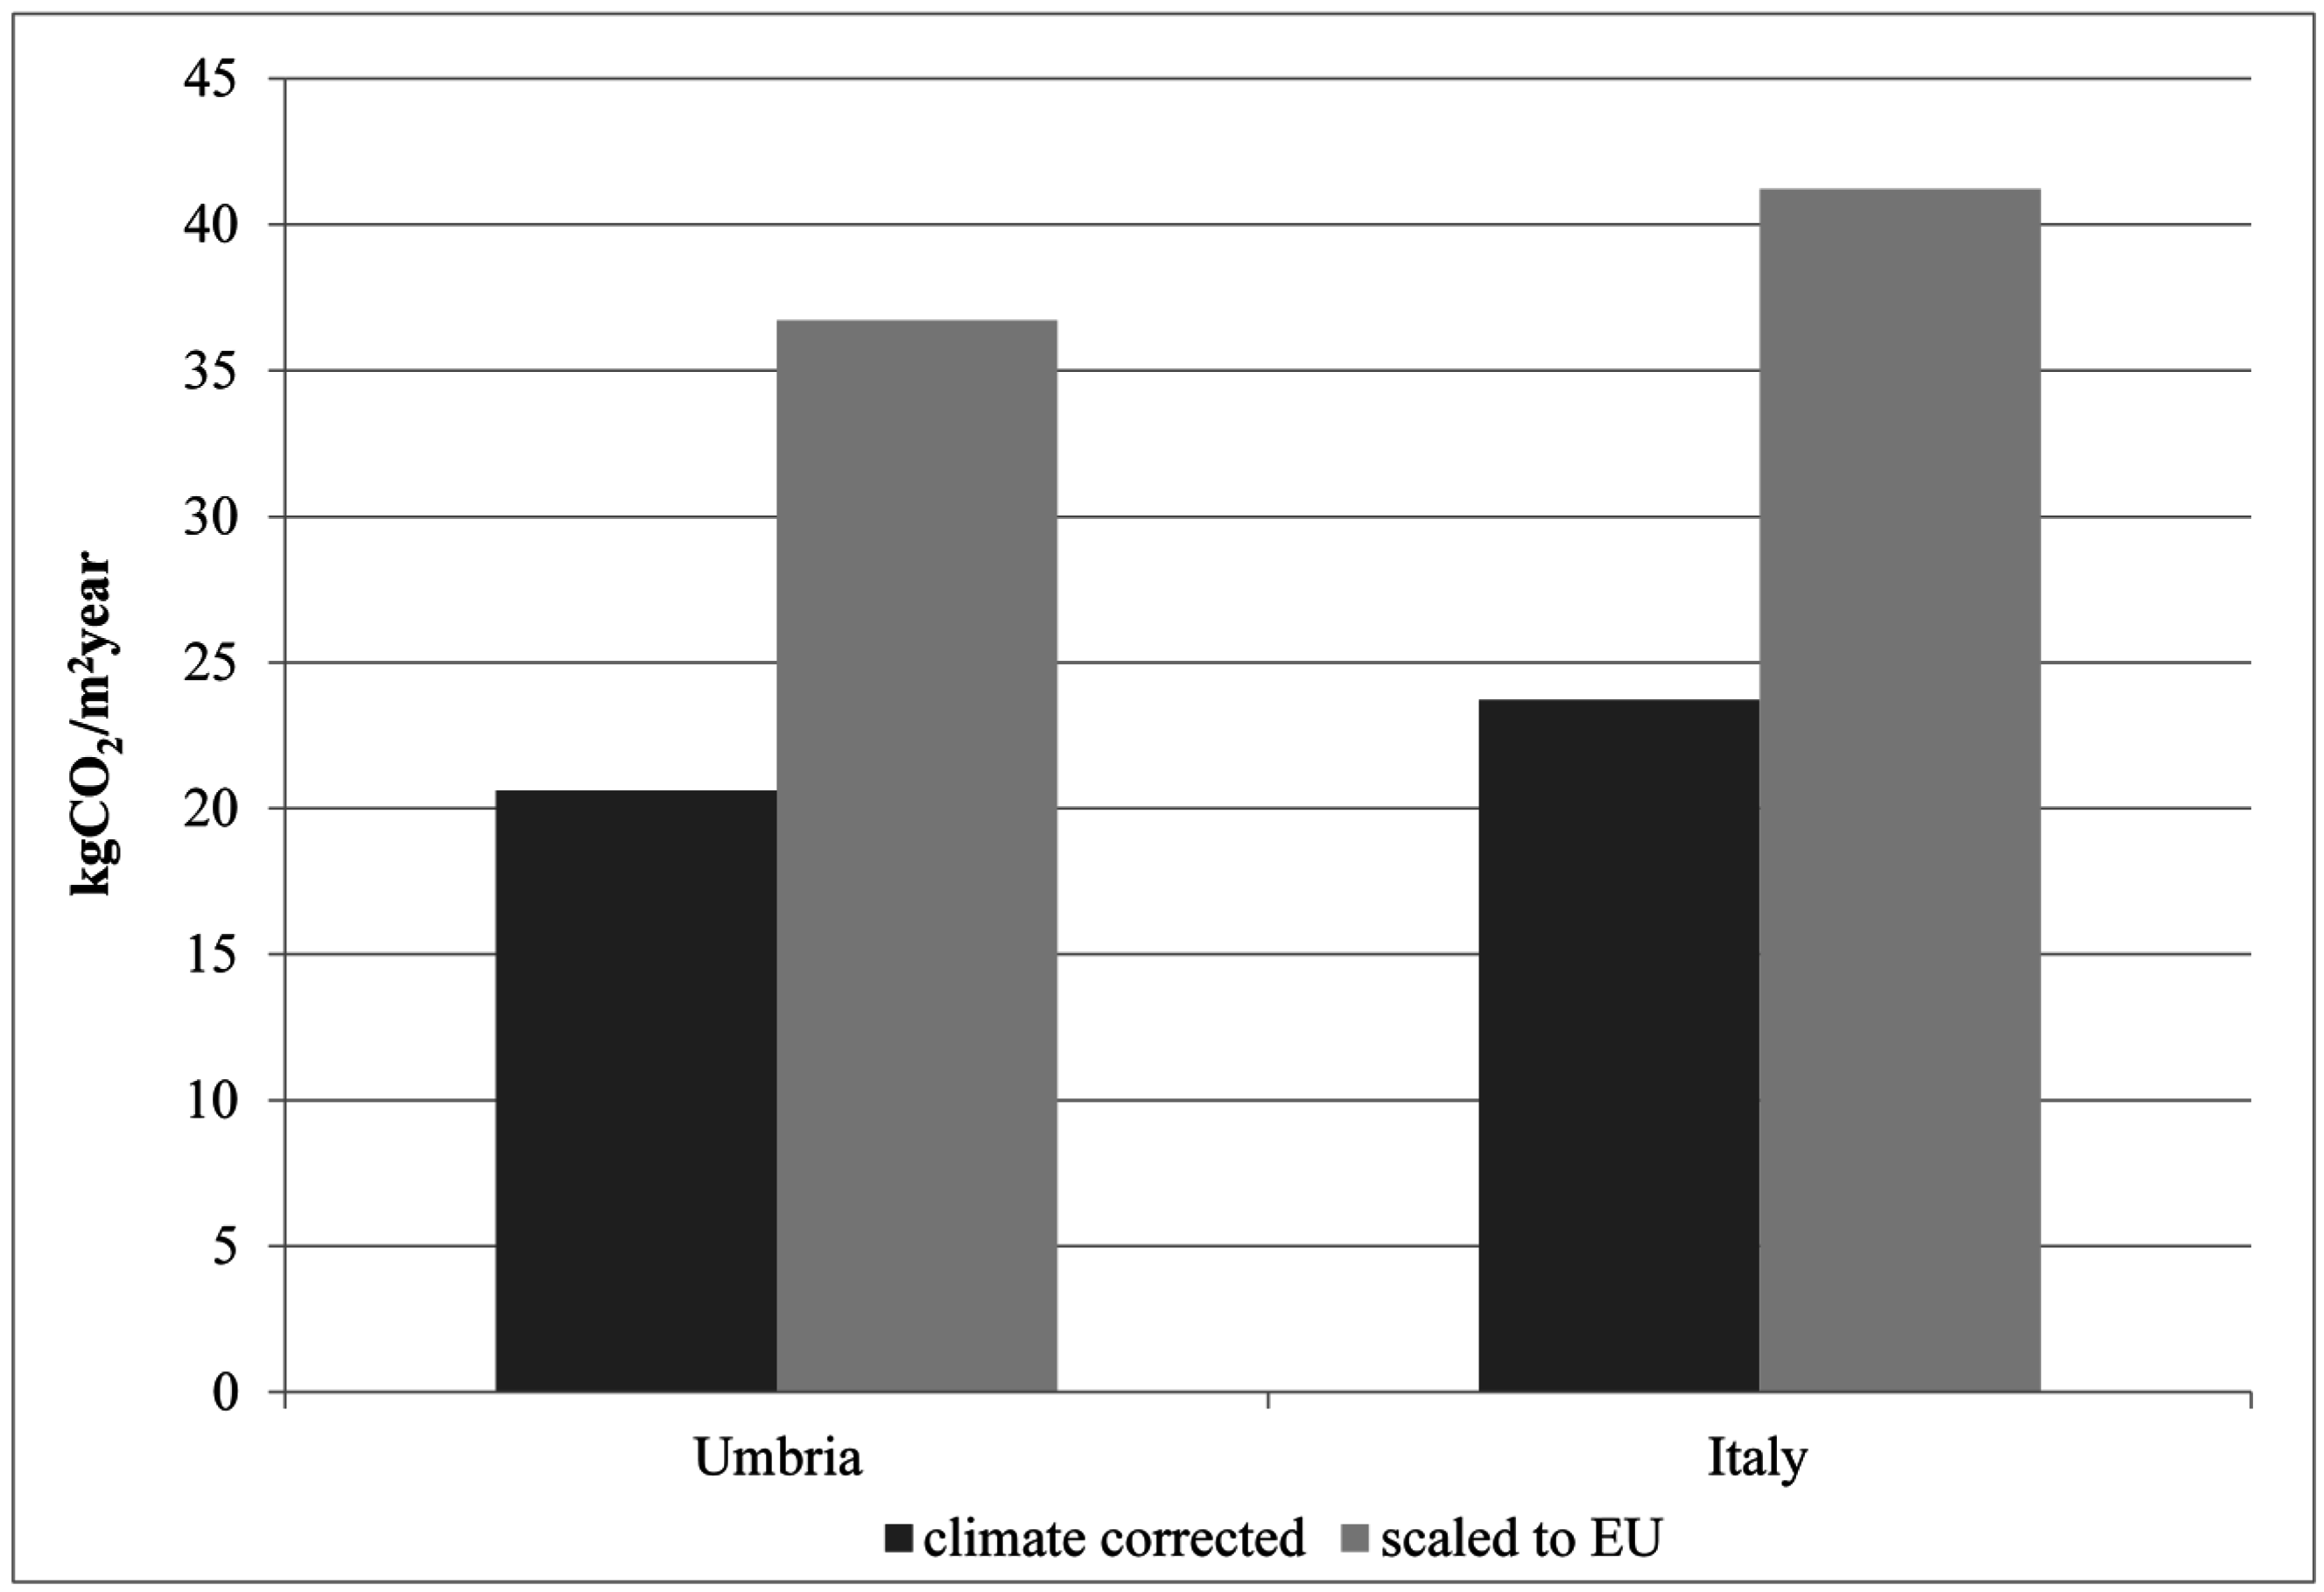
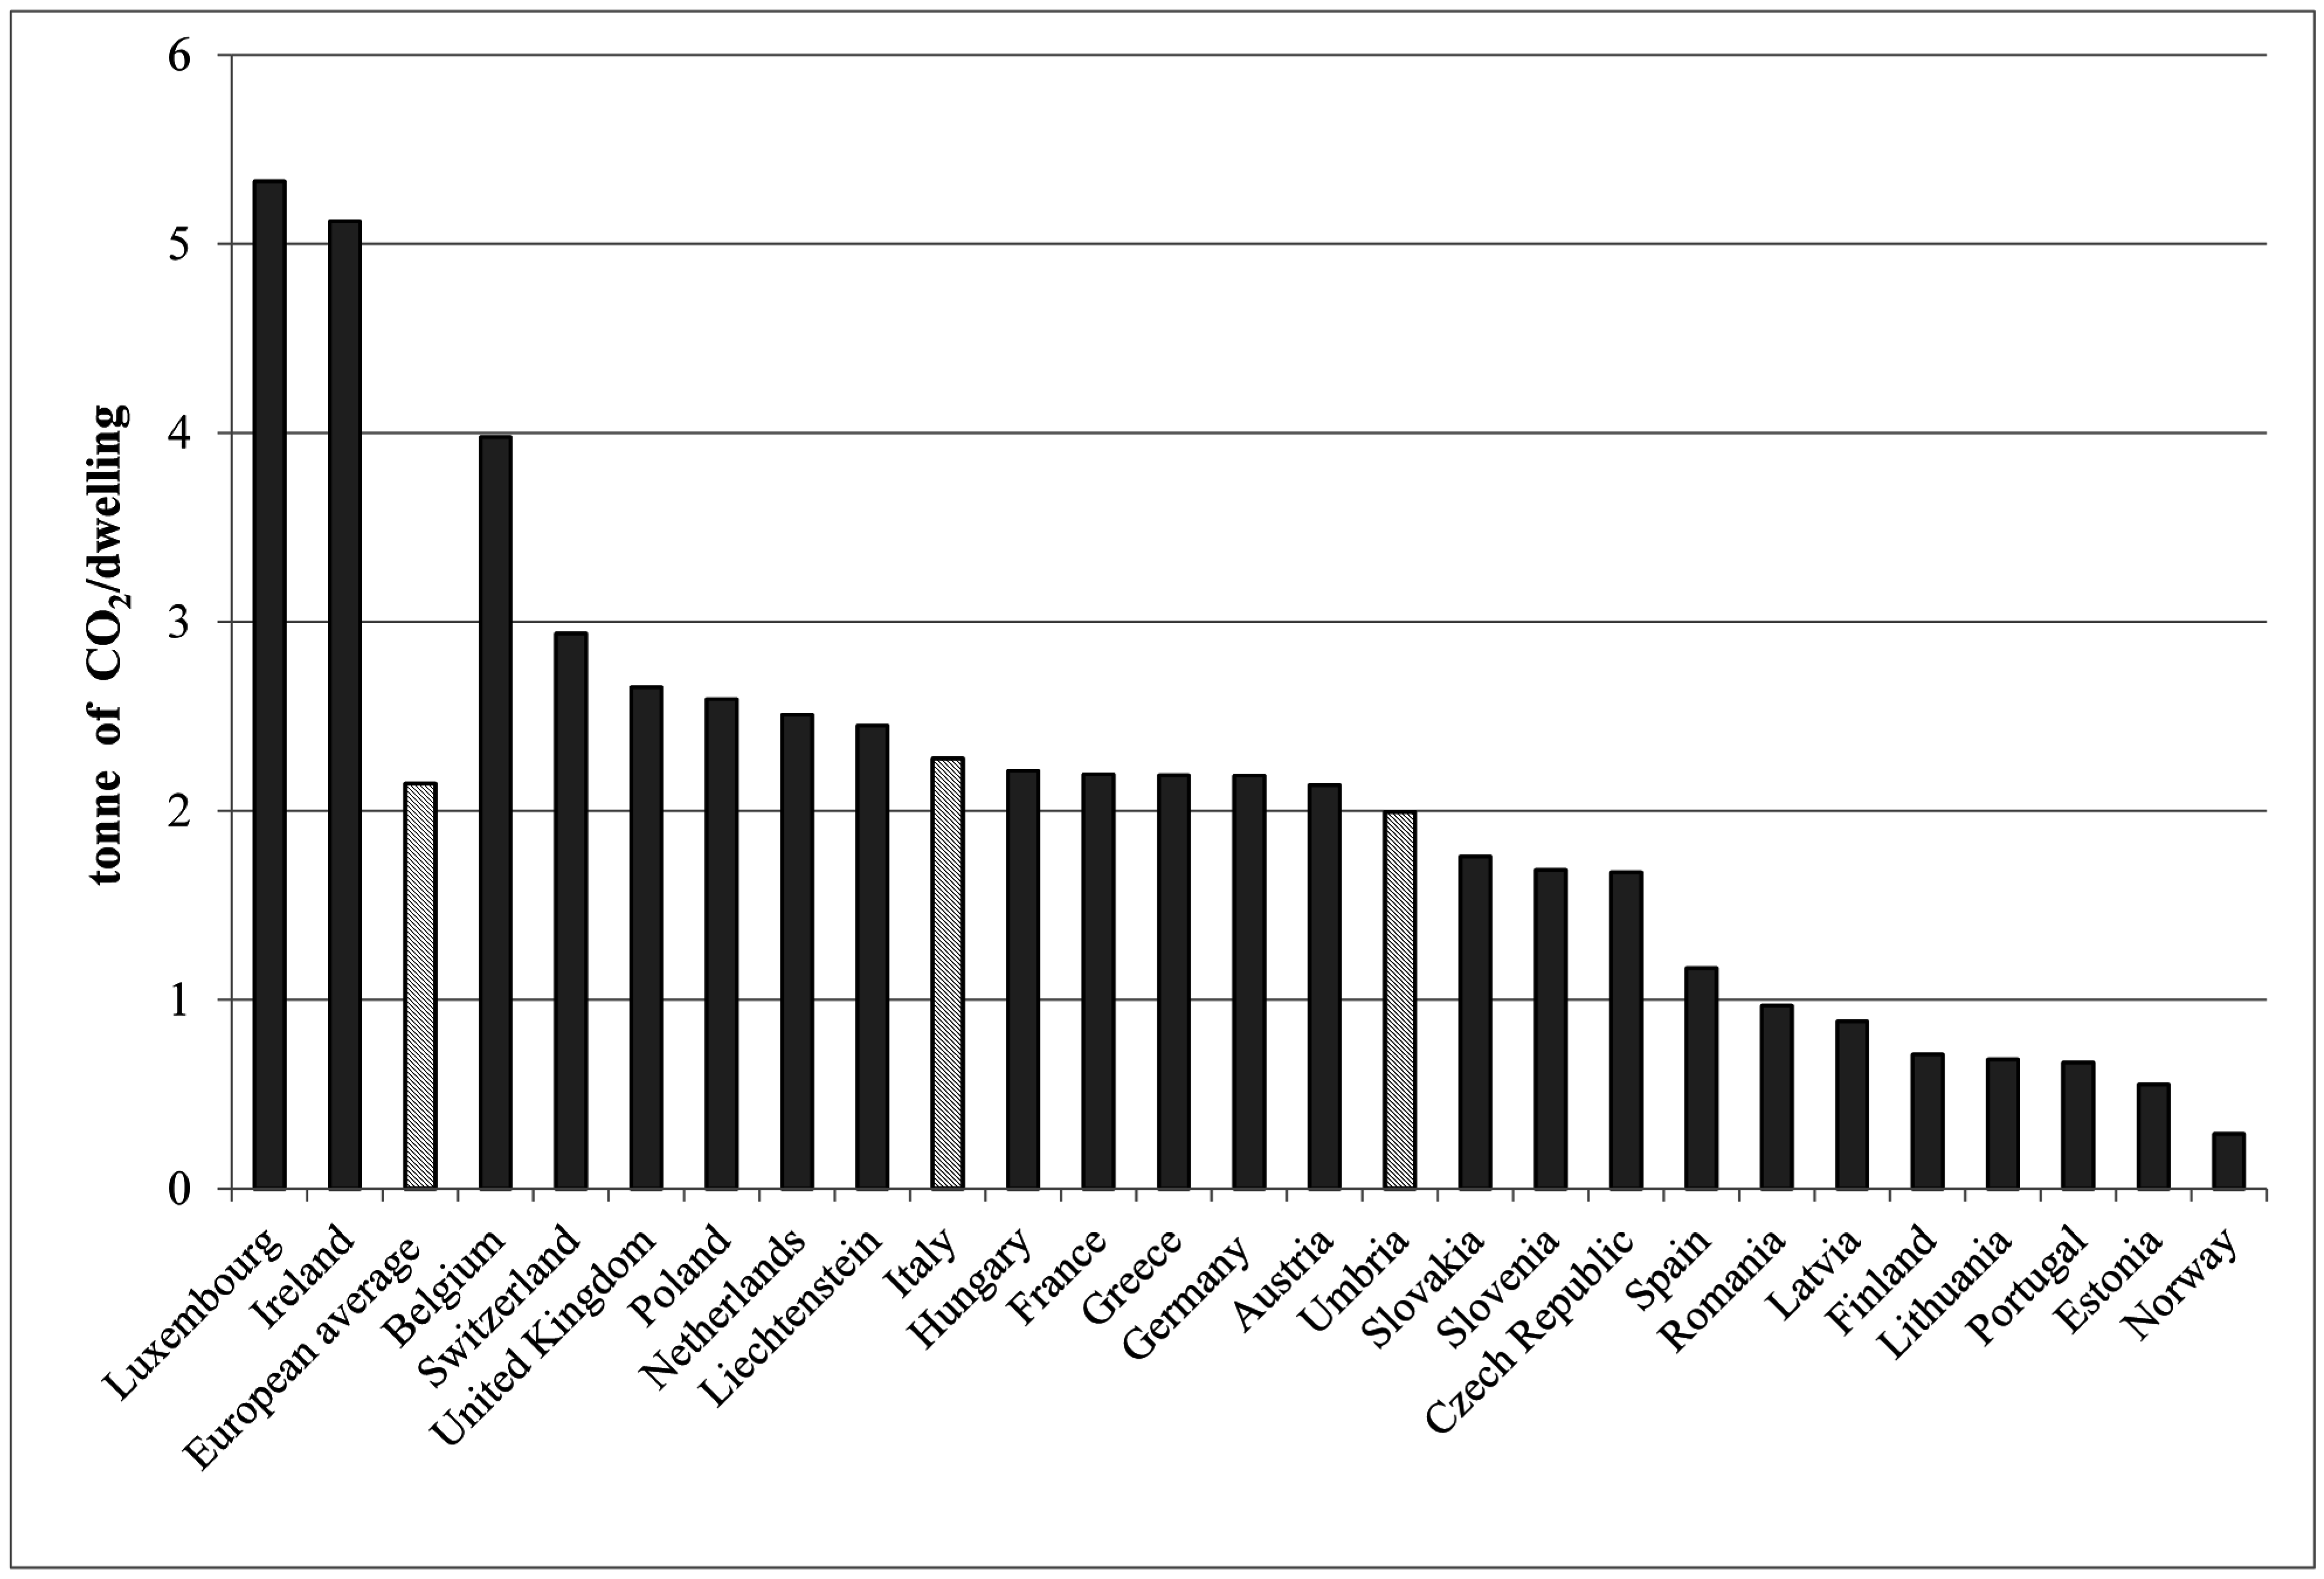
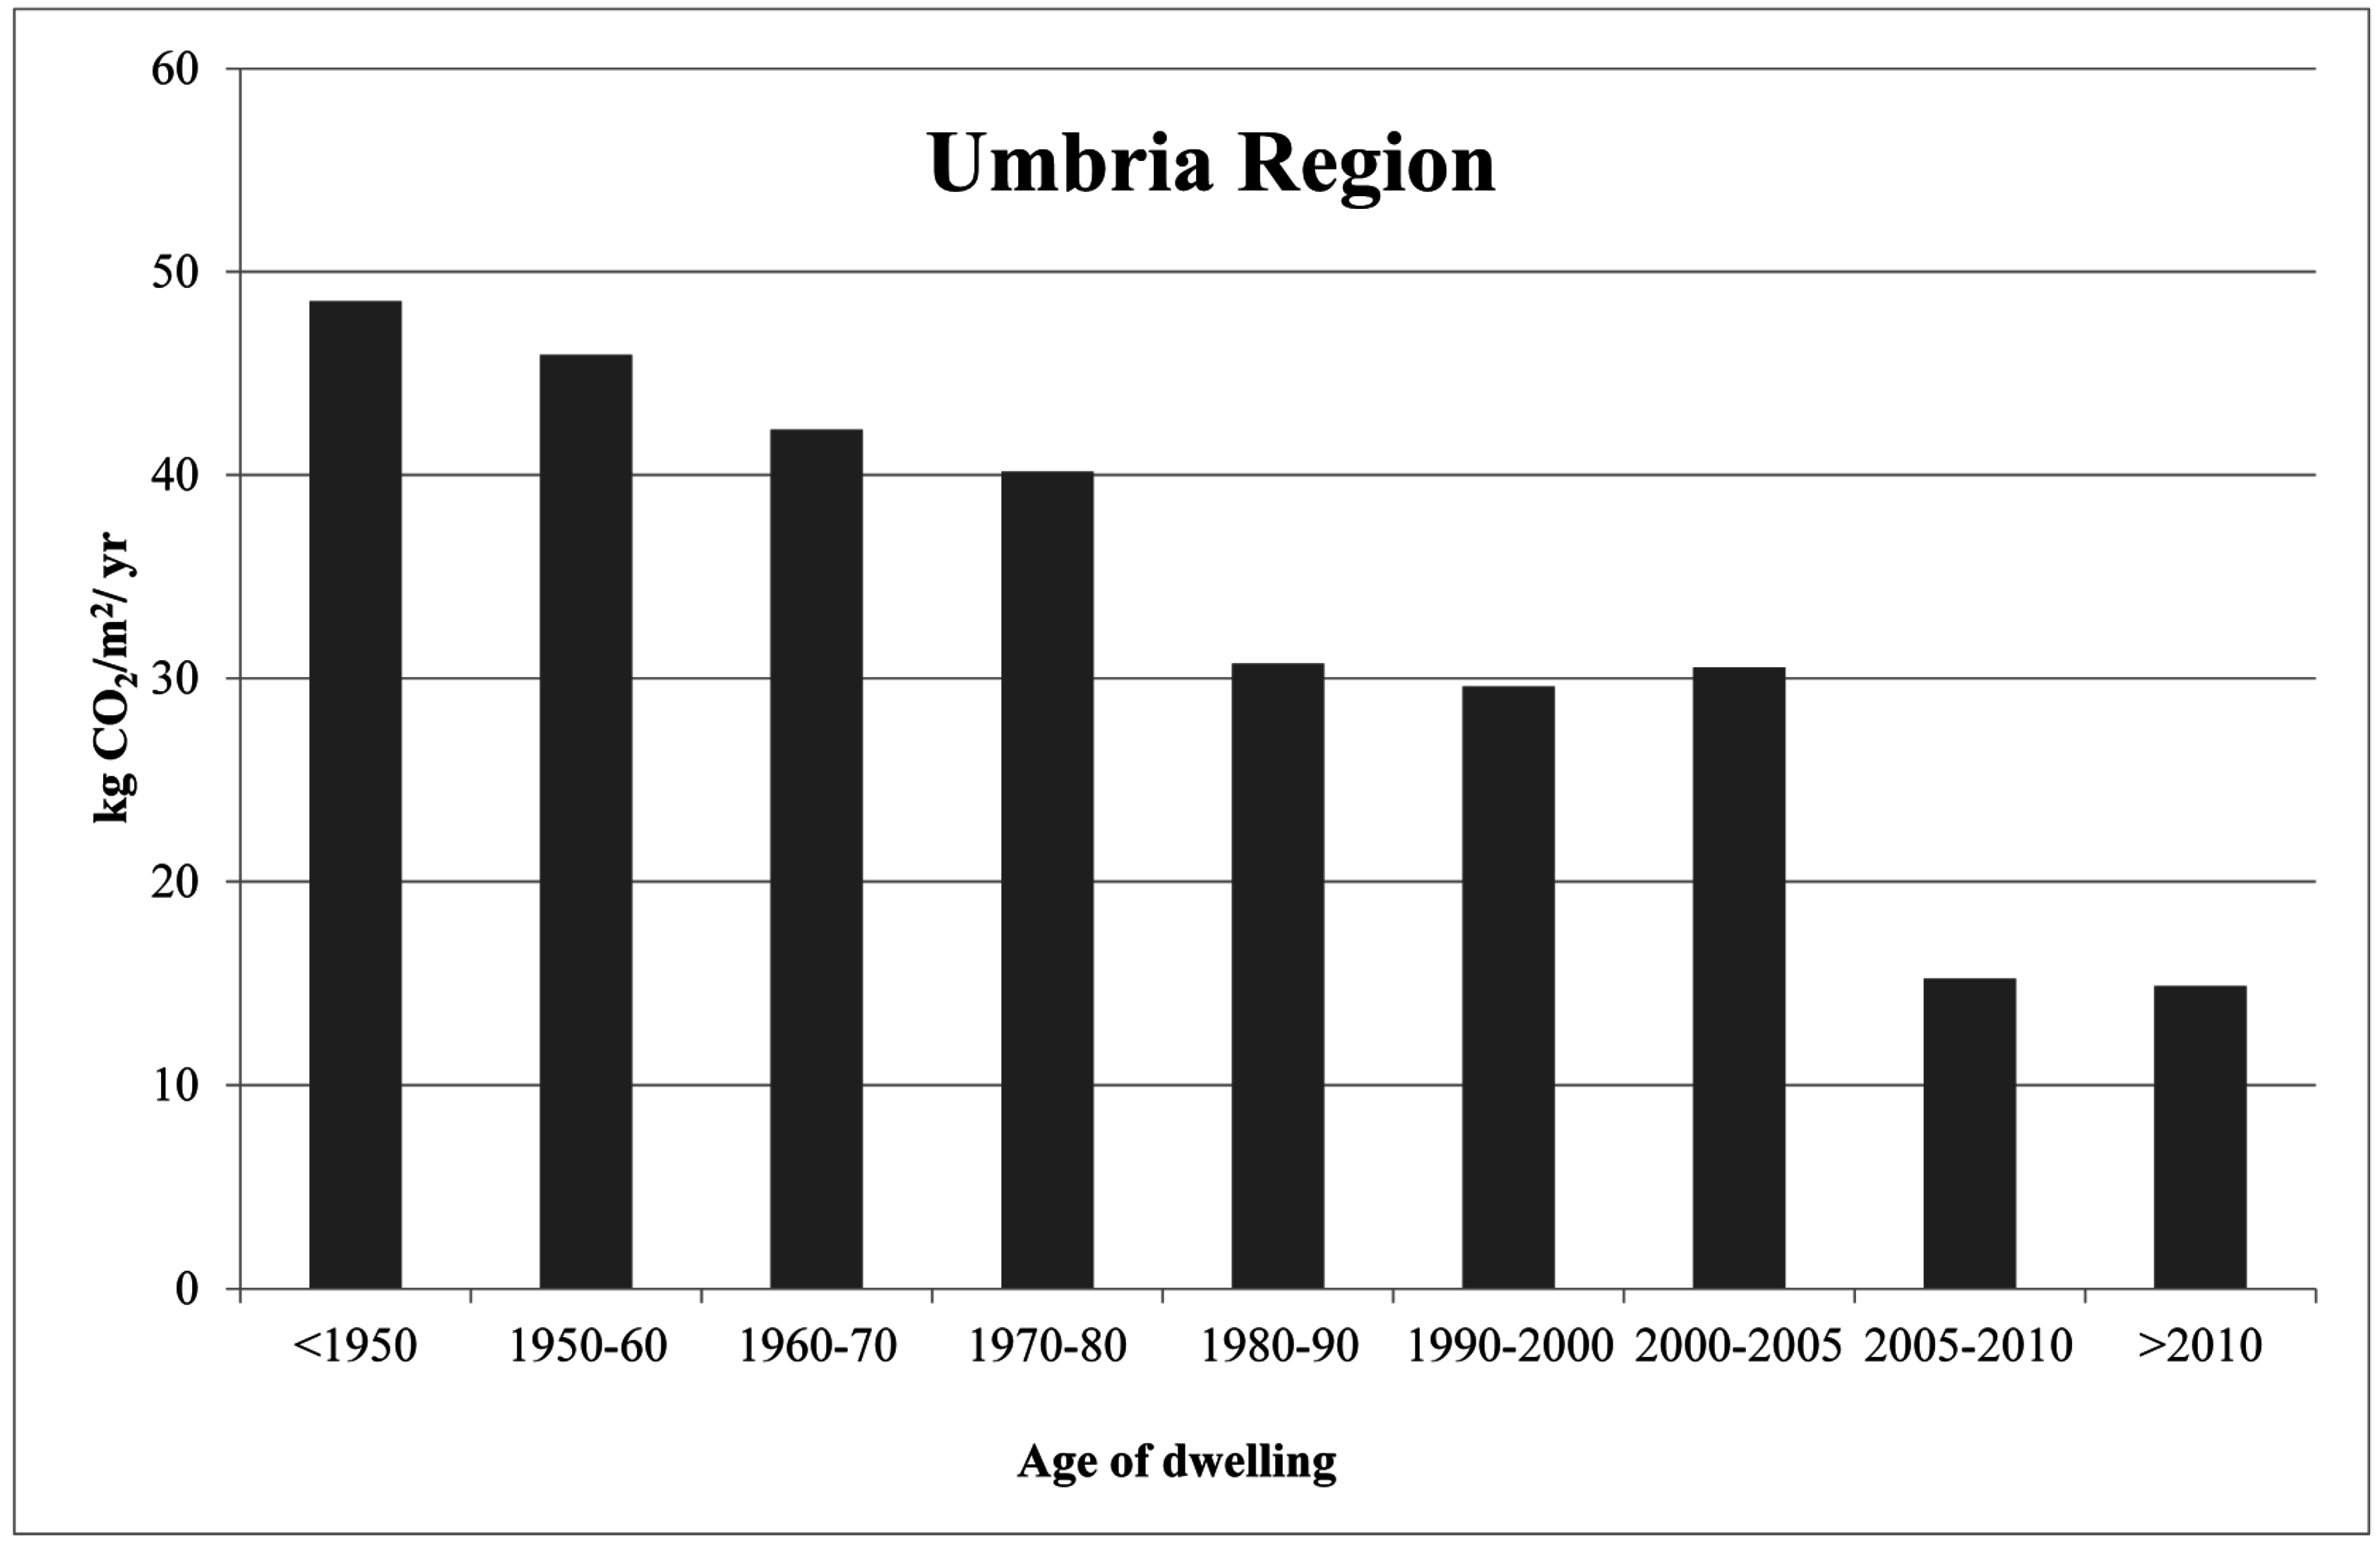
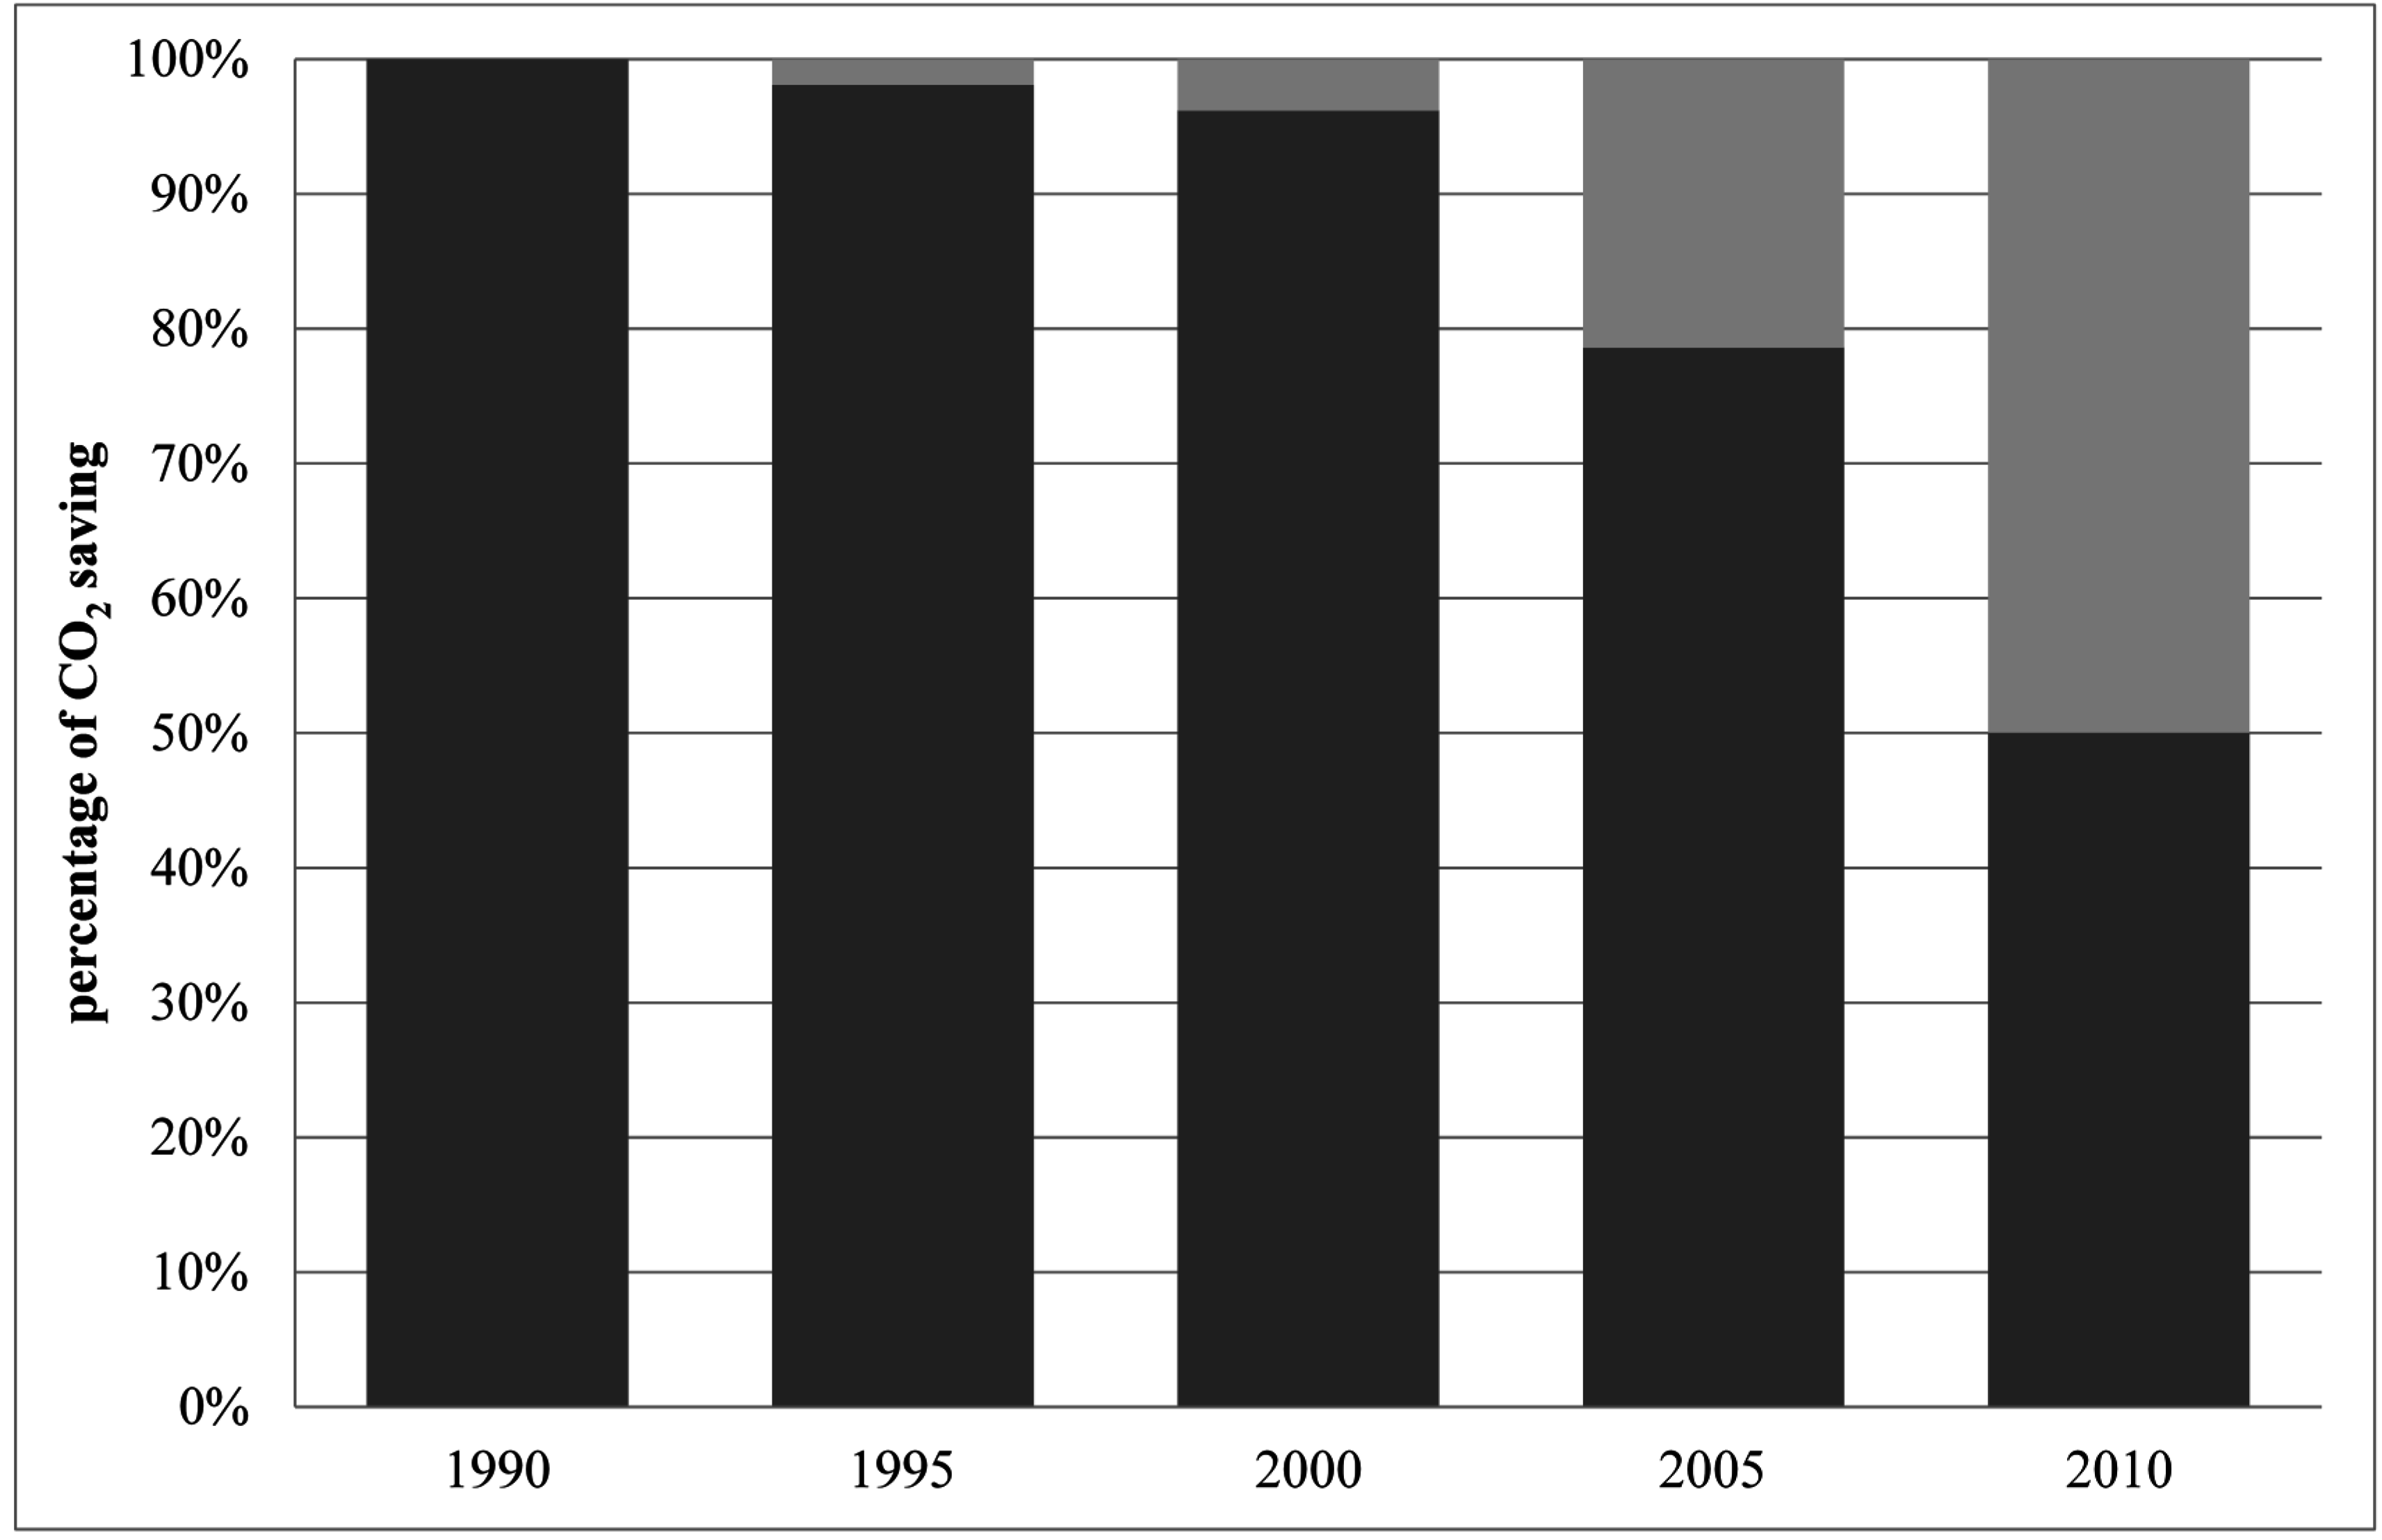
4.2. CO2 Emissions


5. Conclusions
Acknowledgments
Author Contributions
Conflicts of Interest
References
- International Energy Agency (IEA). World Energy Outlook Edition 2012; IEA Publication: Paris, France, 2012. [Google Scholar]
- European Environment Agency (EEA). Annual European Union Greenhouse Gas-Inventory 1990–2010 and Inventory Report; EEA: Copenhagen, Denmark, 2012. [Google Scholar]
- Energy Efficiency and Energy Consumption in the Household Sector. 2012. Available online: http://www.eea.europa.eu (accessed on 7 February 2014).
- ISPRA. Idrologia Operativa Workshop Nazionale. 2013. Available online: http://www.isprambiente.gov.it (accessed on 26 March 2015). [Google Scholar]
- UNFCCC. Information on the quantified emission limitation or reduction objectives (QELROs) for the second commitment period under the Kyoto Protocol. 19 April 2012. [Google Scholar]
- Directive 2009/29/EC of the European Parliament and of the Council so as to Improve and Extend the Greenhouse Gas Emission Allowance Trading Scheme of the Community. 23 April 2009.
- The European Parliament and the Council of the European Union. Directive 2010/31/EU on the energy performance of buildings. 19 May 2010. [Google Scholar]
- Norme di Riordino in Materia di Edilizia Residenziale Pubblica; Legge Regionale n. 23; Regione Umbria: Perugia, Italy, 28 November 2003. (In Italian)
- Asdrubali, F.; Buratti, C.; Cotana, F.; Baldinelli, G.; Goretti, M.; Moretti, E.; Baldassarri, C.; Belloni, E.; Bianchi, F.; Rotili, A.; et al. Evaluation of Green Buildings’ Overall Performance through in Situ Monitoring and Simulations. Energies 2013, 6, 6525–6654. [Google Scholar] [CrossRef]
- González, A.B.R.; Díaz, J.J.V.; Caamaño, A.J.; Wilby, M.R. Towards a universal energy efficiency index for buildings. Energy Build. 2011, 43, 980–987. [Google Scholar] [CrossRef]
- Moncada Lo Giudice, G.; Asdrubali, F.; Rotili, A. Influence of new factors on global energy prospects in the medium term: Comparison among the 2010, 2011 and 2012 editions of the IEA’s World Energy Outlook reports. Econ. Policy Energy Environ. 2013, 3, 67–89. [Google Scholar]
- Battista, G.; Evangelisti, L.; Guattari, C.; Basilicata, C.; de Lieto Vollaro, R. Buildings Energy Efficiency: Interventions Analysis under a Smart Cities Approach. Sustainability 2014, 6, 4694–4705. [Google Scholar] [CrossRef]
- De Lieto Vollaro, R.; Guattari, C.; Evangelisti, L.; Battista, G.; Carnielo, E.; Gori, P. Building energy performance analysis: A case study. Energy Build. 2015, 87, 87–94. [Google Scholar] [CrossRef]
- Buratti, C.; Barbanera, M.; Palladino, D. An original tool for checking energy performance and certification of buildings by means of Artificial Neural Networks. Appl. Energy 2014, 120, 125–132. [Google Scholar] [CrossRef]
- EPBD—Energy Performance of Buildings Directive 2010/31/CE of the European Parliament and of the Council on the Energy Performance of Buildings. 18 June 2010.
- Petersdorff, C.; Boermans, T.; Harnisch, J. Mitigation of CO2 Emissions from the EU-15 Building. Environ. Sci. Pollut. Res. 2006, 13, 350–358. [Google Scholar] [CrossRef]
- Balaras, C.A.; Gaglia, A.G.; Georgopoulou, E.; Mirasgedis, S.; Sarafidis, Y.; Lalas, D.P. European residential buildings and empirical assessment of the Hellenic building stock, energy consumption, emissions and potential energy savings. Build Environ. 2007, 42, 1298–1314. [Google Scholar] [CrossRef]
- Asdrubali, F.; Presciutti, A.; Scrucca, F. Development of a greenhouse gas accounting GIS-based tool to support local policy making—Application to an Italian municipality. Energy Policy 2013, 61, 587–594. [Google Scholar] [CrossRef]
- Poel, B.; van Cruchten, G.; Balaras, C.A. Energy performance assessment of existing dwellings. Energy Build. 2007, 39, 393–403. [Google Scholar] [CrossRef]
- Dall’O, G.; Galante, A.; Torri, M. A methodology for the energy performance classification of residential building stock on an urban scale. Energy Build. 2012, 48, 211–219. [Google Scholar] [CrossRef]
- Dall’O’, G.; Belli, V.; Brolis, M.; Mozzi, I.; Fasano, M. Nearly Zero-Energy Buildings of the Lombardy Region (Italy), a Case Study of High-Energy Performance Buildings. Energies 2013, 6, 3506–3527. [Google Scholar] [CrossRef] [Green Version]
- Theodoridoua, I.; Papadopoulosb, A.M.; Heggera, M. Statistical analysis of the Greek residential building stock. Energy Build. 2011, 43, 2422–2428. [Google Scholar] [CrossRef]
- Fabbri, K.; Zuppitoli, M.; Ambrogio, K. Heritage buildings and energy performance: Mapping with GIS tools. Energy Build. 2012, 48, 137–145. [Google Scholar] [CrossRef]
- Moran, F.; Natarajan, S.; Nikolopoulou, M. Developing a database of energy use for historic dwellings in Bath, UK. Energy Build. 2012, 55, 218–226. [Google Scholar] [CrossRef]
- Annunziata, E.; Frey, M.; Rizzi, F. Towards nearly zero-energy buildings: The state-of-art of national regulations in Europe. Energy 2013, 57, 125–133. [Google Scholar] [CrossRef]
- Dascalaki, E.G.; Droutsa, K.; Gaglia, A.G.; Kontoyiannidis, S.; Balaras, C.-A. Data collection and analysis of the building stock and its energy performance—An example for Hellenic buildings. Energy Build. 2010, 42, 1231–1237. [Google Scholar] [CrossRef]
- Ministry of Economic Development. Ministerial Decree 26th June 2009 National Guidelines for Energy Certification of Buildings. Official Gazette of Italian Republic: Rome, Italy, 10 July 2009. (In Italian) [Google Scholar]
- Lgs, D. 19th August 2005 n.192. EPBD implementation on the energy performance of buildings. 2005. (In Italian) [Google Scholar]
- Buratti, C.; Belloni, E.; Palladino, D. Evolutive Housing System: Refurbishment with new technologies and unsteady simulations of energy performance. Energy Build. 2014, 74, 173–181. [Google Scholar] [CrossRef]
- ISTAT. Noi Italia. 100 indicators to understand the country we live in. 2014. Available online: http://noi-italia2014.istat.it/ (accessed on 21 January 2015). (In Italian)
- ISTAT. XiV Census of population and households, 2001.
- European Commission. Eurostat database. Available online: http://www.epp.eurostat.eu.europa.eu (accessed on 10 February 2015).
- Baker, P. Historic Scotland Technical Paper 10: U-Values and Traditional Buildings: In situ Measurements and Their Comparison to Calculated Values; Glasgow Caledonian University: Glasgow, UK, 2011. [Google Scholar]
- Buildings Performance Institute Europe (BPIE). Europe’s Building under the Microscope: A Country-by-Country Review of the Energy Performance of Buildings, BPIE: Brussels, Belgium, October 2011.
- DGR. 30th September 2013 n. 1079. Technical Regulations for Evaluating of Environmental Sustainability of Buildings. 2013. (In Italian) [Google Scholar]
© 2015 by the authors; licensee MDPI, Basel, Switzerland. This article is an open access article distributed under the terms and conditions of the Creative Commons Attribution license (http://creativecommons.org/licenses/by/4.0/).
Share and Cite
Buratti, C.; Asdrubali, F.; Palladino, D.; Rotili, A. Energy Performance Database of Building Heritage in the Region of Umbria, Central Italy. Energies 2015, 8, 7261-7278. https://doi.org/10.3390/en8077261
Buratti C, Asdrubali F, Palladino D, Rotili A. Energy Performance Database of Building Heritage in the Region of Umbria, Central Italy. Energies. 2015; 8(7):7261-7278. https://doi.org/10.3390/en8077261
Chicago/Turabian StyleBuratti, Cinzia, Francesco Asdrubali, Domenico Palladino, and Antonella Rotili. 2015. "Energy Performance Database of Building Heritage in the Region of Umbria, Central Italy" Energies 8, no. 7: 7261-7278. https://doi.org/10.3390/en8077261