
Ejin Oasis Land Use and Vegetation Change between 2000 and 2011: The Role of the Ecological Water Diversion Project

Abstract
:1. Introduction
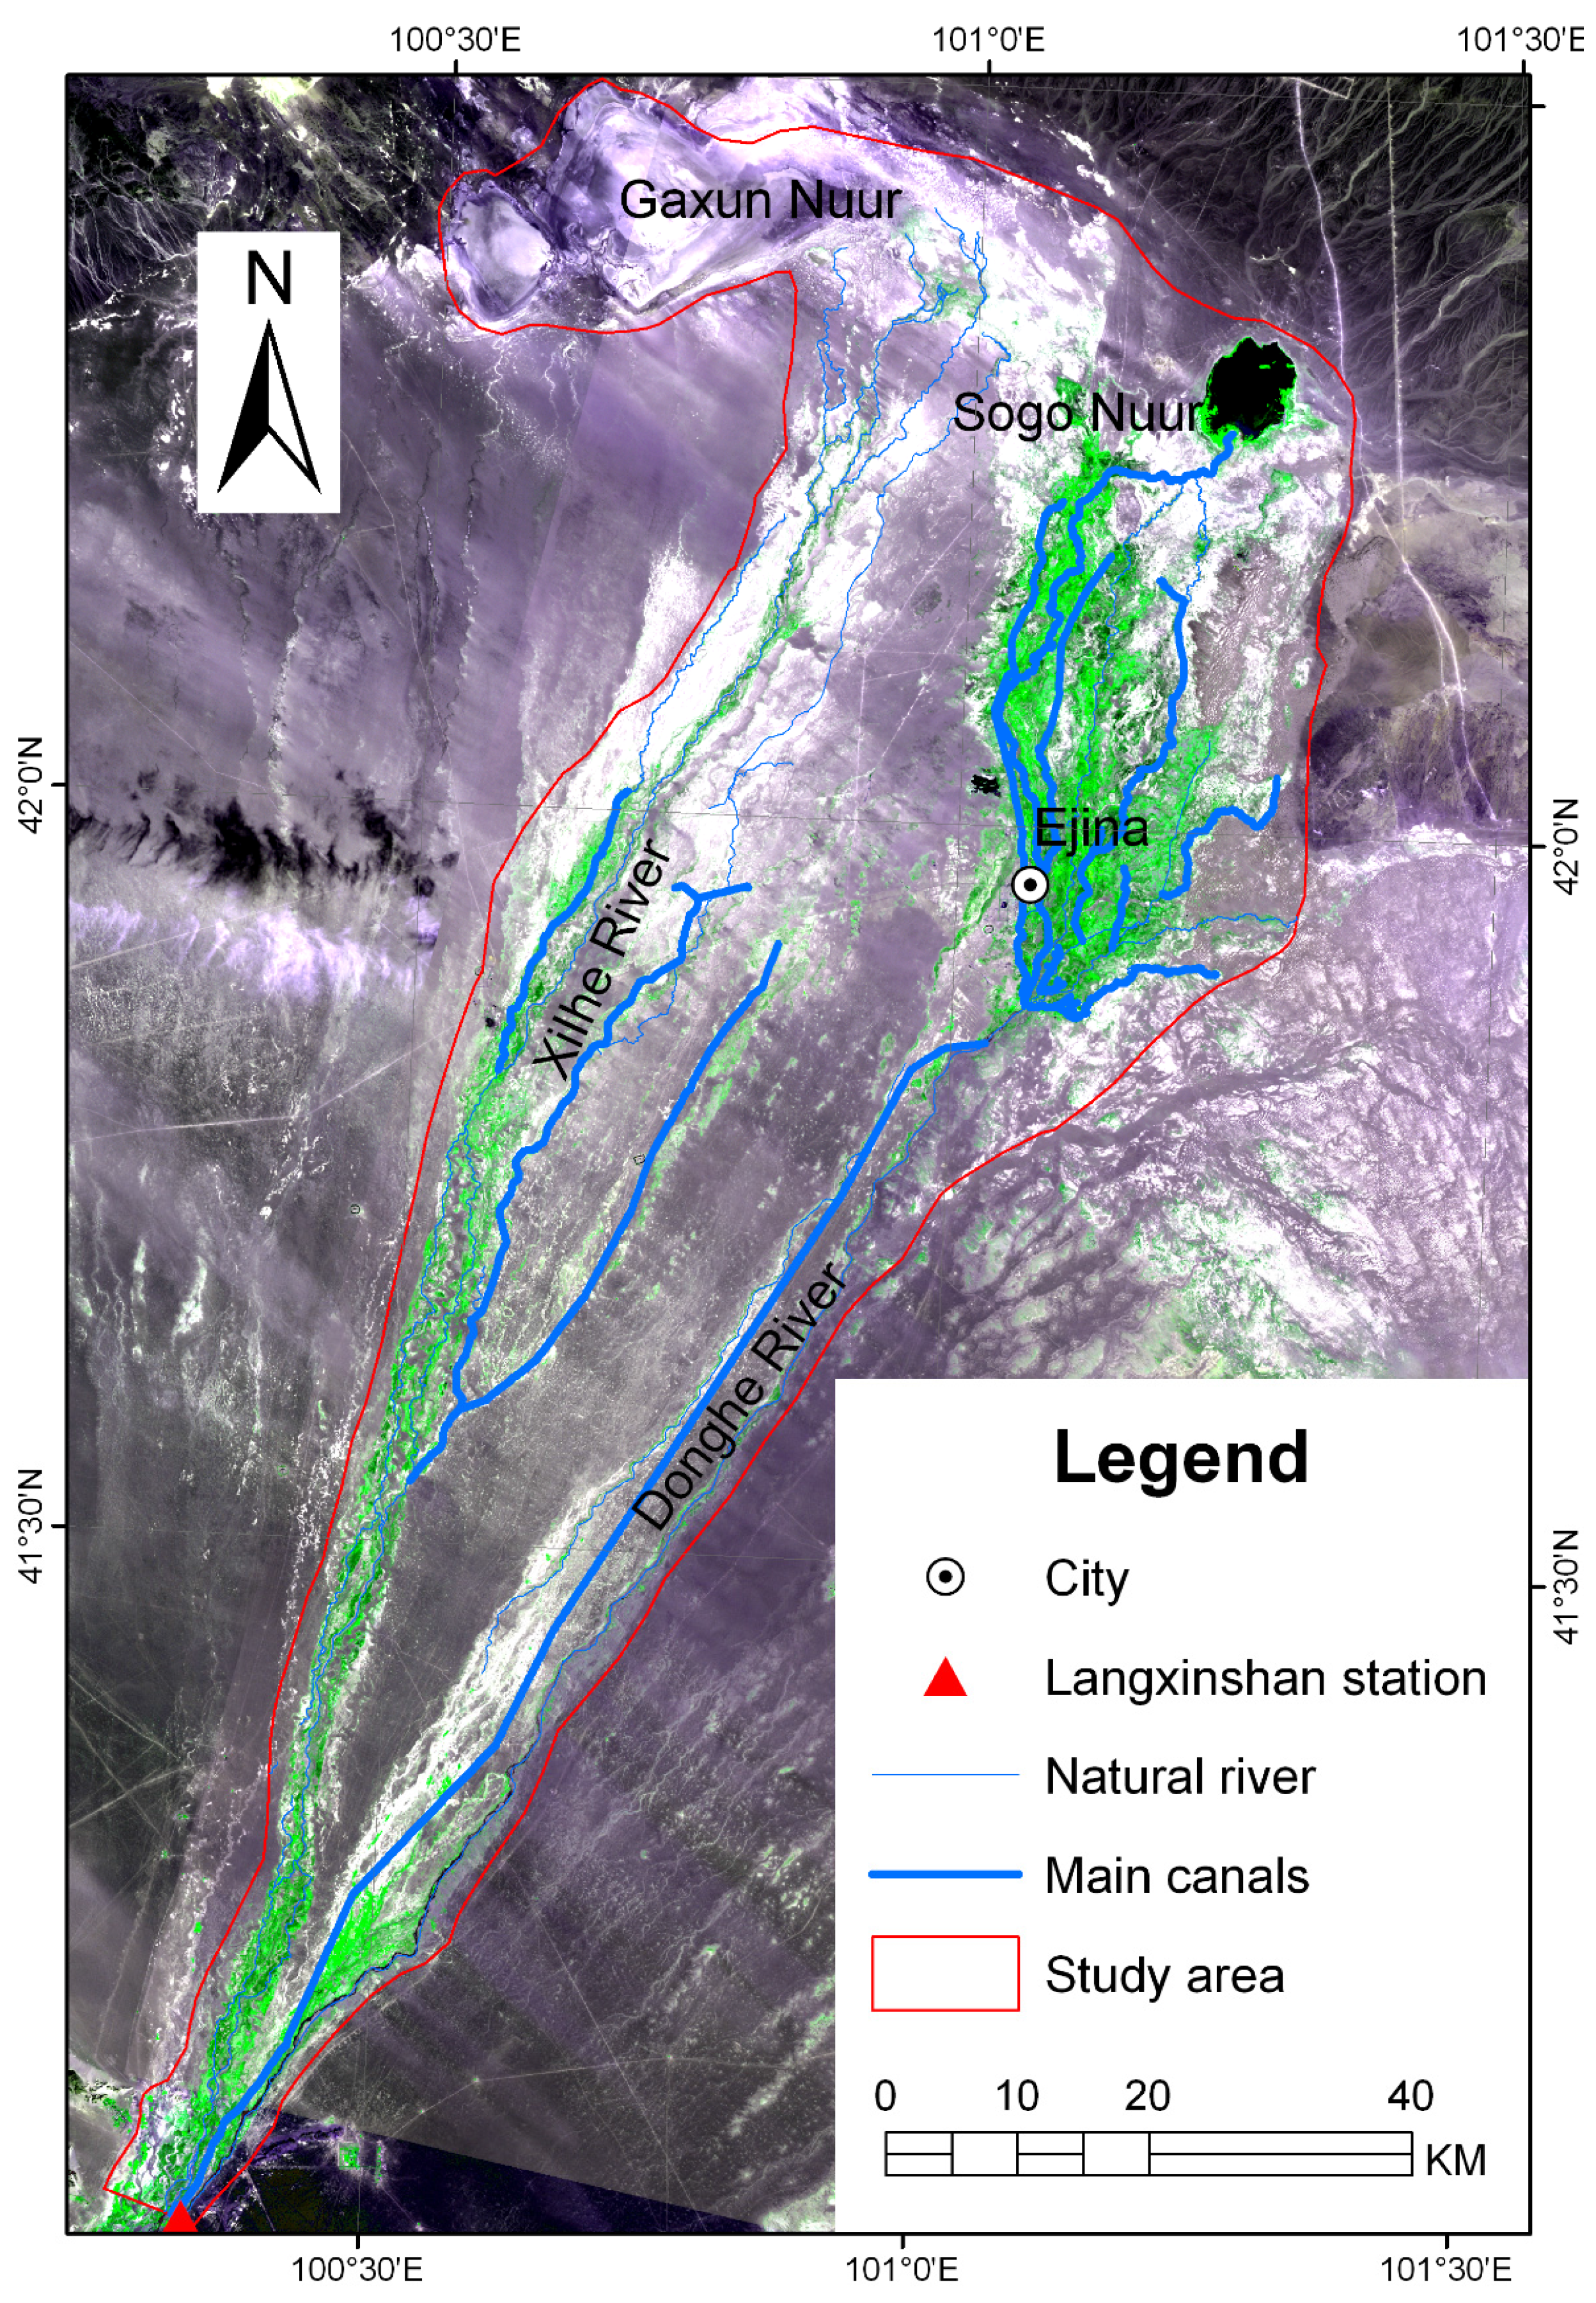
2. Study Area

3. Material and Methods
3.1. Data
3.2. Data Land Use Change Monitoring
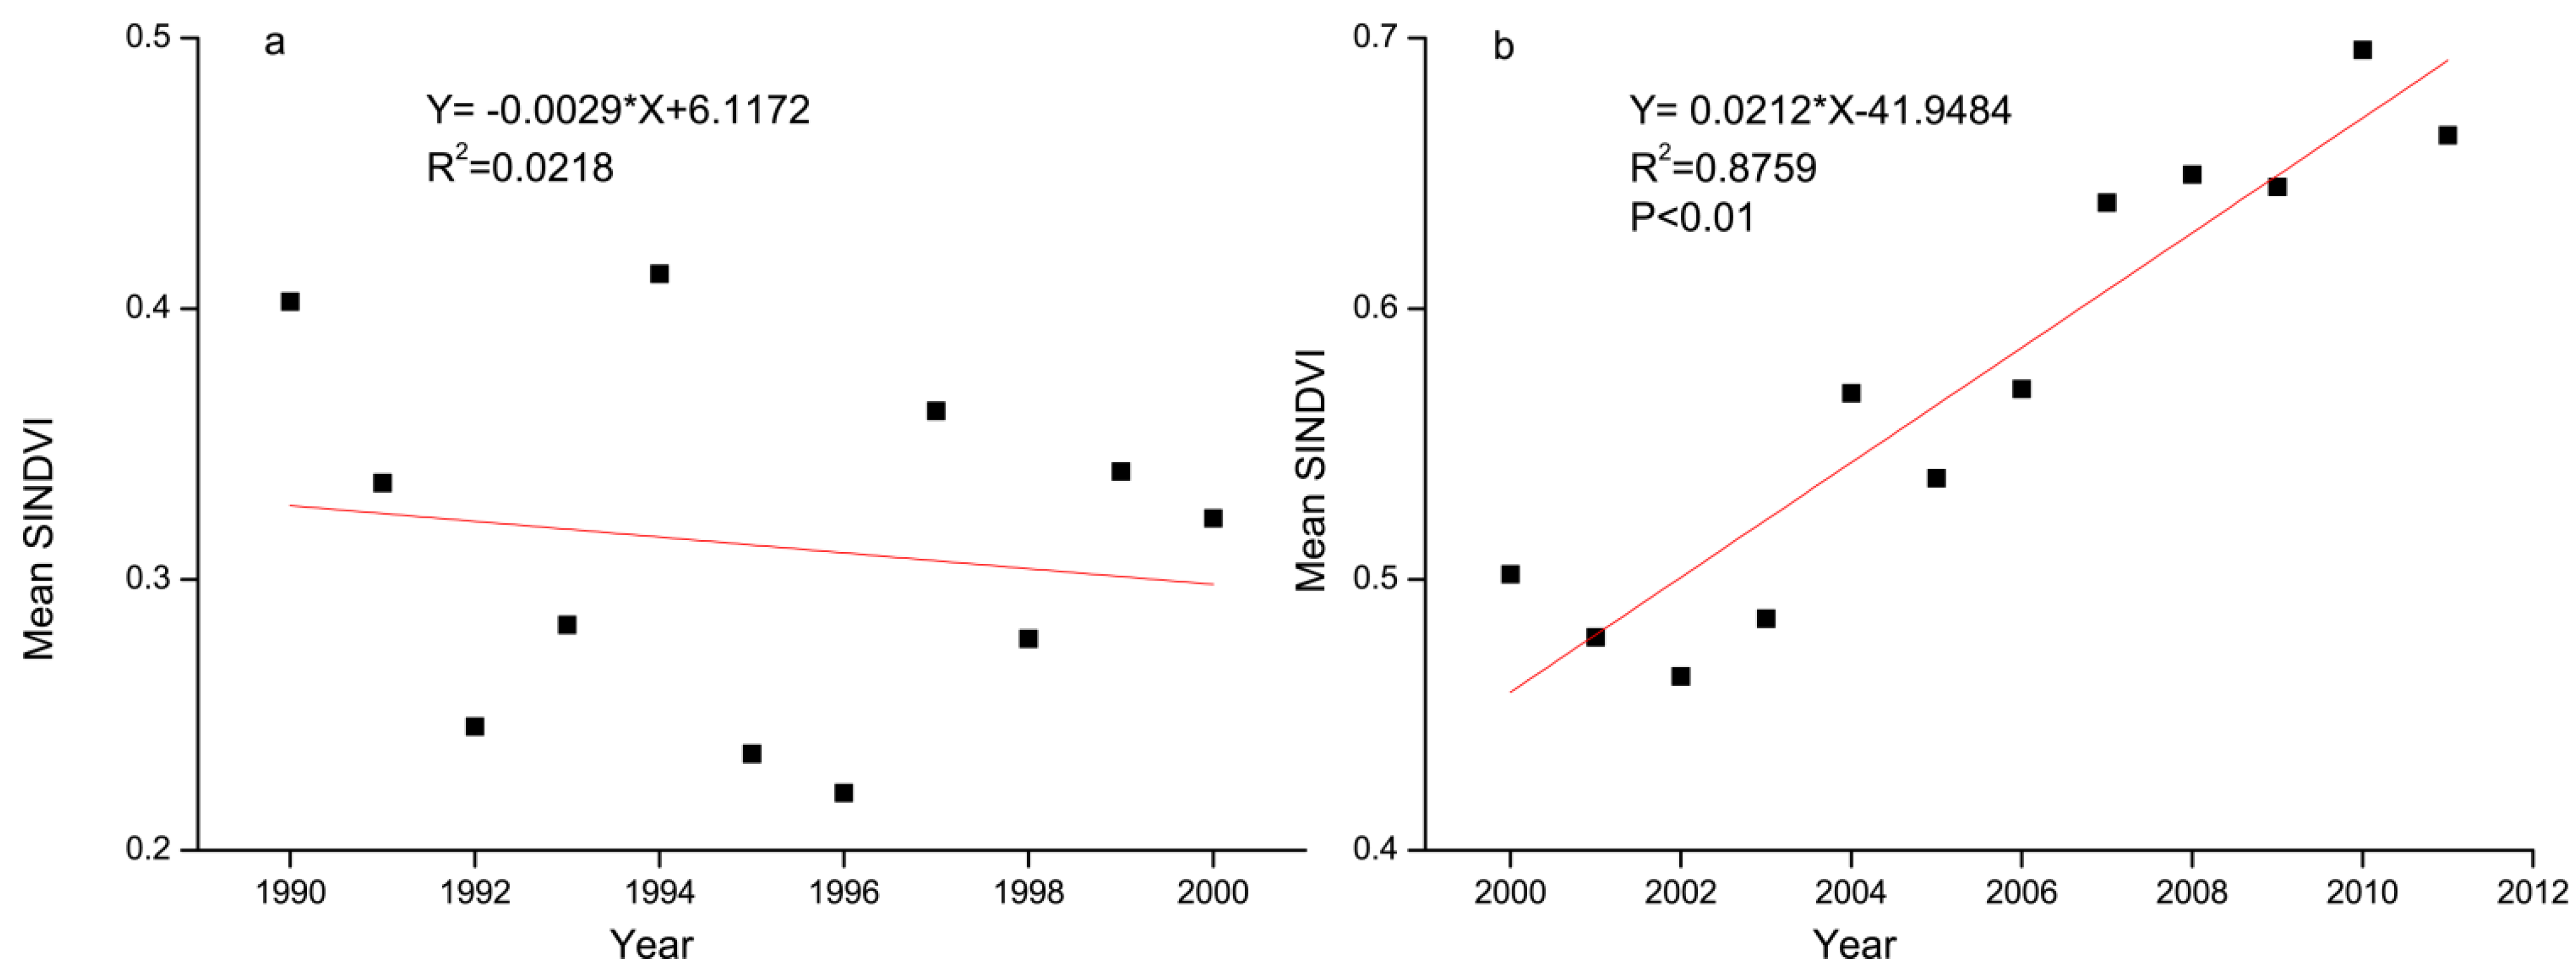
3.3. SINDVI Change
4. Results
4.1. Land Use Change Monitoring


| Year | Parameter | Farmland | Forest Land | Grassland | Water Body | Built-up Land | Desert |
|---|---|---|---|---|---|---|---|
| 2000 | Area (km2) | 71.50 | 379.03 | 927.69 | 70.04 | 6.92 | 4383.33 |
| Percent (%) | 1.22 | 6.49 | 15.89 | 1.20 | 0.12 | 75.08 | |
| 2011 | Area (km2) | 130.32 | 401.08 | 905.23 | 144.17 | 10.97 | 4246.74 |
| Percent (%) | 2.23 | 6.87 | 15.50 | 2.47 | 0.19 | 72.74 | |
| 2000–2011 | Area change (km2) | 58.82 | 22.05 | −22.46 | 74.13 | 4.06 | −136.59 |
| Percent (%) | 82.27 | 5.82 | −2.42 | 105.84 | 58.66 | −3.12 |
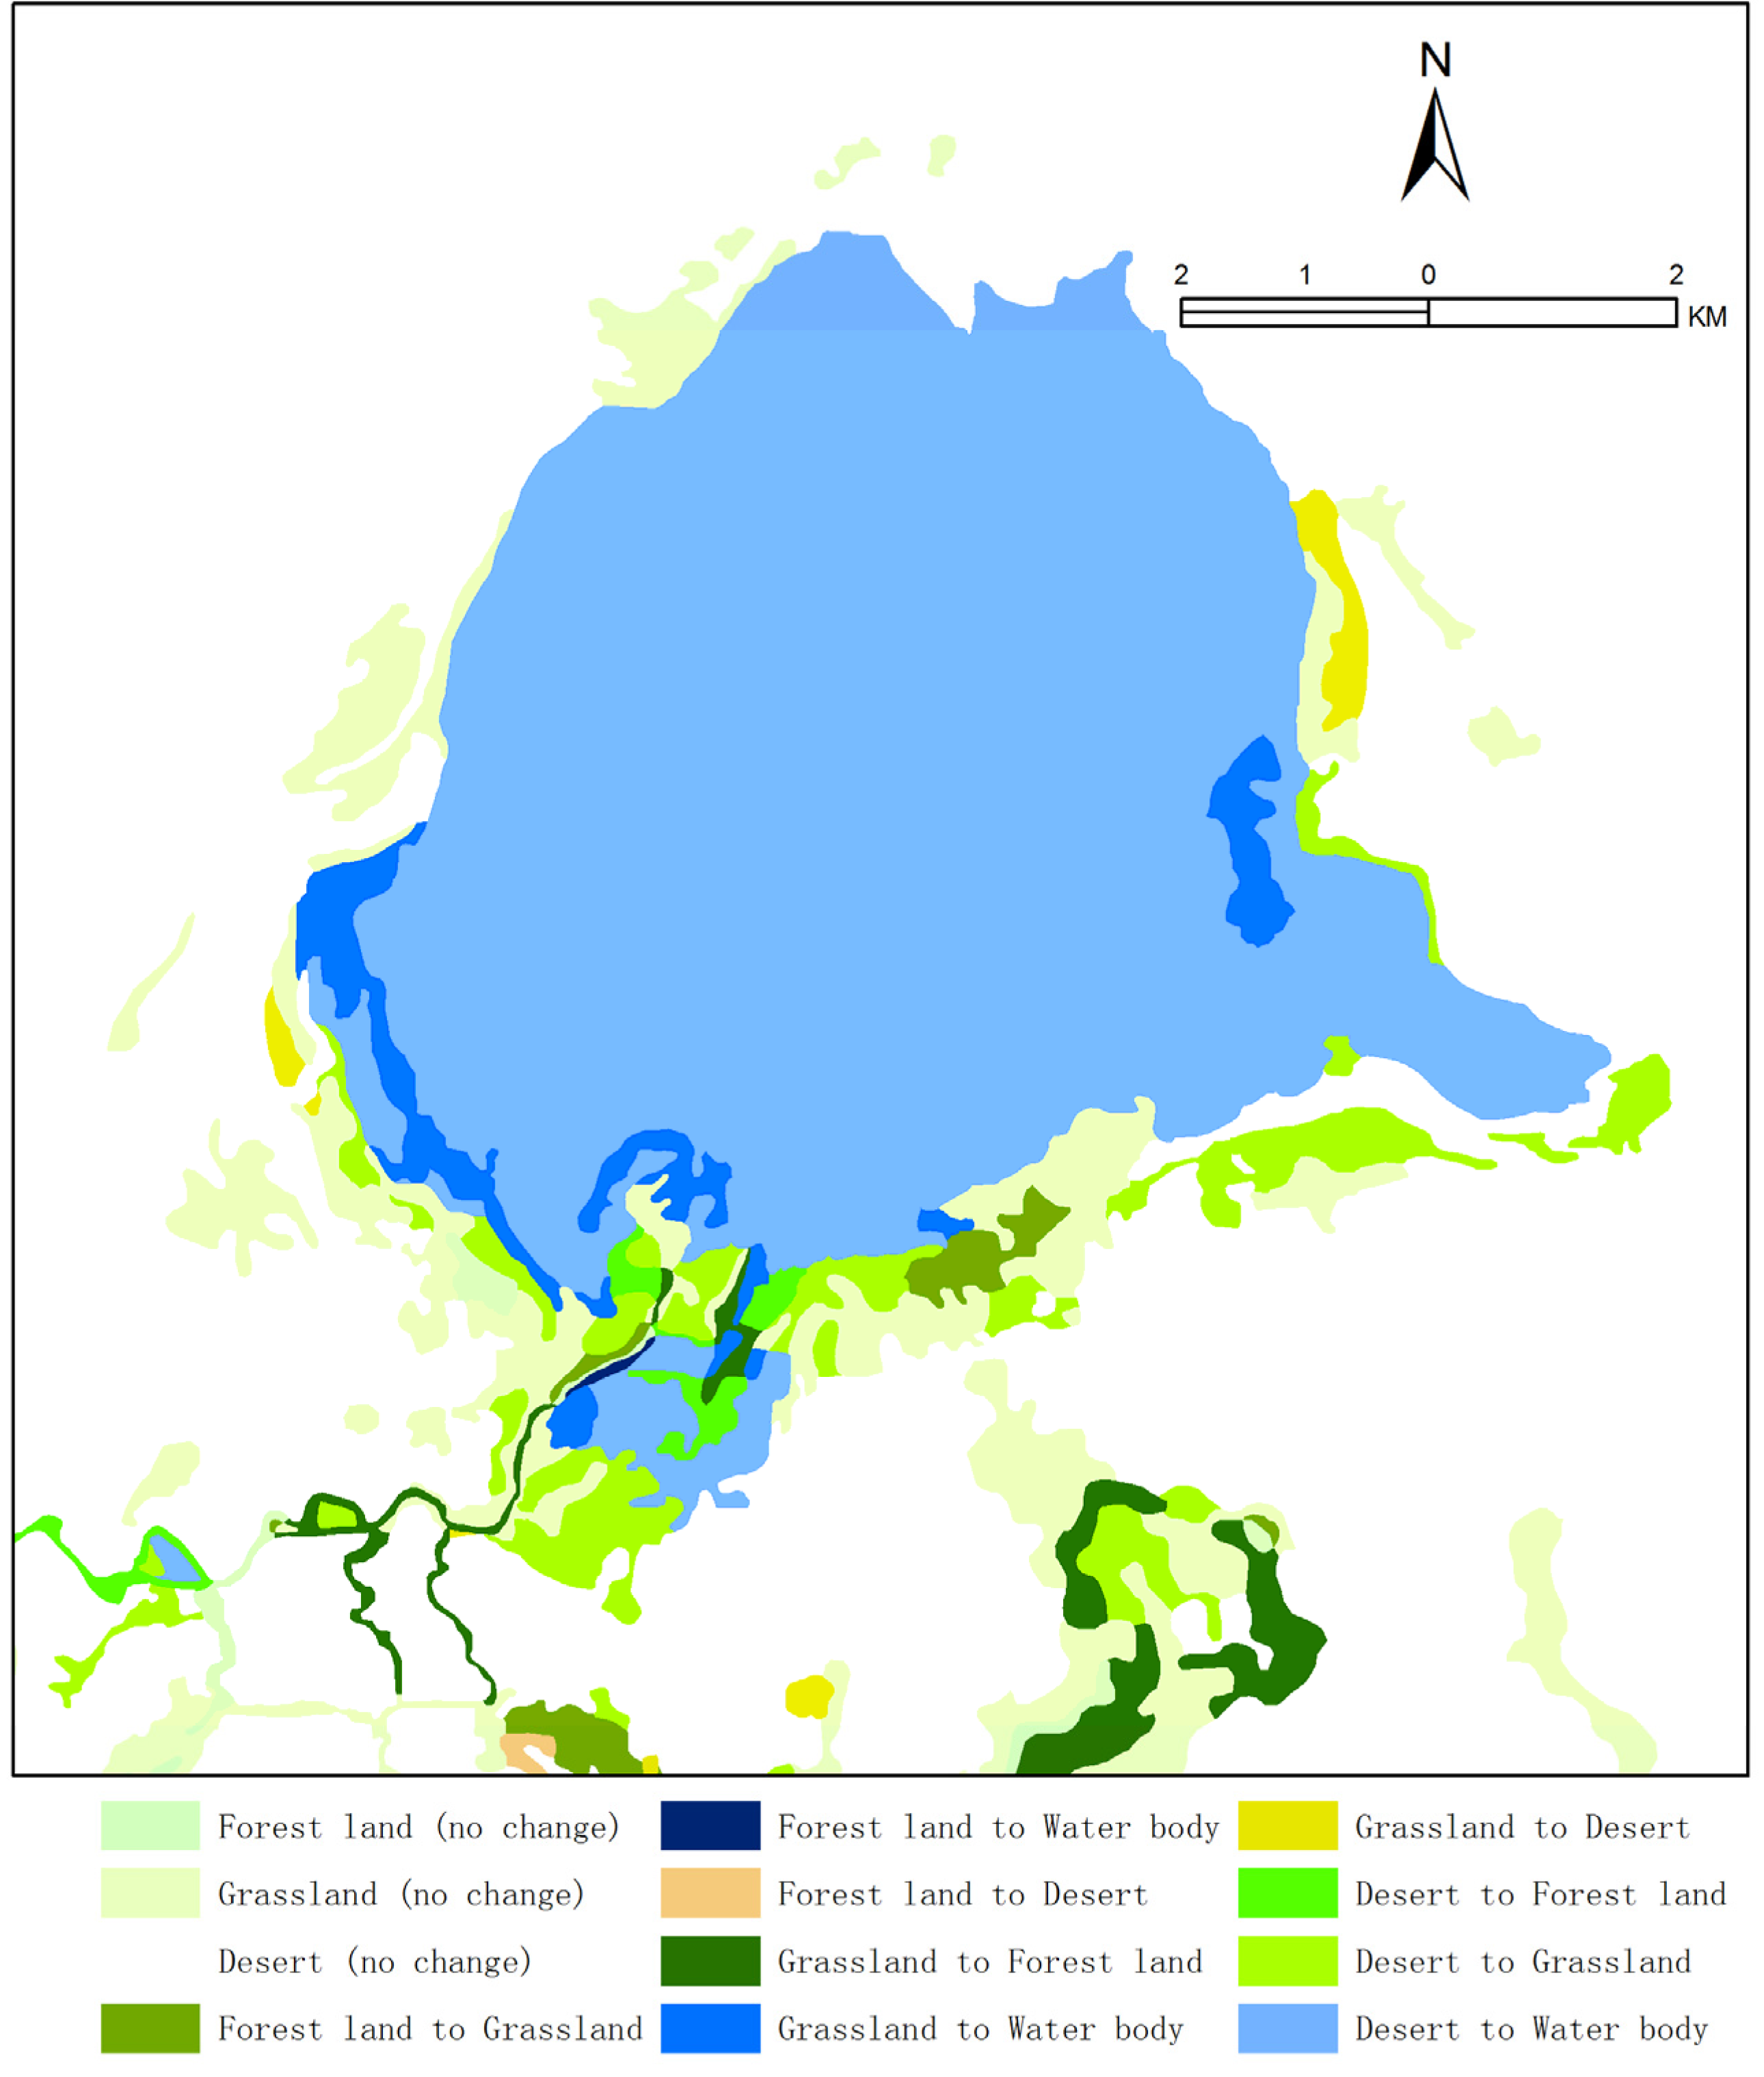
| 2000 | 2011 | |||||
|---|---|---|---|---|---|---|
| Farmland | Forest Land | Grassland | Water Body | Built-Up Land | Desert | |
| Farmland | 67.49 | 2.46 | 1.01 | 0.06 | 0.14 | 0.34 |
| Forest Land | 8.77 | 338.90 | 27.95 | 0.74 | 0.61 | 2.06 |
| Grassland | 35.09 | 54.15 | 787.29 | 8.97 | 0.39 | 41.80 |
| Water Body | 0.00 | 0.00 | 2.14 | 67.28 | 0.00 | 0.62 |
| Built-up Land | 0.00 | 0.00 | 0.12 | 0.01 | 6.72 | 0.07 |
| Desert | 18.97 | 5.57 | 86.72 | 67.11 | 3.11 | 4201.85 |
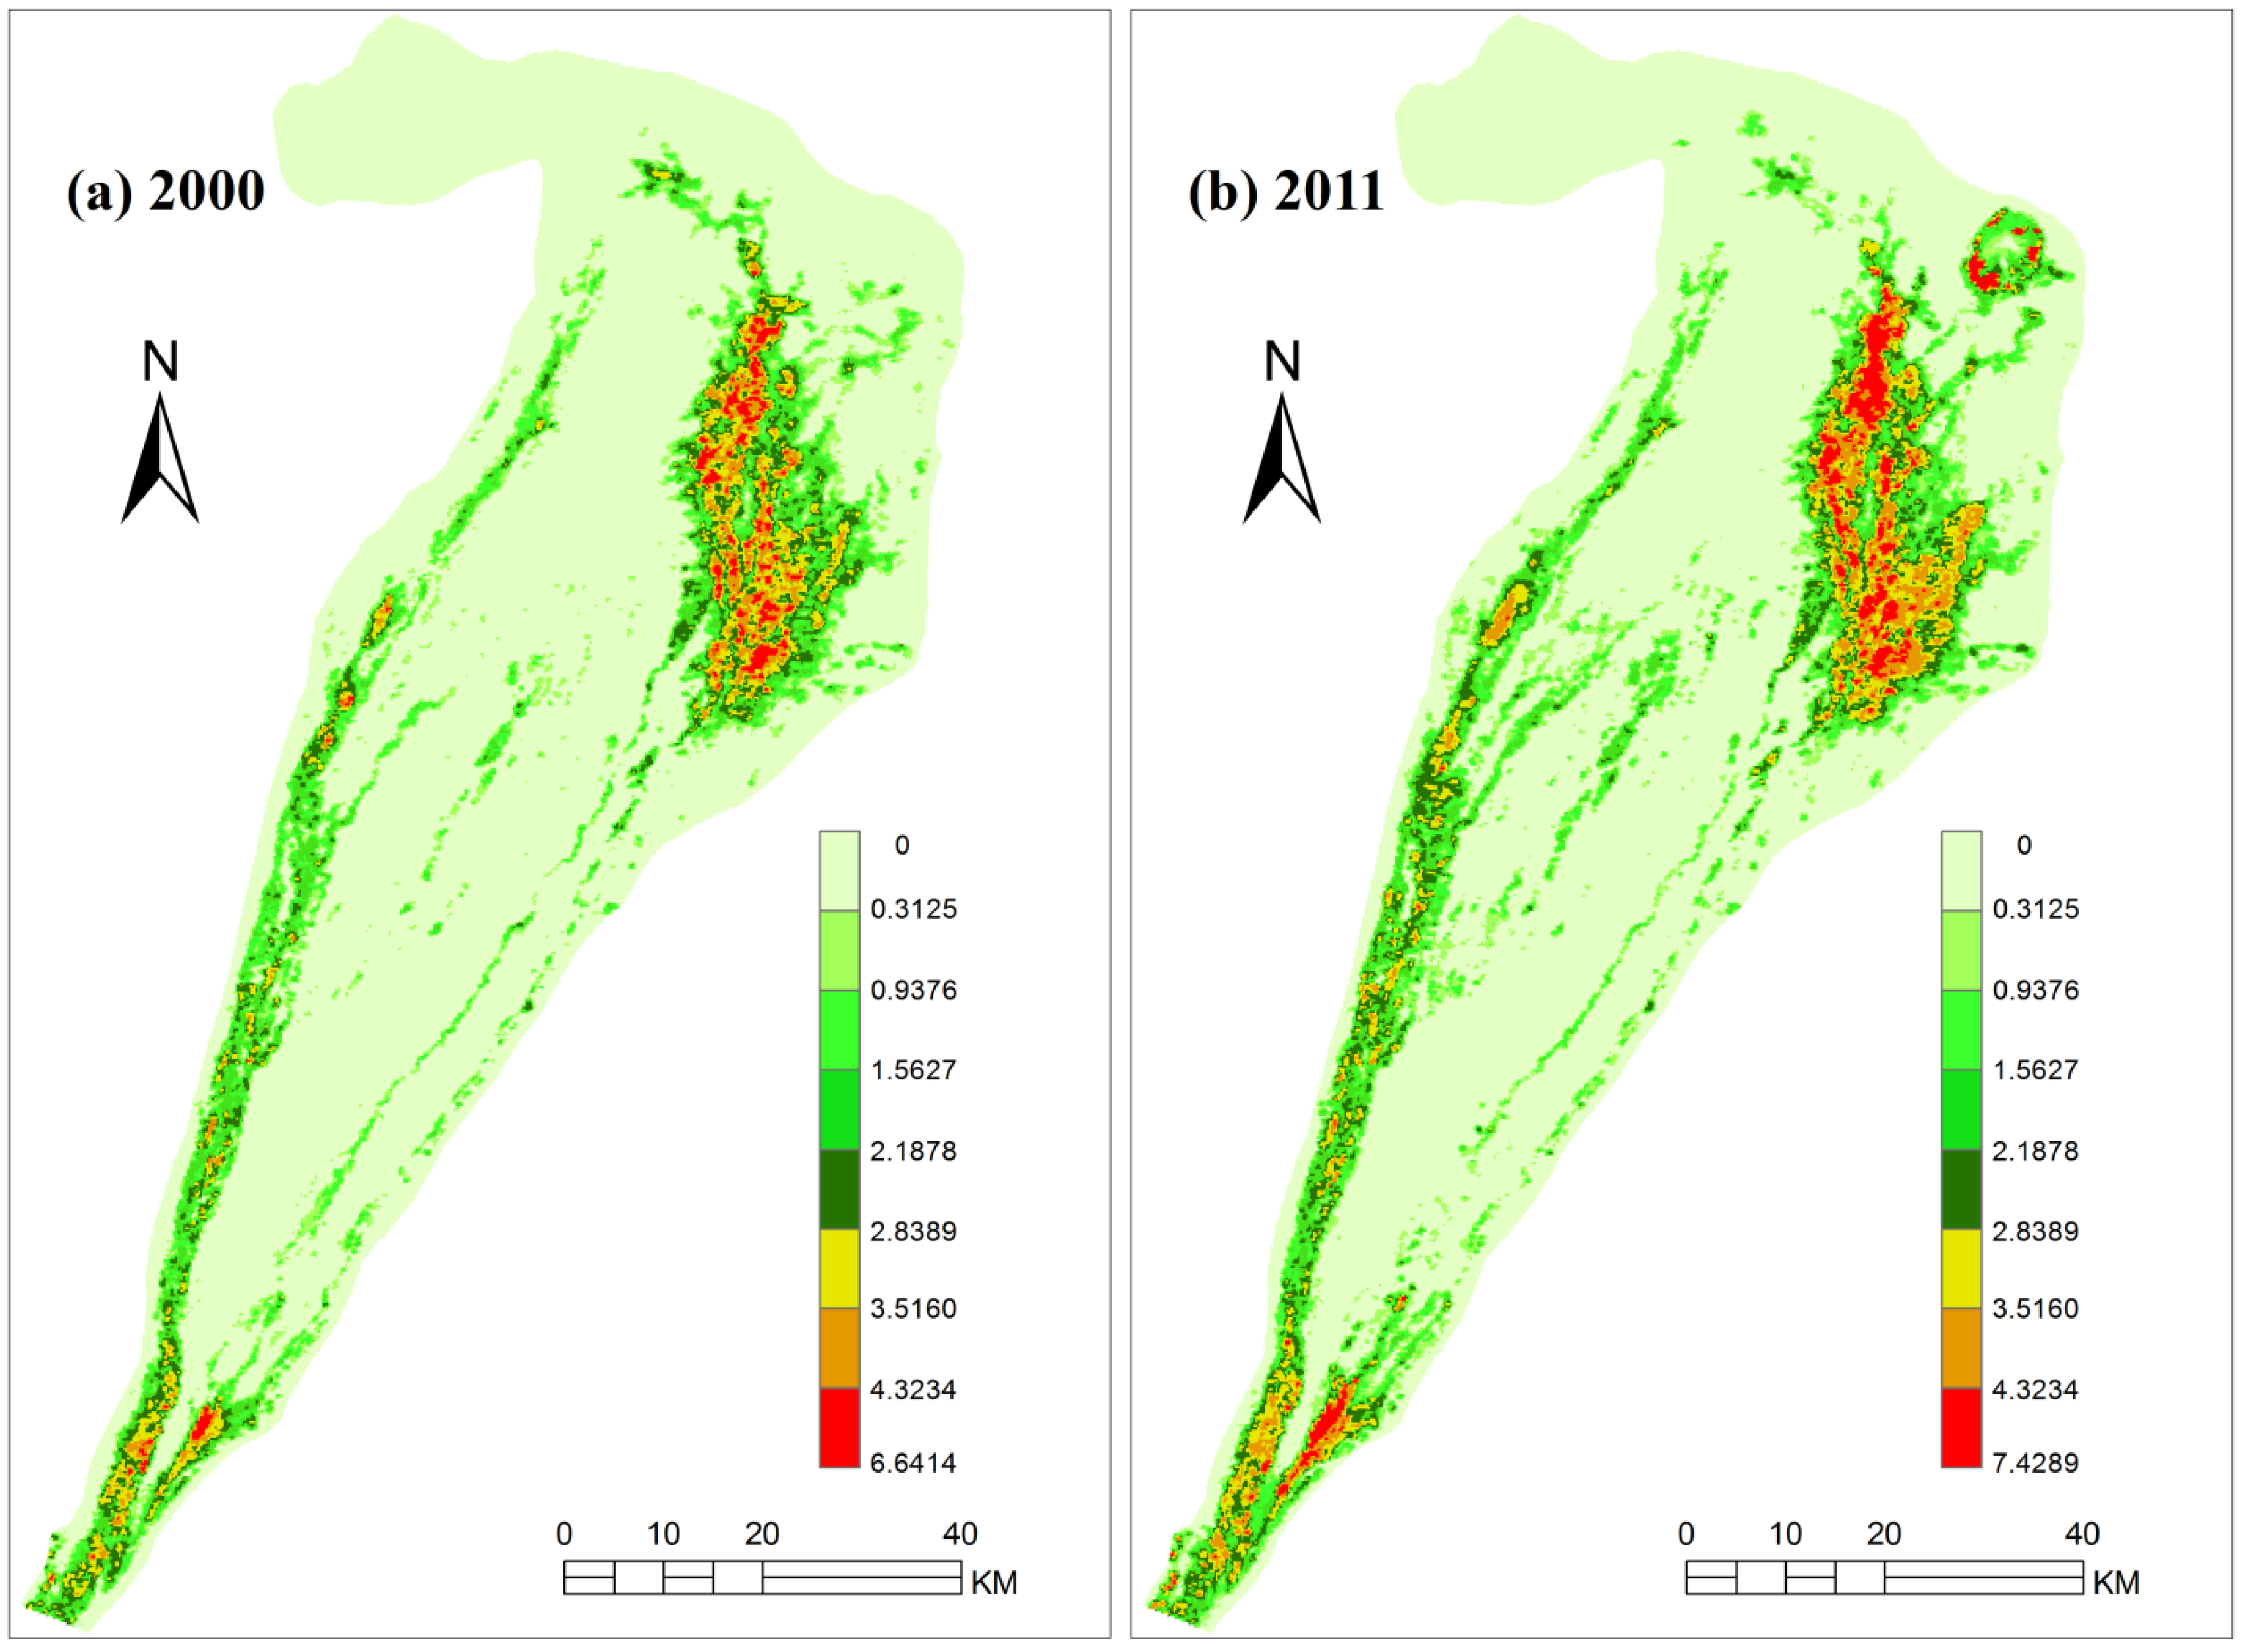
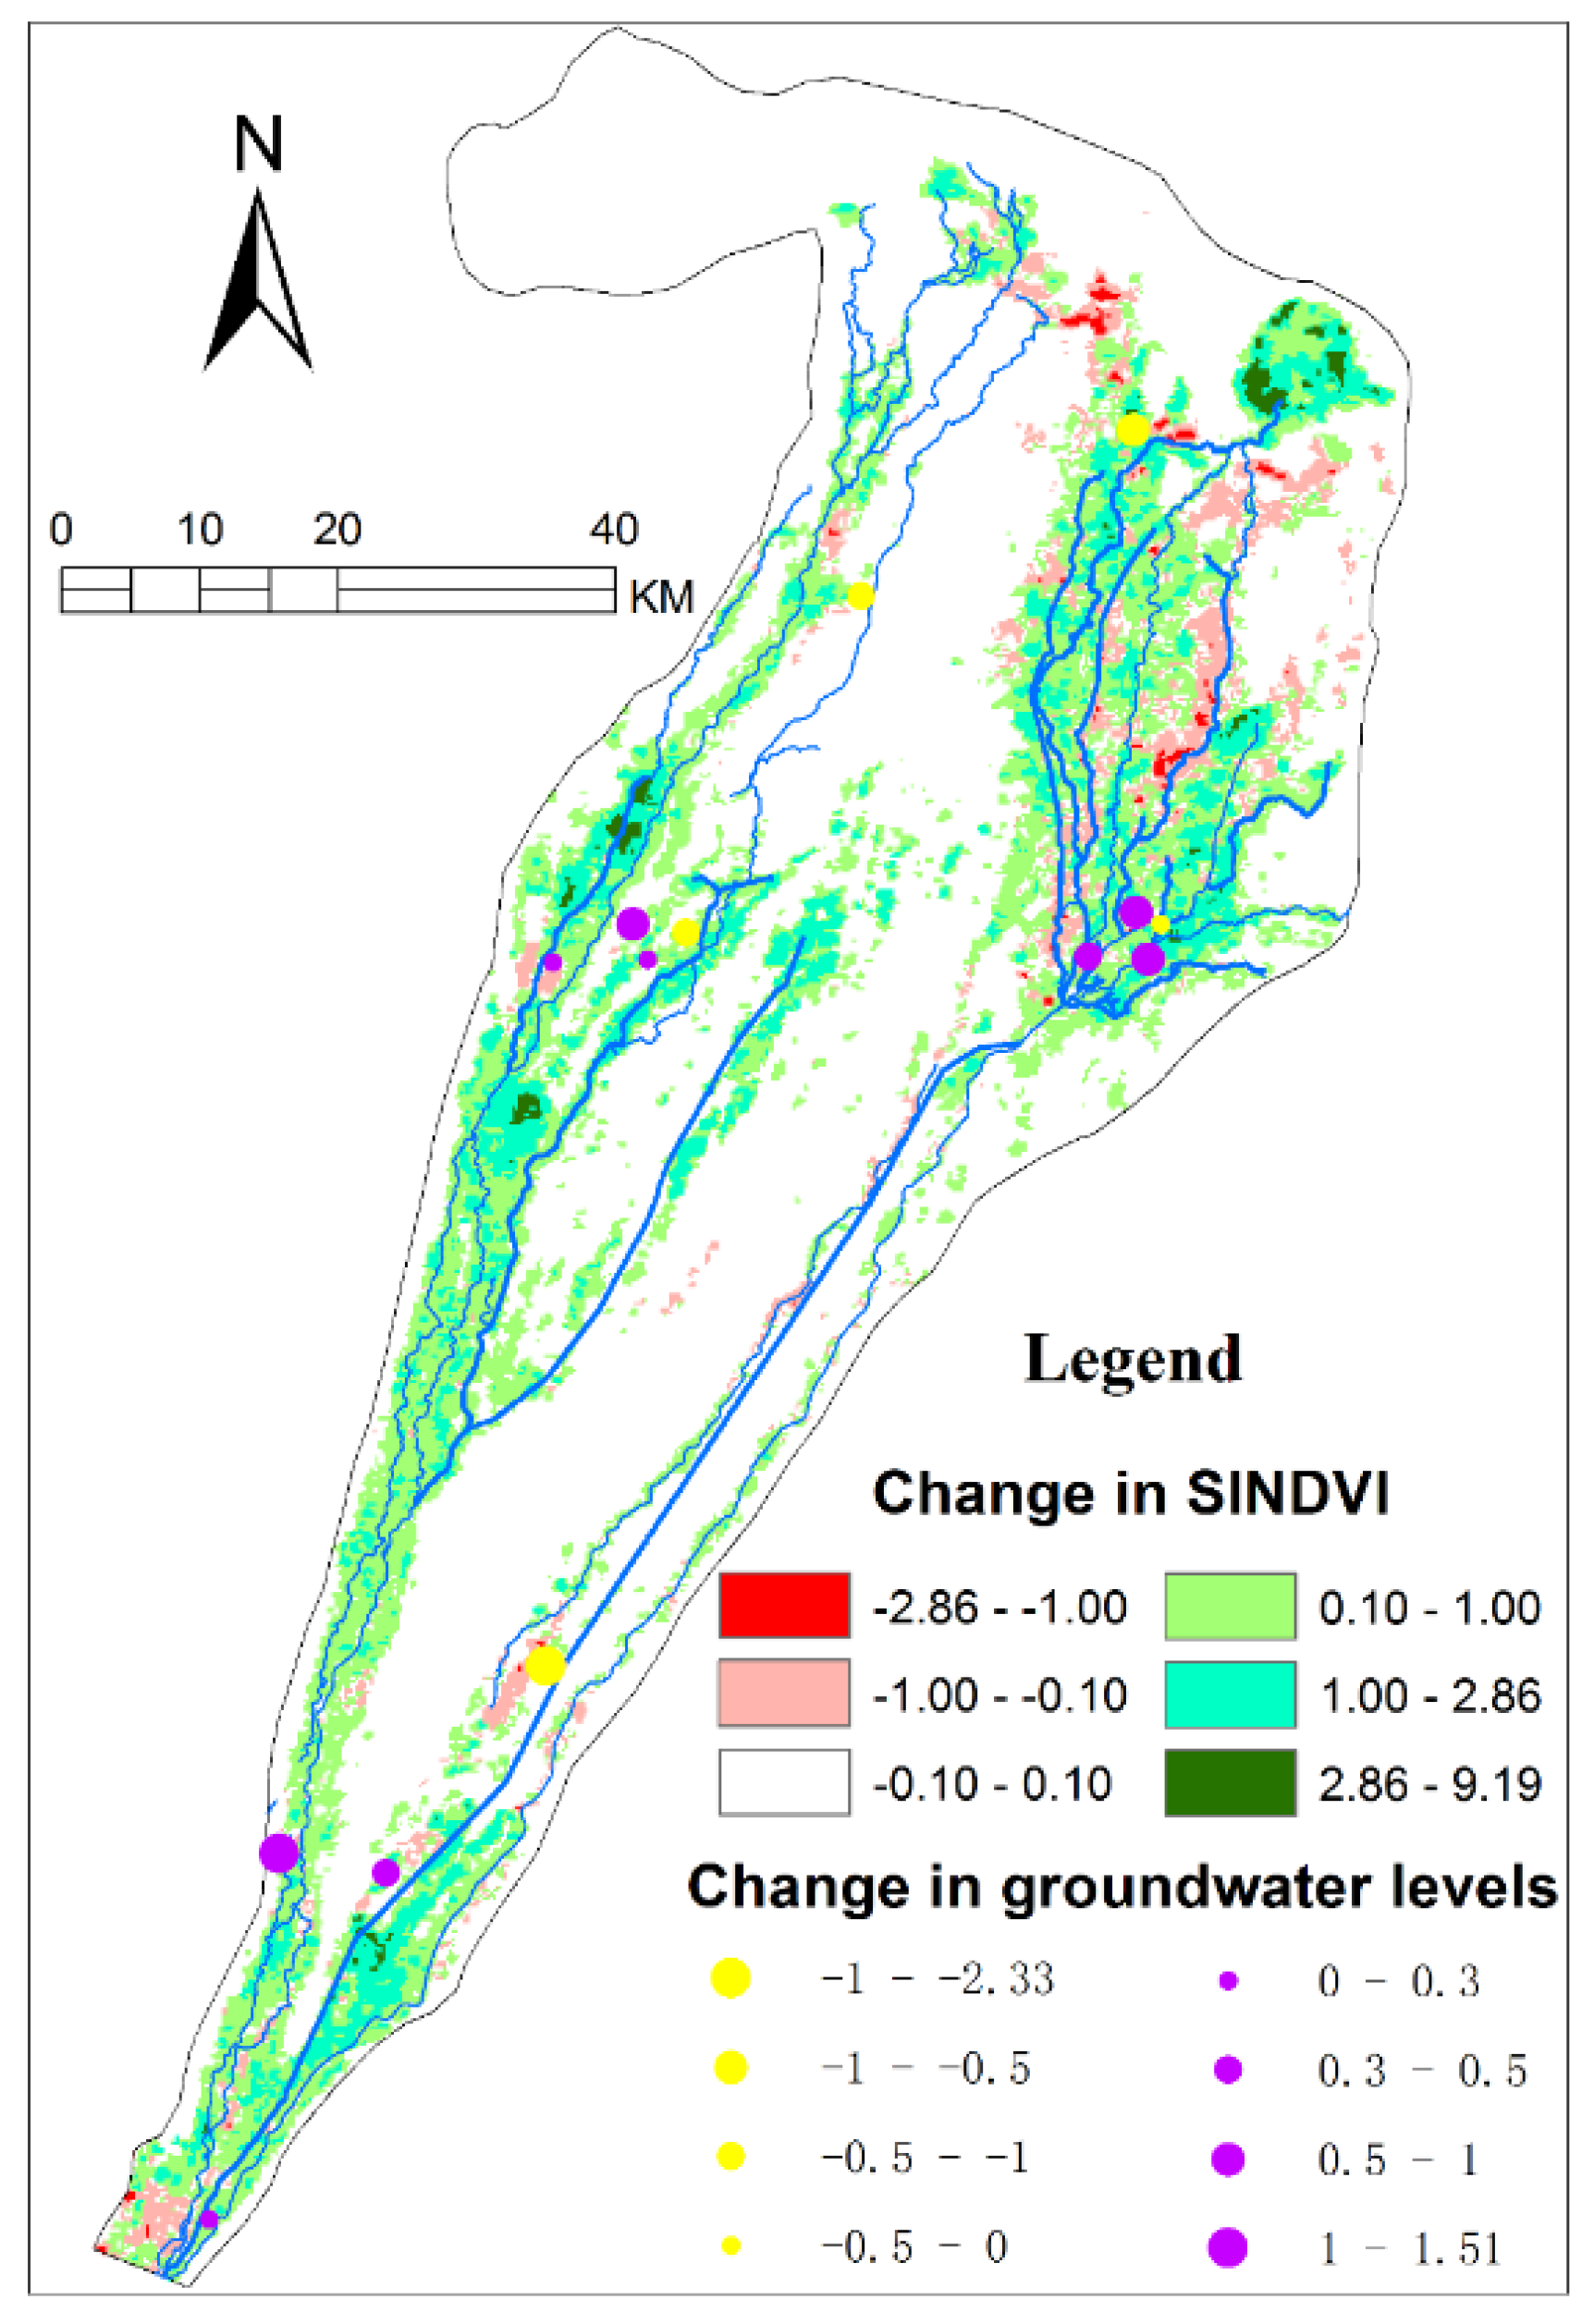
4.2. SINDVI Change


| Degree of SINDVI Changes | Range of SINDVI Changes | Area (%) |
|---|---|---|
| High range decreases | −2.86~−1.00 | 0.26 |
| Lower range decreases | −1.00~−0.10 | 4.32 |
| Relatively stable | −0.10~+0.10 | 64.24 |
| Lower range increases | +0.10~+1.00 | 22.48 |
| Medium range increases | +1.00~+2.86 | 8.21 |
| Higher range increases | +2.86~+9.19 | 0.49 |
5. Discussion
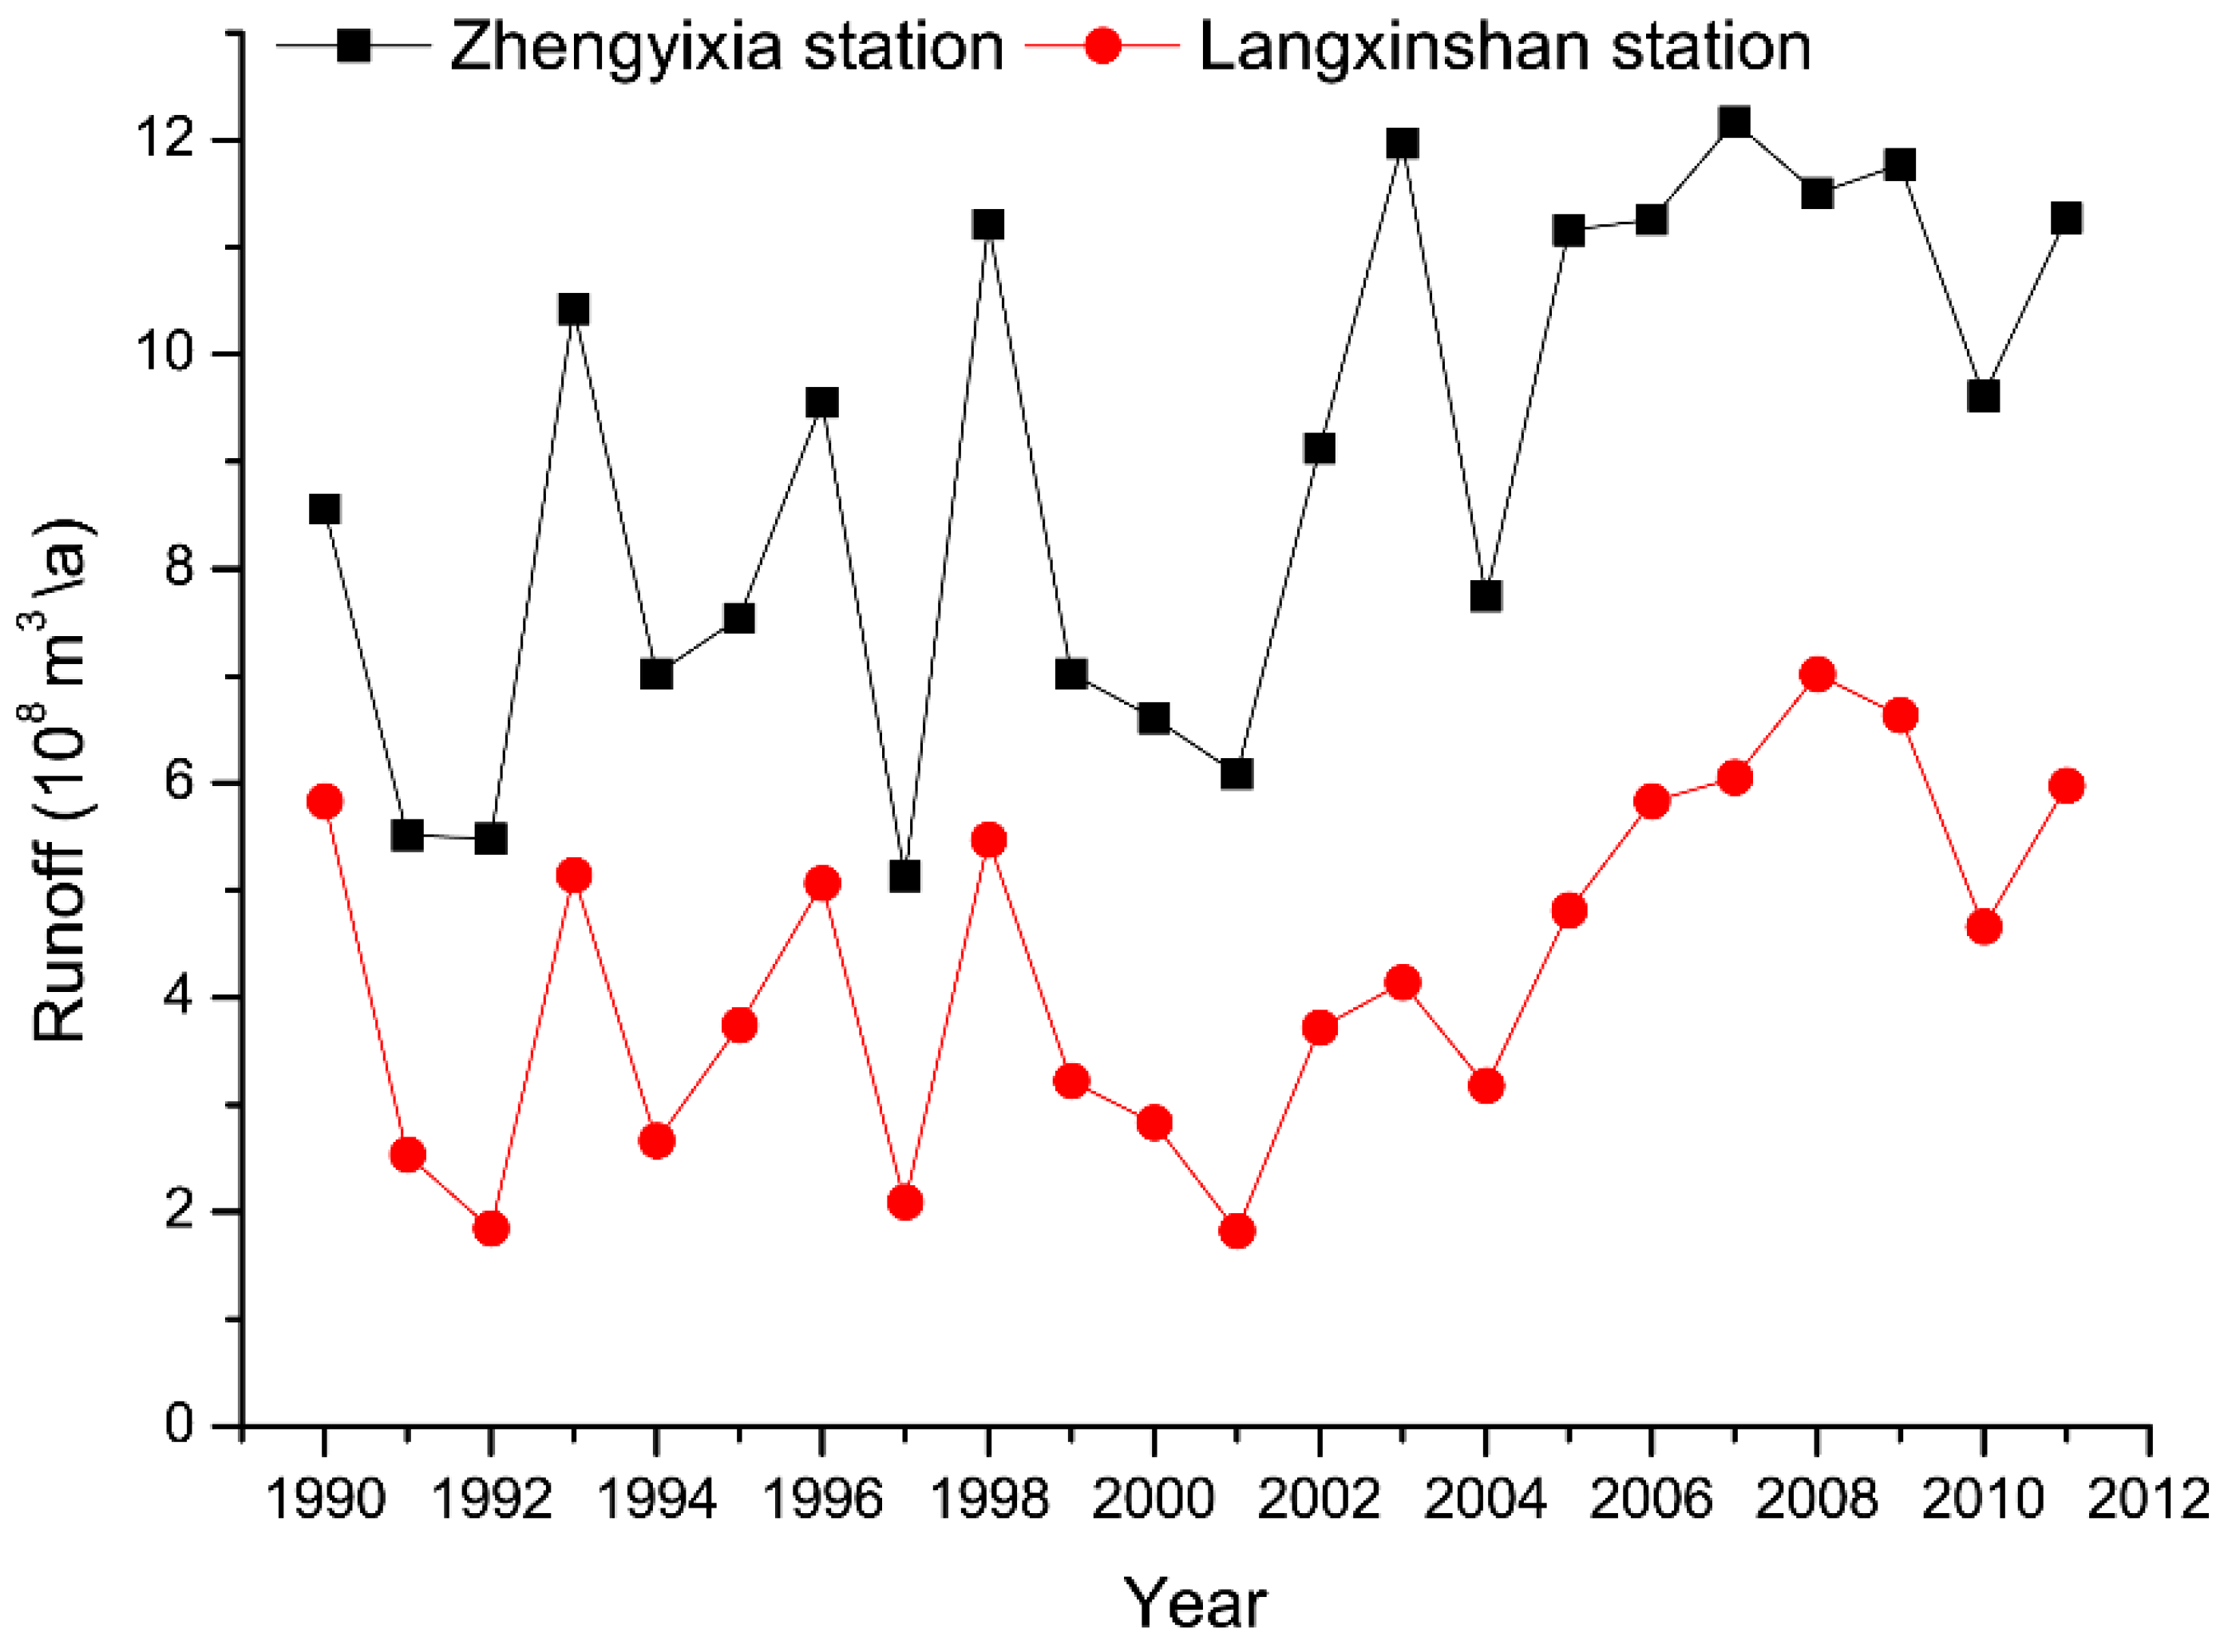
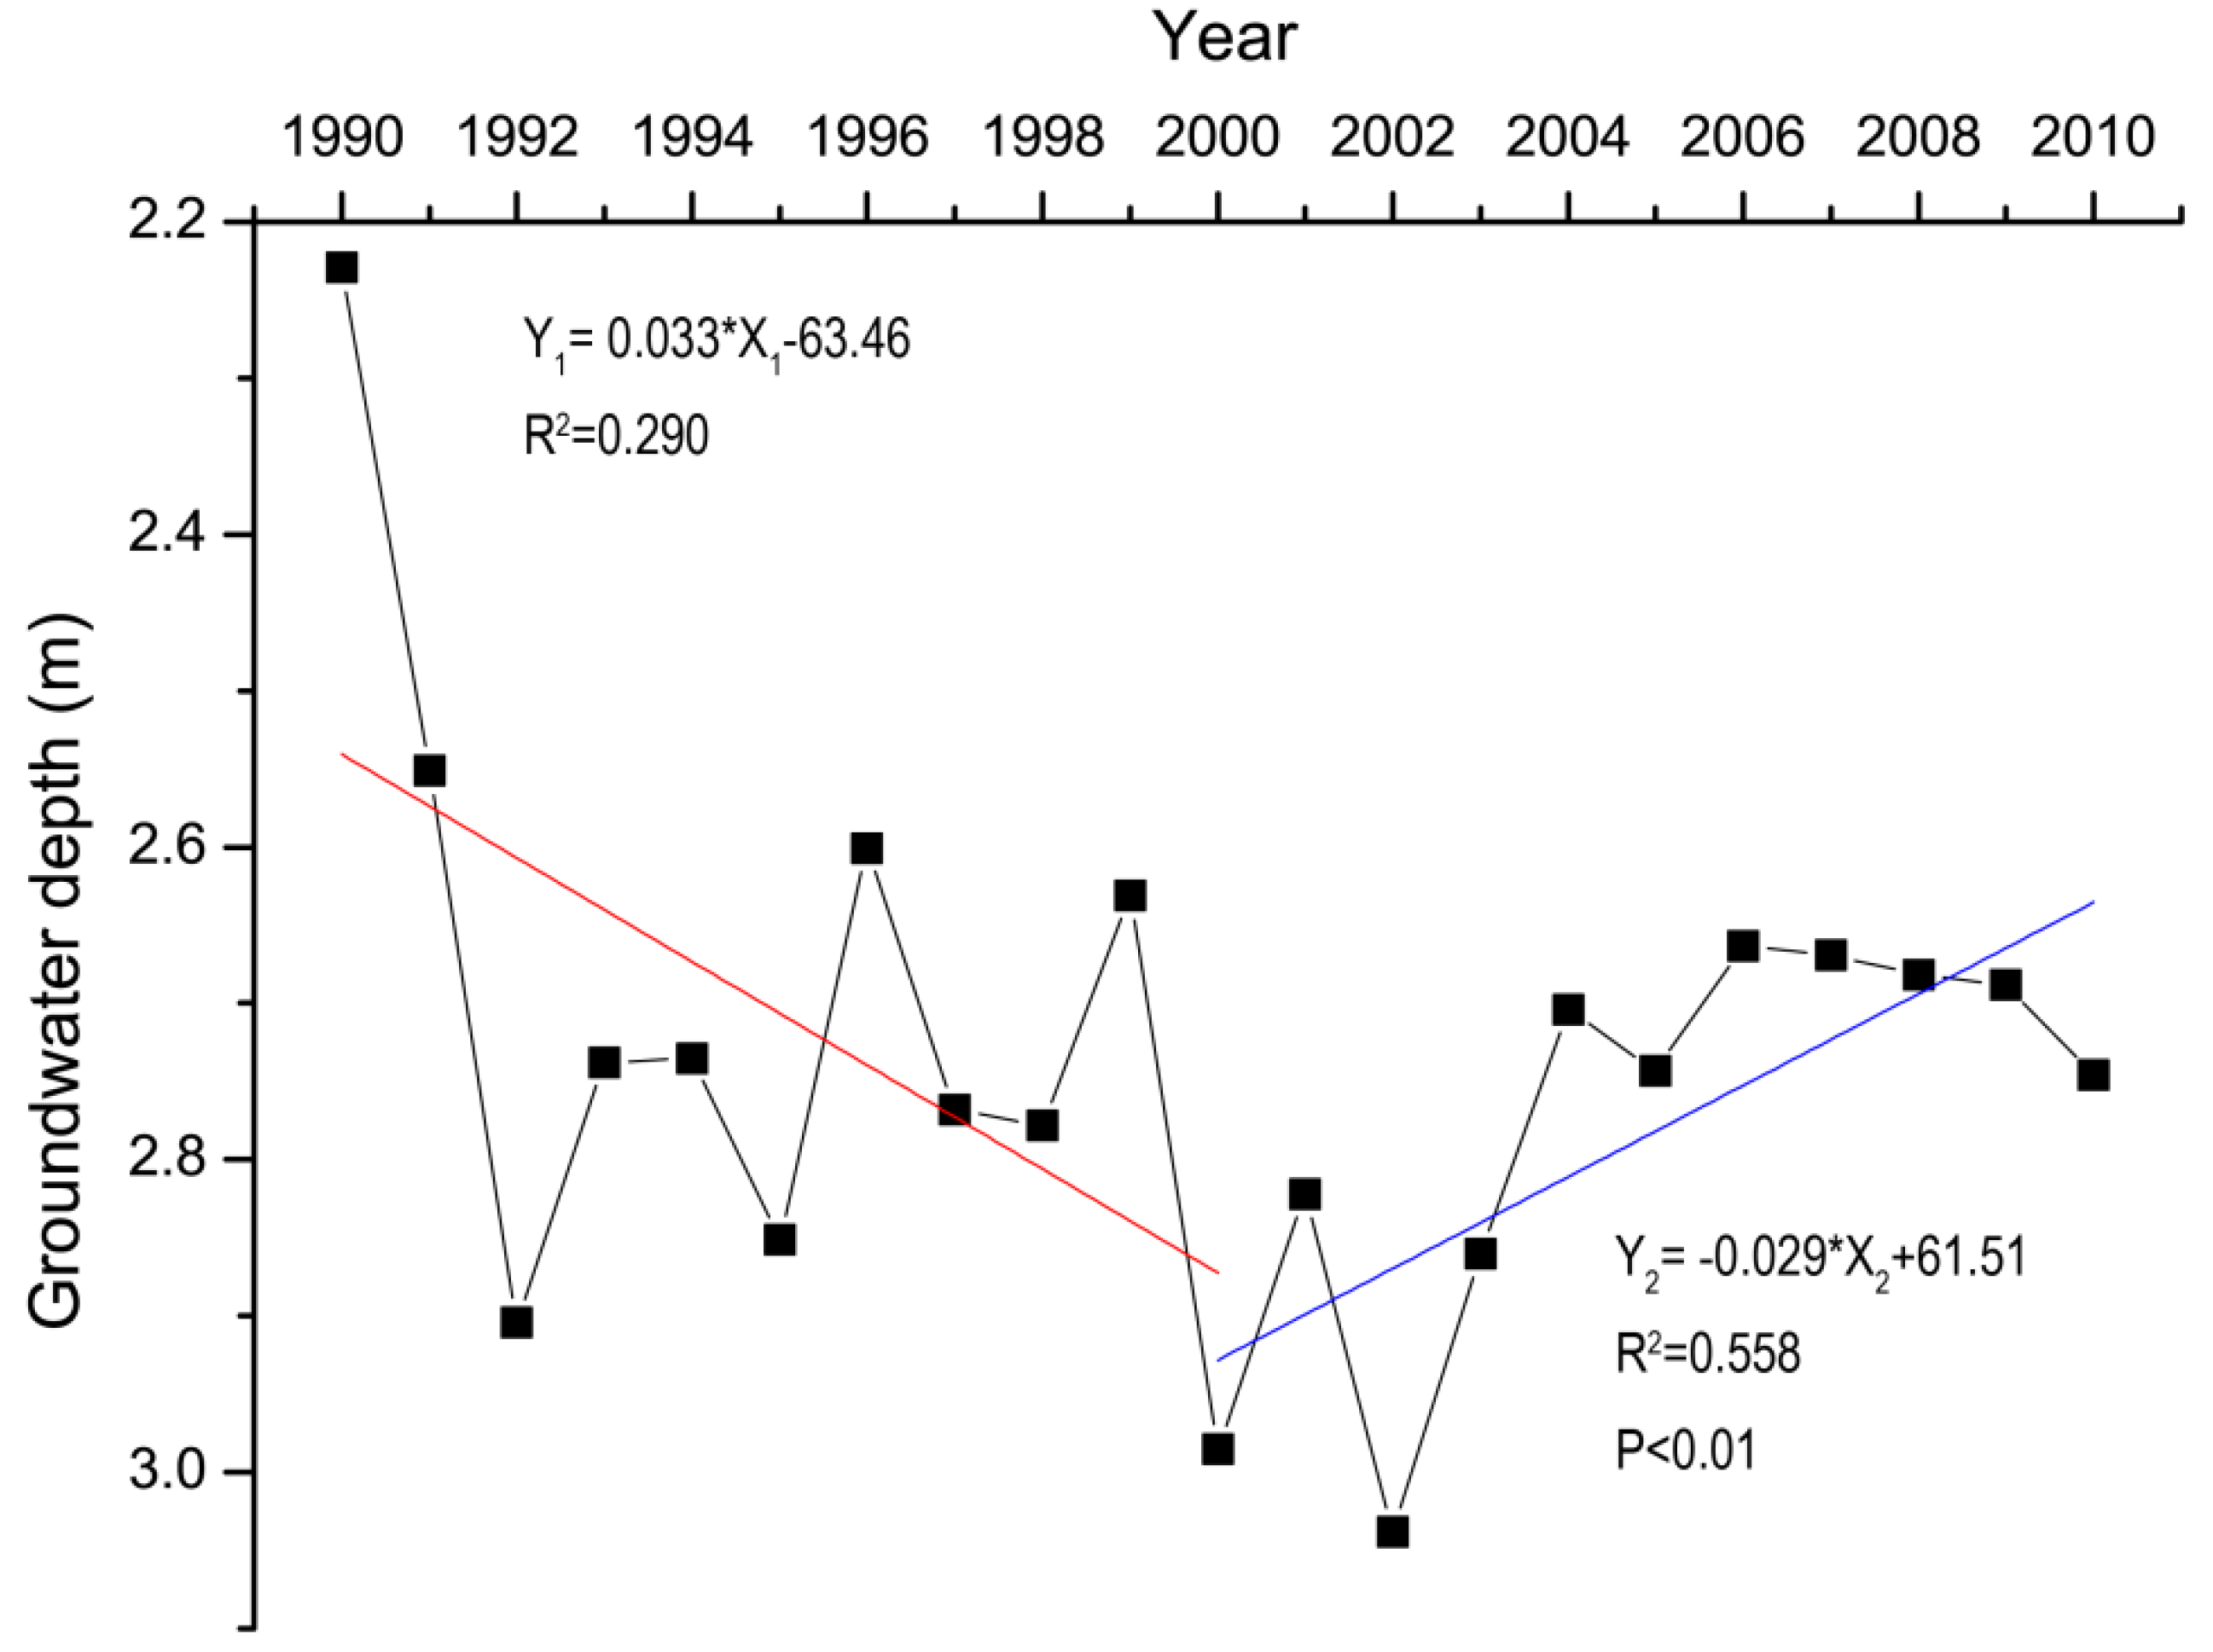
5.1. Driving Factors behind Ecosystem Recovery
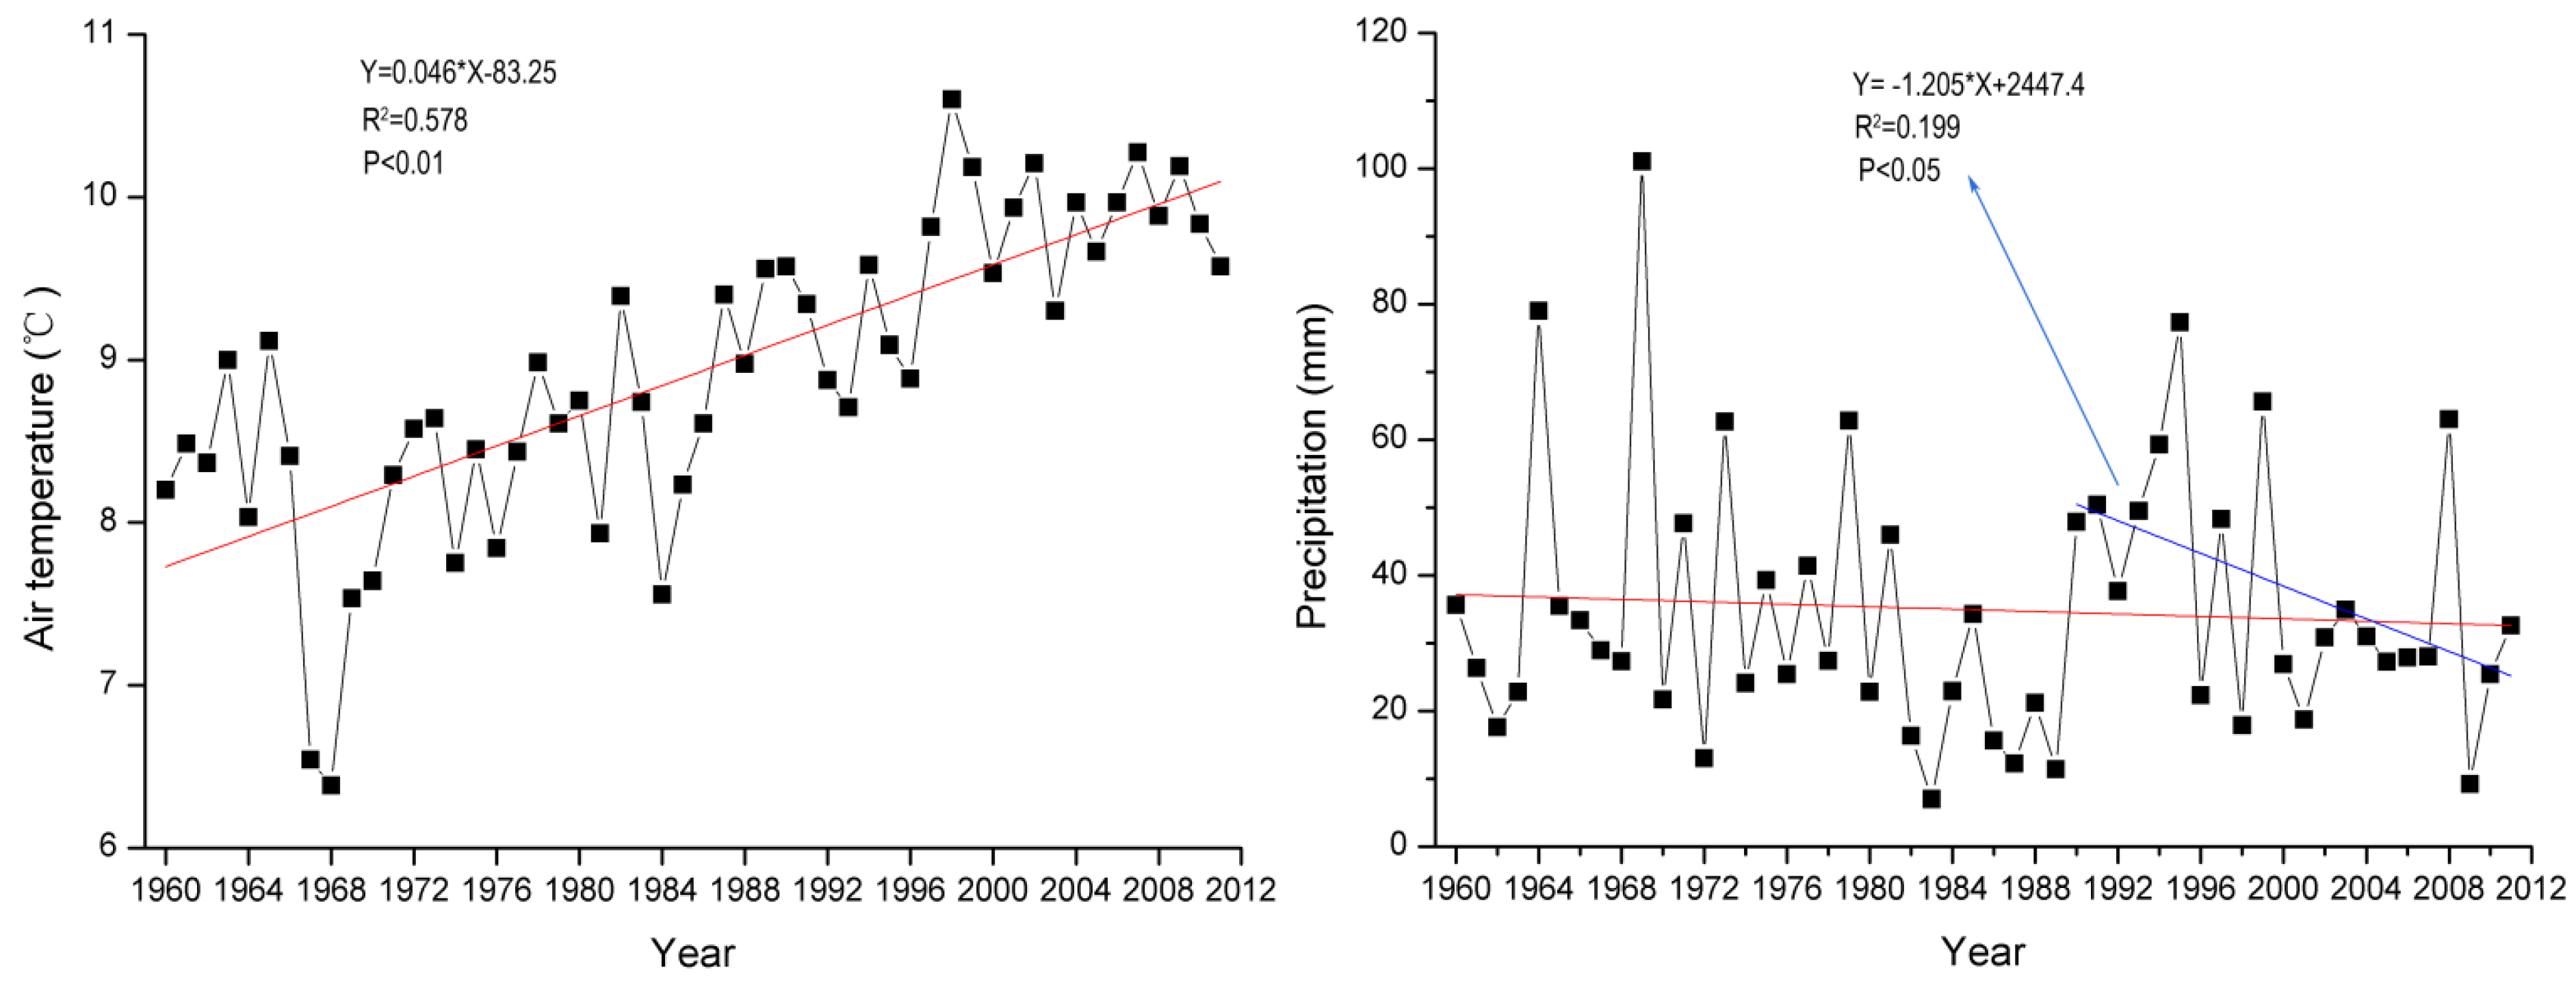
| Correlation Coefficients | Same Year | Previous Years | |||
|---|---|---|---|---|---|
| One Year | Two Years | Three Years | Four Years | ||
| r | 0.729 | 0.903 | 0.837 | 0.600 | 0.385 |
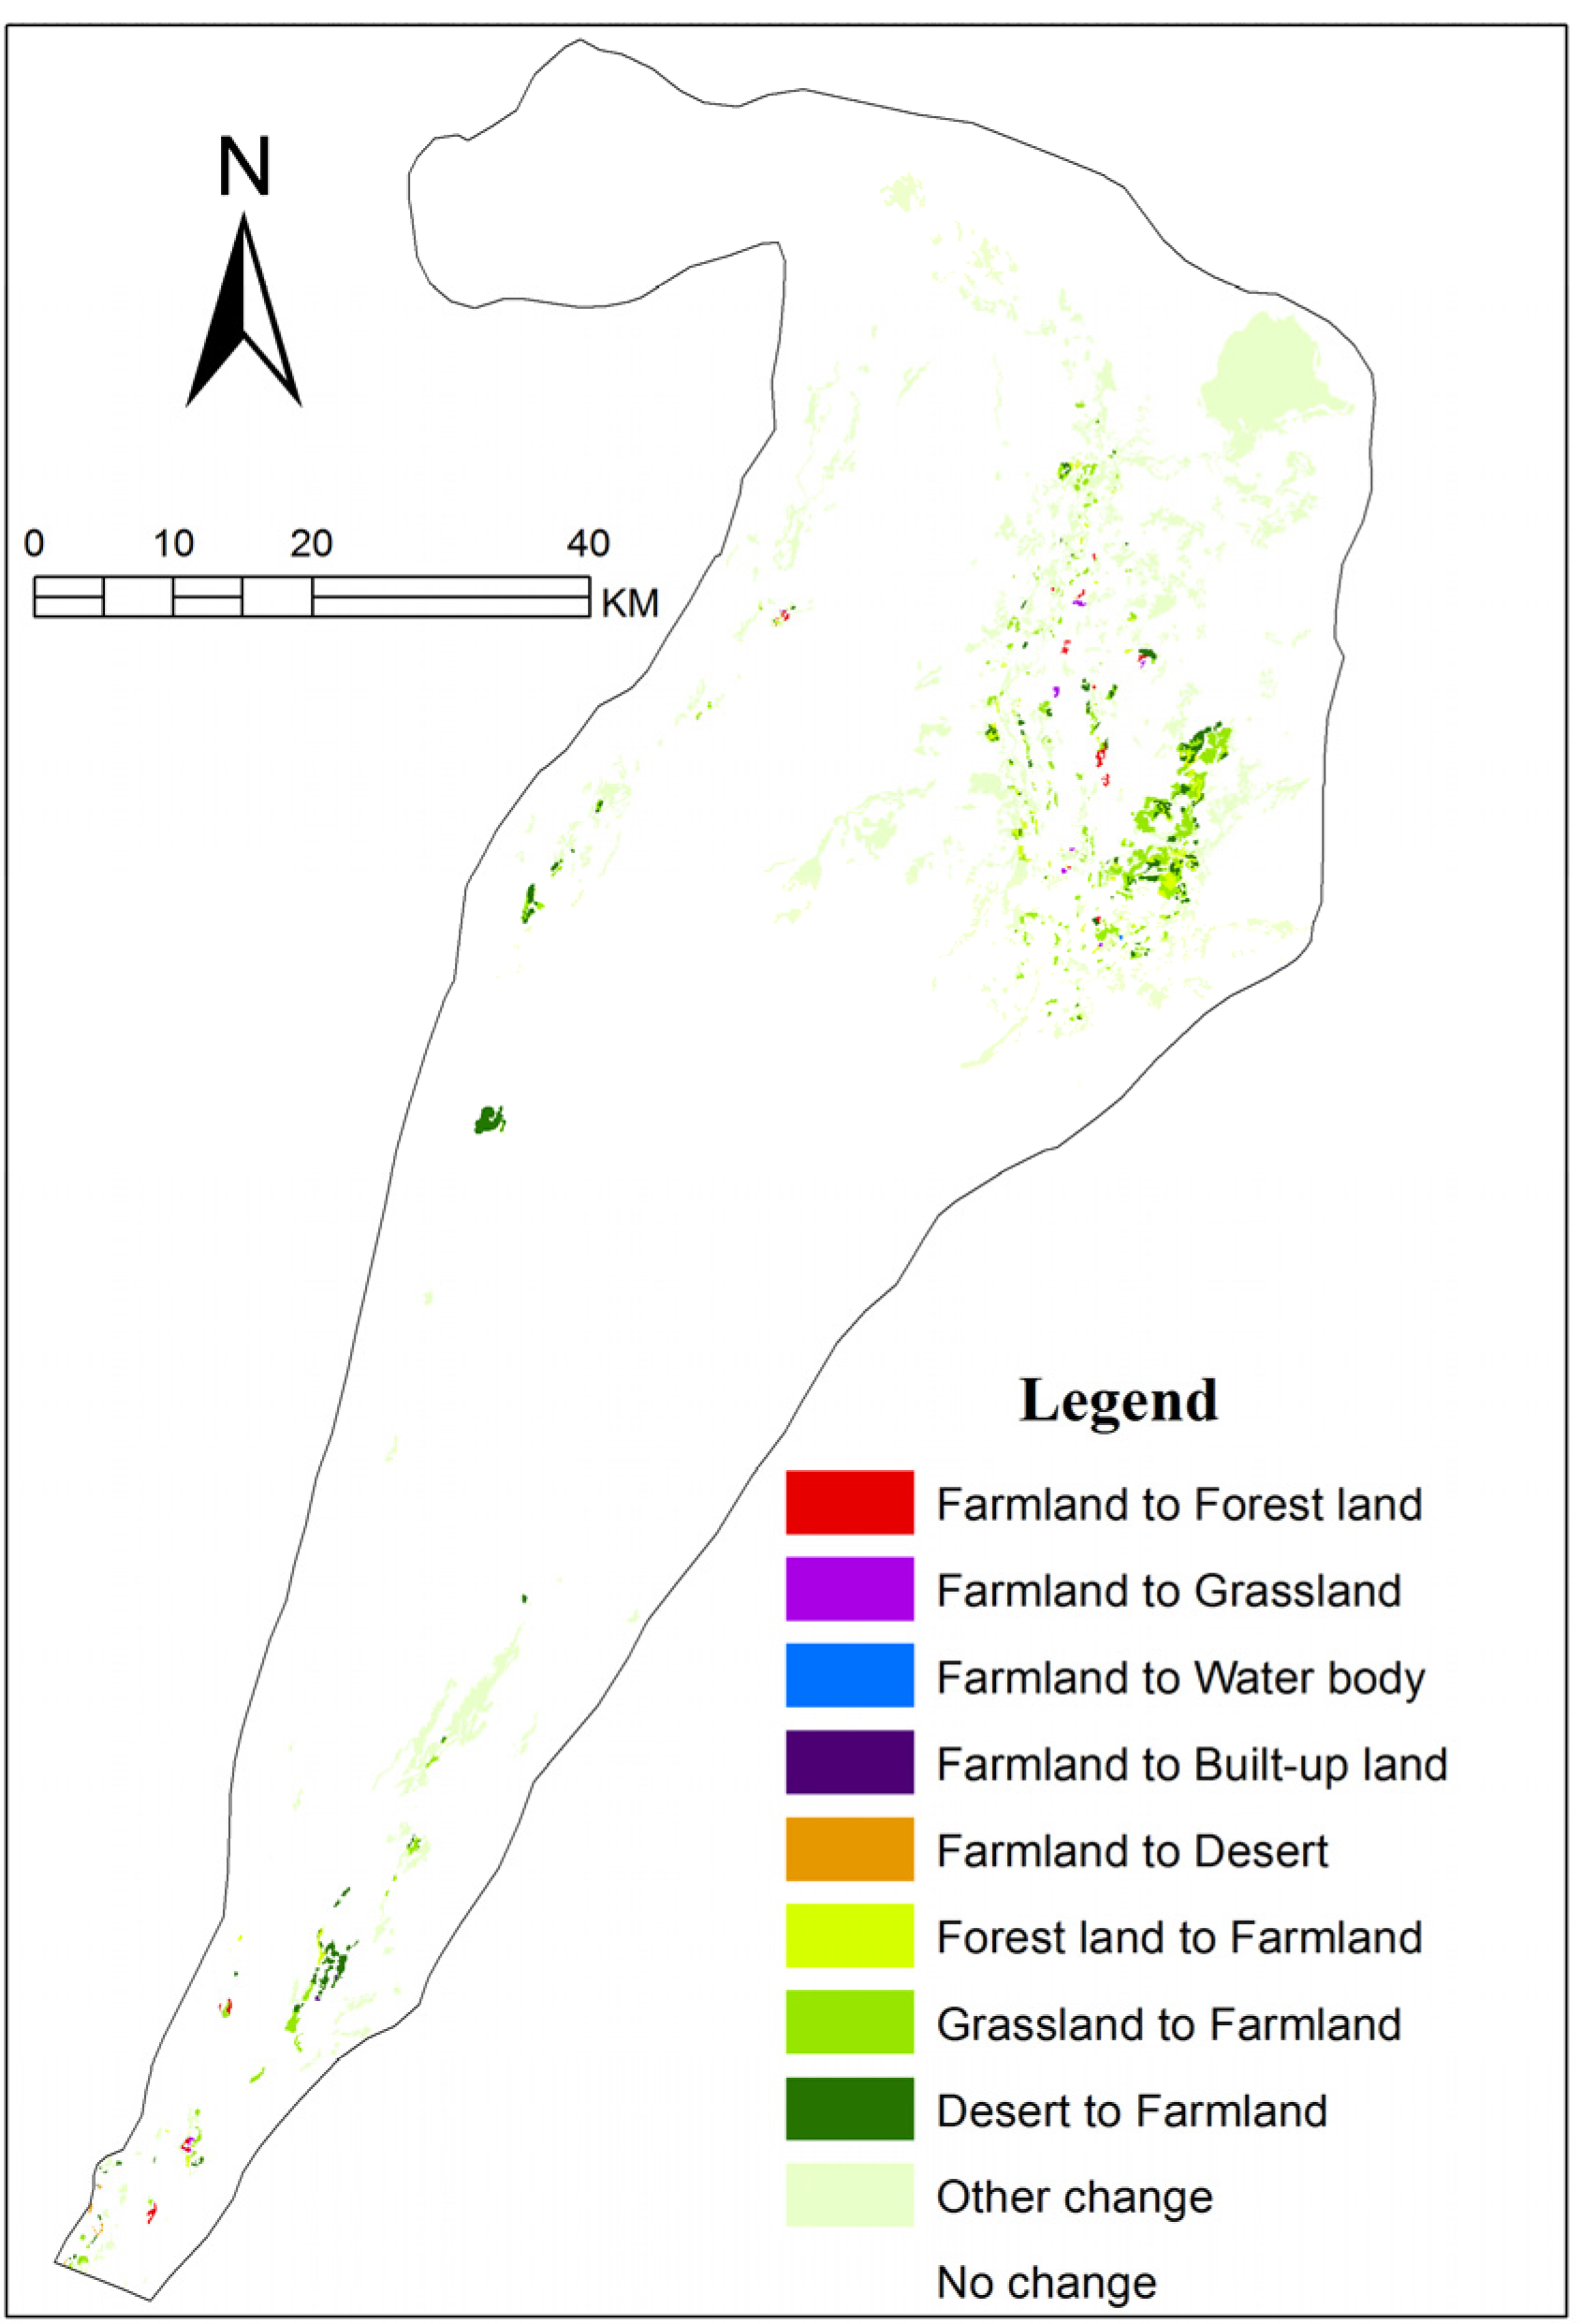
5.2. Reasons behind Farmland Expansion
5.3. Reasons behind Ecosystem Degradation in Particular Areas
6. Conclusions
Acknowledgments
Author Contributions
Conflicts of Interest
References
- Prinz, D.; Singh, A.K. Water resources in Arid Regions and their sustainable management. Ann. Arid Lands 2000, 39, 251–272. [Google Scholar]
- Pereira, L.S.; Oweis, T.; Zairi, A. Irrigation management under water scarcity. Agric. Water Manag. 2002, 57, 175–206. [Google Scholar] [CrossRef]
- Chen, Y.N.; Cui, W.C.; Li, W.H.; Chen, Y.P.; Zhang, H.F. Utilization of water resources and ecological protection in the Tarim River. Acta Geogr. Sin. 200 2003, 58, 215–222. [Google Scholar]
- Paulo, A.A.; Pereira, L.S. Drought concepts and characterization: Comparing drought indices applied at local and regional scales. Water Int. 2006, 31, 37–49. [Google Scholar] [CrossRef]
- Micklin, P. The Aral Sea disaster. Ann. Rev. Earth Planet. Sci. 2007, 35, 47–72. [Google Scholar] [CrossRef]
- Chen, Y.; Chen, Y.P.; Xu, C.C.; Ye, Z.X.; Li, Z.Q.; Zhu, C.G.; Ma, X.D. Effects of ecological water conveyance on groundwater dynamics and riparian vegetation in the lower reaches of Tarim River, China. Hydrol. Process. 2010, 24, 170–177. [Google Scholar] [CrossRef]
- Turner, B.L.; Lambin, E.F.; Reenberg, A. The emergence of land change science for global environmental change and sustainability. Proc. Natl. Acad. Sci. USA 2007, 104, 20666–20671. [Google Scholar] [CrossRef] [PubMed]
- Luo, G.P.; Zhou, C.H.; Chen, X.; Li, Y. A methodology of characterizing status and trend of land changes in oases: A case study of Sangong River watershed, Xinjiang, China. J. Environ. Manag. 2008, 88, 775–783. [Google Scholar] [CrossRef] [PubMed]
- Lambin, E.F. Change detection at multiple temporal scales: Seasonal and annual variations in landscape variables. Photogramm. Eng. Remote Sens. 1996, 62, 931–938. [Google Scholar]
- Brannstrom, C.; Jepson, W.; Filippi, A.M.; Redo, D.; Xu, Z.W.; Ganesh, S. Land change in the Brazilian Savanna (Cerrado), 1986–2002: Comparative analysis and implications for land-use policy. Land Use Policy 2008, 25, 579–595. [Google Scholar] [CrossRef]
- Ruelland, D.; Tribotte, A.; Puech, C.; Dieulin, C. Comparison of methods for LUCC monitoring over 50 years from aerial photographs and satellite images in a Sahelian catchment. Int. J. Remote Sens. 2011, 32, 1747–1777. [Google Scholar] [CrossRef]
- Sleeter, B.M.; Sohl, T.L.; Loveland, T.R.; Auch, R.F.; Acevedo, W.; Drummond, M.A.; Sayler, K.L.; Stehman, S.V. Land-cover change in the conterminous United States from 1973 to 2000. Glob. Environ. Chang. 2013, 23, 733–748. [Google Scholar] [CrossRef]
- Wondie, M.; Schneider, W.; Melesse, A.M.; Teketay, D. Spatial and temporal land cover changes in the Simen Mountains National Park, a world heritage site in Northwestern Ethiopia. Remote Sens. 2011, 3, 752–766. [Google Scholar] [CrossRef]
- Giri, C.; Long, J. Land cover characterization and mapping of South America for the year 2010 using Landsat 30 m satellite data. Remote Sens. 2014, 6, 9494–9510. [Google Scholar] [CrossRef]
- Curatola Fernandez, G.F.; Obermeier, W.A.; Gerique, A.; Sandoval, M.; Lehnert, L.W.; Thies, B.; Bendix, J. Land cover change in the Andes of Southern Ecuador—Patterns and drivers. Remote Sens. 2015, 7, 2509–2542. [Google Scholar] [CrossRef]
- Foley, J.A.; Defries, R.; Asner, G.P.; Barford, C.; Bonan, G.; Carpenter, S.R.; Stuart Chapin, F.; Coe, M.T.; Daily, G.C.; Gibbs, H.K.; et al. Global consequences of land use. Science 2005, 309, 570–574. [Google Scholar] [CrossRef] [PubMed]
- Liu, Y.S.; Chen, B.M. The study framework of land use/cover change based on sustainable development in China. Geogr. Res. 2002, 21, 324–330. [Google Scholar]
- Xiao, S.C.; Xiao, H.L. The Impact of Human Activity on the Water Environment of HeiHe Water basin in Last Century. J. Arid Land Resour. Environ. 2004, 3, 57–62. [Google Scholar]
- Wang, J.; Meng, J.J. Characteristics and tendencies of annual runoff variations in the Heihe River Basin during the past 60 years. Sci. Geogr. Sin. 2008, 28, 83–88. [Google Scholar]
- Lu, L.; Li, X.; Cheng, G.D. Landscape evolution in the middle Heihe River Basin of northwest China during the last decade. J. Arid Environ. 2003, 53, 395–408. [Google Scholar] [CrossRef]
- Qin, C.; Yang, B.; Burchardt, I.; Hu, X.L.; Kang, X.C. Intensified pluvial conditions during the twentieth century in the inland Heihe River Basin in arid northwestern China over the past millennium. Glob. Planet. Chang. 2010, 72, 192–200. [Google Scholar] [CrossRef]
- Yang, B.; Qin, C.; Shi, F.; Sonechkin, D.M. Tree ring-based annual streamflow reconstruction for the Heihe River in arid northwestern China from AD 575 and its implications for water resource management. Holocene 2011, 22, 773–784. [Google Scholar] [CrossRef]
- Shi, Y.F.; Shen, Y.P.; Li, D.L.; Zhang, G.W.; Ding, Y.J.; Hu, R.J.; Kang, E.S. Discussion on the present climate change from warm-dry to warm-wet in northwest China. Quat. Sci. 2003, 23, 152–164. [Google Scholar]
- Liu, Y.C. Evolution of the Juyan lake. J. Arid Land Resour. Environ. 1992, 6, 9–18. [Google Scholar]
- Cheng, G.D. Saving water is the only way for Northwest China to survive. Bull. Chin. Acad. Sci. 1996, 10, 203–206. [Google Scholar]
- Wang, G.; Cheng, G. Water resource development and its influence on the environment in arid areas of China—The case of the Hei River basin. J. Arid Environ. 1999, 43, 121–131. [Google Scholar]
- Li, X.; Lu, L.; Cheng, G.; Xiao, H. Quantifying landscape structure of the Heihe River Basin, north-west China using FRAGSTATS. J. Arid Environ. 2001, 48, 521–535. [Google Scholar] [CrossRef]
- Cheng, G.D.; Wang, G.X. Changing trend of drought and drought disaster in northwest China and countermeasures. Earth Sci. Front. 2006, 13, 3–14. [Google Scholar]
- Lu, L.; Li, X.; Veroustraete, F.; Kang, E.S.; Wang, J.H. Analysing the forcing mechanisms for net primary productivity changes in the Heihe River Basin, north-west China. Int. J. Remote Sens. 2009, 30, 793–816. [Google Scholar] [CrossRef]
- Liu, H.; Cai, X.M.; Geng, L.H.; Zhong, H.P. Restoration of pastureland ecosystems: Case study of Western Inner Mongolia. J. Water Resour. Plan. Manag. 2005, 131, 420–430. [Google Scholar] [CrossRef]
- Cheng, G.D.; Li, X.; Zhao, W.Z.; Xu, Z.M.; Feng, Q.; Xiao, S.C.; Xiao, H.L. Integrated study of the water-ecosystem-economy in the Heihe River Basin. Natl. Sci. Rev. 2014, 1, 413–428. [Google Scholar] [CrossRef]
- Feng, Q.; Cheng, G.D.; Endo, K.N. Towards sustainable development of the environmentally degraded River Heihe basin, China. Hydrol. Sci. J. 2001, 46, 647–658. [Google Scholar] [CrossRef]
- Li, X.; Nan, Z.T.; Cheng, G.D.; Ding, Y.J.; Wu, L.Z.; Wang, L.X.; Wang, J.; Ran, Y.H.; Li, H.X.; Pan, X.D.; et al. Toward an improved data stewardship and service for environmental and ecological science data in west China. Int. J. Digit. Earth 2011, 4, 347–359. [Google Scholar] [CrossRef]
- Liu, J.Y.; Liu, M.L.; Zhuang, D.F.; Zhang, Z.X.; Deng, X.Z. Study on spatial pattern of land-use change in China during 1995–2000. Sci. China Ser. D 2003, 46, 373–384. [Google Scholar]
- Liu, J.Y.; Liu, M.L.; Tian, H.Q.; Zhuang, D.F.; Zhang, Z.X.; Zhang, W.; Tang, X.M.; Deng, X.Z. Spatial and temporal patterns of China’s cropland during 1990–2000: An analysis based on Landsat TM data. Remote Sens. Environ. 2005, 98, 442–456. [Google Scholar] [CrossRef]
- Stow, D.; Daeschner, S.; Hope, A.; Douglas, D.; Petersen, A.; Myneni, R.; Zhou, L.; Oechel, W. Variability of the Seasonally Integrated Normalized Difference Vegetation Index Across the North Slope of Alaska in the 1990s. Int. J. Remote Sens. 2003, 24, 1111–1117. [Google Scholar] [CrossRef]
- Ma, M.G.; Frank, V. Interannual variability of vegetation cover in the Chinese Heihe River Basin and its relation to meteorological parameters. Int. J. Remote Sens. 2006, 27, 3473–3486. [Google Scholar] [CrossRef]
- Song, Y.; Ma, M.G. Variation of AVHRR NDVI and its relationship with climate in Chinese arid and cold regions. J. Remote Sens. 2008, 12, 499–505. [Google Scholar]
- Ding, H.W.; Gao, Y.Z.; He, J.H.; Cao, B.Y. Reason of runoff reducing through Zhangyixia Gorge on Heihe River and Countermeasures. J. Desert Res. 2001, 21, 62–65. [Google Scholar]
- Jin, X.M.; Schaepman, M.; Clevers, J.; Su, Z.B.; Hu, G.C. Correlation between annual runoff in the Heihe River to the vegetation cover in the Ejina Oasis (China). Arid Land Res. Manag. 2010, 24, 31–41. [Google Scholar] [CrossRef]
- Gao, Q.Z.; Li, F.X. Rational Development and Utilization Of Water Resources in Heihe River Basin; Gansu Science and Technology Press: Lanzhou, China, 1990; pp. 91–92. [Google Scholar]
- Jia, L.; Shang, H.; Hu, G.; Menenti, M. Phenological response of vegetation to upstream river flow in the Heihe River basin by time series analysis of MODIS data. Hydrol. Earth Syst. Sci. 2011, 15, 1047–1064. [Google Scholar] [CrossRef]
- Jin, X.M.; Hu, G.C.; Li, W.M. Hysteresis effect of runoff of the Heihe River on vegetation cover in Ejin Oasis in Northwestern China. Earth Sci. Front. 2008, 15, 198–203. [Google Scholar] [CrossRef]
- Ejina Banner Bureau of statistics. Main economic indicators of Ejina Banner during 2000–2011. Available online: http://www.ejnqtj.gov.cn/Class.asp?ID=38&page=1 (accessed on 29 January 2015).
- Zhou, L.H.; Yang, G.J. Screening and evaluation of agricultural specialty industries in Ejina Banner located in the lower reaches of the Heihe River. Agric. Res. Arid Areas 2005, 23, 192–196. [Google Scholar]
© 2015 by the authors; licensee MDPI, Basel, Switzerland. This article is an open access article distributed under the terms and conditions of the Creative Commons Attribution license (http://creativecommons.org/licenses/by/4.0/).
Share and Cite
Hu, X.; Lu, L.; Li, X.; Wang, J.; Lu, X. Ejin Oasis Land Use and Vegetation Change between 2000 and 2011: The Role of the Ecological Water Diversion Project. Energies 2015, 8, 7040-7057. https://doi.org/10.3390/en8077040
Hu X, Lu L, Li X, Wang J, Lu X. Ejin Oasis Land Use and Vegetation Change between 2000 and 2011: The Role of the Ecological Water Diversion Project. Energies. 2015; 8(7):7040-7057. https://doi.org/10.3390/en8077040
Chicago/Turabian StyleHu, Xiaoli, Ling Lu, Xin Li, Jianhua Wang, and Xuegang Lu. 2015. "Ejin Oasis Land Use and Vegetation Change between 2000 and 2011: The Role of the Ecological Water Diversion Project" Energies 8, no. 7: 7040-7057. https://doi.org/10.3390/en8077040