
Nonlinear Passive Control of a Wave Energy Converter Subject to Constraints in Irregular Waves


Abstract
:1. Introduction

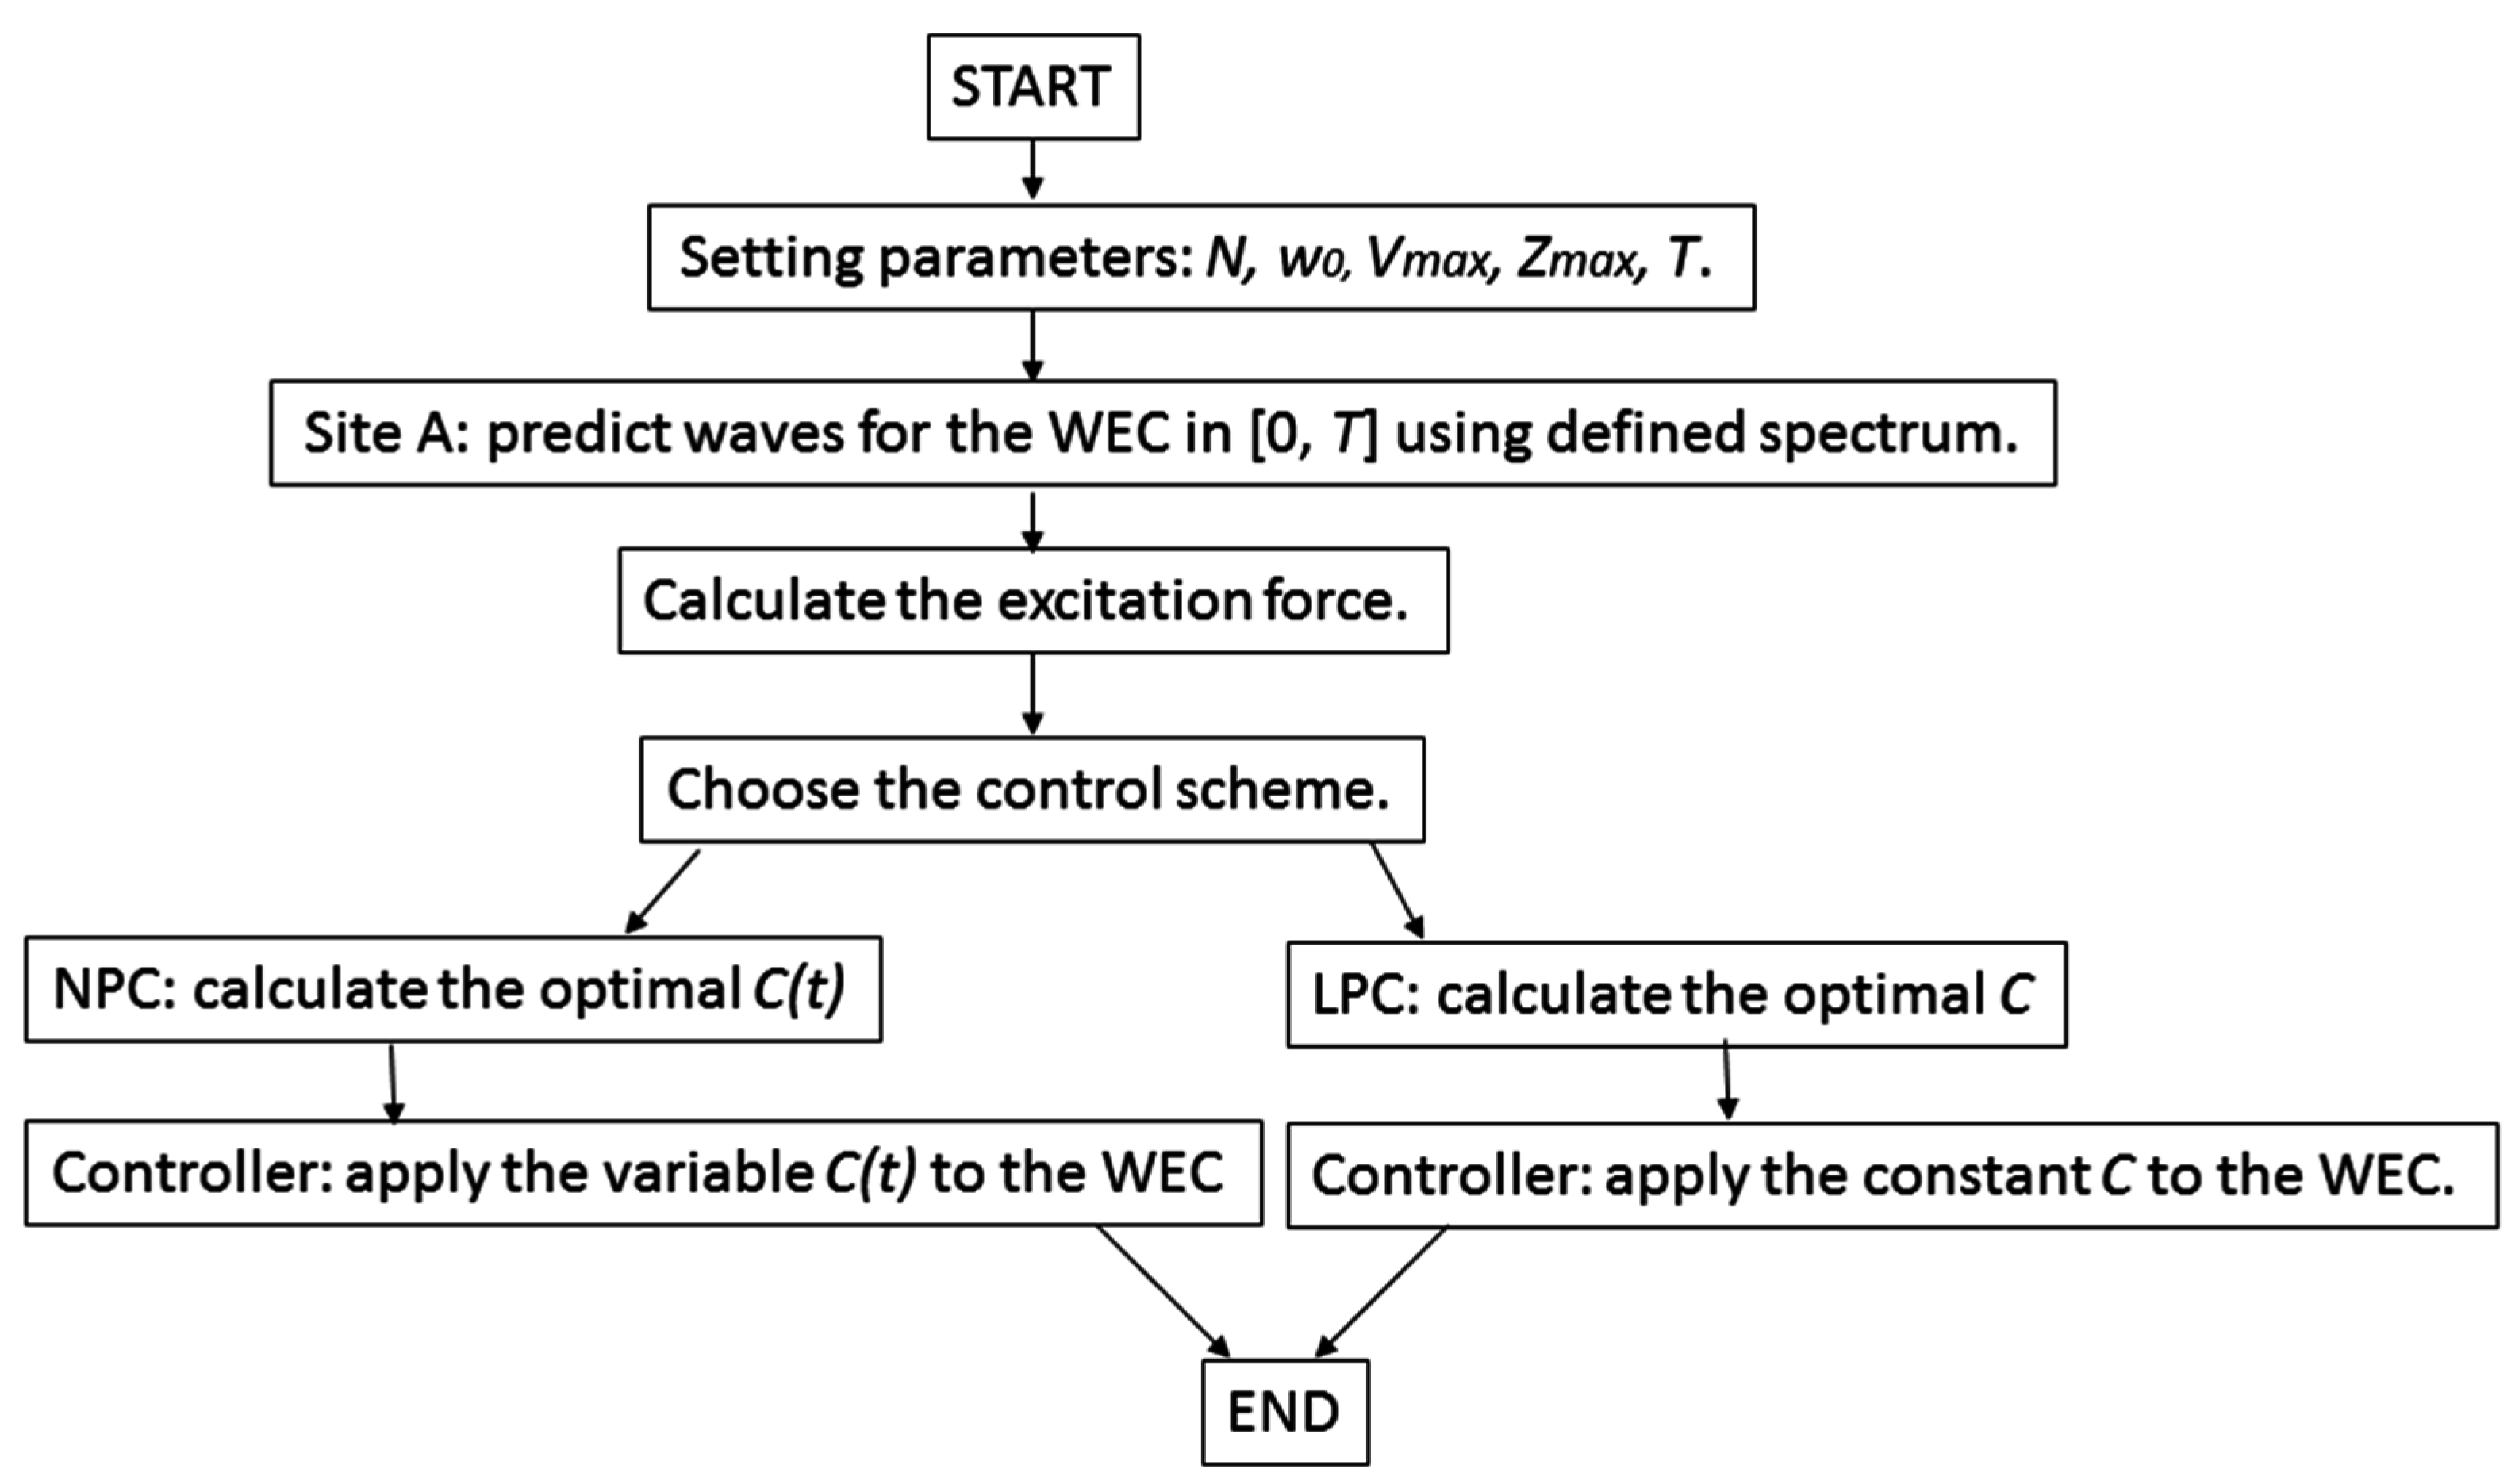
2. Methodology
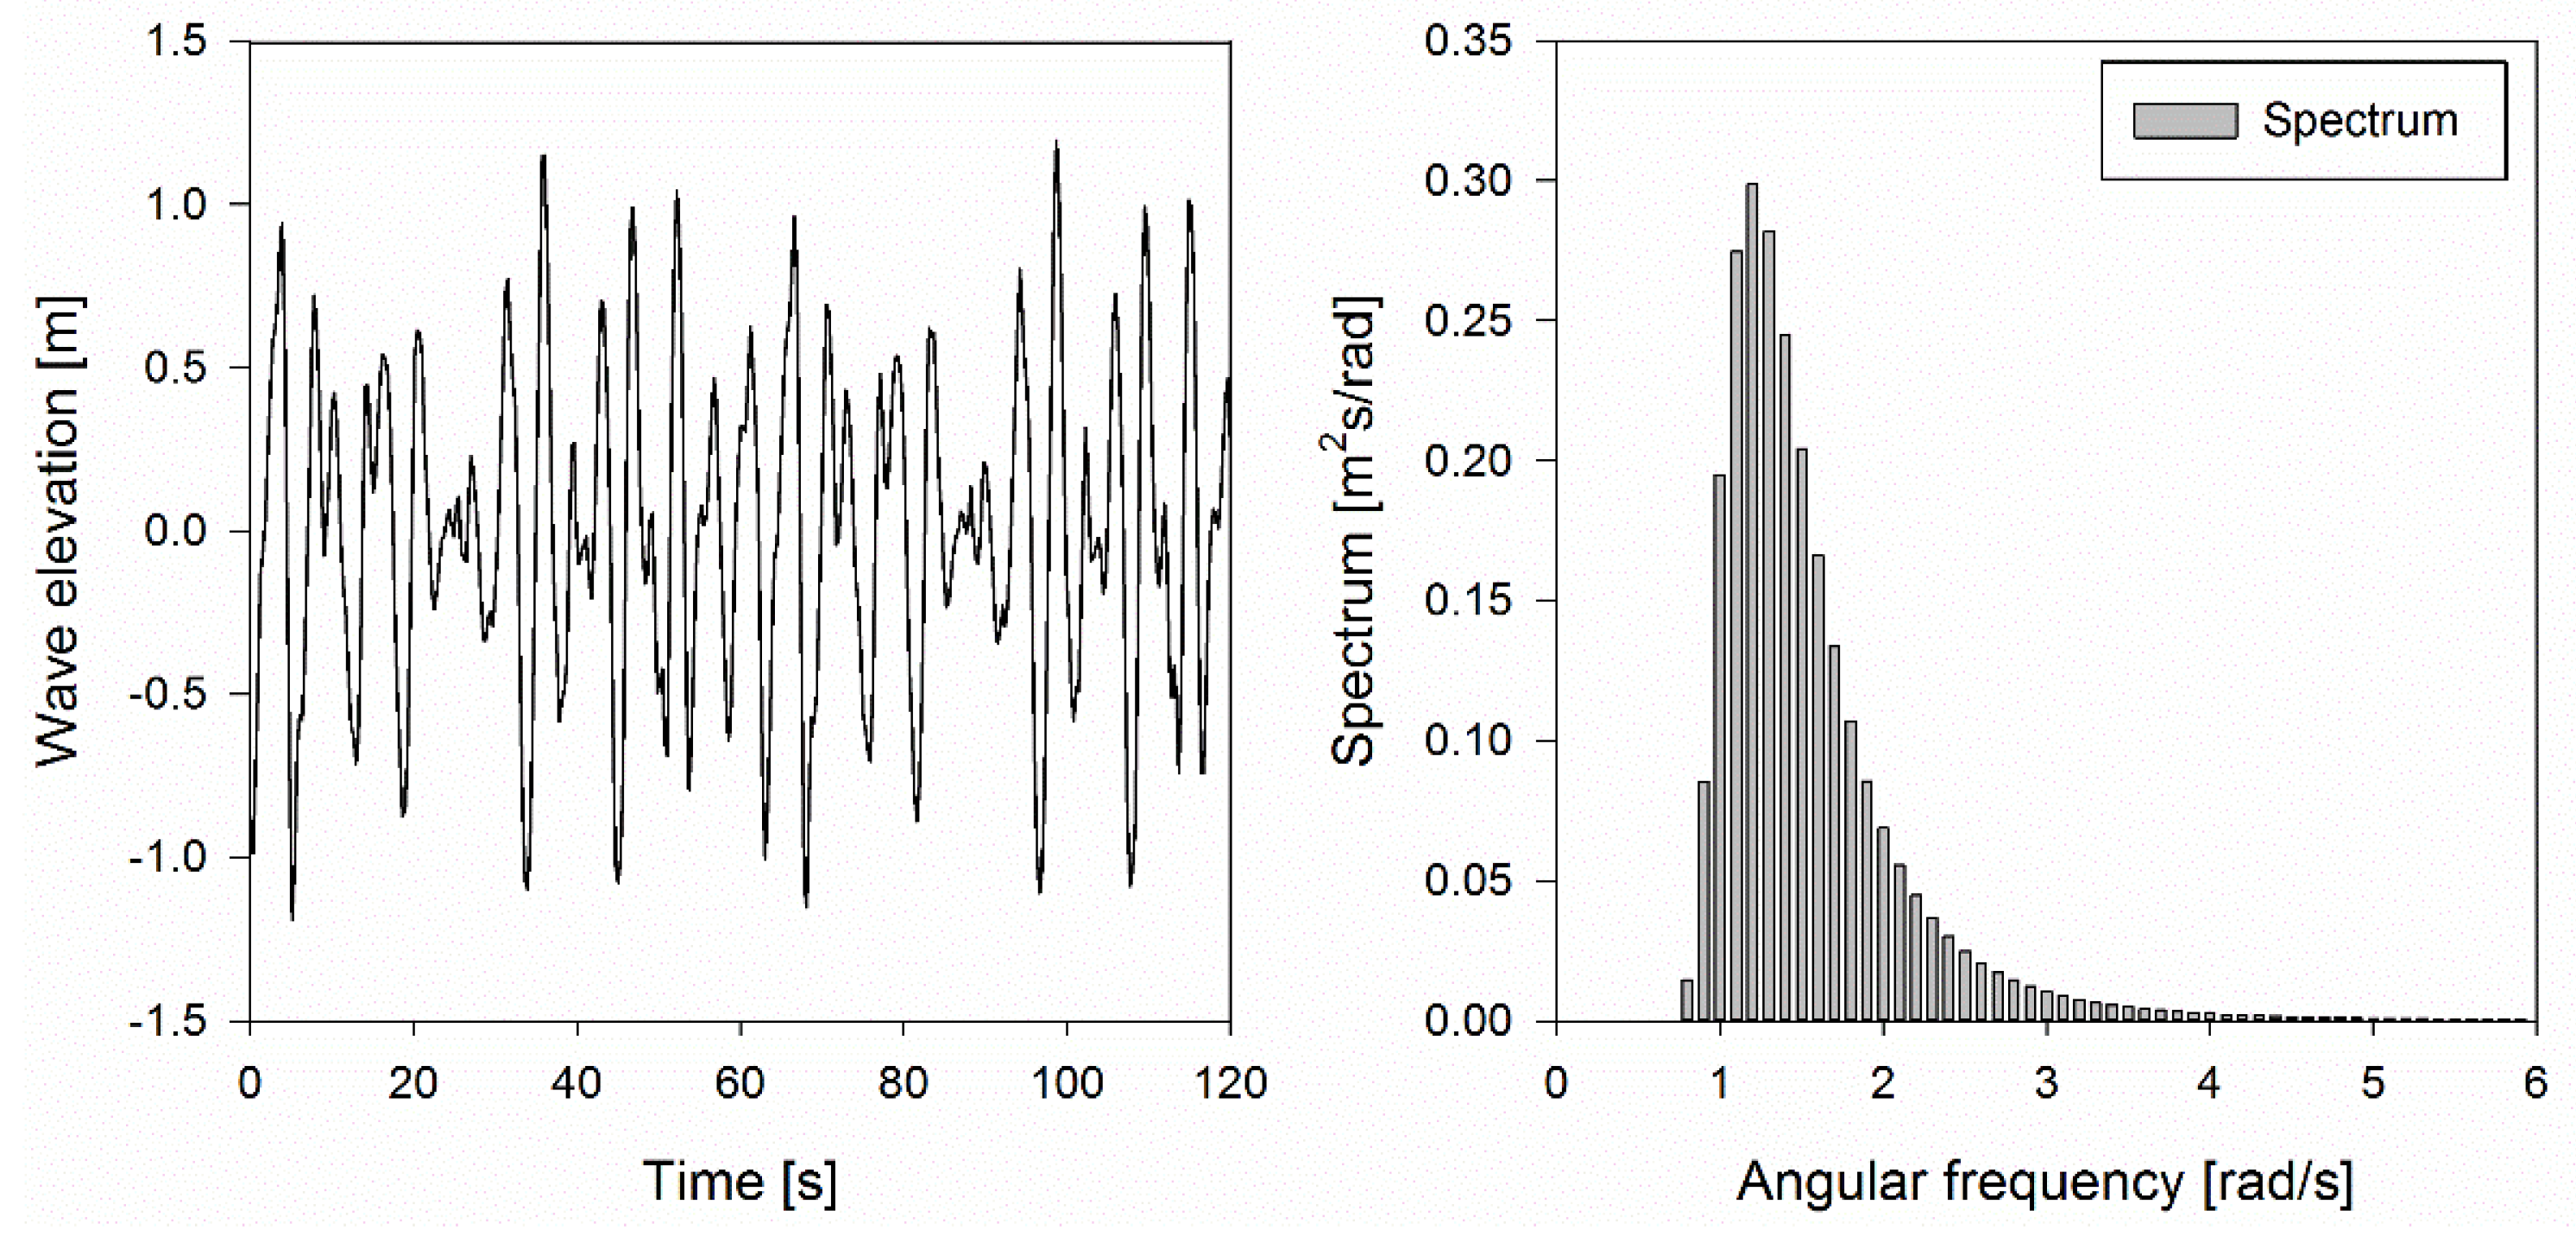
2.1. Wave Model
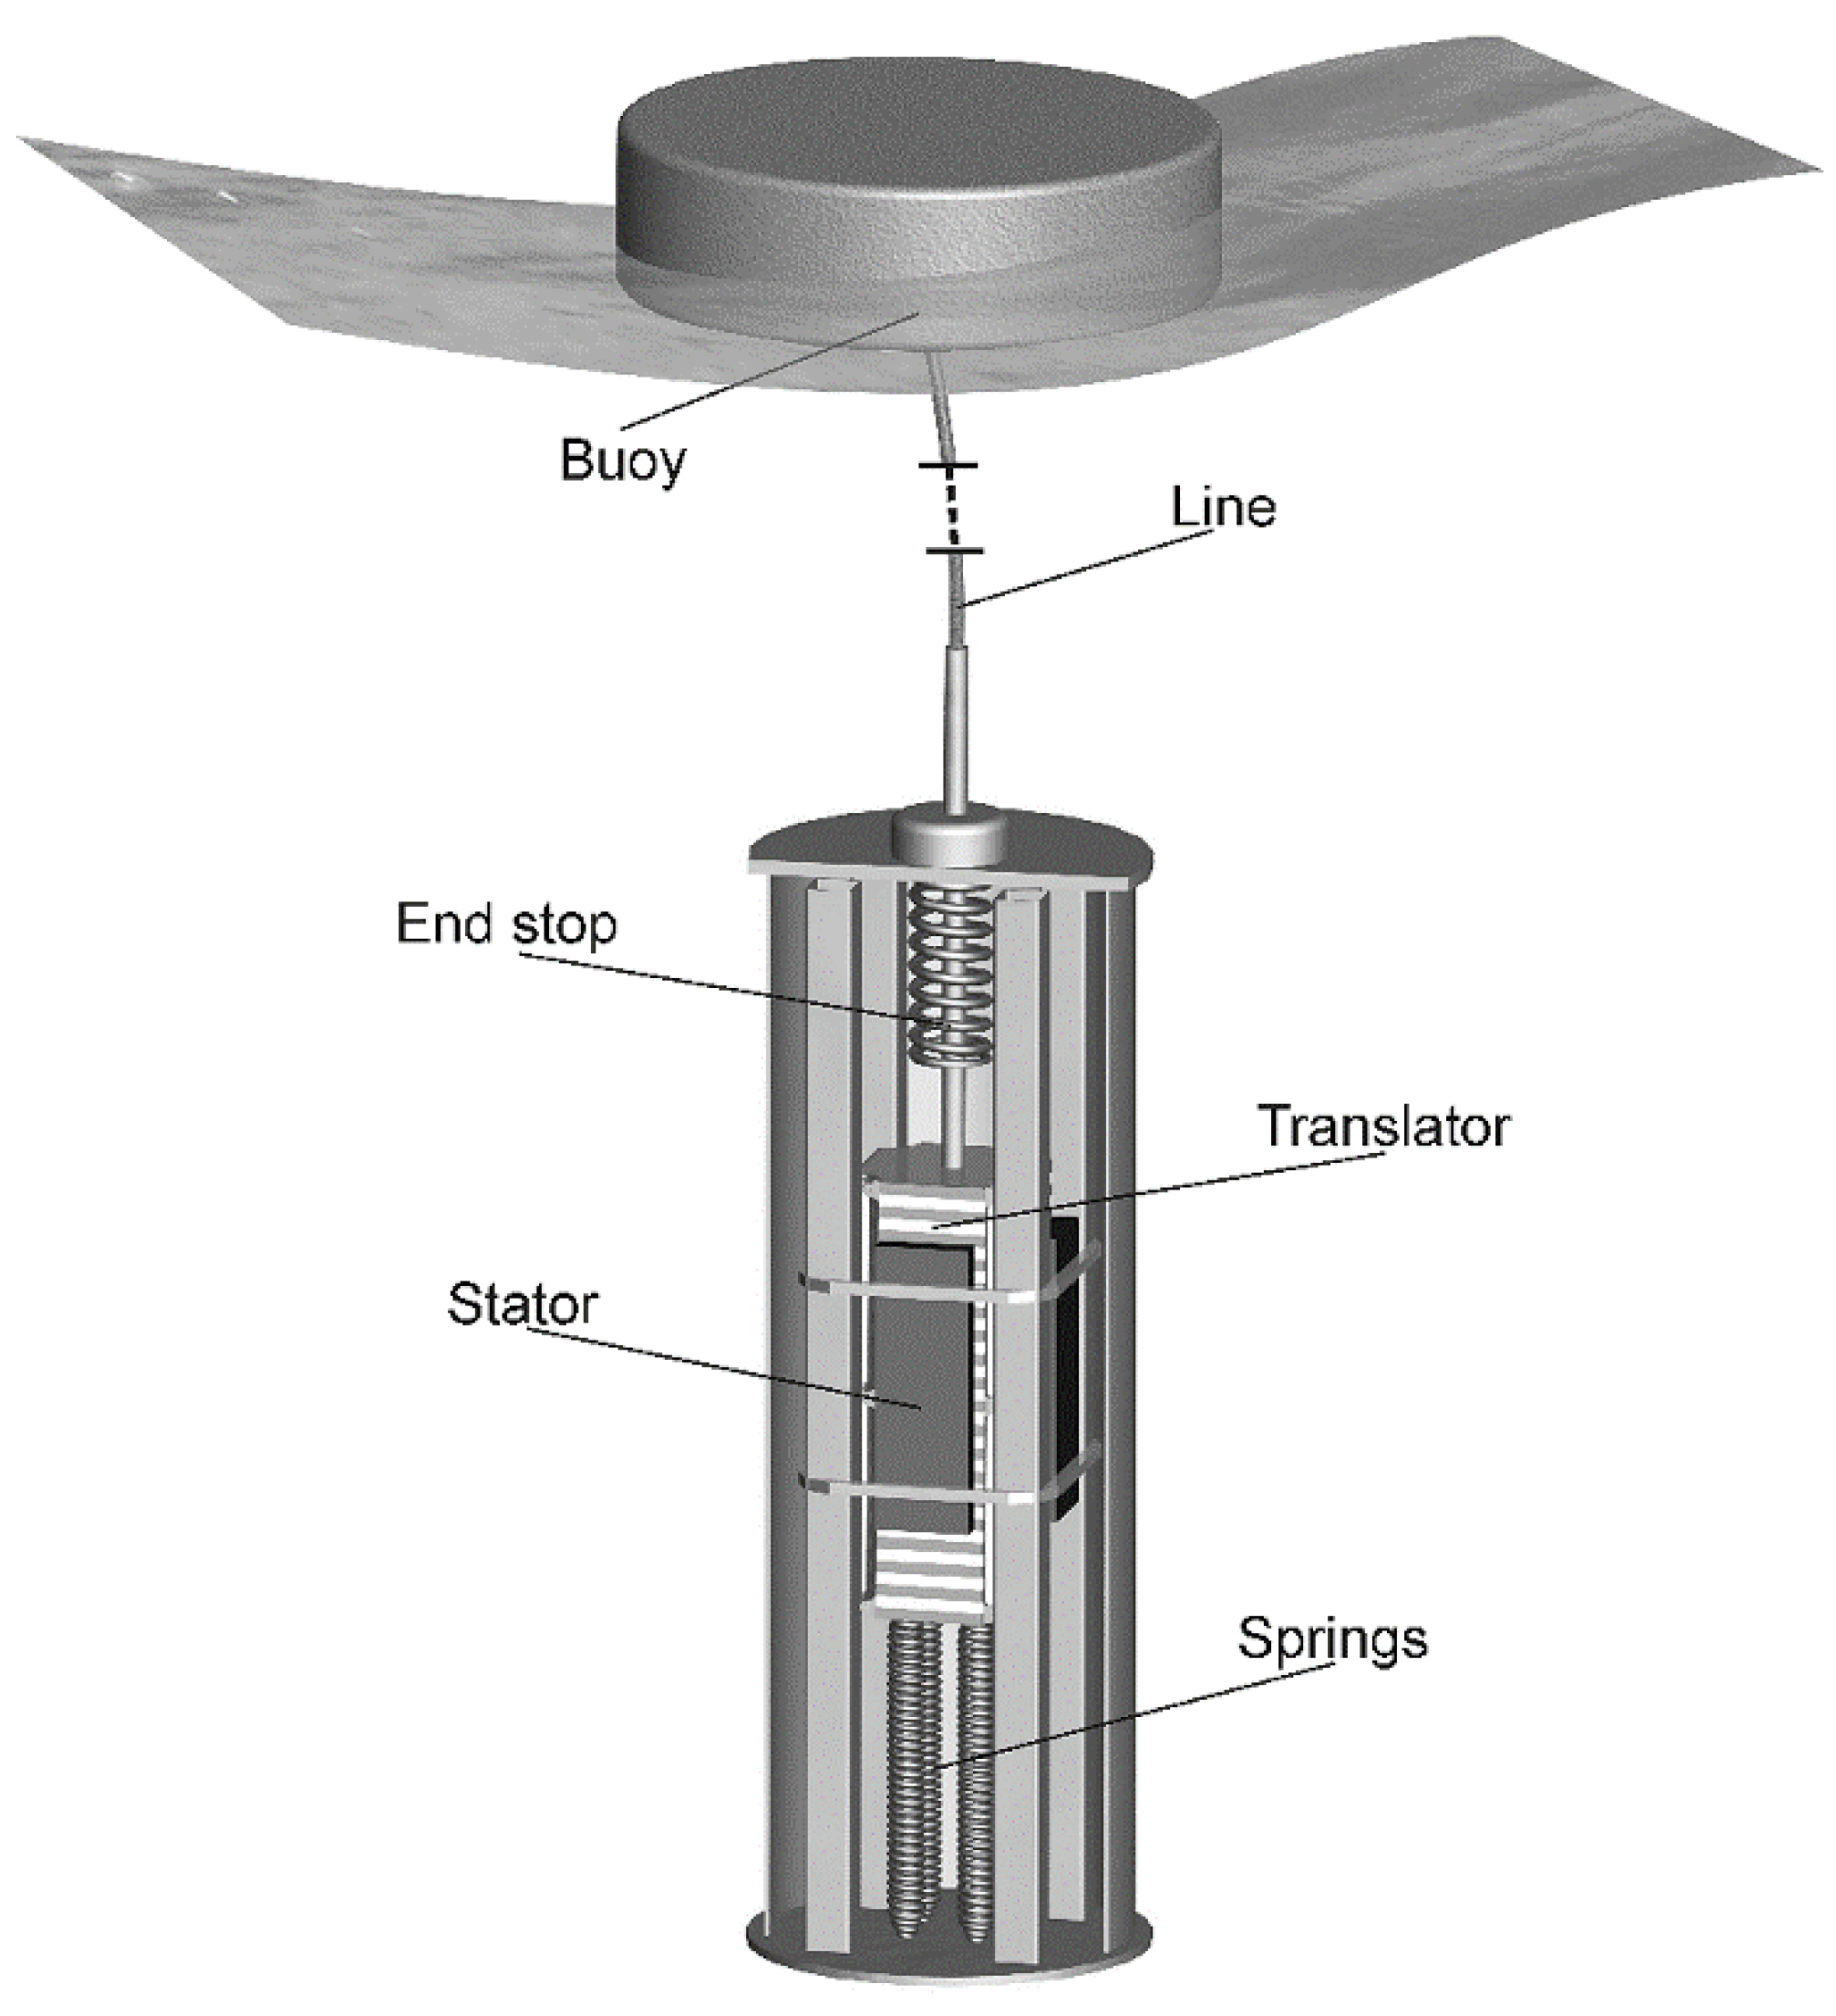
2.2. WEC Model
2.3. Modelling of Power Absorption under Constraints
2.4. Numerical Solution and Benchmark
3. Results and Discussion
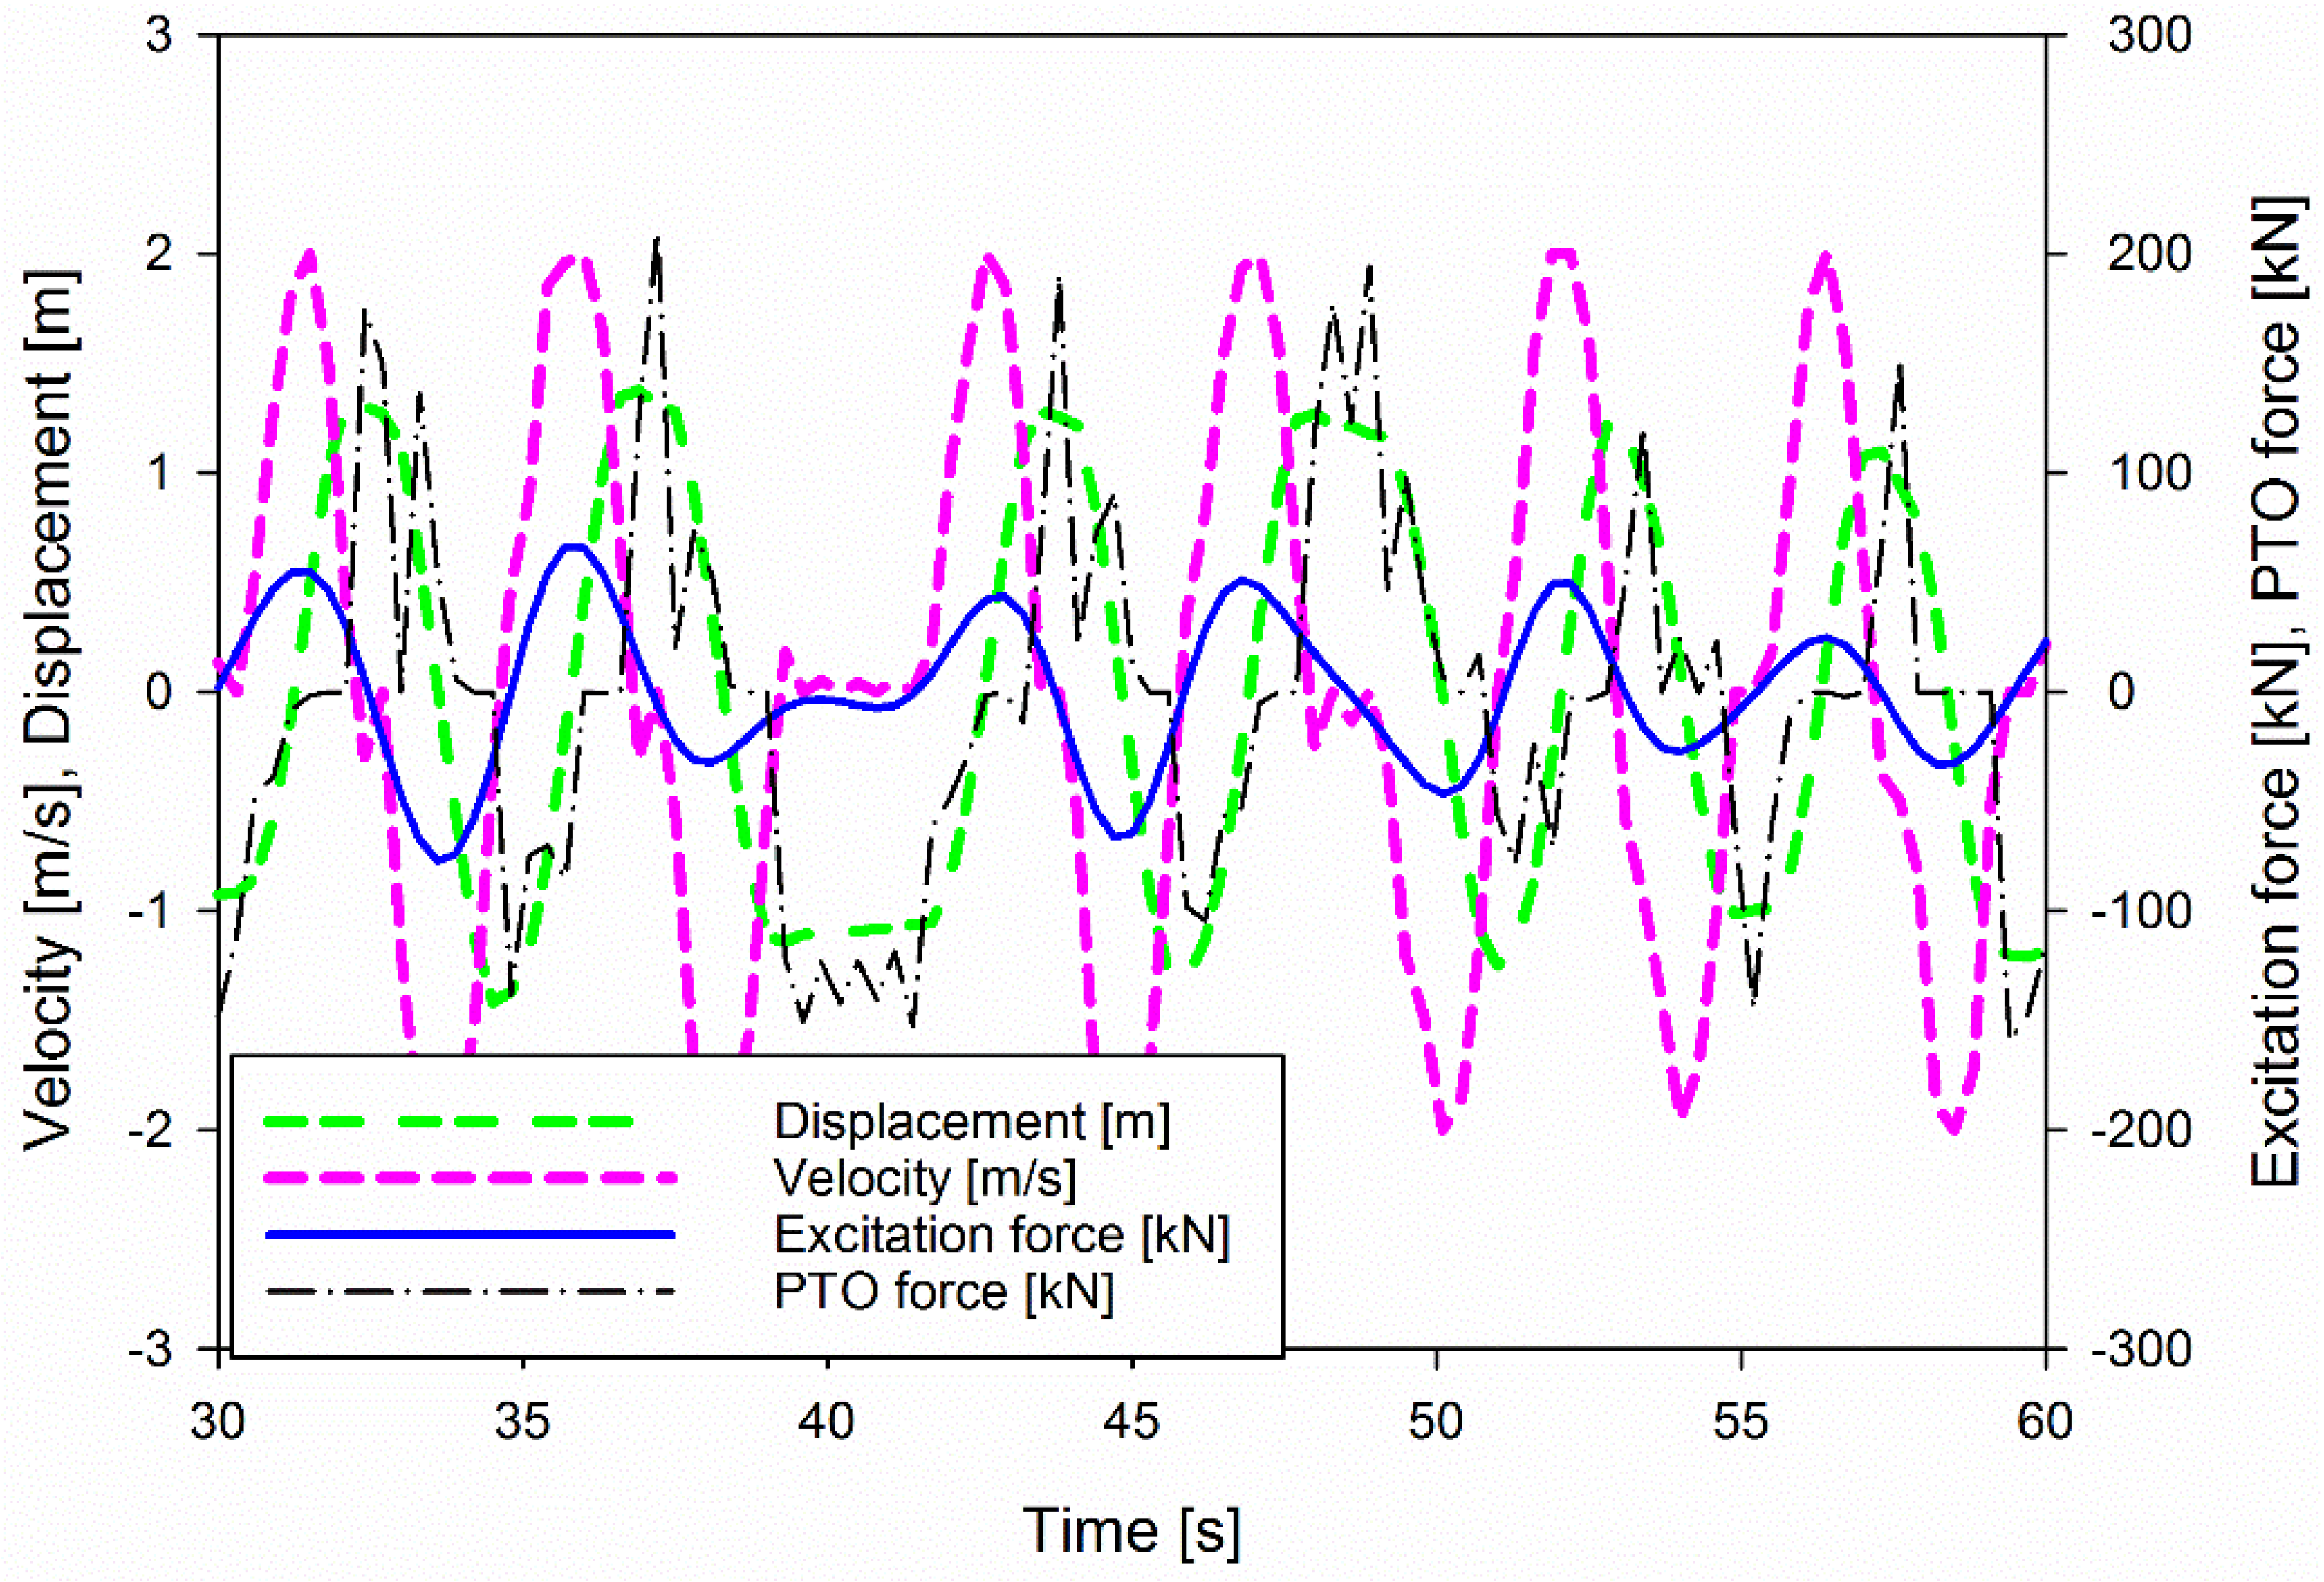
3.1. Performance of the WEC in One Sea State

| Items | Value |
|---|---|
| Buoy radius | 2.0 m |
| Buoy draft | 1.5 m |
| Free stroke | 1.5 m |
| Buoy mass | 5302.0 kg |
| Translator mass | 14.0 ton |
| Length of stator | 2.0 m |
| Water depth | 25.0 m |


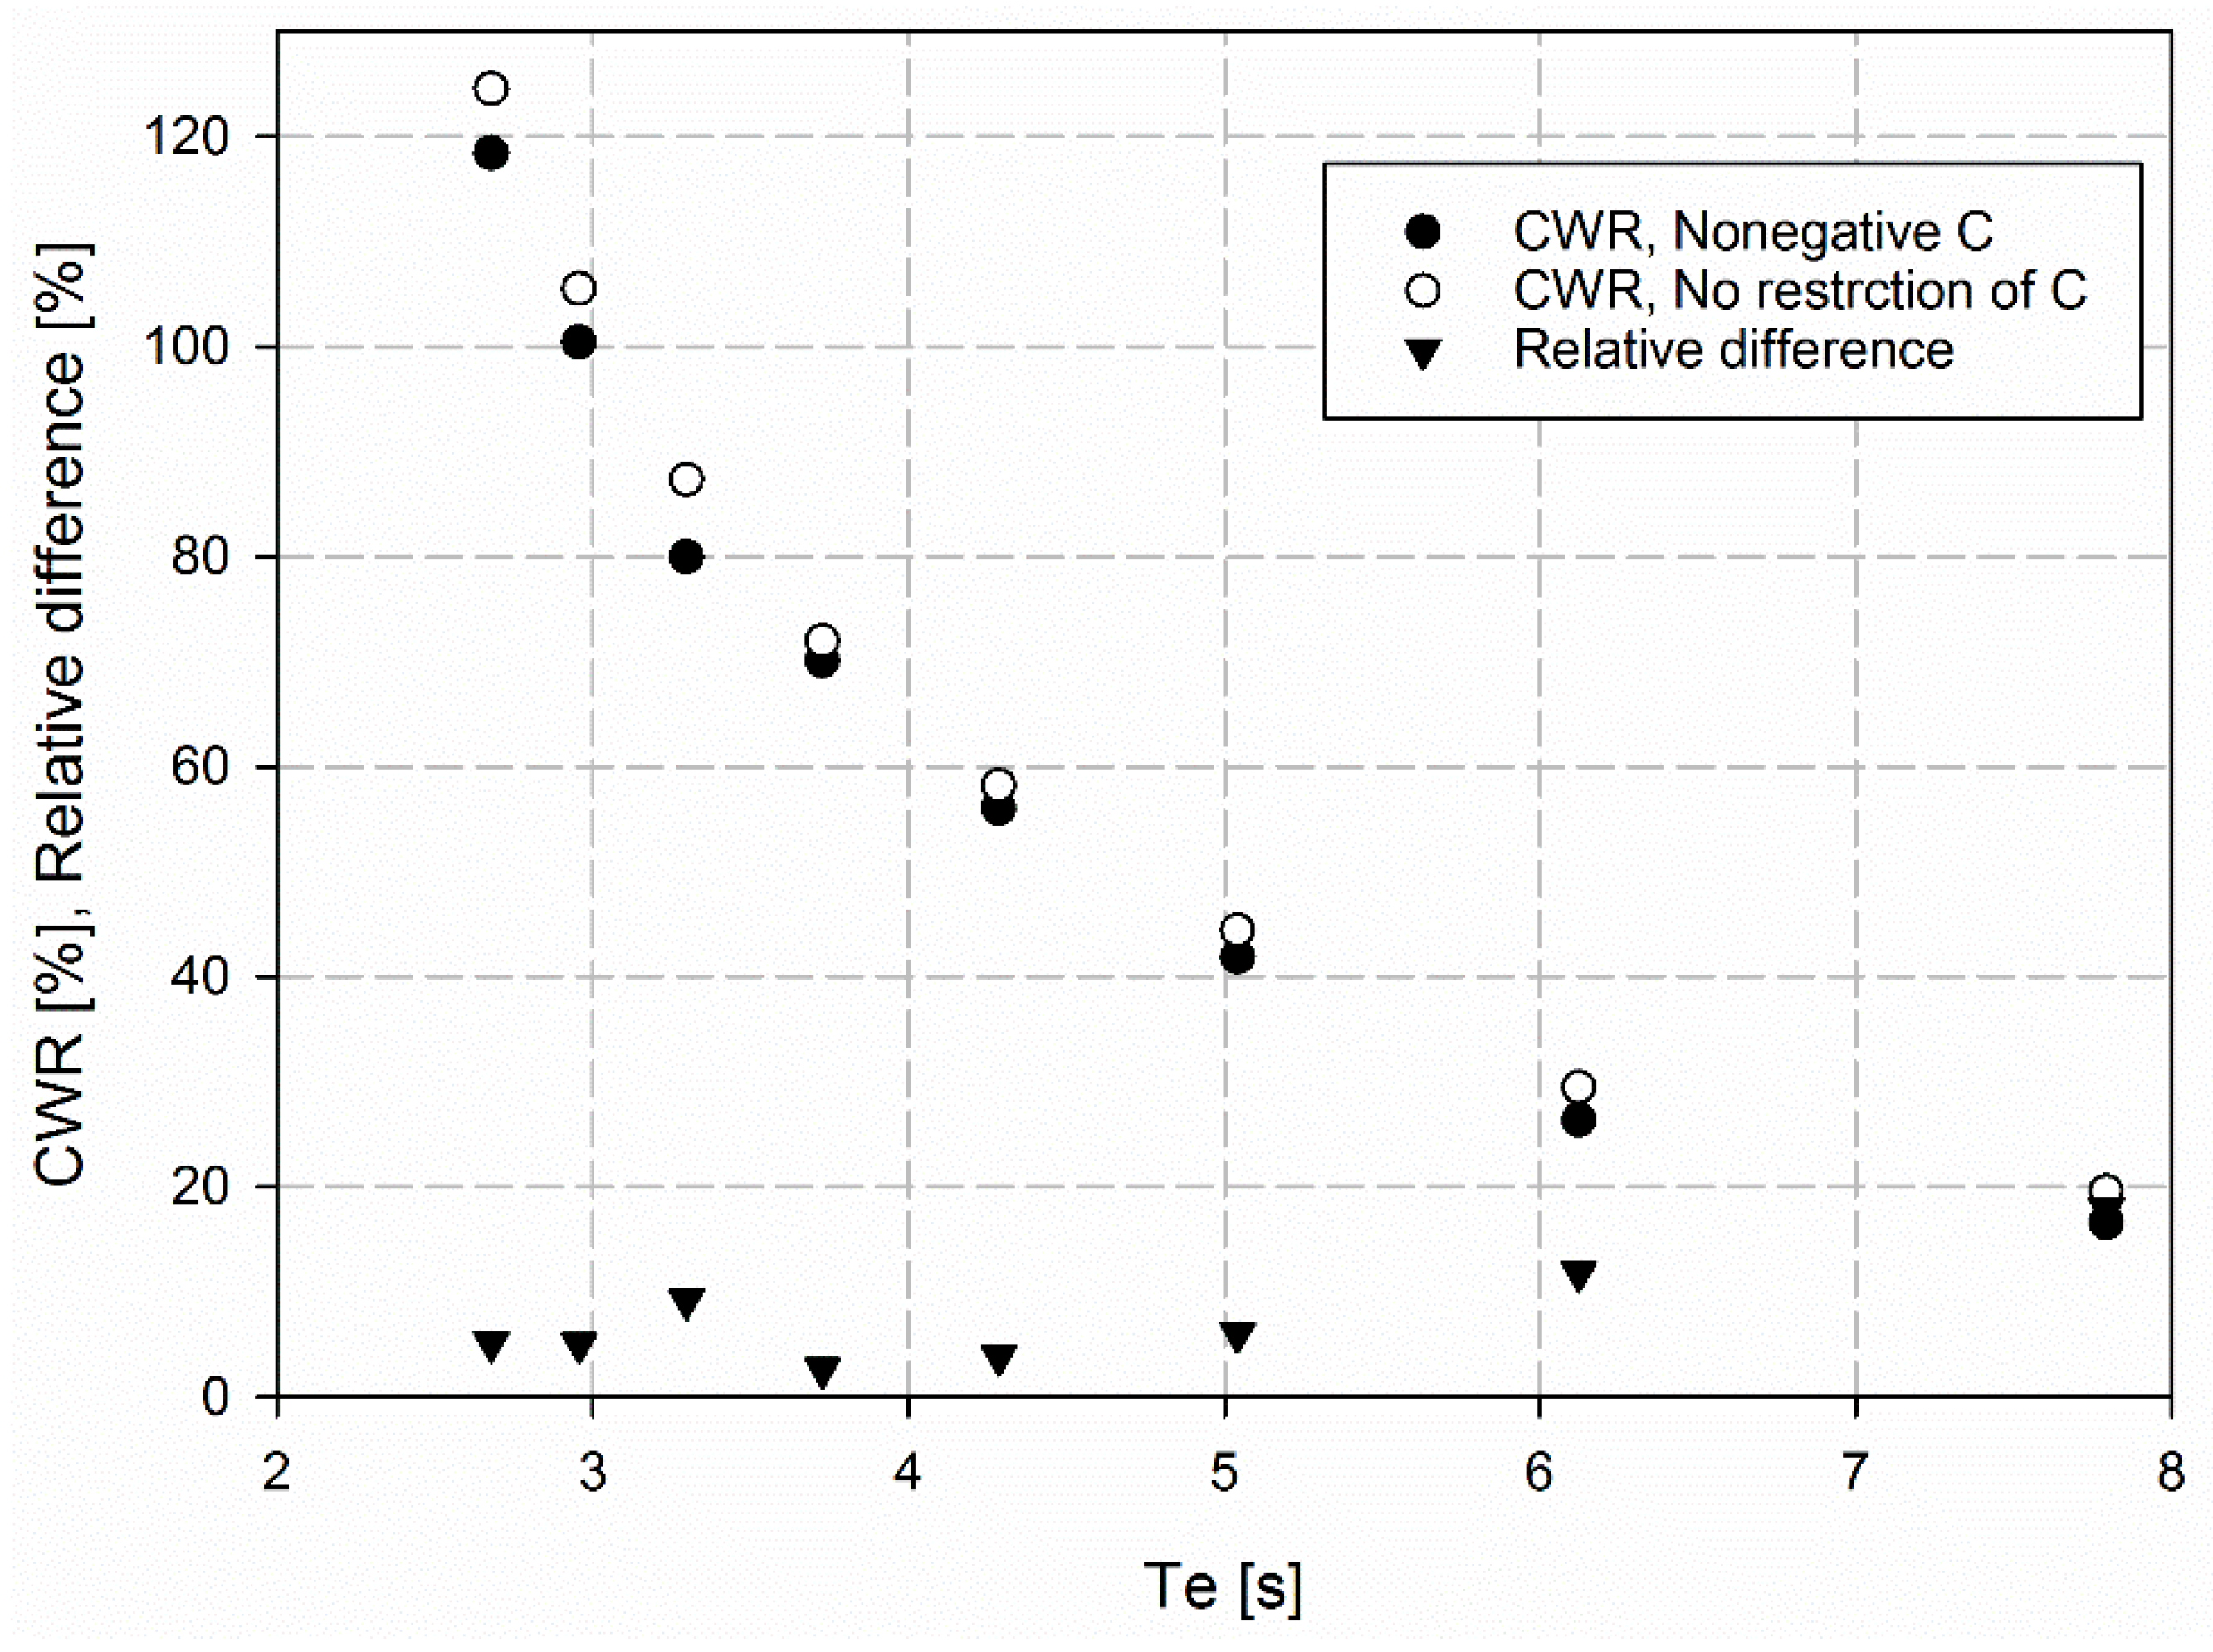
3.2. Influence of the Sign of Damping Coefficient

| Item | Restricting the Sign of C to Nonnegative | No Restriction on the Sign of C |
|---|---|---|
| Mean power [W] | 29700.0 | 32800.0 |
| Peak power [W] | 325400.0 | 702200.0 |
| Peak/Mean | 11.0 | 21.0 |

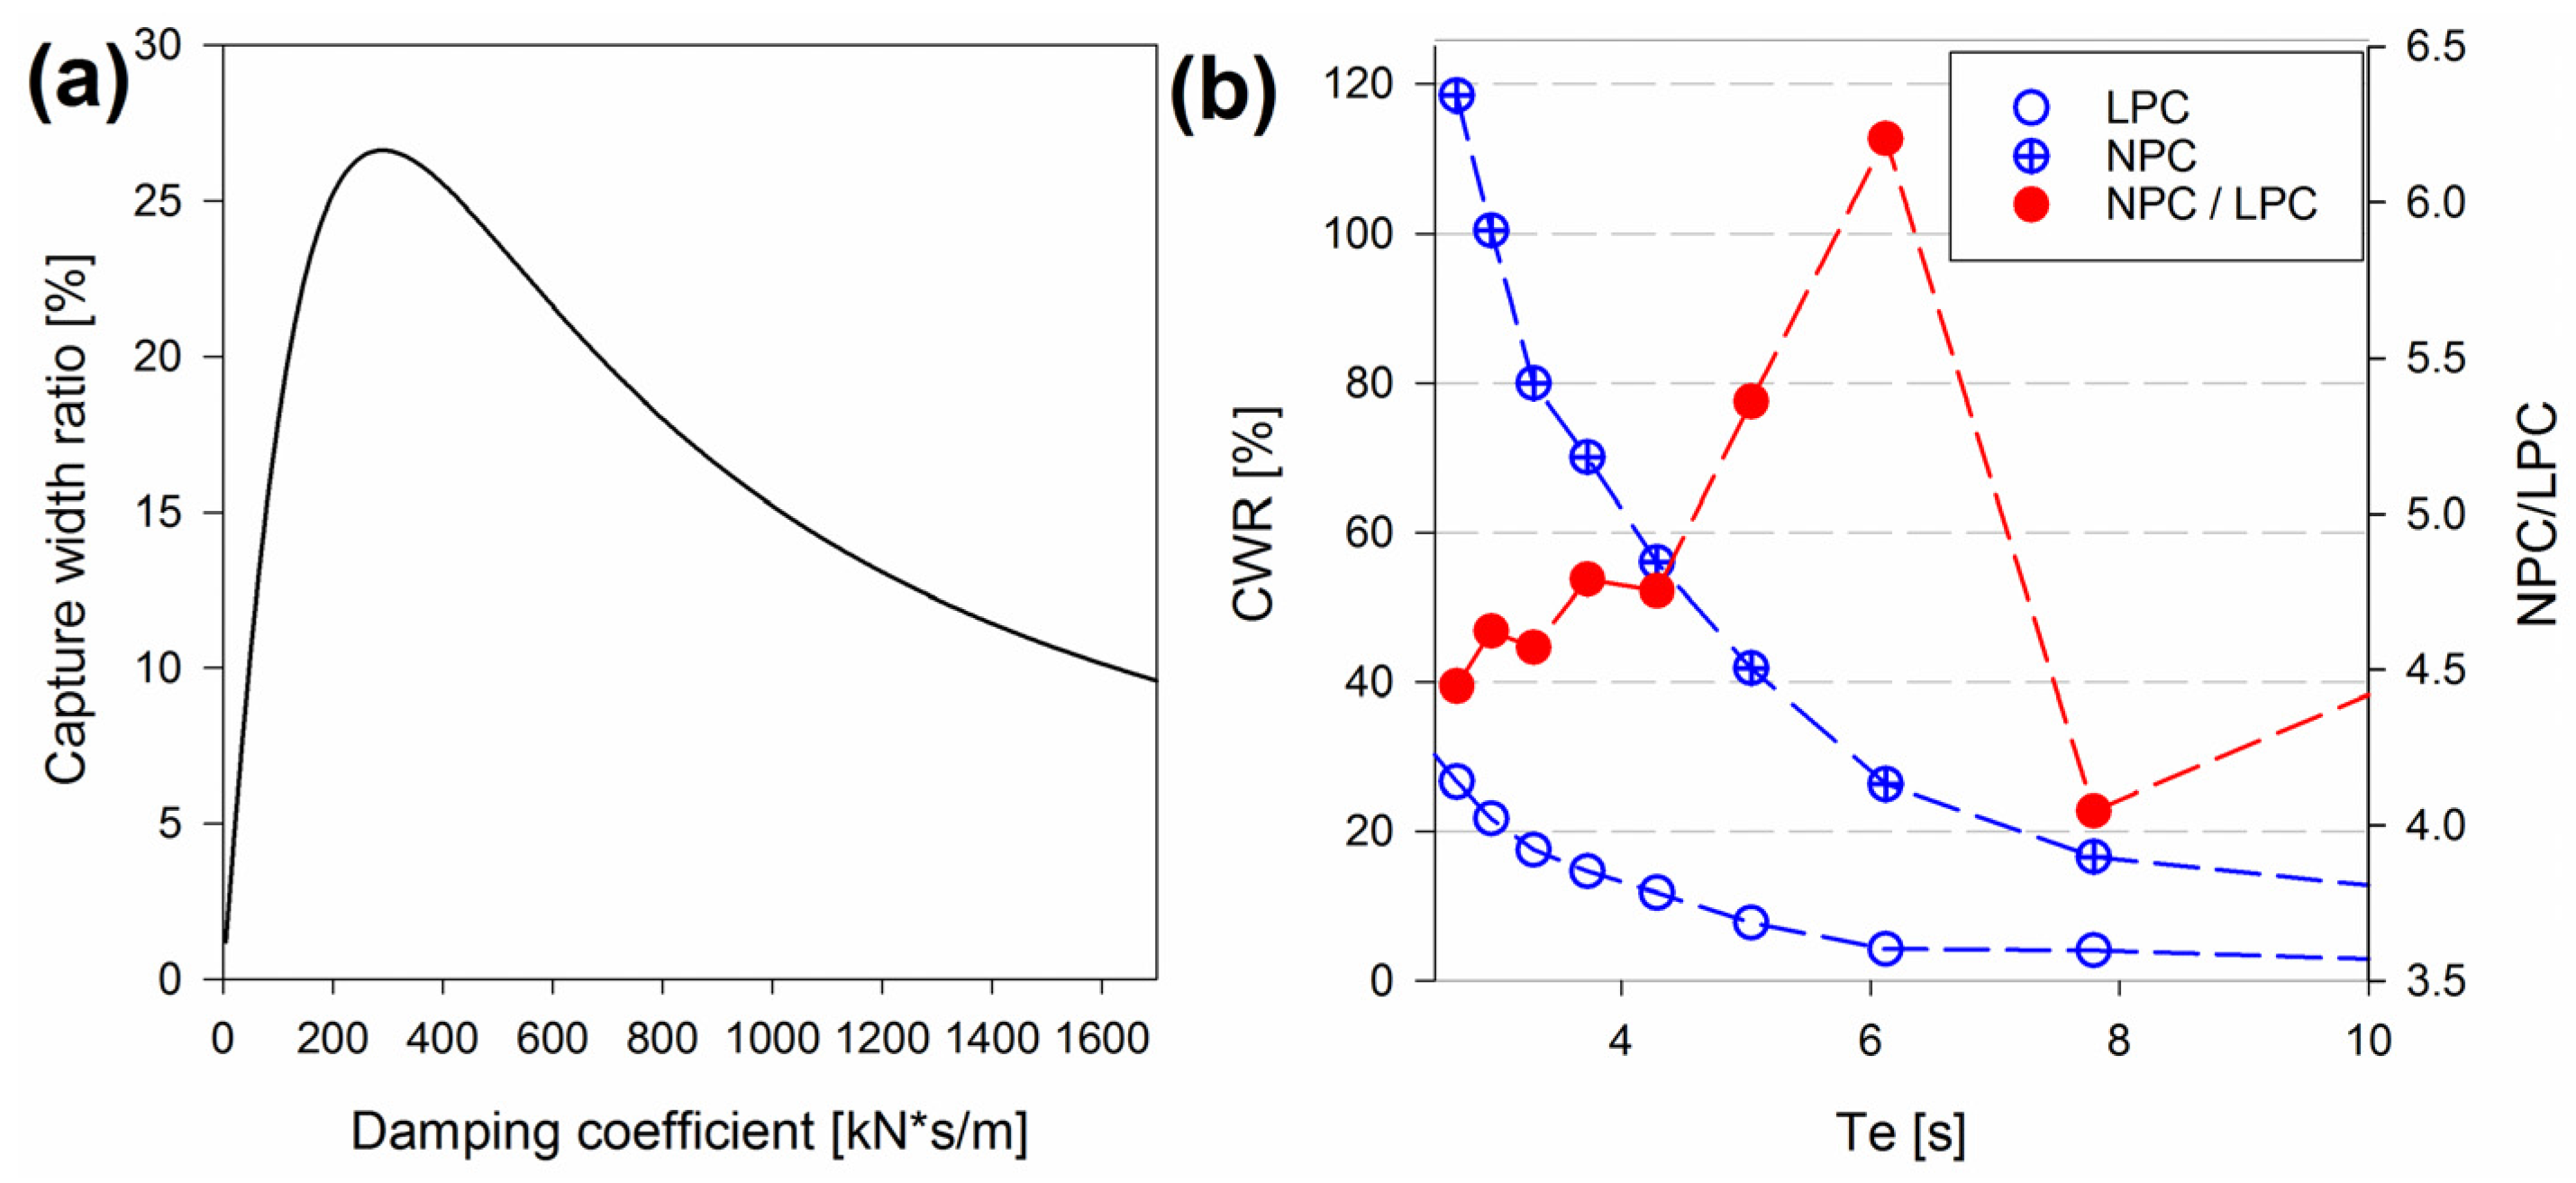
3.3. Influence of the Constraints
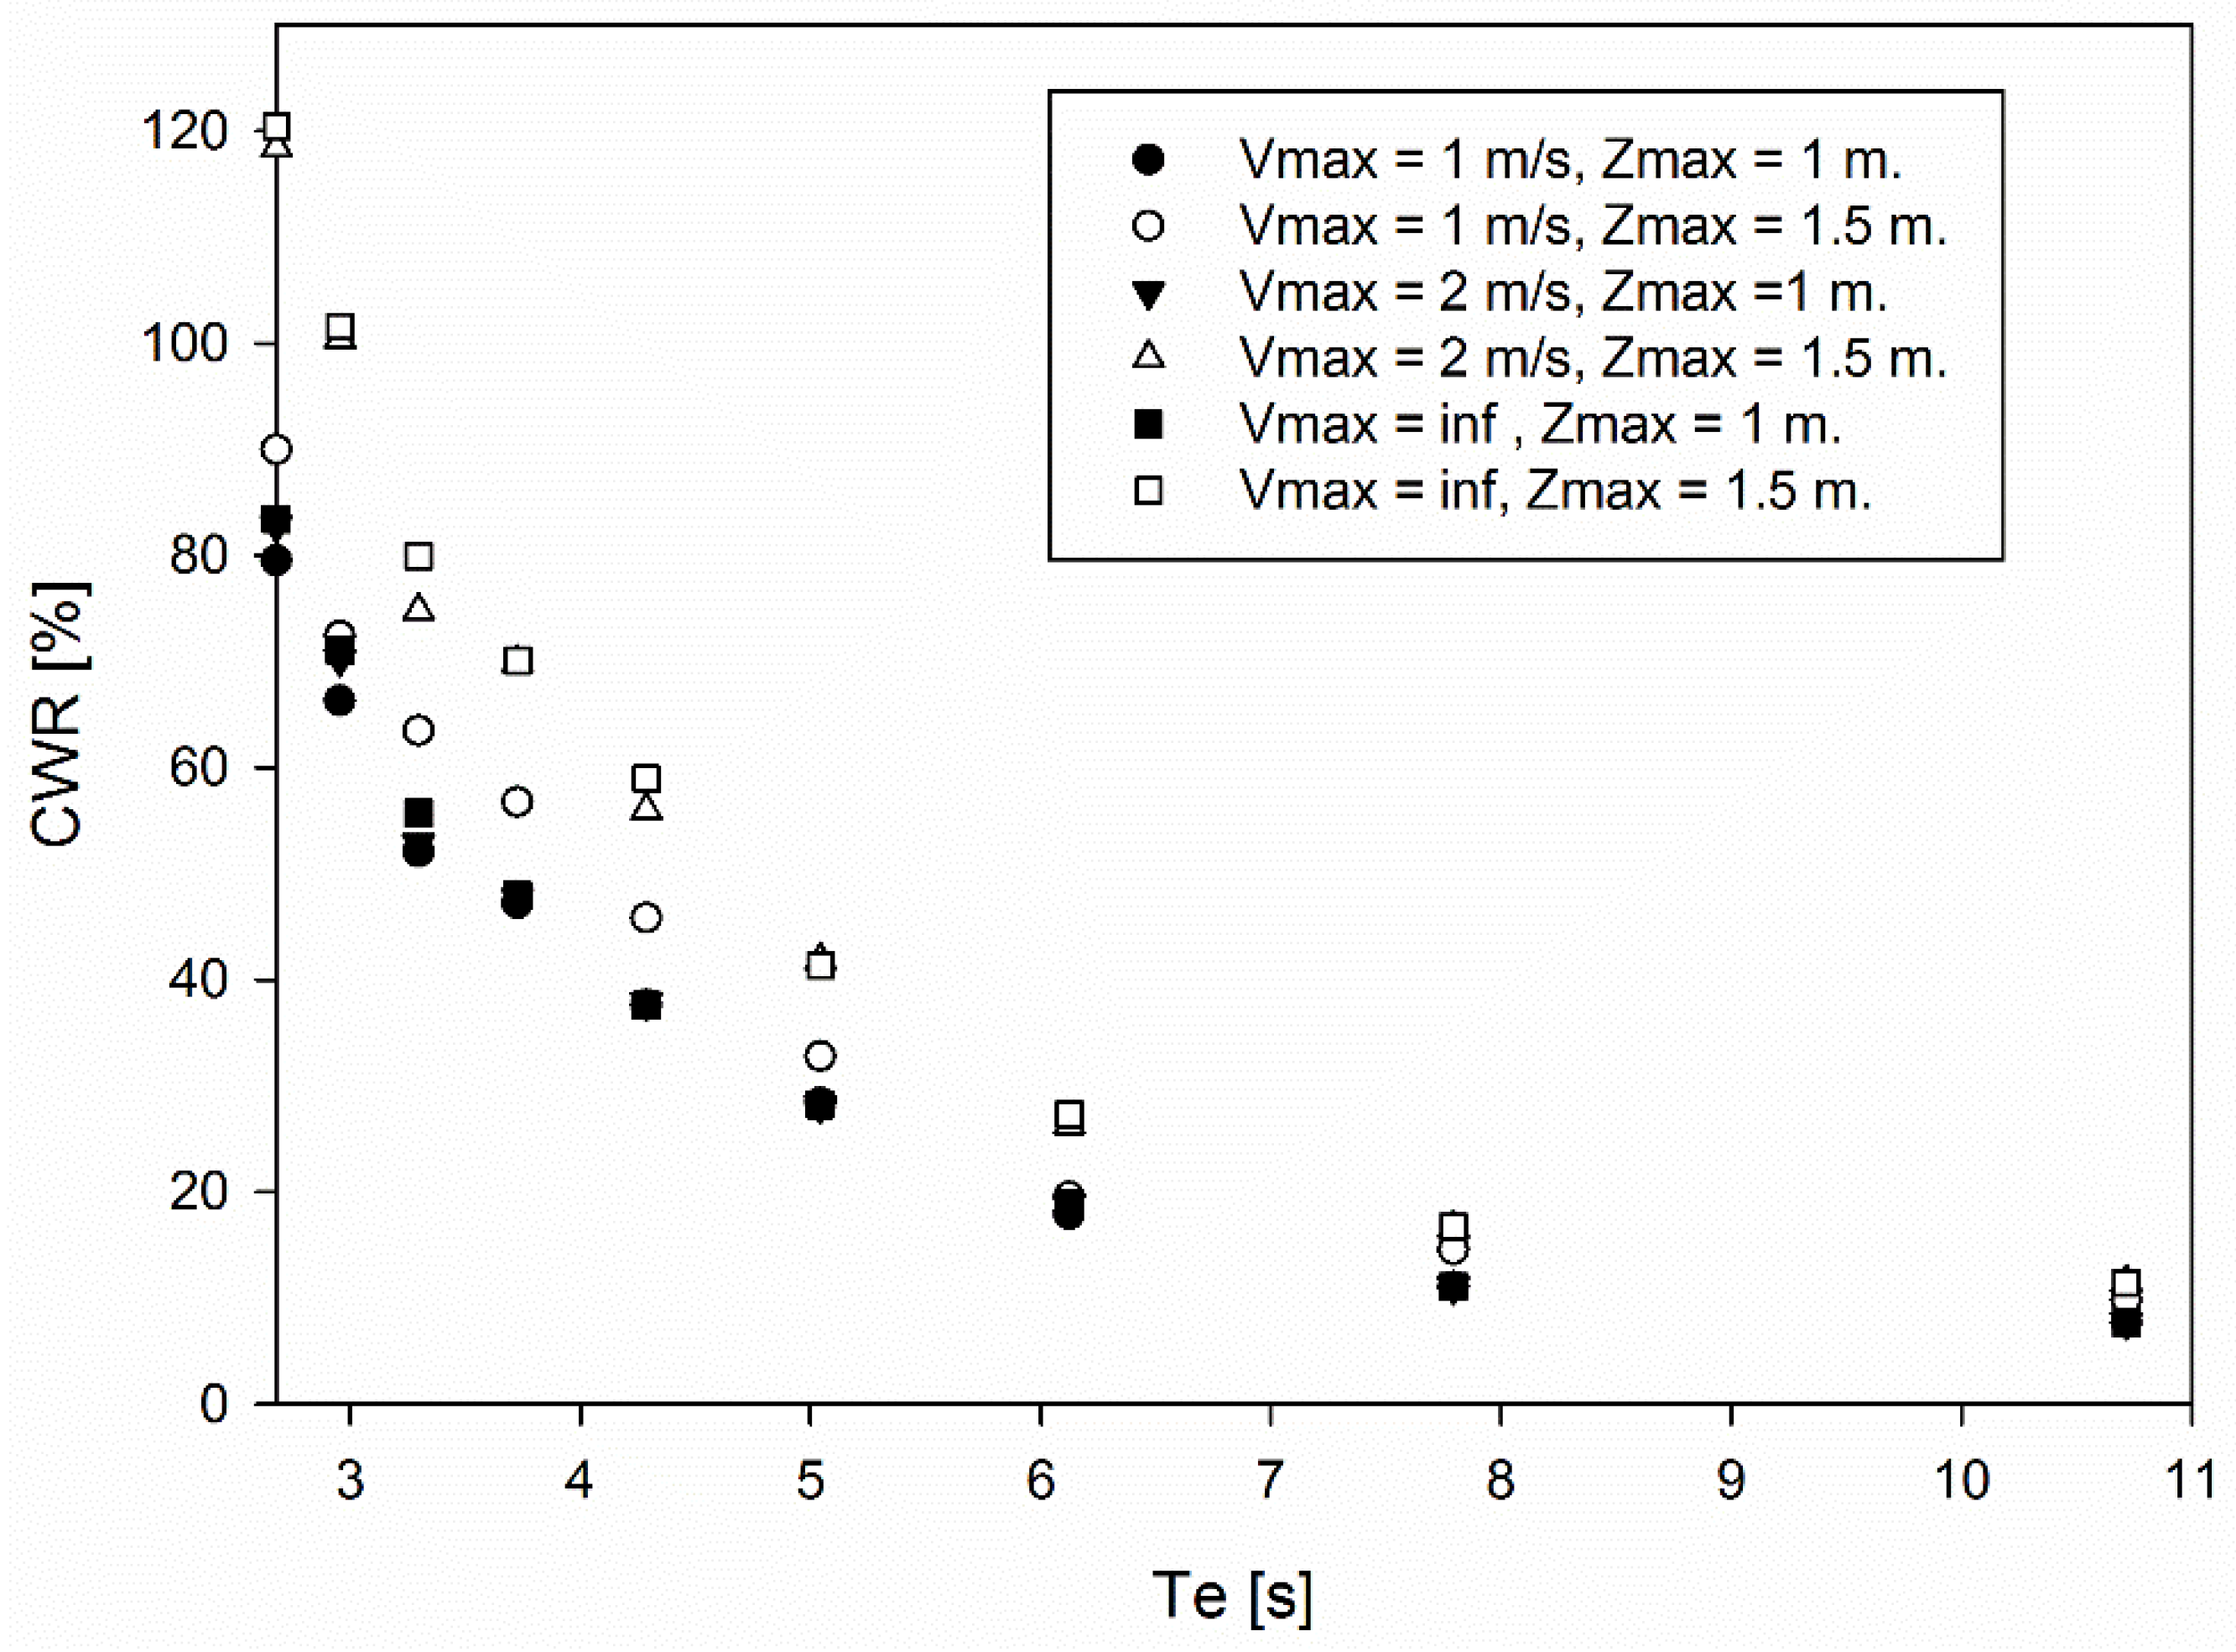
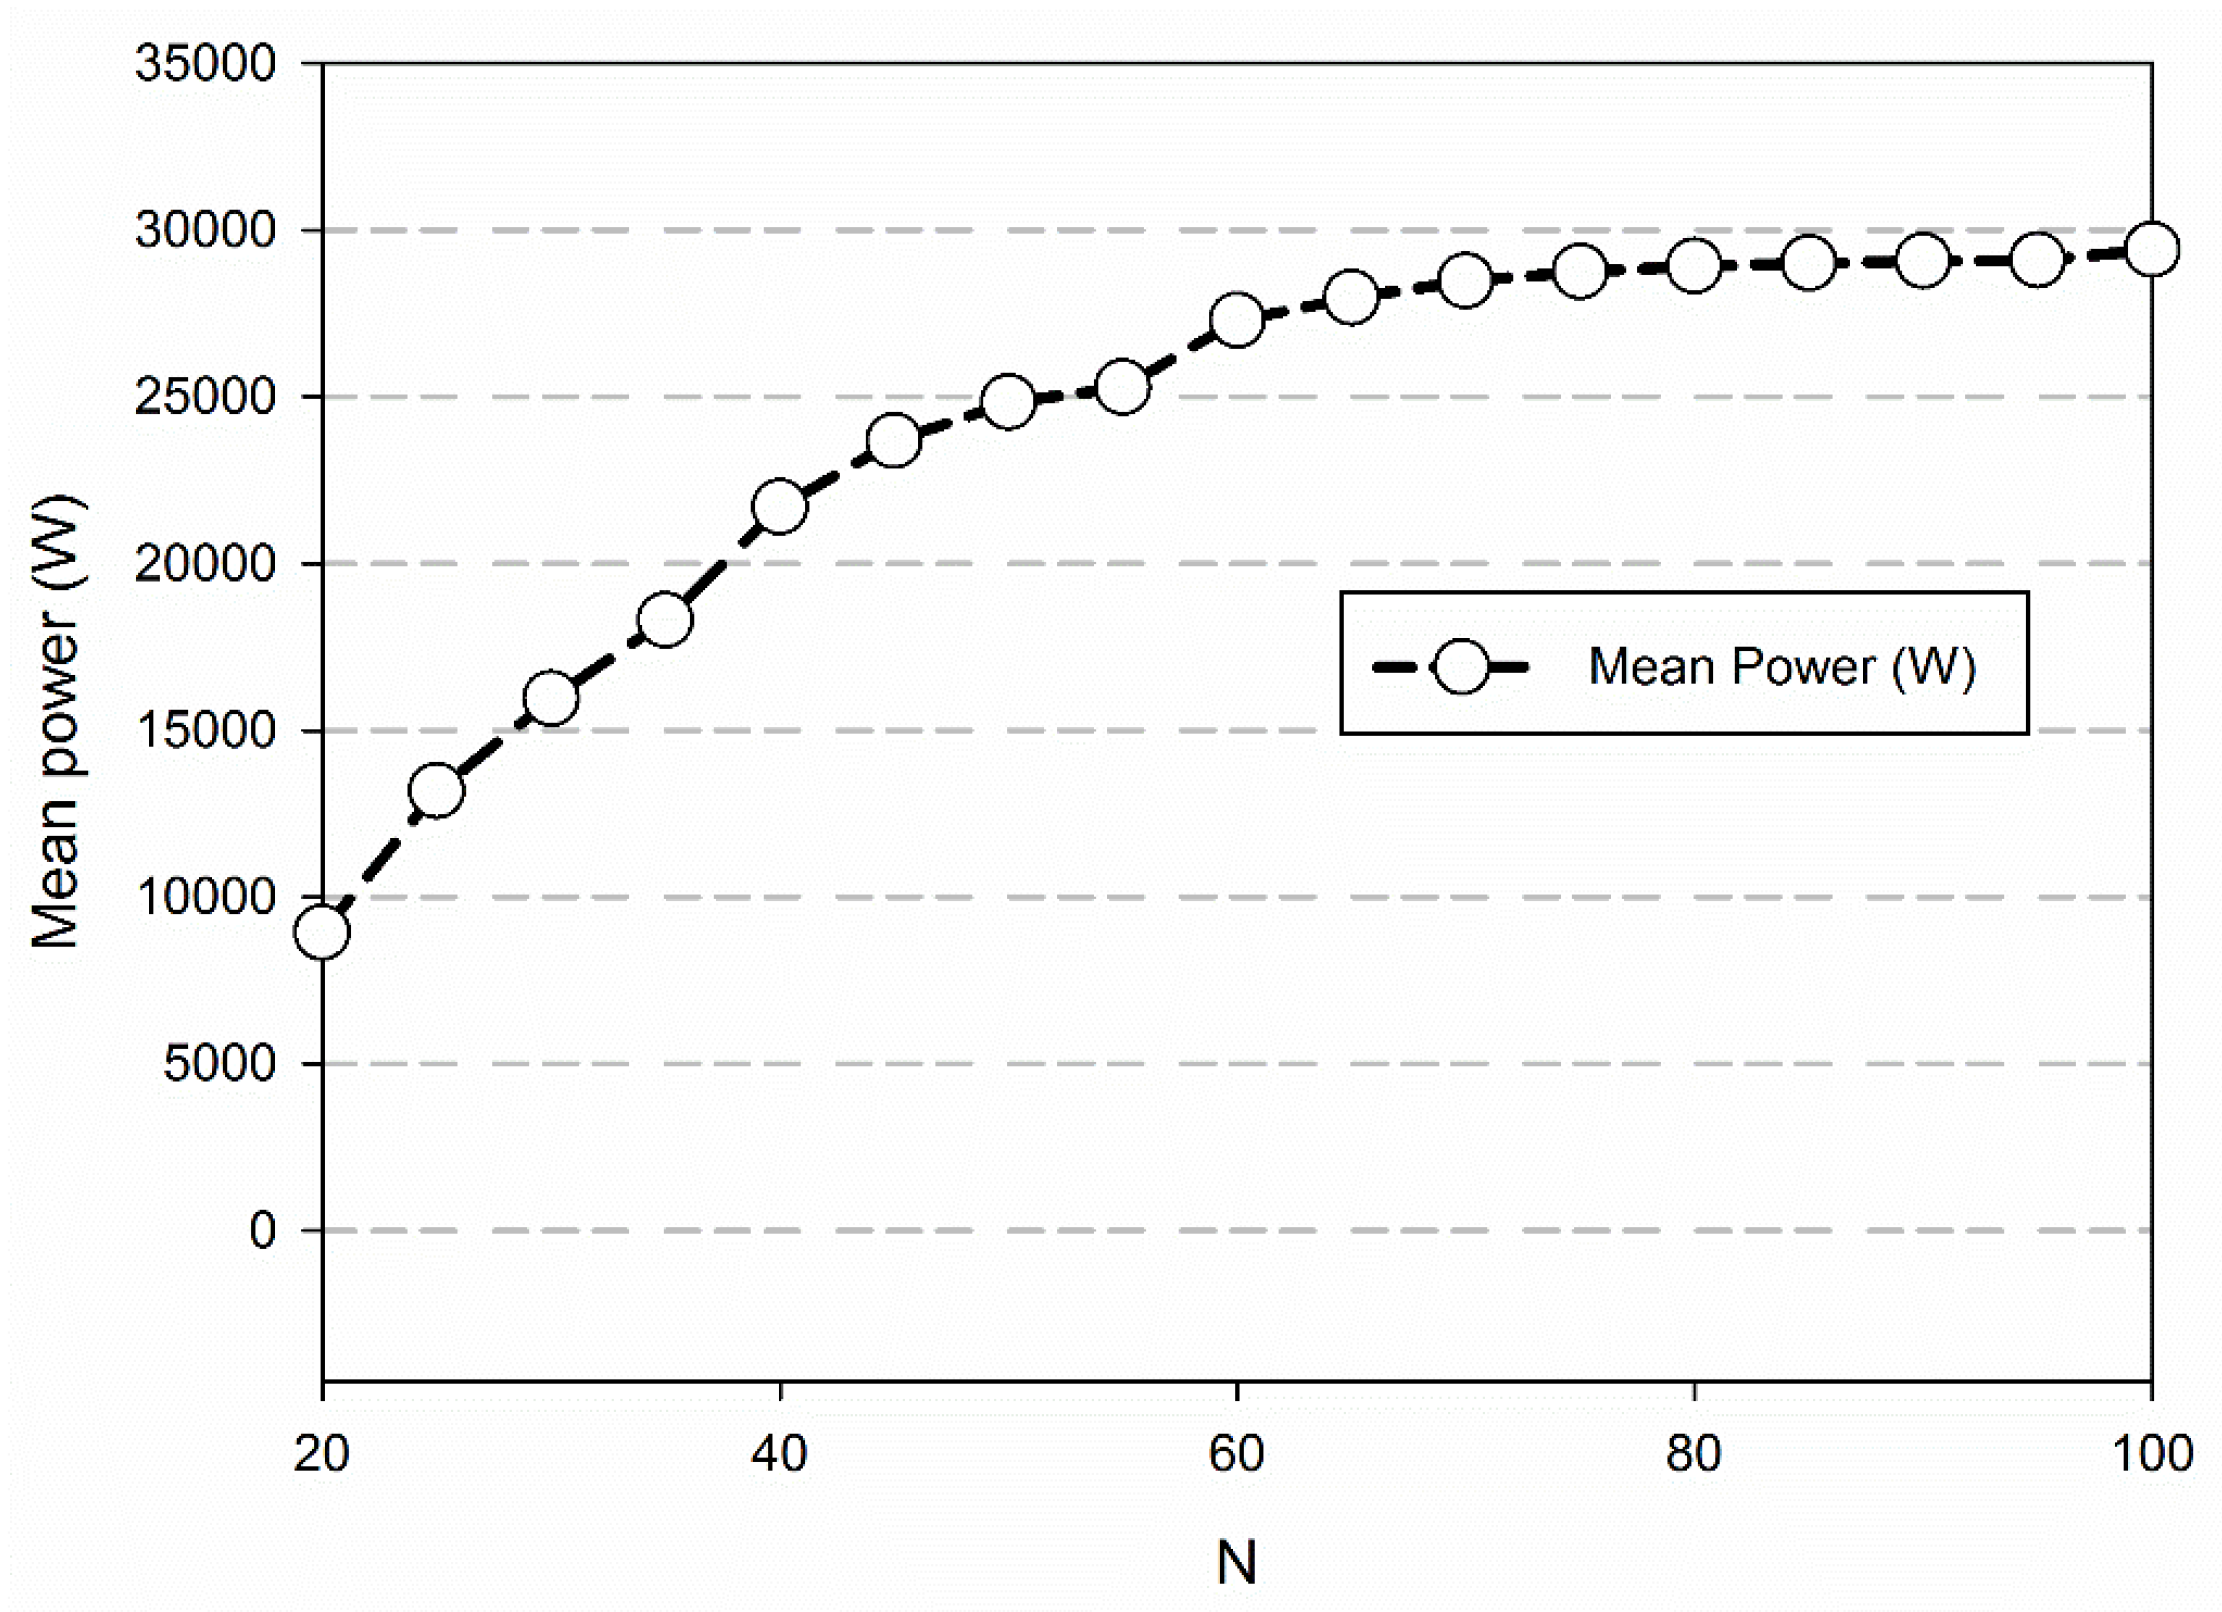
3.4. Performance of the NPC under More Sea States

4. Conclusions
Acknowledgments
Author Contributions
Conflicts of Interest
References
- Drew, B.; Plummer, A.R.; Sahinkaya, M.N. A review of wave energy converter technology. Proc. Inst. Mech. Eng. Part. J. Power Energy 2009, 223, 887–902. [Google Scholar] [CrossRef]
- Falnes, J. A review of wave-energy extraction. Mar. Struct. 2007, 20, 185–201. [Google Scholar] [CrossRef]
- Falcão, A.F. Wave energy utilization: A review of the technologies. Renew. Sustain. Energy Rev. 2010, 14, 899–918. [Google Scholar] [CrossRef]
- Budal, K.; Falnes, J. A resonant point absorber of ocean-wave power. Nature 1975, 256, 478–479. [Google Scholar]
- Clément, A.; McCullen, P.; Falcão, A.; Fiorentino, A.; Gardner, F.; Hammarlund, K.; Lemonis, G.; Lewis, T.; Nielsen, K.; Petroncini, S.; et al. Wave energy in Europe: Current status and perspectives. Renew. Sustain. Energy Rev. 2002, 6, 405–431. [Google Scholar] [CrossRef]
- Leijon, M.; Danielsson, O.; Eriksson, M.; Thorburn, K.; Bernhoff, H.; Isberg, J.; Sundberg, J.; Ivanova, I.; Sjöstedt, E.; Ågren, O.; et al. An electrical approach to wave energy conversion. Renew. Energy 2006, 31, 1309–1319. [Google Scholar] [CrossRef]
- Thorburn, K.; Bernhoff, H.; Leijon, M. Wave energy transmission system concepts for linear generator arrays. Ocean. Eng. 2004, 31, 1339–1349. [Google Scholar] [CrossRef]
- Leijon, M.; Bernhoff, H.; Agren, O.; Isberg, J.; Sundberg, J.; Berg, M.; Karlsson, K.E.; Wolfbrandt, A. Multiphysics simulation of wave energy to electric energy conversion by permanent magnet linear generator. IEEE Trans. Energy Convers. 2005, 20, 219–224. [Google Scholar] [CrossRef]
- Eriksson, M.; Waters, R.; Svensson, O.; Isberg, J.; Leijon, M. Wave power absorption: Experiments in open sea and simulation. J. Appl. Phys. 2007, 102. [Google Scholar] [CrossRef]
- Waters, R.; Stålberg, M.; Danielsson, O.; Svensson, O.; Gustafsson, S.; Strömstedt, E.; Eriksson, M.; Sundberg, J.; Leijon, M. Experimental results from sea trials of an offshore wave energy system. Appl. Phys. Lett. 2007, 90. [Google Scholar] [CrossRef]
- Lejerskog, E.; Boström, C.; Hai, L.; Waters, R.; Leijon, M. Experimental results on power absorption from a wave energy converter at the Lysekil wave energy research site. Renew. Energy 2015, 77, 9–14. [Google Scholar] [CrossRef]
- Stålberg, M.; Waters, R.; Danielsson, O.; Leijon, M. Influence of Generator Damping on Peak Power and Variance of Power for a Direct Drive Wave Energy Converter. J. Offshore Mech. Arct. Eng. 2008, 130. [Google Scholar] [CrossRef]
- Engström, J.; Kurupath, V.; Isberg, J.; Leijon, M. A resonant two body system for a point absorbing wave energy converter with direct-driven linear generator. J. Appl. Phys. 2011, 110. [Google Scholar] [CrossRef]
- Kurupath, V.; Ekström, R.; Leijon, M. Optimal Constant DC Link Voltage Operation of a Wave Energy Converter. Energies 2013, 6, 1993–2006. [Google Scholar] [CrossRef]
- Ekström, R.; Ekergård, B.; Leijon, M. Electrical damping of linear generators for wave energy converters—A review. Renew. Sustain. Energy Rev. 2015, 42, 116–128. [Google Scholar] [CrossRef]
- Eidsmoen, H. Optimum Control of a Floating Wave-Energy Converter with Restricted Amplitude. J. Offshore Mech. Arct. Eng. 1996, 118, 96–102. [Google Scholar] [CrossRef]
- Babarit, A.; Duclos, G.; Clément, A.H. Comparison of latching control strategies for a heaving wave energy device in random sea. Appl. Ocean. Res. 2004, 26, 227–238. [Google Scholar] [CrossRef]
- Babarit, A.; Clément, A.H. Optimal latching control of a wave energy device in regular and irregular waves. Appl. Ocean. Res. 2006, 28, 77–91. [Google Scholar] [CrossRef]
- Babarit, A.; Guglielmi, M.; Clément, A.H. Declutching control of a wave energy converter. Ocean. Eng. 2009, 36, 1015–1024. [Google Scholar] [CrossRef]
- Sheng, W.; Alcorn, R.; Lewis, A. On improving wave energy conversion, part II: Development of latching control technologies. Renew. Energy 2015, 75, 935–944. [Google Scholar] [CrossRef]
- Oskamp, J.A.; Özkan-Haller, H.T. Power calculations for a passively tuned point absorber wave energy converter on the Oregon coast. Renew. Energy 2012, 45, 72–77. [Google Scholar] [CrossRef] [Green Version]
- Jaén, A.D.L.V.; Andrade, D.E.M.; Santana, A.G. Increasing the efficiency of the passive loading strategy for wave energy conversion. J. Renew. Sustain. Energy 2013, 5. [Google Scholar] [CrossRef]
- Abraham, E.; Kerrigan, E.C. Optimal Active Control and Optimization of a Wave Energy Converter. IEEE Trans. Sustain. Energy 2013, 4, 324–332. [Google Scholar] [CrossRef] [Green Version]
- Shek, J.K.H.; Macpherson, D.E.; Mueller, M.A.; Xiang, J. Reaction force control of a linear electrical generator for direct drive wave energy conversion. IET Renew. Power Gener. 2007, 1, 17–24. [Google Scholar] [CrossRef]
- Molinas, M.; Skjervheim, O.; Andreasen, P.; Undeland, T.; Hals, J.; Moan, T.; SØrby, B. Power Electronics as Grid Interface for Actively Controlled Wave Energy Converters. In Proceedings of the International Conference Clean Electric Power 2007 ICCEP 07, Capri, Italy, 21–23 May 2007; pp. 188–195.
- Korde, U. Control System Applications in Wave Energy Conversion. In Proceedings of the OCEANS 2000 MTSIEEE Conference Exhibition, Providence, RI, USA, 11–14 September 2000; Volume 3, pp. 1817–1824.
- Hals, J.; Falnes, J.; Moan, T. A Comparison of Selected Strategies for Adaptive Control of Wave Energy Converters. J. Offshore Mech. Arct. Eng. 2011, 133. [Google Scholar] [CrossRef]
- Bacelli, G.; Ringwood, J.; Gilloteaux, J.C. A Control System for a Self-Reacting Point Absorber Wave Energy Converter Subject to Constraints. In Proceedings of the 18th IFAC World Congress, Milano, Italy, 28 August–2 September 2011; pp. 11387–11392.
- Bacelli, G.; Ringwood, J. Constrained control of arrays of wave energy devices. Int. J. Mar. Energy 2013, 3–4, e53–e69. [Google Scholar] [CrossRef]
- Ekström, R.; Kurupath, V.; Boström, C.; Waters, R.; Leijon, M. Evaluating Constant DC-Link Operation of Wave Energy Converter. J. Dyn. Syst. Meas. Control. 2013, 136. [Google Scholar] [CrossRef]
- Wang, L.; Engström, J.; Göteman, M.; Isberg, J. Constrained optimal control of a point absorber wave energy converter with linear generator. J. Renew. Sustain. Energy. 2015. submitted. [Google Scholar]
- Cargo, C.J.; Hillis, A.J.; Plummer, A.R. Optimisation and control of a hydraulic power take-off unit for a wave energy converter in irregular waves. Proc. Inst. Mech. Eng. Part J. Power Energy 2014, 228, 462–479. [Google Scholar] [CrossRef] [Green Version]
- Pierson, W.J.; Moskowitz, L. A proposed spectral form for fully developed wind seas based on the similarity theory of S.A. Kitaigorodskii. J. Geophys. Res. 1964, 69, 5181–5190. [Google Scholar] [CrossRef]
- WAMIT. WAMIT User Manual version 7.0 n.d; WAMIT: Boston, MA, USA, 2013. [Google Scholar]
- Engström, J.; Eriksson, M.; Isberg, J.; Leijon, M. Wave energy converter with enhanced amplitude response at frequencies coinciding with Swedish west coast sea states by use of a supplementary submerged body. J. Appl. Phys. 2009, 106. [Google Scholar] [CrossRef]
- Kara, F. Time domain prediction of power absorption from ocean waves with latching control. Renew. Energy 2010, 35, 423–434. [Google Scholar] [CrossRef]
© 2015 by the authors; licensee MDPI, Basel, Switzerland. This article is an open access article distributed under the terms and conditions of the Creative Commons Attribution license (http://creativecommons.org/licenses/by/4.0/).
Share and Cite
Wang, L.; Isberg, J. Nonlinear Passive Control of a Wave Energy Converter Subject to Constraints in Irregular Waves. Energies 2015, 8, 6528-6542. https://doi.org/10.3390/en8076528
Wang L, Isberg J. Nonlinear Passive Control of a Wave Energy Converter Subject to Constraints in Irregular Waves. Energies. 2015; 8(7):6528-6542. https://doi.org/10.3390/en8076528
Chicago/Turabian StyleWang, Liguo, and Jan Isberg. 2015. "Nonlinear Passive Control of a Wave Energy Converter Subject to Constraints in Irregular Waves" Energies 8, no. 7: 6528-6542. https://doi.org/10.3390/en8076528