Article

Analysis of Two Stroke Marine Diesel Engine Operation Including Turbocharger Cut-Out by Using a Zero-Dimensional Model

1
Key Laboratory of High Performance Ship Technology of Ministry of Education, School of Energy and Power Engineering, Wuhan University of Technology, 1178 Heping Road, Wuhan 430063, China
2
Department of Naval Architecture, Ocean & Marine Engineering, University of Strathclyde, 100 Montrose Street, Glasgow G4 0LZ, UK
*
Author to whom correspondence should be addressed.
These authors contributed equally to this work.
Energies 2015, 8(6), 5738-5764; https://doi.org/10.3390/en8065738
Submission received: 15 April 2015 / Accepted: 4 June 2015 / Published: 16 June 2015

Abstract

:
In this article, the operation of a large two-stroke marine diesel engine including various cases with turbocharger cut-out was thoroughly investigated by using a modular zero-dimensional engine model built in MATLAB/Simulink environment. The model was developed by using as a basis an in-house modular mean value engine model, in which the existing cylinder block was replaced by a more detailed one that is capable of representing the scavenging ports-cylinder-exhaust valve processes. Simulation of the engine operation at steady state conditions was performed and the derived engine performance parameters were compared with the respective values obtained by the engine shop trials. The investigation of engine operation under turbocharger cut-out conditions in the region from 10% to 50% load was carried out and the influence of turbocharger cut-out on engine performance including the in-cylinder parameters was comprehensively studied. The recommended schedule for the combination of the turbocharger cut-out and blower activation was discussed for the engine operation under part load conditions. Finally, the influence of engine operating strategies on the annual fuel savings, CO2 emissions reduction and blower operating hours for a Panamax container ship operating at slow steaming conditions is presented and discussed.

1. Introduction

During the last years the maritime industry has confronted multiple issues stemming from different factors, such as the increased bunker prices [1,2,3], the significant reduction of chartered ship rates [4], as well as the oversupply of shipping transport capacity [5,6,7], which have put huge financial pressure to the shipping companies. Furthermore, the growing concern for suppressing emissions from shipping along with the recent more stringent international and national regulations for limiting greenhouse and non-greenhouse emissions [8,9,10] have set additional challenges. Therefore, ship owners and operators are forced to adopt measures to lower fuel consumption and the associated costs as well as to reduce the ship gaseous emissions.
In order to achieve a more efficient and environmentally friendly ship operation, a number of measures have been proposed and used. These include the introduction of the electronically controlled versions of marine diesel engines [11,12], in which the engine settings (fuel injection and exhaust valve opening/closing timings) can be controlled and thus the engine can operate in various modes with high efficiency and low emission throughout the entire operating envelope, the application of the exhaust gas bypass, the usage of turbochargers with variable geometry turbines [13,14] and the installation of waste heat recovery systems employing steam turbine to generate electricity (in some cases combined with a power turbine) [15,16,17]. For the existing ships, retrofitting engine packages for fuel slide valves and cylinder lubricators can be used; the former to improve engine injection and combustion processes; the latter to optimise the cylinder oil consumption avoiding the negative effects of overdosing of alkaline cylinder lubrication [18,19]. Apart from the above mentioned engine related measures, the improvement of vessel hydrodynamic performance (optimum hull form, low resistance coating and effective hull and propeller interaction, etc.) [20] as well as the introduction of propeller saving devices [21] can result in potential fuel savings.
However, the majority of the technical measures mentioned above require high investment cost achieving limited fuel consumption reduction potential. Therefore, operational measures including hull/propeller maintenance management, voyage planning, trim optimisation and operation of engine at slow steaming conditions have also been proposed. Slow steaming has been adopted in shipping industry as a standard operating strategy in order for large containerships to stay profitable in the competitive market, since it is the most immediate and effective way to lower operational cost associated with fuel consumption as well as emissions [22,23]. A significant number of ship operators have even implemented ultra-slow steaming [24] in order to maximize the expected benefits. Even considering the last year reduction of fuel prices, the vessels’ operational speed is not expected to increase, since the fuel cost is an important contributor to the shipping company profitability and in addition, containerships with reduced design speed have been recently built, whilst retrofits of bulbous bow have been applied in many containerships to render the ship hull more efficient at lower speeds.
In spite of the substantial reduction of fuel consumption, slow steaming results in less efficient engine operation and introduces some challenges for the engine systems, as the engine operating at low loads results in low exhaust gas energy content supplied to the turbocharger turbine, lower turbocharger speed and compressor air flow. This can lead to increased deposits at the cylinder and exhaust system components. The low temperatures at combustion result in low wall temperatures especially in the cylinder liner bottom part, which can induce cold corrosion problems. Therefore, attention is needed so that slow steaming does not limit the fuel saving potential and cause engine damage considering that deposits accumulate after a long period of engine slow steaming operation [25]. In this respect, solutions including the increase of engine jacket cooling water temperature and the temporal engine operation at higher load have been proposed by the engine manufacturers for ensuring an efficient and reliable engine operation down to 10% load [26]. For the two stroke diesel engines with two or more turbochargers, turbochargers cut-out, which has already been used by many ship owners, is a very viable option for further optimising fuel consumption and improving engine part load operation [27]. However, the turbochargers cut-out and especially, the cut-out of one unit out of two or two units out of three may substantially increase the engine cylinders maximum pressure when the engine operates at the low load region, and as a consequence, may cause engine structural issues. Therefore, the systematic investigation of the engine operation in such cases is quite crucial for understanding the interactions of the various engine components as well as for obtaining the engine performance.
Due to the marine diesel engine high cost and large size, appropriate simulation tools with varying degree of complexity have been used for investigating the engine steady-state performance and transient response as well as for assisting the design process of engine and its systems. The most commonly used types are the cycle mean value engine models (MVEM) [28,29,30,31,32] and the zero-dimensional models [33,34,35,36,37]. The former are fast running and need less input, but they require an elaborate setting up phase in order to predict the engine behaviour with sufficient accuracy. Furthermore, the in-cycle variation (per degree crank angle) cannot be represented [38,39] and therefore the modelling of engines with varying settings poses difficulties since parametric response surfaces are needed [40,41]. The latter are more complex and require a greater amount of input data and execution time, but they can represent the engine working processes more accurately and predict the in-cylinder parameters variation.
Although slow steaming is commonly used in the last years, only limited published works have investigated this specific engine operating phases [41,42,43]. Kyrtatos et al. [43] proposed a novel way of evaluating engine performance by comparing service monitored data and thermodynamic model predictions, and they carried out a study for predicting a VLCC main engine performance at slow steaming conditions concluding that a sufficient extrapolation of the compressor map is required in order to avoid errors in simulation results. Hountalas et al. [42] studied the effect of one turbocharger unit cut-out (out of two) on the engine performance and it is concluded that retard of fuel injection could be the solution for reducing the cylinder maximum pressure and the associated NOx emissions. In [41], a MVEM was used to investigate the engine performance at low load operation considering the influence of blower activation/deactivation phases and turbocharger cut-out. A reliable method of extrapolating the compressor map at low speed area was developed and validated. However, it was found that the BSFC variation cannot be captured using MVEM for engine with varying settings including turbocharger cut-out, as the MVEM parameters were calibrated only for normal operation and the in-cylinder parameters could not be assessed due to the limitation of MVEM approach.
This work focuses on the thorough investigation of a two stroke marine diesel engine with emphasis at part load operating conditions using a zero-dimensional model, which was developed according to a modular approach in MATLAB/Simulink computational environment. As an effective technique to improve engine performance at low loads, turbocharger cut-out is studied in the region from 10% to 50% load. Various options are investigated including cut-out of one or two turbocharger units (out of three) in combination with blower activation/deactivation. The calculated engine performance parameters as well as the in-cylinder parameters variation are analysed and the engine behaviour is explained. Based on the presented results, recommendations are discussed for the required number of turbochargers cut-out in conjunction with blower activation/deactivation when the investigated engine operates at slow steaming conditions within the load range from 10% to 50% of the MCR point. In addition, the annual figures in terms of fuel consumption, CO2 emissions and blower operating hours for a panamax size containership are estimated for various engine operating modes. Based on the derived results, the benefits and savings of the proposed operating mode are identified and discussed.

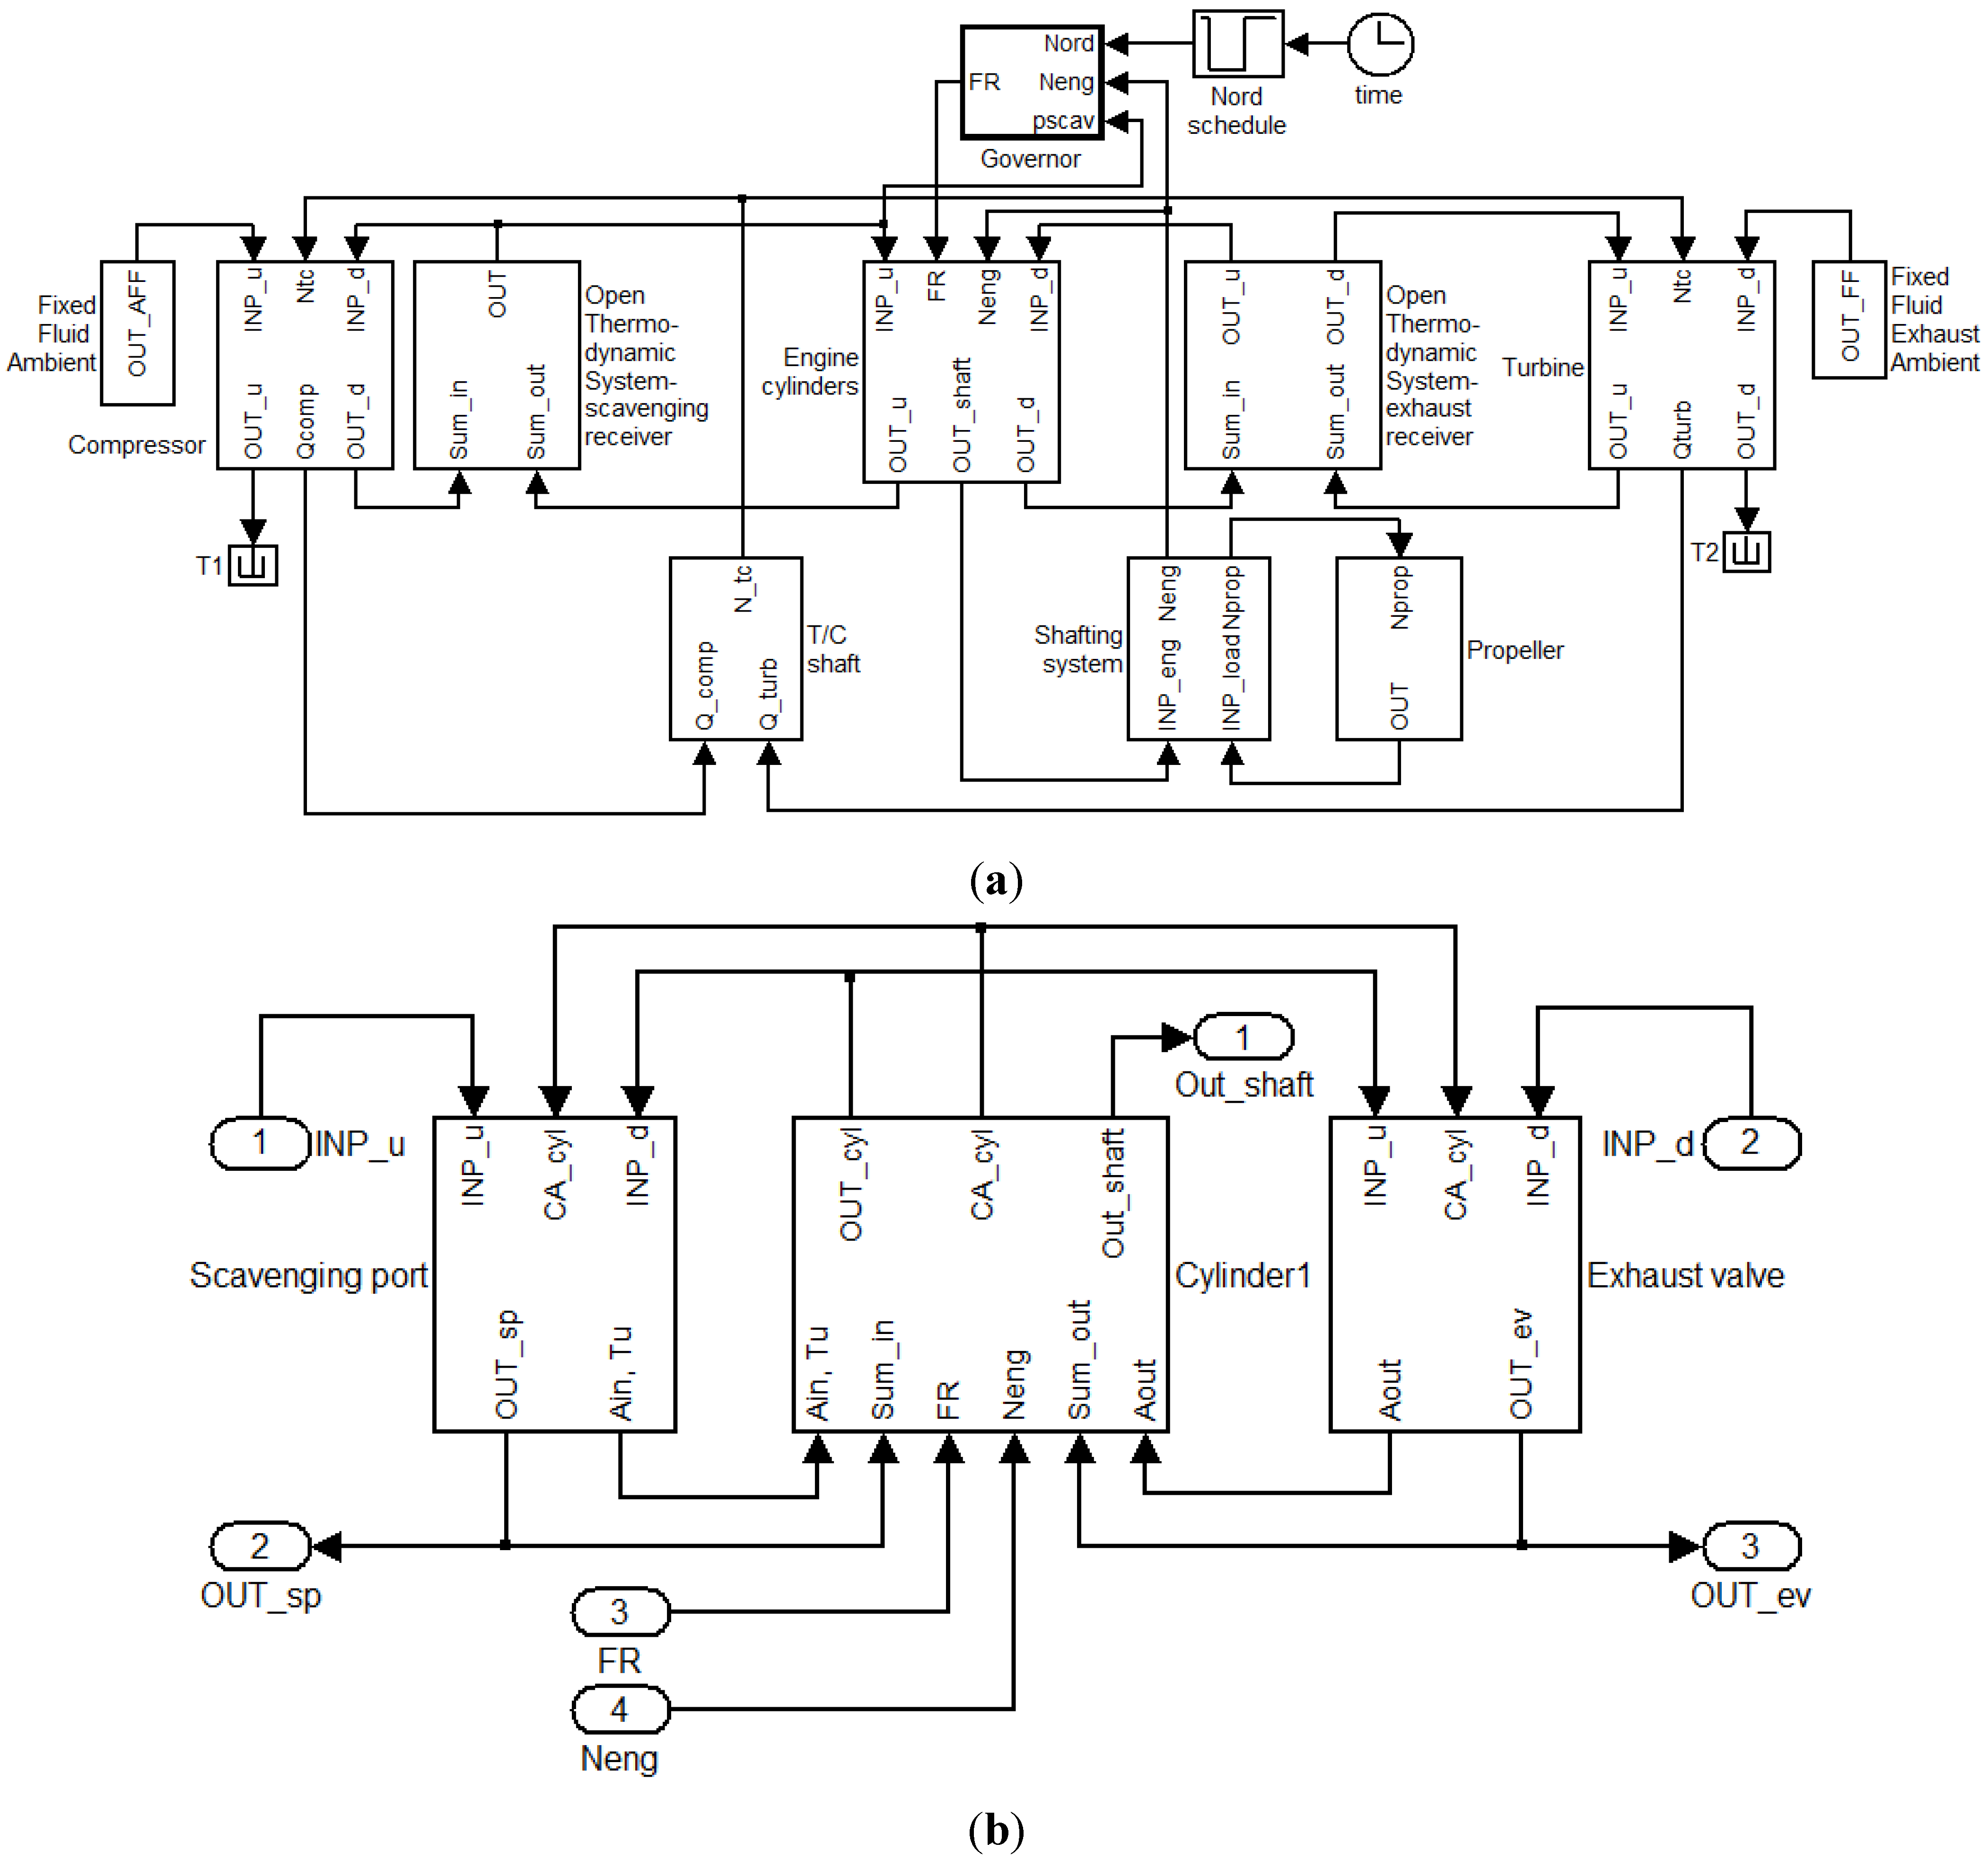
2. Modular Engine Model Description

2.1. Model Structure

In this work, a zero-dimensional model implemented in MATLAB/Simulink environment as shown in Figure 1a is used for investigating a large two-stroke diesel engine operation. The model was developed based on the structure of a modular mean value engine model presented previously [39,41]. The difference from the respective MVEM is that the cylinder block shown in Figure 1a includes the blocks for modelling the cylinder processes, the scavenging ports and exhaust valves. The cylinder block was developed based on a zero-dimensional approach. The part of cylinder block representing the cylinder No. 1 including the scavenging ports and the exhaust valve is shown in Figure 1b.
According to the modular modelling structure, the engine components are modelled by using individual blocks capable of representing the involved processes. Connections between the adjacent blocks are used for exchanging the required parameters. Flow receiver elements (or as otherwise called control volumes according to [44,45]) are used for modelling the engine cylinders, scavenging receiver and exhaust gas receiver. The scavenging ports, exhaust valves as well as the turbocharger compressor and turbine are considered as flow elements. For modelling the engine boundaries, the concept of fixed parameter blocks is used, in which the working medium state as described by the temperature, pressure and equivalence ratio remains unchanged. Shaft elements are employed to represent the engine crankshaft and turbocharger shafts. The proportional-integral (PI) controller block combined with sub-blocks representing the engine fuel rack limiters is used to model the engine governor. The propeller block is used for representing the ship propeller behaviour. The working medium is assumed to be homogeneous and its properties are calculated considering the corresponding temperature, equivalence ratio and pressure.
Figure 1. (a) Zero-dimensional two-stroke engine model implemented in MATLAB/Simulink environment; (b) Cylinder No. 1 block along with each scavenging ports and exhaust valves blocks.
Energies 08 05738 g001
The input required for the flow element blocks is taken from the adjacent flow receiver or constant parameter blocks and include the parameters characterising the working medium state (temperature, pressure, composition) and the thermodynamic properties. The mass and energy flows through the flow elements are calculated and provided to the adjacent flow receiver blocks. The absorbed compressor torque and produced turbine torque are additionally calculated in the compressor and turbine elements, respectively, and they subsequently fed to the turbocharger shaft element, which calculates the turbocharger speed. This, in turn, is provided to the turbine and compressor blocks. The crankshaft block calculates the engine and propeller rotational speeds. The engine rotational speed is forwarded to the engine cylinder and governor blocks. The propeller block uses as input the propeller speed and calculates the propeller absorbed torque. The engine crank angle is calculated by integrating the rotational speed and provided as input to engine cylinder block. For solving the used differential equations, an Euler integration scheme was used along with a fixed time step corresponding to approximately 0.5° crank angle.

2.2. Governing Equations
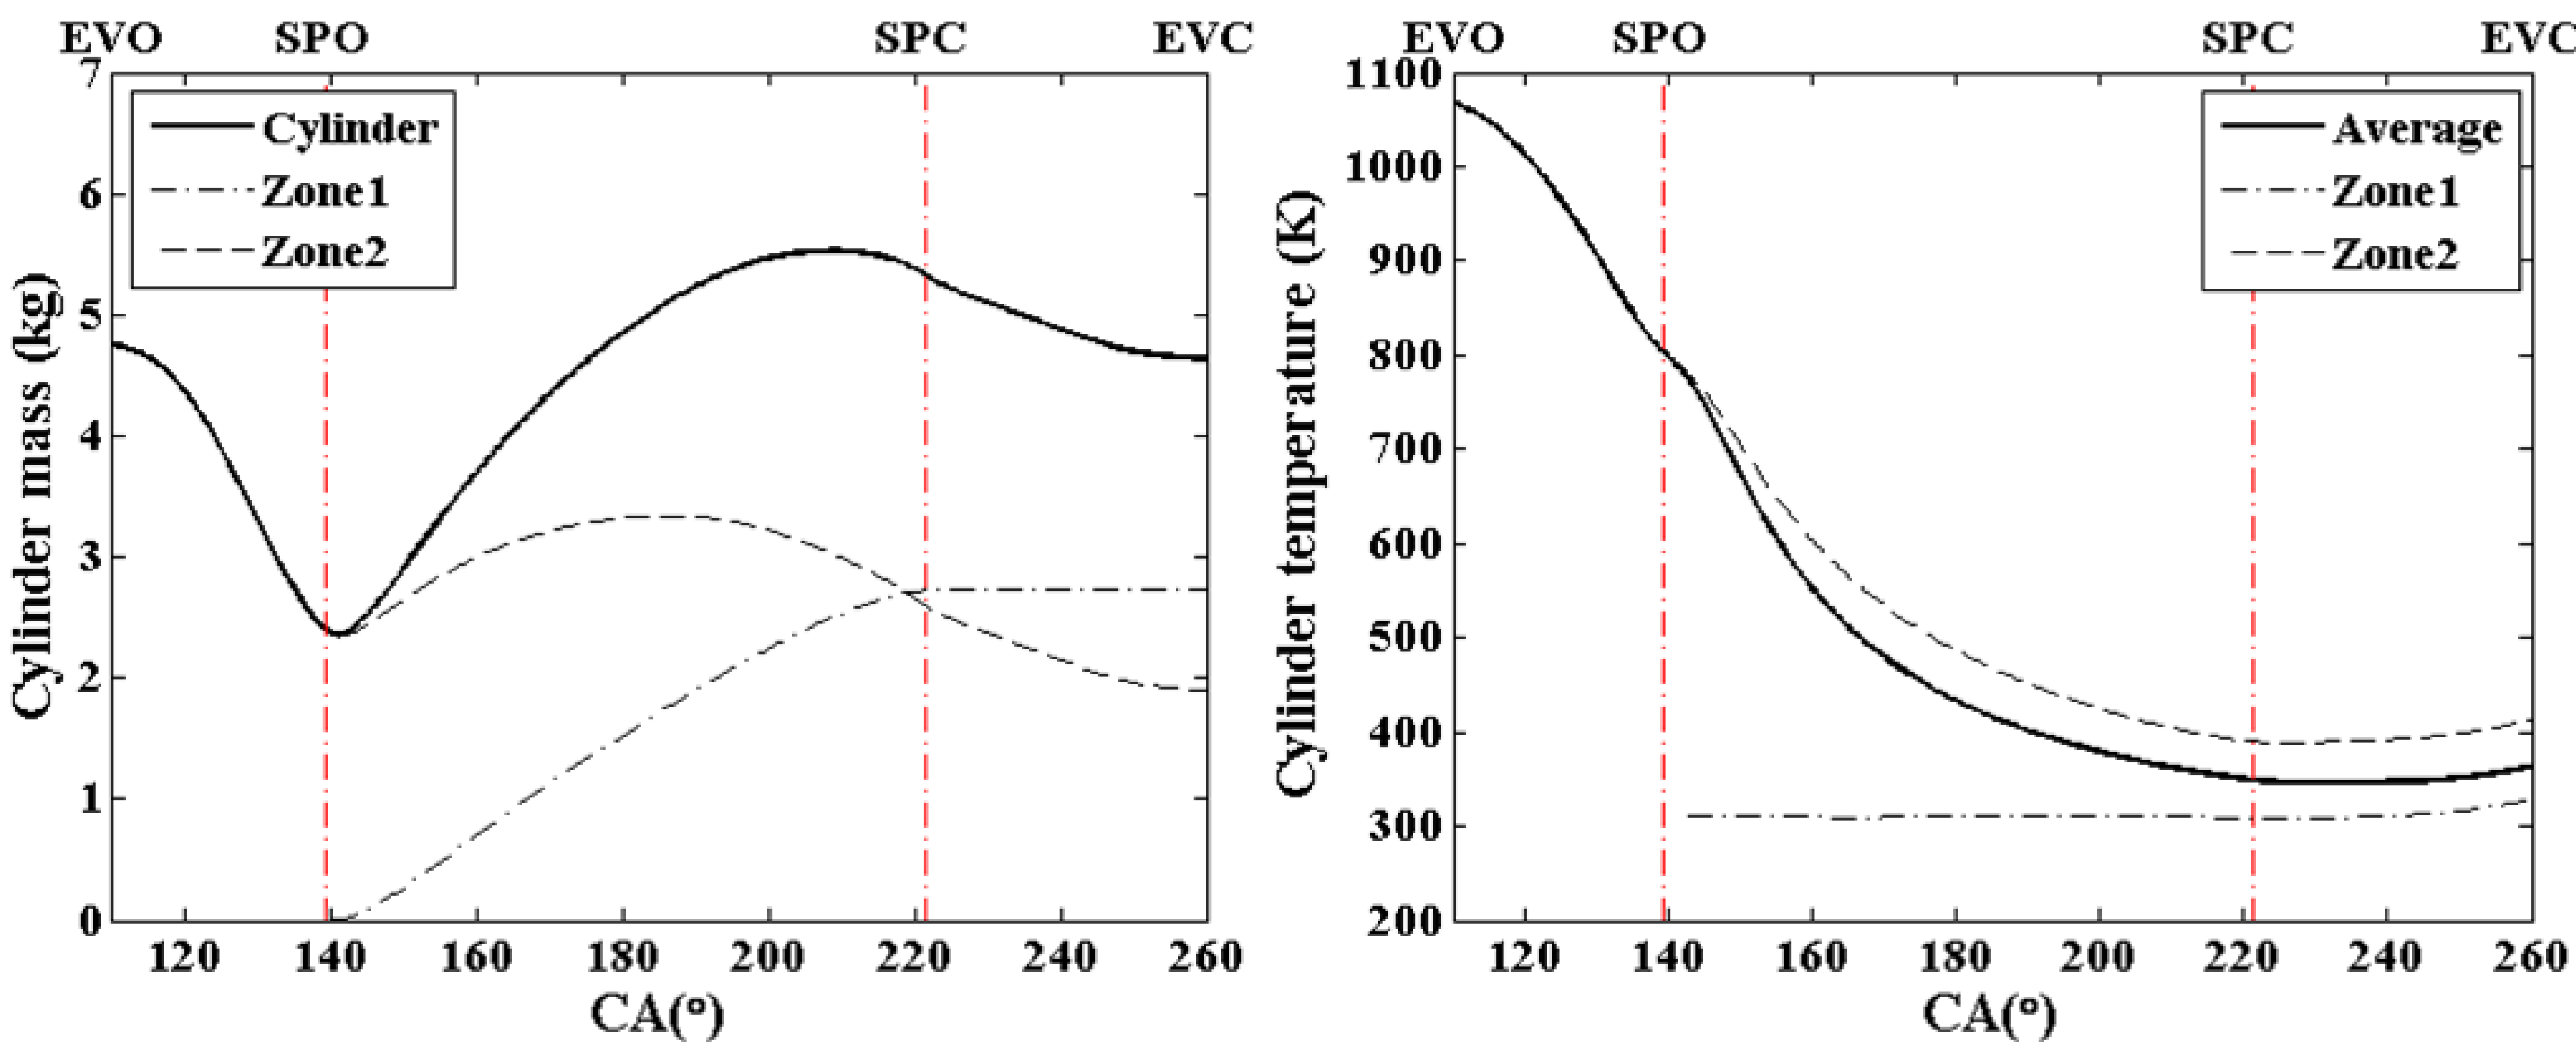
2.2.1. Cylinder

The engine cylinders are modelled using the open or closed thermodynamic system consideration depending on their operating phase. One zone model is considered for the closed cycle and the exhaust gas blowdown period (from EVC to SPO), whereas a two zone model is employed for modelling the scavenging process (from SPO to EVC). Each zone is considered to be uniform and the working medium (air or exhaust gas) is regarded as ideal gas that characterized by its pressure, temperature and equivalence ratio. For the calculation of the cylinder working fluid thermodynamic parameters, the mass and energy conservation laws as well as the ideal gas state equation in the control volume that encloses the cylinder are used [44,45,46]. The one zone model employs three differential equations for calculating the temperature, the mass and burnt fuel fraction along with the ideal gas equation for calculating the pressure and algebraic equations for estimating the working fluid properties.
By applying the energy conservation and the ideal gas state equation assuming that the system can be characterized by using the temperature, pressure and equivalence ratio, the following equation is derived for calculating the cylinder gas temperature time derivative [44]:
d T d t = B u φ d φ d t p D u p ( 1 R R φ d φ d t + 1 m d m d t 1 V d V d t ) u T + C D p T u p
where:
B = 1 m ( s f Q ˙ s f + j m ˙ j h j u d m d t ) R T V d V d t C = 1 + T R R T  and  D = 1 p R R p
The above equation is able to consider the dissociation effects occurring at high pressures and temperatures during the combustion phase. The mass time derivative used in Equation (1) is calculated by applying the mass balance equation, whereas the engine cylinders volume derivative is derived by using the engine kinematic mechanism particulars and the cylinder clearance volume [44]. The working medium properties are calculated as functions of temperature, equivalence ratio and pressure as proposed in [45,47].
The burnt fuel fraction (ξ) is defined by the ratio of burnt fuel mass to the total mass. By differentiating the burnt fuel fraction definition equation, the following equation is derived for the burnt fuel fraction time derivative:
d ξ d t = ( m ˙ ξ ) i n ( m ˙ ξ ) o u t + d m f b d t ξ d m d t m
The fuel/air equivalence ratio and its time derivative, used in Equation (1), are calculated by using the burnt fuel fraction and its time derivative, according to the following equations [44]:
φ = ξ F A s ( 1 ξ )
d φ d t = 1 F A s ( 1 ξ ) 2 d ξ d t
For calculating the fuel burning rate used in Equations (1) and (2), the Woschni-Anisits combustion model [46] was used for describing the combustion process. This model employs the single Vibe approach with the model constants that depend on the engine operating conditions and it can provide adequate accuracy for single fuel combustion [46]. According to that, the fuel burning rate is calculated using the following equation:
d m f b d t = 6 N m f , c y α ( m + 1 ) Δ θ ( θ θ S O C Δ θ ) m e ( α ( θ θ S O C Δ θ ) m + 1 )
where mf,cy is the mass of fuel injected per cylinder per cycle, Δθ is the combustion duration, θSOC is the start of combustion and a, m are the combustion model parameters.
The start of combustion can be calculated by using the start of injection and the ignition delay as follows:
θ S O C = θ S O I + Δ θ I G D
The ignition delay for Diesel engine is estimated by using the following Sitkey equation [46]:
Δ θ I G D = 6 N 10 3 [ k 1 + k 2 e 7800 6.9167 R T ( 1.0197 p 0.7 ) + k 3 e 7800 6.9167 R T ( 1.0197 p 1.8 ) ]
For calculating the start of combustion, the following equation is used [44]:
θ S O I θ S O I + Δ θ I G D d θ Δ θ I G D ( t ) = 1
A constant value can be usually assumed for the combustion model parameter a, whereas the parameter m and the combustion duration Δθ depend on the engine speed and the air-fuel equivalence ratio according to the following equations:
Δ θ = Δ θ o ( λ ο λ ) k 1 ( N N ο ) k 2
m = m o ( Δ θ I G D , ο Δ θ I G D ) k 1 ( N ο N ) k 2 ( p V / T ) E V C ( p V / T ) E V C , o
where o denotes a reference point. It must be noted that the term (pV/T)EVC is proportional to the working medium mass trapped within the cylinder at the EVC point.
Typical values for the constants used in Equations (9) and (10) are provided in [46] for various diesel engine types including large diesel engines.
The Woschni model [48] was used for calculating the cylinder gas to wall heat transfer coefficient, according to the following equation:
h c y l = k D 0.2 p 0.8 T 0.55 w 0.8
where hcyl is the heat transfer coefficient, k is the model constant, D is the cylinder bore, p is the cylinder gas pressure, T is the cylinder gas temperature and w is a representative cylinder gas velocity. Constant temperature at cylinder walls was assumed in this work.
The heat rate transferred from the cylinder gas to the cylinder walls is calculated by using the following equation:
Q ˙ = h c y l j A i ( T g T j )
where j denotes piston, cylinder head, liner and exhaust valve, respectively.
For calculating the engine friction losses, an equation providing the engine friction mean effective pressure as a function of the cylinder maximum pressure and the average piston speed was used [49]. Subsequently, the cylinder torque due to friction is estimated by using friction mean effective pressure. The instantaneous cylinder torque is calculated by using the gross cylinder torque (calculated by using the cylinder indicated work) and cylinder torque due to friction. The cylinder torque is supplied in the crankshaft element, where it is used for calculating the crankshaft rotational speed.
In the two stroke marine engines, the scavenging process takes place from the opening of scavenging port (SPO) till the closing of exhaust valve (EVC). Therefore, two enabled subsystems in MATLAB/Simulink were developed and used: one for calculating the scavenging process, and the other for computing the rest cylinder working processes including compression, combustion, expansion and exhaust gas blowdown. The scavenging port and exhaust valve opening/closing timing is used for determining which enabled subsystem must be employed each time step.
The scavenging process is quite significant for the simulation of a two-stroke diesel engine considering that it accounts for a long period in the open cycle and it affects the trapped mass of the charge as well as its temperature. As a compromise between pure displacement and perfect mixing, a two-zone scavenging model is employed for the scavenging process simulation in this study [50]. The cylinder is divided into a fresh air zone and a residual gas zone. The mass flow rate of the fresh scavenging air entering to the residual gas zone is calculated according to the following equation by introducing the mixing factor ksca:
m ˙ 12 = k s c a m ˙ a
where m ˙ a is the air mass flow rate entering the cylinder through scavenging port.
The mixing factor ksca, which affects the cylinder temperature and gas composition at the end of open cycle (start of closed cycle), is calibrated at each load point. For deriving the required equations to model the scavenging process, the mass and energy conservation are considered in each one of the two zones, respectively. The burnt fuel fraction time derivative in residual gas zone is calculated using Equation (2) considering both ( m ˙ ξ ) i n and dmfb/dt are zero, since zone 1 contains only fresh air and combustion does not take place. Equation (1) simplified accordingly to exclude the terms related to dissociation effects and combustion, was used to derive temperatures of zones 1 and 2. The required initial values were estimated by using the scavenging receiver temperature and the cylinder temperature before the start of the scavenging process (at SPO point) taken from the one zone enabled subsystem, respectively.
The mean temperature of the two zones, which is calculated by taking into account each zone temperature and the respective specific heat at constant volume, provides the initial value for the calculation of the temperature of one zone enabled subsystem at the next cycle. The cylinder pressure time derivative during the scavenging process was calculated according to the following equation that was derived by using the energy balance and the ideal gas law of each zone taking into account that the sum of each zone volume equals to the total cylinder volume and neglecting the effects of dissociation, (i.e., the values of ∂u/p and ∂R/p are considered to be equal to zero):
d p d t = p i = 1 2 V i γ i [ 1 c v , i T i ( B i u i φ i d φ i d t ) + 1 m i d m i d t + 1 R i d R i d t ] d V d t i = 1 2 V i / γ i
where:
B i = 1 m i ( s f Q ˙ i , s f + j m ˙ i , j h i , j u i d m i d t )
where i denotes the zones and j denotes the flows entering/exiting each zone.
The mass balance applied in each zone in conjunction with Equation (13) provides the following equations that are used for the calculation of each zone mass:
d m 1 d t = ( 1 k s c a ) m ˙ a
d m 2 d t = k s c a m ˙ a m ˙ e
where m ˙ e is the exhaust gas mass flow rate exiting through the cylinder exhaust valve.
In total, the two zone scavenging model employs six differential equations (Equation (1) appropriately simplified for each zone, mass balance for each zone (i.e., Equations (15) and (16)), Equation (2) for zone 2 and Equation (14)) in conjunction with the algebraic equations for calculating the working medium properties.
All cylinders of the diesel engine are regarded as identical. Therefore, the only parameter that differs in each cylinder is the phase angle. If malfunction or degradation of the engine cylinders is considered, the combustion and heat transfer as well as scavenging model parameters of the corresponding cylinder can be changed. The torque and inertia of each cylinder are summed up and provided as input parameters for the calculation of engine crankshaft rotational speed.

2.2.2. Scavenging Ports/Exhaust Valve

A quasi-steady one dimensional compressible flow consideration for orifices was adopted to calculate the mass flow rates through the scavenging ports and exhaust valves [44]. The valve/port elements use the instantaneous values for the valve/port equivalent area (derived by using the discharge coefficient and the geometric area) along with the pressure, temperature and properties of the working medium contained in the adjacent receivers. The valve/port mass flow rate is calculated as a function of the equivalence area, the pressure ratio and the properties of the working medium. The mass and energy flow rates are provided to the adjacent elements i.e., the scavenging receiver and the cylinders for the scavenging ports; the cylinders and exhaust receiver for the exhaust valve.

2.2.3. Engine Receivers

The open thermodynamic system concept is also used for modelling the engine receivers. The mass conservation is applied for calculating the working medium mass in the receivers, whereas the temperature is derived by applying the energy balance according to Equation (1). As the effects of dissociation are neglected and the receiver volumes are constant, the terms ∂u/p and dV/dt used in Equation (1) are considered to be zero. Additionally, only fresh air is assumed to be contained in the scavenging receiver so that the term dφ/dt is ignored, whereas the equivalence ratio and its derivative are taken into account for the respective calculations in the exhaust gas receiver. The receiver pressure is subsequently found by using the ideal gas law. No heat transfer was taken into account for the engine scavenging receiver, whereas the heat transferred from the exhaust gas to the ambient was calculated by considering the total heat transfer coefficient, the heat transfer area and the temperature difference.

2.2.4. Turbocharging System Components

The turbocharger compressor was modelled by using the non-dimensional parameters approach developed in the authors’ previous work [41] that can accurately represent the compressor performance in the entire operating region including low speeds. The steps of the extension method taken from [41] are summarised below:
  • Divide the compressor map into zones depending on the available constant speed curves.
  • Digitize the provided compressor performance map.
  • Calculate the non-dimensional parameters for the digitised compressor operating points.
  • Derive the values of the parameters for each zone using curve fitting techniques.
  • Derive the equations interrelating the actual maximum compressor efficiency with speed and the non-corrected maximum compressor efficiency with speed using curve fitting techniques.
  • Provide all the above parameters as input to the compressor model.
  • Calculate the corrected speed and identify the respective compressor map zone.
  • Calculate the non-dimensional parameters.
  • Calculate the non-dimensional flow coefficient for the respective zone.
  • Derive the compressor volumetric flow rate.
  • Calculate the non-dimensional torque coefficient for the respective zone.
  • Calculate the compressor torque.
  • Calculate the non-corrected compressor isentropic efficiency.
  • Derive the corrected compressor isentropic efficiency.
The compressor block uses as input the turbocharger rotational speed (taken from the turbocharger shaft element) and compressor pressure ratio (estimated using the pressures of the adjacent blocks, the air cooler pressure drop, the air filter pressure drop and the blower pressure increase) and calculates the compressor efficiency and air mass flow. Subsequently, the rest compressor parameters including the compressor outlet temperature, the compressor torque and power are calculated.
The turbine block requires as input the digitised maps of the turbine efficiency and swallowing capacity. By using the pressure, temperature and properties of the turbine adjacent elements as well as the provided maps, the turbine efficiency and mass flow are calculated and subsequently used for the calculation of turbine torque, power and outlet temperature.
The pressure increase of each electric driven blower is considered to be polynomial function of each volumetric flow. The air temperature at the blower outlet is derived by considering the air temperature at the blower inlet, the pressure ratio as well as the blower efficiency by using the equation defining the blower isentropic efficiency [45].
The air cooler is modelled within the compressor block. The air cooler effectiveness is calculated by considering a quadratic function of air mass flow. The air temperature at the air cooler outlet is derived by using the air cooler effectiveness, the cooler water inlet temperature and the air temperature at the compressor outlet [45].

2.2.5. Shaft Elements

The shaft elements (crankshaft, turbocharger shaft) use the following angular momentum conservation equation to calculate their rotational speed:
d N d t = 30 Q π I
where ΣQ is the sum of torques provided in the shaft element and I is the total inertia.
For the crankshaft element, the crank angle (at each time step) is derived by integrating the rotational speed and providing the initial crank angle value. The crank angle of each cylinder is calculated by using the respective phase angle.

2.2.6. Governor Element

A proportional-integral (PI) controller law is used for calculating the engine fuel rack position. Appropriate limiters are used to protect the engine during fast transient runs as proposed by the engine manufacturers.

2.2.7. Model Set up and Parameters Calibration

The steps required to set up a model for a given engine are as follows:
  • Select the component blocks which sufficiently represent the engine layout from the models library.
  • Connect the component blocks with the required connections.
  • Insert the input data in all the blocks.
  • Preliminary calibration of the model constants for a reference point and carrying out simulation runs.
  • Fine tuning the model constants to obtain the required accuracy.
The following input data are needed to set up the model: the engine geometric data, the exhaust valve and scavenging port profiles, the steady state compressor and turbine performance maps, the constants of engine submodels (combustion and scavenging), the propeller loading and the ambient conditions. For integrating the time derivatives used in the model, initial values are also required for the following variables: the engine/propeller and turbocharger speeds, the temperature and pressure of the working medium contained in the engine cylinders and receivers as well as the gas composition for cylinders and exhaust receiver. When changing between the used subsystems (from the one-zone subsystem to the two-zones subsystem and vice versa), the required initial conditions were taken from the last time step of the previously enabled system.

3. Results and Discussion

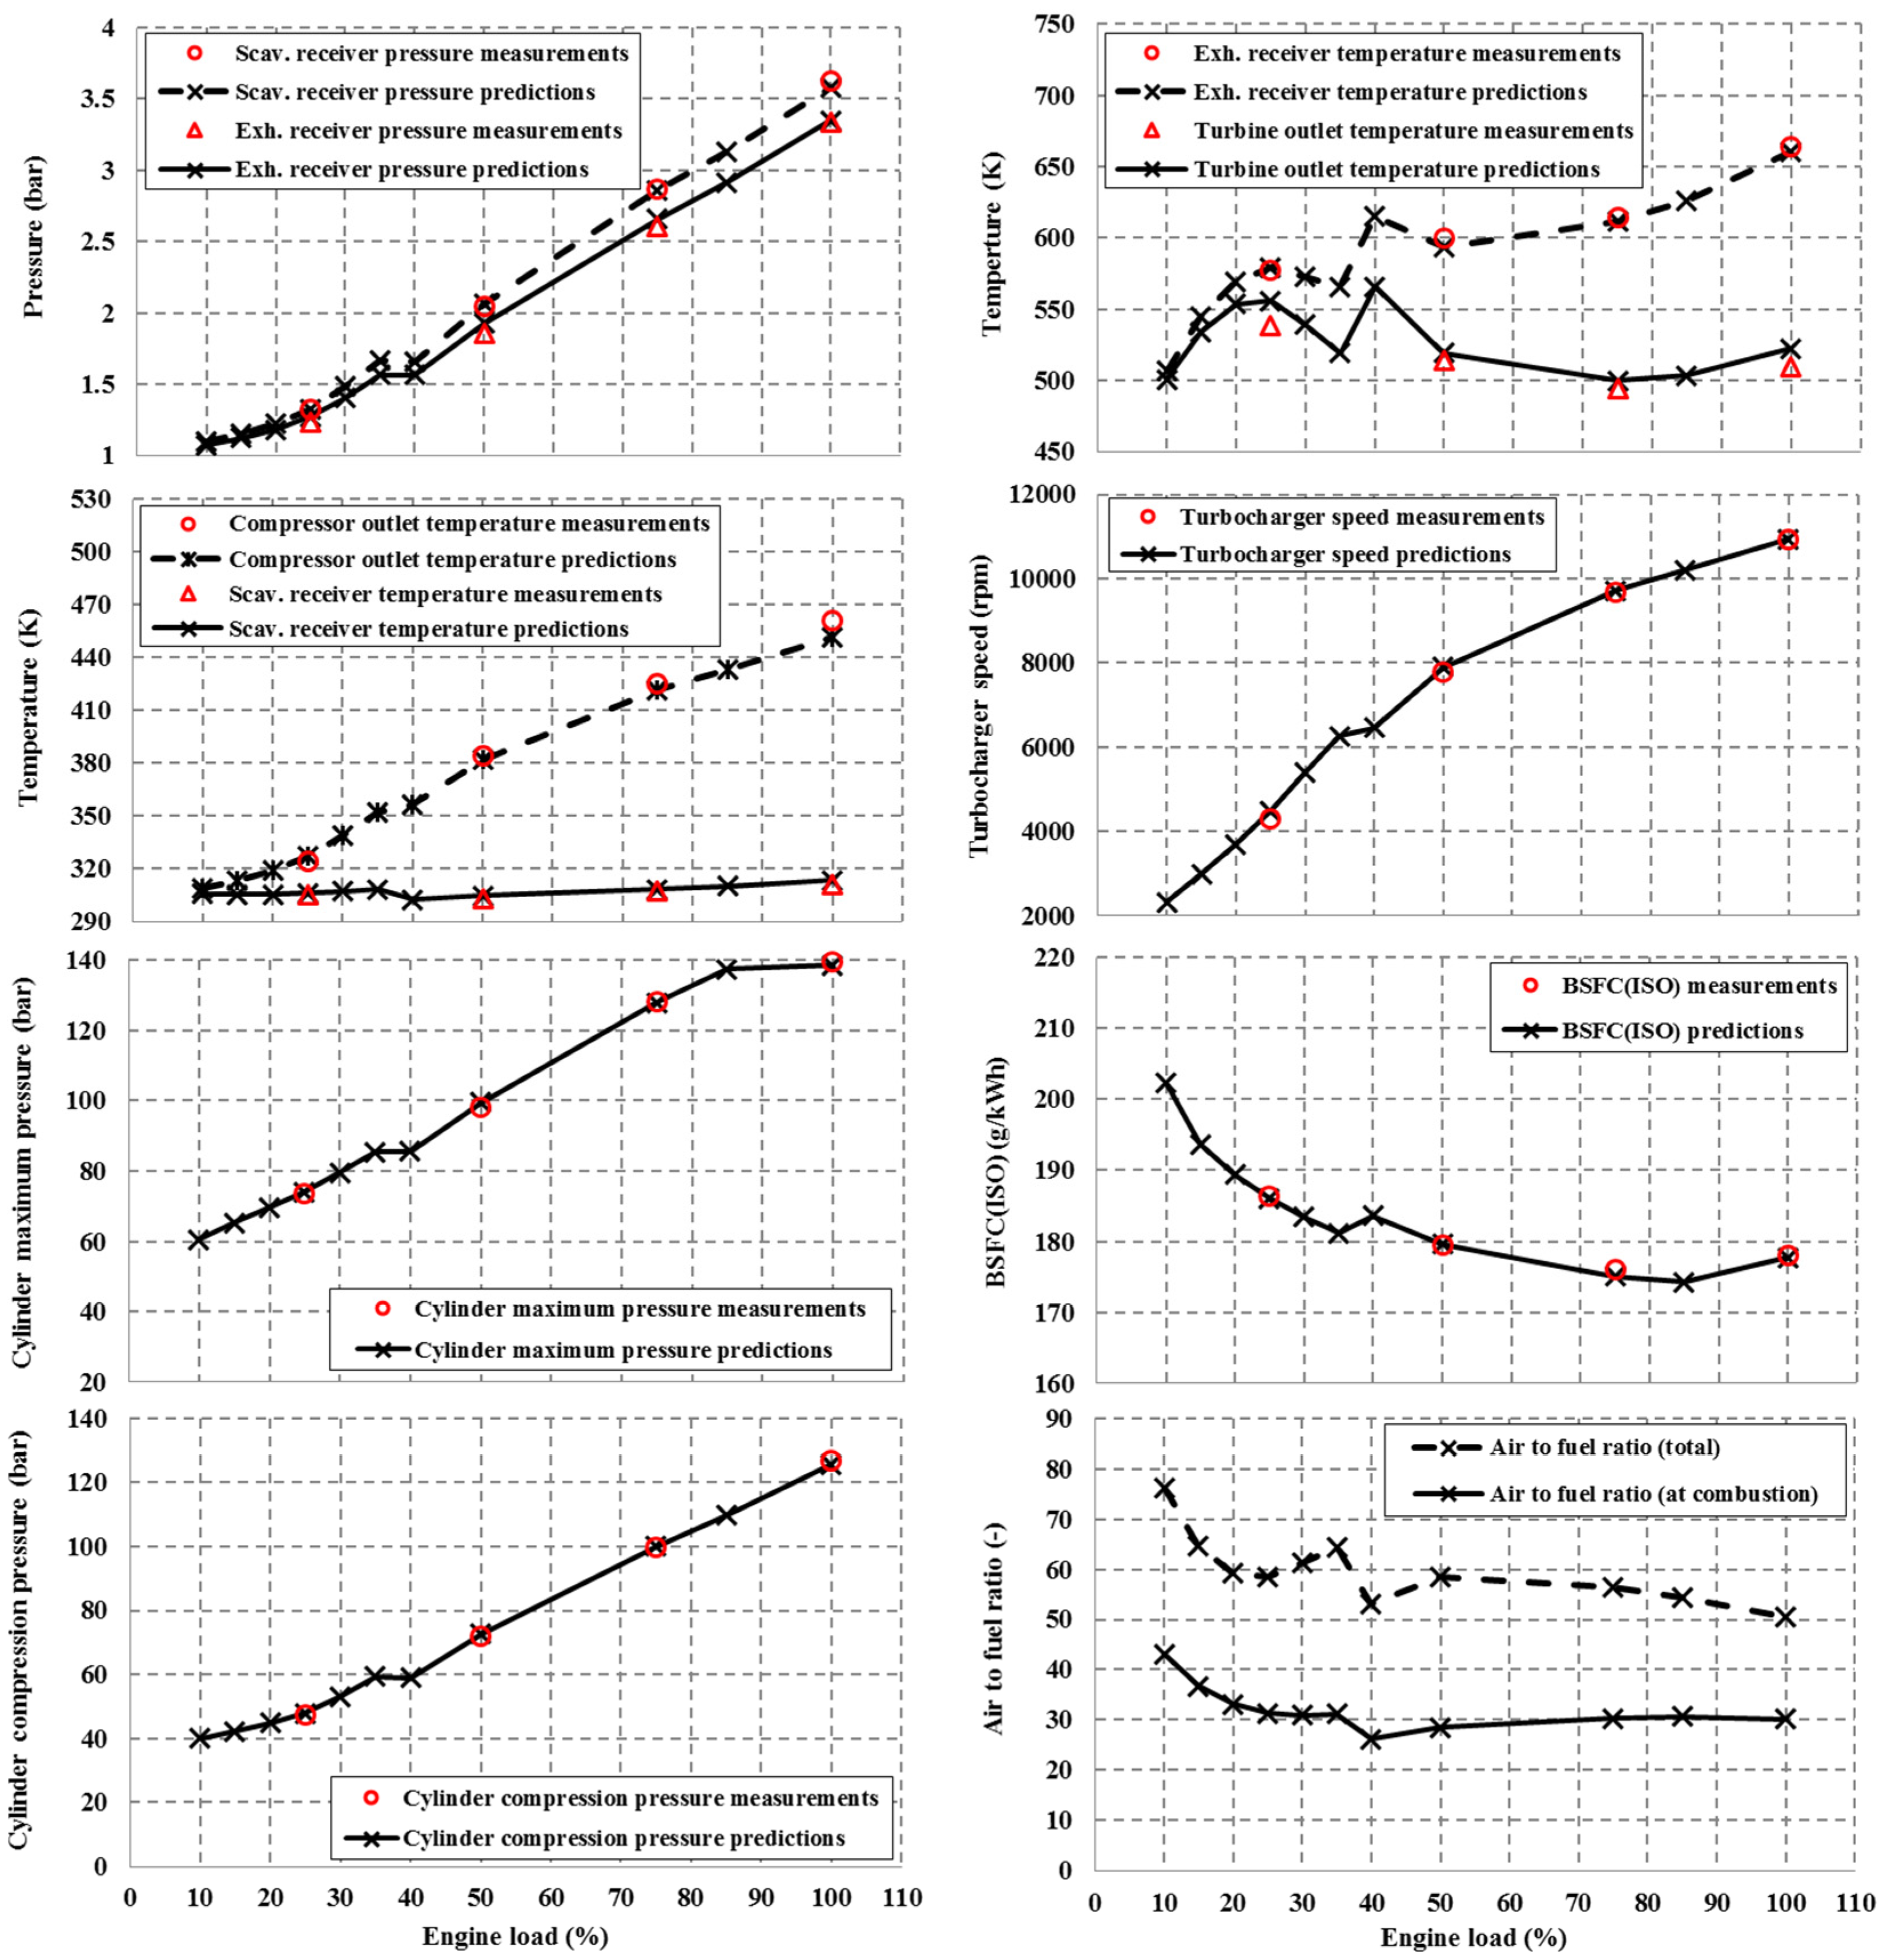
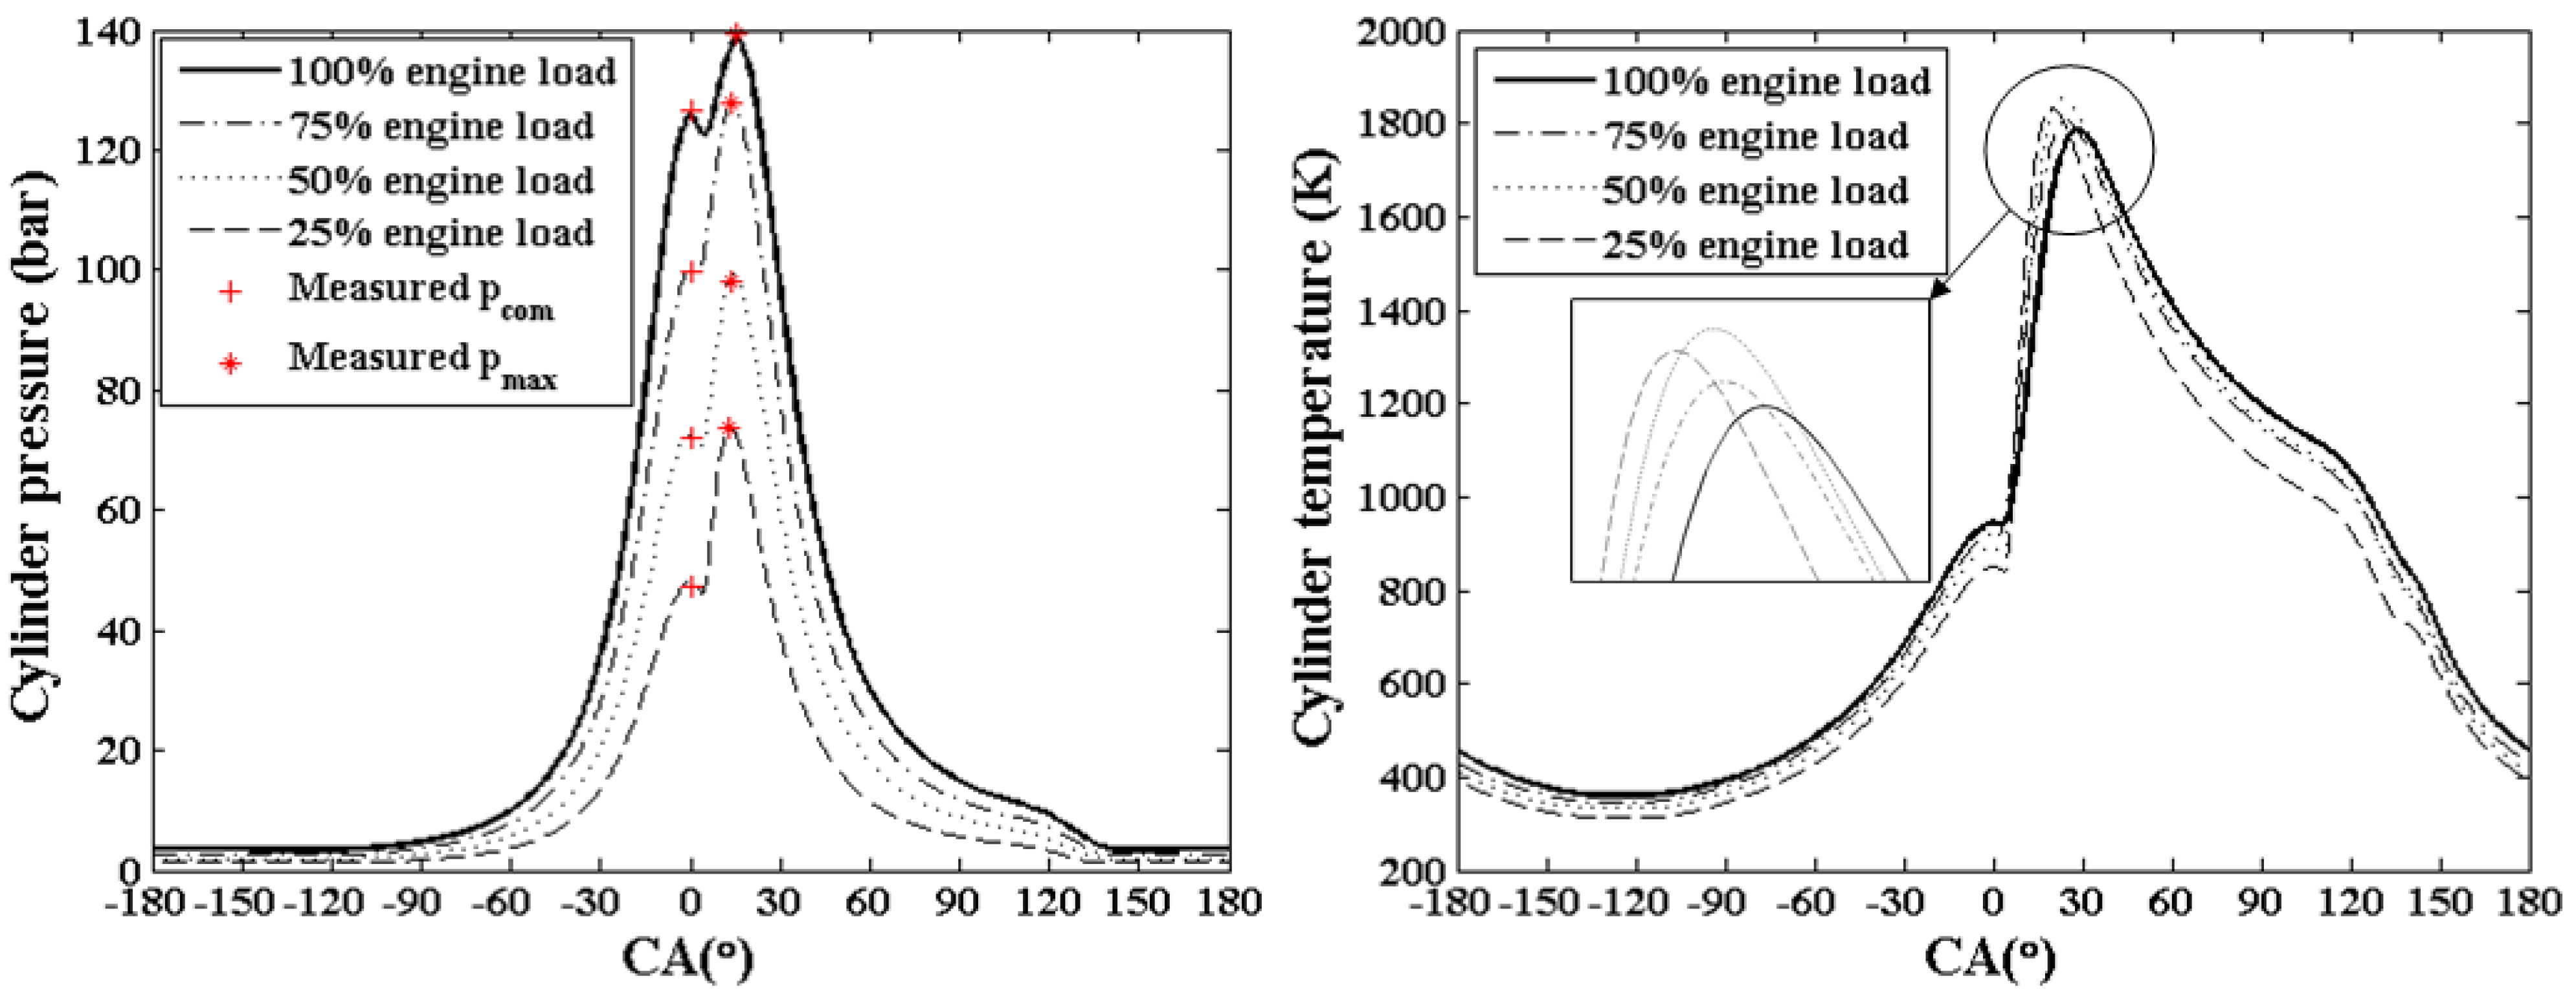
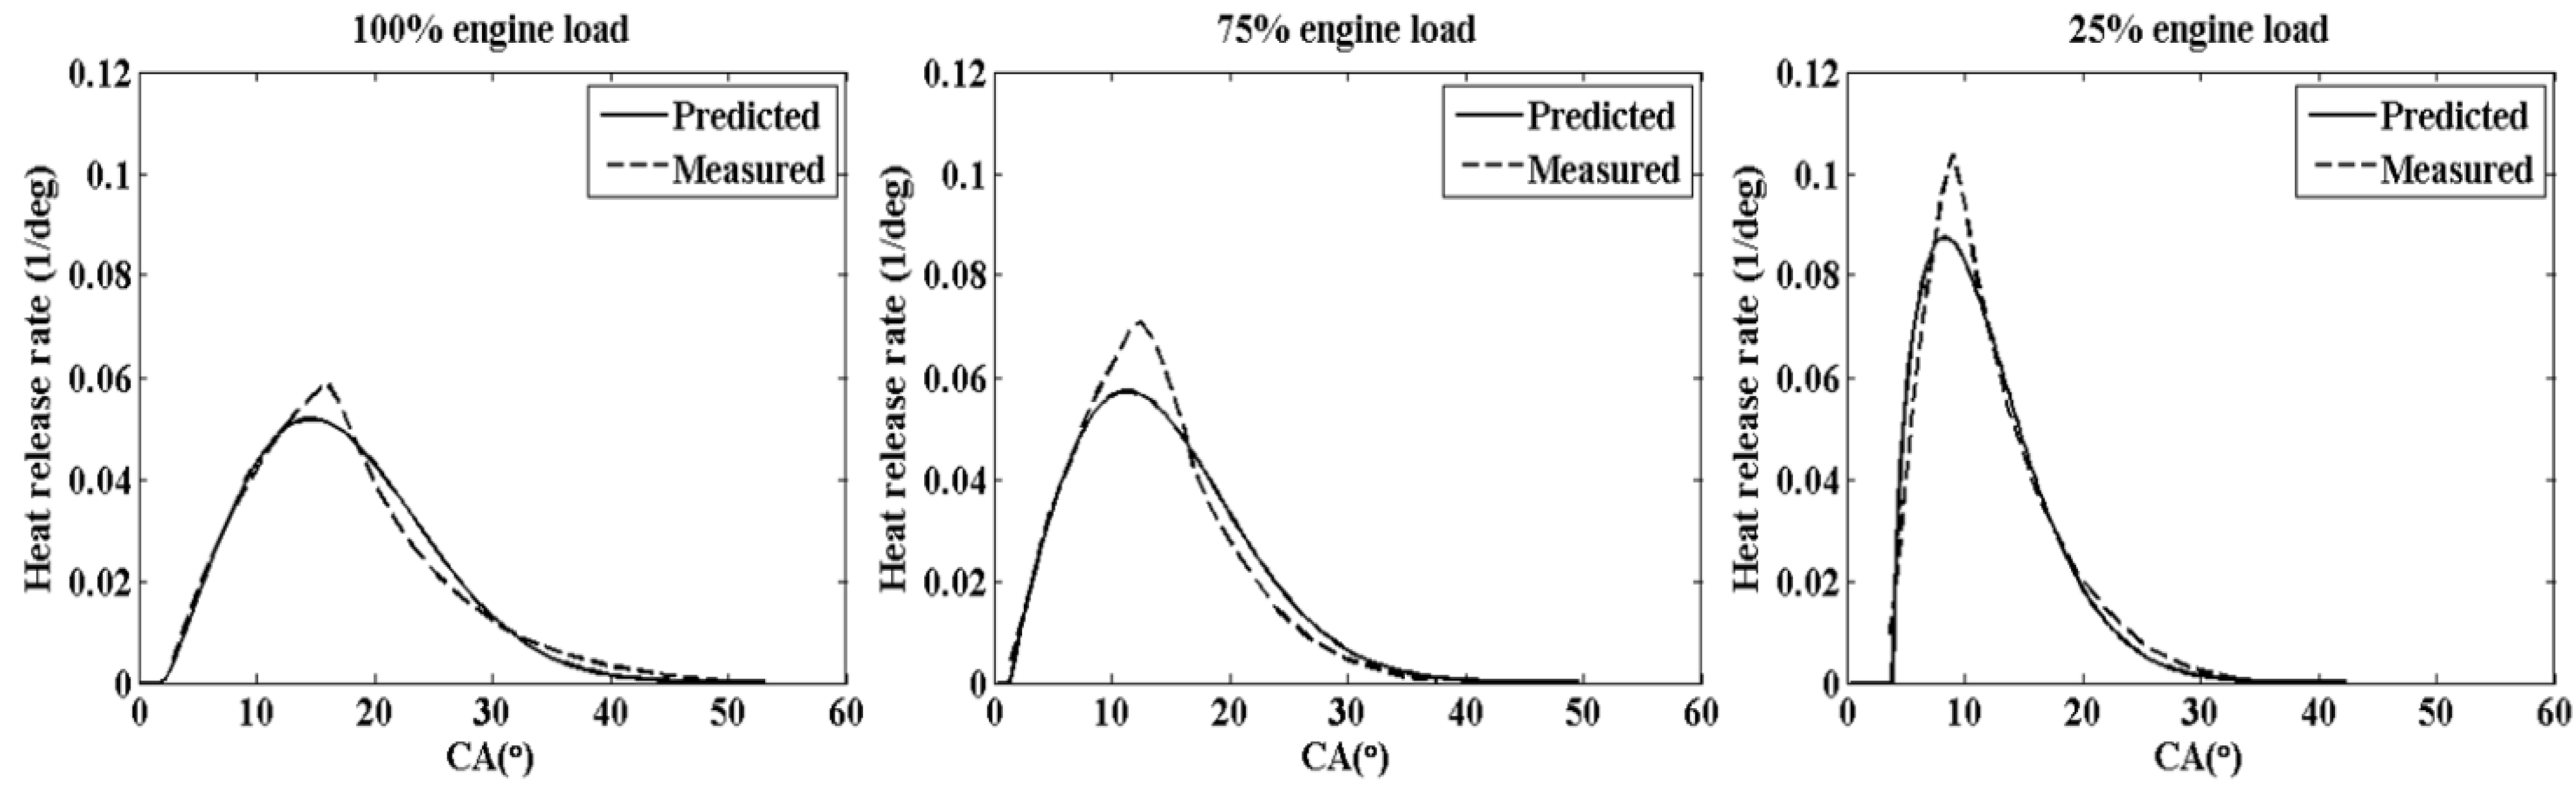
3.1. Validation of Zero-Dimensional Model

The operation of the MAN B&W 7K98MC two-stroke marine diesel engine was investigated using the described modular zero-dimensional engine model built in MATLAB/Simulink environment. The engine employs a constant pressure turbocharging system by using three turbocharger units connected in parallel to supply air to the engine scavenging receiver. The compressed air exiting the turbocharger compressors is forwarded to the air cooler units (one air cooler is installed downstream each compressor), which reduce the air temperature in order to increase its density. When the engine operates at low loads (lower than 40%), the turbocharger speed is too low and thus, the required air for the engine cylinders cannot be covered. Therefore, blowers driven by electric motors are used for providing the required air to the engine cylinders at the engine low load operating region. The blowers are connected between the air cooler and the scavenging receiver and are activated for low scavenging receiver pressure (typically less than 1.55 bar), whereas they are deactivated when scavenging receiver pressure exceeds 1.7 bar [51]. The engine details and the required input data were mainly extracted from the engine project guide [51], whilst the engine shop trial measurements were used for providing the data set used for the model validation. Table 1 contains the main engine parameters. The engine three turbocharger units as well as the installed air coolers and blowers were considered to have identical performance. The start of injection timing was estimated by using the engine variable injection timing (VIT) schedule. The engine was considered to operate on the propeller curve passing through the MCR point.
Table 1. MAN B&W 7K98MC engine parameters.
Bore980 mm
Stroke2660 mm
Number of cylinders7
Brake power at MCR40,100 kW
Engine speed at MCR94 r/min
BMEP at MCR18.2 bar
Turbocharger units3
The combustion model was calibrated at 75% engine load, which was considered to be the reference point, in order to capture the cylinder combustion performance in the entire engine operating region (high and low loads). The required heat release rates were calculated by using the measured cylinder pressure diagrams. Based on this information, the parameters α, m and Δθ of Equation (5) were estimated for 75% engine load by using an optimisation algorithm considering an objective function with parameters the engine maximum pressure and brake specific fuel consumption. Subsequently, considering the pressure diagrams at other engine loads, the constants k1 and k2 used in Equations (9) and (10) were tuned to capture the combustion behaviour at the entire engine operating range. The actual (derived from measured pressure diagrams) and the calculated heat release rates at various engine loads are shown in Figure 2. As can be seen from Figure 2, the agreement between the model prediction and the measured values at 100% and 25% loads is considered acceptable for a single Vibe combustion model, as a compromise between the two extreme load points was achieved. Indeed, a lower value for the parameter m seems to be beneficial for improving the heat release rate shape at 100% load, however, it could make combustion prediction even worse at 25% load. Moreover, as it can be inferred from Figure 3 and Figure 4, there is already a satisfactory agreement with the maximum cylinder pressure for the investigated engine loads.
Figure 2. Heat release rates at various engine loads.
Energies 08 05738 g002
To enable the use of the model for investigating the engine operation with turbocharger cut-out, its ability to predict engine performance under normal engine operating conditions first needs to be examined. Therefore, the model was initially validated against the experimental data obtained from engine shop tests. The engine operation under steady state conditions at 25%, 50%, 75% and 100% of the MCR point was simulated. The obtained percentage error between the predicted engine performance parameters and the corresponding engine shop trial data are provided in Table 2. Acceptable accuracy is obtained for the entire engine operating region including 25% load, where the compressor operating point lays below the provided compressor map area. This shows that the used modelling approach, which includes the extrapolation of the compressor map towards the lowest speed area along with the blower and turbocharging system components models, is regarded as effective. It is deduced that the engine zero-dimensional model can provide adequate accuracy and therefore, it can be considered a reliable tool to simulate the examined engine operation cases presented below.
Figure 3. Steady state simulation results and comparison with shop trial data.
Energies 08 05738 g003
Figure 4. In-cylinder pressure and temperature variations at various loads.
Energies 08 05738 g004
Table 2. Steady state simulation results, comparison with shop trials data.
Engine Load (% MCR)100755025
Error (%)
Brake power−1.02−1.01−0.99−0.92
BSFC0.160.55−0.080.18
Maximum cylinder pressure0.710.07−1.46−0.59
Cylinder compression pressure0.81−0.23−0.86−1.16
Turbocharger speed0.03−0.41−1.47−4.52
Scavenging air receiver pressure1.390.40−0.89−0.54
Exhaust gas receiver pressure−0.20−2.23−4.11−3.13
Scavenging air receiver temperature−0.72−0.39−0.45−0.24
Exhaust gas receiver temperature0.460.481.08−0.37
Exhaust gas temperature after turbocharger2.52−1.18−0.99−3.25
After the validation of the model, the engine operation at steady state conditions was investigated covering the entire load region from 10% to 100%. The activation of the electric driven blowers is induced for engine loads below 40% of the engine MCR, where the scavenging pressure becomes lower than 1.55 bar. The model predictions for a set of engine performance parameters including the receivers pressures and temperatures, the temperature of the exhaust gas exiting the turbine, the turbocharger speed, the brake specific fuel consumption (corrected at ISO conditions), the air to fuel ratio (total and at combustion), as well as the cylinder compression and maximum pressure are presented in Figure 3. The available engine recorded parameters for the engine loads 25%, 50%, 75% and 100% of MCR are also included in Figure 3. It is observed that the minimum brake specific fuel consumption is obtained at 85% load, at which the variable injection timing is the most advanced leading to almost the same maximum cylinder pressure level as 100% load.
Discontinuities in the engine performance parameters variations between 35% and 40% load can be observed, which are attributed to the engine blowers activation. Thus, a greater air amount enters the engine cylinders and therefore, the total and combustion air to fuel ratio values increase, whereas the temperatures of exhaust gas at turbine inlet (exhaust gas receiver temperature) and outlet become lower than the corresponding values at 40% load, where the blowers are switched off. The blower activation results in greater energy content provided to the turbine, which causes an increase in the turbocharger speed and scavenging receiver pressure in comparison with the respective values without blower activation (not shown in Figure 3).
This, in turn, increases the cylinder compression pressure and maximum pressure, thus, reducing the engine BSFC compared to the case without blower activation. Moreover, the blower compression process leads to an approximately 5 K increase of the temperature of the air contained in the scavenging receiver for loads lower than 35% (in comparison with the respective temperature value at 40% load). In the load range from 35% to 25% of MCR, the turbocharger compressor operates at lower speed delivering less air flow rate and as a result, the exhaust receiver temperature marginally increases. At engine loads 20% and lower, the exhaust receiver temperature decreases, since the injected fuel is more drastically reduced in comparison to the engine air flow (due to the turbocharger speed drop), and as a consequence, both the total and combustion air to fuel ratio values become greater.
The in-cylinder parameters versus crank angle are presented in Figure 4 showing a sufficient prediction accuracy of the maximum pressure and the compression pressure. As the engine load reduces, there is a reduction in the cylinder temperature during the open cycle. On the other hand, the maximum average cylinder temperature increases; at 75% load due to the earlier start of injection, whereas at 50% load due to the less trapped air amount, as it is inferred from the lower value of the air to fuel ratio at combustion. When the blowers are activated (below 40% load), the air to fuel ratio significantly increases leading to the reduction of the maximum cylinder temperature.
The scavenging process calculation used in this work is based on a two-zone model as explained in the previous sections. The results for the cylinder scavenging parameters variation during the exhaust gas blowdown and scavenging periods (from the opening of exhaust valve to the closing of exhaust valve) at 75% load are presented in Figure 5.
Figure 5. Scavenging model results for engine operation at 75% load.
Energies 08 05738 g005
The cylinder exhaust gas mass and temperature quickly reduce after the opening of the exhaust valve as the exhaust gas exits the cylinder. After the scavenging port opening (SPO), air enters into the cylinder and therefore, the air zone is created and grows. Since a part of the air passes from the air zone to the mixing zone, the mass of the latter increases after SPO and takes the maximum value at around 10 °CA after BDC. Afterwards, there is a reduction in the mixing zone mass as more exhaust gas exits the cylinder (entering the exhaust receiver). After the scavenging port closing (SPC) point, the exhaust gas continues exiting the cylinder and therefore, the trapped mass, which contains an amount of residual gas, is gradually reduced till the exhaust valve closing (EVC) point.

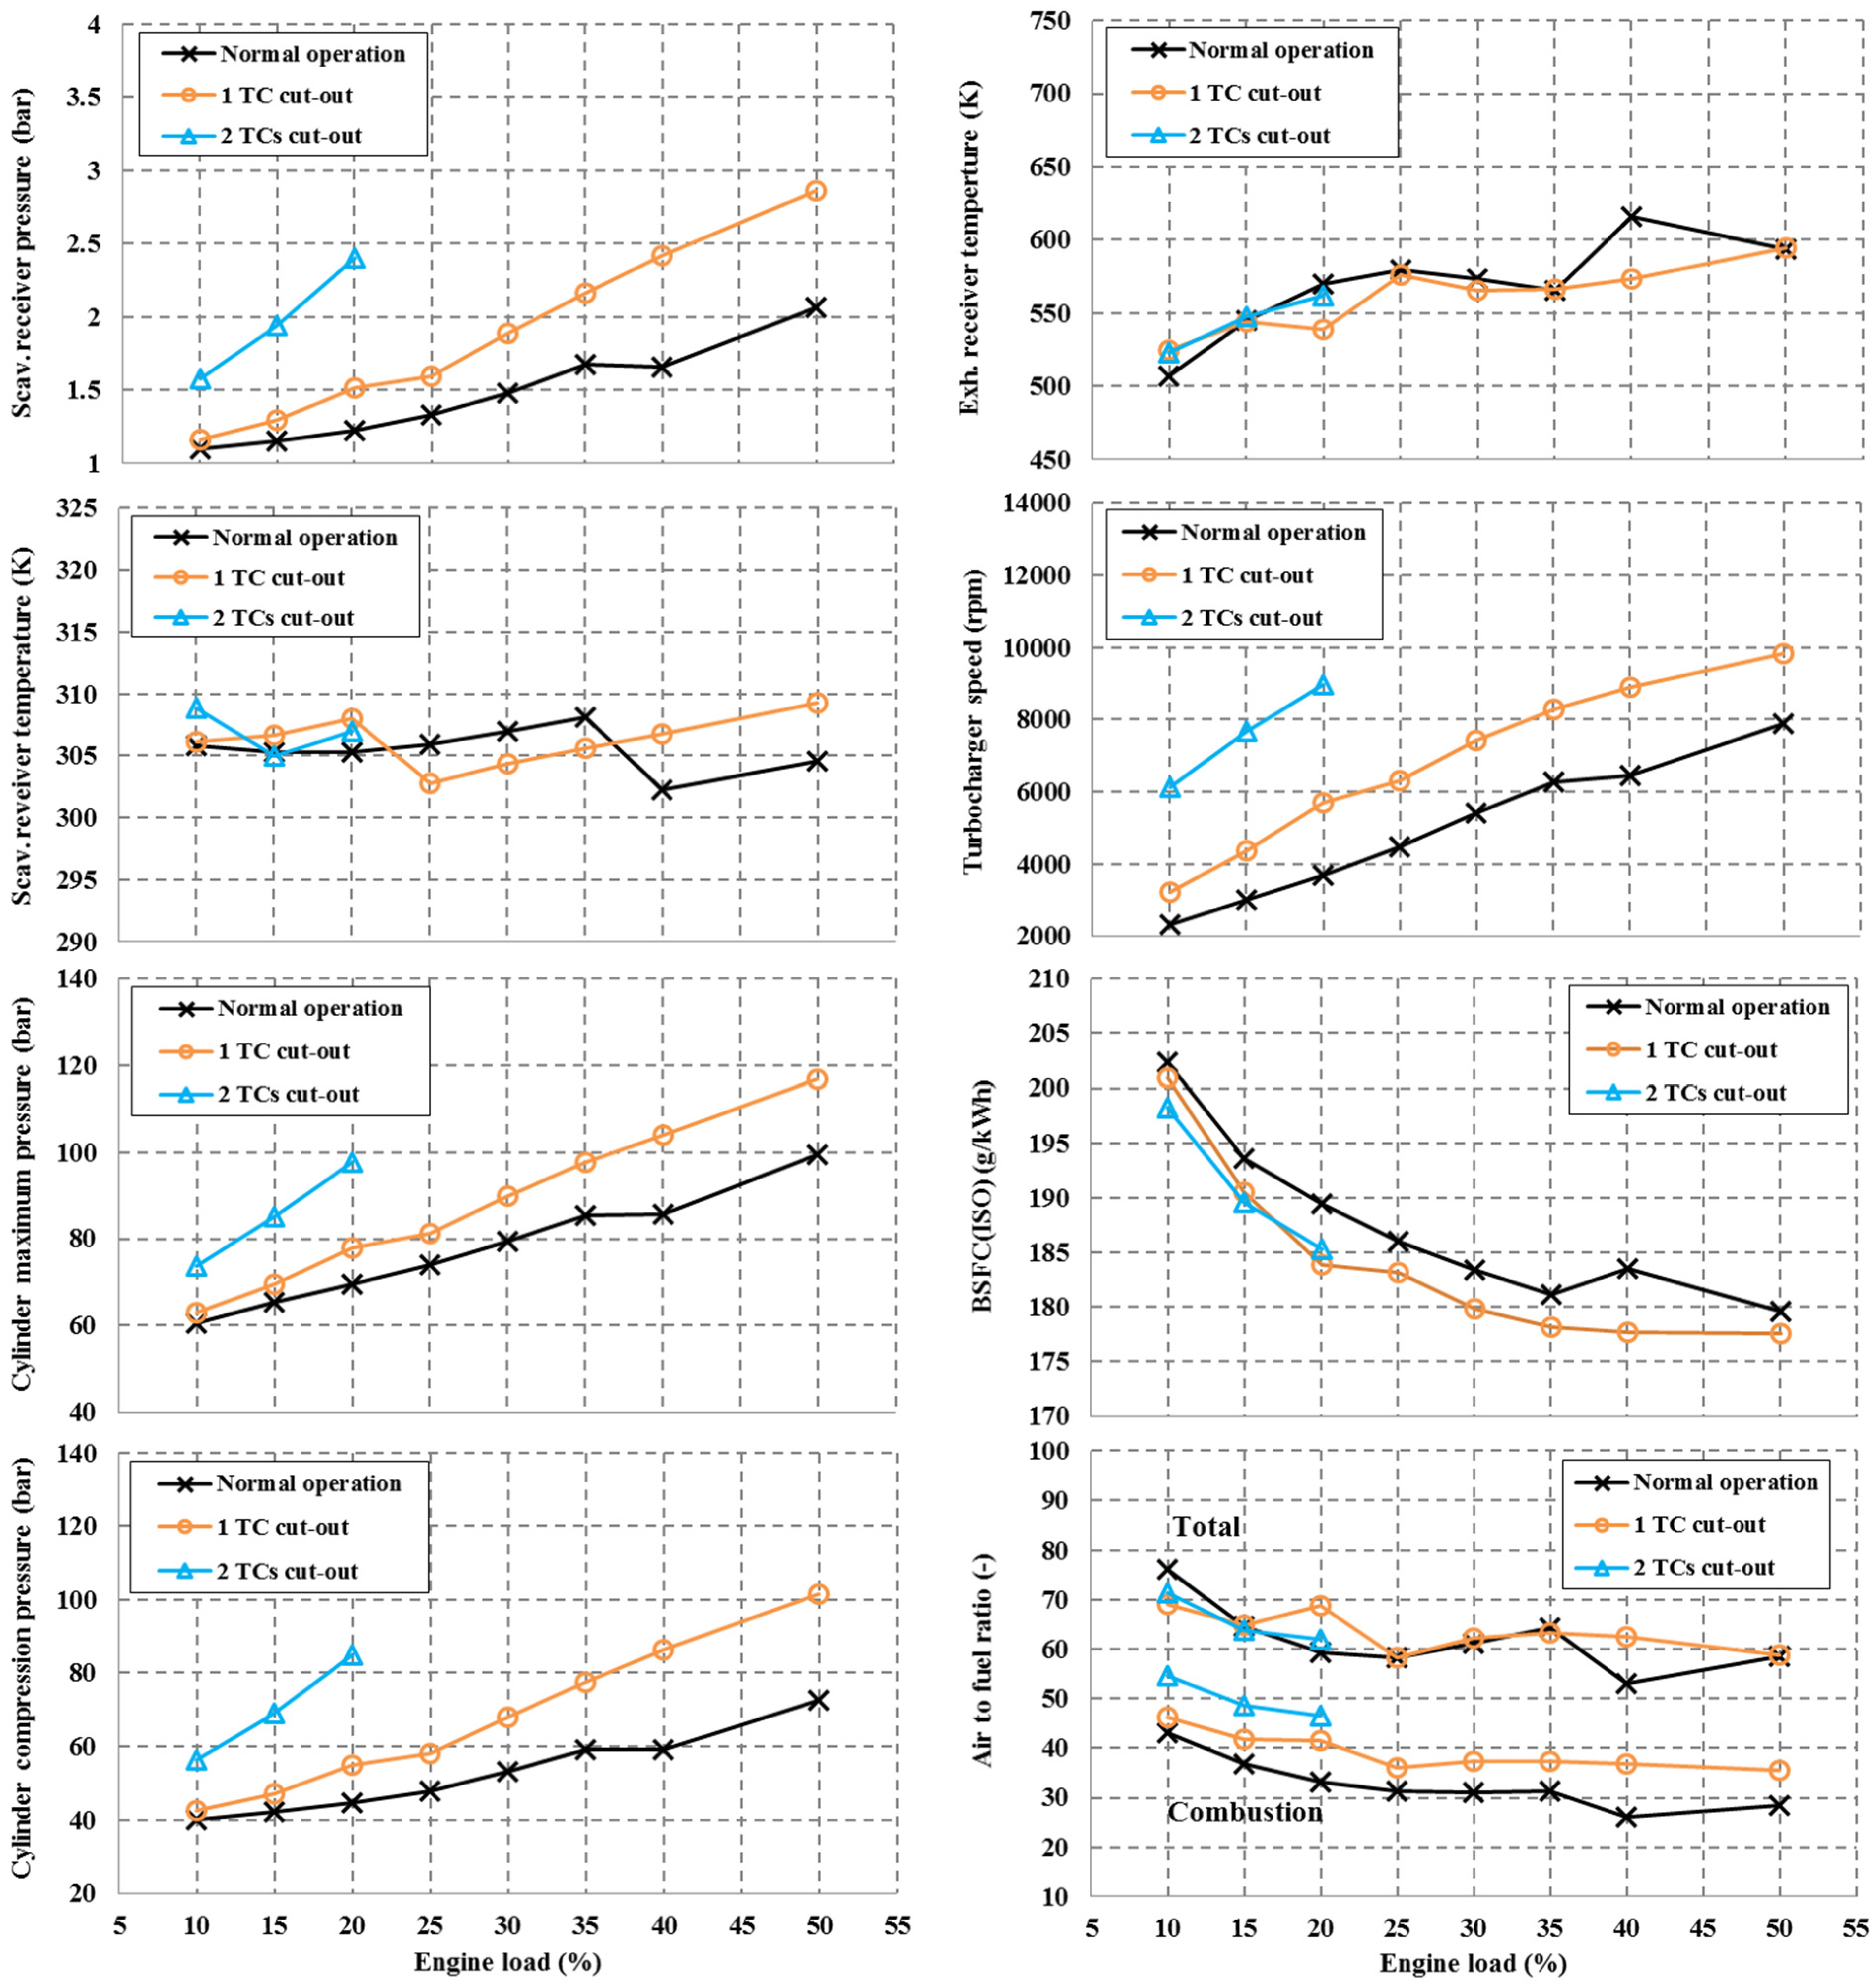
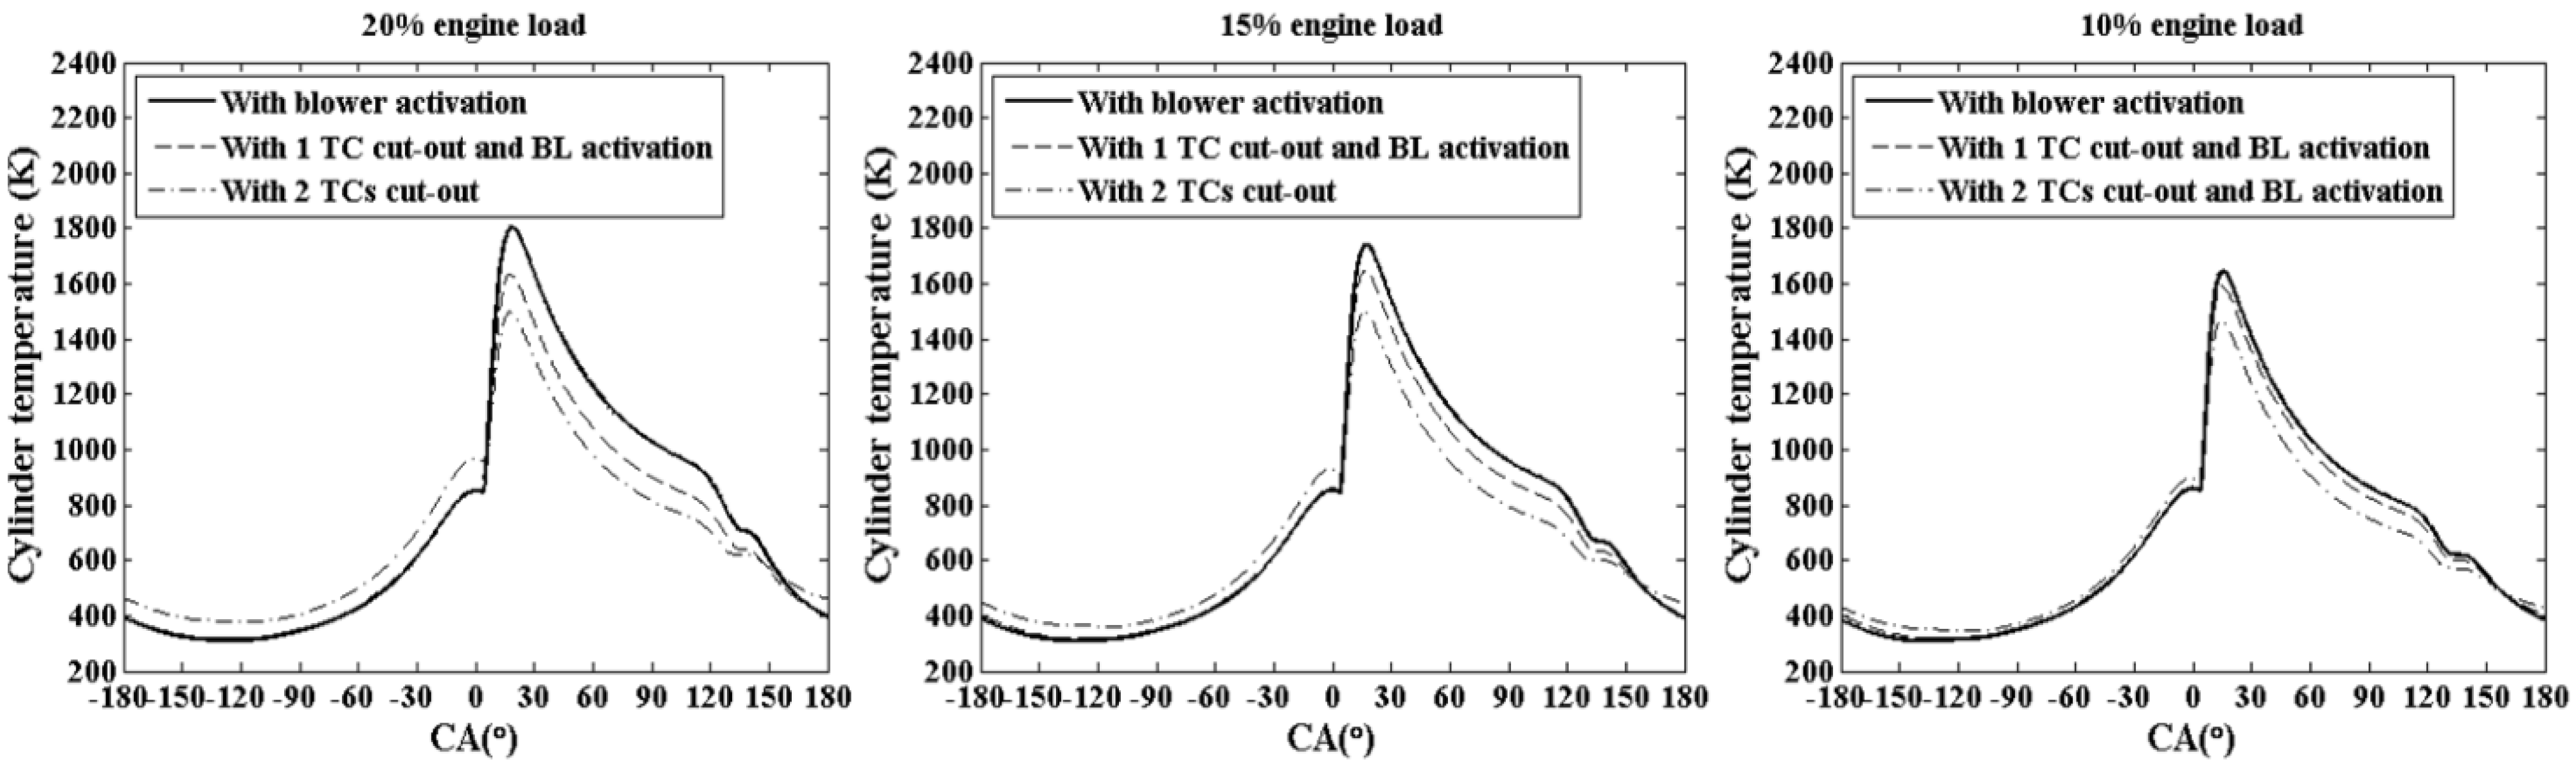
3.2. Engine Operation Investigation with Turbocharger Cut-Out

This section investigates the influence of turbocharger cut-out on the engine performance as well as the various alternatives for operating the engine at part loads down to 10% load, which imposes great challenges due to the significant change of the available exhaust gas flow area. Comparisons of the engine performance parameters predictions under normal operation with the respective ones obtained when using turbocharger cut-out for engine loads below 50% are presented in Figure 6.
Figure 6. Steady state simulation results for normal operation and turbocharger cut-out. (Blowers are activated as follows: below 40% load for normal operation; below 25% load for operation with 1 TC cut-out; at 10% load for operation with 2 TCs cut-out).
Energies 08 05738 g006
The adoption of one turbocharger unit cut-out (out of three) caused a substantial rise of the turbocharger speed and as a result, the increase of the scavenging receiver pressure. In this respect, greater total engine air flow is obtained as it is deduced by the engine total air to fuel ratio values, which are greater than the ones of normal engine operation in the region from 40% to 50% (where the blowers are switched off) and almost the same with the ones of the normal engine operation for the region within 25% to 35% load (where the blowers are switched on). In addition, more air amount remains into the engine cylinders as it is observed by considering the combustion air to fuel ratio values, which increase in the load region from 25% to 50% of MCR. The increased scavenging receiver pressure results in the rise of the cylinder compression and maximum pressures and the consequential reduction of BSFC.
Due to the higher amount of air delivered by the compressor and trapped into the engine cylinders, the turbocharger cut-out decreases the exhaust receiver temperature and therefore, it lowers the thermal loading for engine load from 40% to 50%. It is also observed that the values of the total air to fuel ratio gradually reduced in the load range from 35% to 25% load with one turbocharger cut-out and it is estimated that the total air to fuel ratio will become lower than the respective one at normal operation below 25% load for the case where the engine operates without blower activation. This will result in a significant rise of exhaust receiver temperature imposing greater thermal loading to the engine components. Thus, it is inferred that the two operating turbochargers cannot provide adequate air amount to the engine cylinders. In consequence, the following solutions need to be considered for the engine operation below 25% load: either the switch on of the electric driven blowers or the cut-out of the second turbocharger unit. Both cases are also presented in Figure 6.
For the engine operation with one turbocharger cut-out at loads below 25%, the blower activation provides more air amount, increases the trapped air within cylinder (as can been inferred by the values of air to fuel ratio at combustion), and subsequently improves the engine BSFC. For operating the engine with two turbochargers cut-out, the increase of the turbocharger speed and the scavenging receiver pressure as well as the respective rise of the cylinder compression and maximum pressures are more noticeable resulting in an improvement of BSFC at 20% load comparing with the normal engine operation case.
The total air to fuel ratio value is comparable with the values observed for the normal operating cases, however, the air to fuel ratio at combustion is higher, which means that the trapped air amount is greater. Since two blowers should be activated at this operating point where one turbocharger is cut-out, the electrical energy required by them should also be taken into consideration for selecting the best alternative. Besides that, the engine is commonly not recommended to operate with blower activation for a long period. Therefore, it is deduced that two turbochargers cut-out (out of three) without blower activation is superior to one turbocharger cut-out with blower activation at 20% load.
The cylinder pressure differences (scavenging receiver pressure minus cylinder pressure, cylinder pressure minus exhaust receiver pressure and scavenging receiver pressure minus exhaust receiver pressure) for engine operation at 20%, 15% and 10% loads and for the three investigated cases (without turbocharger cut-out and activated blowers, with one turbocharger cut-out and with two turbochargers cut-out) are shown in Figure 7. The total engine air mass flow and the cylinders trapped air mass depend on the pressure differences, the scavenging ports and exhaust valve effective areas as well as the scavenging receiver air density (which mainly depends on the scavenging receiver pressure). Therefore, both parameters are affected by the number of turbochargers cut-out and the blowers activation. The cylinder pressure difference reduces as the number of cut-out turbochargers increases, since the total turbine geometric area reduces (this effect is equivalent as closing a variable geometry turbine area). However, this increases the scavenging receiver pressure and as a result, the air density; therefore the effect in the total engine air flow is limited and it is also affected by the blowers activation, as it can be inferred by the values of the total air to fuel ratio shown in Figure 6. On the other hand, the influence of the turbocharger cut-out on the cylinders air trapped amount is quite evident as it is deduced by the increased values of air to fuel ratio at combustion (Figure 6).
The cylinder pressure difference decreases as the engine load reduces, as shown in Figure 7, and it will become negative even when two turbochargers are cut-out in case where the blowers are kept deactivated below 15% load. For the two-stroke engines, the negative value of the cylinder pressure difference is not allowed as only the positive value ensures that fresh air will continue entering the engine cylinders; otherwise the engine cannot operate. In addition, the scavenging receiver pressure also drops below 1.55 bar, which is the blower activation pressure limit set by the engine manufacturer. Therefore, the blowers must be activated to supply the required air amount at such low engine loads (in the region of 10% load).
As can be seen from Figure 7, the cylinder pressure difference with one or two turbochargers cut-out and with the assistance of blower activation reaches the respective values observed for the normal operation. At 20% and 15% loads, there is a clear drop of the cylinder pressure difference with two turbochargers cut-out in comparison to its counterparts for the cases of the engine normal operation and the operation with one turbocharger cut-out and blower activation. That leads to less air amount into the cylinder in the scavenging process and the consequential higher cylinder temperature in the open cycle as shown in Figure 8 for all the examined cases of engine operation. At 10% load, the in-cylinder temperature variations at open cycle are comparable with each other, since the blowers are activated and they supply the required fresh air. The in-cylinder temperature in the closed cycle becomes lower as two turbochargers are cut-out due to the fact that more air is trapped within the cylinder at the end of the compression process, as it is also inferred from the comparison of the air to fuel ratio at combustion shown in Figure 6.
Figure 7. Cylinder pressure difference at different conditions.
Energies 08 05738 g007
Figure 8. Cylinder temperature at different conditions.
Energies 08 05738 g008
Based on the above investigation, the proposed engine part load operation schedule is as follows:
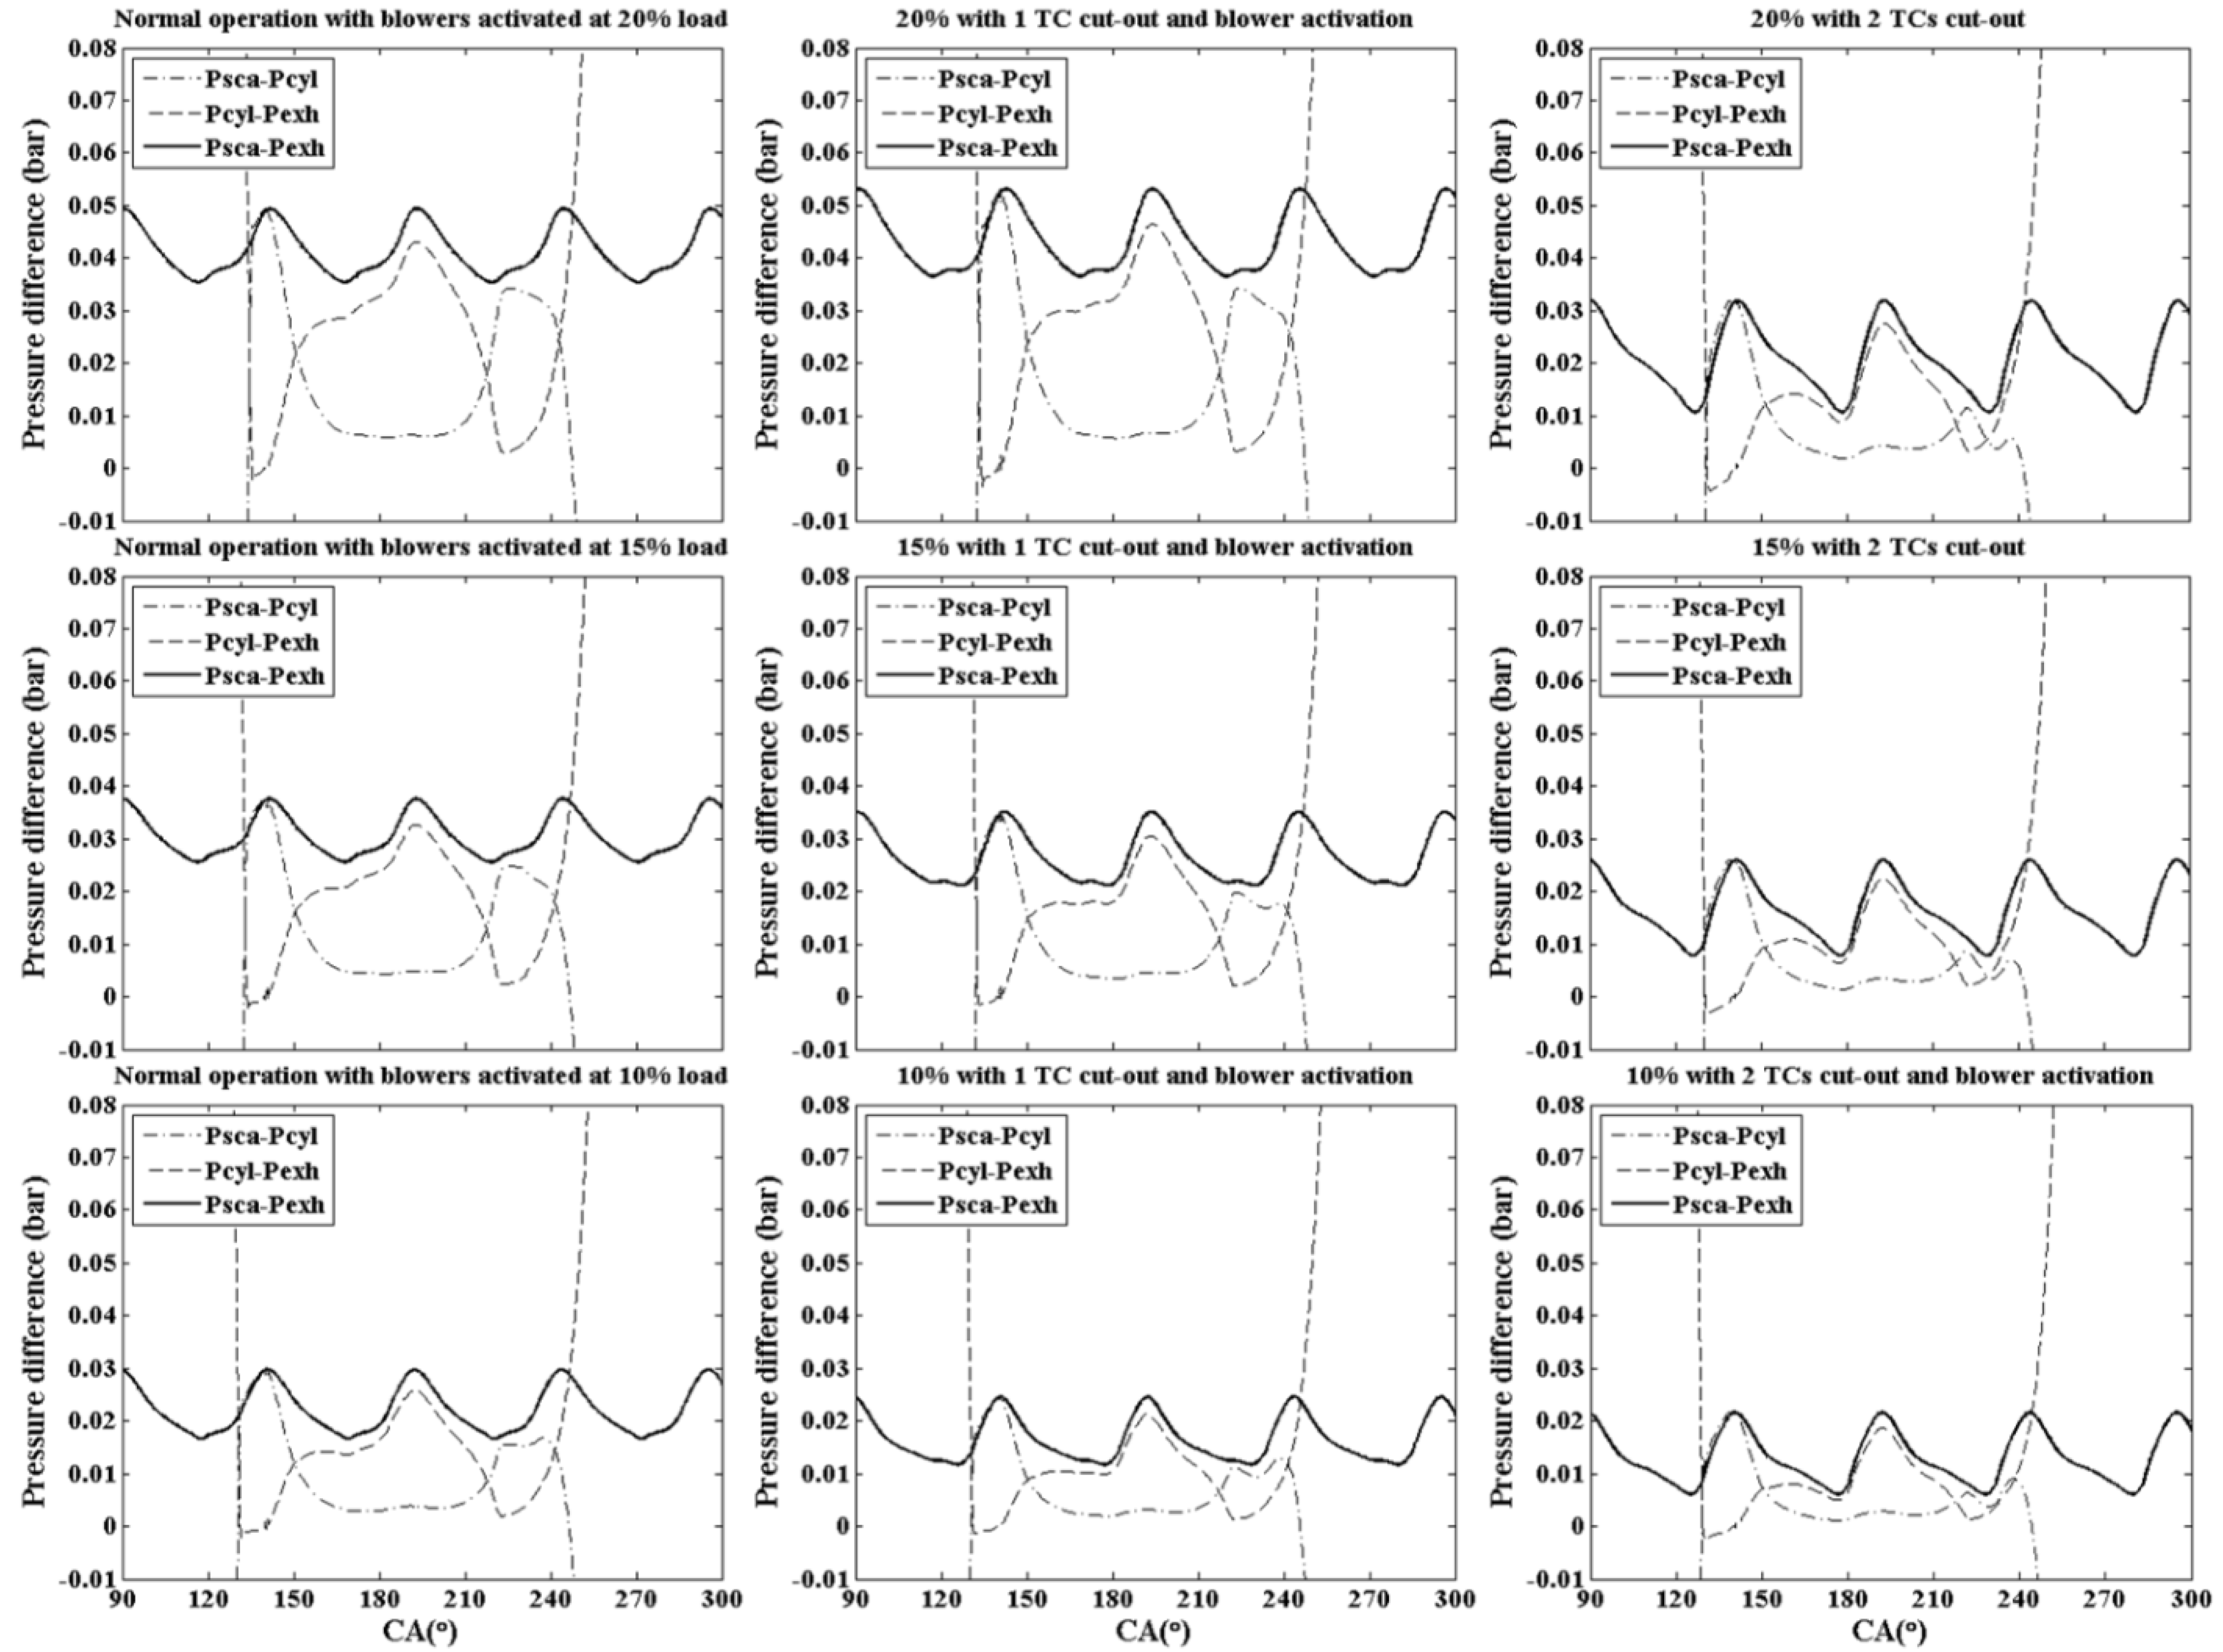
  • From 50% to 25% load, one turbocharger cut-out without blower activation.
  • From 20% to 15% load, two turbochargers cut-out without blower activation.
  • In the region of 10% load, two turbochargers cut-out with blower activation.
According to [52], the investigated engine is generally used as the main propulsion engine in panamax type container vessels with capacity in the range of 4500 TEU. As it is reported in [53], the ship speed profile of this ship type has been varied from 2009 to 2012 towards lower ship speeds. The respective average ship speed value was changed from 22 knots at 2009 to around 14 knots at 2012. Considering that the engine power and ship speed in containerships is approximately in accordance to a power law with exponent values from 3.5 to 4.5 [54], the engine operating profile shown in Figure 9 was estimated and used for the calculation presented below. Based on this Figure, it is deduced that the ship main engine usually operates at loads lower than 50%, and as a result, increasing the engine efficiency at the low load region is crucial for reducing the ship operating cost.
Figure 9. Engine operating profile of panamax vessels in 2012.
Energies 08 05738 g009
In order to analyse the fuel saving and CO2 emissions reduction potential, the fuel consumption during the ship annual operation was calculated for the following three cases: (a) the engine normal operation; (b) the engine operation with one turbocharger cut-out at loads lower than 50%; and (c) the proposed herein engine part load operation schedule. In addition, the annual CO2 emissions amount was estimated by using the CO2 emission factor (3.114 kg CO2/kg HFO) as proposed by IMO [55]. For the calculation presented below, it was assumed that the ship sails around 5900 h per year, which were estimated by excluding 10% and 25% of the total annual time for ship maintenance and port staying, respectively. The annual engine operating hours at each load were calculated by using the operating profile shown in Figure 9, whereas the engine brake specific fuel consumption was taken as function of the load and the operating mode from the data presented in Figure 6. The annual fuel consumption was calculated by using the following equation:
F C a = H a i = 1 n ( P O T i 100 B S F C I S O , i L H V I S O L H V H F O P b , i )
where Ha is the engine annual operating hours, POT is the percentage of operating time at a specific load, BSFCISO is the engine ISO corrected brake specific fuel consumption at this load, Pb is the engine brake power at this load, and i denotes the various engine loads according to the considered engine operating profile.
The calculation results for each operating strategy are presented in Figure 10. It must be noted that three blowers simultaneous operate under normal engine operating conditions; two blower units operate when one turbocharger unit is cut-out, whereas only one blower operates according the schedule recommended in this work. Since the same engine load profile was used in all the investigated cases, fuel savings are expected when the engine operates with one or two turbochargers cut-out due to the lower obtained engine BSFC as shown in Figure 6. Indeed, as it can be inferred from Figure 10, the engine operation with turbocharger cut-out can save annually up to 250 tonnes of fuel and reduce the CO2 emissions by 760 tonnes per year, which corresponds to approximately 2% fuel and CO2 emissions reduction compared with the normal operating mode.
Figure 10. Calculated annual fuel consumption (left) and CO2 emissions (right).
Energies 08 05738 g010
It seems that the engine operation with one turbocharger cut-out and the proposed engine operation strategy can achieve a similar improvement in terms of the total fuel consumption and CO2 emissions. However, the annual blowers operating time (per blower unit) is substantially reduced when the proposed turbocharger cut-out schedule is used as shown in Figure 11. This is expected to have a positive influence both to the maintenance cost and the electrical energy cost, as the electrical energy consumption needed for the operating blowers is very small for the case of the proposed turbocharger cut-out schedule due to the blowers limited operating hours.
Figure 11. Annual blowers operating time (per operating unit); Normal operation: three blowers operate; Operation with 1 TC cut-out: two blowers operate; Proposed engine operation: one blower operates.
Energies 08 05738 g011

4. Conclusions

The study of two stroke marine diesel engine operation was carried out at steady state conditions focusing on part loads using a modular zero-dimensional model implemented in the MATLAB/Simulink environment. The main conclusions drawn from the present investigation are summarized as follows.
The developed modular engine model is a very effective way of engine modelling since the components submodels can be easily replaced based on the specific purpose of investigation. The used zero-dimensional model proved its capability of adequately predicting the engine steady state performance including the in-cylinder parameters variation in the whole engine operating envelope down to the ultra-low load region with high accuracy. The model complexity is greater comparing with the MVEM alternative, but it is compensated by the model enhanced predictive ability.
For the case of engine normal operation at loads lower than 50% of MCR, the cylinder maximum pressure reduces drastically as scavenging receiver pressure decreases, leading to greater brake specific fuel consumption. In addition, the exhaust receiver temperature increases resulting in a higher thermal loading as engine load reduces since the engine air to fuel ratio becomes lower. As a consequence, the blowers activation is required at low load region ensuring a reliable engine operation. The blowers activation results in a significant increase of a number of engine parameters including the turbochargers speed, the scavenging pressure and the engine air amount. Therefore, the cylinder maximum pressure and the air to fuel ratio increase, which in turn, improves the engine brake specific fuel consumption and decreases the exhaust gas temperature, resulting in lower thermal loading of the engine and its components. As an alternative option, the turbocharger cut-out can achieve equivalent or slightly better results with regards to the fuel consumption. Based on the conducted analysis, the preferable engine operation scenario at part loads was found to be as follows: one turbocharger cut-out without blower activation is preferred for the engine operating region between 25% and 50% load; two turbochargers cut-out without blower activation is favoured when the engine operates between 15% and 20% load; two turbochargers cut-out with blower activation should be used at around 10% load.
The proposed turbocharger cut-out schedule can reduce the annual fuel consumption of a panamax containership operating at slow steaming conditions by approximately 2% with a similar reduction in the released CO2 emissions compared with the respective operation at slow steaming conditions without turbocharger cut-out. In addition, it can reduce the operating hours of the electric driven blowers and the associated electrical energy consumption. Therefore, a positive influence on the ship operating cost from both fuel and maintenance as well as the environment is expected.

Acknowledgments

The research work performed by Guan and Professor Chen was supported by the Programme of Introducing Talents of Discipline to Universities (Grant No. B08031), the Research Fund for the Doctoral Program of Higher Education of China (Grant No. 20100143110004), and the Natural Science Foundation of Hubei Province of China (Grant No. 2014CFB843).

Author Contributions

Cong Guan and Gerasimos Theotokatos contributed in equal parts to the establishment of the model, the calculation and the writing, whereby Hui Chen had some useful suggestions and been involved in the discussion and preparation of the manuscript.

Conflicts of Interest

The authors declare no conflict of interest.

Abbreviations

BL
Blower
BDC
Bottom Dead Centre
CA
Crank Angle
EVC
Exhaust Valve Close
EVO
Exhaust Valve Open
IMO
International Maritime Organization
ISO
International Organization for Standardization
MCR
Maximum Continuous Rating
MVEM
Mean Value Engine Model
SPC
Scavenging Port Close
SPO
Scavenging Port Open
TC
Turbocharger
TEU
Twenty-foot Equivalent Unit
VIT
Variable Injection Timing
VLCC
Very Large Crude Carrier

Latin Symbols

A
Area [m2]
BMEP
Brake Mean Effective Pressure [bar]
BSFC
Brake Specific Fuel Consumption [g/kW h]
cv
Specific heat at constant volume [J/kg K]
D
Cylinder bore [m]
h
Specific enthalpy [J/kg], heat transfer coefficient [W/m2 K]
Ha
Annual operating hours (h)
FAs
Stoichiometric fuel-air ratio [kg fuel/kg air]
FC
Fuel consumption (t)
I
Mass moment of inertia [kg m2]
k
Coefficient
LHV
Lower heating value [kJ/kg]
m
Mass [kg], combustion model constant
m ˙
Mass flow rate [kg/s]
N
Rotational speed [r/min]
p
Pressure [Pa]
Pb
Engine brake power [kW]
POT
Operating time percentage [%]
Q
Torque [Nm]
Q ˙
Heat transfer rate [W]
R
Gas constant [J/kg K]
t
Time [s]
T
Temperature [K]
u
Specific internal energy [J/kg]
V
Volume [m3]
w
Representative cylinder velocity (m/s)

Greek symbols

a
Combustion model constant
γ
Ratio of specific heats
Δθ
Crank angle duration (deg)
θ
Crank angle (deg)
λ
Air/fuel equivalence ratio
ξ
Burnt fuel fraction
φ
Fuel/air equivalence ratio

Subscripts

a
Air
cy
Cycle
cyl
Cylinder
exh
Exhaust
f
Fuel
fb
Burnt fuel
s
Stoichiometric
g
Gas
in
Inlet
IGD
Fuel injection delay
o
Reference point
out
Outlet
sca
Scavenging
sf
Surface
SOC
Start of combustion
SOI
Start of fuel injection

References

  1. Carolina, G.M.; Julio, R.; Maria, J.S. Modelling and forecasting fossil fuels, CO2 and electricity prices and their volatilities. Appl. Energy 2013, 101, 363–375. [Google Scholar]
  2. Zhang, C.; Chen, X. The impact of global oil price shocks in China’s bulk commodity markets and fundamental industries. Energy Policy 2014, 66, 32–41. [Google Scholar] [CrossRef]
  3. Zhang, Y.; Wang, Z. Investigating the price discovery and risk transfer functions in the crude oil and gasoline futures markets: Some empirical evidence. Appl. Energy 2013, 104, 220–228. [Google Scholar] [CrossRef]
  4. Alphaliner: Container Ship Charter Rates to Weaken in 2013. Available online: https://www.joc.com/comment/1601 (accessed on 5 December 2014).
  5. Mandavia, M.; Bureau, E.T. Shipping industry may confront another deluge of overcapacity. Available online: http://articles.economictimes.indiatimes.com/2014-04-02/news/48801359_1_great-eastern-shipping-essar-shipping-shipping-industry (accessed on 5 December 2014).
  6. Analysis: Global Shipping Contends with Oversupply Problems. Available online: http://www.stratfor.com/analysis/global-shipping-contends-oversupply-problems#axzz3L2lNkuZT (accessed on 5 December 2014).
  7. Gcaptain. BIMCO Reflections: Oversupply Will Delay Shipping Market Recovery. Available online: http://gcaptain.com/bimco-reflections-2014-shipping-industry-analysis/ (accessed on 5 December 2014).
  8. International Maritime Organisation (IMO). Air Pollution and Energy Efficiency-Estimated CO2 Emissions Reduction from Introduction of Mandatory Technical and Operational Energy Efficiency Measures for Ships; IMO: London, UK, 2011; MEPC 63/INF.2. [Google Scholar]
  9. Haglind, F. A review on the use of gas and steam turbine combined cycles as prime movers for large ships. Part III: Fuels Emiss. Energy Convers. Manag. 2008, 49, 3476–3482. [Google Scholar]
  10. Pappas, C.; Karakosta, C.; Marinakis, V.; Psarras, J. A comparison of electricity production technologies in terms of sustainable development. Energy Convers. Manag. 2012, 64, 626–632. [Google Scholar] [CrossRef]
  11. Wärtsilä. Marine Solutions, 2nd ed.; Wärtsilä: Helsinki, Finland, 2012; Publication no: SP-EN-DBAC136254. [Google Scholar]
  12. MAN Diesel & Turbo. Marine Engine IMO Tier II Programme 2013; MAN Diesel & Turbo: Augsburg, Germany, 2013; Publication no. 4510-0012-00ppr. [Google Scholar]
  13. Brown, D. Helping shipowners cut fuel bills with Wärtsilä low-speed engines. Wärtsilä Tech. J. Mar./InDetail 2009, 1, 34–37. [Google Scholar]
  14. MAN Diesel & Turbo. SFOC Optimization Methods for MAN B&W Two-Stroke IMO Tier II Engines; MAN Diesel & Turbo: Augsburg, Germany, 2012; Publication no. 5510-0099-00ppr. [Google Scholar]
  15. MAN Diesel & Turbo. Waste Heat Recovery System (WHRS) for Reduction of Fuel Consumption, Emissions and EEDI; MAN Diesel & Turbo: Augsburg, Germany, 2012; Publication no. 5510-0136-01ppr. [Google Scholar]
  16. Grljušić, M.; Medica, V.; Račić, N. Thermodynamic analysis of a ship power plant operating with waste heat recovery through combined heat and power production. Energies 2014, 7, 7368–7394. [Google Scholar] [CrossRef]
  17. Schmid, H. Less emissions through waste heat recovery. In Proceedings of the Green Ship Technology Conference, London, UK, 28–29 April 2004; Wärtsilä Corporation: Helsinki, Finland.
  18. MAN Diesel & Turbo. Slide Fuel Valve; MAN Diesel & Turbo: Augsburg, Germany, 2010; Publication no. 1510-0011-03ppr. [Google Scholar]
  19. MAN Diesel & Turbo. Operation on Low-Sulphur Fuels; MAN Diesel & Turbo: Augsburg, Germany, 2014; Publication no. 5510-0075-01ppr. [Google Scholar]
  20. ABS. Ship Energy Efficiency Measures; ABS: Houston, TX, USA, 2013; Publication no: TX 05/13 5000-13015. [Google Scholar]
  21. Armstrong, V.N. Vessel optimisation for low carbon shipping. Ocean Eng. 2013, 73, 195–207. [Google Scholar] [CrossRef]
  22. Wiesmann, A. Slow steaming-a viable long-term option? Wärtsilä Tech. J. Mar./InDetail 2010, 2, 49–55. [Google Scholar]
  23. Pierre, C. Is slow steaming a sustainable means of reducing CO2 emissions from container shipping? Transp. Res. Part D 2011, 16, 260–264. [Google Scholar]
  24. Alphaliner: Slow steaming absorbs capacity. Available online: http://www.transportjournal.com/en/home/news/artikeldetail/slow-steaming-absorbs-capacity.html (accessed on 5 December 2014).
  25. Gard, A.S. Slow steaming on 2-stroke engines. Available online: http://www.gard.no/ikbViewer/Content/8259/No%2003-09%20Slow%20Steaming%20on%202%20stroke%20engines.pdf (accessed on 5 December 2014).
  26. Schmuttermair, H.; Fernandez, A.; Witt, M. Fuel economy by load profile optimized charging systems from MAN. In Proceedings of the 26th CIMAC World Congress on Combustion Engine Technology, Bergen, Norway, 14–17 June 2010. Paper no. 250.
  27. Baechi, R. Slow steaming and turbocharger cut-out. ABB Charge 2012, 2, 20–21. [Google Scholar]
  28. Woodward, J.B.; Latorre, R.G. Modeling of diesel engine transient behaviour in marine propulsion analysis. Trans. Soc. Nav. Archit. Mar. Eng. 1984, 92, 33–49. [Google Scholar]
  29. Hendrics, E. Mean Value Modelling of Large Turbocharged Two-Stroke Diesel Engines, SAE Technical Paper no 890564. 1989. [CrossRef]
  30. Chesse, P.; Chalet, D.; Tauzia, X. Real-time performance simulation of marine diesel engines for the training of navy crews. Mar. Technol. 2004, 41, 95–101. [Google Scholar]
  31. Theotokatos, G. On the cycle mean value modelling of a large two-stroke marine diesel engine. Proc. IMechE Part M: J. Eng. Mar. Environ. 2010, 224, 193–205. [Google Scholar] [CrossRef]
  32. Katrašnik, T. Transient momentum balance-A method for improving the performance of mean-value engine plant models. Energies 2013, 6, 2892–2926. [Google Scholar] [CrossRef]
  33. Kyrtatos, N.P.; Koumbarelis, I. Performance prediction of next-generation slow speed diesel engines during ship manoeuvers. Trans. IMarE 1994, 106, 1–26. [Google Scholar]
  34. Finesso, R.; Spessa, E. A real time zero-dimensional diagnostic model for the calculation of in-cylinder temperatures, HRR and nitrogen oxides in diesel engines. Energy Convers. Manag. 2014, 79, 498–510. [Google Scholar] [CrossRef]
  35. Catania, A.E.; Finesso, R.; Spessa, E. Predictive zero-dimensional combustion model for DI diesel engine feed-forward control. Energy Convers. Manag. 2011, 52, 3159–3175. [Google Scholar] [CrossRef]
  36. Asad, U.; Tjong, J.; Zheng, M. Exhaust gas recirculation–zero dimensional modelling and characterization for transient diesel combustion control. Energy Convers. Manag. 2014, 86, 309–324. [Google Scholar] [CrossRef]
  37. Chmela, F.G.; Pirker, G.H.; Wimmer, A. Zero-dimensional ROHR simulation for DI diesel engines–A generic approach. Energy Convers. Manag. 2007, 48, 2942–2950. [Google Scholar] [CrossRef]
  38. Xiros, N. Robust Control of Diesel Ship Propulsion; Springer-Verlag London Ltd.: London, UK, 2002. [Google Scholar]
  39. Theotokatos, G.; Tzelepis, V. A computational study on the performance and emission parameters mapping of a ship propulsion system. Proc. IMechE Part M: J. Eng. Mar. Environ. 2015, 229, 58–76. [Google Scholar] [CrossRef]
  40. Livanos, G.A.; Papalambrou, G.; Kyrtatos, N.P.; Christou, A. Electronic engine control for ice operation of tankers. In Proceedings of the 25th CIMAC World Congress on combustion Engine Technology, Vienna, Austria, 21–24 May 2007. Paper no. 44.
  41. Guan, C.; Theotokatos, G.; Zhou, P.; Chen, H. Computational investigation of a large containership propulsion engine operation at slow steaming conditions. Appl. Energy 2014, 130, 370–383. [Google Scholar] [CrossRef]
  42. Hountalas, D.T.; Sakellaridis, N.F.; Pariotis, E.; Antonopoulos, A.K.; Zissimatos, L.; Papadakis, N. Effect of turbocharger cut out on two-stroke marine diesel engine performance and NOx emissions at part load operation. In Proceedings of the ASME 12th biennial conference on engineering systems design and analysis, Copenhagen, Denmark, 25–27 July 2014. ESDA2014-20514.
  43. Kyrtatos, N.; Glaros, S.; Tzanos, E.; Hatzigrigoris, S.; Dalmyras, F. Systematic evaluation of performance of VLCC engine, comparing service monitored data and thermodynamic model predictions. In Proceedings of the 27th CIMAC World Congress on Combustion Engine Technology, Shanghai, China, 13–16 May 2013. Paper no. 32.
  44. Heywood, J.B. Internal Combustion Engines Fundamentals; Mc-Graw-Hill: New York, USA, 1988. [Google Scholar]
  45. Watson, N.; Janota, M.S. Turbocharging the Internal Combustion Engine; MacMillan: London, UK, 1982. [Google Scholar]
  46. Merker, G.P.; Schwarz, C.; Stiesch, G.; Otto, F. Simulating Combustion; Springer-Verlag: Berlin, Germany, 2006. [Google Scholar]
  47. Klein, M. Single-Zone Cylinder Pressure Modeling and Estimation for Heat Release Analysis of SI Engines. Ph.D. Dissertation, Linköping University, Linköping, Sweden, 2007. [Google Scholar]
  48. Woschni, G. A Universally Applicable Equation for the Instantaneous Heat Transfer Coefficient in the Internal Combustion Engine, SAE Paper no 670931. 1967. [CrossRef]
  49. Ciulli, E. A Review of Internal Combustion Engine Losses. Part 2: Studies for Global Evaluations. Proc. Inst. Mech. Eng. 1992, 207, 229–240. [Google Scholar] [CrossRef]
  50. Merker, G.; Gerstle, M. Evaluation on Two Stroke Engines Scavenging Models, SAE Technical Paper no 970358. 1997. [CrossRef]
  51. MAN Diesel & Turbo. MAN B&W K98MC Project Guide: Two-Stroke Engines, 3rd ed.; MAN Diesel & Turbo: Augsburg, Germany, 2002. [Google Scholar]
  52. MAN Diesel & Turbo. Propulsion Trends in Container Vessels; MAN Diesel & Turbo: Augsburg, Germany, 2013; No. 5510-0040-02ppr. [Google Scholar]
  53. Banks, C.; Turan, O.; Incecik, A.; Theotokatos, G.; Izkan, S.; Shewell, C.; Tian, X. Understanding ship operating profiles with an aim to improve energy efficient ship operations. In Proceedings of the Low Carbon Shipping Conference, London, UK, 9–10 September 2013.
  54. MAN Diesel & Turbo. Basic Principles of Ship Propulsion; MAN Diesel & Turbo: Augsburg, Germany, 2011; No. 5510-0004-02ppr. [Google Scholar]
  55. International Maritime Organisation (IMO). Third IMO GHG Study; IMO: London, UK, 2014; MEPC 67/INF.3. [Google Scholar]

