Article

Effects of Urbanization-Induced Cultivated Land Loss on Ecosystem Services in the North China Plain

1
Key Laboratory of Land Surface Pattern and Simulation, Institute of Geographic Sciences and Natural Resources Research, Chinese Academy of Sciences, Beijing 100101, China
2
Center for Chinese Agricultural Policy, Chinese Academy of Sciences, Beijing 100101, China
*
Author to whom correspondence should be addressed.
Energies 2015, 8(6), 5678-5693; https://doi.org/10.3390/en8065678
Submission received: 2 February 2015 / Revised: 18 March 2015 / Accepted: 24 March 2015 / Published: 15 June 2015
(This article belongs to the Special Issue Large Scale LUCC, Ecosystem Service, Water Balance and Energy Use)

Abstract

:
Since the implementation of market oriented economic reform in 1978, China has been on the track of rapid urbanization. The unprecedented urbanization in China has resulted in substantial cultivated land loss and rapid expansion of urban areas. The cultivated land loss due to urbanization not only threatens food security in China, but has also led to ecological system degradation to which close attention should be paid. Therefore, we examined the effects of the conversion from cultivated to urban areas on the ecosystem service in the North China Plain on the basis of a net primary productivity based ecosystem service model (NESM) and a buffer comparison method. Cultivated land loss due to urbanization in the North China Plain led to a total loss of ecosystem service value of 34.66% during the period 1988–2008. Urban expansion significantly decreased the ecosystem service function of water conservation (–124.03%), nutrient cycling (–31.91%), gas regulation (−7.18%), and organic production (–7.18%), while it improved the soil conservation function (2.40%). Land use change accounted for 57.40% of the changes in ecosystem service and had a major influence on the changes in nutrient cycling and water conservation. However, climate change mainly determined the changes in gas regulation, organic production, and soil conservation.

1. Introduction

Humankind is entering an urban era [1,2], and the average urbanization rate of the world is projected to be 67.2% in 2050 [3]. Urban areas will therefore become the major living environment for most of the world’s population in the future [4,5,6,7]. Currently, urbanization in most developed countries is almost complete; i.e., almost 80% of Europeans already live in urban areas [4], and the urbanization rate in the United States has reached 81.28% [8]. However, most developing countries are on the track of rapid urbanization [6,9,10].
In 1978, the Chinese government launched market oriented economic reform, namely, the Open Door Policy. Since then, urbanization in China has accelerated at an unprecedented speed. The urbanization rate in China increased to 53.7% in 2013 from 17.9% in 1978 [11]. This trend is projected to continue in the next few decades, and over 65% of the Chinese population will live in urban areas in 2050 [12,13].
Urbanization inevitability leads to the expansion of urban areas [14,15,16]. For example, the total global urban area quadrupled during the period 1970–2000 [17]. Urban areas in developing countries are projected to increase from to 300,000 km2 in 2000 to 770,000 km2 in 2030, and 1,200,000 km2 in 2050 [18]. In the 1990s, the urban areas of 145 cities in China expanded by 39.8% [19]. Because of the close location of cultivated land to urban areas, urban expansion usually results in the loss of a large amount of cultivated land. During the period 1986–2003, urban expansion in China occupied more than 33,400 km2 of cultivated land, accounting for 21% of total cultivated land loss [20].
Many negative effects of urbanization have been well documented, such as resource removal [21], the decrease in native biodiversity [22,23,24], the urban heat island effect [25,26], and air and water pollution [27,28,29]. Ecological system degradation is a significant problem [30,31]. Urbanization influences the ecosystem service by converting agricultural land to built-up areas [29,32,33,34]. Many researchers have taken note of this, and assessed the changes in ecosystem service in response to urbanization. For example, Long et al. [35] assessed that the ecosystem service value (ESV) of the Tianjin Binhai New Areas decreased by 25.9% between 1985 and 2010 due to the conversion from ecological land to construction land. Su et al. [36] found that changes in ESVs were negatively correlated with urbanization indicators in Shanghai, China. The research of Lin et al. [37] showed that urbanization in the island city of Xiamen, China resulted in a decrease in the ESV and significantly changed the landscape.
Although great efforts have been made in assessing the effects of urbanization on ecosystem service, there are still many knowledge gaps in this field. First, the proxy method is usually adopted to assess the ESV, which generates great uncertainties. The proxy method pre-assigns to each land use type an invariable ESV regardless of the spatial heterogeneity. In fact, even in a small region, the ESV of the same kind of land use type usually varies according to the physiographic conditions. For example, the ESV of cultivated land in flat areas is usually different from that in hilly areas. Second, many ESV models can dynamically assess the spatial heterogeneity of ESV but fail to distinguish the effects of climate change and land use change on ESV [38,39,40], for example, the InVEST (Integrated Valuation of Ecosystem Services and Tradeoffs), which is a suite of software models used to map and value the goods and services from nature that sustain and fulfill human life [41]. Last, the effects of cultivated land loss on ESV induced by urbanization were paid less attention.
Considering these knowledge gaps, we developed a net primary productivity (NPP) based ecosystem service model (NESM) [42,43] and a buffer comparison method to quantitatively assess the effects of cultivated land conversion on ESV in the process of urbanization. Specifically, the purposes of this paper are to: (1) examine the urban expansion and consequent cultivated land loss in the North China Plain (NCP) between 1988 and 2008; (2) assess the changes in ESV that resulted from the conversion from cultivated land to urban areas; and (3) separate the effects of land use change from climate change on ESV.

2. Study Area and Data Sources
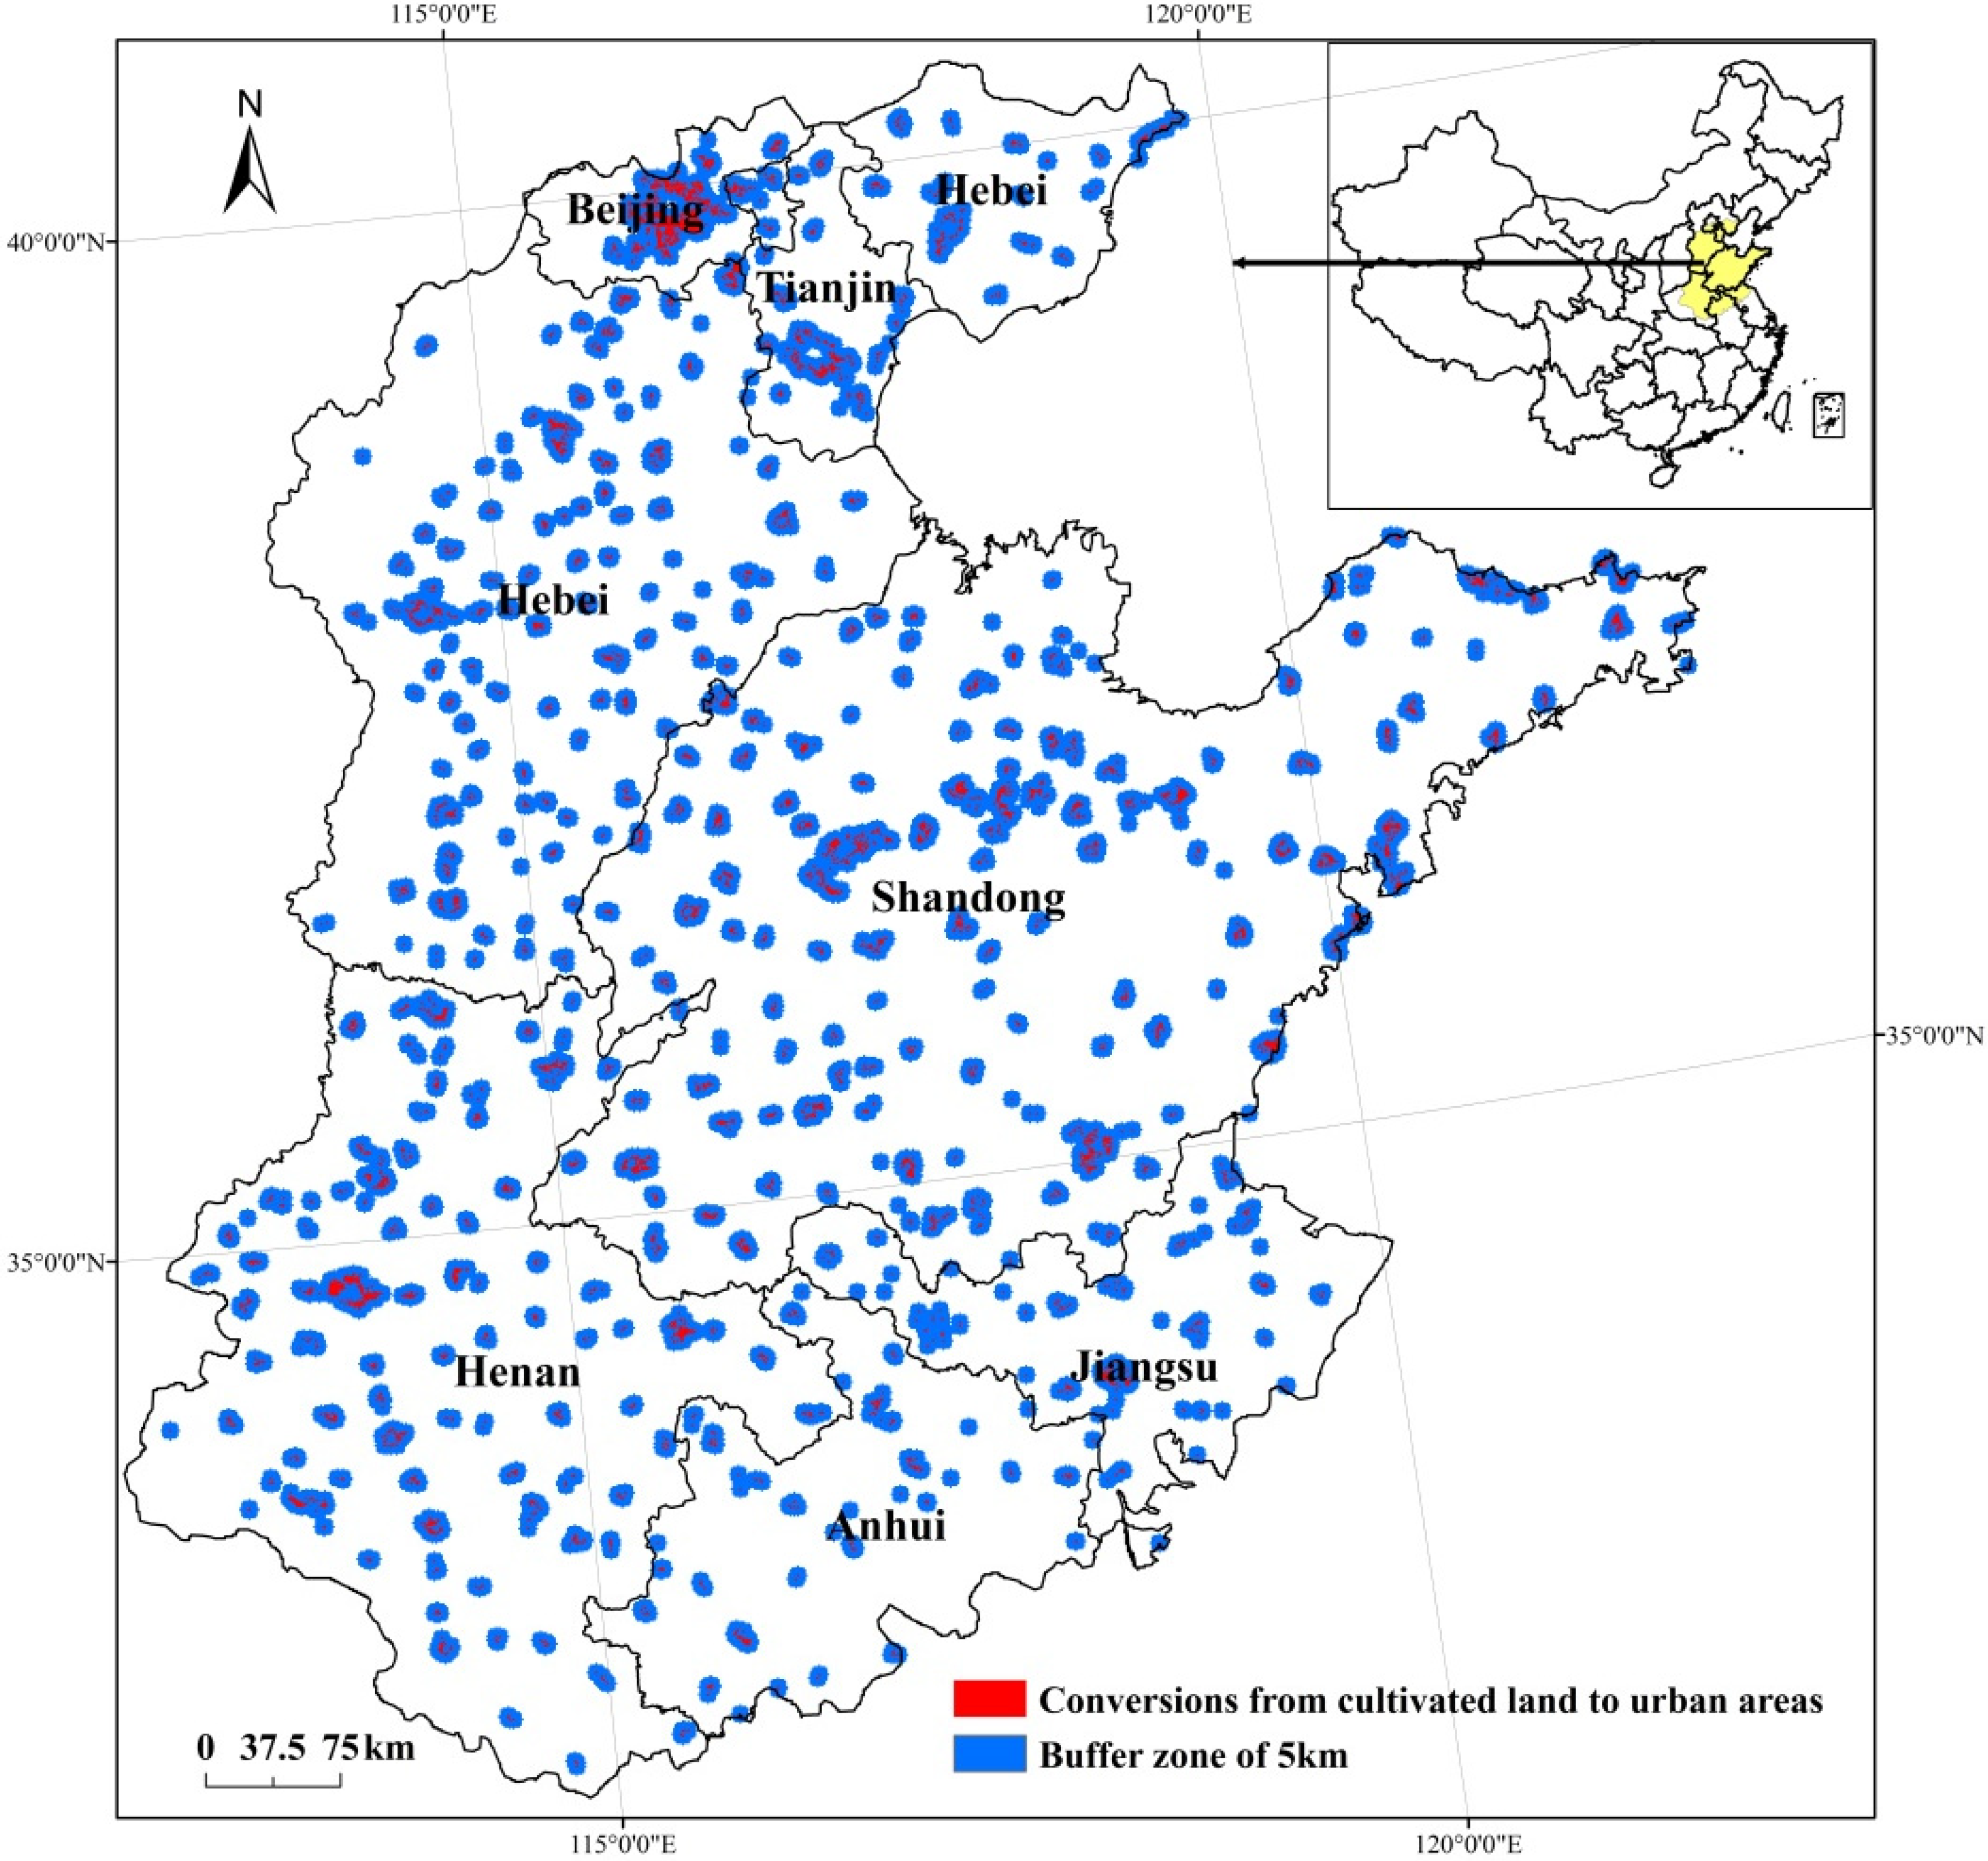
2.1. Study Area

The NCP is the largest alluvial plain in Eastern Asia, formed by sediment deposits from the Yellow River. It is located between 112°48'–122°45'E and 32°00'–40°24'N (Figure 1). The NCP covers an area of over 440,000 km2, most of which is less than 50 meters above sea level. It is the largest wheat belt in China, accounting for more than 60% of China’s wheat production. Because of the flat topography, the NCP has experienced fast urbanization in recent decades.
Figure 1. Cultivated land loss and buffer zone in the NCP between 1988 and 2008.
Energies 08 05678 g001

2.2. Data Sources

Two raster land use maps in 1988 and 2008 are utilized to analyze the urban expansion and cultivated land loss in the NCP. The maps were provided by the Data Center for Resources and Environmental Sciences, Chinese Academy of Sciences (RESDC) [44,45,46]. The overall accuracy of the land use maps is over 95% [46].
The NPP data utilized in this paper are from NASA’s EOS (Earth Observing System)/MODIS (Moderate Resolution Imaging Spectroradiometer). MODIS is a key instrument aboard the Terra (EOS AM) and Aqua (EOS PM) satellites. The normalized difference vegetation index (NDVI) data are from the vegetation data of SPOT (Satellite Pour l’Observation de la Terre) which is a commercial high-resolution optical imaging Earth observation satellite system operating from space. The climate data are collected from China’s Meteorological Data Sharing Service System. The soil map, including attributes of nutrient and soil texture, is from the second soil survey of the 1980s in China. The actual evapotranspiration data are from the Data Sharing Infrastructure of Earth System Science, China. The spatial resolution of these maps is 1 km except for the actual evapotranspiration map (about 850 m). The temporal resolution of the vegetation and climate inputs are all annual values in 1988 and 2008.

3. Methodology

3.1. NPP-Based Ecosystem Service Model

Ecosystem services in the NCP were assessed by the NESM developed by Song et al. [42,43]. The NESM can quantify and map the distribution of ecosystem services under alternative scenarios. NESM’s multi-service design provides an effective tool for exploring the likely outcomes of alternative management and climate scenarios and for evaluating tradeoffs among services.
In total, five kinds of ecosystem services were designed in NESM: organic material production, nutrient cycling, soil conservation, water conservation, and gas regulation. NESM’s detailed parameters are shown in Table 1. For convenient calculations and simple data requirements, NESM can quickly update and map an ecosystem service.
Many parameters (such as NPP and vegetation coverage) in the model can be either calculated by the users or directly downloaded from the Internet database (e.g., products of MODIS and SPOT). Other parameters (e.g., the conversion coefficient from biochar to organic material, the ratio of runoff generated from precipitation) could be acquired from previous research. The amount of soil erosion and the actual evapotranspiration are two vital parameters of the model. NESM can automatically calculate the soil erosion amount using the universal soil loss equation in accordance with the data input in Table 1. However, the model was not designed for the complicated calculation process needed to calculate the actual evapotranspiration. Users need to generate this data input themselves.
Most of the parameters have obvious spatial variations. However, because of the lack of reliable data, we utilized a unified parameter in the whole NCP for several parameters, such as the distribution rate of nutrient elements in organic material, the ratio of runoff generated from precipitation and the coefficient of reducing runoff compared to bare land.
Table 1. Parameters and data requirement of the NPP based ecosystem service model.
Ecosystem serviceData requirements
Organic material productionNPP, the conversion coefficient from biochar to organic material, price of standard coal
Nutrient cyclingNPP, distribution rate of nutrient elements in organic material, conversion coefficients of nutrient elements to corresponding chemical fertilizer, price of chemical fertilizer, land use map
Soil conservation Digital elevation model, precipitation, soil texture, soil organic carbon, soil nutrients, soil density, soil thickness, cost of reservoir construction, vegetation coverage, economic benefit of forest planting, price of chemical fertilizer, land use map
Water conservationPrecipitation, actual evapotranspiration, cost of reservoir construction, ratio of runoff generated from precipitation, the coefficient of reducing runoff compared to bare land, cost of reservoir construction, land use map
Gas regulationNPP, parameter of absorbing carbon dioxide when producing 1 g dry matter, parameter of producing oxygen when producing 1 g dry matter
Notes: NPP is the Net Primary Productivity.

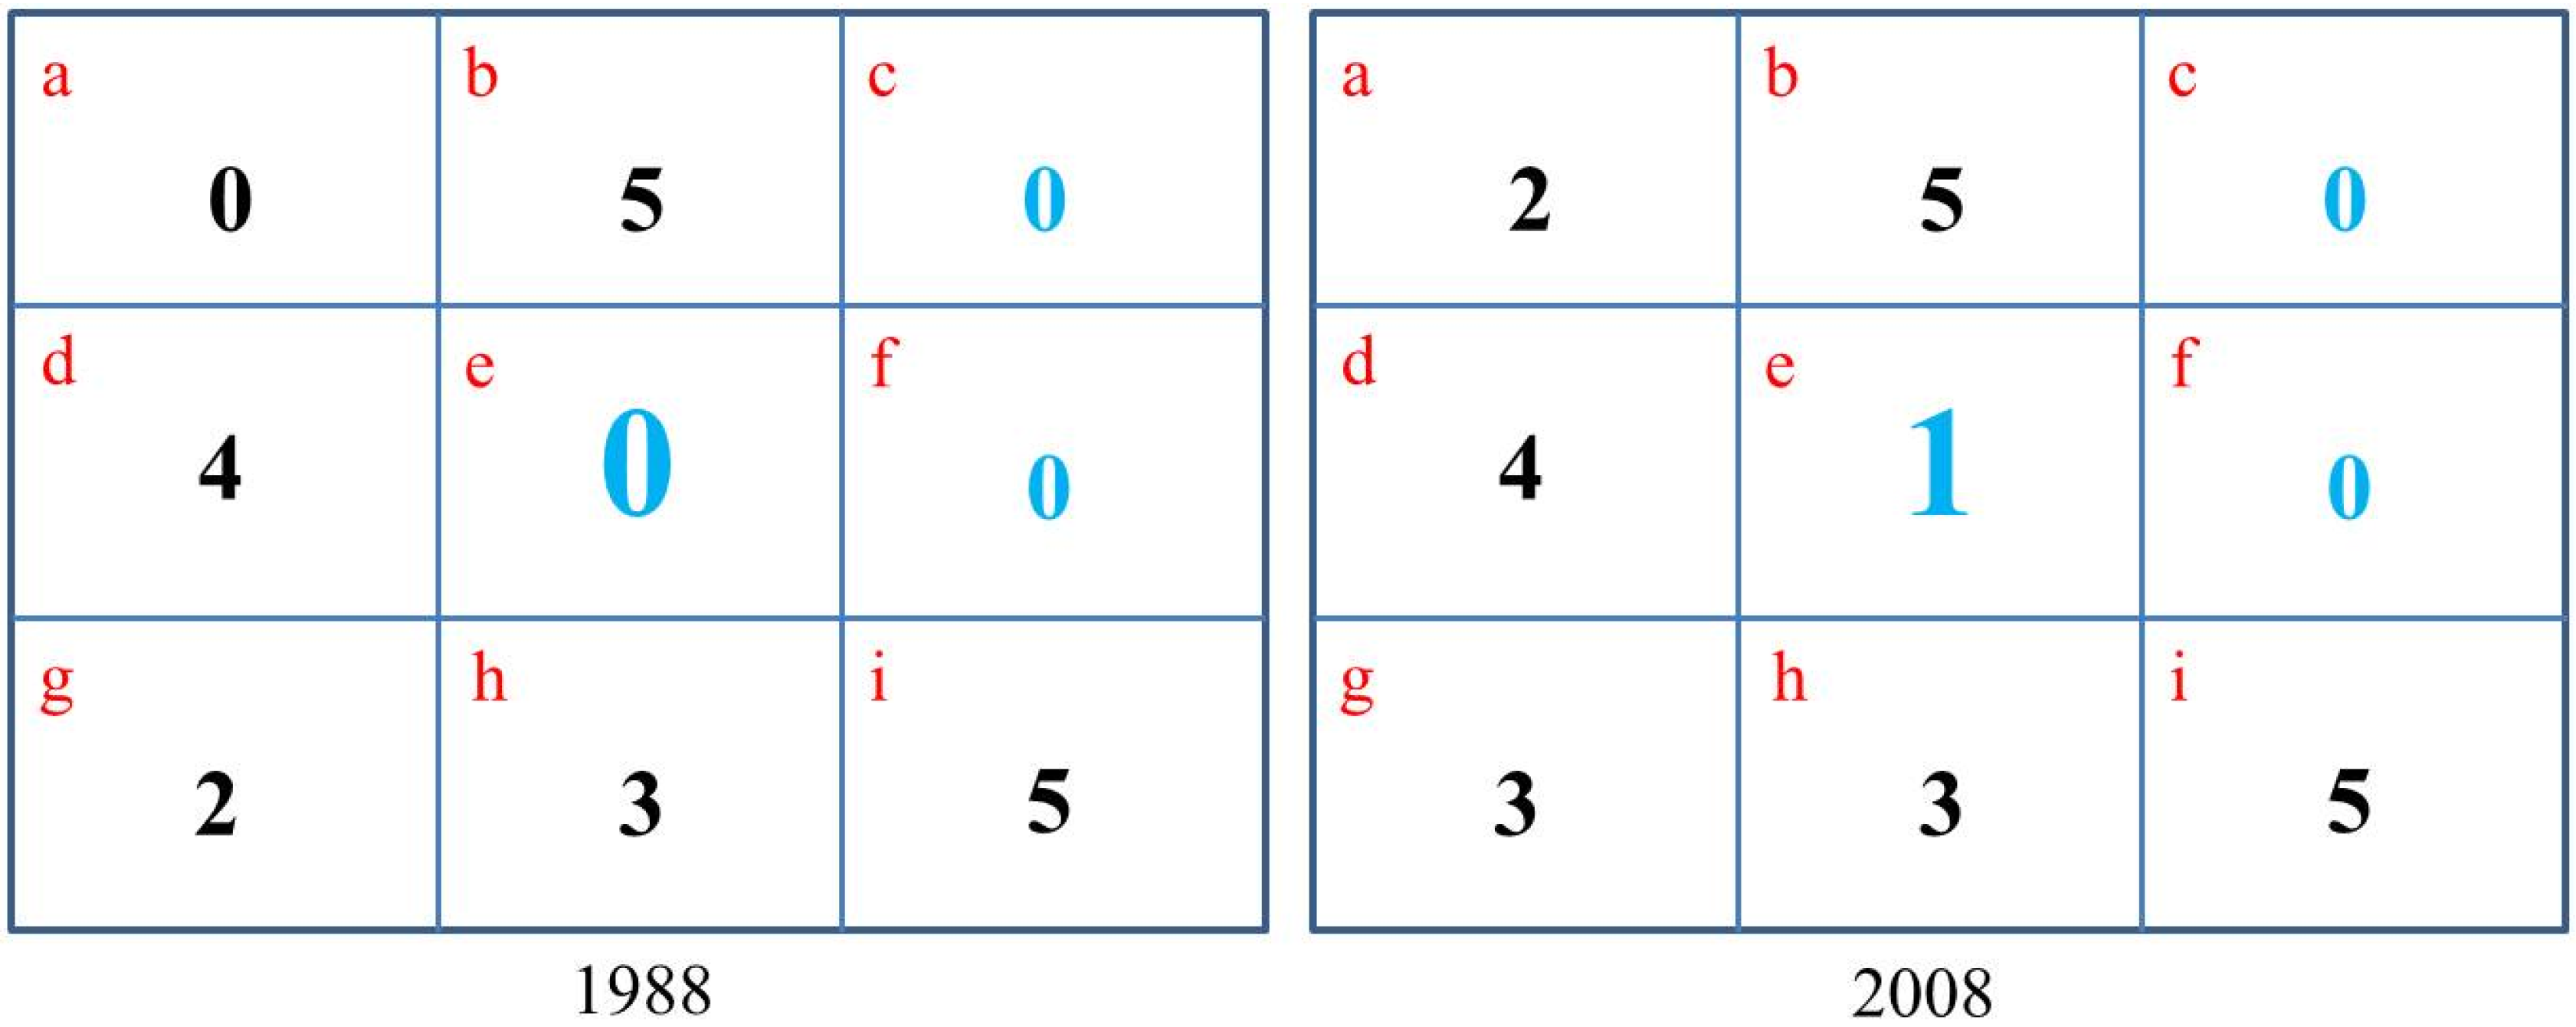
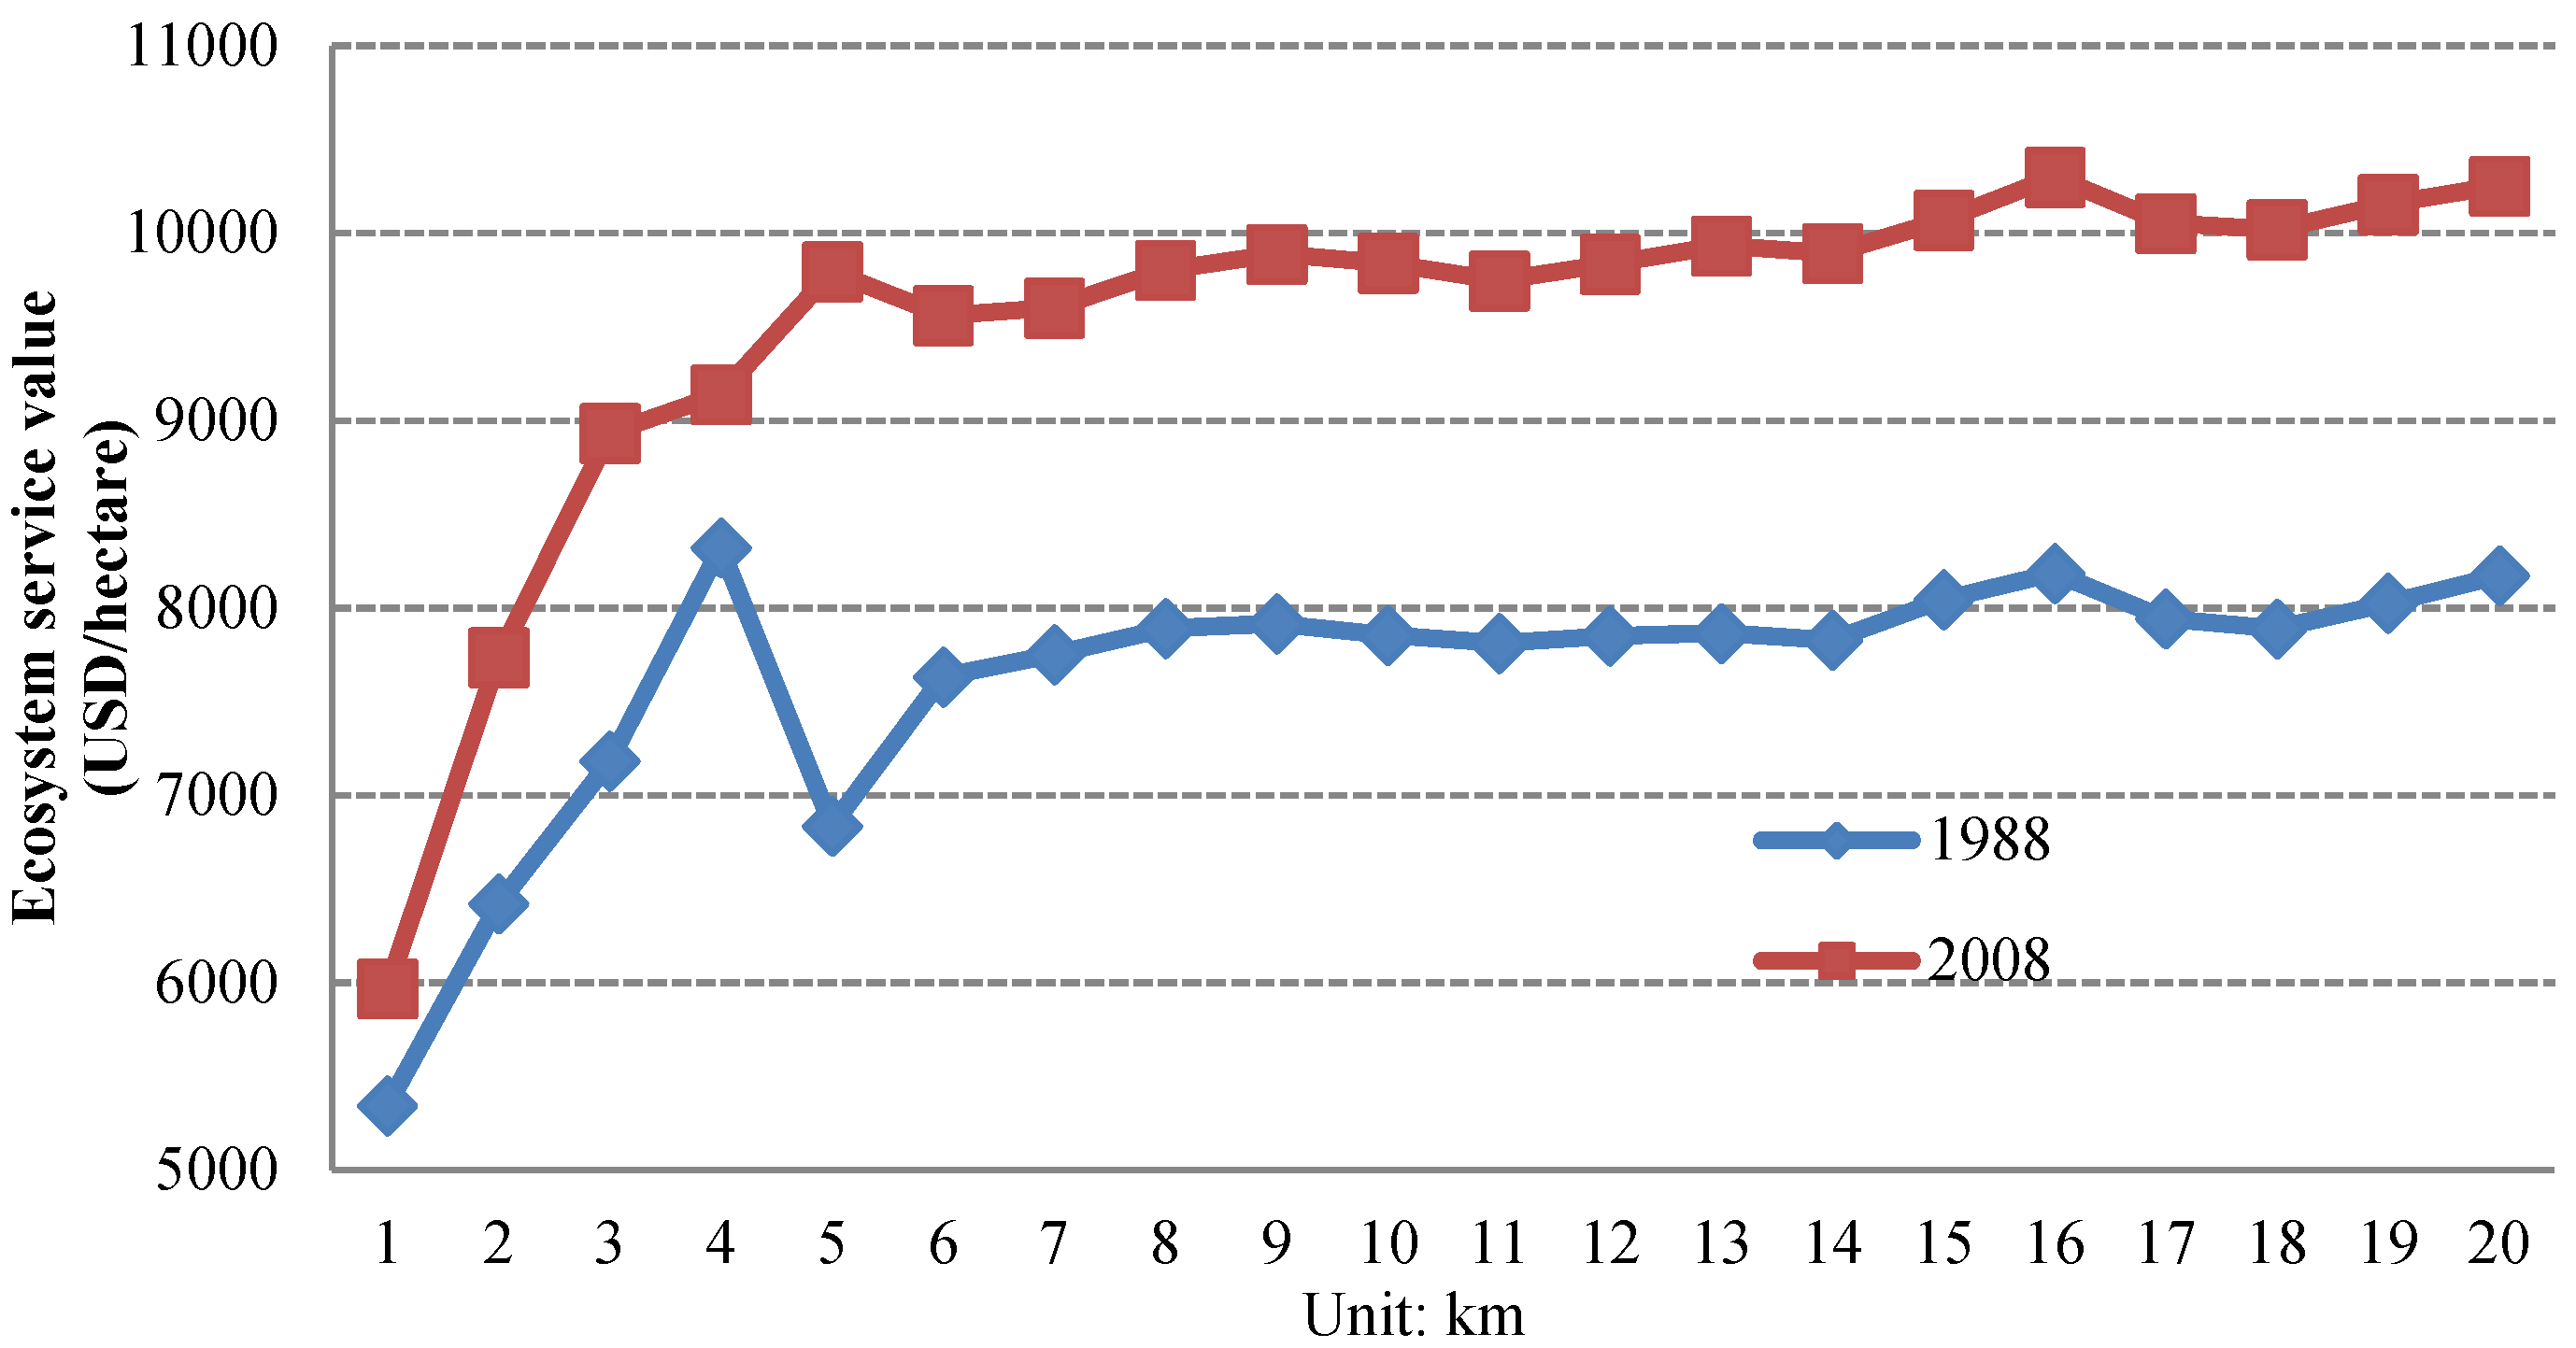
3.2. Buffer Comparison Method

Using NESM and the required data input, we can map the ESV under different land use and climate scenarios. However, whether the changes in ESV were as a result of land use change or climate change is not known. To solve the problem, we developed a buffer comparison method.
As shown in Figure 2, numbers 0 to 5 represent different land use types i.e., cultivated land, urban areas, forestry areas, water areas and unused land, respectively, while letters a to i represent land use pixels in different locations. During the period 1988–2008, pixel e was converted from cultivated land to urban areas. The changes in ESV in pixel e are the combined effects of land use and climate change. However, pixels c, d, f, h, and i did not undergo land use changes from 1988 to 2008. Climate change itself determines the changes in ESV. In other words, changes in ESV in pixels c, d, f, h, and i are the consequences of climate change.
In 1988, pixels c, e, and f were all cultivated land (Figure 2). Since climate is highly auto correlated in adjacent pixels, we assumed that the physical geography conditions and climate change in pixels c, e and f were the same due to the close location. The change in the percentages of ESV resulting from the climate in pixel e should be equal to that of pixel c and f. Thus, we assessed the effects of climate change on ESV in pixel e, i.e., the average change percentage in ESV of pixels c and f. Subtracting the average percentage changes in pixels c and f (ESV changes due to climate change) from the actual change percentage in pixel e (combined influences of land use and climate change), we can calculate that the ESV changes resulted from land use change in pixel e.
Figure 2. The mechanism distinguishing the effects of land use change from climate change on ESV.
Energies 08 05678 g002
How to determine the buffer distance is the next problem. If the buffer distance is too close, we may not find the same unchanged land use type (e.g., pixels c and f in Figure 2) in 1988. In addition, the errors in land use classification could generate interference on the result. If the buffer distance is too far, the physical geography conditions and climate changes in these pixels could be significantly different from that in pixel e (Figure 2). To solve the problem, we assessed the sensitivity of the ESV change to the buffer distances (Figure 3). It was found that the ESV of cultivated land has a significant inflection point at the distance of 5 km. This means that the physical geography conditions and climate change within 5 km are similar to that of the converted areas, while significant differences exist beyond 5 km. Thus, we decided to create a 5 km buffer zone to ascertain the unchanged cultivated land in the period 1988–2008 which could provide a reference for the effects of climate change on ESV. Compared to the ESV in 1988, the ESV in 2008 in different buffer zones significantly increased. Since the buffer zones did not undergo land use changes during the period 1988–2008, the significant increase in ESVs in the buffer zones is the effect of climate change, i.e., the changes in temperature, precipitation etc.
Figure 3. Sensitivity of ESV changes in response to buffer distances in the NCP for both 1988 and 2008.
Energies 08 05678 g003

3.3. Assessments of Contributions of Land Use and Climate Change in Driving ESV Change

Based on the buffer comparison method, we further developed an equation to distinguish the contributions of land use and climate change on ESV.
C e l u c c = C P a c t C P b z
C c l u c c = | C e l u c c | | C e l u c c | + | C P b z |
Cccc=100%−Cclucc
where Celucc is the effects of land use change on ESV; Cclucc is the contribution of land use change in driving ESV change; CPact is the actual change percentage in ESV in converted areas, i.e., areas converted from cultivated land to urban areas during the period 1988–2008; CPbz is the change percentage in ESV in the buffer zone; and Cccc is the contribution of climate change in driving ESV change.

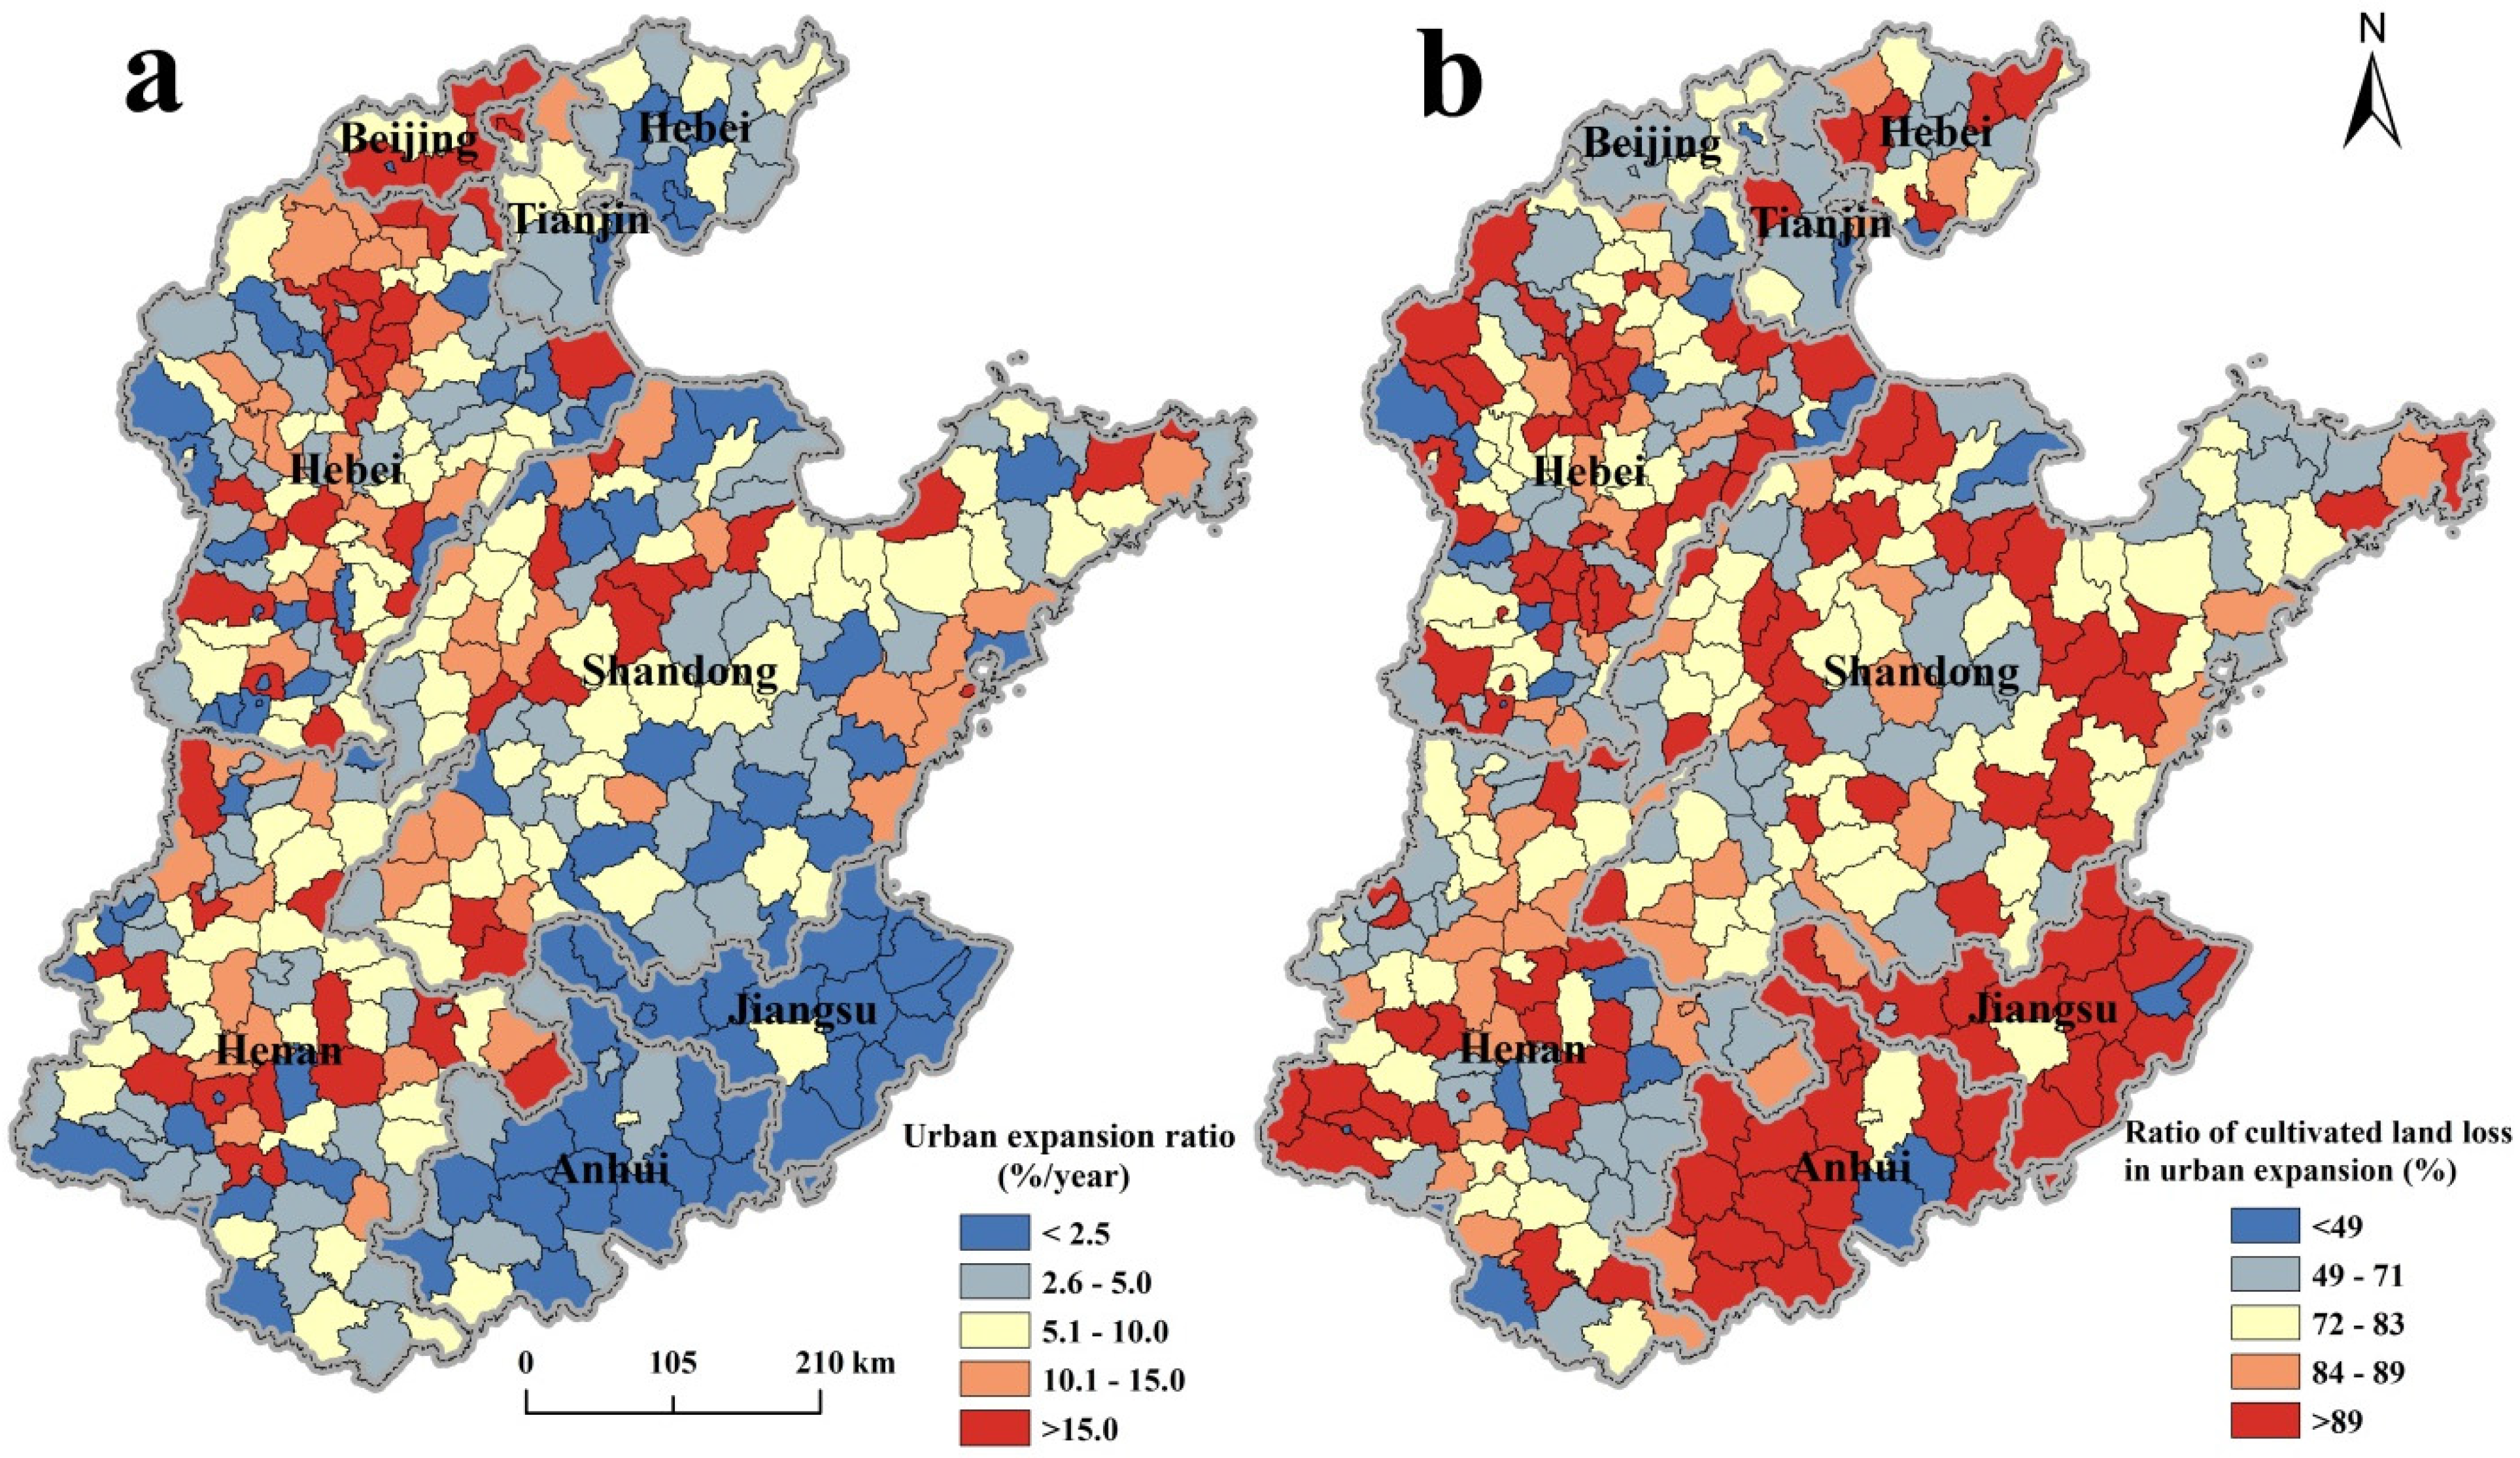
3.4. Urban Expansion Rate and Cultivated Land Loss Ratio in Urban Expansion

To describe the expansion of urban areas and the corresponding cultivated loss in the NCP, we defined indicators of urban expansion rate and cultivated land loss ratio in urban expansion.
U E R = U A e n d U A s t a r t U A s t a r t × 1 T 100 %
where UER is the urban expansion rate; UAend is the urban area at the end of the research period; UAstart is the urban area at the start of research period; and T is the number of years in the research period.
C L L E = L L E U A e n d U A s t a r t × 100 %
where CLLE is the cultivated land loss ratio in urban expansion and LLE is the area of cultivated land occupied by urban expansion.

4. Results

4.1. Cultivated Land Loss Due to Urbanization in the NCP

Urban areas in the NCP increased to 12,648 km2 in 2008 from 6,036 km2 in 1988, with a change percentage of 108.54%. The urban expansion rate in the NCP reached 5.43%/year. Urban areas expanded faster in the Western NCP, i.e., regions around Beijing, central Hebei, central Henan, and northwestern Shandong, with urban expansion rates over 15%/year (Figure 4). Urban expansion rates are lower in the southeastern NCP, i.e., regions in the northern Anhui and Jiangsu Province. Most of the urban expansion rates in these areas were less than 2.5%/year during the period 1988–2008 (Figure 4).
Figure 4. (a) Urban expansion rate and (b) cultivated land loss ratio in urban expansion in the NCP during the period 1988–2008.
Energies 08 05678 g004
The ratio of cultivated land loss in urban expansion reached 76.48% in the NCP between 1988 and 2008. In addition, about 19.89% of the expanded urban areas were converted from other construction land (i.e., rural settlement, industrial and mining land), 0.75%, 1.19%, and 1.36% from forestry areas, grasslands, and water areas, respectively. Cultivated land contributed to most of the expanded urban areas. The spatial pattern of cultivated land loss ratio in urban expansion is the opposite of that of the urban expansion rate. The ratio of cultivated land loss in urban expansion is higher in the southeastern NCP, ranging from 90% to 100% (Figure 4). Urban expansion consumes less cultivated land in the western NCP, with a ratio of cultivated land loss lower than 60%.
Urban areas in the southeastern NCP are usually embraced by cultivated land due to the flat terrain. When urban areas expanded, much cultivated land was consumed in this region. However, the western NCP is mainly a hilly region. In spite of the cultivated land, many forestry areas and grasslands were close to urban areas. Thus the urban expansion in the western NCP resulted in a lower cultivated land loss ratio than that in the southeastern NCP.

4.2. Actual Changes in ESV in the Conversions from Cultivated Land to Urban Areas

The value of the total ecosystem service of converted cultivated land in 1988 was about 3911.17 USD/ha (e.g., in 2008 in USD) (Table 2). The value percentages of nutrient cycling, water conservation, gas regulation, provision of organic production, and soil conservation were 0.32%, 22.77%, 15.69%, 51.17%, and 10.05%, respectively. After the conversion from cultivated land to urban areas, the value of the total ecosystem service decreased by 8.94% (349.33 USD/ha) between 1988 and 2008. Three kinds of ecosystem services presented a decreasing trend, while two ecosystem services increased.
Table 2. Actual changes in ESV in the NCP during the period 1988–2008.
Ecosystem serviceESV in (USD/ha)Value change (USD/ha)Change percentage (%)
19882008
Total ecosystem service3911.173561.84−349.33−8.94
Nutrient cycling12.3310.961.37−3.18
Water conservation890.460.00−890.46−100.00
Gas regulation613.73746.62132.8821.54
Organic production2001.482431.64431.5321.54
Soil conservation393.17372.62−20.55−5.50
Notes: The ESV of water conservation in 2008 and the change in the percentage of water conservation between 1988 and 2008 are rounded to two decimal places. In fact, they are not just 0.00 and −100.00, respectively.
The ecosystem service of water conservation vanished (decreased by 100.00%) when cultivated land was converted to urban areas. The ESV of soil conservation and nutrient cycling also decreased by 5.50% and 3.18%, respectively. However, the ESV of gas regulation and organic production increased by 21.54% and 21.54%, respectively. The changes in ESV are the combined results of climate and land use change.

4.3. Effects of Land Use Change on ESV

According to Equation (1), we assessed the effects of land use change on ESV when cultivated land was converted to urban areas. Land use change led to the overall decrease of ESV except for soil conservation (Table 3). Urban expansion almost resulted in the complete loss of water conservation. As a result of the increase in water conservation due to climate change, land use change totally led to the decrease of 124.03% in water conservation. The ecosystem service of nutrient cycling, gas regulation, and organic production also decreased by 31.91%, 7.18%, and 7.18%, respectively. However, urban expansion improved soil conservation with an increase in ESV of 2.40%.
Table 3. Effects of climate and land use change on ESV in the NCP between 1988 and 2008.
Ecosystem serviceActual change (%)Effects of climate change (%)Effects of land use change (%)
Total ecosystem service−8.9425.72−34.66
Nutrient cycling−3.1828.73−31.91
Water conservation−100.0024.03−124.03
Gas regulation21.5428.73−7.18
Organic production21.5428.73−7.18
Soil conservation−5.50−7.902.40
Notes: The actual change percentage of water conservation in the period 1988–2008 is rounded to two decimal places. In fact, it was not just as −100.00%.
Land use change significantly reduced the total ecosystem service value in the central NCP (decreased by 43%–100%), while it increased the ESV in the western NCP (ranging from 15% to 128%) (Figure 5). Except for several regions in the northwest, all water conservation decreased by over 100% in the NCP. Soil conservation was improved in 65.28% of the counties in the NCP due to urban expansion. The increase in soil conservation is particularly significant in the eastern NCP, i.e., Shandong Peninsula. However, it decreased remarkably in the southwestern NCP (Figure 5).
Figure 5. Percentage change in ESV induced by land use change in the NCP.
Energies 08 05678 g005
Organic material production and gas regulation decreased in 70.91% of the counties in the NCP, while nutrient cycling decreased in over 98%. The decrease in nutrient cycling is more significant than that of organic production and gas regulation. The decrease in nutrient cycling is greater in the central NCP than in the western NCP. The regions in which gas regulation and organic production increased were scattered across the entire NCP. However, the number of counties experiencing an increase in gas regulation and organic production gradually decreased from the western NCP to the eastern NCP.

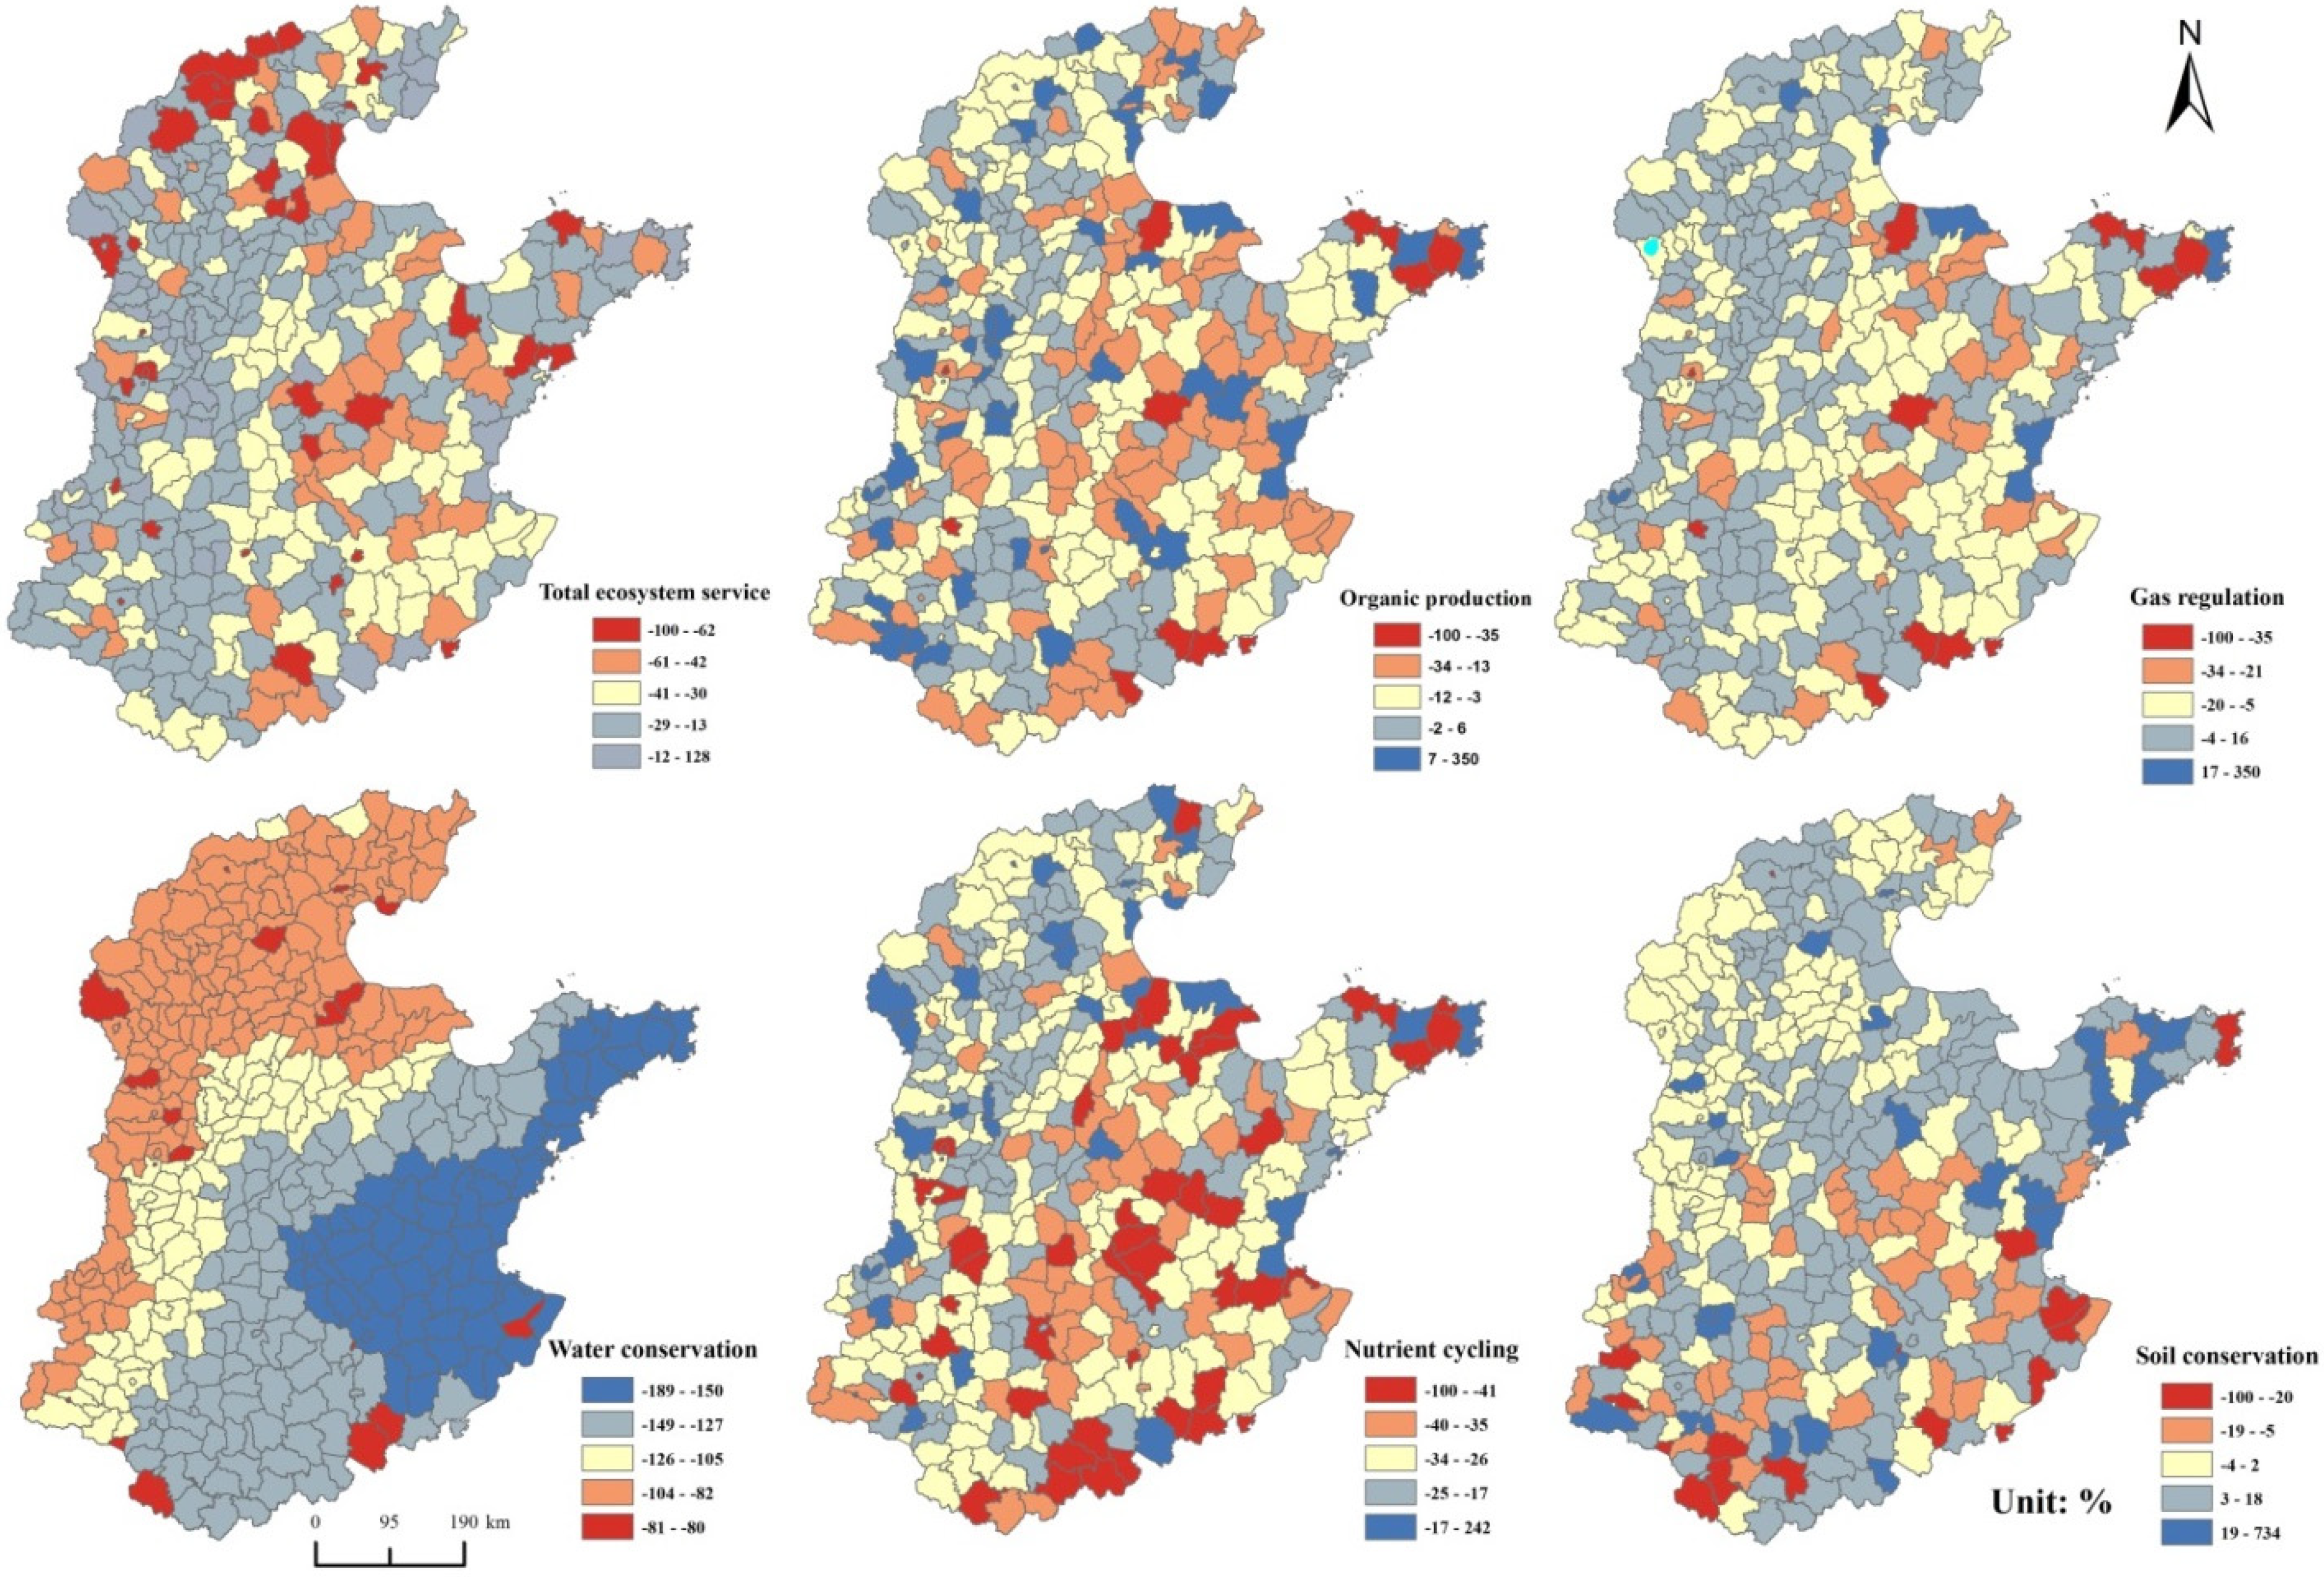
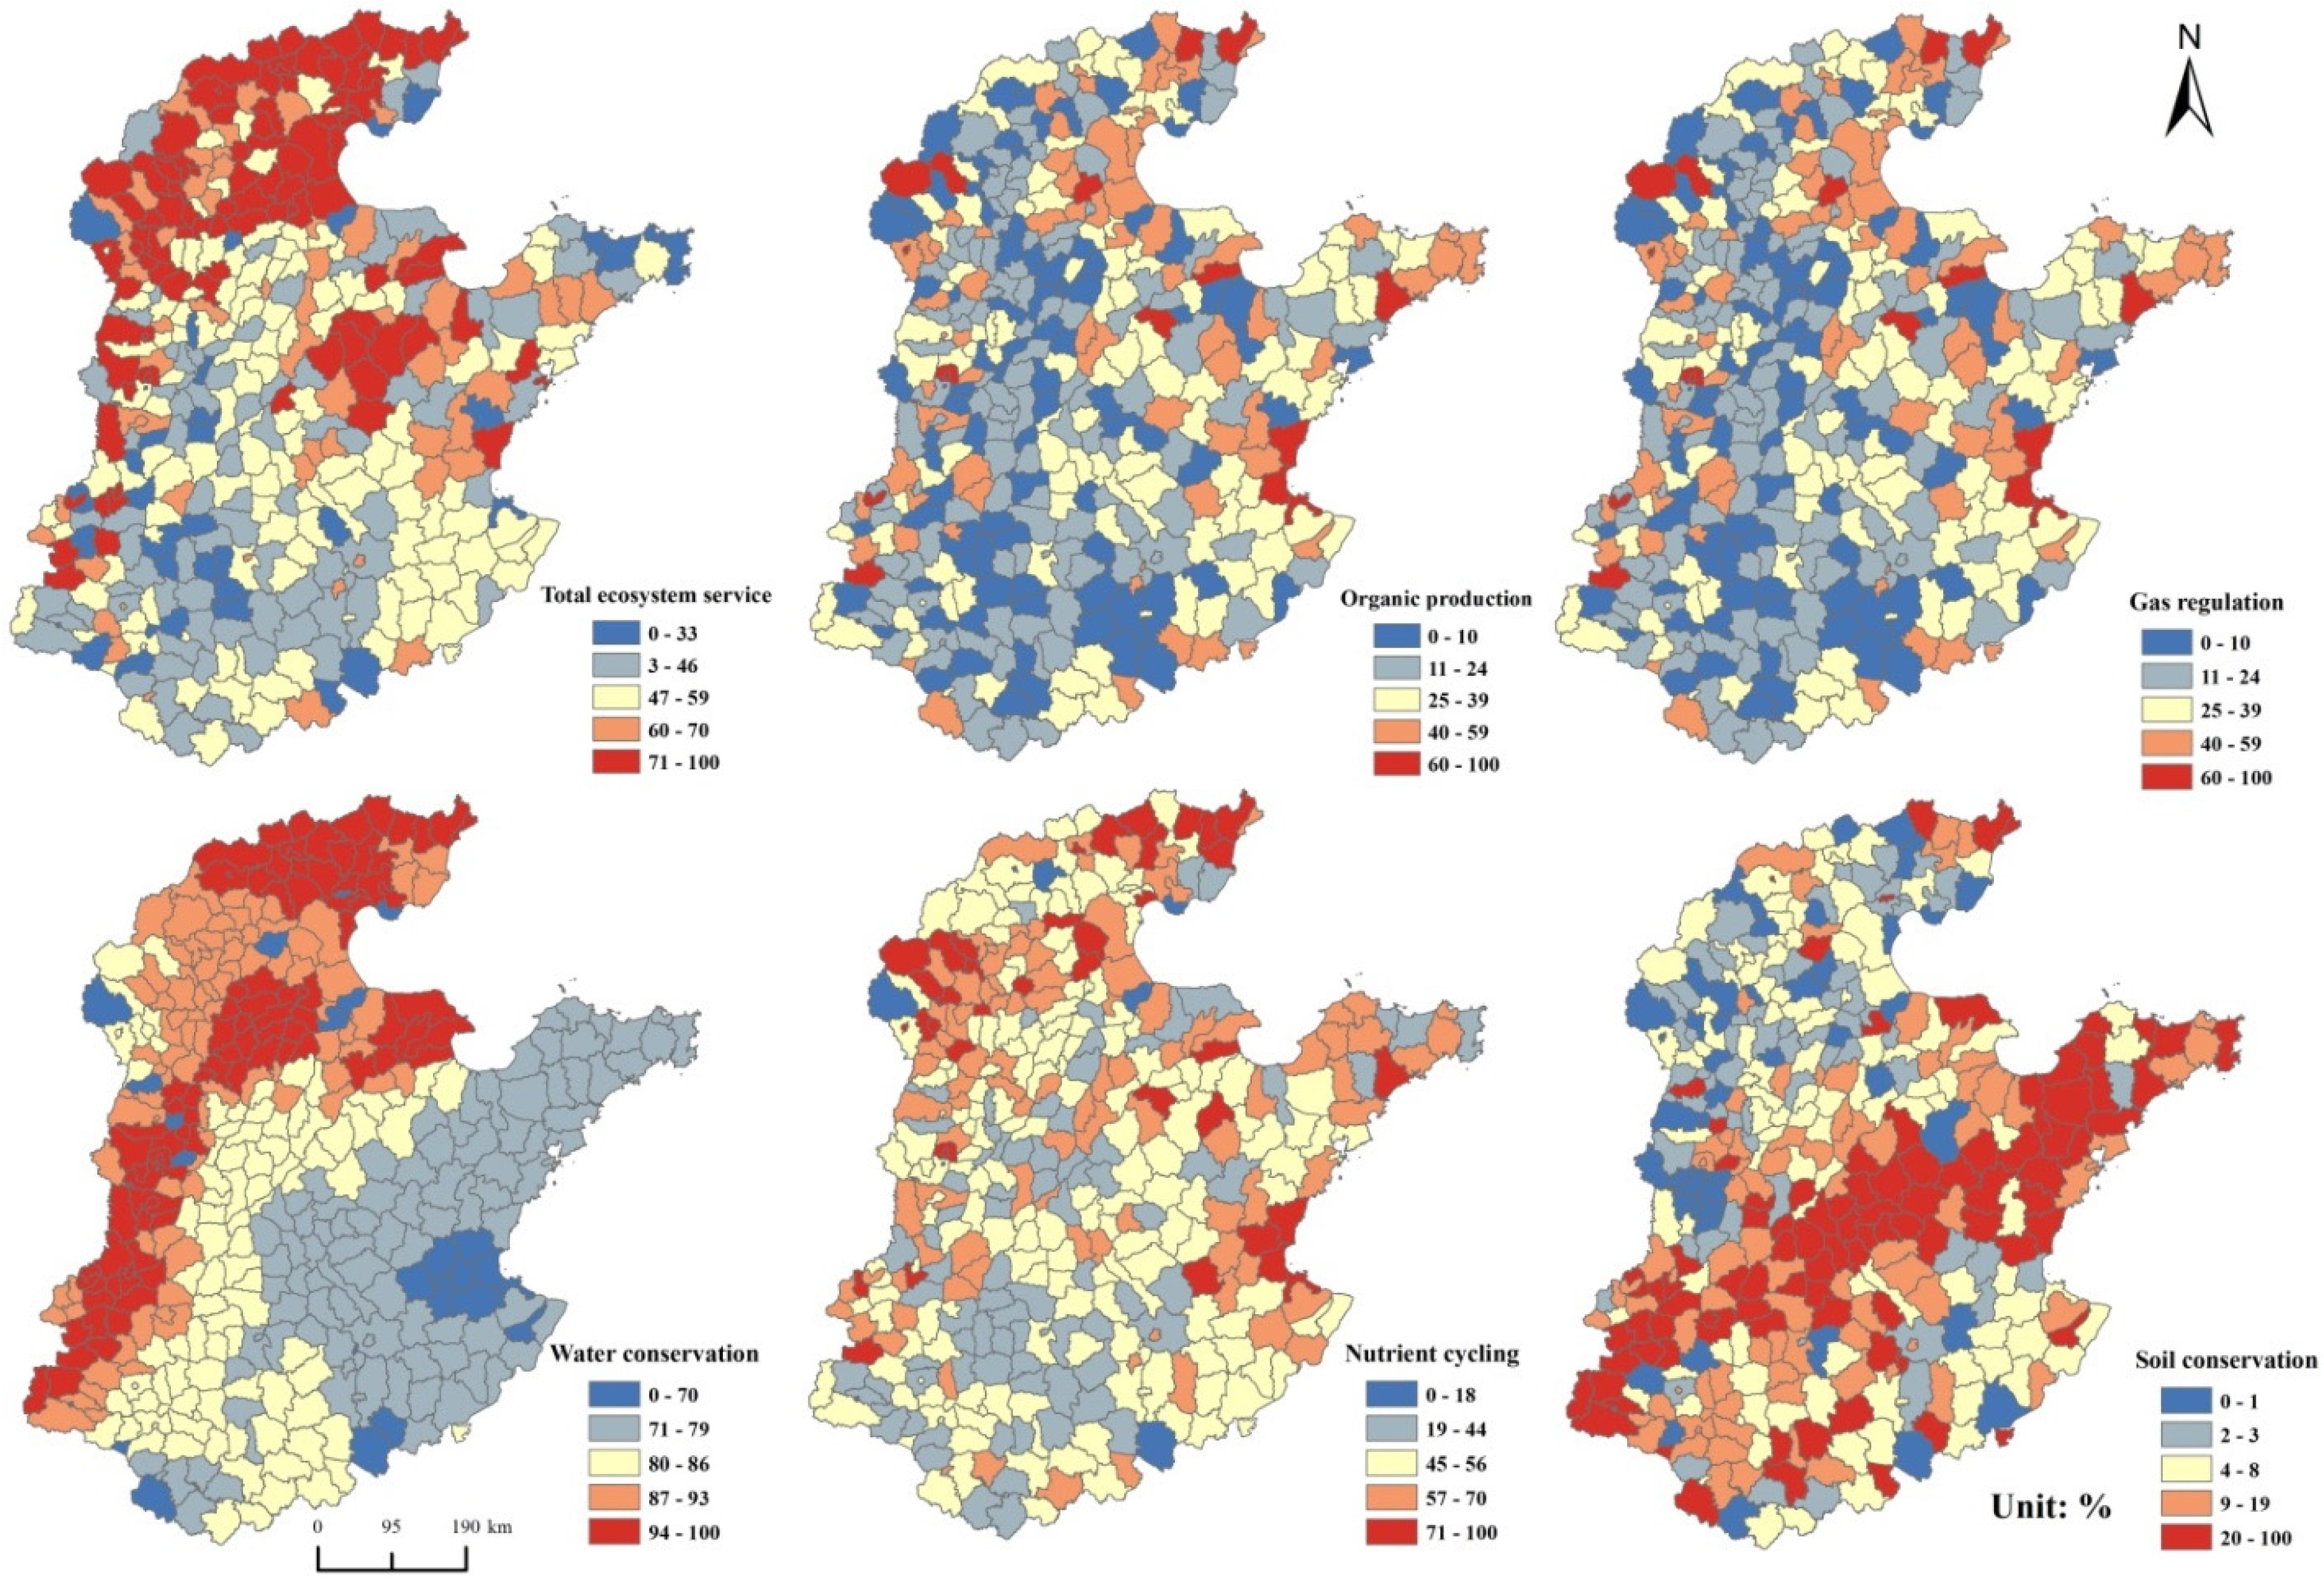
4.4. Contributions of Land Use and Climate Change in Driving ESV Change

In accordance with Equation (2), we assessed the contributions of land use and climate change in driving ESV change. In the conversion from cultivated land to urban areas, land use change accounted for 57.40% of the changes in ESV, while climate change resulted in 42.60% of the changes in ESV. For different ecosystem services, land use change accounted, on average, for 52.62%, 80.63%, 19.99%, 19.99%, and 23.30% of changes in ESV for nutrient cycling, water conservation, gas regulation, organic production, and soil conservation, respectively (Figure 6). Land use change has a major influence on water conservation and nutrient cycling, while the main effects of climate change are on gas regulation, organic production, and soil conservation.
Figure 6. Contribution of land use change in driving ESV change in the NCP.
Energies 08 05678 g006
The effects of land use change on ESV are more significant in the northwestern NCP than in any other region in the NCP (Figure 6). Land use change in this area accounted for over 60% of the changes in ESV. However, in the northern NCP, the effects of land use change on ESV are generally lower than 45%. The influence of land use change on water conservation gradually decreased from the northwestern NCP to the southeastern NCP. The effects of land use change on soil conservation are particularly significant in a northeast–southwest strip (Figure 6). The effects of land use change on organic production, gas regulation and nutrient cycling are similar, i.e., in the NCP they gradually decreased from the east to the west.

5. Discussion

5.1. Causes of the Changes in Ecosystem Service in the Process of Urbanization

There are many tradeoffs in ecosystem service in urban expansion, i.e., an increase in soil conservation, while at the same time a decrease in water conservation, nutrient cycling, gas regulation and organic production. Urban areas are mostly soil sealed, which means that soil erosion does not easily occur. However, cultivated land usually leads to soil erosion under certain conditions, such as in sloping areas, areas with low vegetation cover, and areas of heavy rainfall.
For soil sealing in urban areas, urban land almost has no water conservation function. When cultivated land was converted to urban areas, the water conservation function almost vanished. The nitrogen content of the nutrients in cultivated land is similar to that of an urban ecosystem. However, the phosphorus and potassium nutrient content in urban ecosystems is far below that in cultivated land. Therefore, in the conversion from cultivated land to urban areas, the nutrient cycling value of phosphorus and potassium significantly decreased.
Theoretically, if expanded urban areas are all soil sealed, the functions of organic material production and gas regulation will significantly decrease with the loss of vegetation. In this paper, we found that land use change resulted in a decrease of 7.18% for both organic material production and gas regulation. This can be explained from two perspectives. First, we utilized the land use change data with a spatial resolution of 1 km. There will be many mixed pixels of urban areas and cultivated land. Although many land use pixels were classified as urban areas, vegetation could still emerge in these pixels forming functions of organic material provision and gas regulation. Second, there may be many mistaken classification errors in urban areas, i.e., much of the cultivated land close to cities was reclassified as urban areas.

5.2. Comparisons between the Buffer and Other Previous Methods

Separating the effects of land use change on ESV from climate change has always been difficult due to the complex mutual influences between them. In the previous research, usually two approaches have been adopted, i.e., econometric analysis and scenario analysis. Econometric analysis identifies the effects of land use and climate change on ESV by regression or correlation analysis [47]. For example, Su and Fu [48] found that precipitation in the Chinese Loess Plateau significantly influences the water yield while the land use conversion from cropland to grass/woodland significantly influences the sediment control. Econometric analysis can judge whether land use or climate change significantly influences ESV while it fails to assess the degree of the influence.
In scenario analysis, three scenarios were generally developed, i.e., the pure climate scenario (no land use change), the pure land use change scenario (no climate change) and the combined scenario (changes in both climate and land use) [49,50]. The influence of land use and climate change on ESV can be clearly presented by assessing the changes in ESV under different scenarios. The contribution of climate and land use change on ESV can also be assessed in scenario analysis. However, scenario analysis still faces great challenges in scenario creation. Many pure scenarios of climate and land use change are difficult to create for the complex mutual effects between them. For example, soil erosion is determined by a great deal of factors, e.g., precipitation, land use, slope, vegetation coverage, etc. Precipitation, land use and slope can be easily controlled in scenario creation. However, vegetation coverage, which is usually directly calculated by remote sensing, is a combined result of land use and climate change. It is difficult to create pure climate vegetation coverage without the influence of land use change and vice versa. Therefore, the application of the scenario analysis method is greatly limited.
The buffer comparison method developed in this paper can directly assess the contribution of land use and climate change on ESV. It could be viewed as an improved scenario analysis method. The buffer comparison method factually developed two scenarios, i.e., the pure climate scenario and the combined scenario. The influence of land use change on ESV was indirectly deduced by the two scenarios. Since there is no land use change in the buffer zones, the pure climate scenario can be easily created and applied in all ESV assessments. The application range of this method is widely enhanced.

5.3. Uncertainty of the Assessment

The Millennium Ecosystem Assessment [51] classifies the functions of ecosystem services into provisioning (e.g., provision of food and fiber), regulation (e.g., regulation of climate through carbon storage), cultural (e.g., recreational values), and supporting services (e.g., nutrient cycling and soil formation). Because of the lack of available data and the method of mapping cultural services, we only assessed five ecosystem functions in provisioning, regulation, and supporting services. The cultural function changes in the process of urbanization were not assessed, adding much uncertainty to the assessment.
The spatial resolution of the data we utilized to assess ESV and urban expansion is 1 km. The data could be a little coarse in analyzing urban expansion and generate many mixed pixels of urban areas and other land use types. If the mixed pixels were classified as urban areas, the NPP and NDVI in urban areas could be overestimated. The ESV closely related to NPP and NDVI (e.g., organic material production, nutrient cycling) could be consequently overestimated.

6. Conclusions

We examined urban expansion and cultivated loss in the NCP between 1988 and 2008. It was found that urban areas in the NCP increased by 108.54% during that period. Urban areas expanded faster in the northwestern NCP, i.e., regions around Beijing, but expanded more slowly in the southeastern NCP, i.e., northern Anhui and Jiangsu Province. Urban expansion in the NCP has led to significant cultivated land loss. About 76.48% of the expanded urban areas were converted from cultivated land. Furthermore, cultivated land loss is more serious in the regions with low speed urban expansion.
Using NESM and a buffer comparison method, we assessed the changes in ESV due to land use change when converting cultivated land to urban areas. The ecosystem service function of water conservation, nutrient cycling, gas regulation, organic production and soil conservation changed −124.03%,−31.91%, −7.18%, −7.18%, and 2.40% due to land use change, respectively. Urban expansion has led to a total loss of ESV of 34.66%, while it slightly improves the soil conservation function.
Land use change has a major effect on changes in ESV in urban expansion. As a whole, land use change accounted for 57.40% of the changes in ESV. However, the effect of land use change on ESV varied according to different ecosystem service functions. Land use change has a major influence on the ESVs of nutrient cycling (52.62%) and water conservation (80.63%), while it has a minor influence on changes in the ESVs of gas regulation (19.99%), organic production (19.99%), and soil conservation (23.30%).

Acknowledgments

This work was supported by the National Natural Science Foundation of China (Grant No. 71225005 and 41071343).

Author Contributions

Xiangzheng Deng conceived and designed research. Wei Song wrote the paper.

Conflicts of Interest

The authors declare no conflict of interest.

References

  1. Seto, K.C.; Reenberg, A.; Boone, C.G.; Fragkias, M.; Haase, D.; Langanke, T.; Marcotullio, P.; Munroe, D.K.; Olah, B.; Simon, D. Urban land teleconnections and sustainability. Proc. Natl. Acad. Sci. USA 2012, 109, 7687–7692. [Google Scholar] [CrossRef] [PubMed]
  2. Song, W.; Pijanowski, B.C.; Tayyebi, A. Urban expansion and its consumption of high-quality farmland in Beijing, China. Ecol. Indic. 2015, 54, 60–70. [Google Scholar] [CrossRef]
  3. United Nations. World Urbanization Prospects, the 2011 Revision; United Nations: New York, NY, USA, 2012. [Google Scholar]
  4. Haase, D.; Frantzeskaki, N.; Elmqvist, T. Ecosystem services in urban landscapes: Practical applications and governance implications. Ambio 2014, 43, 407–412. [Google Scholar] [CrossRef] [PubMed]
  5. Xu, T.; Ma, T.; Zhou, C.H.; Zhou, Y.K. Characterizing spatio-temporal dynamics of urbanization in China using time series of DMSP/OLS night light data. Remote Sens. 2014, 6, 7708–7731. [Google Scholar] [CrossRef]
  6. Song, W.; Liu, M.L. Assessment of decoupling between rural settlement area and rural population in China. Land Use Policy 2014, 39, 331–341. [Google Scholar] [CrossRef]
  7. Tayyebi, A.; Pijanowski, B.C. Modeling multiple land use changes using ANN, CART and MARS: Comparing tradeoffs in goodness of fit and explanatory power of data mining tools. Int. J. Appl. Earth Obs. 2014, 28, 102–116. [Google Scholar] [CrossRef]
  8. Ntelekos, A.A.; Oppenheimer, M.; Smith, J.A.; Miller, A.J. Urbanization, climate change and flood policy in the United States. Climatic Change 2010, 103, 597–616. [Google Scholar] [CrossRef]
  9. Song, W. Decoupling cultivated land loss by construction occupation from economic growth in Beijing. Habitat Int. 2014, 43, 198–205. [Google Scholar] [CrossRef]
  10. Shen, L.Y.; Zhou, J.Y. Examining the effectiveness of indicators for guiding sustainable urbanization in China. Habitat Int. 2014, 44, 111–120. [Google Scholar] [CrossRef]
  11. National Bureau of Statistics of the People’s Republic of China. China Statistical Yearbook 2014; China Statistics Press: Beijing, China, 2014.
  12. Zang, S.Y.; Wu, C.S.; Liu, H.; Na, X.D. Impact of urbanization on natural ecosystem service values: A comparative study. Environ. Monit. Assess. 2011, 179, 575–588. [Google Scholar] [CrossRef] [PubMed]
  13. Zhang, K.H.; Song, S.F. Rural-urban migration and urbanization in China: Evidence from time-series and cross-section analyses. China Econ. Rev. 2003, 14, 386–400. [Google Scholar] [CrossRef]
  14. Song, W.; Pijanowski, B.C. The effects of China’s cultivated land balance program on potential land productivity at a national scale. Appl. Geogr. 2014, 46, 158–170. [Google Scholar] [CrossRef]
  15. Tayyebi, A.; Pijanowski, B.C.; Linderman, M.; Gratton, C. Comparing three global parametric and local non-parametric models to simulate land use change in diverse areas of the world. Environ. Modell. Softw. 2014, 59, 202–221. [Google Scholar] [CrossRef]
  16. Tayyebi, A.; Pijanowski, B.C.; Pekin, B.K. Land use legacies of the Ohio River Basin: Using a spatially explicit land use change model to assess past and future impacts on aquatic resources. Appl. Geogr. 2015, 57, 100–111. [Google Scholar] [CrossRef]
  17. Seto, K.C.; Fragkias, M.; Guneralp, B.; Reilly, M.K. A meta-analysis of global urban land expansion. PLoS ONE 2011, 6, e23777. [Google Scholar] [CrossRef] [PubMed]
  18. Angel, S.; Parent, J.; Civco, D.L.; Blei, A.; Potere, D. The dimensions of global urban expansion: Estimates and projections for all countries, 2000–2050. Prog. Plann. 2011, 75, 53–107. [Google Scholar] [CrossRef]
  19. Tan, M.H.; Li, X.B.; Lu, C.H. Urban land expansion and arable land loss of the major cities in China in the 1990s. Sci. China Ser. D 2005, 48, 1492–1500. [Google Scholar] [CrossRef]
  20. Chen, J. Rapid urbanization in China: A real challenge to soil protection and food security. Catena 2007, 69, 1–15. [Google Scholar] [CrossRef]
  21. Rebele, F. Urban ecology and special features of urban ecosystems. Global Ecol. Biogeogr. 1994, 4, 173–187. [Google Scholar] [CrossRef]
  22. Su, Z.M.; Zhang, R.Z.; Qiu, J.X. Decline in the diversity of willow trunk-dwelling weevils (Coleoptera: Curculionoidea) as a result of urban expansion in Beijing, China. J. Insect. Conserv. 2011, 15, 367–377. [Google Scholar] [CrossRef]
  23. Zapata, V.M.; Robledano, F. Assessing biodiversity and conservation value of forest patches secondarily fragmented by urbanisation in semiarid southeastern Spain. J. Nat. Conserv. 2014, 22, 166–175. [Google Scholar] [CrossRef]
  24. Heterick, B.E.; Lythe, M.; Smithyman, C. Urbanisation factors impacting on ant (Hymenoptera: Formicidae) biodiversity in the Perth metropolitan area, Western Australia: Two case studies. Urban Ecosyst. 2013, 16, 145–173. [Google Scholar] [CrossRef]
  25. Arola, T.; Korkka-Niemi, K. The effect of urban heat islands on geothermal potential: Examples from Quaternary aquifers in Finland. Hydrogeol. J. 2014, 22, 1953–1967. [Google Scholar] [CrossRef]
  26. Zhao, L.; Lee, X.; Smith, R.B.; Oleson, K. Strong contributions of local background climate to urban heat islands. Nature 2014, 511, 216–219. [Google Scholar] [CrossRef] [PubMed]
  27. Christ, K.; Baier, K.; Schmitz, K.S.; Jha, R.; Azzam, R. Water pollution and environmental problems as a result of urbanization in Hyderabad. Wasserwirtschaft 2012, 102, 25–30. [Google Scholar] [CrossRef]
  28. He, H.M.; Zhou, J.; Wu, Y.J.; Yu, Q.; Zhang, W.C.; Xie, X.P. Estimating water quality pollution impacts based on economic loss models in urbanization process in Xi’an, China. J. Urban Plan. Dev. 2007, 133, 151–160. [Google Scholar] [CrossRef]
  29. Aunan, K.; Wang, S.X. Internal migration and urbanization in China: Impacts on population exposure to household air pollution (2000–2010). Sci. Total. Environ. 2014, 481, 186–195. [Google Scholar] [CrossRef] [PubMed]
  30. Cumming, G.S.; Buerkert, A.; Hoffmann, E.M.; Schlecht, E.; von Cramon-Taubadel, S.; Tscharntke, T. Implications of agricultural transitions and urbanization for ecosystem services. Nature 2014, 515, 50–57. [Google Scholar] [CrossRef] [PubMed]
  31. Jat, M.K.; Khare, D.; Garg, P.K.; Shankar, V. Remote sensing and GIS-based assessment of urbanisation and degradation of watershed health. Urban Water J. 2009, 6, 251–263. [Google Scholar] [CrossRef]
  32. Deng, X.Z.; Zhao, C.H.; Lin, Y.Z.; Zhang, T.; Qu, Y.; Zhang, F.; Wang, Z.; Wu, F. Downscaling the impacts of large-scale lucc on surface temperature along with IPCC RCPs: A global perspective. Energies 2014, 7, 2720–2739. [Google Scholar] [CrossRef]
  33. Ma, E.J.; Deng, X.Z.; Zhang, Q.; Liu, A.P. Spatial variation of surface energy fluxes due to land use changes across China. Energies 2014, 7, 2194–2206. [Google Scholar] [CrossRef]
  34. Deng, X.Z.; Han, J.Z.; Yin, F. Net energy, co2 emission and land-based cost-benefit analyses of jatropha biodiesel: A case study of the Panzhihua region of Sichuan province in China. Energies 2012, 5, 2150–2164. [Google Scholar] [CrossRef]
  35. Long, H.L.; Liu, Y.Q.; Hou, X.G.; Li, T.T.; Li, Y.R. Effects of land use transitions due to rapid urbanization on ecosystem services: Implications for urban planning in the new developing area of China. Habitat Int. 2014, 44, 536–544. [Google Scholar] [CrossRef]
  36. Su, S.L.; Li, D.L.; Hu, Y.N.; Xiao, R.; Zhang, Y. Spatially non-stationary response of ecosystem service value changes to urbanization in Shanghai, China. Ecol. Indic. 2014, 45, 332–339. [Google Scholar] [CrossRef]
  37. Lin, T.; Xue, X.Z.; Shi, L.Y.; Gao, L.J. Urban spatial expansion and its impacts on island ecosystem services and landscape pattern: A case study of the island city of Xiamen, Southeast China. Ocean Coast. Manag. 2013, 81, 90–96. [Google Scholar] [CrossRef]
  38. Hoyer, R.; Chang, H.J. Assessment of freshwater ecosystem services in the Tualatin and Yamhill basins under climate change and urbanization. Appl. Geogr. 2014, 53, 402–416. [Google Scholar] [CrossRef]
  39. Harmackova, Z.V.; Vackar, D. Modelling regulating ecosystem services trade-offs across landscape scenarios in Trebonsko Wetlands Biosphere Reserve, Czech Republic. Ecol. Model. 2015, 295, 207–215. [Google Scholar] [CrossRef]
  40. Fu, B.; Wang, Y.K.; Xu, P.; Yan, K.; Li, M. Value of ecosystem hydropower service and its impact on the payment for ecosystem services. Sci. Total. Environ. 2014, 472, 338–346. [Google Scholar] [CrossRef] [PubMed]
  41. Natural Capital Project. Available online: http://www.naturalcapitalproject.org (accessed on 24 April 2015).
  42. Song, W.; Deng, X.Z.; Yuan, Y.W.; Wang, Z.; Li, Z.H. Impacts of land-use change on valued ecosystem service in rapidly urbanized North China Plain. Ecol. Model. 2015. [Google Scholar] [CrossRef]
  43. Song, W.; Deng, X.Z.; Liu, B.; Li, Z.H.; Jin, G. Impacts of Grain-for-Green and Grain-for-Blue policies on valued ecosystem services in Shandong Province, China. Adv. Meteorol. 2015. [Google Scholar] [CrossRef]
  44. Deng, X.Z.; Huang, J.K.; Uchida, E.; Rozelle, S.; Gibson, J. Pressure cookers or pressure valves: Do roads lead to deforestation in China? J. Environ. Econ. Manag. 2011, 61, 79–94. [Google Scholar] [CrossRef]
  45. Liu, J.Y.; Kuang, W.H.; Zhang, Z.X.; Xu, X.L.; Qin, Y.W.; Ning, J.; Zhou, W.C.; Zhang, S.W.; Li, R.D.; Yan, C.Z.; et al. Spatiotemporal characteristics, patterns, and causes of land-use changes in China since the late 1980s. J. Geogr. Sci. 2014, 24, 195–210. [Google Scholar] [CrossRef]
  46. Liu, J.Y.; Liu, M.L.; Tian, H.Q.; Zhuang, D.F.; Zhang, Z.X.; Zhang, W.; Tang, X.M.; Deng, X.Z. Spatial and temporal patterns of China’s cropland during 1990–2000: An analysis based on Landsat TM data. Remote Sens. Environ. 2005, 98, 442–456. [Google Scholar] [CrossRef]
  47. Heubes, J.; Heubach, K.; Schmidt, M.; Wittig, R.; Zizka, G.; Nuppenau, E.A.; Hahn, K. Impact of future climate and land use change on non-timber forest product provision in Benin, West Africa: Linking niche-based modeling with ecosystem service values. Econ. Bot. 2012, 66, 383–397. [Google Scholar] [CrossRef]
  48. Su, C.H.; Fu, B.J. Evolution of ecosystem services in the Chinese Loess Plateau under climatic and land use changes. Global Planet Change 2013, 101, 119–128. [Google Scholar] [CrossRef]
  49. Geng, X.L.; Wang, X.S.; Yan, H.M.; Zhang, Q.; Jin, G. Land use/land cover change induced impacts on water supply service in the upper reach of Heihe River Basin. Sustainability 2015, 7, 366–383. [Google Scholar] [CrossRef]
  50. Briner, S.; Elkin, C.; Huber, R.; Gret-Regamey, A. Assessing the impacts of economic and climate changes on land-use in mountain regions: A spatial dynamic modeling approach. Agric. Ecosyst. Environ. 2012, 149, 50–63. [Google Scholar] [CrossRef]
  51. Millennium Ecosystem Assessment. Ecosystems and Human Well-Being: Current State and Trends; Island Press: Washington, DC, USA, 2003.

