Article

Fast Charging Battery Buses for the Electrification of Urban Public Transport—A Feasibility Study Focusing on Charging Infrastructure and Energy Storage Requirements

by
Matthias Rogge
1,2,*,
Sebastian Wollny
1 and
Dirk Uwe Sauer
1,2,3
1
Electrochemical Energy Conversion and Storage Systems Group, Institute for Power Electronics and Electrical Drives (ISEA), RWTH Aachen University, Jaegerstr. 17/19, 52066 Aachen, Germany
2
Juelich Aachen Research Alliance, JARA-Energy, Wilhelm-Johnen-Str. 1, 52425 Juelich, Germany
3
Institute for Power Generation and Storage Systems (PGS), E.ON ERC, RWTH Aachen University, Mathieustr. 10, 52074 Aachen, Germany
*
Author to whom correspondence should be addressed.
Energies 2015, 8(5), 4587-4606; https://doi.org/10.3390/en8054587
Submission received: 25 March 2015 / Revised: 8 May 2015 / Accepted: 15 May 2015 / Published: 21 May 2015
(This article belongs to the Special Issue Electrical Power and Energy Systems for Transportation Applications)

Abstract

:
The electrification of public transport bus networks can be carried out utilizing different technological solutions, like trolley, battery or fuel cell buses. The purpose of this paper is to analyze how and to what extent existing bus networks can be electrified with fast charging battery buses. The so called opportunity chargers use mainly the regular dwell time at the stops to charge their batteries. This results in a strong linkage between the vehicle scheduling and the infrastructure planning. The analysis is based on real-world data of the bus network in Muenster, a mid-sized city in Germany. The outcomes underline the necessity to focus on entire vehicle schedules instead on individual trips. The tradeoff between required battery capacity and charging power is explained in detail. Furthermore, the impact on the electricity grid is discussed based on the load profiles of a selected charging station and a combined load profile of the entire network.

1. Introduction

Electric buses support the transition process towards a more sustainable public transport. The different electric bus systems in the market use basically the same traction system to convert electricity into propulsion. The supply of electricity is the defining difference between them. A simple and proven concept is for example the trolley bus. It is continuously connected to overhead wires, which cover the energy demand at any time. However, the overhead wire system causes high invest costs and maintenance efforts [1]. The bus is furthermore bound to certain tracks so that the level of flexibility is very low. Serial diesel hybrid buses generate the electricity onboard with a combustion engine and a generator. An all-day operation without refueling is manageable, due to the high energy density of diesel. A high level of flexibility is furthermore guaranteed, because no infrastructure is needed on the track. Fuel cell buses use hydrogen as their energy source. The available driving range is lower compared to diesel hybrid buses [2], but they still offer a high level of flexibility. The three concepts can always be combined with an energy storage inside the vehicle. Hybrid and fuel cell buses have for example energy storages for the recovery of braking energy [3,4,5]. The energy storage in hybrid buses can also be used for a partial emission free operation [6,7]. Furthermore, the battery of some hybrid buses can be charged externally. These concepts are also named plug-in hybrid bus or battery bus with range extender, depending on the size of the energy storage and the charging possibilities. Trolley buses can use energy storages for a partial operation without overhead wires [8].
Battery electric buses neither have a continuous power supply nor generate electricity onboard. Their energy is stored in the battery. The energy density of batteries is rather low compared to diesel or hydrogen [9]. The driving range of battery buses is therefore limited and the charging process requires a certain time. There are mainly two concepts for the charging of the battery, standard and fast charging [10]. Standard charging is performed with a moderate charging power mainly in the bus depot overnight and during longer brakes. This causes a high battery capacity and a high weight of the system, when the bus shall be operated the entire day [11]. Fast charging on the track during operation can reduce the battery capacity and therefore the weight significantly. However, the bus schedule must provide sufficient charging times at certain locations. The existing research in this field focusses mainly on the adaption of the vehicle scheduling on fixed predetermined charging infrastructure and vehicle configurations [12,13,14] or on the dimensioning of the battery capacity and charging infrastructure for a single bus route or standard driving cycle, without considering the vehicle scheduling in detail [11,15]. This works expands the scope from the secondly mentioned work to the entire bus network taking especially the influence of the vehicle scheduling on the system design into account. It is analyzed how and to what extend entire bus networks can be electrified with fast charging battery bus systems, without changing the existing bus routes and trips. This ensures a straightforward transition process from the conventional to an electrified bus fleet, because the operator does not have to adjust the already optimized operational planning. The results are discussed with the focus on the general feasibility and the required minimal battery capacity. Furthermore, the limits of this approach are shown and discussed based on examples.

2. Material and Boundary Conditions
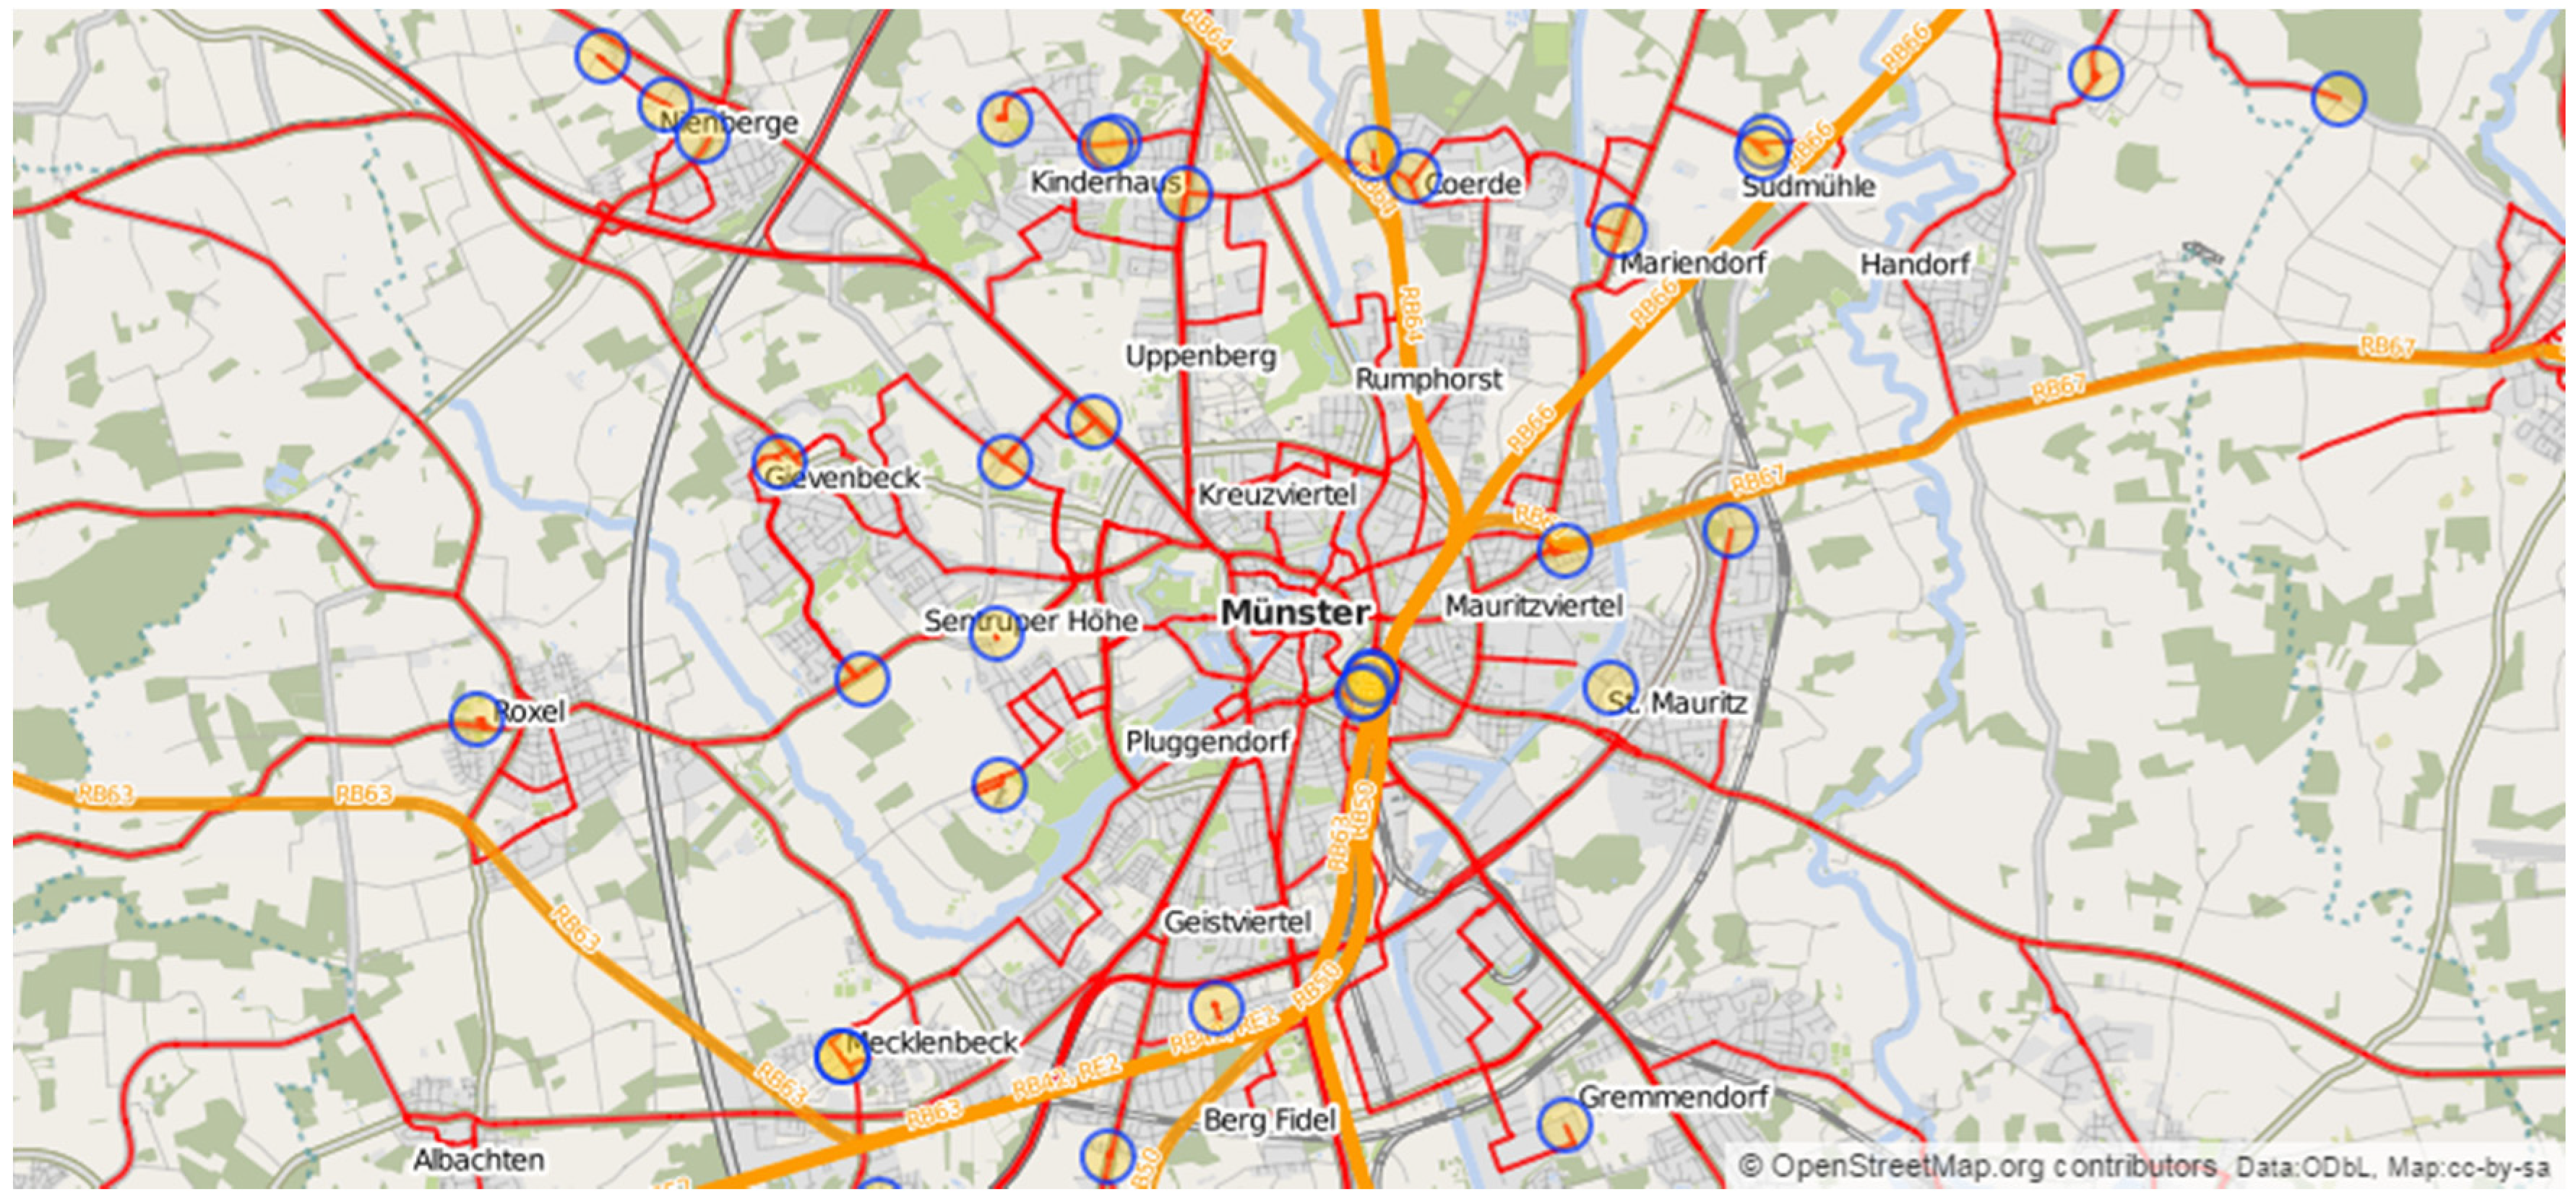
This section highlights the processed raw data and the relevant boundary conditions for the analysis. The first part describes the considered bus network consisting of the routes and a certain set of service trips (trips on a bus route in regular passenger service), which are currently operated with conventional diesel buses. A common set of service trip types is identified and subsequently used in the energy consumption calculation. Part 2 focuses on current technological solutions for the fast charging process in public transport applications. Their characteristic data is shown and the modeling for the simulation is described. The third part introduces solutions for the positioning of fast charging stations and describes the concept used in this analysis.

2.1. Bus Network

The analysis is conducted for the bus network of Muenster, a medium sized city in Germany. The local bus operator “Stadtwerke Muenster” publishes the bus schedules online [16], but detailed vehicle schedules are not available to the public. Therefore, the trips on each bus route in regular passenger service, the so called service trips, are identified manually. The dataset of a workday is chosen, because it places the highest demand on the bus system referring to the number of vehicles and the service frequency. The prepared dataset is shown in Table 1. It consists of 1588 service trips, which have an accumulated driving distance of about 27,000 km per day. The service trips are performed on 23 different bus routes. Buses on the same route leave in 20 min intervals. Superposition of different routes is used to achieve a higher frequency in critical areas. Separate trips for demand response transport, e.g. school transport, are excluded from the scope of this analysis. Regional bus routes to suburbs are also not taken into account, because they are not operated by “Stadtwerke Muenster”.
Table 1. Identified service trips for a workday.
RouteNo. of service trip typesNo. of service trips per dayDaily driving distance [km]RouteNo. of service trip typesNo. of service trips per dayDaily driving distance [km]
14982,29713290583
25881,558142911,063
3145550152941,977
4145562164911,768
53952,201177901,184
641161,84780216224
77932,01981216453
84921,70082717312
93911,67883216323
106901,96284216279
112921,39285216419
12290653761,58827,003
The service trips on each bus route are clustered into 76 service trip types, which have a common course and duration. The number of service trip types differs depending on the considered bus routes. For bus routes which have two terminal stops and no shortenings during the day exist only 2 service trip types, representing the back and return trip. A higher value reveals that there are shortenings during the day, which use different terminal stops. The value 1 for route 3 and 4 indicates that the return trip is missing. In this special case, the return trip of bus route 3 is the trip of bus route 4. In the following analysis route 3 and 4 are combined to route 34. The service trip types are used in the simulation of the energy consumption. They can be transformed to individual service trips by adding a certain starting time.
Route 1–17 are operated until 8 p.m. and called day routes in the following. Afterwards the night routes 80–85 start their service. The night routes are considered as individual routes in this analysis, because their course differs from the day routes. The daily driven distance of the night routes is lower compared to the day routes due to the shorter operating time. Information about the vehicles serving the different bus routes is not available. Therefore, it is assumed that each bus route is served by articulated buses with a length of 18 m. This bus type dominates the fleet of “Stadtwerke Muenster” and is furthermore the largest bus operated by them. More detailed vehicle parameters are given in Section 3.1.

2.2. Fast Charging Systems

The fast charging systems available in the market are based on different coupling technologies. The concepts can be divided in two groups, which use conductive or inductive energy transfer. Conductive coupling devices are offered for example by ABB, Oprid, Schunk or Proterra. A further system is developed within the German research project SEB by the RWTH Aachen University. The conductive coupling devices enable a very high charging power of up to 500 kW, which is demonstrated for example by Proterra in the US [17]. The charging power of the inductive systems is about 200 kW for the Bombardier Primove system [18] and 120 kW for the system of Conductix Wampfler [19]. Table 2 shows the charging power of some exemplary systems.
Table 2. Examples of current fast charging systems [17,18,19,20].
SupplierSystemTechnologyCharging power
ProterraFastFillconductive500 kW
BombardierPrimoveinductive200 kW
ABBTOSAconductive200 kW; 400 kW (15 s)
Conductix WampflerIPT chargerinductive60–180 kW
The detailed coupling procedure is excluded from the scope of this analysis. Charging systems are modeled by their maximum continuous charging power and the duration of the coupling und decoupling process. The analysis takes into account charging powers from 100 kW to 500 kW in steps of 100 kW for simplicity reasons. This subdivision reflects the currently available systems in the market. However, this value is the maximum charging power capability. The required charging power is determined in each case by the consumed energy and the available charging time.

2.3. Positioning of Fast Charging Infrastructure

Studies focusing on the positioning of charging stations for passenger vehicles have to predict the customer behavior in order to get information on the demand [21,22,23]. However, in the field of public transport buses, the operating conditions of the energy consumers are well known. The buses have a fixed route and the dwell time can be estimated based on the bus schedule and an expected delay. The fast charging can take place at the bus stops on the track, at the terminal stops and in the bus depot. Especially inductive solutions offer also the possibility to charge during driving, but this has not yet been implemented in practice for a public transport bus. The longest dwell time is usually located at the terminal stops, so that delays can be compensated and the bus driver can have a break according to the regulations of driving time. Furthermore, the terminal stops are usually located outside the city center, where the construction of a charging station can be carried out easier. The terminal stops appear therefore as a highly suitable location for the charging stations. In practice, the concept of fast charging at the terminal stops is implemented for example in the battery bus project in Vienna [24].
For this analysis, it is assumed that all fast charging stations are located at the terminal stops of the bus routes in Muenster. The current dataset contains 44 individual terminal stops resulting in 44 charging stations. The charging stations located in the surroundings of the city center as well as the corresponding bus routes can be seen in Figure 1. The charging stations in the simulation are modeled by a predefined charging power for every demanding bus. A simultaneous charging of multiple buses with the full charging power is possible.
Figure 1. Localization of fast charging stations at the terminal stops in the surroundings of the city center.
Energies 08 04587 g001

3. Calculation Method

The simulation is divided in 3 steps. First, the energy consumption of each service trip type is simulated based on the defined bus type and the geographical characteristics of the bus route. Secondly, the service trip types are combined to individual vehicle schedules based on the determined set of service trips including the available charging time at the terminal stops. Furthermore, the resulting power profiles are derived for every charging station and the entire network, which reveals the impact of simultaneous charging processes. In the third step, the required battery capacity is calculated for each bus route based on the given charging power.

3.1. Energy Consumption

The simulation of the energy consumption is performed according to the methodology of Sinhuber [11]. The proposed simulation model consists of a track and a vehicle model. The track model uses data from Openstreetmap on the course of the bus route and the position of the stops. The Shuttle Radar Topography Mission (SRTM) data of the NASA is used to calculate the height profile. It is assumed that the bus waits at every bus stop for 20 s and at every traffic light for 15 s. The energy demand for the traction system is calculated based on the driving resistances, which consists of air drag, rolling and climbing resistance. However, the air drag resistance is of minor importance, due to the low vehicle speed.
In addition to the energy consumption of the traction system, the consumption of the auxiliaries has to be taken into account [25,26]. Main consumers are for example the steering support, the compressor and the air condition. The interior heating can be realized by an electric heater, like a heat pump or a PTC heater, or by a conventional heating system which uses fossil fuels. However, especially the use of a PTC heater would lead to extreme energy demands, which intensively affects the outcomes of this analysis. A standard 18 m bus has for example an energy consumption without interior heating of about 2 kWh/km. Taking an average speed of 15 km/h into account, the average traction power can be calculated to 30 kW. The required power for the PTC heating system can equal this value in extreme conditions and therefore double the total energy consumption [27]. Heat pump systems have a lower energy consumption and they enable the use of waste heat from the traction system [28]. The measured system in the analysis of Cho et al. supplied a heating power of 30 kW with an electric energy consumption of 10 kW for the compressor. The use of a conventional heating system with fossil fuels enables heat generation without electricity. The conventional systems are used in many current battery bus projects and therefore chosen for this analysis. Hence, the energy consumption of the air conditioning system is dominated by the cooling scenario in the summer. The moderate climate conditions in Germany allow an energy efficient cooling concept. The German Transport Association recommends a cooling to a defined temperature difference between the vehicle interior and outside temperature, instead of cooling to a defined vehicle interior temperature [29]. The total power of the air condition system in the summer can therefore be limited to 6.75 kW for an 18 m bus. The dynamic behavior of the auxiliaries is not taken into account, because the main focus of the simulation is the overall energy consumption. The auxiliaries are therefore modeled by a constant load in the simulation.
The basic vehicle model, consisting of the mechanical and the traction system part, is parameterized and verified with data of the APTS Phileas bus. The data was gained within the “H2-Bus NRW” project [30]. The energy supply system of the “H2-Bus” consists of a fuel cell, double layer capacitors and a NiMH battery. In this analysis, these components are replaced by a lithium-ion battery, which is represented by its efficiency. Table 3 highlights the relevant parameters of the bus, which are used in the simulation. One important key parameter is the weight. It affects directly the rolling and climbing resistance and has therefore a strong impact on the energy consumption. This analysis focusses on the technical feasibility, which should be proven under the most challenging conditions. Thus, the maximum gross vehicle weight of 28 t is used in the simulation, which represents a fully packed vehicle. This value includes also the weight of the battery. The worst case scenario for the auxiliaries is represented by the summer condition, in which the vehicle interior is continuously cooled (6.75 kW) and the maximum continuous auxiliary power (2.25 kW) is demanded.
Table 3. Vehicle parameter.
ParameterValueRelevant forParameterValueRelevant for
Width2.55 mCross section area for air drag calculationEfficiency of the traction system90%Loss calculation
Height3.44 mCross section area for air drag calculationEfficiency of the battery system95%Loss calculation for charging and discharging
Maximum gross vehicle weight28 tRolling resistance, climbing resistanceMax auxiliary power9 kWEnergy consumption of the auxiliaries

3.2. Vehicle Scheduling and Grid Load Profiles

The technical feasibility of the electrification is analyzed individually for every bus route. A transition between the day and the night routes is therefore not taken into account. A lean algorithm is used for the vehicle scheduling to enable separate analysis of each route. Every bus serves only one route without any deadheading trips. After a service trip is finished, the bus waits at the terminal stop until the next service trip on the same route starts from the current stop. If there is no ongoing trip during the day, the bus will drive back to the depot. During the dwell time at the terminal stop, the bus has the possibility to charge its battery. The available charging time is calculated based on the resulting dwell time reduced by the average delay of the bus system and the required time for the coupling process of the fast charging system. The average delay for the bus system in Muenster is about 3 min [31]. The coupling time differs according to the considered system. This analysis compares different charging systems represented by the charging power, without focusing on the detailed coupling process. The coupling and decoupling time is set to 30 s. The resulting charging time can be calculated to:
T c h a r g e , a v =   T d w e l l T d e l a y   2   T c o u p l i n g
It is assumed that the battery of each bus is fully charged at the beginning of the shift, which means that the SOC (State of Charge) is 100%. This value is the upper limit and cannot be exceeded during the charging process. Within the charging process every bus tries to charge to 100% SOC. The required charging power can be calculated based on the energy demand from the traction system and the auxiliaries, the available charging time and the efficiency of the battery system:
P c h a r g e , r e q =   Δ E d e m a n d T c h a r g e , a v × 1 η b a t
The calculated charging power represents the value at the DC-output of the charging station and includes the losses of the battery system during charging. Furthermore, the efficiency of the charging system has to be taken into account in the calculation of the overall power demand:
P c h a r g e , g r i d =   P c h a r g e , r e q η c h a r g e r
It is assumed that the efficiency of the charging system is 90%. The overall power demand represents the AC-input power of the charger and has to be covered by the electrical grid. All charging powers mentioned in the following correspond to this value.
The use of the available charging time in Equation (2) ensures that the entire dwell time is utilized. Another possibility would be to charge the bus with the maximum available charging power followed by a waiting period until the end of the break. This procedure is not recommended, because the losses increase with the applied charging power. Furthermore, the additional losses could raise the battery temperature, which results in an accelerated aging [32]. If the required charging power cannot be supplied by the charging station, the bus will charge with the maximum available power. In this case, the SOC will not reach 100%. The remaining energy deficit will be added to the energy demand of the next charging process. This causes an increase of the required battery capacity. At the end of the shift, the bus has additional 20 min charging time in order to compensate an energy deficit accumulated during the day. The charging time is limited because the buses arrive in 20 min intervals at the terminal stops. A remaining energy deficit is recharged in the bus depot overnight.
The resulting power of the individual charging processes is afterwards combined to a power profile for each charging station. This enables a spatially resolved analysis, which is important to discuss the electrical grid stability. The power profiles can furthermore be merged to an overall load profile for the entire bus network, which enables a conclusion about the simultaneities and the overlapping.

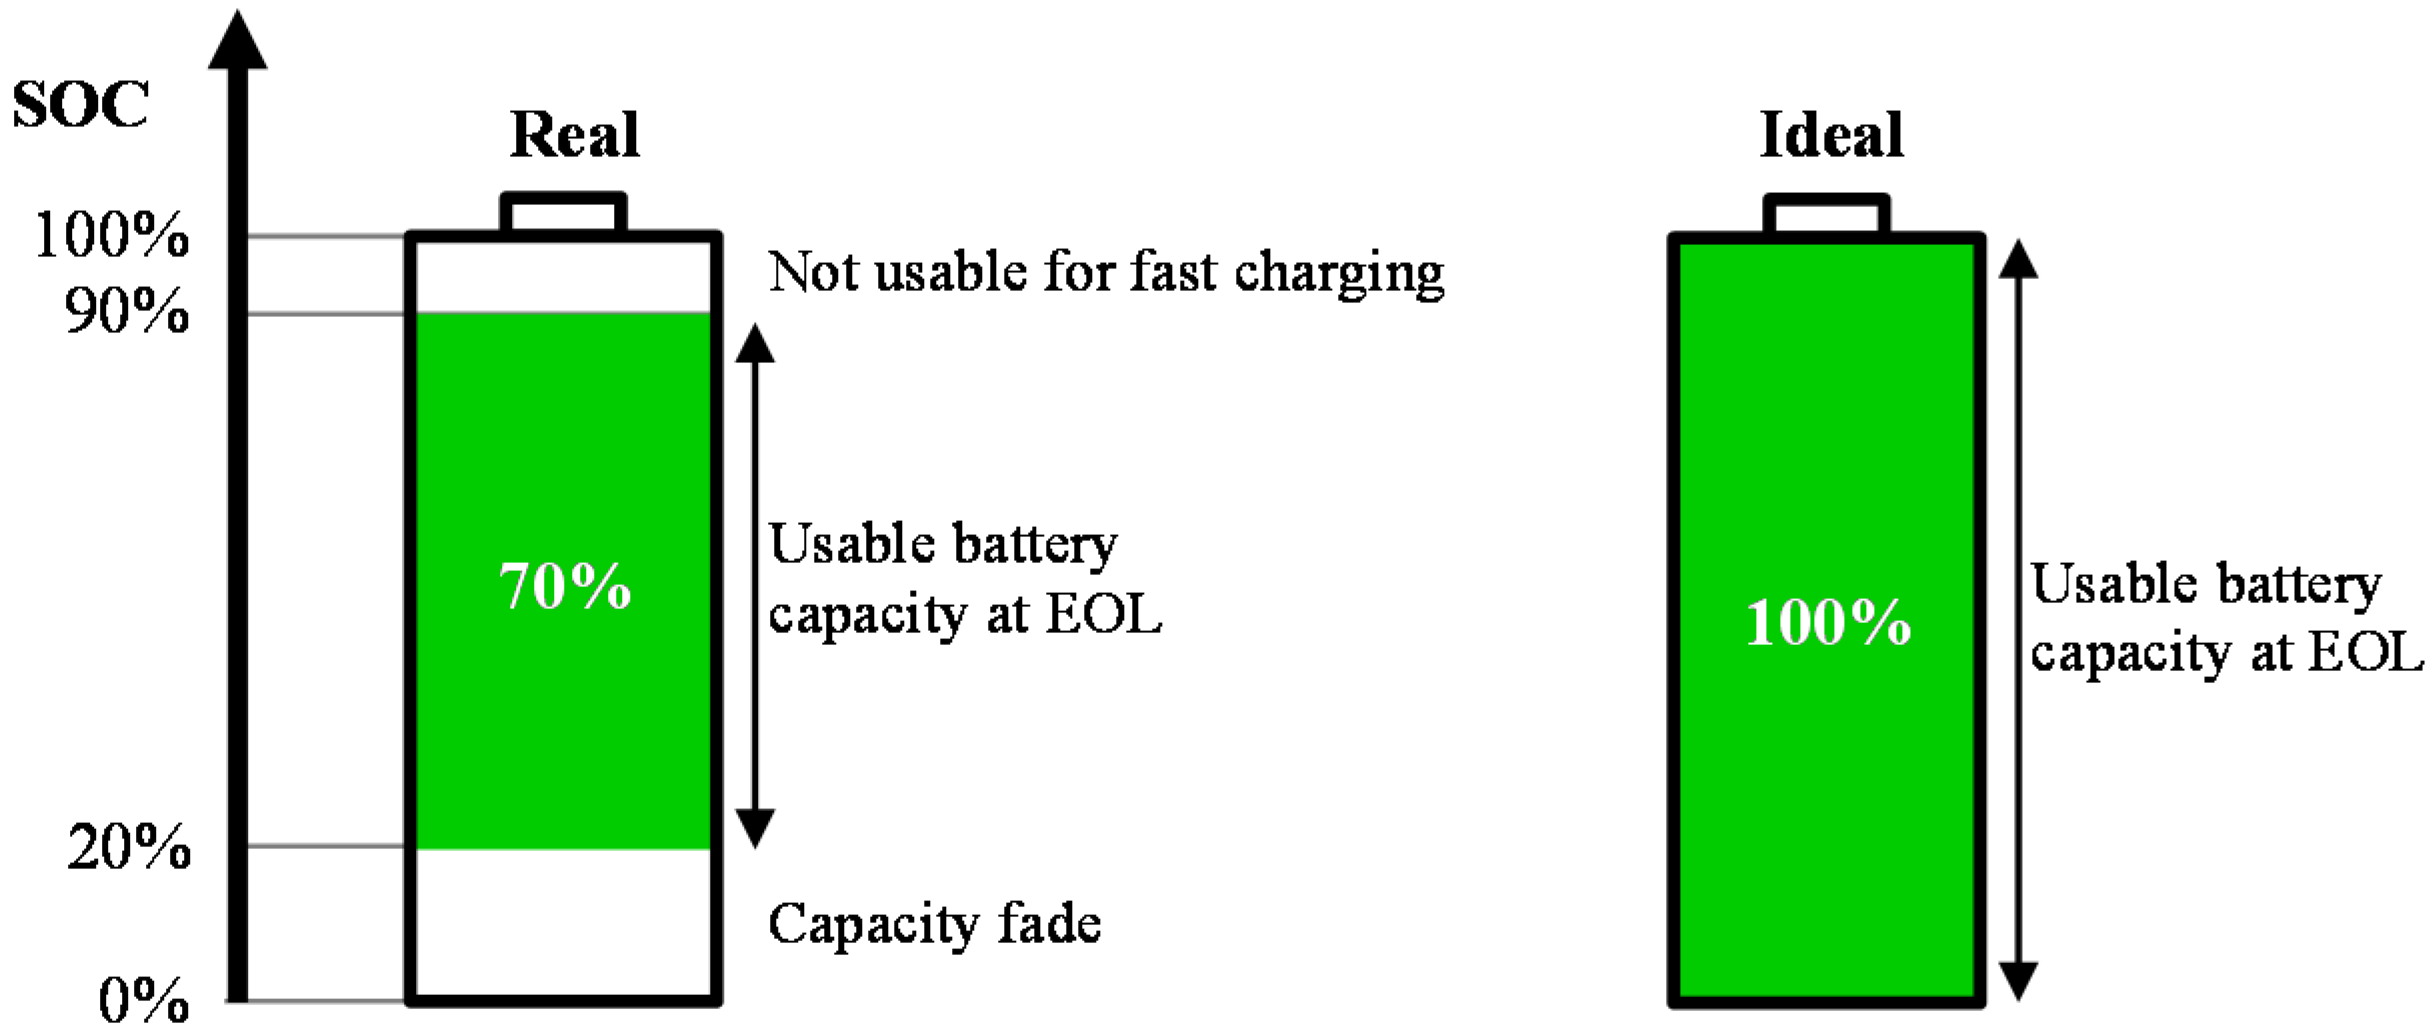
3.3. Battery Capacity

Different energy storages can be used for opportunity charging buses depending on the localization of the fast charging stations respectively the desired operating range and on the demanded charging power. Supercapacitors offer a very high charging power, but the energy density is rather low [33]. The operating range of the vehicle is therefore limited, so that charging stations at several bus stops along the route are required. The operating range can be increased when Supercapacitors are combined with a battery [15]. However, with the improvements in the lithium-ion battery technology their performance becomes sufficient for the opportunity charging application even without the use of Supercapacitors. Current battery systems in electric public transport buses are therefore mainly based on the lithium-ion technology (except of the 24 V lead acid batteries).
The capacity of a lithium-ion battery is not a constant value during its lifetime. It fades because of aging processes, which are time and usage depended [34]. The end of life (EOL) of a lithium-ion battery is usually defined as a remaining capacity of 80% or as a doubled internal resistance, whichever occurs first. The EOL conditions are important for the dimensioning of the battery capacity. To enable an unrestricted operation even at the EOL, a 20% reserve has to be taken into account. The fast charging application causes an additional reduction of the usable capacity due to the voltage limitation. At high SOCs the charging current has to be reduced in order not to exceed the upper voltage limit of the battery. This effect increases with the aging of the battery due to the increasing internal resistance [35]. The reduction of the current leads to an increase of the charging time, which contradicts the fast charging purpose. The upper region of the SOC can therefore not be used fast charging applications. This effect depends on the applied charging current and the used cell chemistry [35]. Figure 2 highlights the usable battery capacity at EOL of a typical NMC lithium-ion cell and of an ideal battery.
Figure 2. Usable battery capacity of an exemplary lithium-ion cell at EOL.
Energies 08 04587 g002
In this analysis, an ideal battery is used to achieve technological independence. The ideal battery can be charged to a SOC of 100% with the maximum charging current and the capacity does not fade during the lifetime of the battery. Nonetheless, the efficiency is taken into account in order to calculate realistic power profiles. The required capacity of the ideal battery is calculated based on the energy consumption of the service trips and the energy supply of the fast charging system. Therefore, the value differs according to the bus schedules. It is assumed that all buses, which are operated on the same bus route, have an identical battery system. The battery capacity must therefore cover the worst case scenario of the considered bus schedules on the route. The calculated capacity for the ideal battery can be transferred to real world conditions by multiplication with the oversizing factor. In the example in Figure 2 the factor is 1.43. It has been observed that the aging of a lithium-ion battery could depend on the applied cycle depth [36]. Therefore, it can be useful to use even higher oversizing factors to reduce the depth of discharge. However, this is always a tradeoff between the resulting weight of the battery system and the lifetime advantages.

4. Results and Discussion

The described bus network from Section 2 is analyzed with the calculation method described in Section 3 taking different charging power capabilities into account. The gained results are discussed with a broadening scope in this section, starting from the service trip over the route until the entire network scope. The first section focusses on the worst-case energy consumption of the service trip types on each bus route. The shown values reveal the minimum for the subsequent battery capacity calculation in the second part. The third part describes the proportion of routes, which can be electrified with a certain combination of charging power and battery capacity. The last part reveals the resulting power profiles of the charging stations and discusses the effects on the electrical grid.

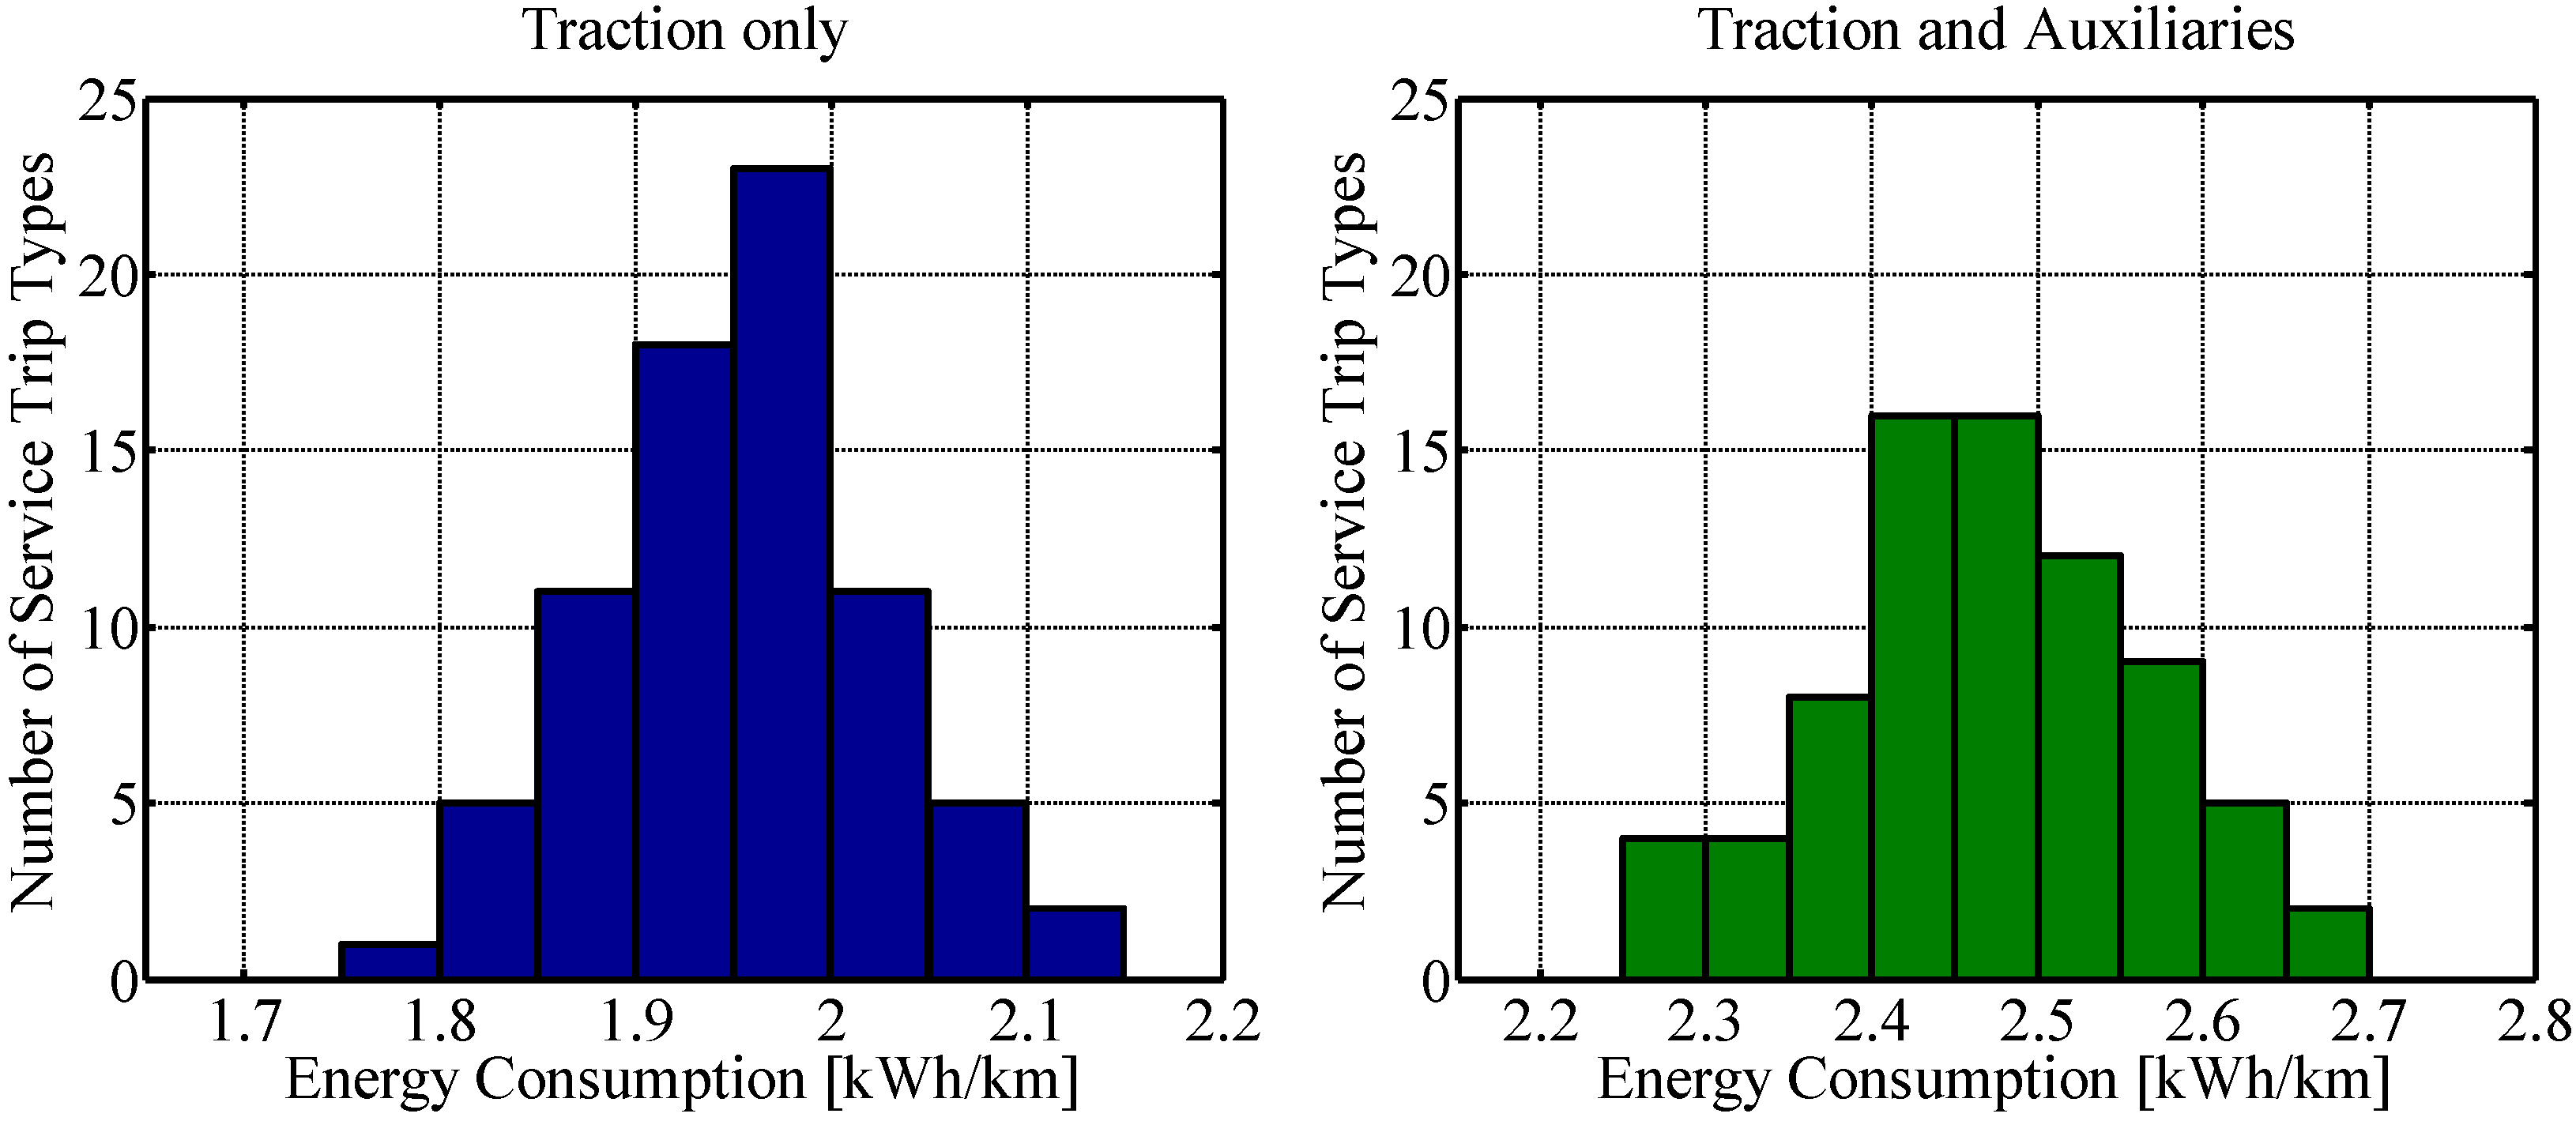
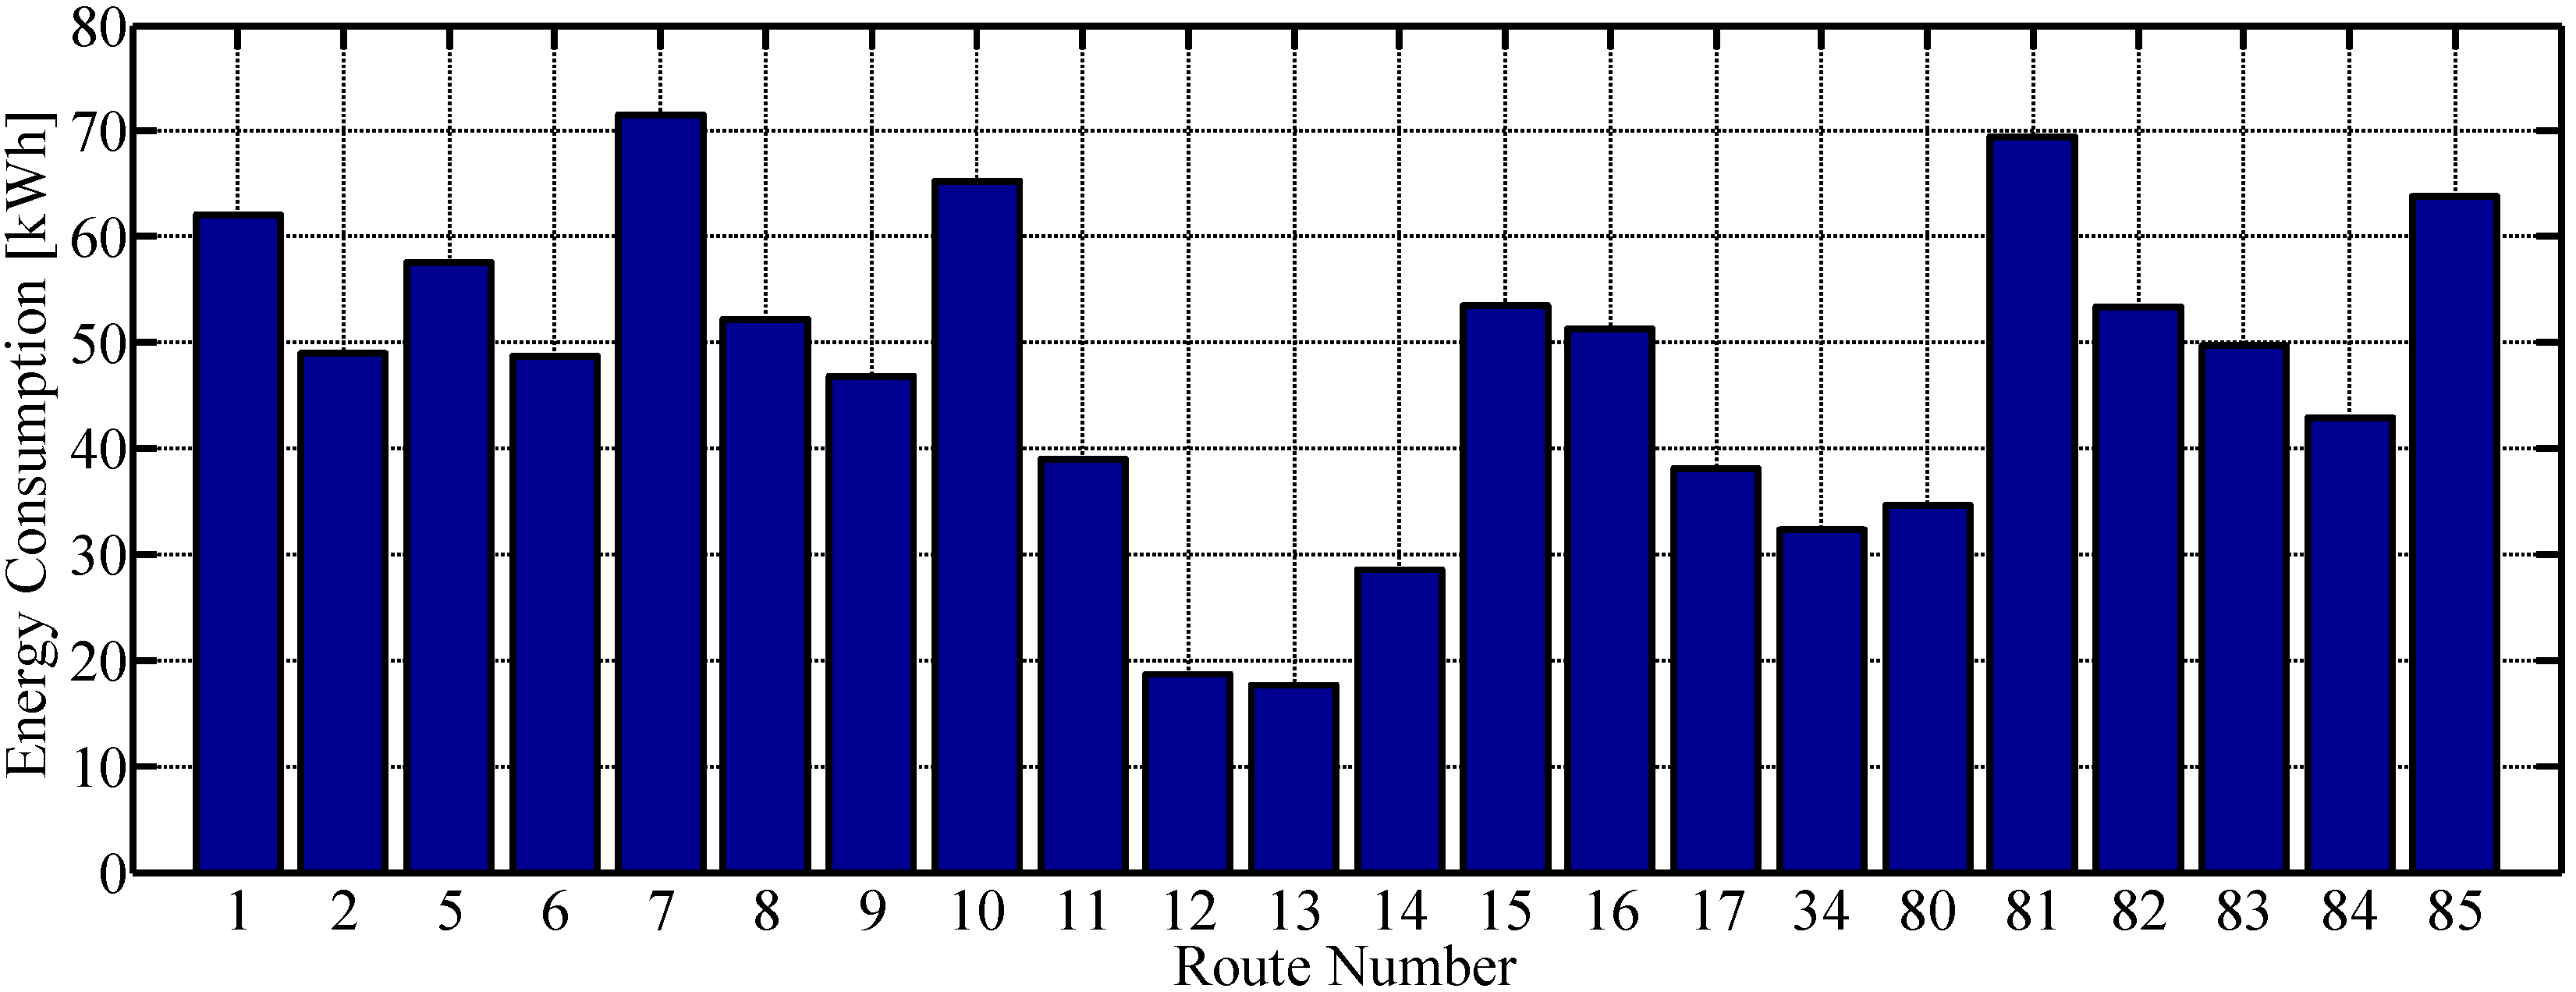
4.1. Energy Consumption

The entire bus network of “Stadtwerke Muenster” can be fully described, in terms of energy consumption, by the 76 service trip types. The service trip types have a different course and therefore a different track profile consisting of elevation data, required stops, traffic signs etc. The energy consumption of the auxiliaries is determined by the travel time. Two simulations are conducted to reveal the influence of the auxiliaries on the overall energy consumption. In the first simulation the auxiliary power is set to zero, so that the outcome represents only the traction energy. The values range from 1.79 to 2.10 kWh/km with an average of 1.96 kWh/km. The distribution is highlighted in Figure 3 on the left. Sinhuber proposed a value of 0.072 kWh/km·t [11], which leads to an energy consumption of 2.016 kWh/km for a bus with a weight of 28 t. This matches the simulation results of this analysis.
The energy consumption increases significantly when the auxiliaries are taken into account. The distribution of the results from the second simulation with the maximum auxiliary power of 9 kW is shown in the right part of Figure 3. The minimum value is 2.26 kWh/km and the maximum 2.69 kWh/km. The average value is about 2.47 kWh/km, which is an increase by 26% compared to the average value of the traction without auxiliaries. This observation confirms the necessity of including the auxiliaries in the overall energy consumption simulation. The defined scenario for the auxiliaries represents the summer with an active interior cooling, which will be the worst case condition, if a conventional heating system with fossil fuels is used in the winter. An electric heating system would increase the energy consumption of the auxiliaries as described in Section 3.1.
Figure 3. Histogram of the energy consumption of all service trip types.
Energies 08 04587 g003
Figure 4 gives an overview on the energy consumption of the individual bus routes. To enable a direct link to the required battery capacity for the bus route, only the service trip types with the highest energy consumption are shown. The values range from 18 kWh (route 13) to more than 70 kWh (route 7). These values represent the minimum requirements for the battery capacity of the bus routes and give a first indication on the electrification potential. However, it is not possible to draw a conclusion out of this data, unless the vehicle schedules are taken into account. As a consequence of the vehicle schedules, it is always possible that several short trips with minor energy consumption are combined without sufficient charging stops, so that the required battery capacity increases.
Figure 4. Highest energy consumption of the service trip types on the different routes.
Energies 08 04587 g004

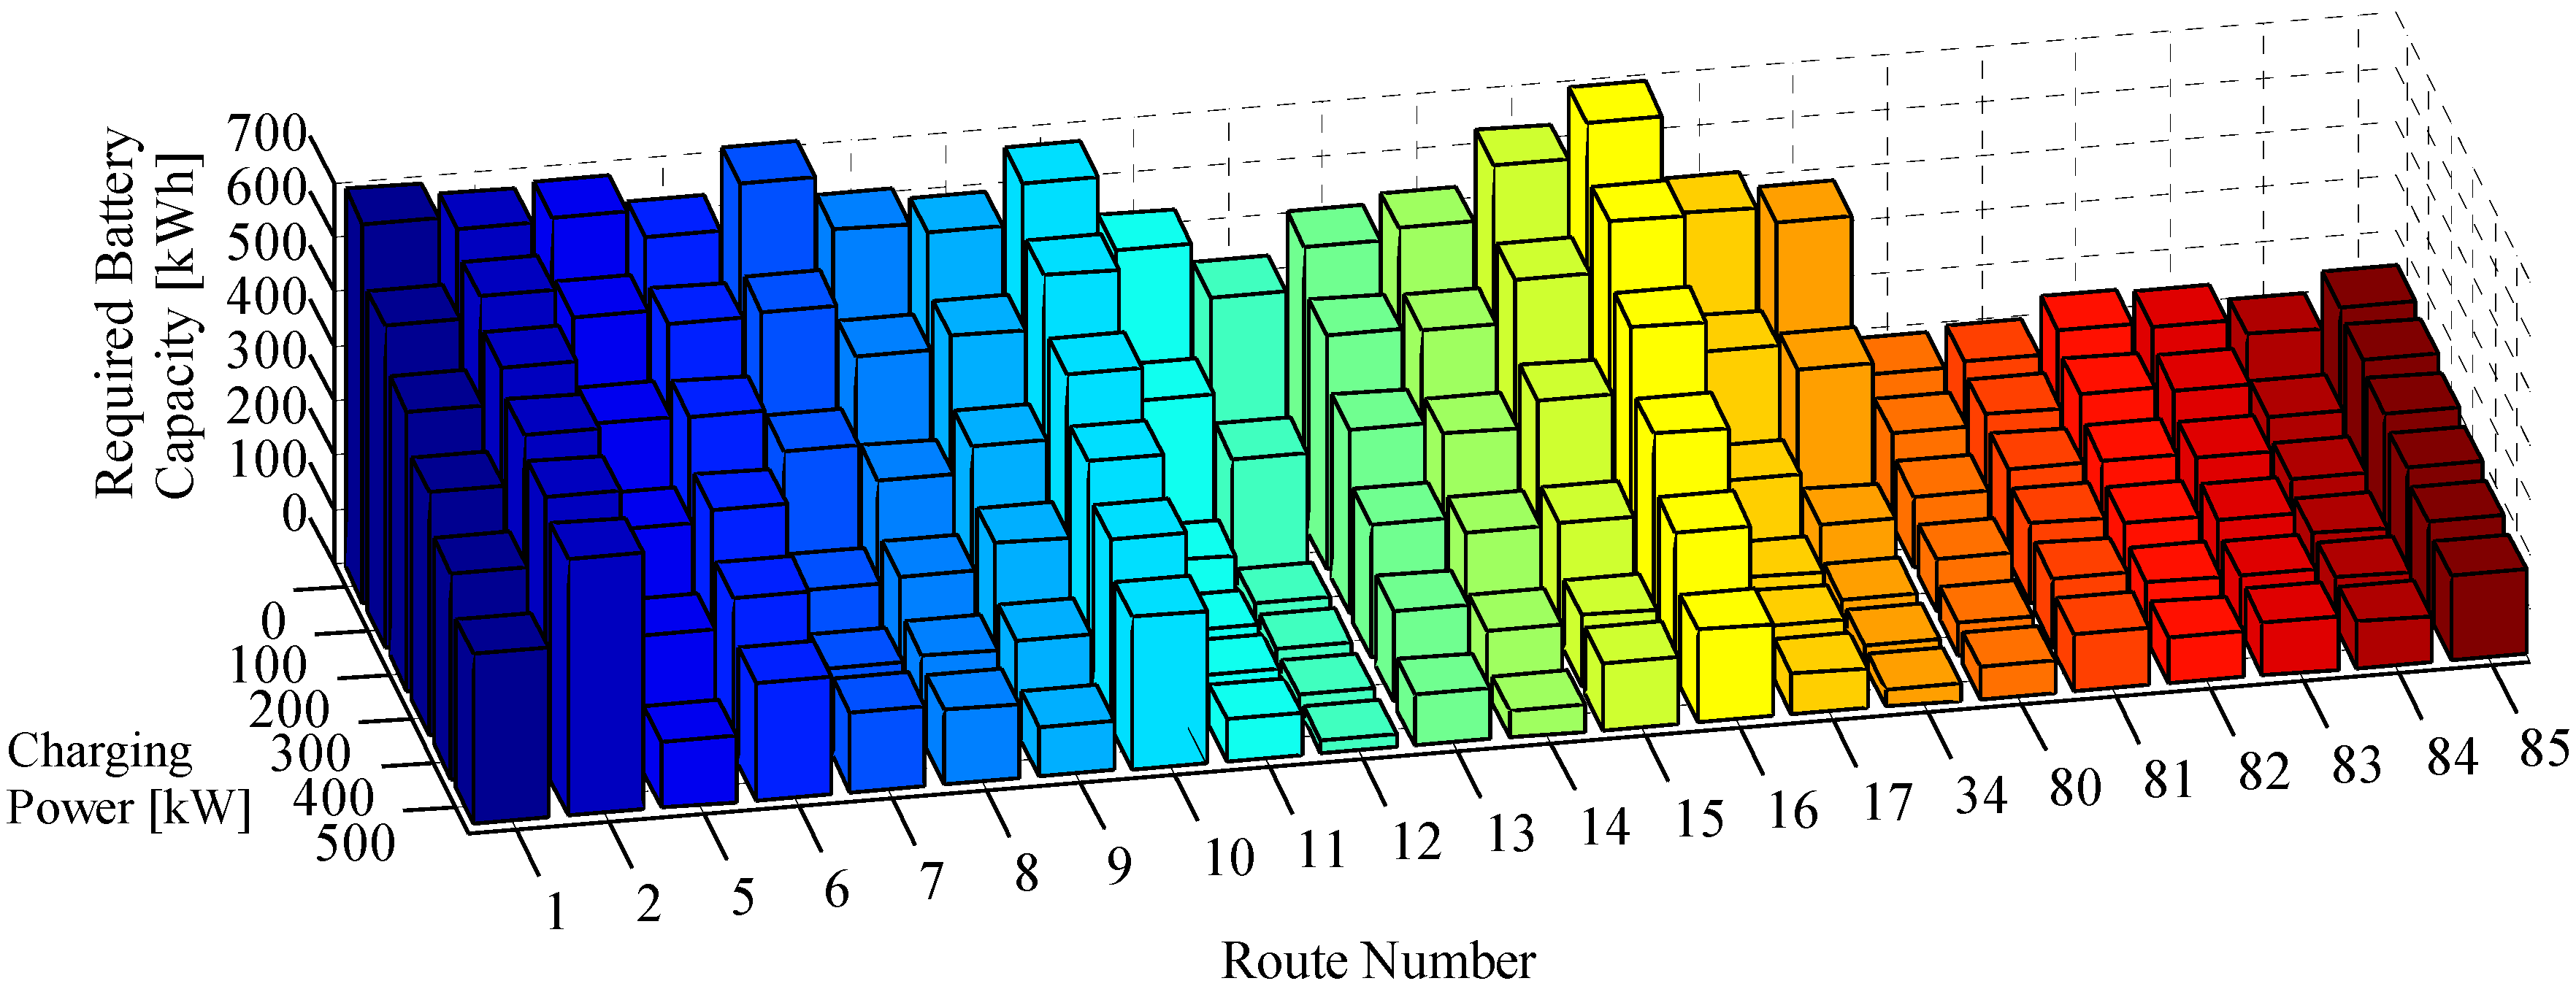
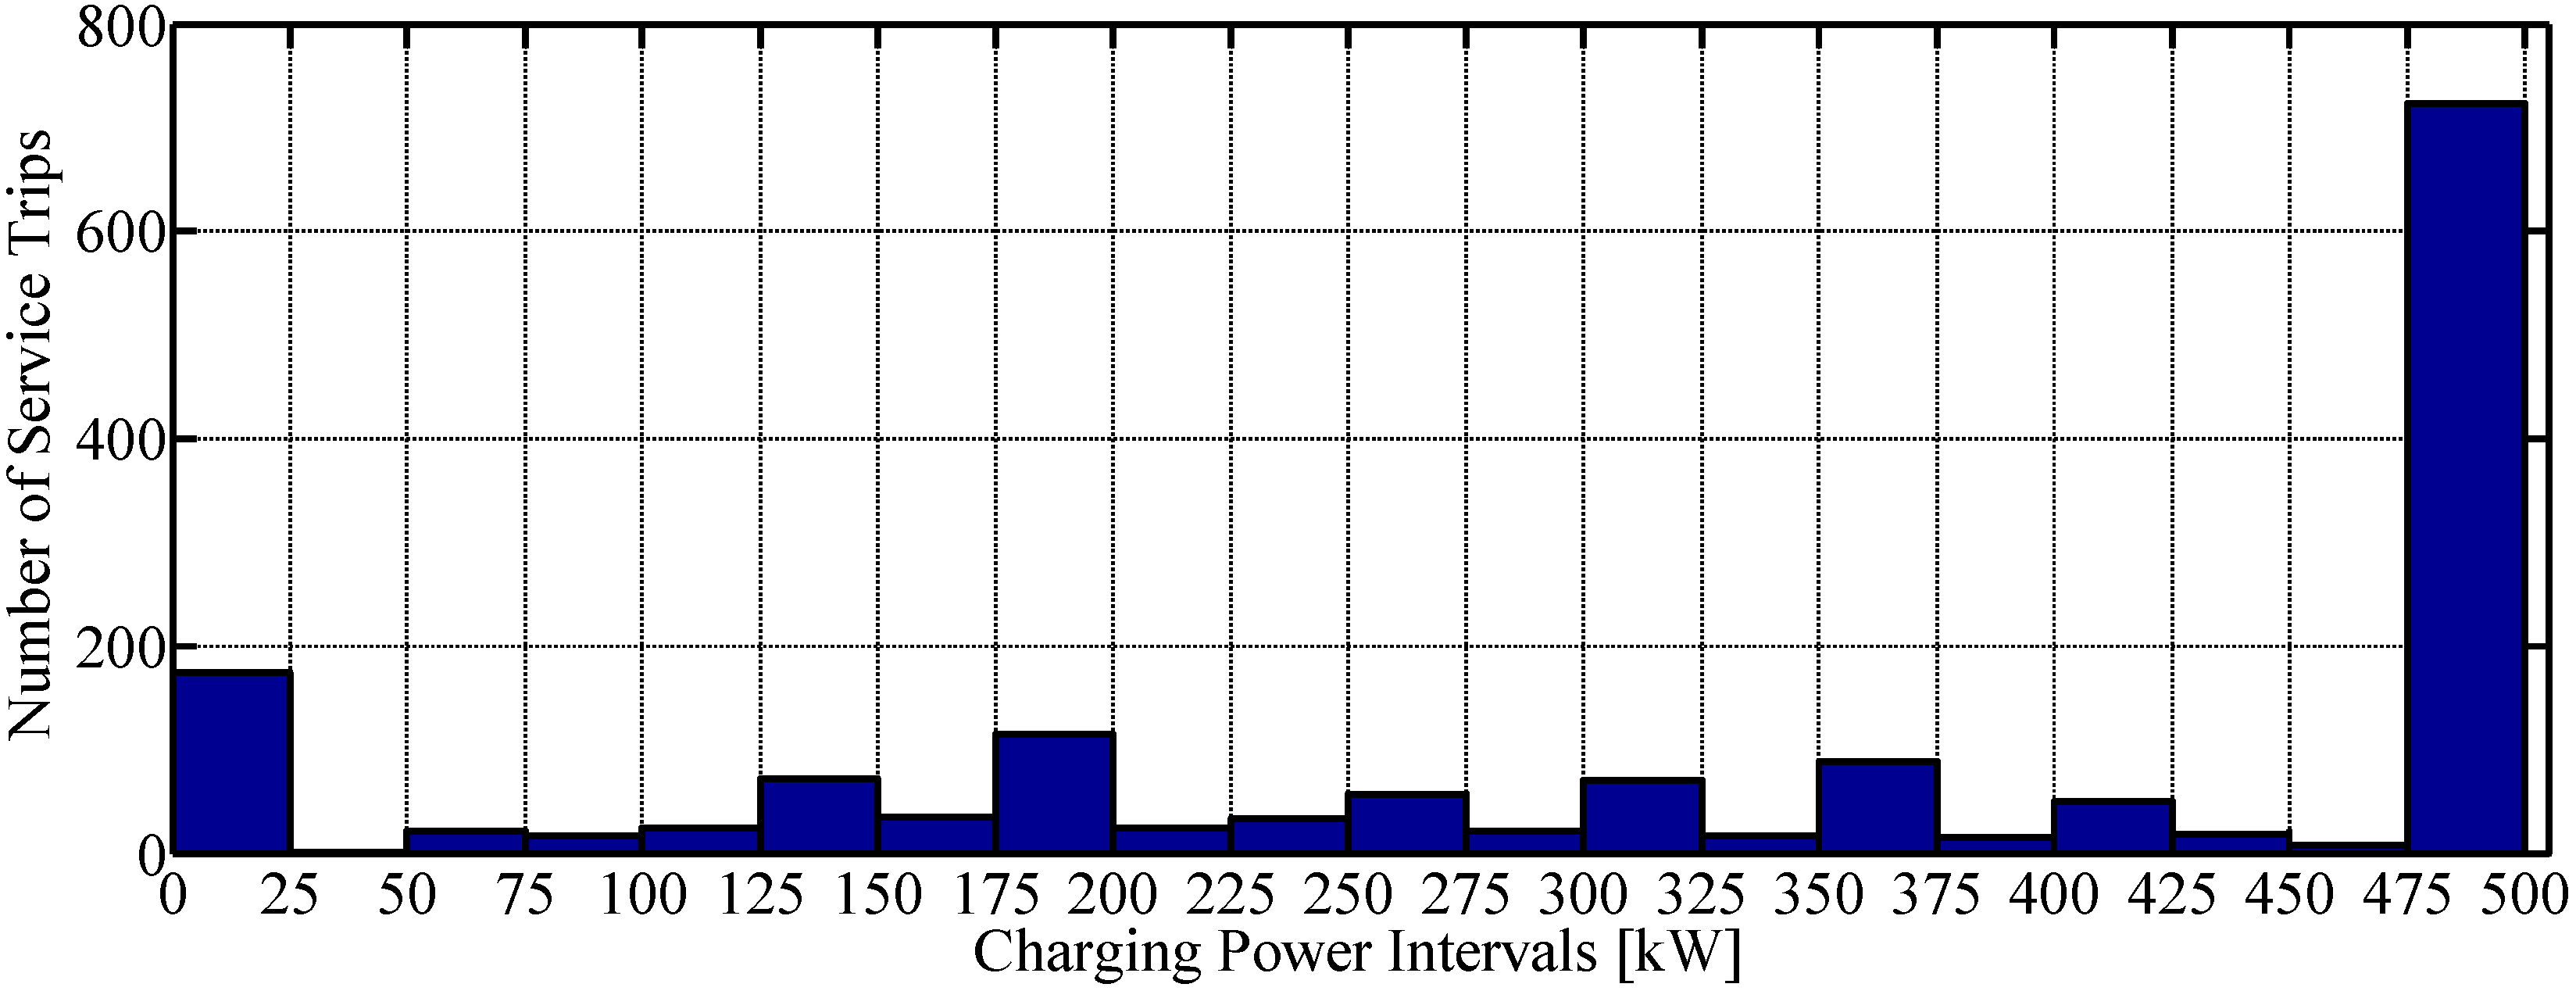
4.2. Impact of the Charging Power on the Required Battery Capacity

The service trip types are combined to vehicle schedules according to the set of identified service trips and the methodology described in Section 3.2. In this section, the required battery capacity is analyzed separately for every route taking the worst case condition and different charging power capabilities into account.
Table 4 reveals the results of the calculation. The values shown for the charging power of 0 kW represent a full day operation without recharging. For the day routes they range from 433 kWh (route 12) to 715 kWh (route 7) and the values for the night routes range from 192 kWh (route 80) to 243 kWh (route 85). The differentiation between the day and the night routes is also clearly visible in the visualization shown in Figure 5. The different routes are shown on the x-axis, the charging power on the y-axis and the required battery capacity on the z-axis.
Table 4. Required usable battery capacity in kilowatt hours (kWh) for different charging power limits.
RouteCharging Power [kW]RouteCharging Power [kW]
01002003004005000100200300400500
16955905144463793111453142531521511649
267262958053750447115632504362219130122
568057846435023612216697595481367267169
663055046037029021517515342186898274
77155593852111461463448529691353333
861446331522015513780192163129946058
95944863642671699281201184165145126106
106715824824033402798224320716613310484
115333391247676768323620015812510296
124332173229262384207138105848484
135124303372451669485243227209191173155
Figure 5. Required capacity of the ideal battery over charging power for every bus route.
Energies 08 04587 g005
The limiting factor for the installable battery capacity in an electric bus is the weight. Thus, it is always a tradeoff between passenger and battery capacity. The unloaded weight of an electric 18 m articulated bus is estimated to 14.5 t. It includes the weight of the electrical traction system, but not the weight of the battery system. Taking into account the defined gross vehicle weight in Section 3.1 of 28 t, the bus offers a theoretical passenger capacity of 180 people. The passenger capacity of conventional 18 m articulated buses range from 140 to 160 persons depending on the unloaded weight of the bus [37,38]. Current lithium-ion battery systems for fast charging applications achieve energy densities of about 100 Wh/kg on system level [39,40]. Even the battery system of the weight optimized BMW i3 is in this range [41]. The maximum installable battery capacity can be calculated by:
E m a x = ( m b u s   t o t a l n p a s s e n g e r s m p a s s e n g e r m b u s   u n l o a d e d ) ω b a t t e r y  
With a total mass of 28 t, 140 passengers of 75 kg, an unloaded weight of 14.5 t and an energy density of 100 Wh/kg of the battery system the maximum installable battery capacity can be calculated to 300 kWh (ideal battery). Taking the oversizing factor of 1.43 into account reveals that the usable capacity at the EOL of the battery is limited to 210 kWh for a state-of-the-art lithium-ion system. Under this condition, only some night routes can be electrified without opportunity charging. A partly electrification of a small proportion of the day routes and a large part of the night routes requires at least a charging power of 200 kW.
The required battery capacity decreases with an increasing charging power. This effect is expected and can be observed for every route. The intensity of the decline differs among the routes. The required battery capacity for route 12 decreases very rapidly and reaches a value close to the minimum with a charging power of 200 kW. A further increase of the charging power has only a limited effect. This can also be observed for route 7, 11, 17, 34 and 84. Other routes like for example route 1 show a different behavior. The required battery capacity decreases even at the step from 400 kW to 500 kW. A further increase of the charging power is required, when the battery capacity should be minimized. The intensity of the decline is mainly caused by the available charging time. Therefore, it would be beneficial to express the slope based on the information on the dwell time of the vehicle schedules. However, this is not possible due to the limitation of the SOC of the battery. Additional charging time is not useful, when the battery is already charged to 100%. It is therefore mandatory to focus always on the resulting profiles instead of only on single values.
The results shown in Figure 5 indicate clearly that it is beneficial to focus on the entire vehicle schedules instead of focusing on single trips as in Figure 4. Route 2 has for example less than 50 kWh energy consumption per trip, which sounds manageable for an electrification. However, the route is operated heavily without sufficient charging time. The analysis of the vehicle schedules reveals that route 2 is the most problematic route to electrify. Another example is route 7 with an energy consumption per trip of more than 70 kWh. The analysis of the vehicle schedule reveals that the route can be operated with a charging power of 400 kW and a minimized battery capacity of 146 kWh, which points out that even routes with a high energy demand can be electrified if the dwell time at the terminal stop is sufficient.
The discussed values for the charging power describe the maximum power capability of the charging station. The power demand of the vehicles may be less than the offered charging power, depending on the energy consumption and the available charging time. Figure 6 highlights the distribution of the applied charging power for the 1588 service trips in the 500 kW scenario. The interval between 0 and 25 kW is dominated by the trips without any charging possibility. Due to the insufficient dwell time, no charging action can take place. A large part (46%) of the charging processes uses a charging power between 450 kW and 500 kW. This high proportion is caused by the definition of the charging process. Every vehicle tries to charge its batteries as fast as possible even if there is plenty of time at the next terminal stop. This issue can be solved with an intelligent control algorithm. The algorithm has to predict the future charging possibilities for the vehicle so that an optimization of the charging power can take place. The optimization criteria in this case would be the resulting life-cycle costs for the entire system taking the costs for the charging infrastructure as well as the costs for the battery system into account.
Figure 6. Histogram of the applied charging power for all 1588 service trips in the 500 kW scenario.
Energies 08 04587 g006

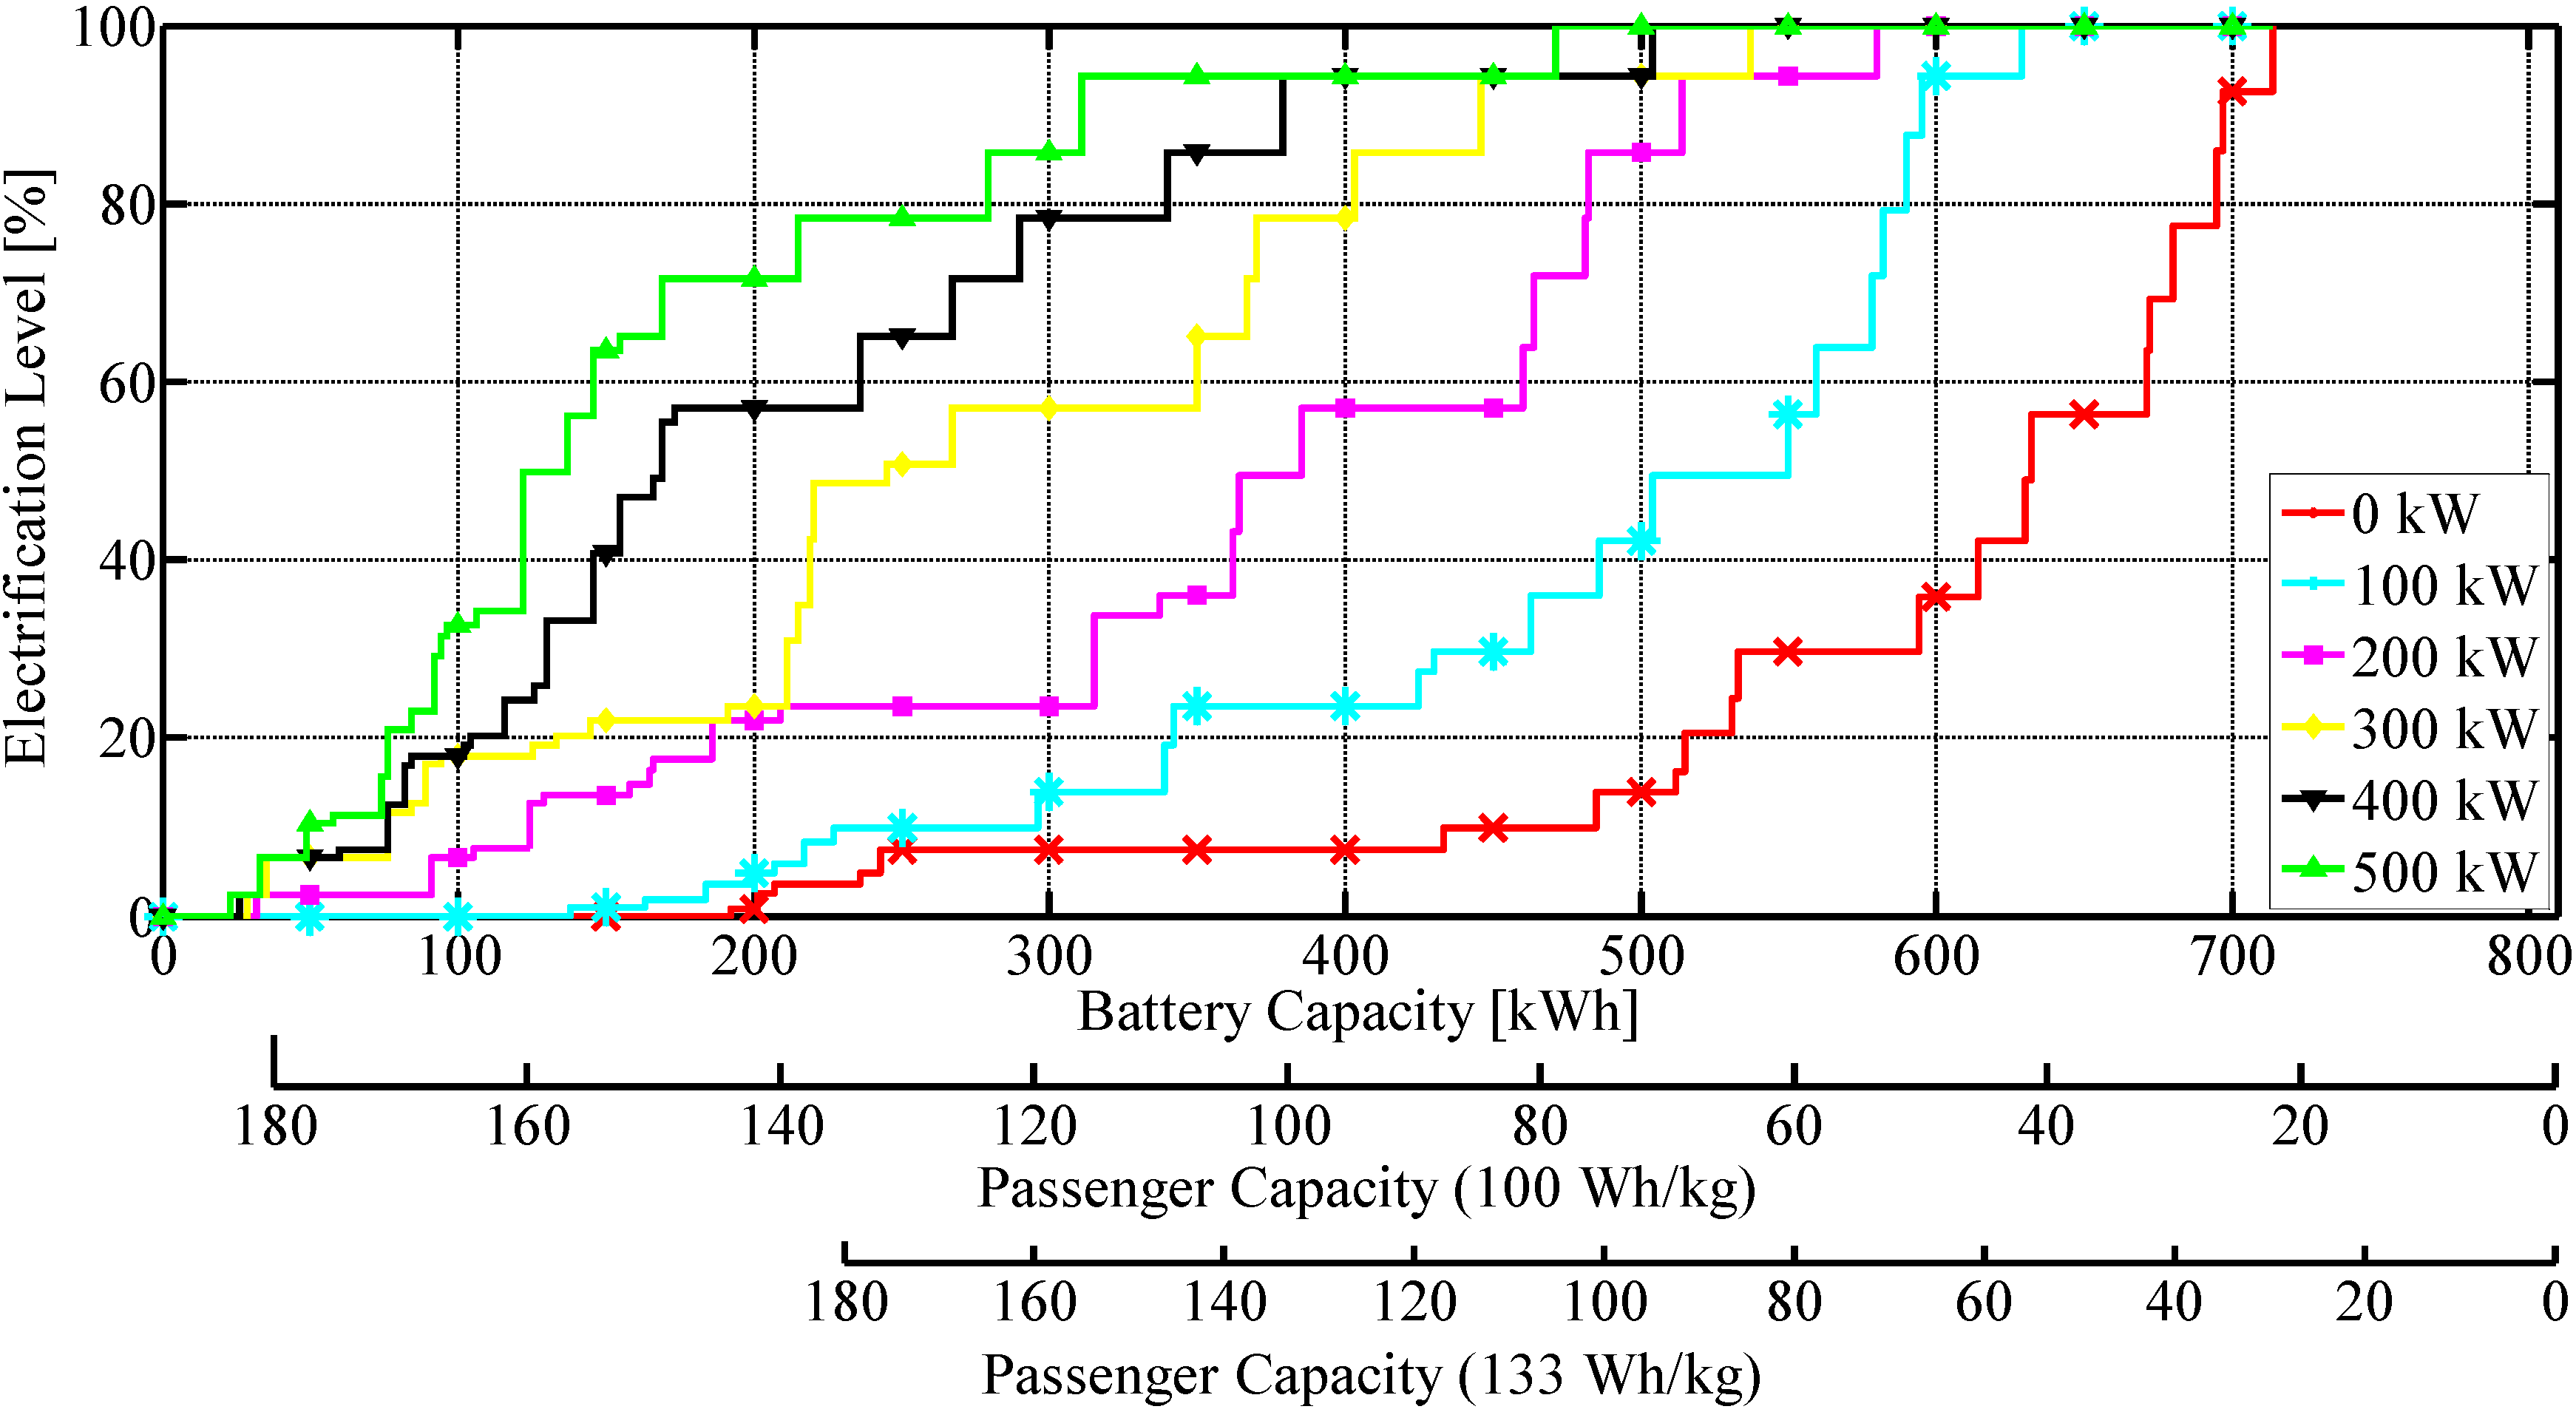
4.3. Electrification Level of the Bus Network

The electrification level reveals the percentage of a given bus network which can be electrified with a certain charging power and battery capacity. It is measured route wise and weighted based on the daily driven distance of each bus route. The weighting of the electrification level with the daily driven distance enables a direct connection with the CO2 reduction potential, if CO2 neutral electricity is used for the charging. An electrification level of 100% for a bus network means that all trips on all routes can be carried out with the defined charging power and battery capacity, even under worst-case conditions.
The described calculation procedure for the minimum battery capacity does not require that the whole energy consumed during operation is charged on the track. An energy deficit at the end of the shift is allowed. This leads to an additional charging overnight in the bus depot, where it can be done with lower power than the charging on the track due to the long dwell time.
The calculated electrification levels are shown in Figure 7. The night routes can easily be identified when the 0 kW curve is considered. Their required capacity of the ideal battery is less than 300 kWh, but the influence on the electrification level is rather low, due to their limited daily driving distance. The influence of the increasing charging power can be assessed based on the gap between the colored curves. The gap fades with an increasing charging power, because some routes have already reached the minimum value for the required battery capacity. An increase of the charging power from 400 kW to 500 kW has therefore only limited effects. In Section 4.2, route 2 was identified as the most problematic route to electrify. The influence of route 2 can also be observed in Figure 7. The electrification level above 95% is dominated by route 2. An increase of the charging power has only a minor impact due to the extremely limited charging time.
Figure 7. Electrification level of the bus network as a function of usable battery capacity and charging power.
Energies 08 04587 g007
The second and third x-axis in Figure 7 highlight the tradeoff between battery and passenger capacity. The resulting passenger capacity is calculated based on the parameters discussed in Section 4.2, taking the oversizing factor of 1.43 and a specific energy density of the battery system into account. The value of 180 passengers can be seen as the maximum, due to the available space inside the vehicle. The second x-axis bases on a specific energy density of 100 Wh/kg, which is a realistic value for current battery systems. It can be seen that an electrification level above 20% with a passenger capacity of 140 people can only be reached with a charging power of at least 200 kW. The electrification level can be increased to 50% with a charging power of 300 kW and a battery capacity of 220 kWh. A further increase of the charging power to 500 kW enables an electrification level of about 80%, with a passenger capacity of nearly 140 people. The electrification level exceeds 90% by decreasing the passenger capacity to 115 people and therefore increasing the installed battery capacity to 310 kWh. The third x-axis is also calculated based on the oversizing factor of 1.43, but the specific energy density for the battery system is set to 133 Wh/kg, which represents an estimation for the future technological development. Considering the increased energy density, an electrification level of 90% and a passenger capacity of over 150 people can be achieved with a charging power of 500 kW.
The analysis reveals that a significant electrification level and therefore a significant CO2 reduction can be achieved with state of the art fast charging battery bus technology. This is possible even in the worst-case scenario without changing the current bus timetables. A defined electrification level can be reached by different combinations of charging power and battery capacity. However, this analysis proves the technical feasibility. The most economical solution has to be identified in life-cycle-cost calculations taking into account investment costs for infrastructure and vehicles, maintenance costs, replacement costs as well as energy costs. The result is always a tradeoff between battery capacity and charging power, which causes the lowest life-cycle costs for the entire system. It can for example be beneficial to increase the battery capacity in order to be able to reduce the charging power at critical locations or even to omit the construction of a certain charging station. Furthermore, an increase in the number of operated buses and an adaptation of the vehicle scheduling could extent the dwell times and therefore lower the required battery capacity and charging power. However, the additional costs for the further vehicles and drivers have to be compensated by the savings. This optimization problem is highly complex, because it addresses technical issues as the dimensioning of the components as well as the area of operations research in terms of vehicle scheduling and crew rostering.

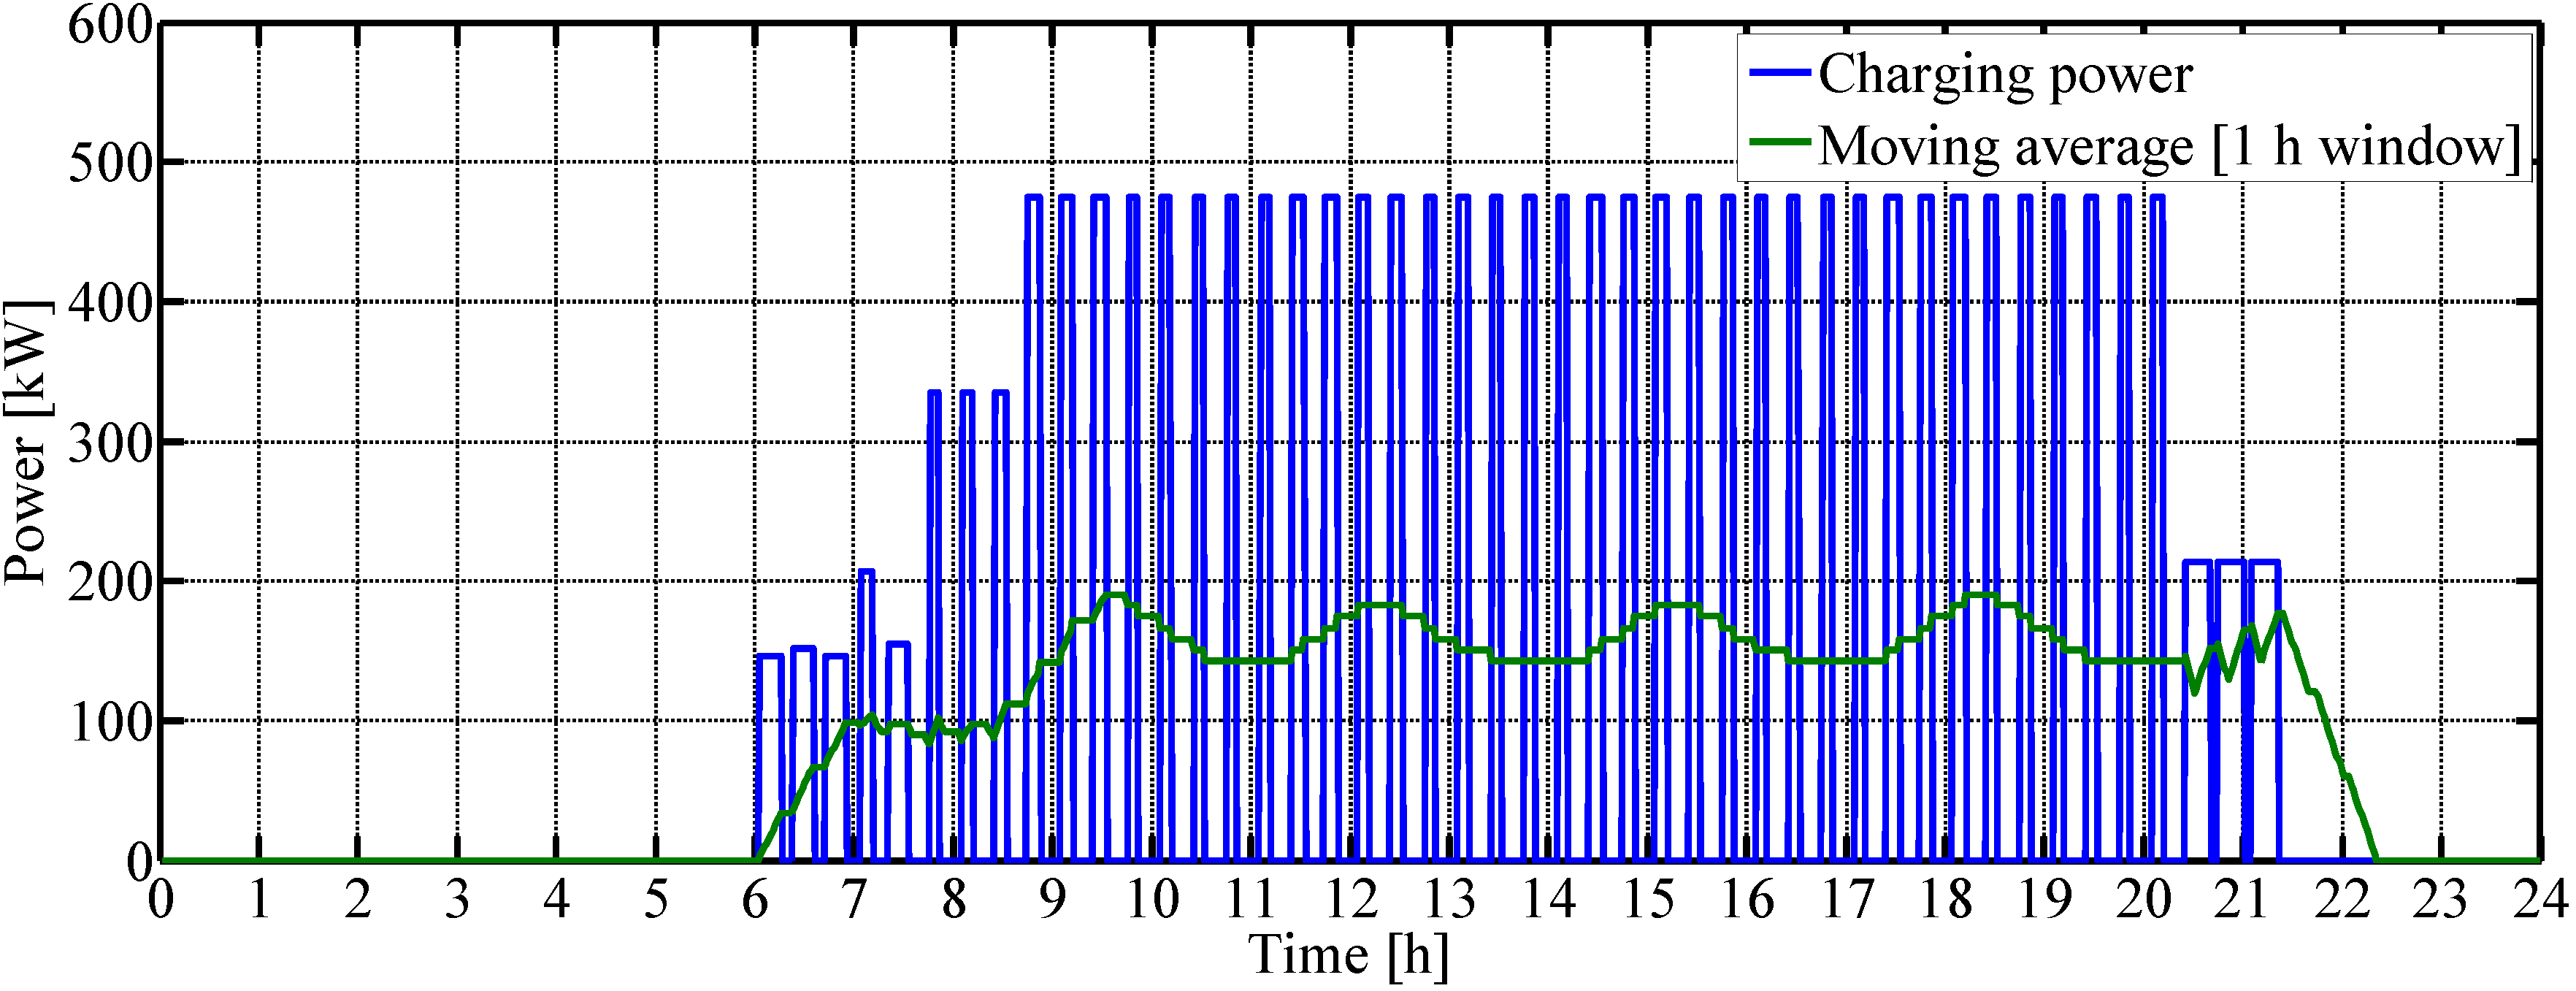
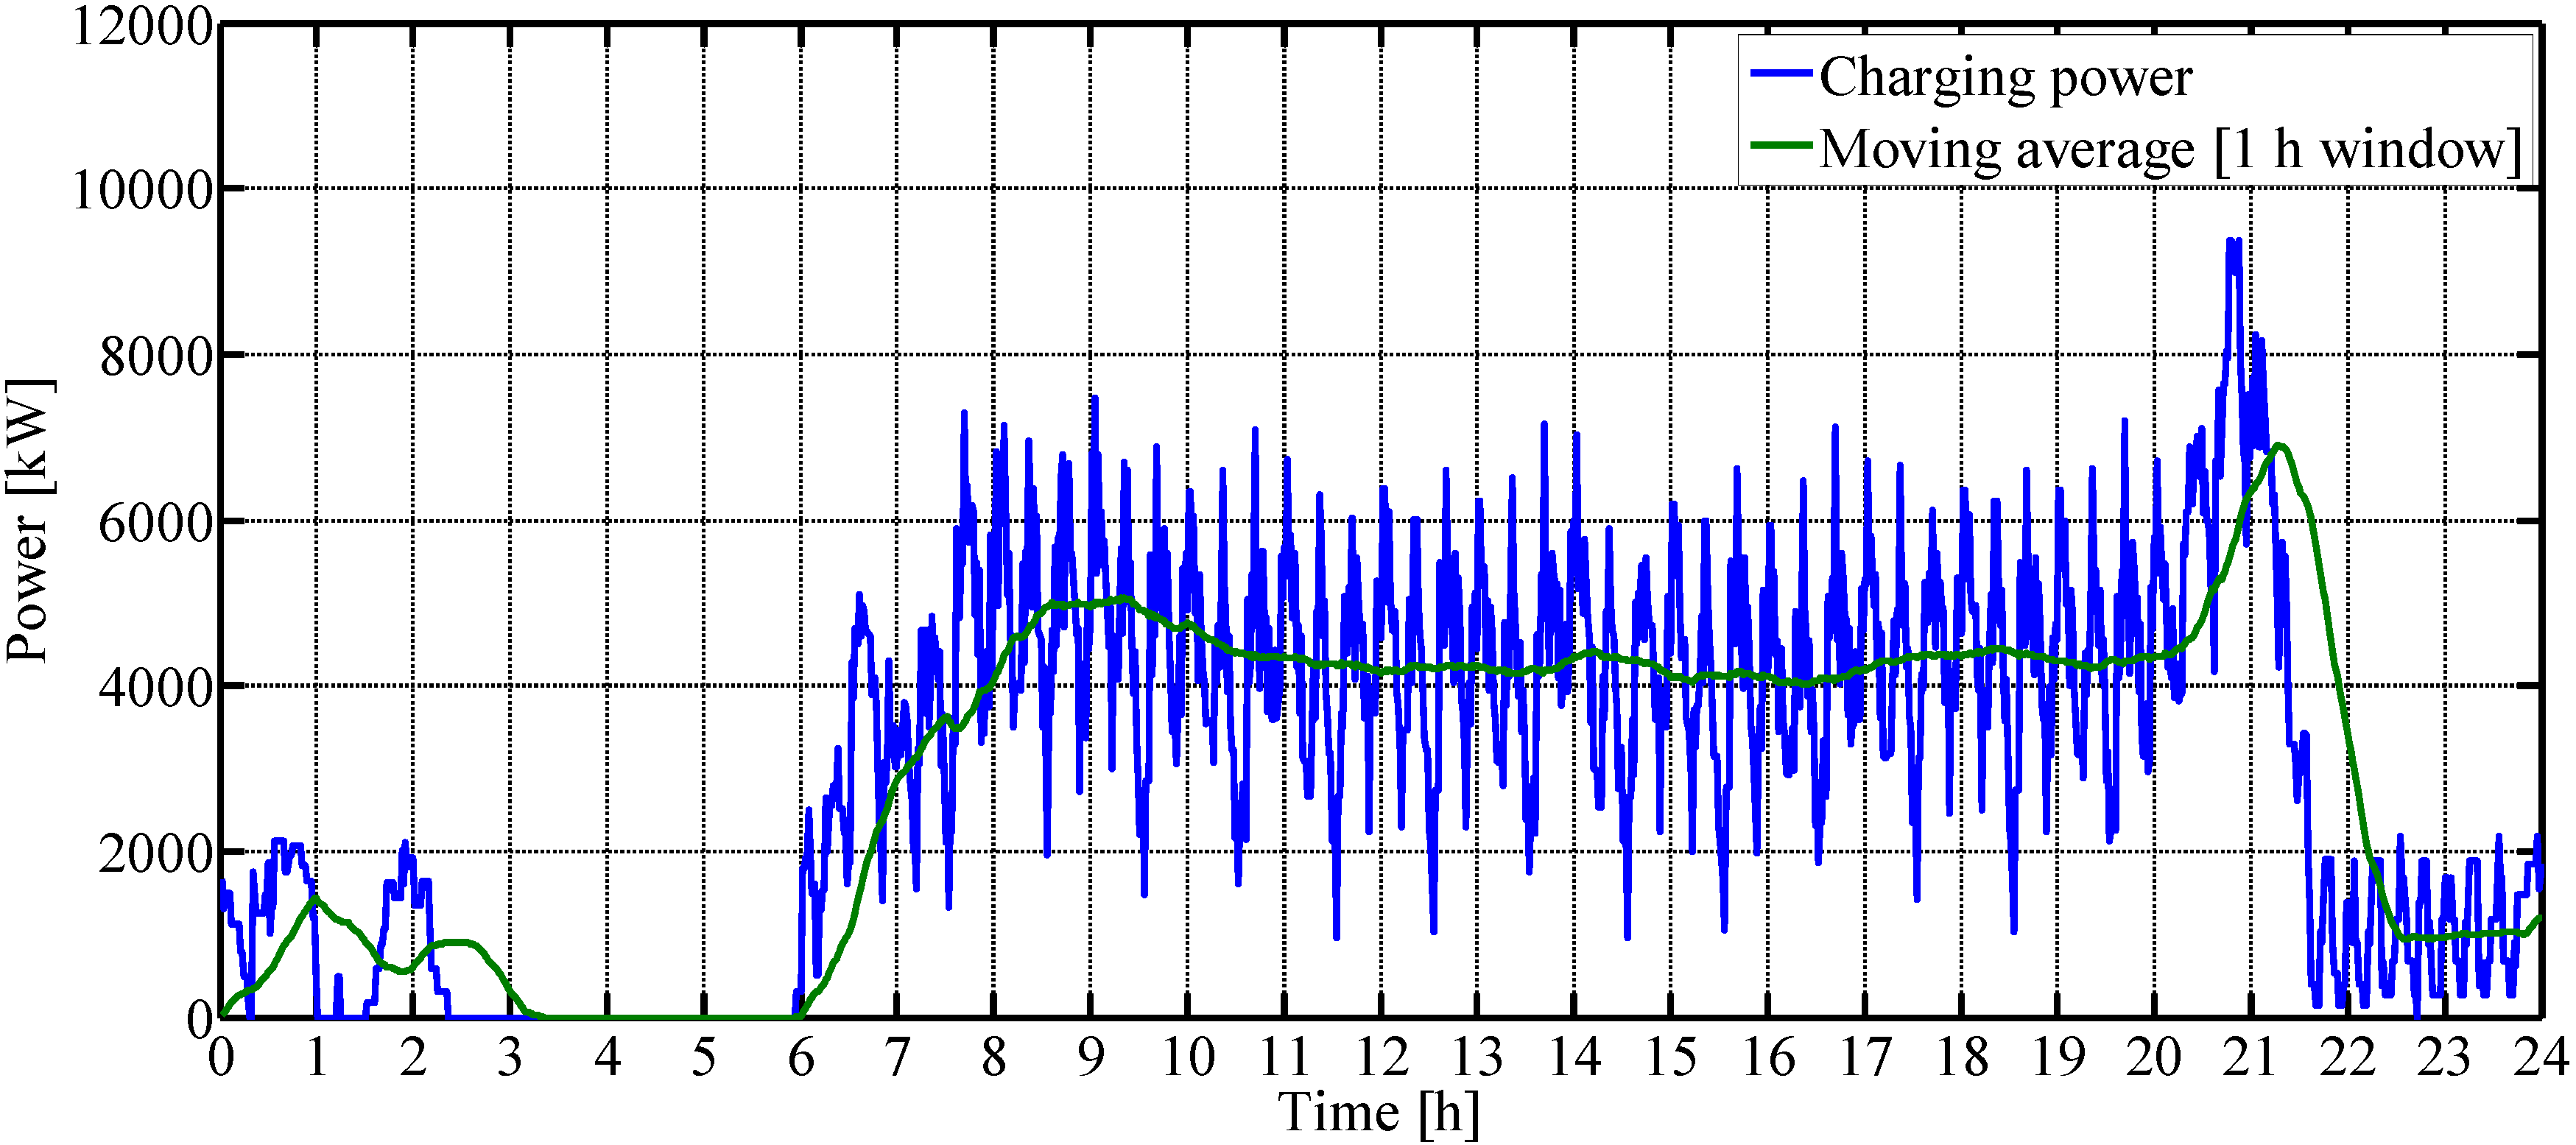
4.4. Grid Load Profile

The electrification of bus networks with fast charging battery bus systems influences not only the transport sector. The high power demand of the buses cause also effects in the electrical grid. Figure 8 shows an exemplary power profile of the charging station at “Gallenkamp” with a maximum charging capability of 500 kW. The maximum charging power is not demanded in this case. The dwell time is sufficient for a complete charging of the battery even at a lower power of 475 kW. The shape of the power profile has a high dynamic. The sporadic peaks with a delta of 475 kW could cause problems in the electrical grid. The peaks can be equalized with peak shaving strategies. A stationary battery can for example buffer energy when no bus is charged and supply this energy afterwards in the charging process [42,43]. The moving average in Figure 8 gives a first indicative on the resulting power profile utilizing such a system. Another advantage of the peak shaving is that the grid connection costs for the bus operator could be reduced, because the operator has to pay a monthly fee for the installed power capability regardless of using time [44]. The optimal configuration for a peak shaving system can be determined by life-cycle-cost calculations taking the invest costs for the grid connection, the stationary storage and the monthly fee for the grid connection and consumed electricity into account.
The power profiles of all 44 charging stations can be merged to a power profile of the entire network, which is presented in Figure 9. The power profiles of the individual charging stations overlap, so that a continuous load is applied to the grid. However, the resulting power profile has still intensive fluctuations. The frequency is caused by the 20 min intervals of the bus schedules. The highest value of more than 9 MW is demanded in the evening, when the buses that serve the day routes finish their shift. The defined interval of 20 min for the charging at the end of the shift is longer than the usual dwell time. This leads to an increasing overlap between the individual charging processes. A decrease of this time frame and therefore a shift of the charging process to the bus depot can lower this peak.
The power profile of the entire network is not applied at only one single location. The individual charging stations, which are located throughout the city, are connected to the local electricity grid. The overall power profile has therefore in addition to the time also a geographical dependency, which has to be taken into account in the realization of the fast charging system in order to ensure the stability of the electricity grid.
Figure 8. Power profile of the charging station at “Gallenkamp” with a charging capability of 500 kW.
Energies 08 04587 g008
Figure 9. Power profile of the entire bus network with a charging capability of 500 kW per bus.
Energies 08 04587 g009

5. Conclusions

This work analyzed the existing bus network of the German city of Muenster regardless its electrification potential with fast charging battery buses. State of the art fast charging technology was presented and the locations of 44 fast charging stations were derived out of the bus network data. The energy consumption for individual service trip types was calculated for 18 m articulated buses and combined to vehicle schedules for every route. The analysis points out that it is necessary to focus on the entire vehicle schedules instead of individual trips, when the required battery size is calculated. It has been shown that 50% of the service trips can be electrified with a charging power capability of 300 kW and a usable battery capacity of 220 kWh. This is possible even under worst-case conditions using currently available battery systems and without any changes in the existing schedules. An increase of the charging power capability to 500 kW enables an electrification level of about 80%. The resulting power profiles for the charging stations have a high dynamic. Therefore, it can be beneficial to install additional hardware at the charging stations to equalize the load. The tradeoff between the required battery capacity and the passenger capacity was explained in detail. A reduction of the demanded passenger capacity enables an increase of the installable battery capacity, so that the required charging power can be reduced. This analysis proves the technical feasibility of the electrification with fast charging battery buses. Based on this, the cost-optimized electrification scenario can be derived in a life-cycle-cost calculation.

Acknowledgments

The work was conducted as part of the Climate-KIC research project LoCarUT funded by the European Institute of Innovation and Technology (EIT).

Conflicts of Interest

The authors declare no conflict of interest.

References

  1. Brunton, L.J. Why not the trolleybus? In Proceedings of the IEEE Seminar on Electric, Hybrid and Fuel Cell Vehicles, Durham, UK, 11 April 2000; p. 5.
  2. Wu, W.; Bucknall, R.W.G. Conceptual evaluation of a fuel-cell-hybrid powered bus. In Proceedings of the 48th Universitiesʼ Power Engineering Conference (UPEC), Dublin, Ireland, 2–5 September 2013; pp. 1–5.
  3. Kellaway, M.J. Hybrid buses—What their batteries really need to do. J. Power Sources 2007, 168, 95–98. [Google Scholar] [CrossRef]
  4. Sasaki, M.; Araki, S.; Miyata, T.; Kawaji, T. Development of capacitor hybrid system for urban buses. JSAE Rev. 2002, 23, 451–457. [Google Scholar] [CrossRef]
  5. Xiong, W.; Zhang, Y.; Yin, C. Optimal energy management for a series–parallel hybrid electric bus. Energ. Convers. Manag. 2009, 50, 1730–1738. [Google Scholar] [CrossRef]
  6. Klingner, M.; Potthoff, U. The AutoTram: A system integration platform of multiple energy storage and transfer concepts. In Proceedings of the VDE Kongress 2010, Leipzig, Germany, 8–9 November 2010.
  7. Wang, X.; He, H.; Sun, F.; Sun, X.; Tang, H. Comparative study on different energy management strategies for plug-in hybrid electric vehicles. Energies 2013, 6, 5656–5675. [Google Scholar] [CrossRef]
  8. Kühne, R. Electric buses—An energy efficient urban transportation means. Energy 2010, 35, 4510–4513. [Google Scholar] [CrossRef]
  9. Campanari, S.; Manzolini, G.; Garcia de la Iglesia, F. Energy analysis of electric vehicles using batteries or fuel cells through well-to-wheel driving cycle simulations. J. Power Sources 2009, 186, 464–477. [Google Scholar] [CrossRef]
  10. Sauer, D.U.; Rohlfs, W.; Sinhuber, P.; Rogge, M. Energy consumption, battery size, battery type and charging infrastructure—Optimal eÖPNV mobility through integral analysis. In Proceedings of the 4th VDV Conference Electric Buses—Market of the Future, Berlin, Germany, 18–19 February 2013.
  11. Sinhuber, P.; Rohlfs, W.; Sauer, D.U. Study on power and energy demand for sizing the energy storage systems for electrified local public transport buses. In Proceedings of the IEEE Vehicle Power and Propulsion Conference (VPPC), Seoul, Korea, 9–12 October 2012; pp. 315–320.
  12. Paul, T.; Yamada, H. Operation and charging scheduling of electric buses in a city bus route network. In Proceedings of the 17th IEEE International Conference on Intelligent Transportation Systems (ITSC), Qingdao, China, 8–11 October 2014; pp. 2780–2786.
  13. Wang, H.; Shen, J. Heuristic approaches for solving transit vehicle scheduling problem with route and fueling time constraints. Appl. Math. Comput. 2007, 190, 1237–1249. [Google Scholar] [CrossRef]
  14. Zhu, C.; Chen, X. Optimizing battery electric bus transit vehicle scheduling with battery exchanging: Model and case study. Procedia Soc. Behav. Sci. 2013, 96, 2725–2736. [Google Scholar] [CrossRef]
  15. Mapelli, F.L.; Tarsitano, D.; Annese, D.; Sala, M.; Bosia, G. A study of urban electric bus with a fast charging energy storage system based on lithium battery and supercapacitors. In Proceedings of the 2013 Eighth International Conference and Exhibition on Ecological Vehicles and Renewable Energies (EVER 2013), Monte Carlo, Monaco, 27–30 March 2013; pp. 1–9.
  16. Stadtwerke Muenster. Timetable of Muenster and the Region. Available online: https://www.stadtwerke-muenster.de/privatkunden/busverkehr/fahrplaninfos/fahrplaene-netzplaene/fahrplantabellen.html (accessed on 10 February 2014).
  17. Goldman, J. The proterra fast charge battery bus and charging station. In Proceedings of the International Workshop on Environment and Energy, San Diego, CA, USA, 2–4 November 2010.
  18. Koebel, C. Update primove technology and projects. In Proceedings of the 5th VDV Conference Electric Buses—Market of the Future, Berlin, Germany, 17–18 February 2014.
  19. Wechlin, M. Charging electric buses quickly and efficiently. Bus stops fitted with modular components make “Charge & Go” simple to implement. Wireless Charging of Electric Vehicles, 13 May 2013. [Google Scholar]
  20. Prenaj, B. TOSA flash electric bus system: Experiences and perspectives after nine months of operation. In Proceedings of the 5th VDV Conference Electric Buses—Market of the Future, Berlin, Germany, 17–18 February 2014.
  21. Cruz-Zambrano, M.; Corchero, C.; Igualada-Gonzalez, L.; Bernardo, V. Optimal location of fast charging stations in Barcelona: A flow-capturing approach. In Proceedings of the 10th International Conference on the European Energy Market (EEM 2013), Stockholm, Sweden, 27–31 May 2013; pp. 1–6.
  22. Dong, J.; Liu, C.; Lin, Z. Charging infrastructure planning for promoting battery electric vehicles: An activity-based approach using multiday travel data. Transport. Res. Part C Emerg. Technol. 2014, 38, 44–55. [Google Scholar] [CrossRef]
  23. Wang, Y.-W. An optimal location choice model for recreation-oriented scooter recharge stations. Transport. Res. Part D Transp. Environ. 2007, 12, 231–237. [Google Scholar] [CrossRef]
  24. Wiesinger, P. Battery buses for Vienna. In Proceedings of the 4th VDV Conference Electric Buses—Market of the Future, Berlin, Germany, 18–19 February 2013.
  25. Lajunen, A. Energy consumption and cost-benefit analysis of hybrid and electric city buses. Transport. Res. Part C Emerg. Technol. 2014, 38, 1–15. [Google Scholar] [CrossRef]
  26. López-López, Á.J.; Pecharromán, R.R.; Fernández-Cardador, A.; Cucala, A.P. Assessment of energy-saving techniques in direct-current-electrified mass transit systems. Transport. Res. Part C: Emerg. Technol. 2014, 38, 85–100. [Google Scholar] [CrossRef]
  27. Basile, R. Challenges for HVAC solutions in the electric bus—Status Quo. In Proceedings of the 4th VDV Conference Electric Buses—Market of the Future, Berlin, Germany, 18–19 February 2013.
  28. Cho, C.-W.; Lee, H.-S.; Won, J.-P.; Lee, M.-Y. Measurement and evaluation of heating performance of heat pump systems using wasted heat from electric devices for an electric bus. Energies 2012, 5, 658–669. [Google Scholar] [CrossRef]
  29. Schmidt, M.; Classen, A. Life-Cycle-Cost-optimierte Klimatisierung von Linienbussen. Teilklimatisierung Fahrgastraum - Vollklimatisierung Fahrerarbeitsplatz; VDV Schrift 236-1; Verband Dt. Verkehrsunternehmen (VDV): Cologne, Germany, 2009. [Google Scholar]
  30. Kaup, D.; Bouwman, R.; Schaedlich, G.; Sauer, D.U.; Lohner, A. H2 Bus NRW The Hybrid Electric Fuel-Cell Bus. In Proceedings of the 18th World Hydrogen Energy Conference - WHEC 2010, 16–21 May 2010.
  31. König, D.; Oellers, F.-W.; Roes, J.; Schulte, R.; Wittenberg, H.-U. 2. Nahverkehrsplan Stadt Münster. Available online: http://www.muenster.de/stadt/stadtplanung/pdf/Nahverkehrsplan-Schlussfassung.pdf (accessed on 10 September 2014).
  32. Schmalstieg, J.; Kabitz, S.; Ecker, M.; Sauer, D.U. From accelerated aging tests to a lifetime prediction model: Analyzing lithium-ion batteries. In Proceedings of the World Electric Vehicle Symposium and Exhibition (EVS27), Barcelona, Spain, 17–20 November 2013; pp. 1–12.
  33. Zhu, C.; Lu, R.; Tian, L.; Wang, Q. The development of an electric bus with super-capacitors as unique energy storage. In Proceedings of the IEEE Vehicle Power and Propulsion Conference, Windsor, UK, 6–8 September 2006; pp. 1–5.
  34. Vetter, J.; Novák, P.; Wagner, M.R.; Veit, C.; Möller, K.-C.; Besenhard, J.O.; Winter, M.; Wohlfahrt-Mehrens, M.; Vogler, C.; Hammouche, A. Ageing mechanisms in lithium-ion batteries. J. Power Sources 2005, 147, 269–281. [Google Scholar] [CrossRef]
  35. Rogge, M.; Rohlfs, W.; Sauer, D.U. Fast charging of battery buses and its impact on the aging of various lithium-ion cell types. In Proceedings of the 10th Symposium of Hybrid and Electric Vehicles, Braunschweig, Germany, 13–14 February 2013.
  36. Ecker, M.; Nieto, N.; Käbitz, S.; Schmalstieg, J.; Blanke, H.; Warnecke, A.; Sauer, D.U. Calendar and cycle life study of Li(NiMnCo)O2-based 18650 lithium-ion batteries. J. Power Sources 2014, 248, 839–851. [Google Scholar] [CrossRef]
  37. MAN Truck & Bus AG. Lionsʼs City datasheet. Available online: http://www.bus.man.eu/man/media/en/content_medien/doc/business_website_bus_master_1/Lions_City.pdf (accessed on 28 November 2014).
  38. Mercedes-Benz. Citaro G technical information. Available online: http://www.mercedes-benz.de/content/media_library/hq/hq_mpc_reference_site/bus_ng/services_accessories/brochures/2013/citaro_g_tech/2081_0114Tech_Info_Citaro_G_EuroVI_EN_pdf.object-Single-MEDIA.tmp/2081_0114 Tech_Info_Citaro_G_EuroVI_EN.pdf (accessed on 28 November 2014).
  39. Akasol GmbH. Akasystem 45m Datasheet. Available online: http://www.akasol.com/fileadmin/Kundendaten/pdf/datenblatt/update_AKASYSTEM_09_2013_E/AKASOL_Datenblatt_AKASYSTEM_45M_E_09_2013.pdf (accessed on 27 November 2014).
  40. Riegel, B. High-Voltage-Battery-Concepts for public transport application. In Proceedings of the 5th VDV Conference Electric Buses—Market of the Future, Berlin, Germany, 17–18 February 2014.
  41. Schoewel, F. The High-Voltage Batteries of the BMW i3 and BMW i8. In Proceedings of the Advanced Automotive Battery Conference (AABC), Atlanta, GA, USA, 4–5 February 2014.
  42. Jiang, G.; Zeng, X.; Xiao, S.; Chen, M.; Pu, S.; Zhou, N. Research on control strategy of energy storage buffer system for electric vehicle smart charging station. In Proceedings of the China International Conference on Electricity Distribution (CICED), Shanghai, China, 10–14 September 2012; pp. 1–5.
  43. Mahmoodi, M.; McDonough, M.; Shamsi, P.; Fahimi, B. Peak shaving and minimum cost operation of an electric vehicle charging station based on Multi-port Power Electronic Interface. In Proceedings of the IEEE Transportation Electrification Conference and Expo (ITEC), Dearborn, MI, USA, 18–20 June 2012; pp. 1–5.
  44. Pacher, A.; Stifter, M.; Übermasser, S.; Bletterie, B. Power supply analysis of a parking garage with a controlled charging of electric vehicles. In Proceedings of the 13th Symposium Energy Innovation, Graz, Austria, 12–14 February 2014.

