1. Introduction
The power grid is in constant evolution [
1], and the transformation to a smarter grid [
2,
3] is widely considered to be progressive [
4,
5,
6]. These evolutionary changes are today taking place in different areas and levels of the grid [
7], affecting many different stakeholders, such as utilities, consumers, service providers, vendors, governments and regulators [
4]. One of the main characteristics of the Smart Grid (SG) is the enabling of new products, services and markets [
8]. Microgrids (MG) can be considered an example of a novel market [
9] part of the SG, with requirements for specific products and systems. The MG applications has been chosen for the research. The benefits that MG and SG will bring to the grids have been widely discussed and assessed in the literature. For example, SGs are key to achieving the goal of a low-carbon economy [
10,
11,
12,
13], through renewable energy integration, increased distributed generation [
14,
15], and therefore help address a first sustainability concern, related to the environment and climate change. MG represent an application pursuing these same objectives, as the renewable energy penetration can be increased by means of distributed generation embedded in MG. Regarding a second concern, economic sustainability and economic benefits, the SG, as well as reducing emissions [
16], reduces electricity consumption with extended efficiency. The efficiency increase has the potential to result in global benefits of 122 bn$ in 2020 [
11]. Moreover, if all the possible additional benefits, such as reliability, or avoided capacity investments, are taken into account, the global benefits are expected above 2,000 bn$, for the period 2010 to 2030 in the US [
17].
Related to the third sustainability concern, social sustainability, is not usually taken into account in the literature on SG [
10,
18]. SGs improve accessibility, promote customer participation [
19] and improve access to electricity, as well as requiring additional trained workforce [
20]. Besides, a reliable and secure grid, with additional self-healing and disaster-recovery capabilities also is more socially sustainable, because the power supply is a basic service to society [
21]. In this regard, MG enhance customer involvement through embedded generation and storage. In a MG environment, the customer takes decisions through a control system, with the goal of improving the efficiency, reliability and the cost-effectiveness of the MG.
It is very relevant to facilitate assessments and methodologies for SG evaluation to utilities and new players, as it will enable SG technologies to be widely implemented [
22]. With the appropriate evaluation, the decision makers are better prepared to implement the most appropriate solution to meet their technological and business goals. Many electric utilities have identified important business potential on the SG technologies available in the market, and various pilot projects have been executed to prove the benefits [
20,
23,
24]. The sharing of the performance [
22] and lessons learnt [
24] of completed projects can also be an enabler for future developments as it complements decision tools with operational experience [
25,
26]. Other SG implementations are a consequence of the mandatory regulations and energy policy decided by governments [
27]. However, the conventional investment decisions justified by positive returns can already be applied to various SG technologies and areas [
28]. Following the aforementioned recommendation, many companies have already shared their analysis of these returns for other decision makers to review and possibly adopt [
29,
30,
31]. Still, there are many barriers for the deployment and implementation of SG technologies in the grid. In the case of MG, the development is hindered, for example, by the financing of these systems, regulatory conditions that impede the development and, in some cases, the reluctance of distribution utilities. This paper analyses MG system implementation through a newly introduced methodology, assesses the cost benefit analysis and the implications to the stakeholders, also considering previous recommendations [
32,
33]. The objective is to develop a tool to analyze the MG configuration and assess the status. The contribution of the paper is the developed methodology and the concepts presented herein, such as the “stored grid parity”, the “grid independence cycle” or the triggers for development of the different MG configurations.
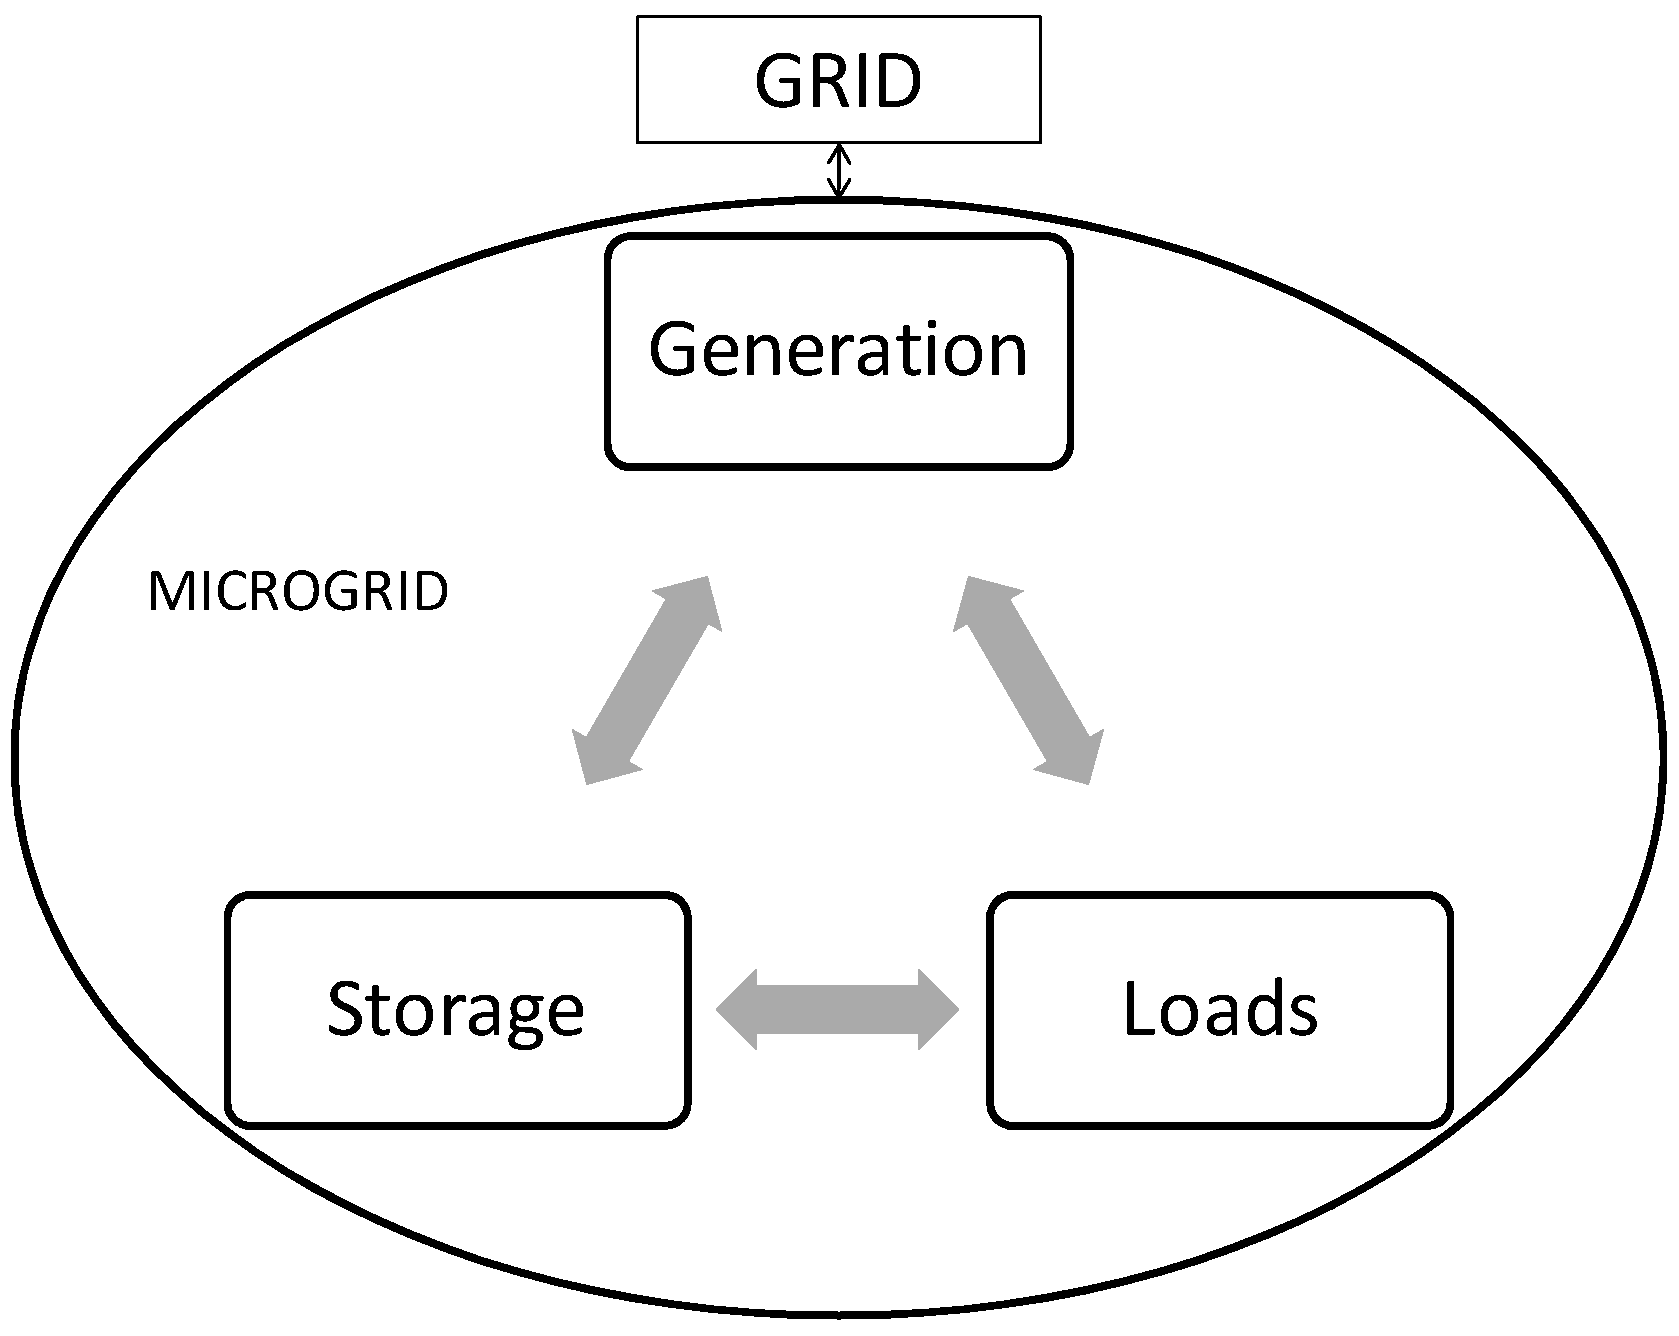
Microgrids
MG are groups of various generation units, storage and loads operating as a single controllable system [
34]. The size for MG can be a single household, a building, a community, a city or an island.
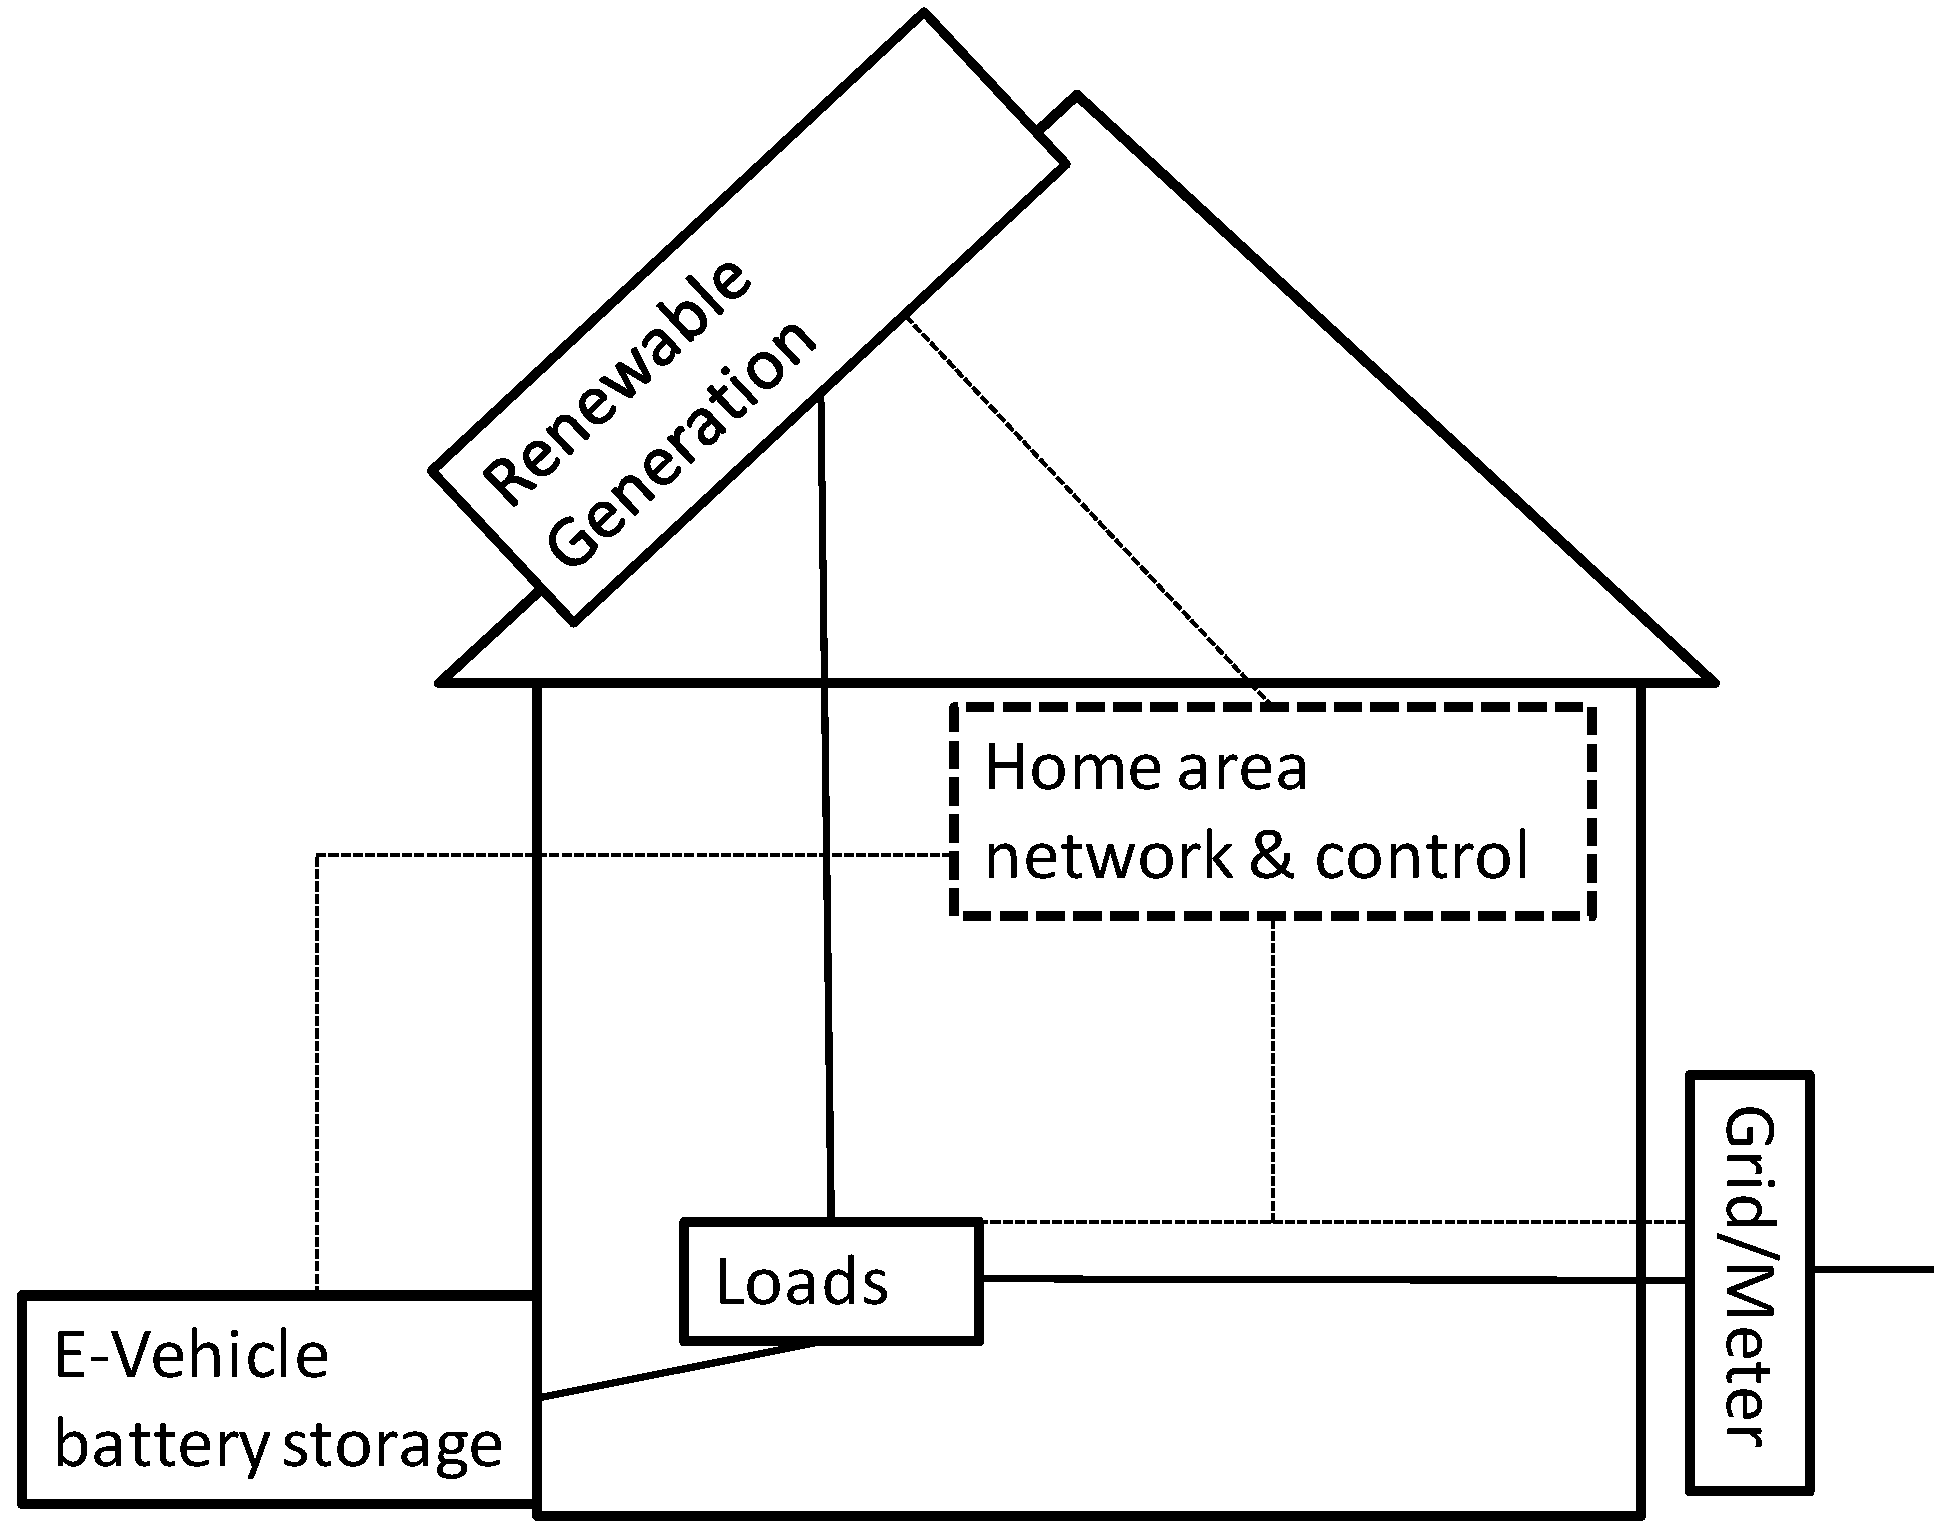
Figure 1 shows the general concept of a MG linked to a major grid through a single point of coupling. As mentioned above, a smart home, as represented in
Figure 2, can be considered a MG because it may integrate generation and storage to the loads, as well as home automation and smart metering [
35,
36].
Figure 2.
Smart home as MG.
Figure 2.
Smart home as MG.
MGs can be isolated or be connected to a larger grid through one or more interconnections, and additionally MGs have the possibility to disconnect from this larger grid and function as an islanded unit. MG systems and functionalities are been deployed in a growing rate [
13] because of the benefits they bring to managing grids.
As one of the goals is the energy consumption optimization, researchers have developed algorithms for optimization of the MG operations, to lower energy cost as a whole, managing storage, grid supply and generation [
37,
38]. Fluctuations on the grid price imply different strategies, such as storing low-priced grid energy apart from microgeneration excess energy [
39]. The drivers towards the development of MG are:
Competitiveness of Distribute Generation (DG) and microgeneration, compared to increasing grid price.
CO2 emission reduction goals and renewable integration goals.
Need for increased reliability and uninterruptible power supply.
Increased awareness of environmental aspects of energy consumption and the need for efficiency measures.
Competitiveness of monitoring, control and communication technologies for MG management.
The first is the main driver, but this is only true for MGs where available microgeneration is competitive with grid price. The reason for MGs not being massively implemented at the moment is that this competitiveness is only starting recently to be effective in some regions. Besides, even when the competitiveness is present, the regulatory framework may deter the development of microgeneration, for example if generation in low voltage networks in forbidden. The important initial investments for microgeneration and the need for finance is also a drawback for these systems not being widely implemented. The use of MG is thus focused on reducing the end user cost, lowering the dependence on energy imports and gaining reliability. On the simplest of cases, the aggregation of consumers in a consumption MG with one single interface to the energy market can directly lead to lower electric pricing via retail market negotiation. Besides, reliability is increased when MG are capable of operating off-grid in case of grid black-out, in addition, these MG allow faster restoration of the grid [
40]. Additionally, a MG has the possibility to follow Transmission System Operator (TSO) and Distribution System Operator (DSO) indications for load-shedding or demand-response and offer grid ancillary services when operating as a virtual-power plant [
41].
Social benefits are a category that has not been considered widely [
18], although energy security and reliability are also social benefits to be considered. Further social benefits that MG include are the following:
Accessibility, as more control and information on power consumption and autogeneration increases the social accessibility (for example with remote control on the electrical appliances and microgeneration units).
Linked to control and information, the empowerment of customers is also a social benefit, increasing the knowledge and the decision capability of the society, as it implies energy conservation awareness and participation in a local MG.
Emission reduction is linked to social health increase, not only from power plants but also from vehicle pipe emissions in the case of cities, when MG include electric vehicles.
Sound emissions reduction, from Internal Combustion Engine (ICE) vehicles to Electric vehicles (EV) is also socially sustainable, related to comfort.
Job creation is not only an economic benefit, but also social, specially of the jobs created, as those related to SG technologies are of high value.
Extending the right of society to generate its own electricity (with microgeneration and net-metering for example) is a social benefit. The use of these SG technologies with renewable energy sources in remote areas, while reducing energy costs, also yields a social impact as it facilitates access to basic energy needs.
If we analyse the benefits of MGs from the stakeholder point of view, all have different perspectives. For the TSO, the main interest is the reduction of transmission load and losses. The Grid System Operator (GSO) benefits if demand response capabilities are included in MG, improving market competitiveness and grid reliability. DSOs benefit from reduced peak loads, total load in the distribution network and reduced losses. Lower load implies less stress on the equipment, so the asset lifetime is increased. A problem DSOs may face is the reversed energy flow, if DG increases with MG [
42]. The energy retailers see a problem of reduced revenues for energy sales unless they are actively participating in MG resource or financing as an energy service provider [
43]. The benefits for the energy services provider include the opportunity to capture de investment and operation of MG as a service for end-users [
44].
After highlighting the benefits and problems, we must mention that the development of MG entails possible risks as well. Increased deployment of MG, estimated to be at the moment circa 3 GW in global installed power [
45], has risks associated with the interoperability and coordination of MG and the grid. Problems in interoperability or communication, as well as data security could put the MG reliability under risk. Furthermore, the inclusion in MG of generation and storage multiplies the maintenance service sites and transfers part of the reliability risk from the GSO to the MG operator.
2. Methods
The proposed methodology, presented in this paper, has the goal of determining the most appropriate MG configuration, based on the costs and grid regulatory conditions. The objective is the reduction of the complete cost of energy, using the Levelized Cost of Electricity (LCOE) for the MG. The methodology is therefore based on the economic analysis. A MG configuration can be determined by the percentage of microgeneration, the percentage of storage and the islanding status. For example, taking the configuration of an isolated MG, such as a remote military facility, it has 100% autogeneration, may have a variable percentage of storage capacity and the islanding status is permanent.
In order to assess the MG technology and market, it is common to analyze the load characteristics, the microgeneration characteristics, the storage components [
39], the management and control [
37,
38] as well as the grid interface [
40]. Usually the most cost effective measures are, first the load management, second, the inclusion of microgeneration, third, storage and finally the interface for grid islanding. However, grid islanding necessarily requires microgeneration in the MG, although storage may not be necessary. The technology used for microgeneration depends on the location of the MG, and the consequent availability of solar, wind or natural gas supply for combined Heat and Power (CHP). The trigger for installing these generation technologies will be the cost-effectiveness of the different systems.
2.1. Description and LCOE
It has been mentioned that MG can be classified using the variables of percentage of autogeneration, percentage of storage and islanding status. Additionally, the MG concept includes all energy in the MG, that is, the heating energy required in buildings, and other fuels used for transportation in the MG. If CHP is used, the complete energy cost is affected, not just electricity autogeneration. To completely define the MG configuration, it is possible to include the electrification ratio and renewable penetration. Following this scheme, a MG consisting of a residential household may have a 50% of renewable penetration, being grid connected permanently, with net-metering and a 100% electrification ratio by the use of a heat pump and one electric vehicle, with no vehicle-to-grid functionality, so % of effective storage is 0.
The Levelized Cost of Energy (LCOE) used for this assessment methodology follows (1):
where “It” are the investment expenditures in year “t”, “Mt” are the MG operations and maintenance expenditures in the year “t”, “Ft” are the fuel expenditures in year “t”, “Gt” are the grid supplied energy expenditure. “r” is the discount rate, “Et” is the total energy consumption in year “t” and “n” is the effective life of the MG system. The formula can be used for the complete energy cost as in (1), or applied to part of the energy costs for the MG, for example, the autogeneration LCOEa would include only the energy from autogeneration (Et), and Gt would be 0. The grid LCOEg would only take into account the Gt, and the energy supplied from the grid. In this simplest example, LCOEg is calculated as the “Gt” costs of purchasing power every year, and the energy “Et” consumed each year. LCOEa for a certain penetration percentage would include the investment in year 1, “It” and the maintenance for all years of operation, normally 20 years are considered. If the new local generation is renewable “Ft” would be 0, and the “Et” would include the energy expected from the local generation installation. In the case of storage, it would be included as part of “It” for the initial storage investment and also the maintenance of the system as part of “Mt”. The stored energy LCOEs would consider only the “Et” of the stored and delivered energy, and the investment and maintenance for the storage unit. A similar reasoning for the calculation is to be considered for the investments in control and automation in the MG, included as investment and operation and maintenance costs.
2.2. Autogeneration and Storage Assessment
Autogeneration is defined here as the distributed generation included in the MG for self-consumption. The birth of autogeneration in an electricity system market, as part of the evolving power distribution to a SG [
3], is mainly due to two factors:
The second case, lower LCOE, is the main reason for increasing autogeneration and this trigger is also commonly called grid parity in demand. Once this grid parity for a consumer is reached, the decision to increase autogeneration improves the cost-efficiency of the system and is thus a driver for implementation. The decision will not be exclusively based on this economical reason, as other factors, such as convenience, financing or physical adequateness can influence the decisions.
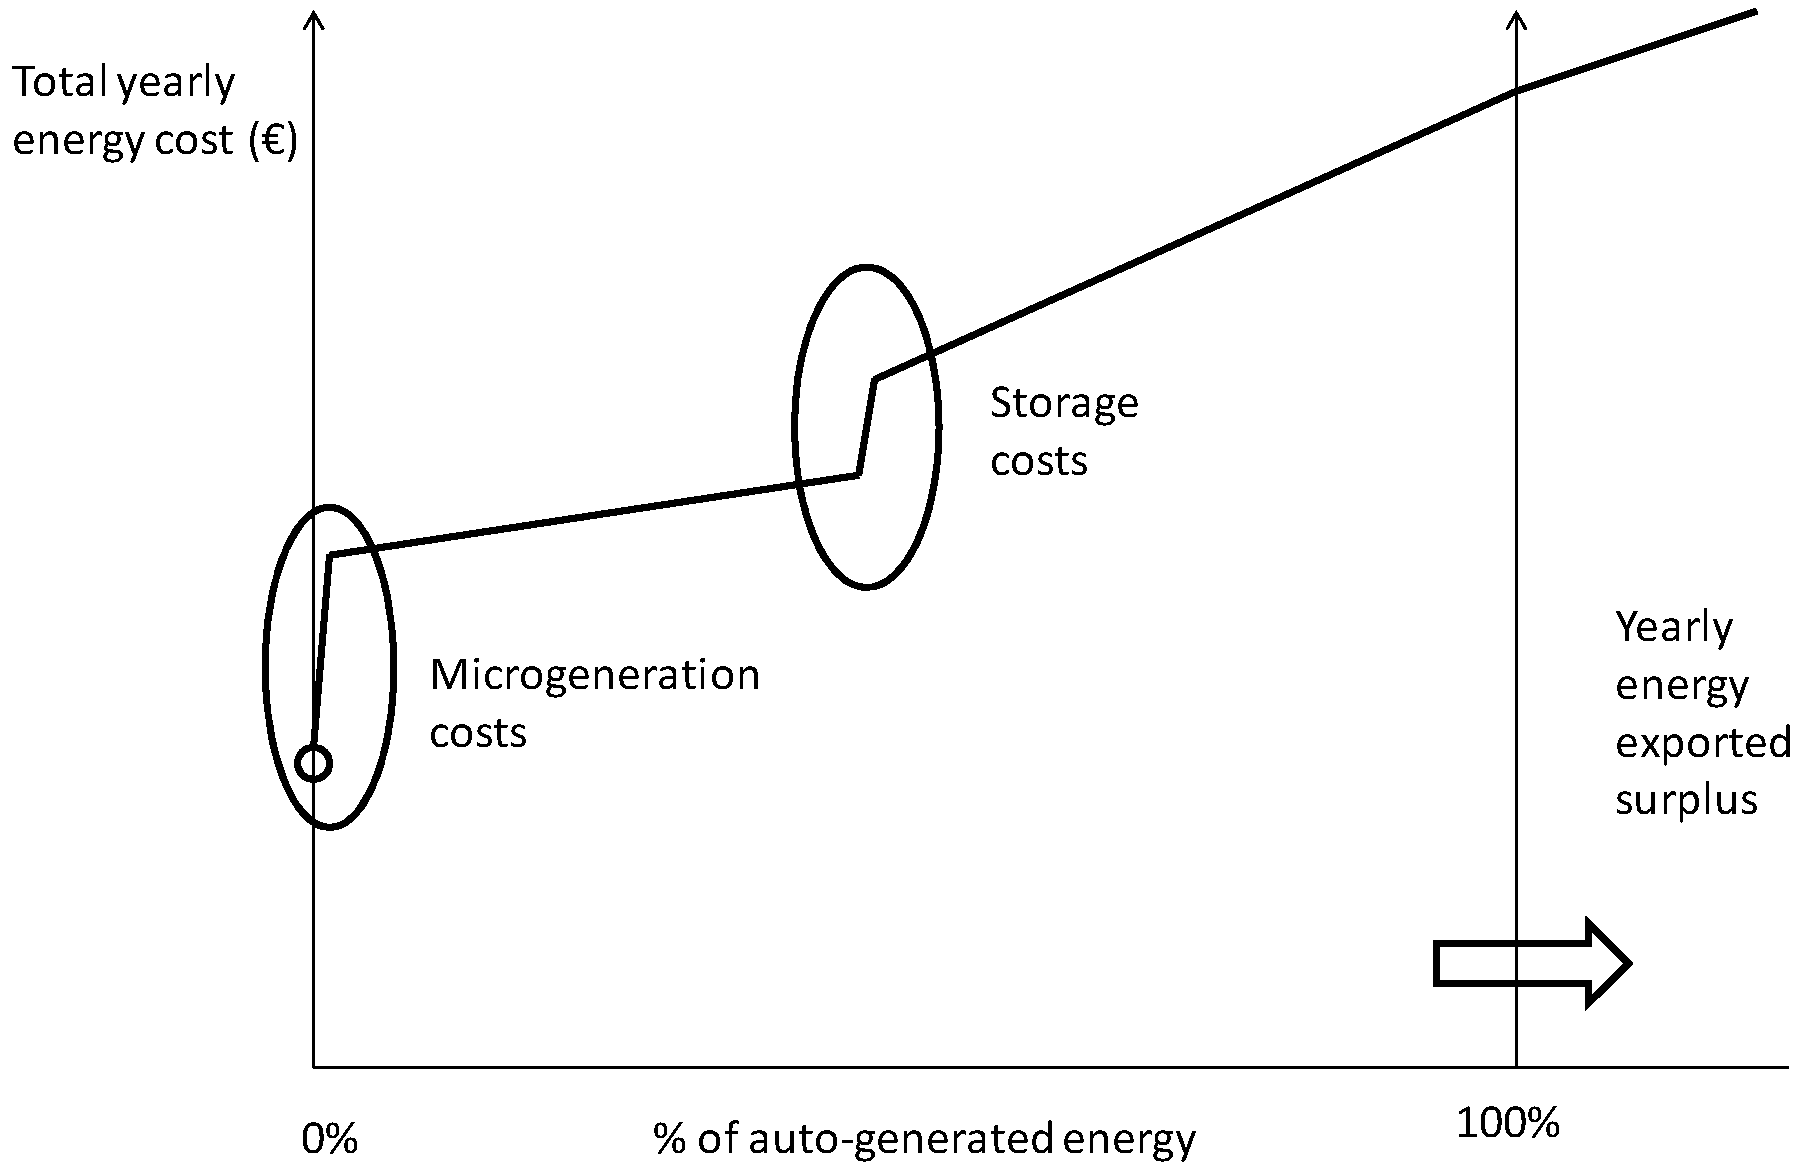
In developed grid systems, increasing the % of autogenerated energy has traditionally increased the total energy costs, because of non-competitive microgeneration and storage, as shown in
Figure 3. In this base case, the steep increases in energy costs are driven by the initial investment in autogeneration and in storage (It), because of economies of scale in supply and project fixed costs, investment for the initial small increase in penetration is relatively higher than for a larger capacity. The gradual increase in total price is due to the higher “LCOE” from autogeneration and even higher stored energy costs. But price reductions, mainly on renewable microgeneration, together with the increase in the traditional generation costs has already triggered a change in some markets [
46]. When considering combined heat and power autogeneration, the economics have to take into account not only the avoided grid energy but also the fuel if used for heating in Equation (1).
Figure 3.
Traditional auto-generation cost assessment.
Figure 3.
Traditional auto-generation cost assessment.
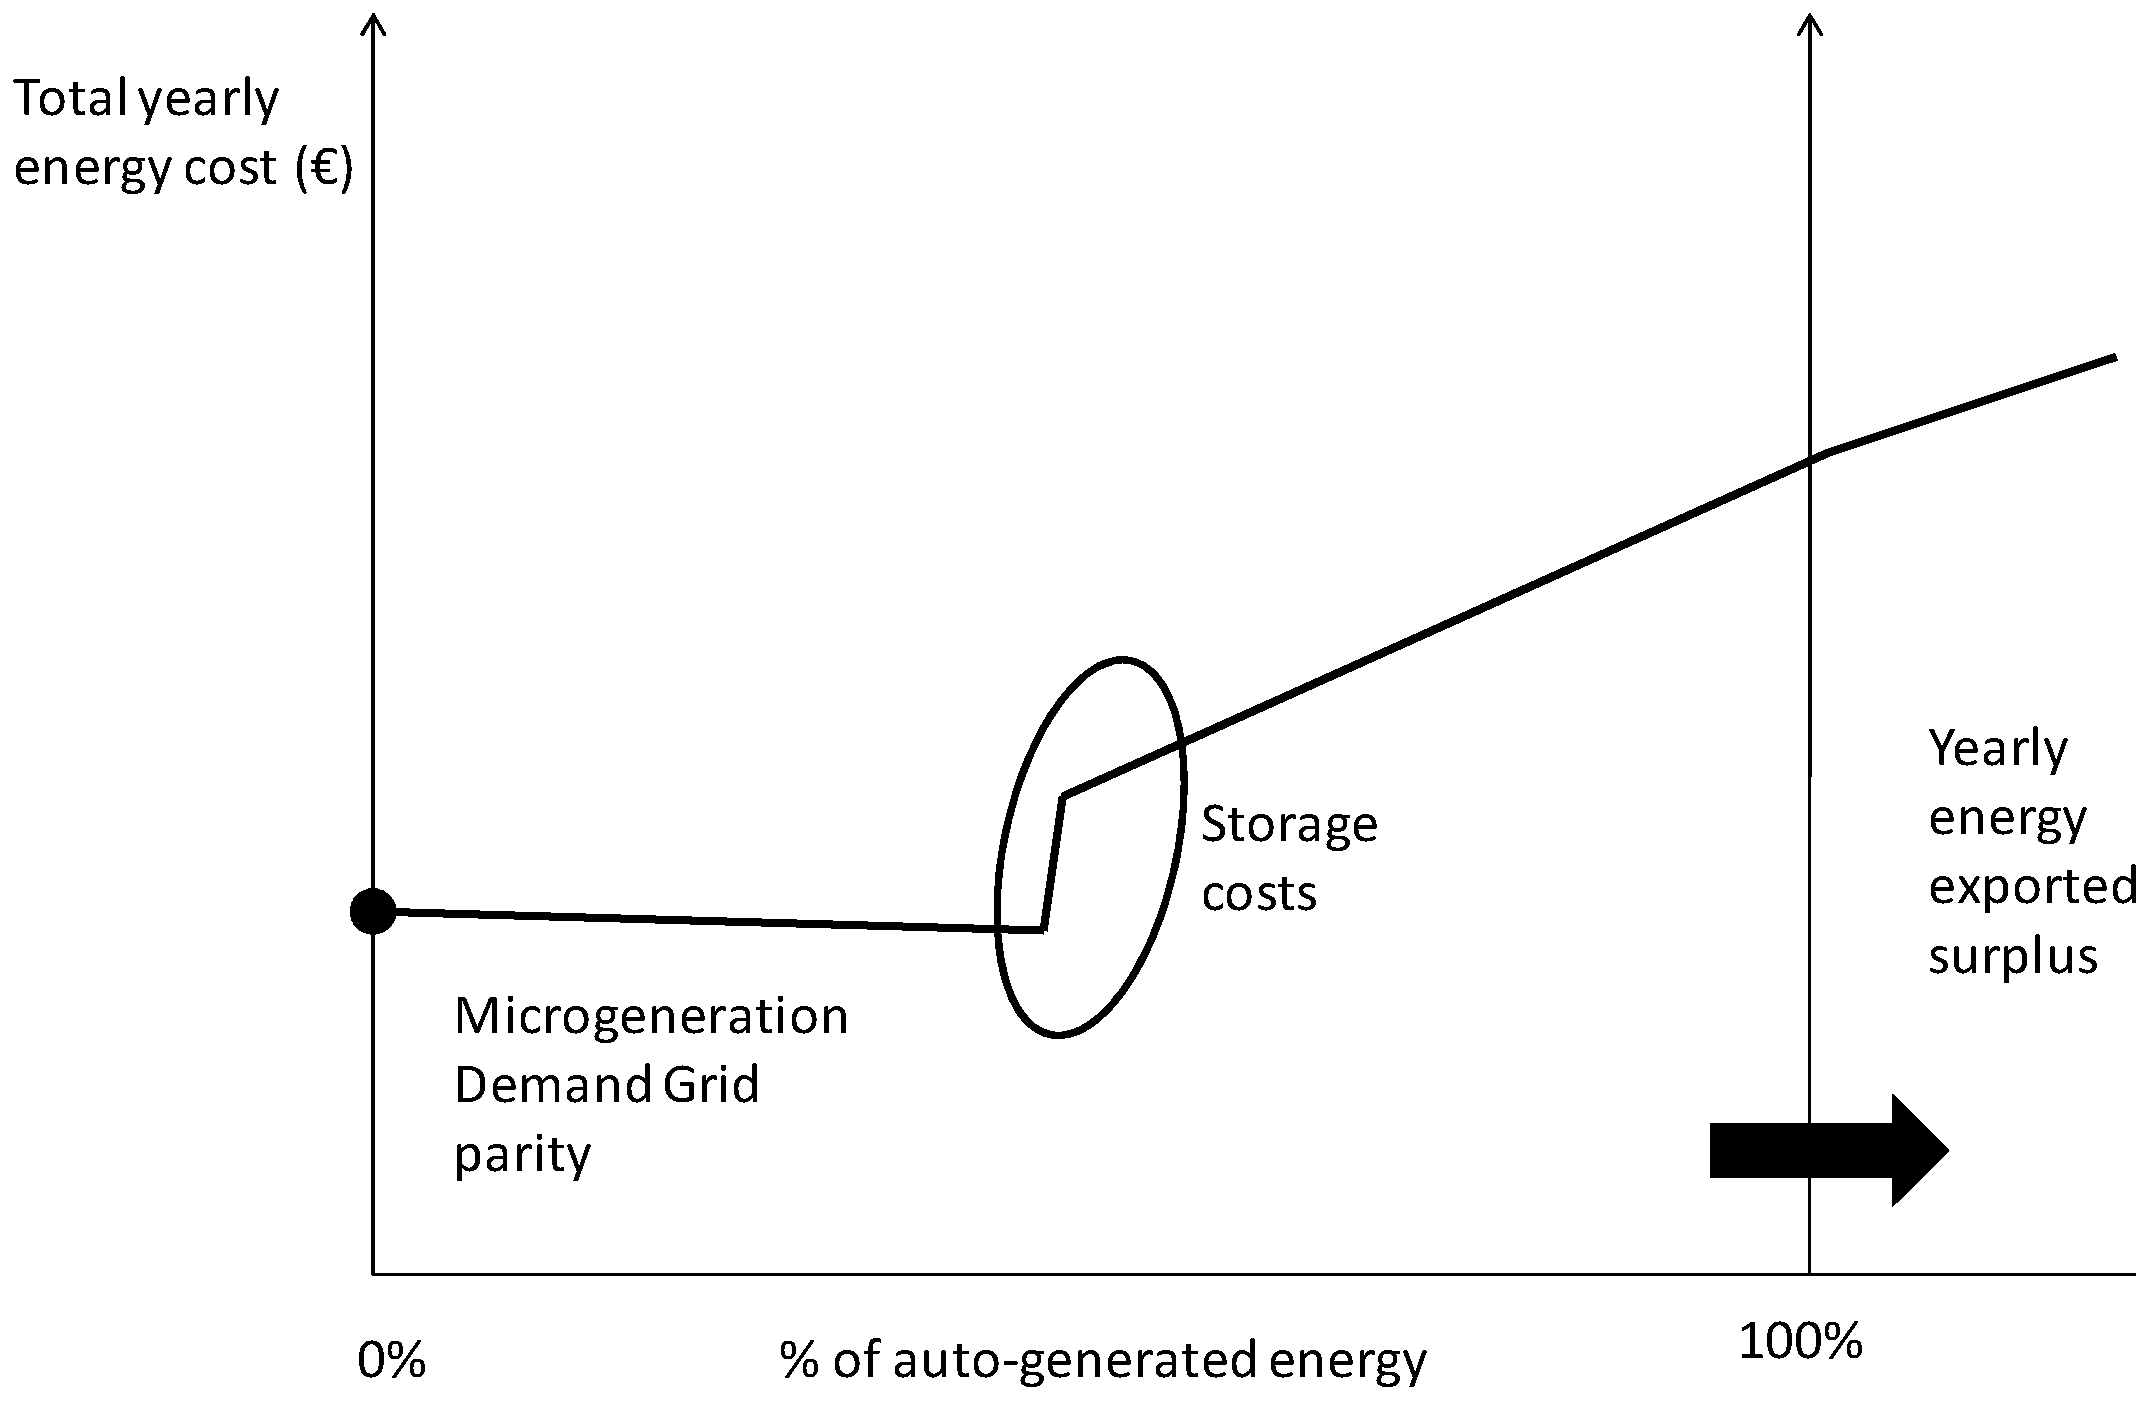
Once the trigger of demand grid parity is reached, with competitive renewable microgeneration, and the LCOE of autogenerated energy in the MG is lower than the grid price, an increase in % of autogeneration reduces total energy cost. This is shown in
Figure 4, where total cost decreases with the initial increase in autogeneration content. There are markets where this trigger is already a reality for solar PV autogeneration, for example in Spain [
15,
47]. In this case, the modularity of photovoltaic (PV) power implies that small penetrations, with less installed power are not so much more expensive per kW, compared to other generation sources.
When analysing the effect of autogeneration on the resulting electricity market, there is a total demand reduction as it is similar to energy efficiency measures [
48] with the difference that instead of reduced consumption there is generation close to where the load is, reducing demand from the grid. This effective demand reduction from the grid implies lower losses in the network but at the same time a reduced asset utilization of transmission and distribution assets in a given network.
Figure 4.
Demand grid parity and autogeneration.
Figure 4.
Demand grid parity and autogeneration.
The limit to the competitive % of autogenerated content with this grid parity price is set by the limit of the MG to couple the autogeneration with the load. The reason is that without storage all the generation that is exceeding and not coupled with the demand in the MG, would be exported to the grid. However, various technological solutions improve the synchronization.
Table 1 shows these technology enablers to increase variable autogeneration (renewable) in MG [
49]. For the system as a whole this stage means less consumption from the grid, a reduction in retailed electricity. As explained, it is equivalent to an energy efficiency measure, and there is a reduction on the LCOE for the MG.
Apart from the correct dimensioning and generation control, grid stabilization is necessary to achieve instantaneous 100% autogenerated power. When the MG is grid connected, the stabilization is done by the major grid as long as the capacity of the grid is much higher and the MG cannot cause variations in grid frequency. However, in islanding mode, stabilization is indispensable to avoid failures in the MG [
38]. For the autogeneration content to be higher, the demand response capability inside the MG (managing loads inside the grid) is an important lever, as it couples the load to the autogeneration availability.
Table 1.
Technologic enablers to renewable integration.
Table 1.
Technologic enablers to renewable integration.
| Energy & Power System Modelling | Sizing the MG, with Power and Energy Design |
|---|
| 1. Automatic dispatch and generation control | Controls the generator to adapt to the MG load |
| 2. Grid stabilization | Maintains the voltage and frequency |
| 3. Load control and automated demand response | Manages demand to adapt to MG generation |
| 4. Energy Storage | Allows decoupling of generation and demand |
Once the generation and demand response control limit is reached, the next increase requires storage of the non-coupled generation, dimensioned accordingly as proposed in [
39]. Demand response and storage, have been estimated as having the best benefit-to-cost ratio as part of the SG technologies [
17,
50]. Storage of energy is possible using the grid as storage, with net metering capabilities, or with the use of electric vehicle storage, MG storage, or distributed storage. Different technologies for MG storage are available, and the main drawback is usually the price. Other conditions, such as the size, the life cycle, and therefore the maintenance cost, have to be included in the LCOE calculation. Net metering can thus be more competitive, as it avoids additional investment, but it depends on the price of the service, compared to the selling of excess energy to the market and re-purchasing. The price of this storage, when it is competitive compared to the equivalent grid purchased power (“stored grid parity”), would lead to continuous decline in total energy cost up to the 100% autogenerated yearly power, as shown in
Figure 5.
Figure 5.
Demand grid parity and stored grid parity.
Figure 5.
Demand grid parity and stored grid parity.
The limit of microgeneration and storage competitiveness would mean surpassing the 100% autogeneration, if there is consumption parity and demand grid parity, where distributed generation cost is lower than other generation capacity in the market. This point can be reached earlier if MG generation can additionally be remunerated by ancillary services, if providing these services can be more competitive than other generation options. The flexibility of MG systems should allow for this services to be provided increasingly, and the assessment calculation has to include this additional income as a compensation for the costs, thus reducing the LCOE.
In the case of grid parity in supply, it means competitiveness not compared to retail price but to bulk generation market pool price (Mp) and would imply a market shift from centralized power plants to auto sufficient MG acting as distributed generators, also called virtual power plants [
35].
2.3. Islanding Assessment
The islanding capabilities assessment [
40] is not related to grid power price, microgeneration and storage, but more with the reliability of the grid, as mentioned before. The assessment of adding this functionality has to compare the cost of implementation with the benefit in reliability, plus additional remuneration from demand response services to the grid system operator. The trigger for islanding functionality can be calculated following (2), where the cost of the major grid unreliability for the MG “C
u” is higher than the costs of improved reliability “C
ui” through islanding, plus the costs of including islanding functionality “C
if” and the demand response (DR) revenues from the GSO if existent. The cost of unreliability for the MG has to be calculated as the effect of System Average Interruption Duration Index (SAIDI) and System Average Interruption Frequency Index (SAIFI) values on economic terms. An example of this application would be an MG with a cost of unreliability of “C
u” 100 k€ per year due to black-outs or load-shedding by the grid operator. The trigger for islanding functionality is met if they have no compensation for demand response on this disconnections (DR = 0) and, for example the cost of improved reliability through islanding is lower,
i.e., 50 k€ per year, and the cost for including the islanding functionality with additional local generation and storage is below 50 k€ per year:
3. Results
The summary of the resulting analysed triggers, and steps on competitive autogeneration for MG, is included in
Table 2. These results are the consequence of different conditions of the market and the costs of the technologies, following the methodology of LCOE calculation presented in
Section 3.
The consequences of the different situations can be inferred from these results. The typical starting configuration is a MG with 0% autogeneration. In the definition of a MG, it has been mentioned that it may have generation, storage, loads and a single control. In this first configuration, the MG would be such if it has a control for the loads for energy management or demand response. Without demand grid parity this MG may have storage or generation, but it is not the optimal condition.
Table 2.
Triggers and Stages on Grid-Connected MG.
Table 2.
Triggers and Stages on Grid-Connected MG.
| MG stage | Trigger | Conditions |
|---|
| 1. 0% autogeneration, permanently grid connected | N/A | Typical starting point for grid connected MG. May have MG control for energy management or demand response |
| 2. Grid demand parity, >0% autogeneration | Competitive microgeneration or distributed generation, below grid retail price; LCOEa < LCOEg | Optimal point in autogeneration limit to couple with load, or increased through net metering |
| 3. “Stored grid parity”; >0% autogeneration, >0% storage | Autogeneration + storage price below grid retail price LCOEa (including storage) < LCOEg | Autogeneration with MG storage. May have islanding capability or permanent islanding |
| 4. “Grid supply parity”/“market grid parity”; >100% autogeneration; >0% storage | Competitive microgeneration or distributed generation, below grid market price; LCOEa < Mp | Autogeneration, as virtual power plant, sells to the grid/market |
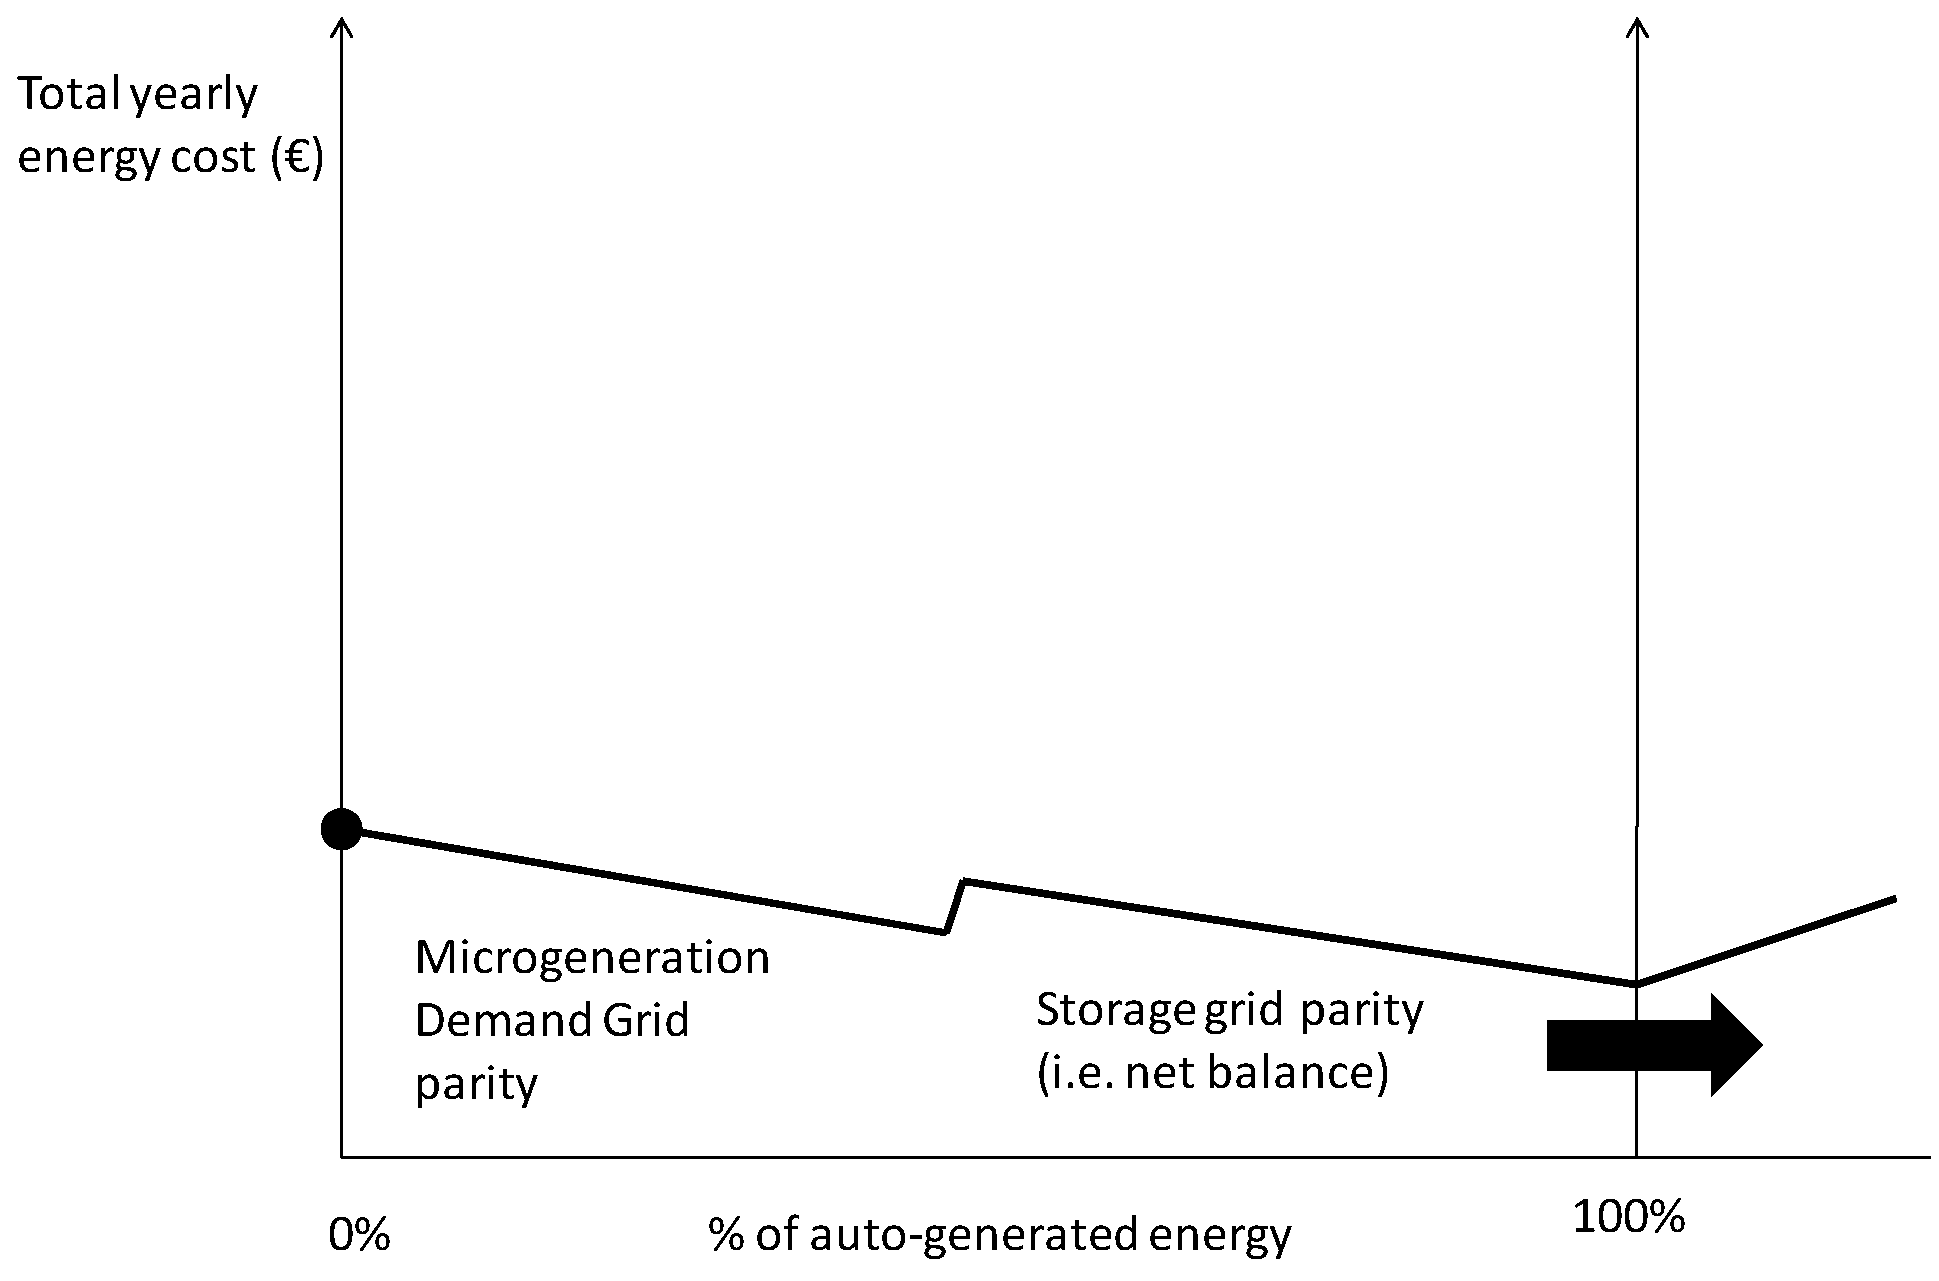
With the trigger of “demand grid parity”, MGs may have a percentage of autogeneration penetration. An example in the market are some regions with abundant sun or wind resources. In the case of Spain, where LCOEg for a MG can be 20 c€/kWh and the LCOEa from solar generation for a 10% penetration can be 10 c€/kWh, the resulting LCOE of the MG would be reduced to 19 c€, and is in the interest of the MG. The penetration can be higher if there is net metering and therefore no storage is required in the MG. Otherwise, the autogeneration will be for the amount of energy that can be coupled with the demand in the MG, as is the case for renewable generation. “Stored grid parity” is the trigger for increasing storage capacity in a MG, as stored autogeneration can be consumed at a lower price than the energy from the grid. An example of this trigger can be actually found in locations such as islands, where the grid LCOE could be 40 c€/kWh because of the use of diesel generators. Not only the demand grid parity is reached with wind or solar, but also the stored grid parity, depending on the technology used for storage. An LCOEa of 10 c€ and an LCOEs of 20 c€/kWh could result in a lower LCOE for the system, including storage and reaching a 100% penetration of local generation.
This grid parity can be such only for peak price generation, so the consequence is the use of stored energy during peak hours, or complete for the grid supply. If there is “stored grid parity” for all the time of the day, there would be no reason for consuming from the grid. The MG would be selling energy, when allowed, to the grid at the best price period or could be permanently disconnected from the grid. To completely disconnect, the cost of storage increases as it has to be over dimensioned to have the same availability. When using the methodology and including the storage costs on the LCOEa calculation, the possibility of using storage from EV batteries is considered. In this case, the investment to be considered in “It”, would be arguably only for the interface with the MG and the control, as the investment on the vehicle is done for mobility purposes. For example, a 24 kWh battery storage, in comparison to the same energy capacity of a commercial EV. The investment “It” for the battery can be 24 k€, while for the EV “It” would be 3 k€, only for the bidirectional charger, as the vehicle investment is not specific for the LCOE, but for mobility purpose. Considering “Et” as one cycle per day with 80% capacity use (19.2 kWh) and only a conservative 40% for EV (9.6 kWh), with a lifecycle of 8 years, and a discount rate of 4%, the resulting LCOEs is 48 c€/kWh for the battery compared to 12 c€/kWh for the EV storage.
The last trigger is the “grid supply parity”, when generation in a MG can compete in the spot market for generation of the grid system. The situation of a competitive generation in small scale compared to the grid scale generation capacity might still seem unlikely because of the economies of scale and the reduced investment per installed capacity. Normally a new generation unit of the same technology would be more competitive on a larger scale, but a power market has also existing generation units that set the market price. Therefore, the possibility of the grid supply parity cannot be discarded.
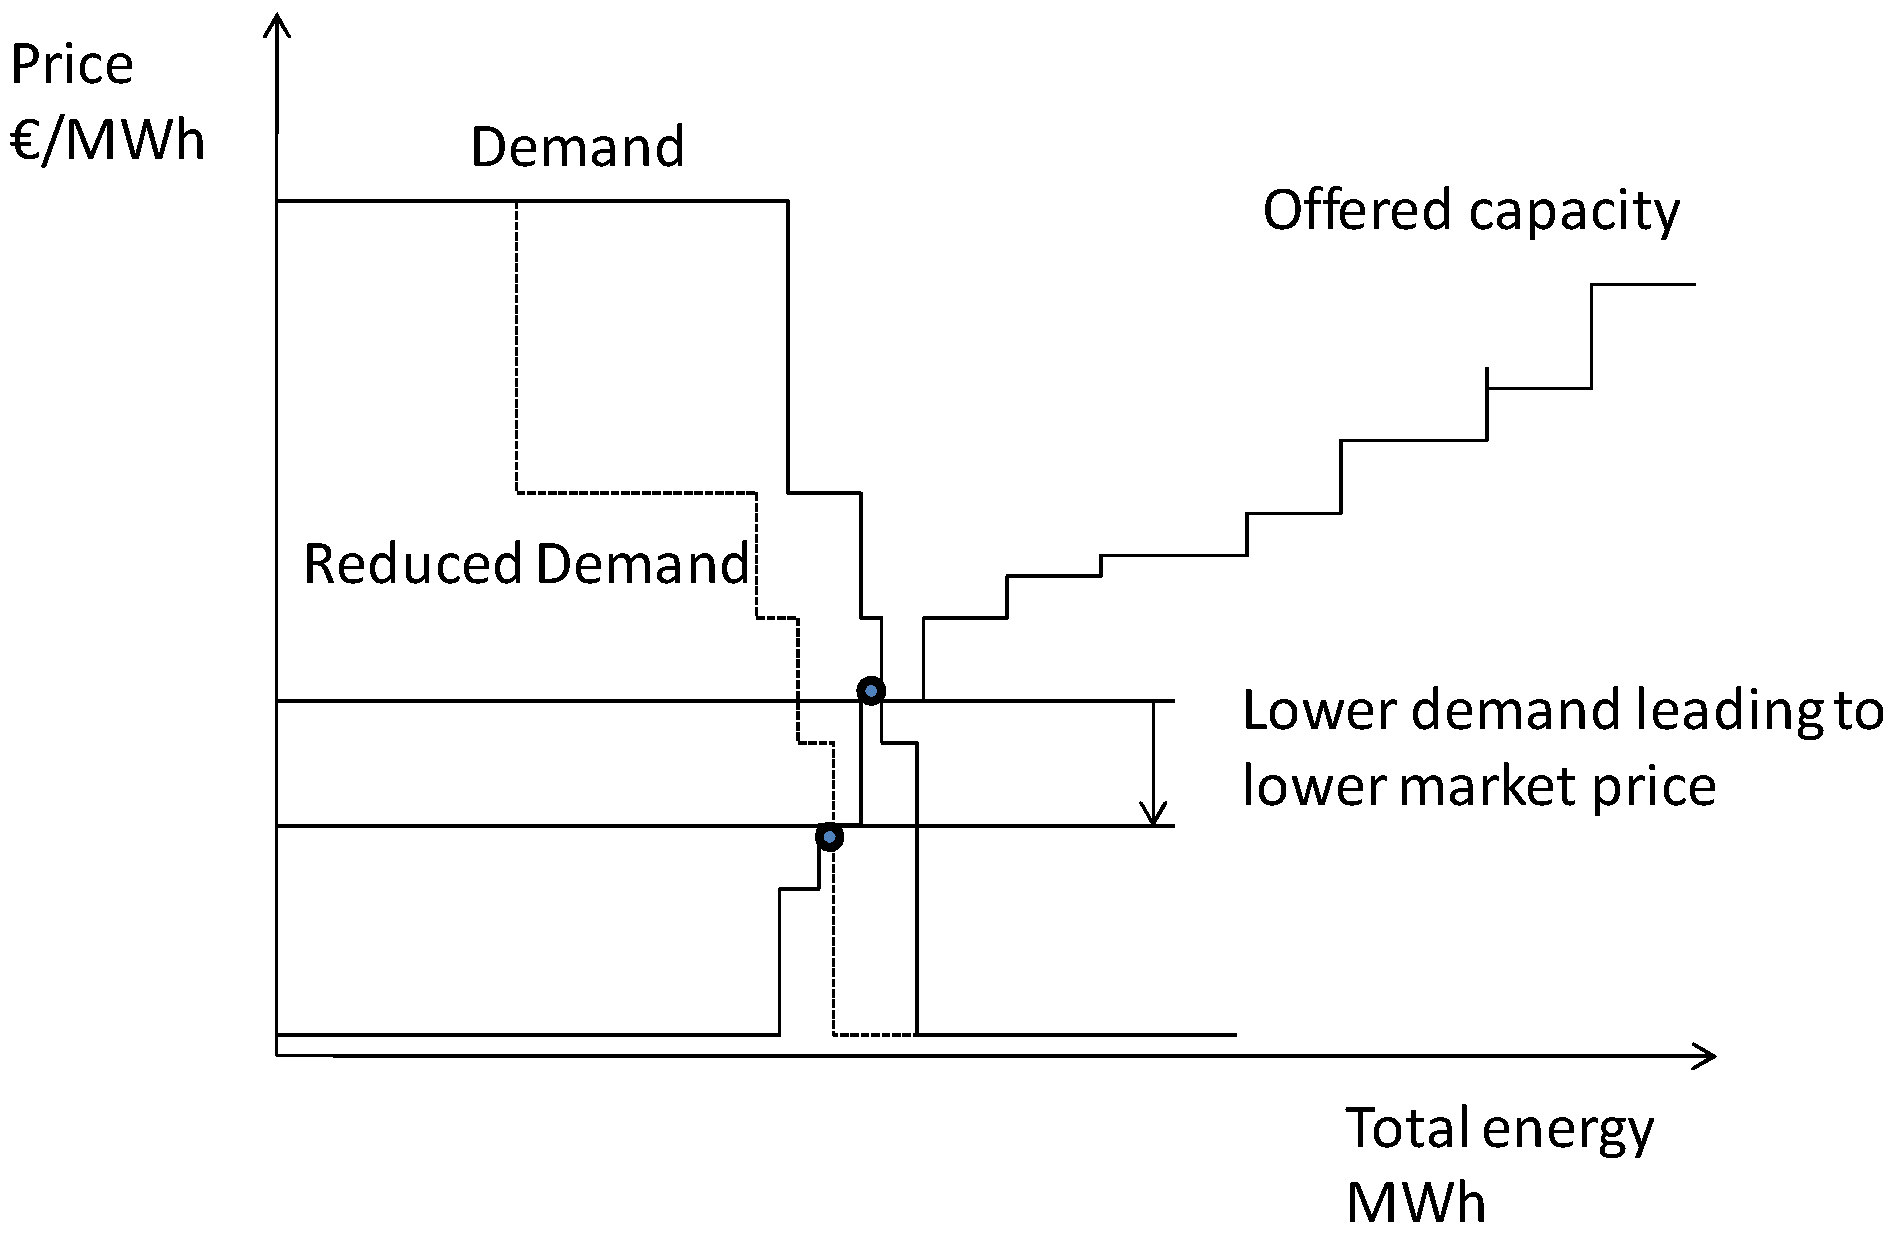
From a GSO point of view, important autogeneration capacity increase leads to a reduction in the market demand for power in the spot market. This consequently leads to a reduction of the market price, as
Figure 6 shows in a typical spot market price setting.
Figure 6.
Market price with demand reduction.
Figure 6.
Market price with demand reduction.
But the end user price is not only fixed by the market spot price, as other fixed costs have to be added, so G
t has a fixed part and a variable cost depending on the energy consumed. As simplified in (3), where “P
eu” is the end-user price, “P
mk” the market price, “F
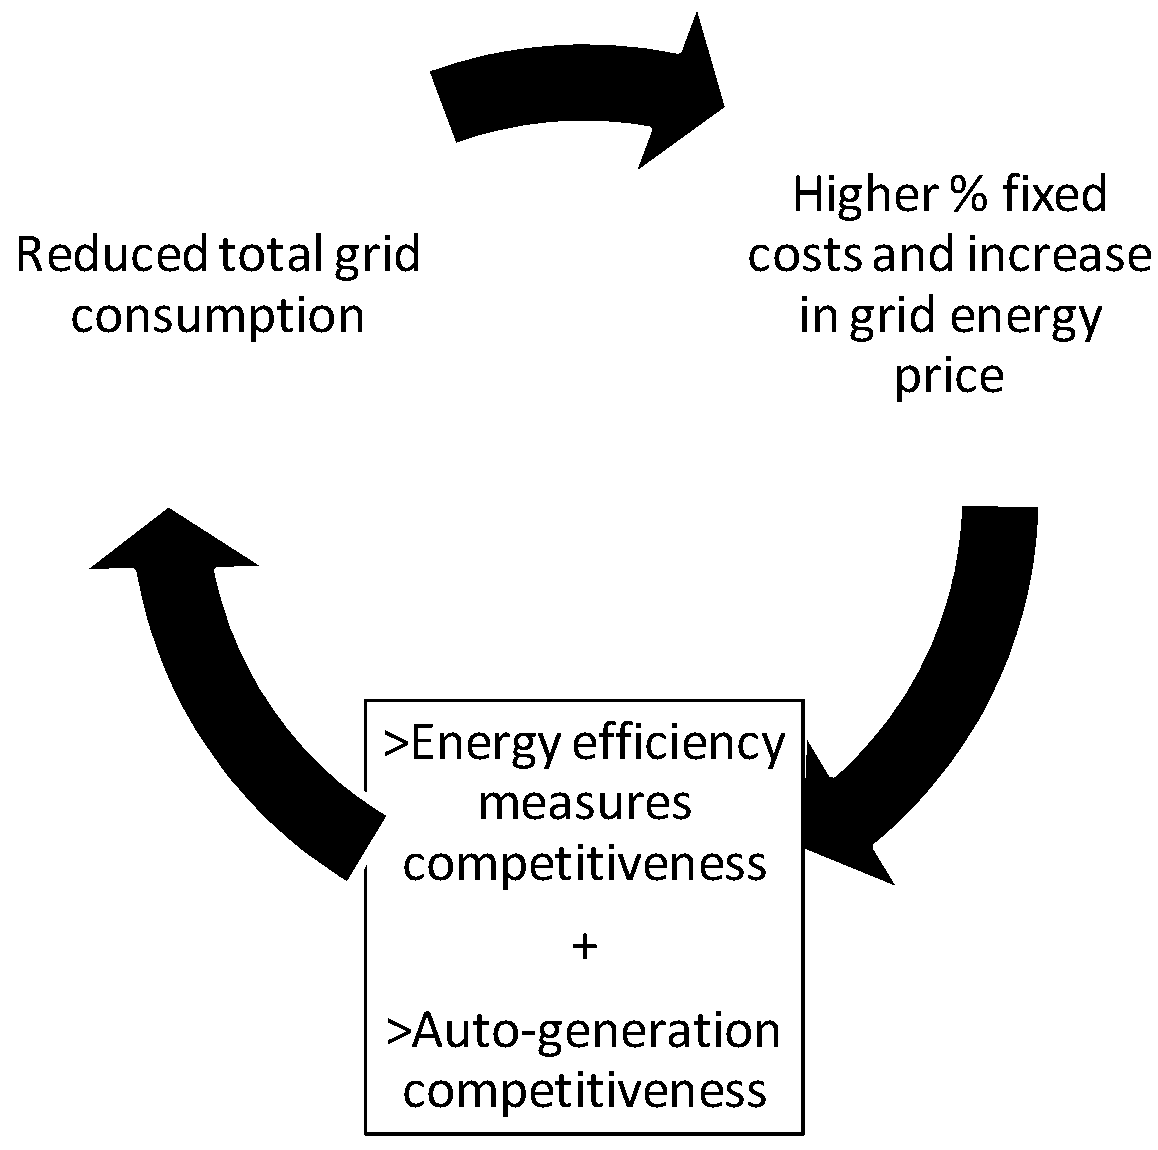
xc” the fixed system costs and “Dem” the demand. The market price is lowered by lower demand, but lower demand also increases the price per end user of the fixed costs. If the fixed cost component is higher than the market price component, demand reductions would lead to higher end-user price. If that is the case, the system enters a grid independence cycle (
Figure 7) and reduced demand fuels further autogeneration and energy efficiency, reducing demand.
Figure 7.
Grid independence cycle.
Figure 7.
Grid independence cycle.
The grid independence cycle would accelerate the development of autogeneration and islanding MG, with the consequence of an increasing grid price electricity and the consequences of unused and costly assets. For example, the Spanish market can be considered as having triggered this independence cycle. If the end user price has a variable energy cost of 9 c€/kWh, but the rest of the fixed costs (Regulated costs and taxes) imply a P
eu of 25 c€/kWh. In this situation, a reduction of energy demand will feed-back an increase in P
eu. The grid independence cycle presented here will be discussed further in
Section 4 and
Section 5.
3.1. Islanding Results
Islanding capabilities for the GSO are similar to interruptible load contracts, permitting the GSO to gain reliability for the major grid by disconnecting loads or islanding MG to avoid black-outs affecting more loads. Additionally, islanding and load shedding have a market functionality, and the GSO may benefit from lower costs for the islanding, demand response or load shedding than for additional capacity in peak pricing periods. The DSO may be negatively affected by the islanding of important DG, as if the system is designed taking into account the DG, increased flow of energy may be necessary from substation transformers. Islanding procedures have to be followed, for the DSO to reconfigure appropriately the distribution system, in order to avoid islanding MG to cause operational problems to the DSO.
In order for this MG to work off-grid it has to be able to cover the demand with the auto-generation and local storage. Additionally, it has to be able to maintain the stability of the voltage and frequency parameters [
1]. It is because of this stability condition that MG connected to major grids, even when 100% auto sufficient (without importing or exporting energy) benefit from the grid connection.
3.1.1. Anti-islanding Protections and Islanding
In order for MG to continue implementation, interoperability [
51] and “plug&play” solutions for interconnection and protection are necessary [
52]. International grid codes include anti-islanding protections for distributed generation and microgeneration, consisting in frequency and/or voltage relays [
40]. Anti-islanding is set by DSO and GSO mainly for safety reasons, to avoid distributed generation feeding a part of the grid that has been disconnected from a Medium Voltage (MV) distribution substation, and for optimal operation of the distribution network [
53,
54]. In order to allow islanding of MGs, the protections would have to be located in the interconnection of the MG, so there is no external influence from the microgeneration or distributed generation to other parts of the grid and affecting the DSO. Of course, distributed power and MG storage can react actively to frequency variations, preventing the protection disconnections on the first place [
38]. Another alternative is the disconnection of the microgeneration or distributed generation and it’s reconnection after the MG has been islanded, and that could be included in the hierarchical control of the MG [
37].
3.1.2. Reconnection to Grid
A MG can reconnect to the grid through a synchro-checked relay with a fast switch or manually by the MG operator. Depending on the size of the MG, the investment on this equipment could unbalance the benefits of islanding and make it uncompetitive. The cost-benefit analysis would be done comparing the costs of loss-of-supply, against the cost of the fast switch and the reduced expected loss-of service. Depending on the reliability of the existing grid connection, the investment can result in a benefit, and will specially be so for loads with high continuity cost, such as data centres or military facilities.
The alternative is to disconnect all microgeneration and distributed generation to reconnect to the grid through a zero. This as in disconnection islanding implies there is no fault-ride-through or uninterruptible power supply, but the total loss of service can be reduced. The optimization of the reconnection, as with the disconnection is considered part of the DSO optimization task [
54].
3.1.3. Permanent Islanding
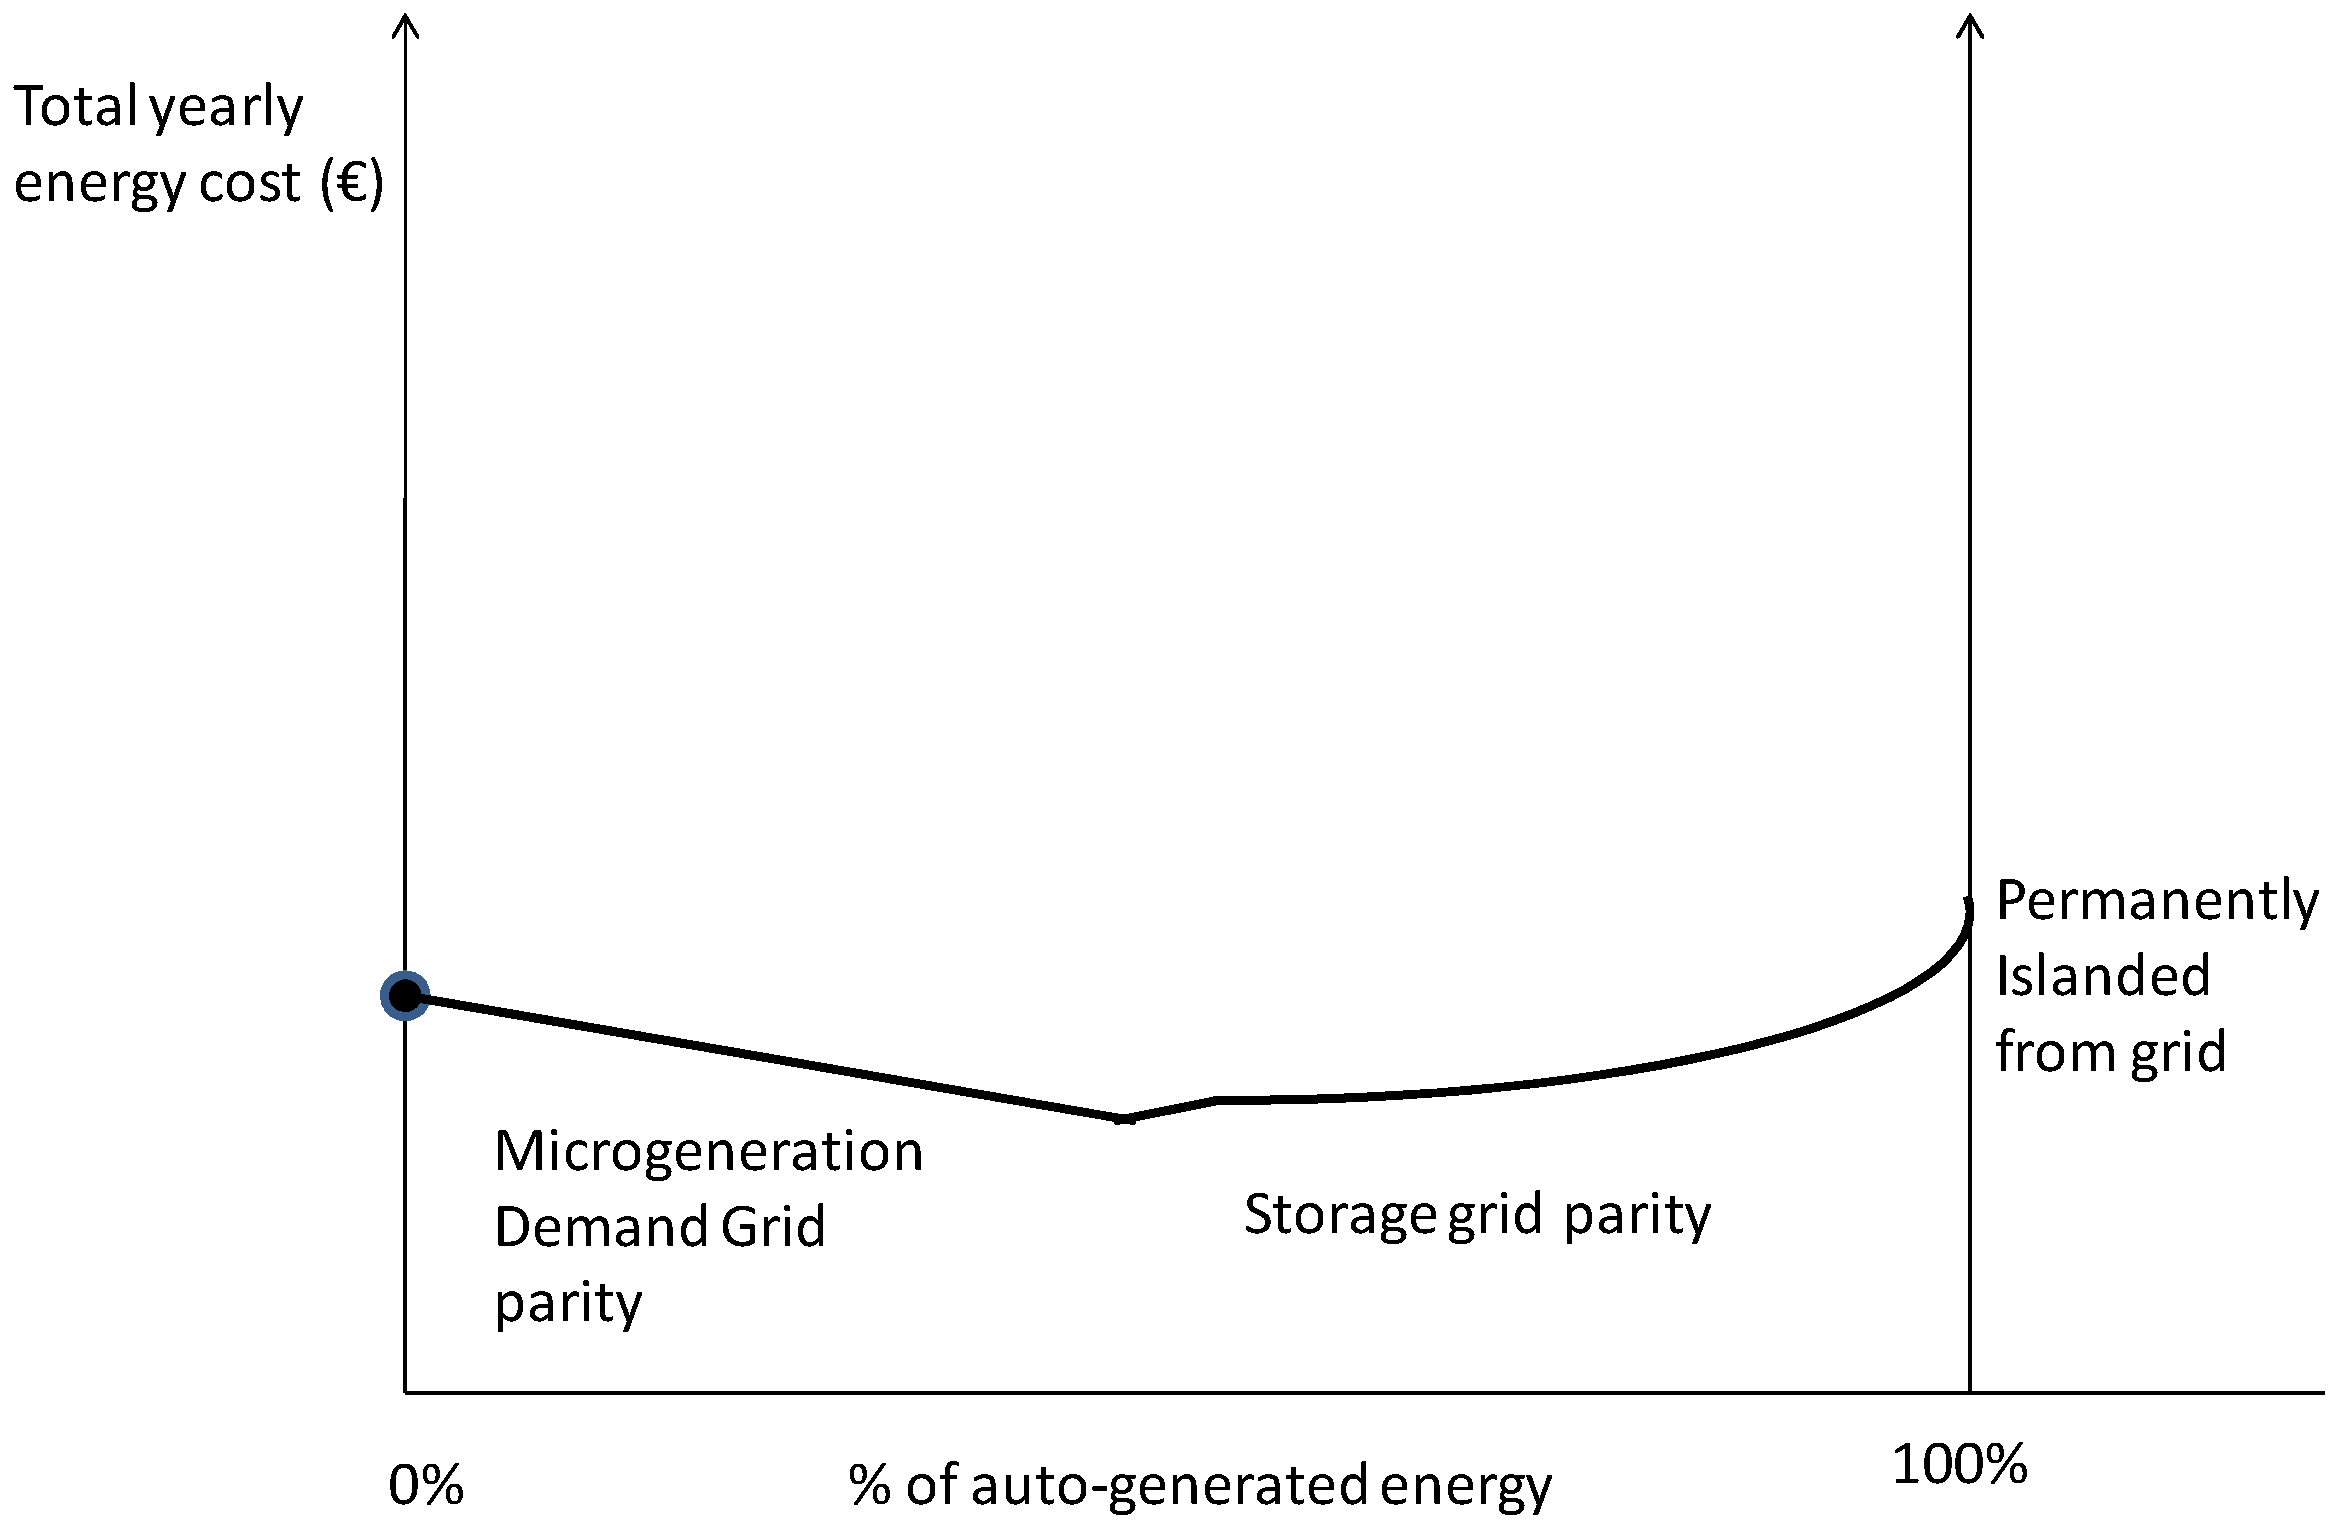
Another possibility given the 100% autogeneration content with non-grid storage could lead to a permanent islanding, in order to reduce further the costs in the MG from energy retail. When permanently islanded, the MG would avoid the fixed costs associated with the grid connection and power availability. The balance for this complete grid independence in the cost to benefit analysis has to take into account the risk of power unavailability and consequent generation and storage sizing. As shown in
Figure 8, the need to ensure 100% availability implies progressively rising costs. The rise in costs when approaching 100% autogeneration without grid connection is due to the lower asset utilization and over-dimensioning of both storage and generation. The ratio of “It” to the “Et” that has to be generated and stored grows because of the increased investment in autogeneration capacity and the increased investment in storage capacity, for the last percentage points of the penetration.
Islanded permanently, the MG requires dynamic stabilization, which could mean additional investment. This is due to the need of the power electronics fixing the frequency and voltage instead of equipment using the major grid as a reference [
38]. The relation based on market prices can be up to 2:1 for the equipment, as exemplified also in [
49].
Apart from this cost considerations, a permanently islanded MG may have excess energy that cannot be exported. The above mentioned reliability and efficiency benefits for the grid (GSO, DSO) are lost, and from the social and environmental sustainability the complete grid independence is not preferable. Socially, complete grid independence compared to islanding capabilities means resigning to benefitting other users through the grid by means of efficiency and reliability. As storage capacity has to be oversized (this has been presented also on [
39]), and excess energy could have to be dumped, environmentally disconnecting permanently is less sustainable as well as economically less interesting for the system.
Figure 8.
Permanently islanded MG stored grid parity.
Figure 8.
Permanently islanded MG stored grid parity.
4. Discussion
The results can be useful as guidance for MG configuration and for assessing tendencies in the electrical grid. The calculations of LCOE are by definition valid for a determined time, with conditions and prices. Therefore, the assessment results will vary with the changes in energy prices, renewable energy technology prices, storage technology prices and islanding technologies. However, it is considered here that the calculation of triggers is useful for market assessment, near-future tendencies prediction and for regulatory purposes, and the recommendation is to using the methodology monitor periodically the conditions in a given region or market. The grid independence cycle, for example, is presented with a trigger on fixed costs to variable costs ratio. The implications for the prices and systemic outlook are clear if the trigger has being surpassed in terms of increased fixed costs. Besides, regulatory and energy policy measures will be considered necessary if competitive market pricing wants to be promoted, in order to drive grid energy prices down.
The triggers that are presented in the results are considered as steps that are taken progressively with the increased competitiveness of microgeneration in MGs. The evolution of these technologies has followed this path in the past, but it is not necessarily true that it will follow that path in the future. It is important to discuss this subject, as the possibility of grid energy to become more competitive exists. The decision of investing in autogeneration is normally based on a static LCOE calculation as the methodology proposes, but these calculations can change over time. The possibility of the trigger returning to below demand grid parity could be caused by increased efficiencies, asset optimization, reduction of fixed costs and cost improvements on the grid scale generation power plants. An example can illustrate this situation, given a market where there is a large share of renewable generation with feed-in-tariff, the cost of grid electricity will be increased, normally through fixed costs that include these higher prices. There might be a demand grid parity, but once the feed-in-tariff period expires, this amortized generation would decrease the price through reduced grid fixed price as seen by the MG. Another option of returning to a more competitive grid price could come from the demand reduction due to MG. If the grid requires less investment, and the asset lifetime is extended because of lower usage, the fixed costs are reduced and thus the grid price for the MG.
Given the LCOE calculations presented can be used for all energy consumption in the MG, the integration of the different sources in the assessment is recommended. Heat and power can be combined, and also storage, electricity and energy for mobility, with the use of EV in MG. Growing EV adoption [
55] could be leveraged with bidirectional interface to the grid, as well as optimal charging [
56] Thus, the search for the optimum configuration of the MG will probably be enhanced by considering all energy demand when using the proposed methodology. The results also show that the storage and islanding will be driven by the market conditions, for example, if net metering is not regulated. The need for energy policy measures should be to avoid the MG market from being driven to less beneficial situations for the system as a whole. For example, the permanent islanding is not of much interest for the whole system, as was also highlighted in [
40]. The MG off-grid configuration requires excess local generation, storage, and is thus less efficient. Nevertheless, enabling services that benefit the system efficiency or reliability in a competitive manner are preferable, as we will conclude in the following section of the paper.
5. Conclusions
The increase in MG autogeneration, storage, demand response and MG islanding is beneficial for the grid as a whole and for all stakeholders in different degrees, as has been summarized. This paper has assessed the evolution and market triggers for increased autogeneration, storage and MG islanding, presenting a methodology for calculating the most appropriate MG configuration. The key factors are the competitiveness of microgeneration and distributed generation, the competitiveness of storage technologies and the grid reliability conditions for islanding. The assessment methodology presented in the paper serves to identify the MG situation and the status of equilibrium for given costs, prices and MG conditions with the grid.
Apart from using the grid as storage via net metering as the most competitive storage, electric vehicle battery storage should be prior to using other technologies of distributed storage, as show the results in LCOE calculations. Moreover, it has other associated benefits external to the grid, as is the environmental benefit of de-carbonisation of transportation. The competitiveness of this energy storage solution results the optimal, as the gross of the investment on an EV is done for transportation and not included in the LCOE costs for storage of the methodology. Mainly, it is the vehicle-to-grid equipment and control in the MG that are to be included as investment cost.
Another conclusion is the benefit for the grid is higher, both on reliability and economic efficiency, when MGs have islanding functionalities, but the permanent islanding is not of much interest for the system. In the case of the previously presented grid independence cycle, the consequences are highlighted as negative for the sustainability of the grid system. If there is an increase in the grid price and the islanding of MGs is extended, there would be a feedback for price escalation and increase independence from the grid. Only consumers without the possibility of installing autogeneration and storage would be supplied by the grid, with the possible consequence of closing grid power generation facilities, and also increasingly underused grid assets. The possible consequence would be that the system could become unsustainable to maintain financially by the remaining connected consumers.
The paper does not enter into detail of regulation levers for enabling the growth of MG, but the implications in terms of costs and LCOE are presented. However, based on the estimation of the benefits, economic, but also social and environmental, it is reasonable to conclude that three regulatory steps are necessary. First, the regulation of autogeneration for MG, technical procedures and protections for generation coupled to demand. This means enabling autogeneration without export or remuneration, as a first energy efficiency step. This measure allows the growth of autogeneration without the need for any investment by the regulator or the grid operator. Just the individual MGs would increase the autogeneration on their own interest, as long as the LCOE calculation from the methodology is lower than 100% grid supply. Second, the regulation of net metering, with appropriate remuneration to the DSO as an enabler of increased autogeneration penetration. This second step allows net balance of exported energy and consumption and should be complemented with the possibility of selling excess energy to the market. The consequence of allowing net metering is increased autogeneration without the need for storage in the MG, as the grid would be the storage. The calculated LCOE will be lower for increased penetrations of autogeneration even when not coupled with the consumption. It is preferable, because it doesn’t require additional investment on storage, basically other consumers or MG are consuming the excess energy. The third and last recommendation is the inclusion of islanding procedures for MGs as well as demand response and ancillary services pricing for MGs acting as virtual power plants. The methodology suggests having this incentives should be preferable in LCOE to permanent islanding when there is grid parity of storage. These last regulatory measures should deter islanding MGs from becoming grid independent, as the market should reflect the benefits the interconnection has for all stakeholders. The islanding procedures are necessary for the technical functioning of the islanding MG, it is an enabling regulation for the application. Demand response regulation associated with MGs can allow the control of the demand, but also the islanding decisions of MGs. The possibility of participating in ancillary services, such as reactive power control for voltage stability, or active power control for frequency stability is relevant, as it increases competition in these regulation markets by the entrance of MGs and benefits the MGs with reduced global LCOE. These policy recommendations are not considered as levers benefiting MGs but as enabling regulatory measures for the development of MGs when the application is beneficial. Following the recommendations presented here, the energy system may expect the improvements mentioned in the introduction, increased economic, social and environmental sustainability.


