1. Introduction
Due to the increase in traffic volume, host tonnage and the quantity of marine diesel engine growing year by year, their emissions cause serious harm to the ecological environment. This issue has been of high concern for the international maritime organization (IMO), the international maritime environmental protection committee, the world health organization, and other agencies and governments. On October 10, 2008, the Maritime Environment Protection Committee (MEPC) defined three levels of IMO Marine diesel engine emission regulation systems. The Tier II emission regulation has already been implemented since 2011, and the Tier III emission regulation will apply to the emission control areas from January 1, 2016. The Tier III emission regulation requires 80% of nitrogen oxide (NOx) reduction compared to Tier I emission regulations, which is clearly a huge change for the development of marine engines. Furthermore, the future coexistence of IMO Tier II and IMO Tier III emission areas will enhance the requirements for the flexibility of engine operation.
The major marine diesel engine manufacturers have been carrying out researches on emissions reduction, aimed at seeking the most effective and feasible technical route for the Tier III emission regulation. Various techniques, such as selective catalytic reduction (SCR), exhaust gas recirculation (EGR), humidification, and natural gas engines, have been thoroughly researched [
1,
2,
3,
4]. SCR and gas engine are the only feasible technical solutions at present. The life cycle cost of the aforementioned technologies was evaluated by Christer Wik [
5], and the results show that two-stage turbocharging, dual fuel and SCR technology have more potential. However, by reason of the uncertainty of the market price of fuel and urea (the raw material of SCR system) in the future, it is difficult to make a final choice at the present stage, and there are still problems with the layout of SCR devices. In addition, other combination of the potential technical routes are proposed: Wetpac (intake humidifying/emulsified oil/water in-cylinder) + EGR + 2 TC (two-stage turbocharging), is worth further evaluation.
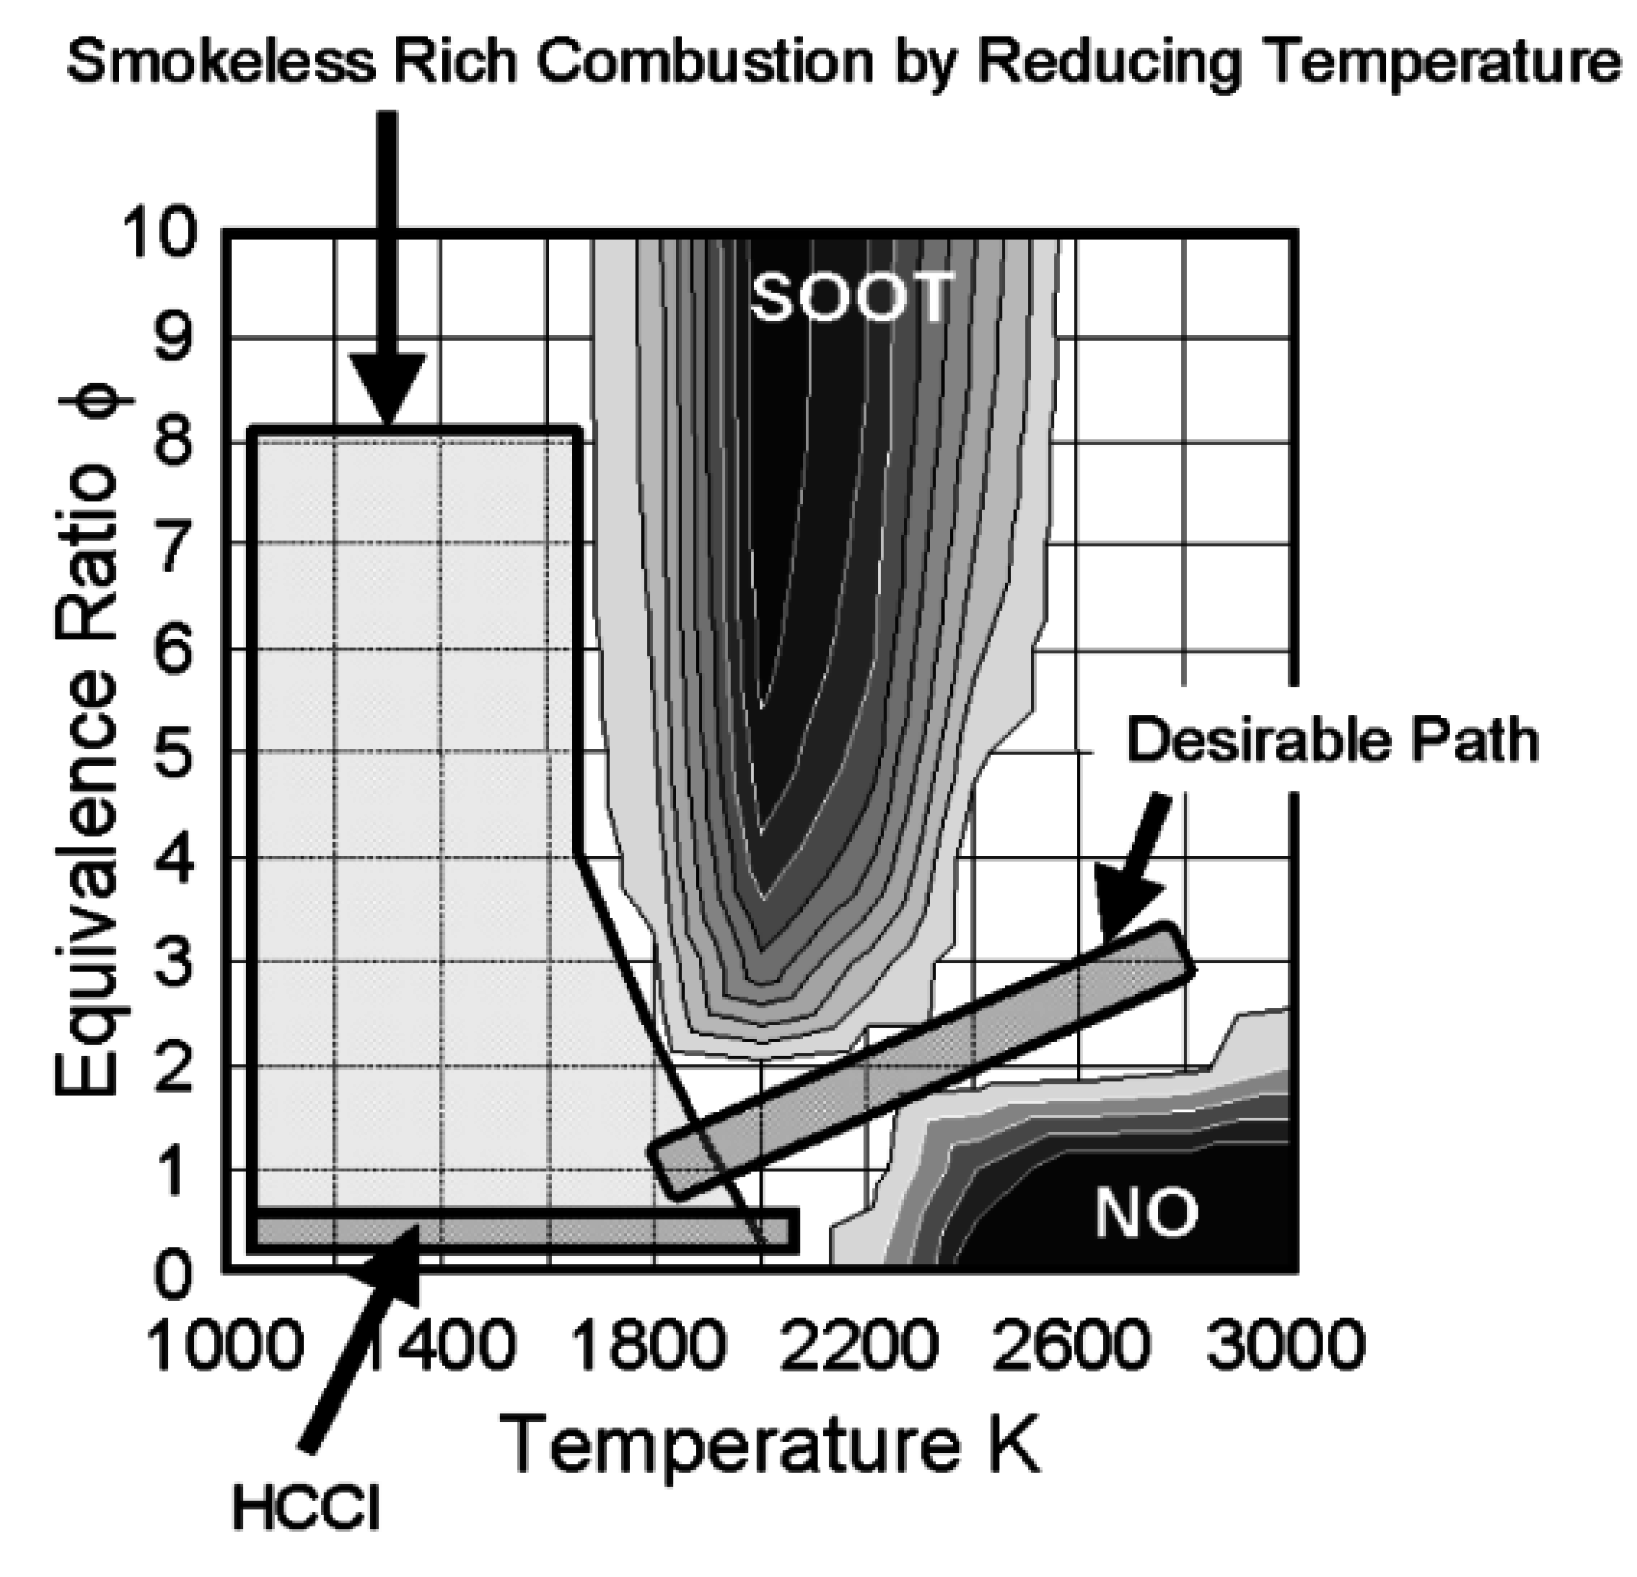
In view of diesel engine combustion, how to reduce NO
x and PM (particulate matter) simultaneously is a highly complicated problem. These two kinds of pollutants are formed simultaneously in traditional diesel engines which are operated with a heterogeneous mixture under conditions of high temperature burning. Shown in
Figure 1, soot, the major composition of PM, is produced in the 1800–2500 K region with rich fuel conditions; NO
x emissions are produced in rich O
2 conditions with temperature higher than 2300 K. A number of researches have demonstrated that NO
x and soot emissions can be suppressed at the same time by controlling combustion temperature and the equivalent ratio φ by the new combustion concept, such as LTC (low temperature combustion) [
6,
7,
8], HCCI (homogeneous charge compression ignition) [
9,
10] and so on. There is also a desirable path [
11] in the φ-T map in which NO
x and soot can both be reduced, which is a long and narrow channel with high temperature and a rich mixture.
The Miller cycle is a low cost and effective method to reduce NOx emissions. By advancing or delaying intake valve closing time, the effective compression ratio is decreased, and accordingly the in-cylinder compression terminal temperature and maximum combustion temperature are reduced. However, as the result of a shorter inlet valve open period, a turbocharger with higher pressure ratio (>9) is needed to compensate for the loss of intake air. Thus the air-fuel ratio is maintained so that it is consistent with the baseline engine. At the same time, the Miller cycle can improve the engine efficiency by 4%–8%. Further, in part load condition, the Miller cycle will be restricted by the thermal load, thus impairing the ability to reduce NOx emissions. Compared with traditional single-stage turbocharging diesel engines, extreme Miller timing technology, which advances the intake valve closing timing by 100°CA, combined with two-stage turbocharging can reduce NOx emissions by 40%–50%.
Figure 1.
Comparison between new combustion concepts on a Φ-T map [
7].
Figure 1.
Comparison between new combustion concepts on a Φ-T map [
7].
EGR technology [
6,
12,
13,
14,
15], is namely, recirculating the cooled exhaust gas back into the combustion chamber. On the one hand, the heat capacity of the in-cylinder charge is improved, so the flame temperature can be reduced at the inlet CO
2 and water vapor; on the other hand, NO
x formation is effectively restrained by reducing the inlet concentration of O
2, slowing down the mixing speed of air and fuel, and obtaining a lower flame temperature. EGR technology demonstrates the potential of reducing NO
x emissions by 60% on the basic of the IMO Tier I emission level.
Several researches have confirmed that the combination of Miller cycle, two-stage turbocharging, and EGR technology is a feasible route to meet the IMO Tier III NO
x regulations. F. Millo
et al. [
15] established four models for EGR connection schemes on a Wärtsilä W20L6 four-stroke diesel engine by using a one dimensional CFD simulation code. EGR rate schemes of 5%–20% were simulated, and exhaust emissions and economy levels of different schemes were analyzed. The study found that, compared with single-stage turbocharging diesel engines, using 20% EGR combined with extreme Miller timing (100°CA BBDC) NO
x emissions can be reduced by 90%, while the fuel consumption rate is slightly elevated. The effects of 0%–20% EGR operation on a six-cylinder medium speed diesel engine were investigated in reference [
16] by R. Verschaeren, reductions of up to 70% of NOx were attained at different loads. The greatest NOx reduction was achieved with Miller timing. It can be concluded that the EGR system is an essential part of an engine concept in order to fulfill IMO Tier III NO
x requirements, but only one Miller IVC (20°CA BBDC) was tested in his paper. In reference [
17], a 1.8 l single-cylinder diesel engine was studied by Jesús Benajes by combining direct experimental data with the detailed information on the local in-cylinder conditions obtained from 3D-CFD simulations. The research was combined to compare the 10%–16% EGR and Miller (effective compression ratio = 8~14.4) strategies respectively in terms of the emissions, efficiency and the local combustion process. The results show that both combustion strategies provide very low NO
x levels below 1 g/kg
fuel, which correspond to 0.2 g/kWh. These levels are well below the limit of 0.4 g/kWh imposed by EURO VI regulation.
The above researches have given valuable results; nevertheless, there are also insufficiencies, such as it is difficult for a one dimensional CFD simulation code to predict the in-cylinder combustion process in reference [
15], especially for the emissions. In references [
16,
17], deeper Miller timing over 20°CA BBDC and an EGR rate which is higher than 20% were not presented, and Jesús Benajes confirmed how Miller cycle and EGR strategies are suitable for decreasing simultaneously NO
x and soot emissions down to ultra-low levels, but he did not investigate the combination of these two technologies. For the Tier III emission regulation, NO
x emissions still need to be further reduced if only one of the two technologies is adopted. Moreover, not so many of these kinds of strategies have been carried out on marine diesel engines, especially those which use high boost pressure with Miller cycle, because there are still problems which need to be solved, such as how EGR technology works in conjunction with high turbocharging technology. When using extreme Miller cycle technology, a two-stage turbocharger must be incorporated, this implies that the exhaust pressure will be smaller than the inlet pipe, and thus the traditional EGR circuit connection cannot be simply adopted; also the application of two-stage turbo charging increases the manufacturing costs of the engine. Meanwhile, although a much lower compression terminal temperature is achieved by using an extreme Miller cycle, in the low load condition, a miss fire phenomenon is liable to happen. In addition, overlong ignition delay period, which can be obtained from a decrease of effective compression ratio, promotes the heat release of premixed combustion, and increases the local instantaneous high temperature zones in the cylinder, which weakens the ability of the Miller cycle to reduce NO
x emissions [
18].
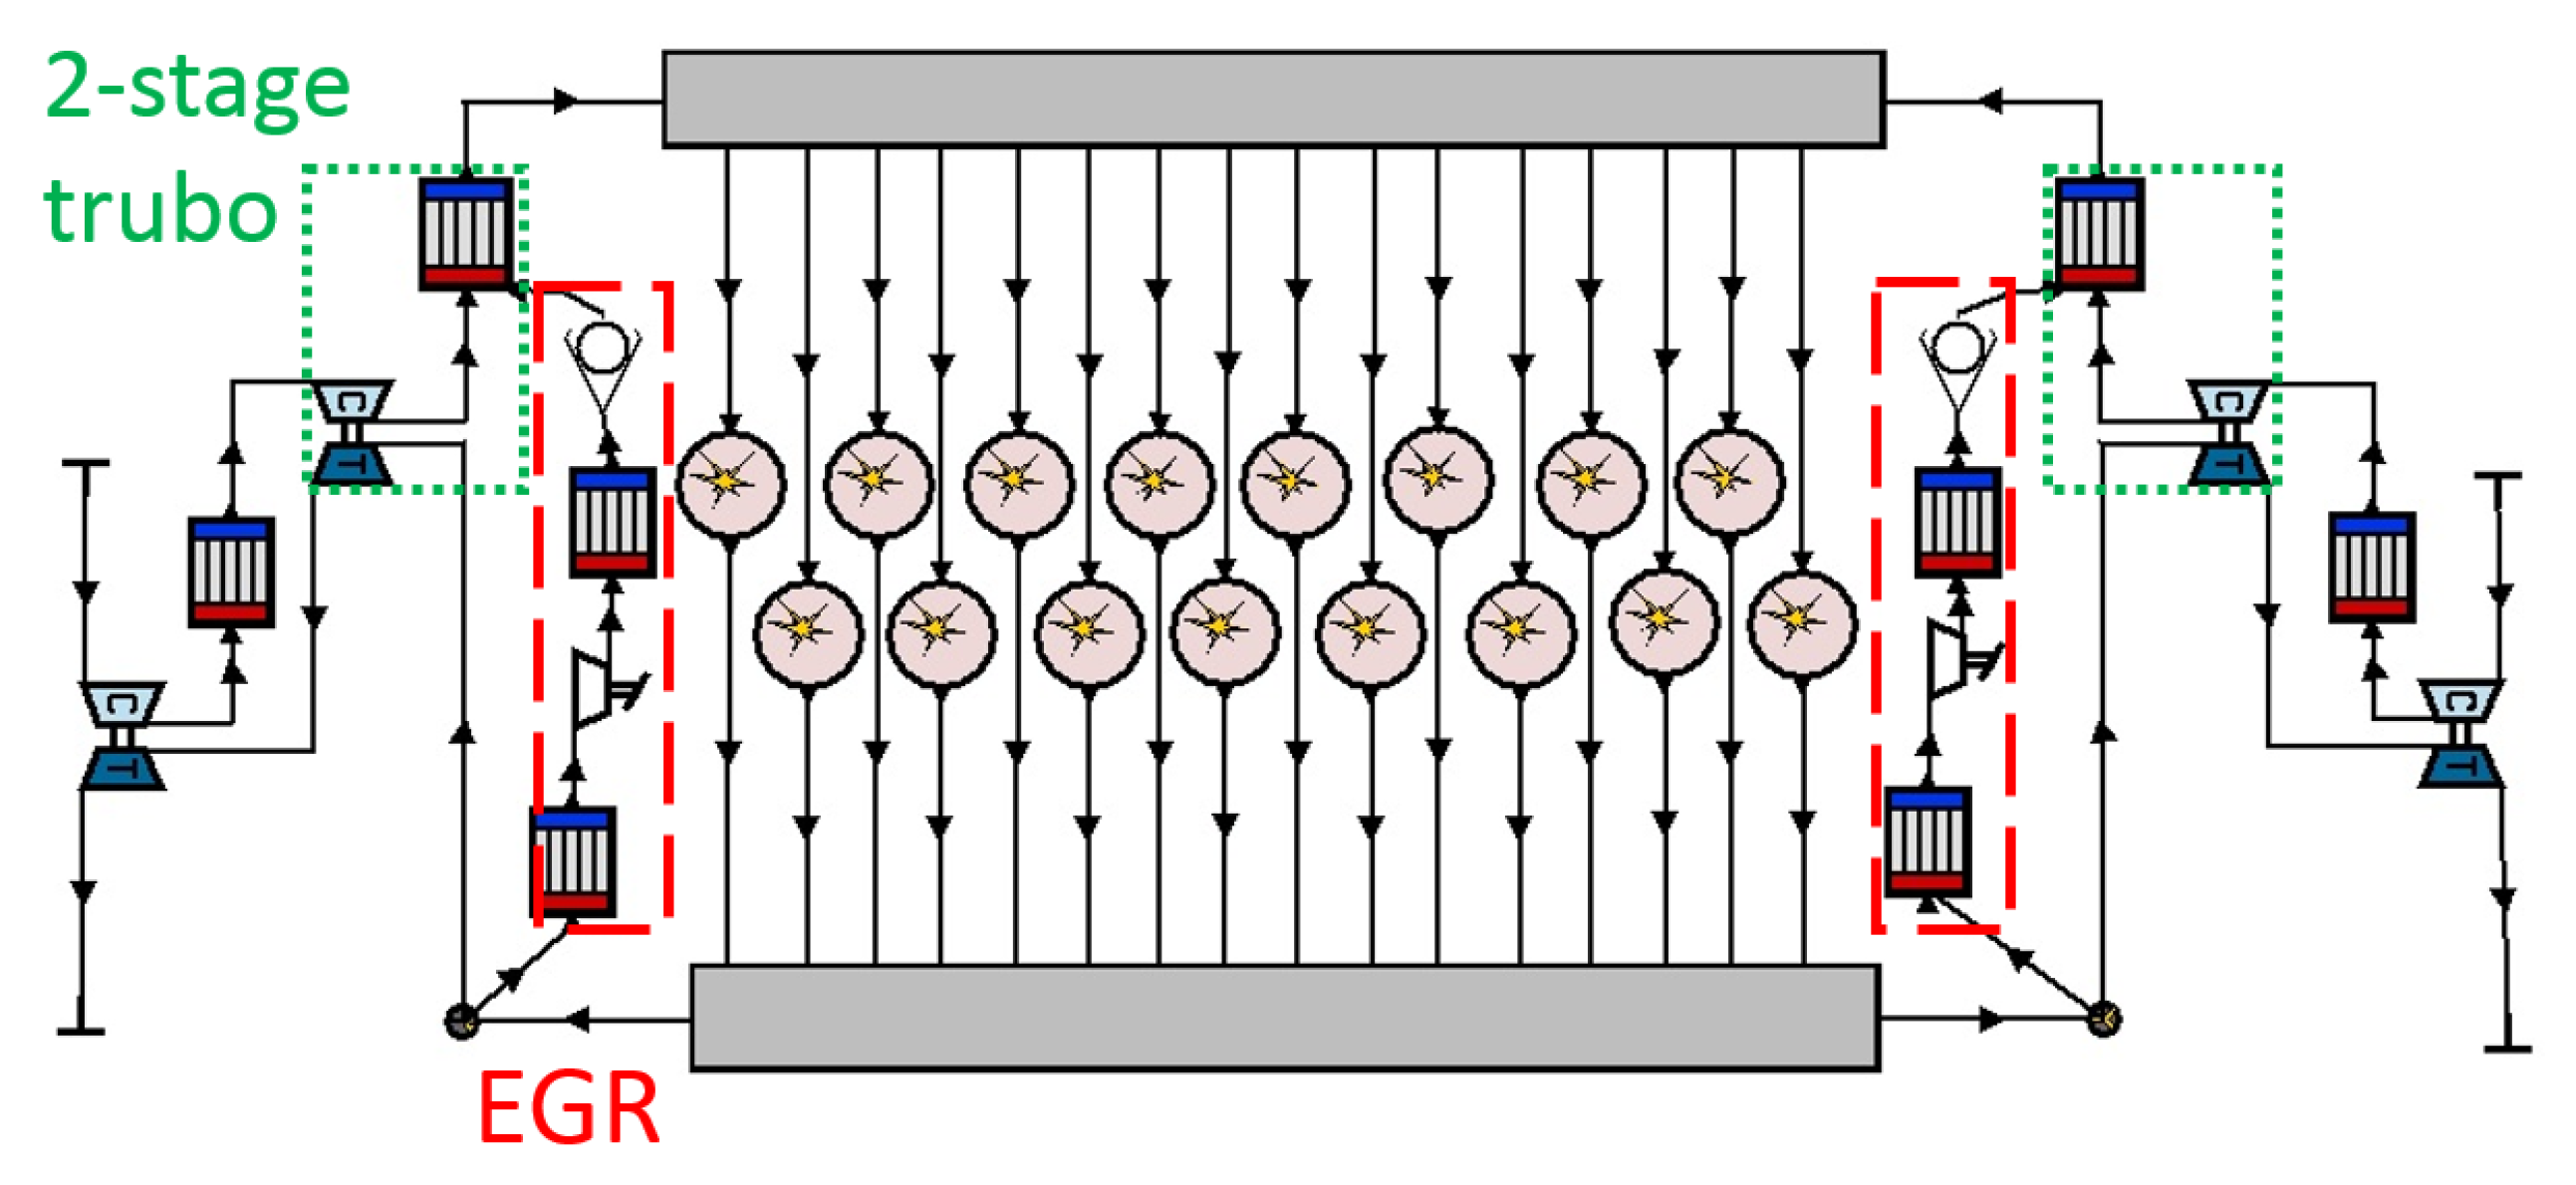
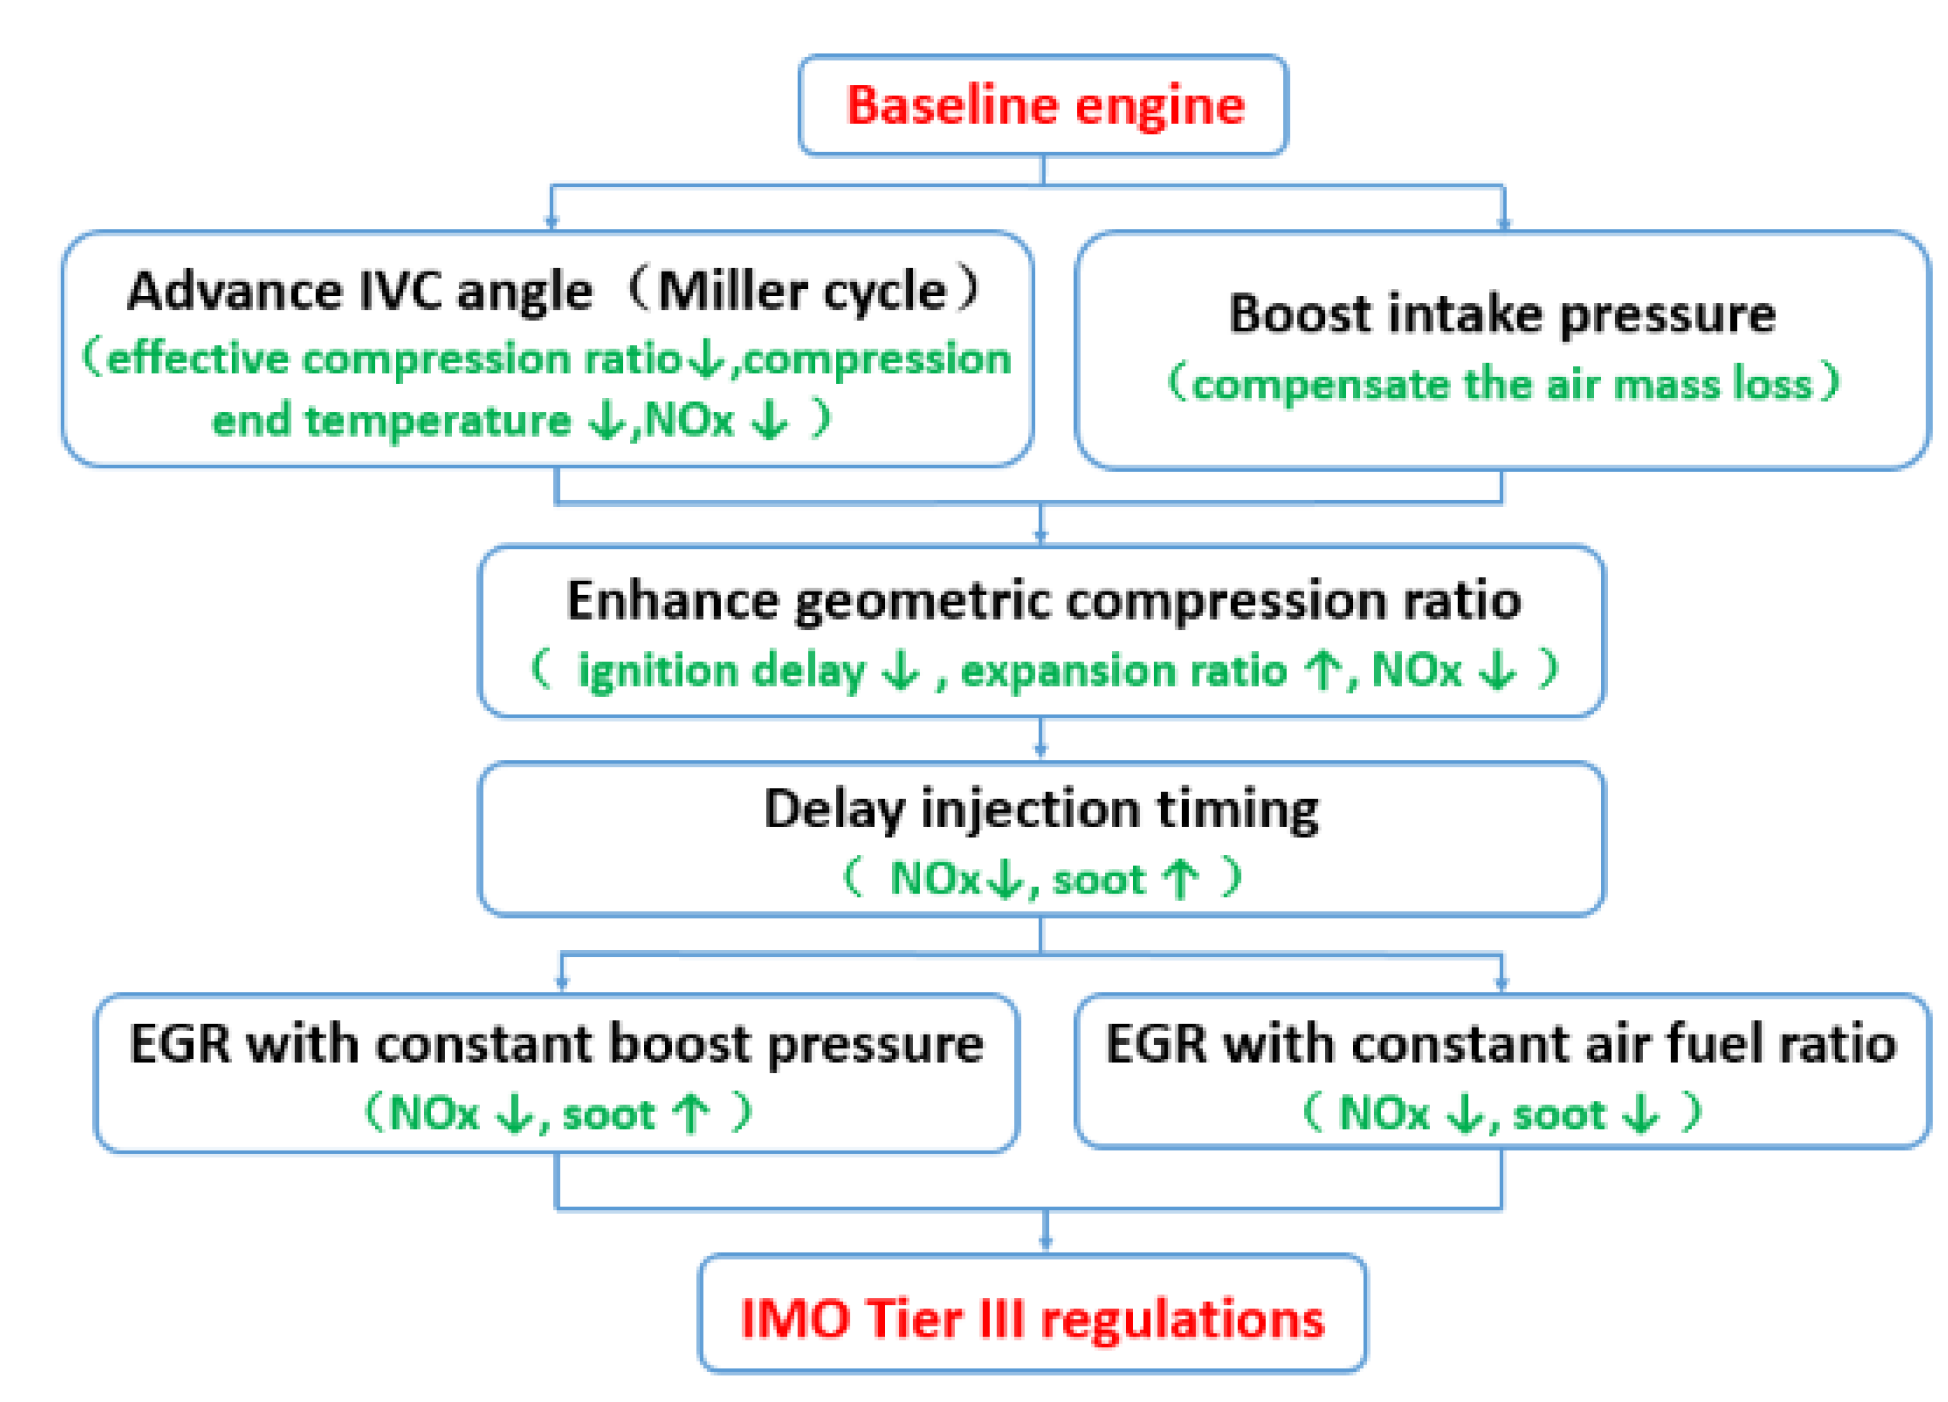
With the above background, this research considers the technology which combines moderate Miller cycle with moderate EGR rate as a more feasible technical route to realize IMO Tier III regulations. The aim of the current study is to clarify the effects of advancing IVC (intake valve close) angle (Miller cycle 0–70°CA BBDC), boosting the ratio of the charge, enhancing the geometric compression ratio, delaying the injection timing and 0%–30% EGR rates on the performances and emissions of a medium speed marine diesel engine, shown as in
Figure 2. This is achieved by means of the combination of one and three dimensional (1D & 3D) Computational Fluid Dynamics (CFD) simulation, using AVL BOOST and FIRE packages respectively. The whole engine performance model was established by 1D CFD software to provide the initial in-cylinder temperatures and pressures for 3D CFD simulations. The influence of Miller cycle and EGR technologies on the compression terminal temperature and pressure can be taken fully into account, while the in-cylinder combustion process and emissions are simulated by 3D CFD software.
Figure 2.
IMO Tier III technology roadmap.
Figure 2.
IMO Tier III technology roadmap.
3. Results and Discussion
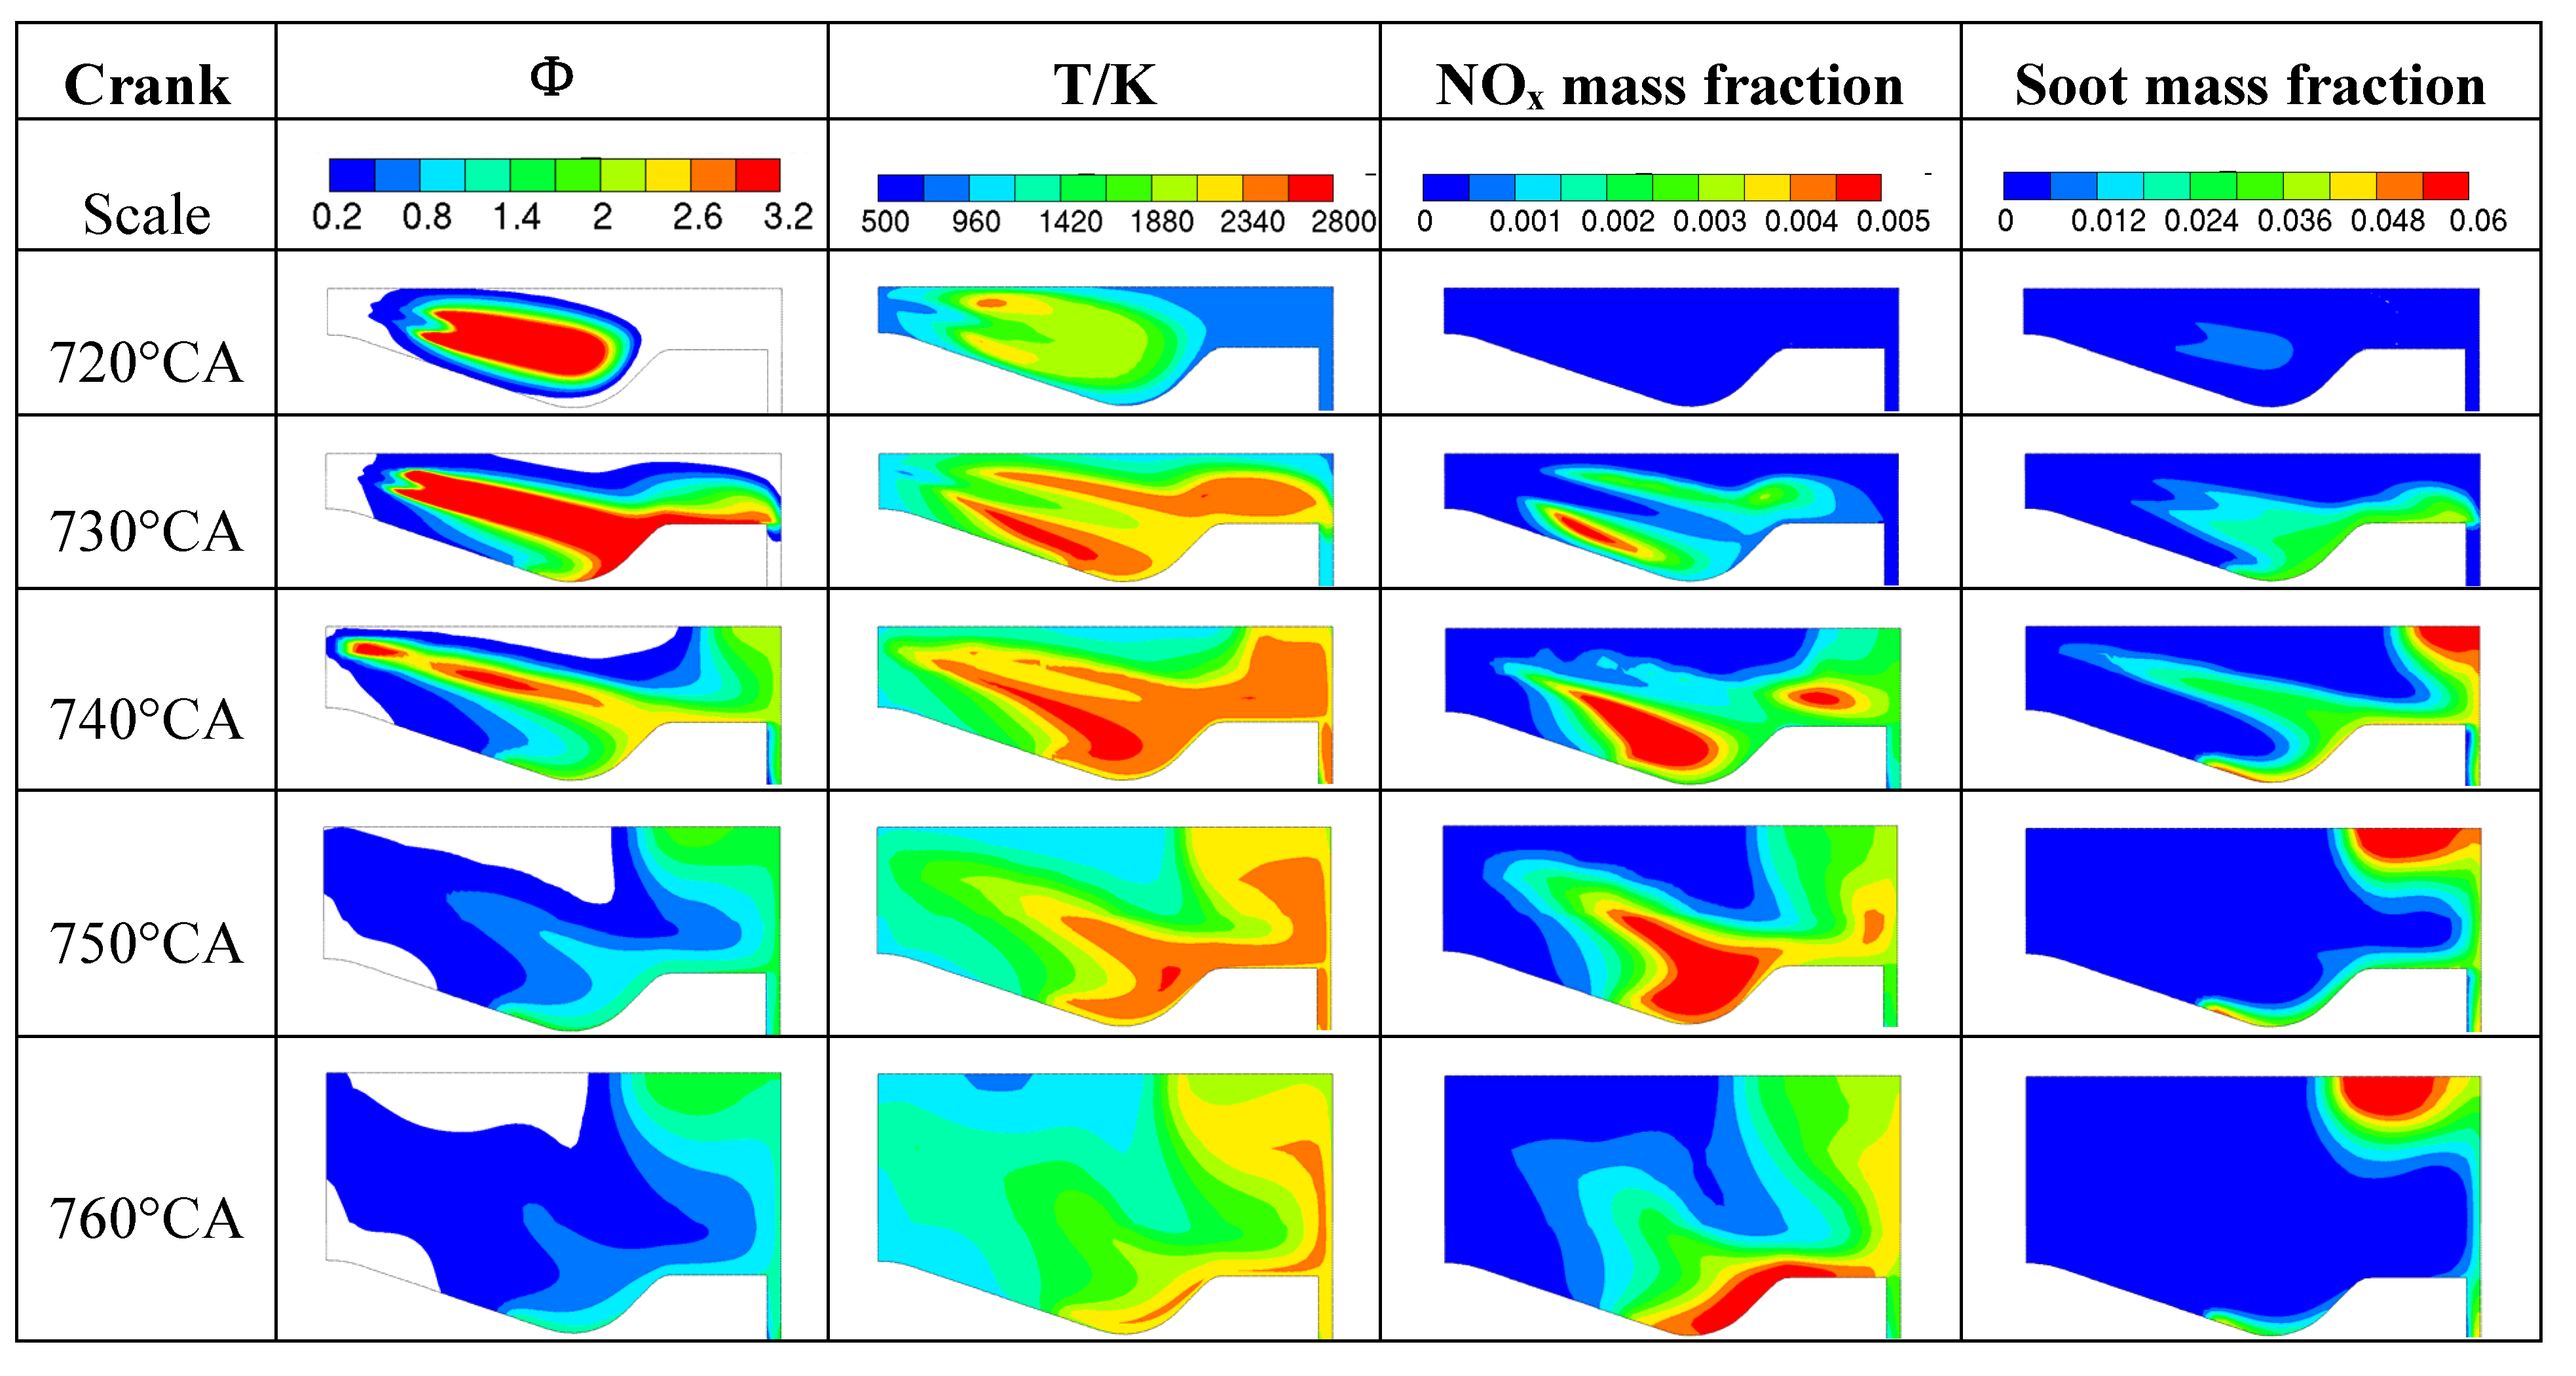
Figure 8 shows the contour images of the fuel/air equivalent ratio, in-cylinder temperature, NO
x, and soot mass fraction of the baseline engine. The formation of diesel engine pollutants shows that soot emissions are produced in the local rich oil mixture where the combustion temperature is higher than 1800 K, and the excess air ratio is lower than 0.5; NO
x emissions are formed in the local high temperature regions with rich O
2, where the combustion temperature is usually higher than 2300 K. The simulation results show the same trend as the above mechanisms. It can be seen that when thein-cylinder temperature increases above 2300 K, the NO
x starts to form near the TDC, and the high NO
x region concentrates in the periphery of the spray during the early injection time (720–730°CA). At the end of fuel injection (740°CA), the NO
x concentration region moves to the pit of the piston. From the figure, the red region of NO
x is transferred to the pit at 740–760°CA, and φ is in the range of 0.6–1.2. On the other hand, soot emissions are produced in the center of the spray firstly, and then move to the outskirts of the clearance near the cylinder head. Compared to the NO
x formation region, the soot concentration region appears when the spray impinges the pistion where φ is higher than three with the temperature in the range of 1700–2300 K. The last concentration region of soot appears near the cylinder head at 740–750°CA, during this time, the mixture transfers along the piston to the outskirts of the clearance, then turns round when meeting the cylinder wall. The mixture then begins to move up to the cylinder head, so it becomes a rich oil region where φ is in the range of 1.4–2.1.
Figure 8.
Contour images of equivalent ratio, temperature, NOx, and soot mass fraction of baseline.
Figure 8.
Contour images of equivalent ratio, temperature, NOx, and soot mass fraction of baseline.
3.1. Effects of Miller Valve Timing
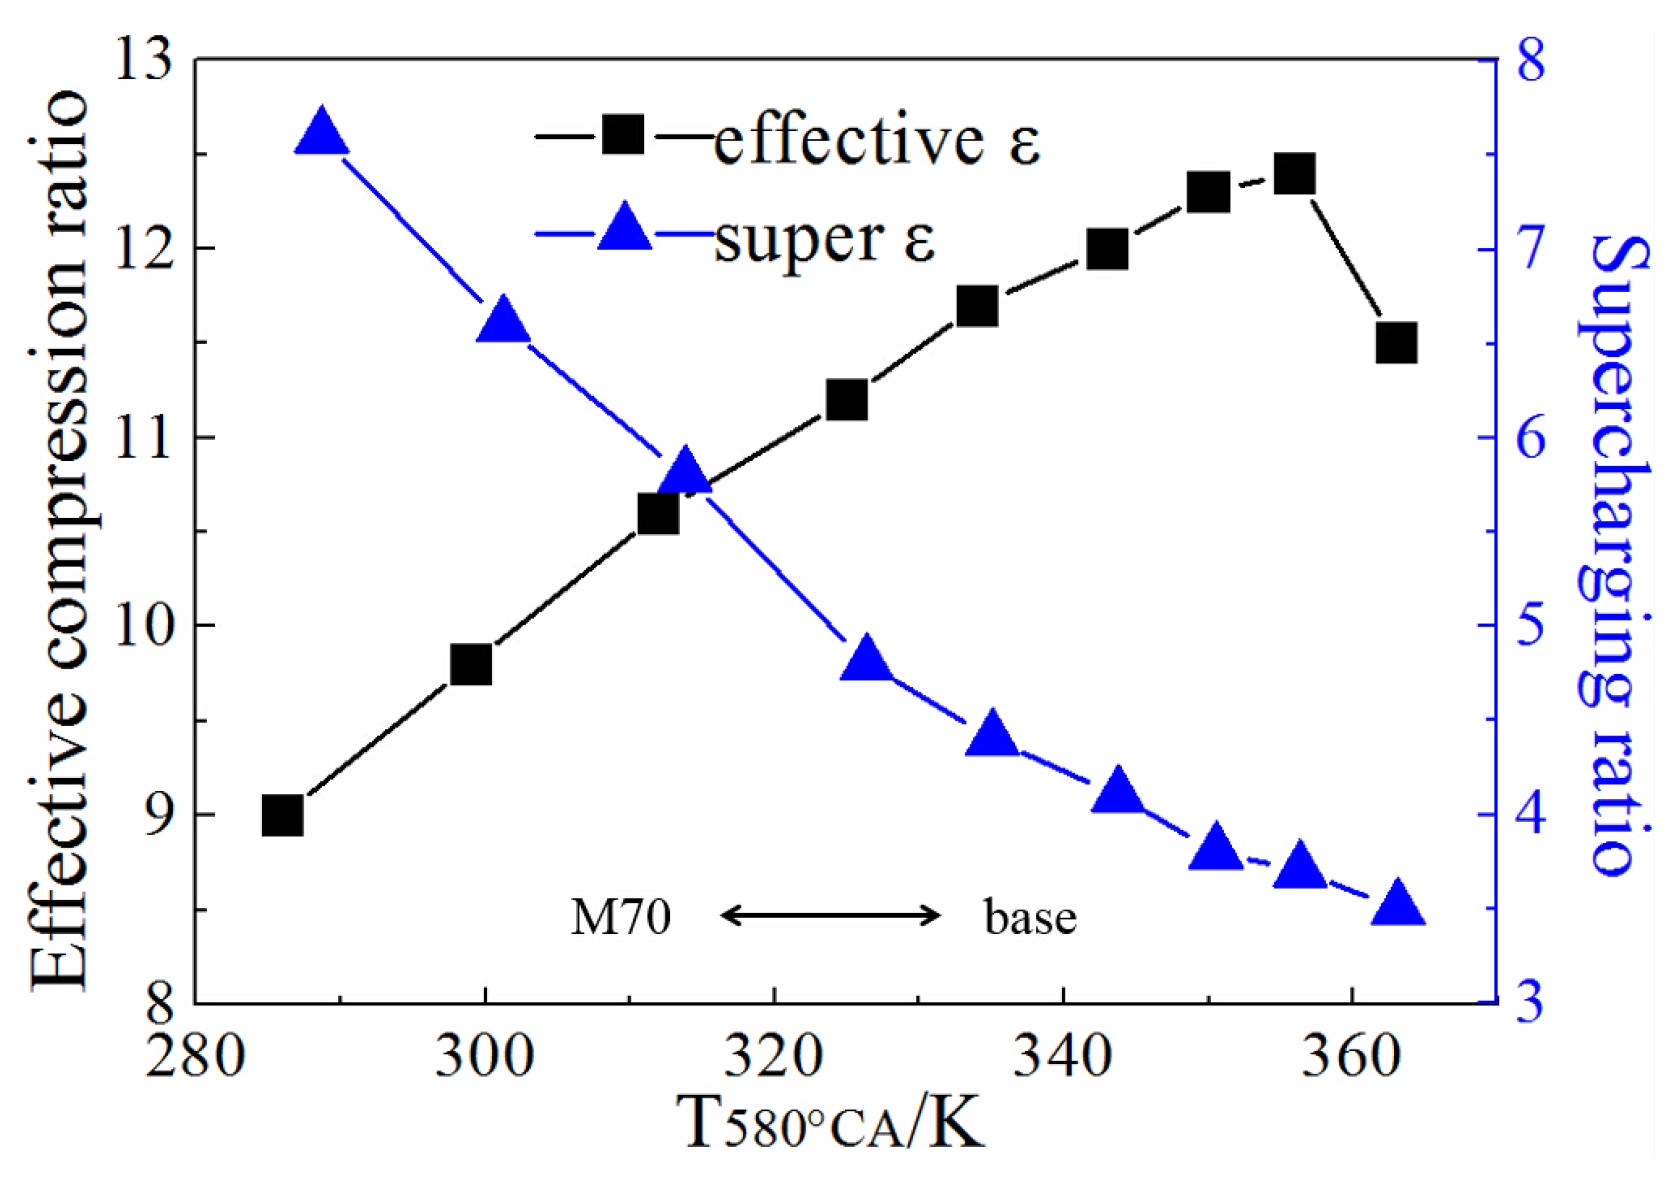
Eight Miller cycle schemes with different advance close timings through 10–80°CA were simulated. The fuel/air equivalence ratio φ, intake manifold temperature, and power are kept the same as the baseline engine in this set of simulation.
Figure 9 shows the comparison of the effective compression ratio, boost ratio, and in-cylinder temperature at 580°CA (IVC timing of the baseline engine) between the Miller cycle and baseline engine schemes; the Miller schemes are marked as M+crank angle of the IVC timing advance referring to the BTC; for example, M40 represents the intake valve close timing is 40°CA BBTC. Due to the advance of the inlet valve closing time, the effective compression ratio is reduced. Since there is a 74 mm piston offset, the effective compression ratio of the M40 scheme is a little different from the baseline. The turbochargers with higher boost ratio are required to maintain the same intake air quantity as the baseline engine, so as to avoid the increase of NO
x and thermal load. Two-stage turbocharging was employed in the M60, M70, and M80 schemes. The initial in-cylinder temperature and pressure of different Miller timings at 580°CA that should be inputted into the 3D CFD were obtained from the results of 1D CFD simulation. The in-cylinder temperatures reduce gradually, since the expansion of the endothermic process takes a longer period of time in a deeper Miller cycle, and the temperature at the compression end is also reduced. Consequently, the flame temperature is reduced. There are two key factors in the NO
x formation process: one is high temperature and the other is rich O
2. As one of the above conditions has been suppressed, the NO
x emissions can be reduced.
Figure 9.
Comparison between Miller and base schemes in effective compression and boost ratios.
Figure 9.
Comparison between Miller and base schemes in effective compression and boost ratios.
A comparison of NO
x and soot emissions under different Miller cycle conditions is shown in
Figure 10. The in-cylinder temperature at the compression end time reduces as the intake valve close timing advances, and NO
x emissions decrease substantially. It can be seen that the NO
x was reduced by 27.1% in the M50 scheme. The results show that when the in-cylinder temperature at the intake valve close timing of the baseline engine is kept in the range of 299–312 K in Miller schemes, the normalized NO
x reduction remain at about 27%. On the contrary, if the intake valve closes even earlier, the NO
x emissions increase by 5.8%. This is because the lower compression temperature extends the ignition delay period, then more premixed gas is formed in the longer ignition delay period, and the peak of premixed heat release increases; this was verified by Roel Verschaeren [
16]. Since the peak of premixed heat release increases in Miller schemes, the in-cylinder temperature and pressure will increase rapidly in this period. This phenomenon not only leads to rough working possibly, but also weakens the ability to reduce NO
x emission [
27]. On the other hand, there is no obvious change in the soot emissions with low degree Miller cycle. The relative change of soot emissions is less than 5% in the M20–40 schemes compared with the baseline engine. When continuing to increase the Miller cycle degree, the compression terminal pressure becomes lower, and there is a retard on the start of combustion timing, since the ignition delay period is longer. The soot emissions can be restrained by the increase of the premixed combustion heat release. The soot emissions were 28.9% lower in the M50 scheme than for the baseline engine. The start of combustion timing is already delayed after the TDC in the M60 and M70 schemes. The soot emissions are inhibited significantly, and the decreasing rate reached about 85%.
Figure 10.
Influence of Miller timing on NOx and soot.
Figure 10.
Influence of Miller timing on NOx and soot.
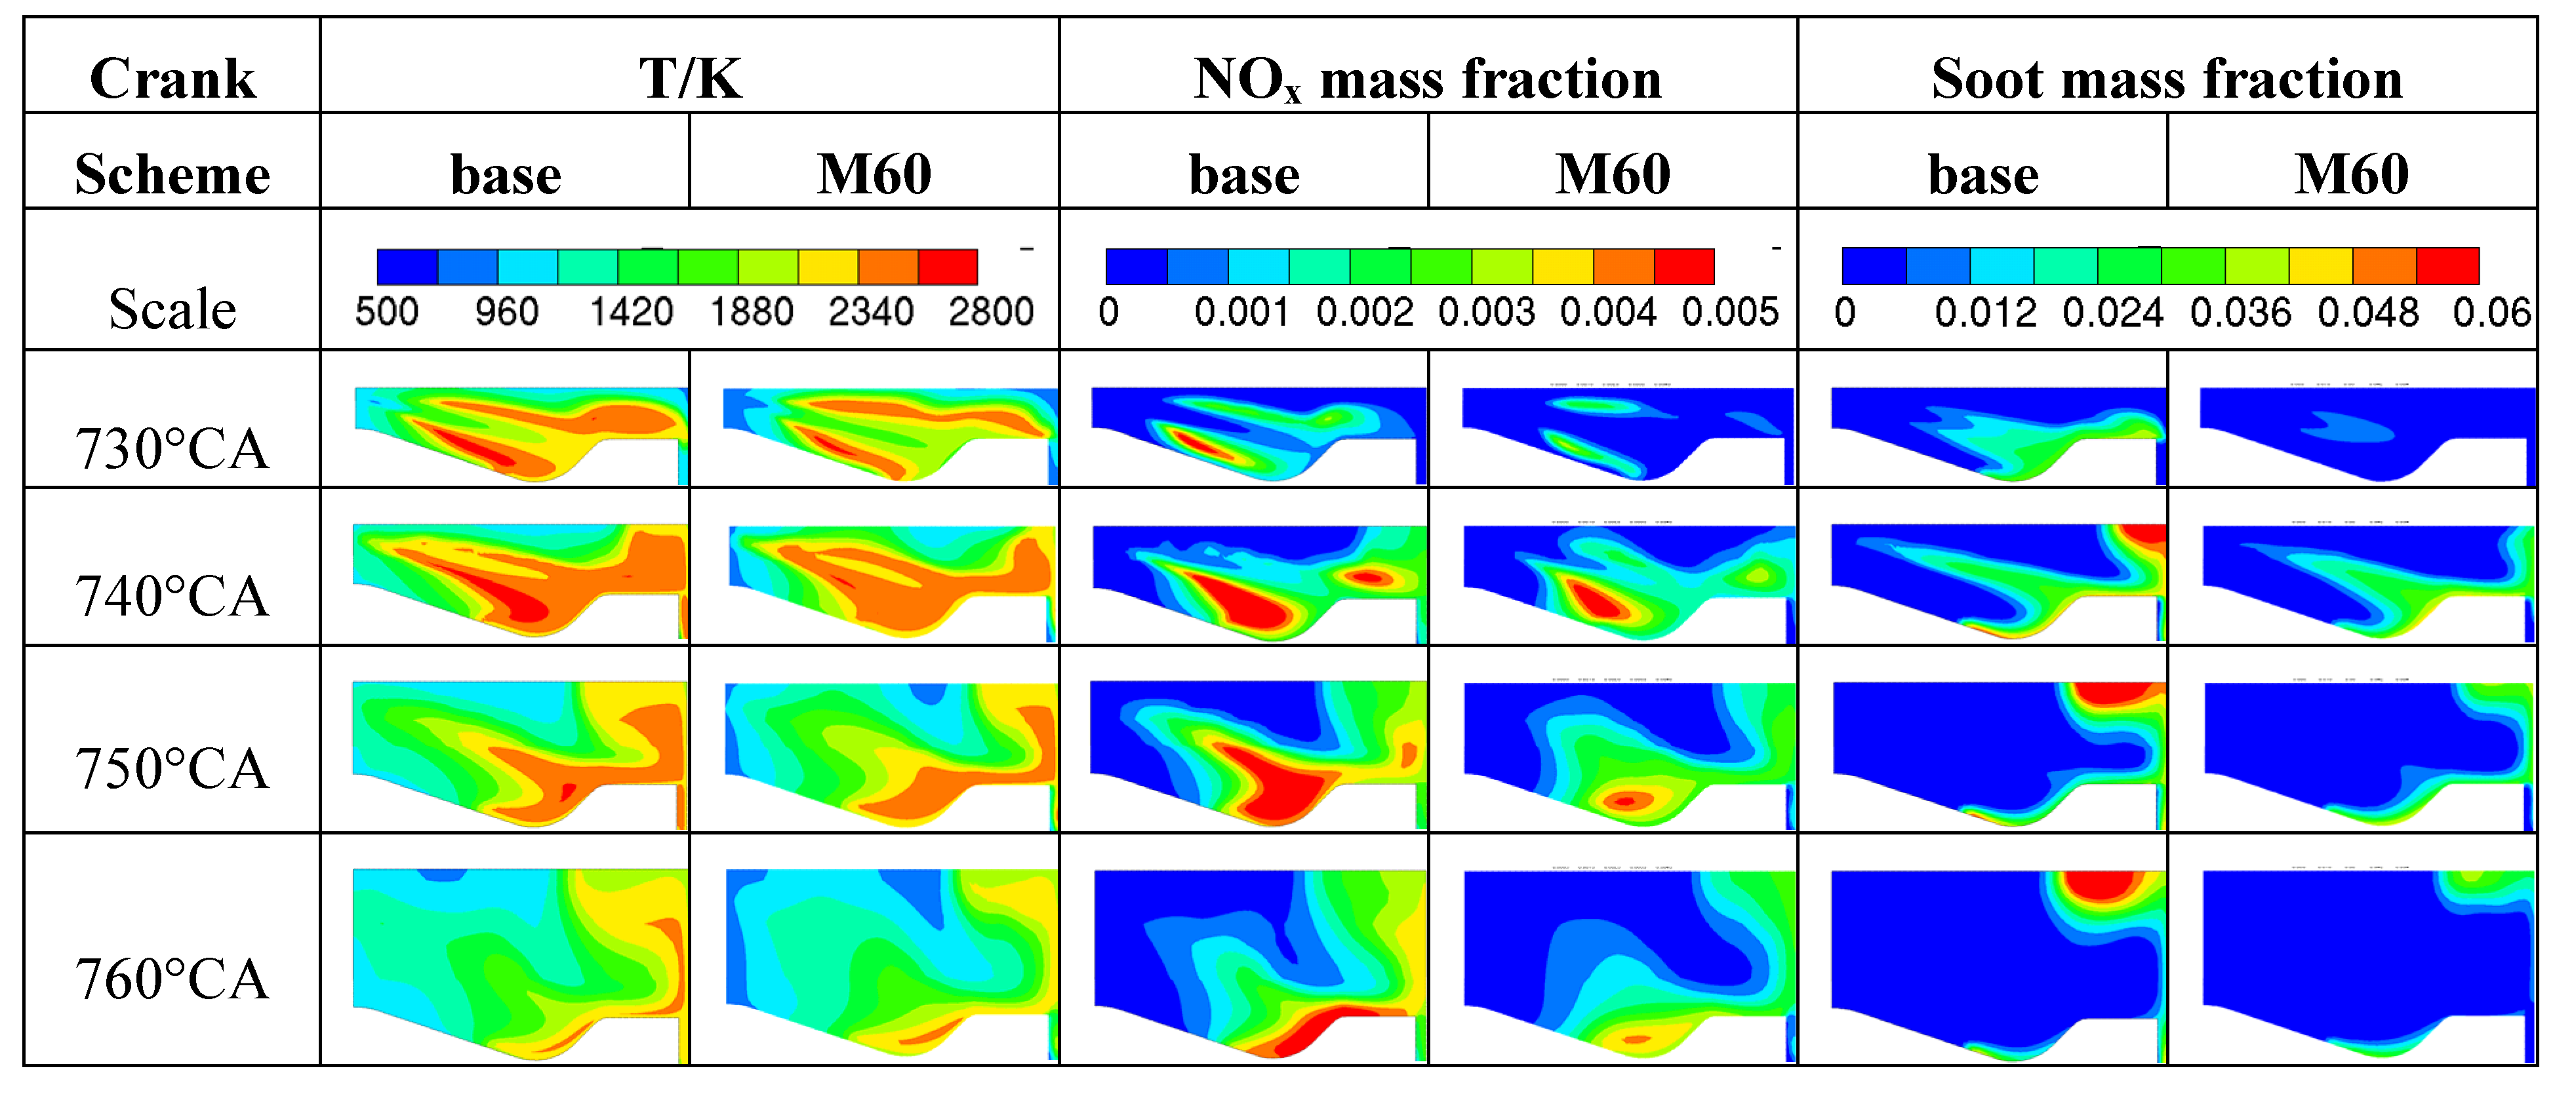
Figure 11 shows the comparison of the temperature, NO
x and soot mass fraction between the M60 and the baseline scheme. It is obvious that the in-cylinder temperature is reduced when Miller cycle is applied, and the NO
x and soot emissions are reduced dramatically. Since the distribution of φ is not changed too much over 740–780°CA, the in-cylinder temperature is the most important factor which determines the formation of NO
x and soot. It can be seen in the figures that the high NO
x region is reduced in the whole combustion process, and only a small red region appears near the piston pit at 740–760°CA. Meanwhile, due to the longer ignition delay, the local fuel/air equivalent ratio decreases, and the reduction range of the soot is even larger. It can be seen from the figure that the red region has disappeared completely. Up to now, NO
x and soot have been reduced by 27.4% and 84.3% respectively by controlling the in-cylinder temperature. It also reflects that the NO
x and soot can be further reduced if the problem of the oil accumulation in the piston pit can be solved. In conclusion, the combination of reducing in-cylinder temperature and organizing the air flow is an effective way to reduce both NO
x and soot.
Figure 11.
Contour images comparison of temperature, NOx, and soot mass fraction between M60 and baseline schemes.
Figure 11.
Contour images comparison of temperature, NOx, and soot mass fraction between M60 and baseline schemes.
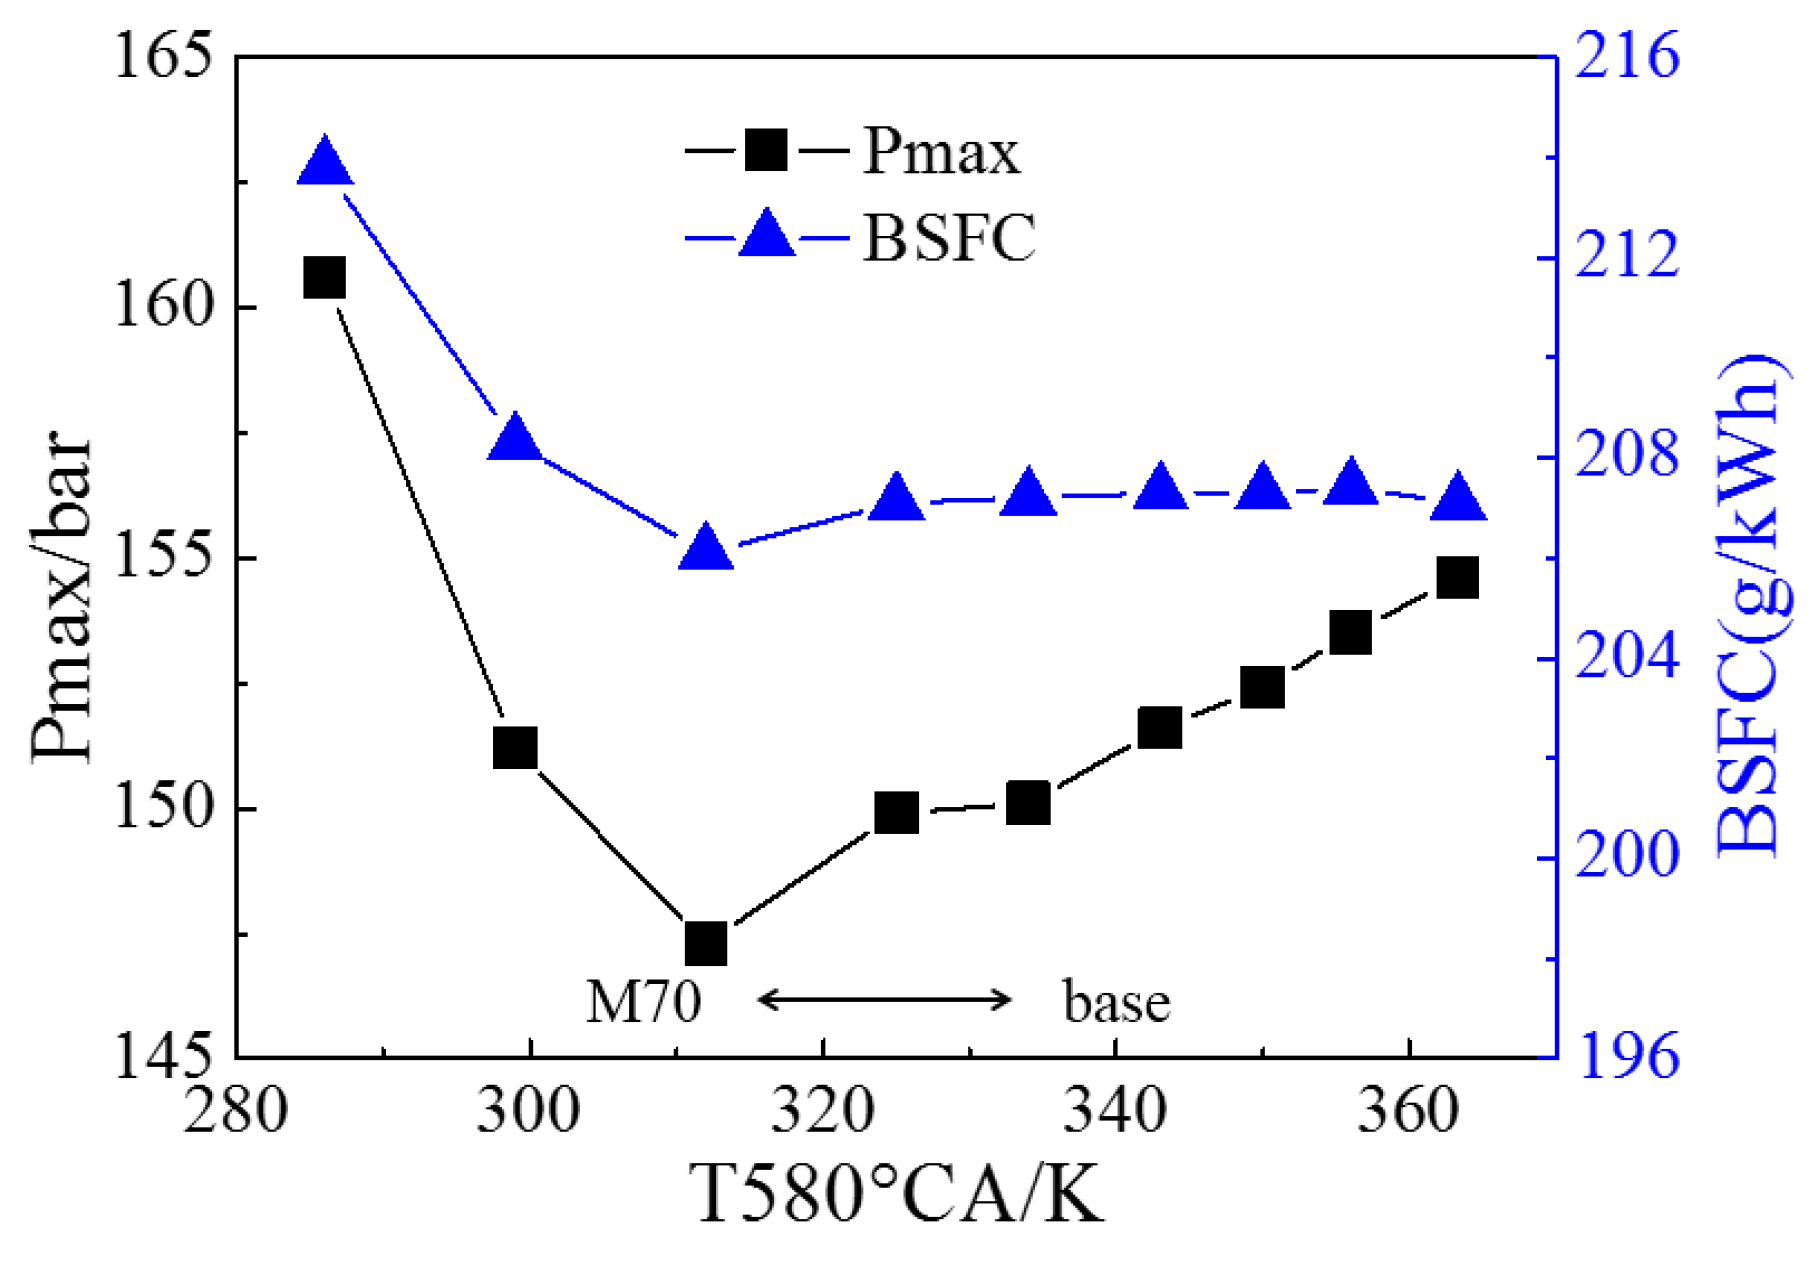
Figure 12 shows the effect of Miller valve timing on the maximum cylinder pressure and BSFC (brake specific fuel consumption) compared to the baseline engine. It is obvious from the figure that the maximum cylinder pressure is decreased along with the degree of Miller cycle becoming deeper. The minimum data of maximum cylinder pressure occurs in the M50 scheme, and then increases gradually. This is because the ignition delay period is longer in Miller schemes, and the combustion starting phase is retarded, so the maximum cylinder pressure will decrease with the deeper Miller cycle. Meanwhile, when the total mass of the intake gas is constant, the in-cylinder pressure will decrease with reducing temperature at the same crank angle by the ideal gas state equation. The maximum cylinder pressure shows an increasing trend in the M60-70 schemes because of the pressure explosion which is caused by the multiplied heat release during the premixed combustion. On the other hand, medium Miller cycle has little effect on the fuel economy of the diesel engine, and BSFC is maintained in the baseline engine level. The BSFC is reduced since two-stage turbocharging is used in the M50 scheme. However, due to the overmuch pumping loss, the combustion deteriorates in the M60-70 schemes. Although two-stage turbocharging is also used, BSFC still becomes worse. In view of the whole process of Miller cycle deepening, the premixed heat release peak increases gradually, and the ignition delay period becomes longer. In conclusion, the Miller cycle affects the maximum cylinder pressure to some extent less, and the effect depends on two factors: one is the peak of premixed heat release; the other is the ignition delay period.
Figure 12.
Influence of Miller timing on firing pressure and BSFC (brake specific fuel consumption).
Figure 12.
Influence of Miller timing on firing pressure and BSFC (brake specific fuel consumption).
3.2. Effects of High Geometric Compression Ratio
The compression temperature decreases with the deepening of the Miller cycle, and it affects the cold start process of the diesel engine to a certain extent. In order to improve the cold start ability and the fuel economy, and also to weaken the disadvantageous effects of strong premixed heat release in the Miller cycle, the effect of a high geometric compression ratio on the performance and emissions of the Miller cycle diesel engine were numerically analyzed. Retaining the same combustion chamber shape, four high geometric compression ratio Miller schemes were designed by reducing the model’s clearance based on the M50 scheme, as shown in
Table 4. The baseline M50 scheme is marked as G12.4, and the M50 combined with high geometric compression ratios are marked as G12.4–15.4 respectively. Due to the increase of the geometric compression ratio, to a certain extent, the fuel economy is improved, and further reduction of NO
x can be achieved by retarding the injection timing.
Table 4.
Settings and results of high ε Miller cycle.
Table 4.
Settings and results of high ε Miller cycle.
| Scheme | Miller | ε | NOx | Soot |
|---|
| G12.4 | M50 | 12.4 | 27.1%↓ | 28.9%↓ |
| G13.4 | M50 | 13.4 | 28.8%↓ | 4.5%↑ |
| G14.4 | M50 | 14.4 | 36.6%↓ | 2.9%↑ |
| G15.4 | M50 | 15.4 | 40.5%↓ | 21.7%↓ |
When the geometric compression ratio is enhanced, on the one hand, the expansion ratio can be increased; on the other hand, the premixed heat release peak and the maximum combustion temperature aree reduced, which is beneficial for the reduction of NO
x due to the shorter high temperature period. Such NO
x reduction is obvious, especially in the G15.4 scheme. Thus it can be seen that the desired effect of suppressing the high local in-cylinder temperature during the combustion process has been achieved by enhancing the geometric compression ratio. The thermal efficiency is increased by enhancing the geometric compression Miller schemes, and the fuel economy also benefits. The NO
x decrease ability of the Miller cycle is weakened because of the rapid increase of the local temperature during the premixed combustion period. On the contrary, as there is restriction on the premixed heat release by enhancing the geometric compression ratio, the duration of the high temperature can be shortened effectively, so that the formation of NO
x can also be suppressed. As shown in
Table 4, based on the G12.4 scheme, the normalized NO
x emission is increased along with the auxiliary increase of the geometric compression ratio, and the goal of increasing the NO
x reduction ability of the Miller cycle is finally achieved. In the G15.4, the M50 scheme is combined with the high geometric compression ratio which is increased to 15.4, and NO
x is reduced by 40.5%. This improves the NO
x reduction ability of the Miller cycle by 14%, and the soot emissions is 21.7% lower than the base engine.
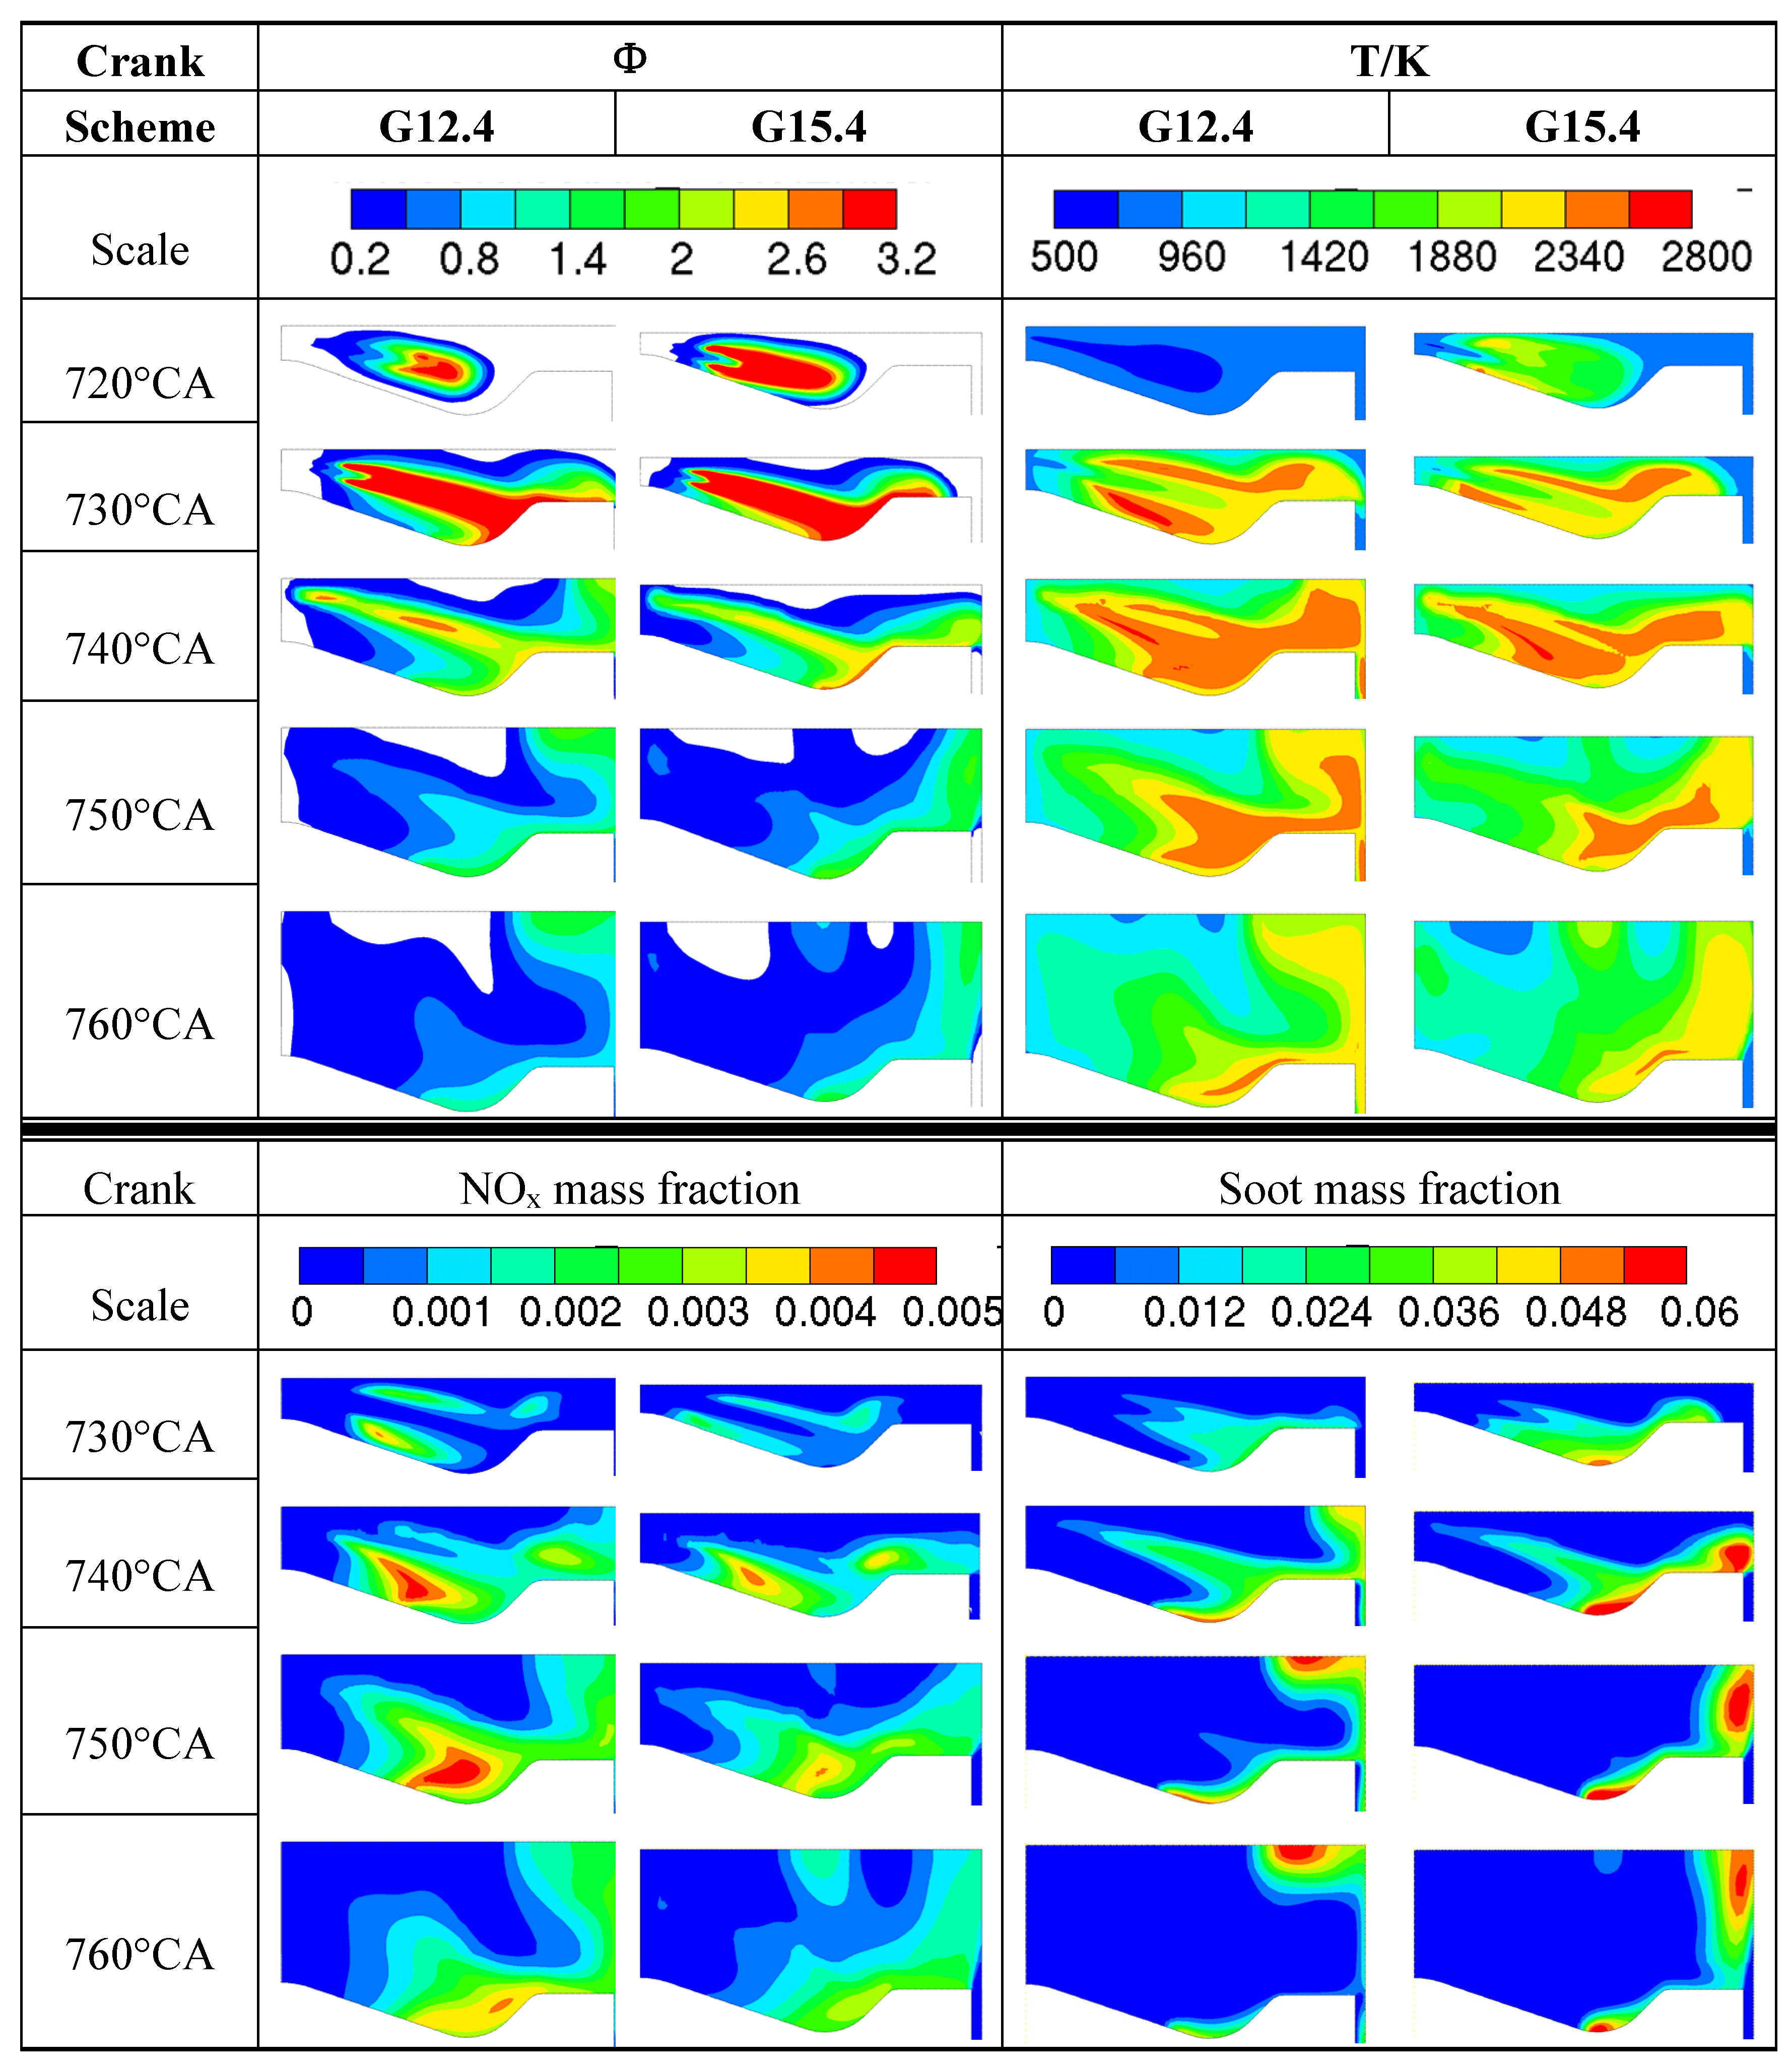
Figure 13 shows the contours comparison of φ, T, NO
x, and soot mass fraction between the G12.4 and G15.4 schemes. It can be seen that φ distribution is a little different between G0 and G15.4 because of the reduction of clearance, and the high soot region moves along with the high φ concentration at 740–760°CA. Since the ignition delay becomes shorter by increasing the geometric compression ratio, the combustion start point appears earlier in G15.4 than G12.4. In the temperature contour images at 720°CA, a temperature increase which reflects an earlier start of combustion can be observed in the G15.4 scheme, and the red temperature region is always smaller than G12.4 because of the reduction of the premixed combustion heat peak. The high combustion temperature and its duration time are both restrained by decreasing the over high premixed combustion heat peak, while the red NO
x region in G15.4 almost disappears.
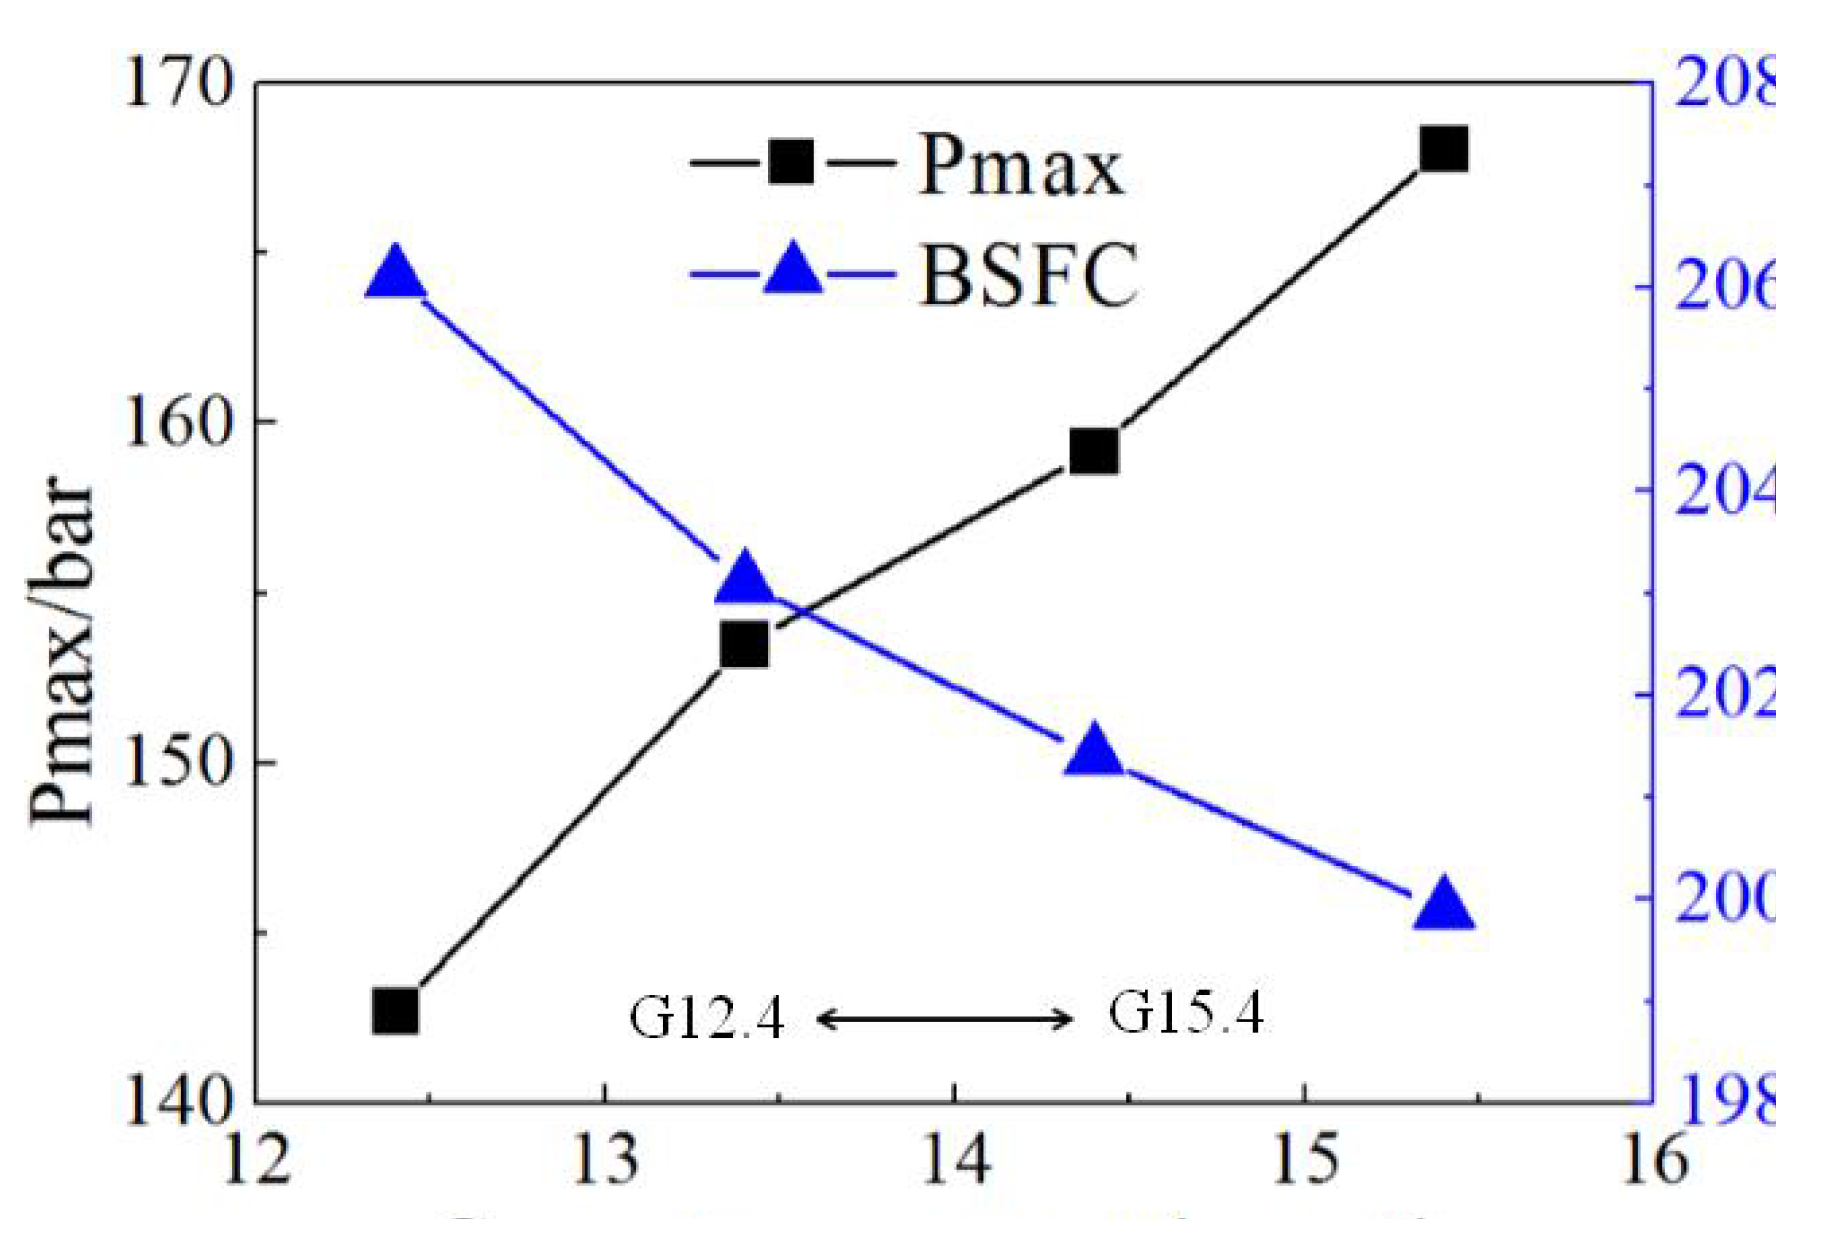
Figure 14 shows the effects of the Miller cycle combined with a high geometric compression ratio on the fuel economy and maximum cylinder pressure. The minimum BSFC is obtained in G15.4 in which the fuel consumption is 3.8% lower than the base engine. Further, it is consequent that the maximum cylinder pressure will increase with the enhancement of the geometric compression ratio, so that the mechanical load also increases. Therefore, based on the high geometric compression ratio Miller scheme, the injection time is retarded in the next stage of research, and if it is made sure that the maximum cylinder pressure reduces to the base engine level, the formation of NO
x can be also restrained further.
Figure 13.
Contour images comparison in Φ, T, NOx, and soot mass fraction between G12.4 and G15.4.
Figure 13.
Contour images comparison in Φ, T, NOx, and soot mass fraction between G12.4 and G15.4.
Figure 14.
Influence of high ε Miller cycle on maximum cylinder pressure and BSFC.
Figure 14.
Influence of high ε Miller cycle on maximum cylinder pressure and BSFC.
3.3. Effects of Injection Time
Delaying injection timing is one of the main methods to reduce NO
x, due to the fact that the combustion process transfers to the expansion stroke, resulting in lower combustion flames. Five schemes were simulated in this study, in which the injection time was advanced from −12°CA TDC to −4°CA TDC respectively, as shown in
Table 5. The output power was kept constant by adjusting the fuel mass.
Table 5.
High ε Miller cycle with different injection times.
Table 5.
High ε Miller cycle with different injection times.
| Scheme | Miller | ε | Injection /°CA TDC |
|---|
| I12 | M50 | 15.4 | −12 |
| I10 | M50 | 15.4 | −10 |
| I8 | M50 | 15.4 | −8 |
| I6 | M50 | 15.4 | −6 |
| I4 | M50 | 15.4 | −4 |
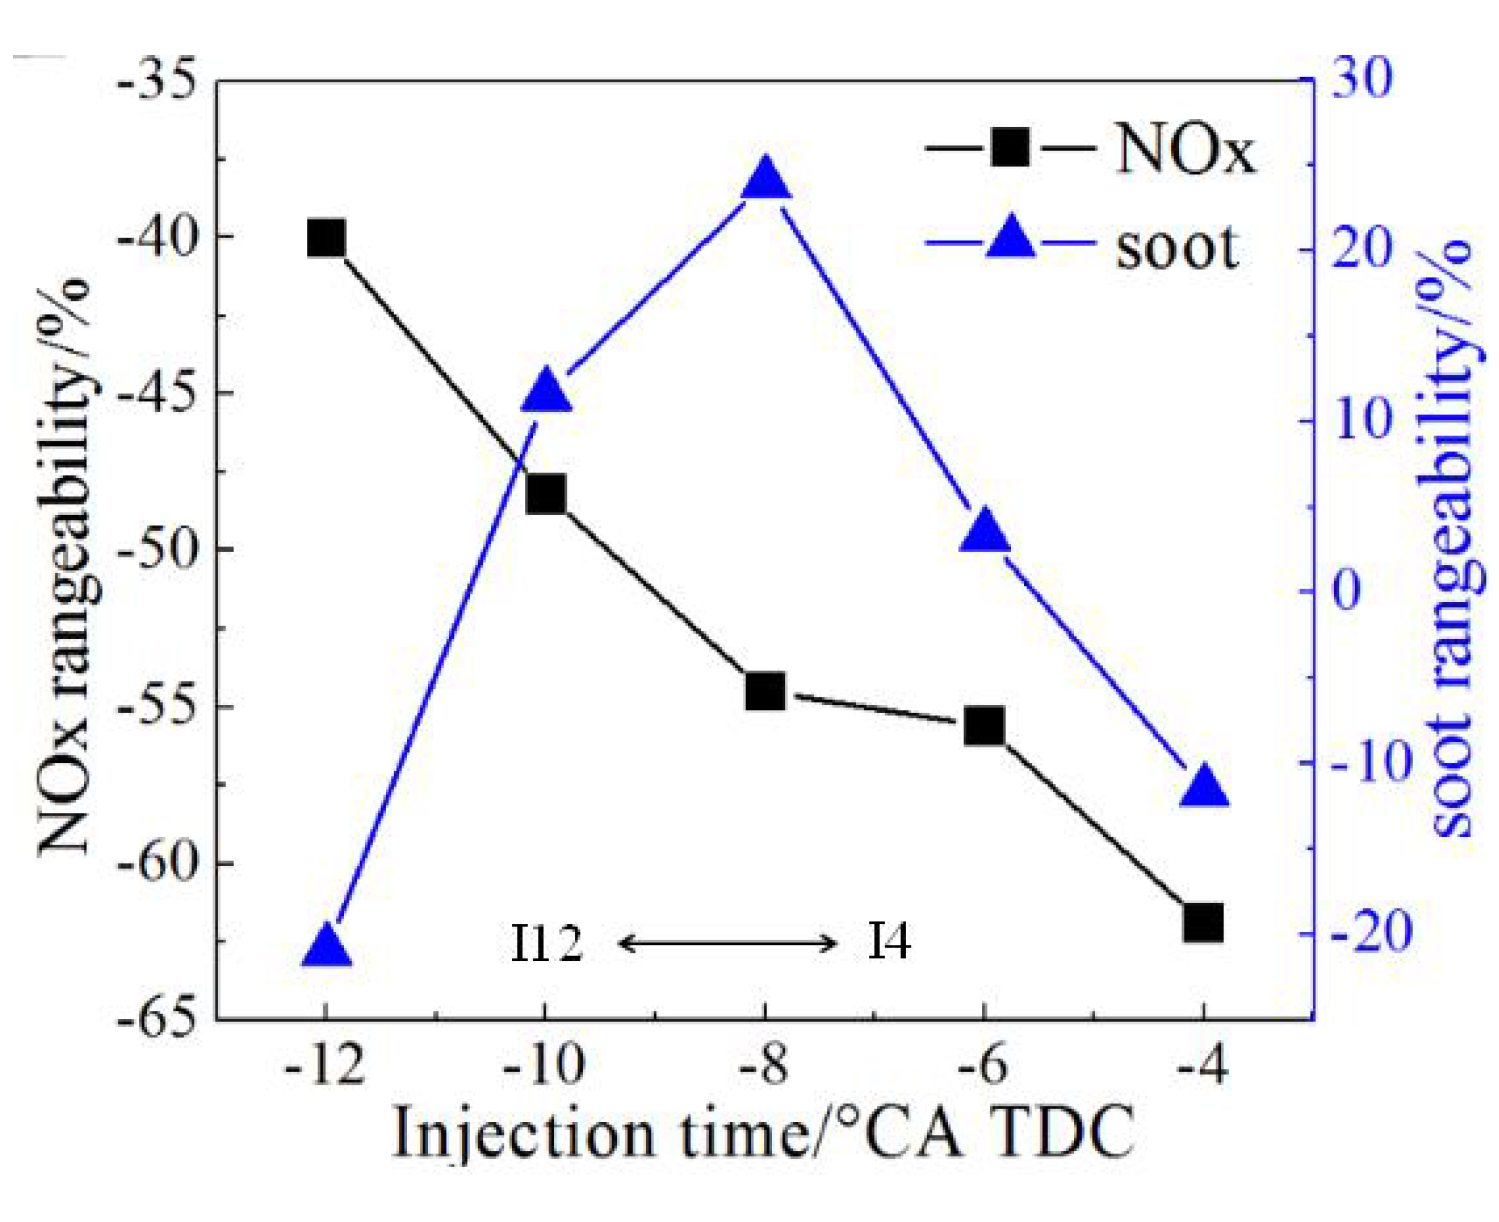
In
Figure 15, it can be seen that NO
x emissions are reduced along with the injection delay, but soot emissions increase firstly then decrease with the further injection delay. When the injection timing delays to −4°CA TDC, the NO
x can be reduced by 61.9%, but since the combustion start point appears after the TDC, the maximum cylinder pressure is much lower than the base engine, and the economy relapses back to the base engine level. In the I6 scheme, the NO
x is reduced by 55.6%, meanwhile, the maximum cylinder pressure is just 4.2% lower than the baseline engine, and the fuel economy is 1.8 g/kWh lower. Meanwhile, retarding injection reduces the combustion efficiency, but the influence is very little. It can be seen from the simulation result that the combustion efficiency of the I4 scheme is just 0.2% lower than the I12 scheme.
Figure 15.
Influence of injection time of high ε Miller cycle on NOx and soot.
Figure 15.
Influence of injection time of high ε Miller cycle on NOx and soot.
When the extreme Miller cycle is used, the turbocharger should be equipped with a higher pressure ratio, and the cost will increase correspondingly. Meanwhile, the temperature at the intake valve close time decreases drastically with the extreme Miller cycle, and more mixing gas is burnt during the premix combustion due to a longer ignition delay period. The large amount of heat released during premix combustion causes a dramatic increase in temperature, resulting in a large number of NOx emissions at this stage. Moreover, the overly low temperature at the compression end can cause misfire, and decrease the stability of the diesel engine in the low and medium load conditions; it also can lead to cold start problems. As a result, the combination of medium Miller cycle, high geometric compression ratio, and delaying injection timing is adopted to reduce NOx emissions by 50%–60% through taking into account the performance of the diesel engine in the full conditions, while both the power or the fuel economy can remain in the base engine level, and the mechanical load can be reduced to some extent.
3.4. Effects of EGR
In order to further reduce NO
x, high pressure loop cooled EGR is applied in the simulation, as shown in
Figure 4, and the output power is kept the same as the baseline engine. Based on the I6 scheme, in which NO
x emissions were reduced 55.3% lower than the base engine, five EGR schemes containing 10%–30% EGR rates were analyzed, as shown as
Table 6. The boost ratio of the turbocharger is kept constant in the simulation. With the increase of EGR rate, the O
2 concentration is decreased accordingly, the combustion rate is reduced, as well as the flame temperature. Since one of the key factors which decides the formation of NO
x is the high combustion temperature, the formation of NO
x emissions can be effectively suppressed by reducing the in-cylinder temperature. However,t the soot shows an increasing trend because of the reduction of O
2 concentration caused by EGR.
Table 6.
High ε Miller cycle with EGR (exhaust gas recirculation).
Table 6.
High ε Miller cycle with EGR (exhaust gas recirculation).
| Scheme | Miller | ε | EGR rate |
|---|
| E10 | M50 | 15.4 | 10% |
| E15 | M50 | 15.4 | 15% |
| E20 | M50 | 15.4 | 20% |
| E25 | M50 | 15.4 | 25% |
| E30 | M50 | 15.4 | 30% |
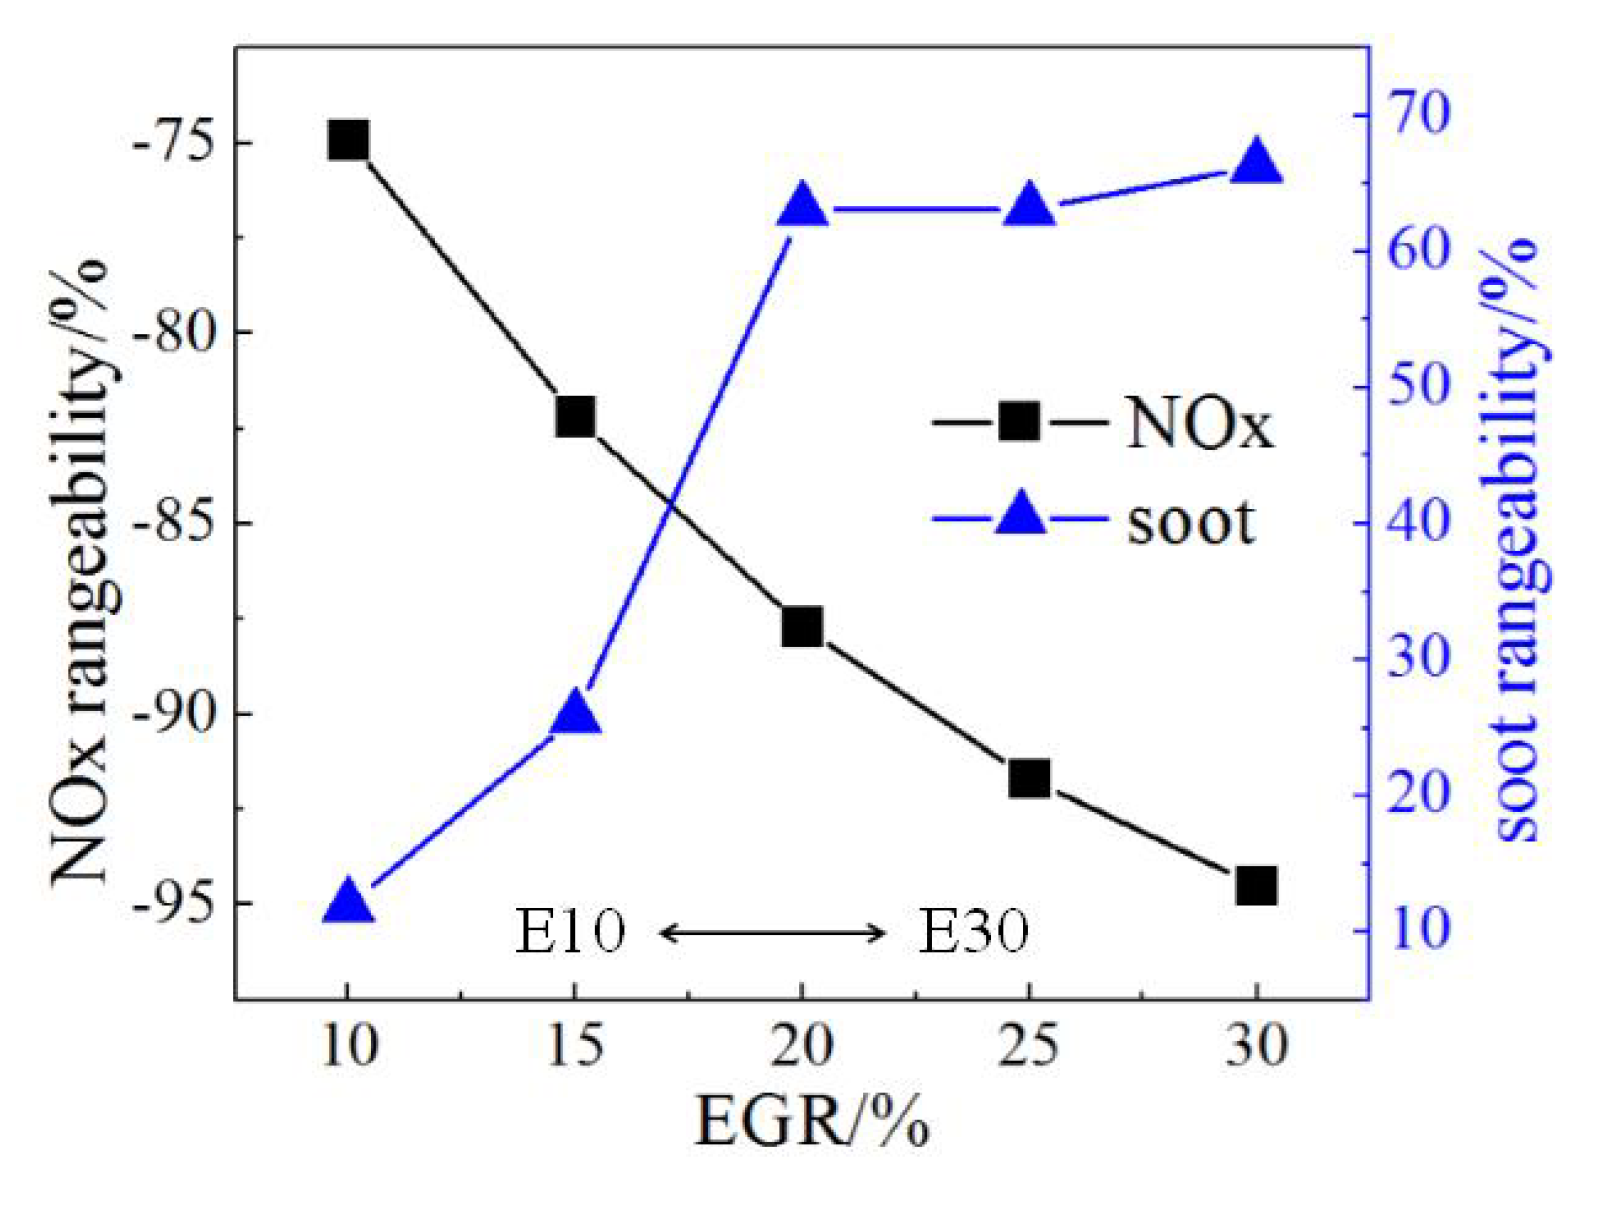
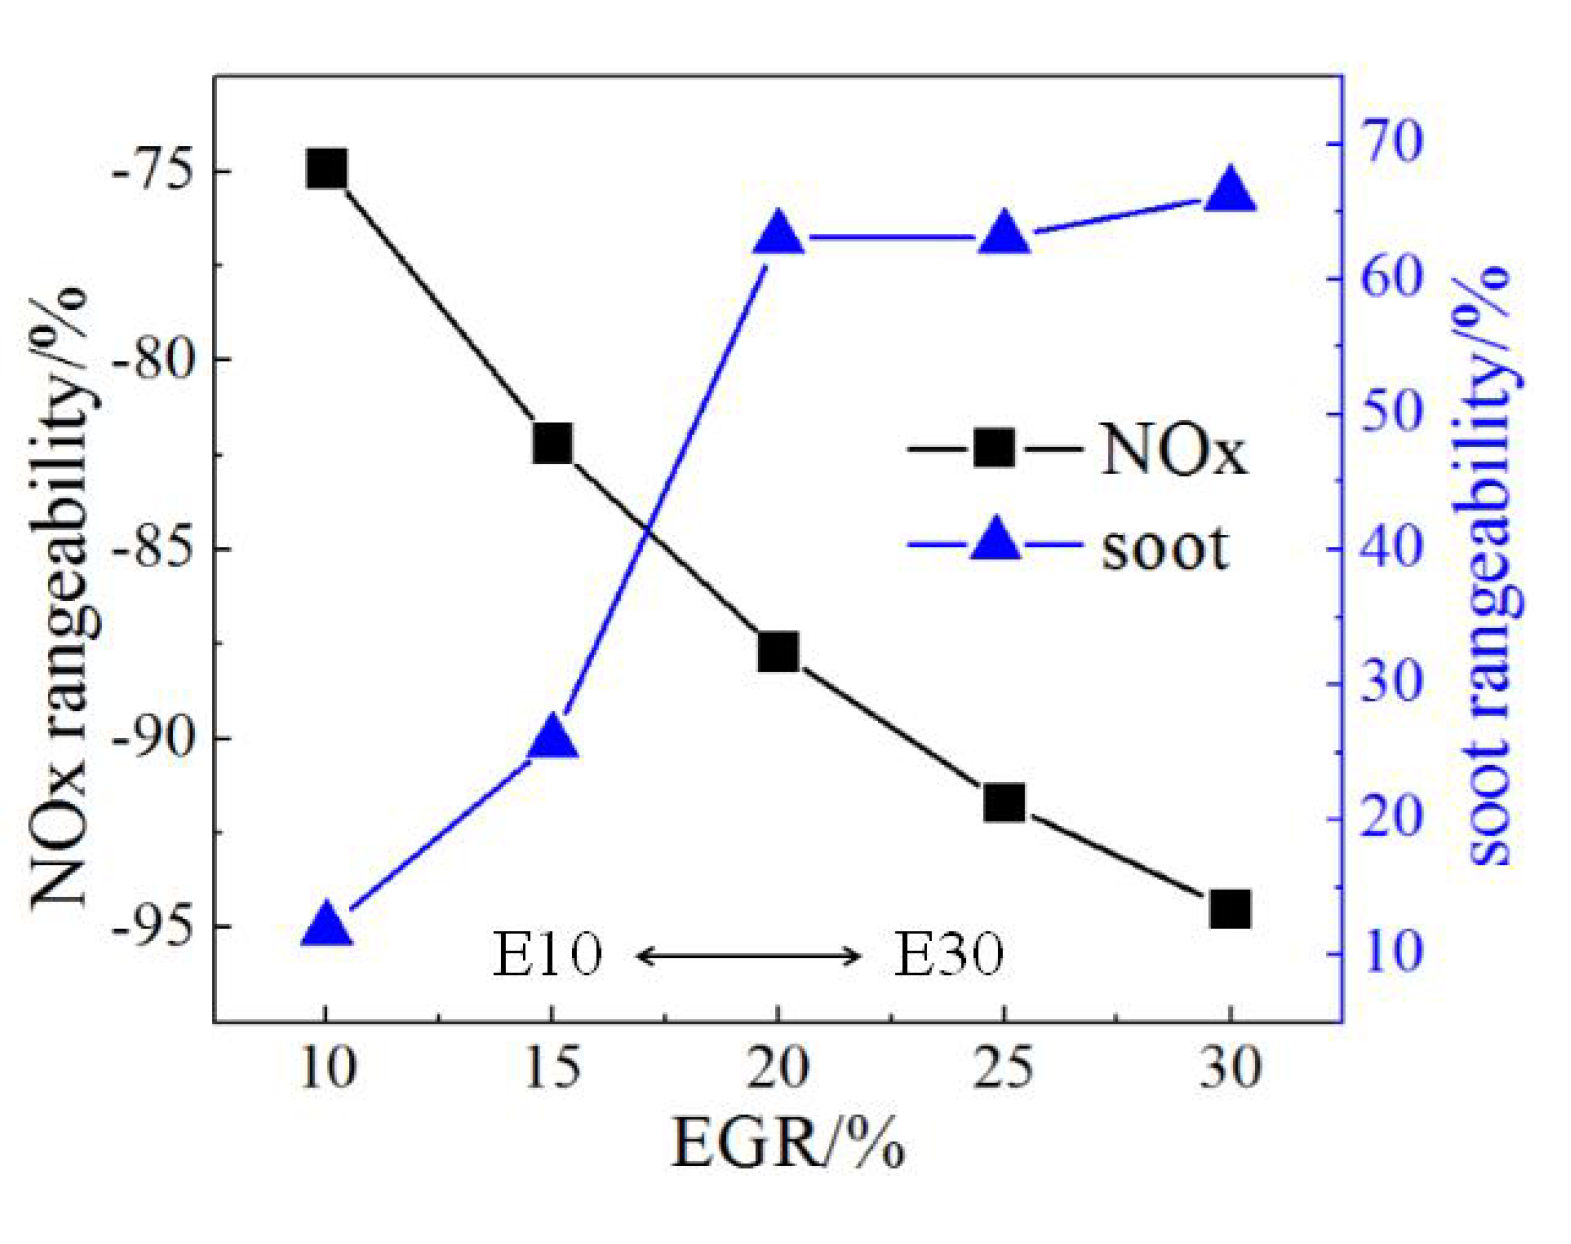
Figure 16 shows the effect of EGR on emissions with constant boost ratio. The results show that, the NO
x can be reduced by 80% of the base engine if more than 15% EGR is used, which will satisfy the Tier III regulation completely. On the other hand, the soot emissions increase substantially due to the reduction of O
2 concentration caused by EGR rate enhancement. This is the NO
x-soot tradeoff relationship in traditional diesel engine combustion. It can be seen from the figure that the soot emissions continue to increase during the process where the EGR rate increases from 10%–20%. In the E20-E30 schemes in which the EGR rate is over 20%, the amount of soot becomes stable, and the maximum rise is up to 66.3% higher than the base engine. Researches carried out show that reducing in-cylinder temperature can effectively restrain soot formation. Compared with that for the conventional diesel combustion, the number of particles of nucleation mode was increased under the LTC regime, while the mass was reduced [
28]. Resultant soot formation including inception and oxidation is reduced due to the in-cylinder combustion temperature decreasing when a large amount of EGR is applied. Although soot emissions can be controlled effectively, the fuel economy is sacrificed. Research data show that the fuel consumption is 3.4% higher when 30% EGR is applied. If even more EGR is adopted in order to further restrain the formation of soot, the combustion process deteriorates, and the fuel consumption will increase obviously. Furthermore, since the combustion rate slows down, the maximum cylinder pressure is also decreased accordingly, and the maximum cylinder pressure of E30 is 3.9 bar lower than E10.
Figure 16.
Influence of EGR on emissions at constant boost pressure.
Figure 16.
Influence of EGR on emissions at constant boost pressure.
A. Maiboom
et al. [
18] studied the effect of different EGR rates on combustion and emission characteristics on a direct injection diesel engine. The cooled EGR route, variable geometric turbocharger, and intercooler were used in the experiment. The boost pressure was adjusted to keep a constant air fuel ratio. The results show that NO
x is still decreased as the EGR rate increases. The main effect of EGR technology is to dilute the intake gas when boost pressure is kept constant, however soot emissions and fuel consumption increase at the same time. Further, if adjusting the boost pressure to obtain a constant air fuel ratio, the effect of EGR technology then mainly reflects on the temperature effect. Using this method NO
x and soot emissions can be restrained simultaneously, and fuel consumption does not increase.
Figure 17 shows the effect of EGR on NO
x and soot emissions in the constant air fuel ratio (2.1) condition which is obtained by adjusting the boost pressure. It can be seen that there is little effect on NO
x by enhancing the pressure ratio of turbocharging, but the soot emissions can be significantly reduced. The soot emissions are 11.4% lower than the base engine when 25% EGR is applied. If the EGR rate is increased to 30%, there is nearly 20% reduction of soot compared to the base engine, so NO
x and soot can be suppressed simultaneously. In this research the output power is kept the same as the baseline in order to judge the emissions at the same reference, so that the BMEP of different schemes was constant. Therefore, although the maximum cylinder pressure is different, the simulation result on IMEP has little change. However, the fuel injection quantity increases at the higher EGR rate. In addition, the fuel consumption, which can be improved by enhancing boost pressure, is just 2.7% higher than the baseline engine in the scheme where 30% EGR is applied, and such raised fuel consumption can be remedied by improving the fuel injection system. Meanwhile, enhancing the injection pressure is also a solution to further reduce soot.
Figure 17.
Influence of EGR on emissions at constant excess air ratio.
Figure 17.
Influence of EGR on emissions at constant excess air ratio.
4. Conclusions
In this research a 16V240 middle speed diesel engine was studied under the rating condition(1000 rpm, 3240 kW). The 1D&3D CFD simulations were both established to simulate the working performance and the in-cylinder combustion process respectively, and different Miller timing, geometric compression ratios, retarding injection, and EGR technology were analyzed. The conclusions are as follows:
(1) The in-cylinder temperature and pressure both decrease at the same crank angle with advanced intake valve close timing (Miller cycle), which cause NOx emissions to be reduced by as much as 27%.
(2) The expansion ratio is increased, and the ignition delay period is shortened when enhancing the geometric compression ratio, and NOx emissions can be further reduced; there is a 50%–60% reduction of NOx when using the Miller cycle combined with high geometric compression ratio and delay injection with the same power and fuel economy of the baseline engine, However the mechanical load is slightly reduced. Moreover, NOx emission can be reduced more than 80% when over 15% EGR is applied at a constant boost pressure ratio condition. It can satisfy the Tier III regulation, but soot emission and BSFC are increased.
(3) By keeping the excess air coefficient constant, NOx can be reduced by over 80% when a medium Miller cycle and over 15% EGR is applied, and soot decreases with the boost pressure ratio increase. Soot emissions are nearly 20% lower than the baseline engine, and BSFC is also improved. The optimized scheme (M50, 30%EGR, ε = 15.4, Injection timing = −6°CA TDC) results in an 80% reduction of NOx, 20% reduction of soot emission,but there is a 2.7% increase of BSFC.
(4) The NOx and soot emissions can be reduced simultaneously when medium Miller cycle and medium rate EGR technology are applied in the diesel engine. Therefore it is a possible way to meet the IMO Tier III regulations completely. Moreover, compared with the extreme Miller cycle and the high rate EGR technology, this technical route need not be combined with an over high boost ratio, and the economy cost of the diesel engine can be reduced; it also reduces the difficulties of implementation of EGR technology in supercharging diesel engines.


