Article

The Effects of Envelope Design Alternatives on the Energy Consumption of Residential Houses in Indonesia

1
Department of Civil Engineering, National Cheng Kung University, Taiwan/1, University Road, Tainan 701, Taiwan
2
Department of Architecture, National Cheng Kung University, Taiwan/1, University Road, Tainan 701, Taiwan
*
Author to whom correspondence should be addressed.
Energies 2015, 8(4), 2788-2802; https://doi.org/10.3390/en8042788
Submission received: 1 November 2014 / Revised: 4 March 2015 / Accepted: 3 April 2015 / Published: 13 April 2015
(This article belongs to the Special Issue Energy Conservation in Infrastructures)

Abstract

:
As an emerging country and one of the most populous countries in the world, Indonesia requires a sufficient energy supply to ensure the nation’s continued development. In response to this increasing energy demand, various studies have proposed energy-saving measures; building envelope design is considered to be a typical energy-saving technique. A significant goal in achieving greener buildings is learning how to reduce a building’s energy consumption by applying an efficient energy-saving design. This study used the eQUEST software to investigate how different types of roof construction, glazing and sun-shading techniques affect the energy consumption of residential structures in Indonesia in common scenarios. The results indicate that window shading has the most significant impact on a building’s overall energy consumption, followed by the use of an appropriate glazing, whereas the roof type produced smaller energy efficiency benefits.

1. Introduction

Indonesia is an archipelago consisting of an estimated 17,508 islands. With over 238 million people, Indonesia is the world’s fourth most populous country. This means that the urban population in Indonesia is extremely large and rapidly increasing. Indonesia’s large population growth has caused an even faster increase in demand for energy. From 1980 to 2010, total primary energy production increased by 2.8 fold, whereas energy consumption grew by nearly five-fold [1]. In 2010, approximately 96% of the national energy mix was dominated by fossil fuels. Renewable energy sources, namely, hydropower and geothermal energy, amounted to less than 4% of the country’s energy portfolio. The total energy demand in 2025 is predicted to be nearly three times higher than 2010 levels. The natural depletion of non-renewable resources, particularly oil, and their replacement must be addressed. Indonesian Government Regulation No. 5/2006 attempts to address this situation by aiming at the following energy mix by 2025: oil <20%, gas 30%, coal 33%, and renewable resources >17%, including bio-fuel (5%), geothermal energy (5%), biomass, nuclear power, hydropower, solar energy (5%) and coal liquefaction (2%). However, changing conditions since 2006 have caused this target to be amended. A balanced use of non-renewable and renewable energy resources is crucial to ensure a sufficient energy supply in 2025. Various challenges, such as increasing the availability of renewable energy resources, establishing energy supply grids under difficult transport conditions and increasing the development of renewable energy sources, can only be managed by establishing a clear and comprehensive energy policy strategy and framework based on an appropriate energy mix [2].
The Directorate General of New Renewable Energy and Energy Conservation, Ministry of Energy and Mineral Resources [3], stated that in recent years, energy consumption in Indonesia has increased 7% per year. Meanwhile, the world’s energy consumption has only increased by 2.6% per year. This substantial increase in consumption has led to various problems and imbalances, namely, the hastened depletion of fossil resources, such as oil, gas and coal, when compared to the discovery of new reserves.
In general, Indonesia’s energy consumption is divided among the industrial (50%), transportation (34%), residential (12%) and commercial (4%) sectors. In addition, according to the government’s projection, the residential sector will garner a 59% share of the total electricity consumption, whereas the commercial, industry and public sectors will constitute 22%, 12% and 7% of the electricity demands, respectively [4]. In response to this increasing energy demand by buildings, various studies have proposed energy-saving measures, such as renewable energy plans and effective load management. A significant goal in achieving greener buildings is learning how to reduce a building’s energy consumption by applying an efficient energy-saving design [5,6,7,8].
The energy consumption of a building is affected by many factors, including the number of occupants, the orientation of the building, the number of electrical appliances used, the air conditioner’s performance, the window materials, shading, and the type of building materials used for the roof and walls [9]. The best energy-saving approaches typically involve the exterior of a building, namely, the use of building materials with a lower heat transfer coefficient, having fewer openings and the use of energy-saving glass. Many effective analysis tools and simulation software packages, such as DOE2, eQUEST, and EnergyPlus, are utilized to effectively analyze and manage a building’s energy consumption.
Among the available analysis tools and simulation software packages, EnergyPlus and eQUEST were developed based on DOE2. Chirarattananon and Taweekun [10] used DOE2 to analyze the energy consumption of commercial buildings and government buildings in Thailand. The power consumption of various types of commercial buildings, including offices, hotels, hospitals, department stores and government buildings, was divided into three different categories according to the roof and floor area of the buildings. Compared to DOE2, software with friendlier user interfaces has emerged in recent years. Medrano et al. [11] installed a distributed generation system in four types of commercial buildings in California and applied eQUEST to conduct a simulation-based analysis. The variables in the analysis included the shading design for windows, lighting control, HVAC efficiency enhancement and cooling capacity enhancement. The results showed that the range of savings for commercial buildings can reach 5%–20%. Yu et al. [12] also used eQUEST to design the exteriors of residential buildings in China. The annual energy consumption based on different energy-saving designs was simulated. The best performances were found with the use of better wall insulation and window shading, which resulted in decreases in in the energy consumption of air conditioners of 11.55% and 11.31%, respectively. Many studies have confirmed the accuracy of the results of the simulations provided by the software [13,14].
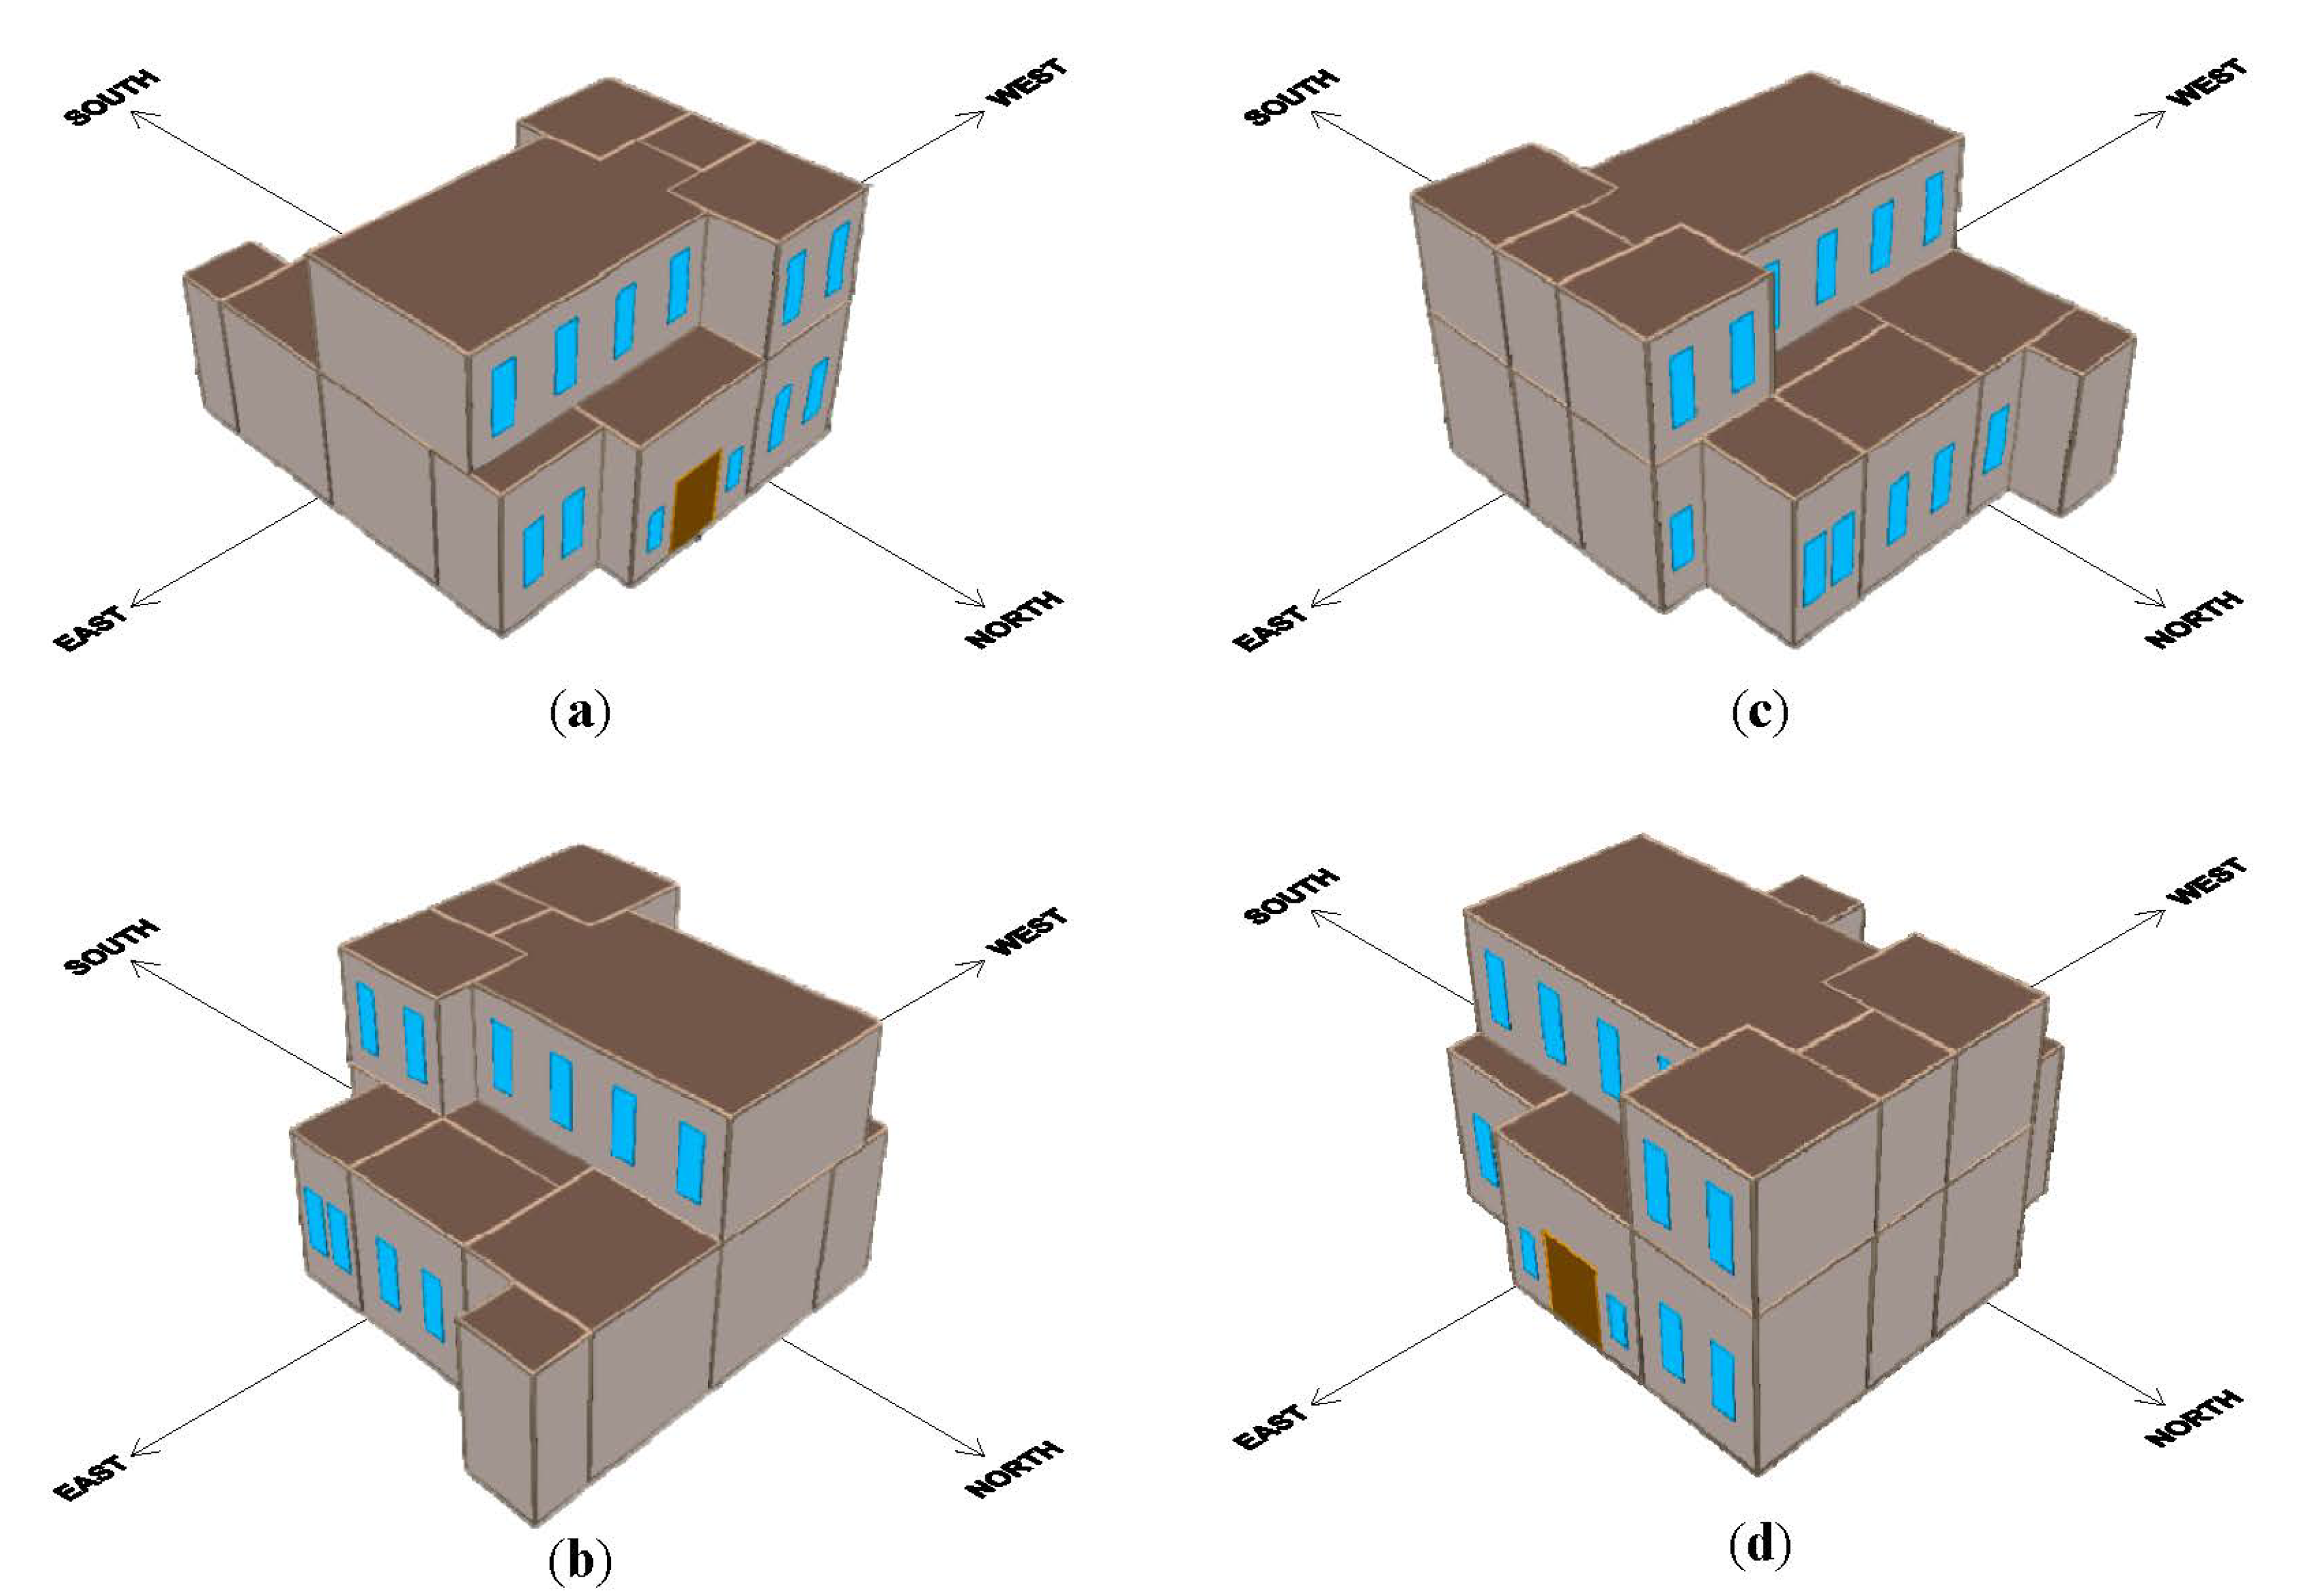
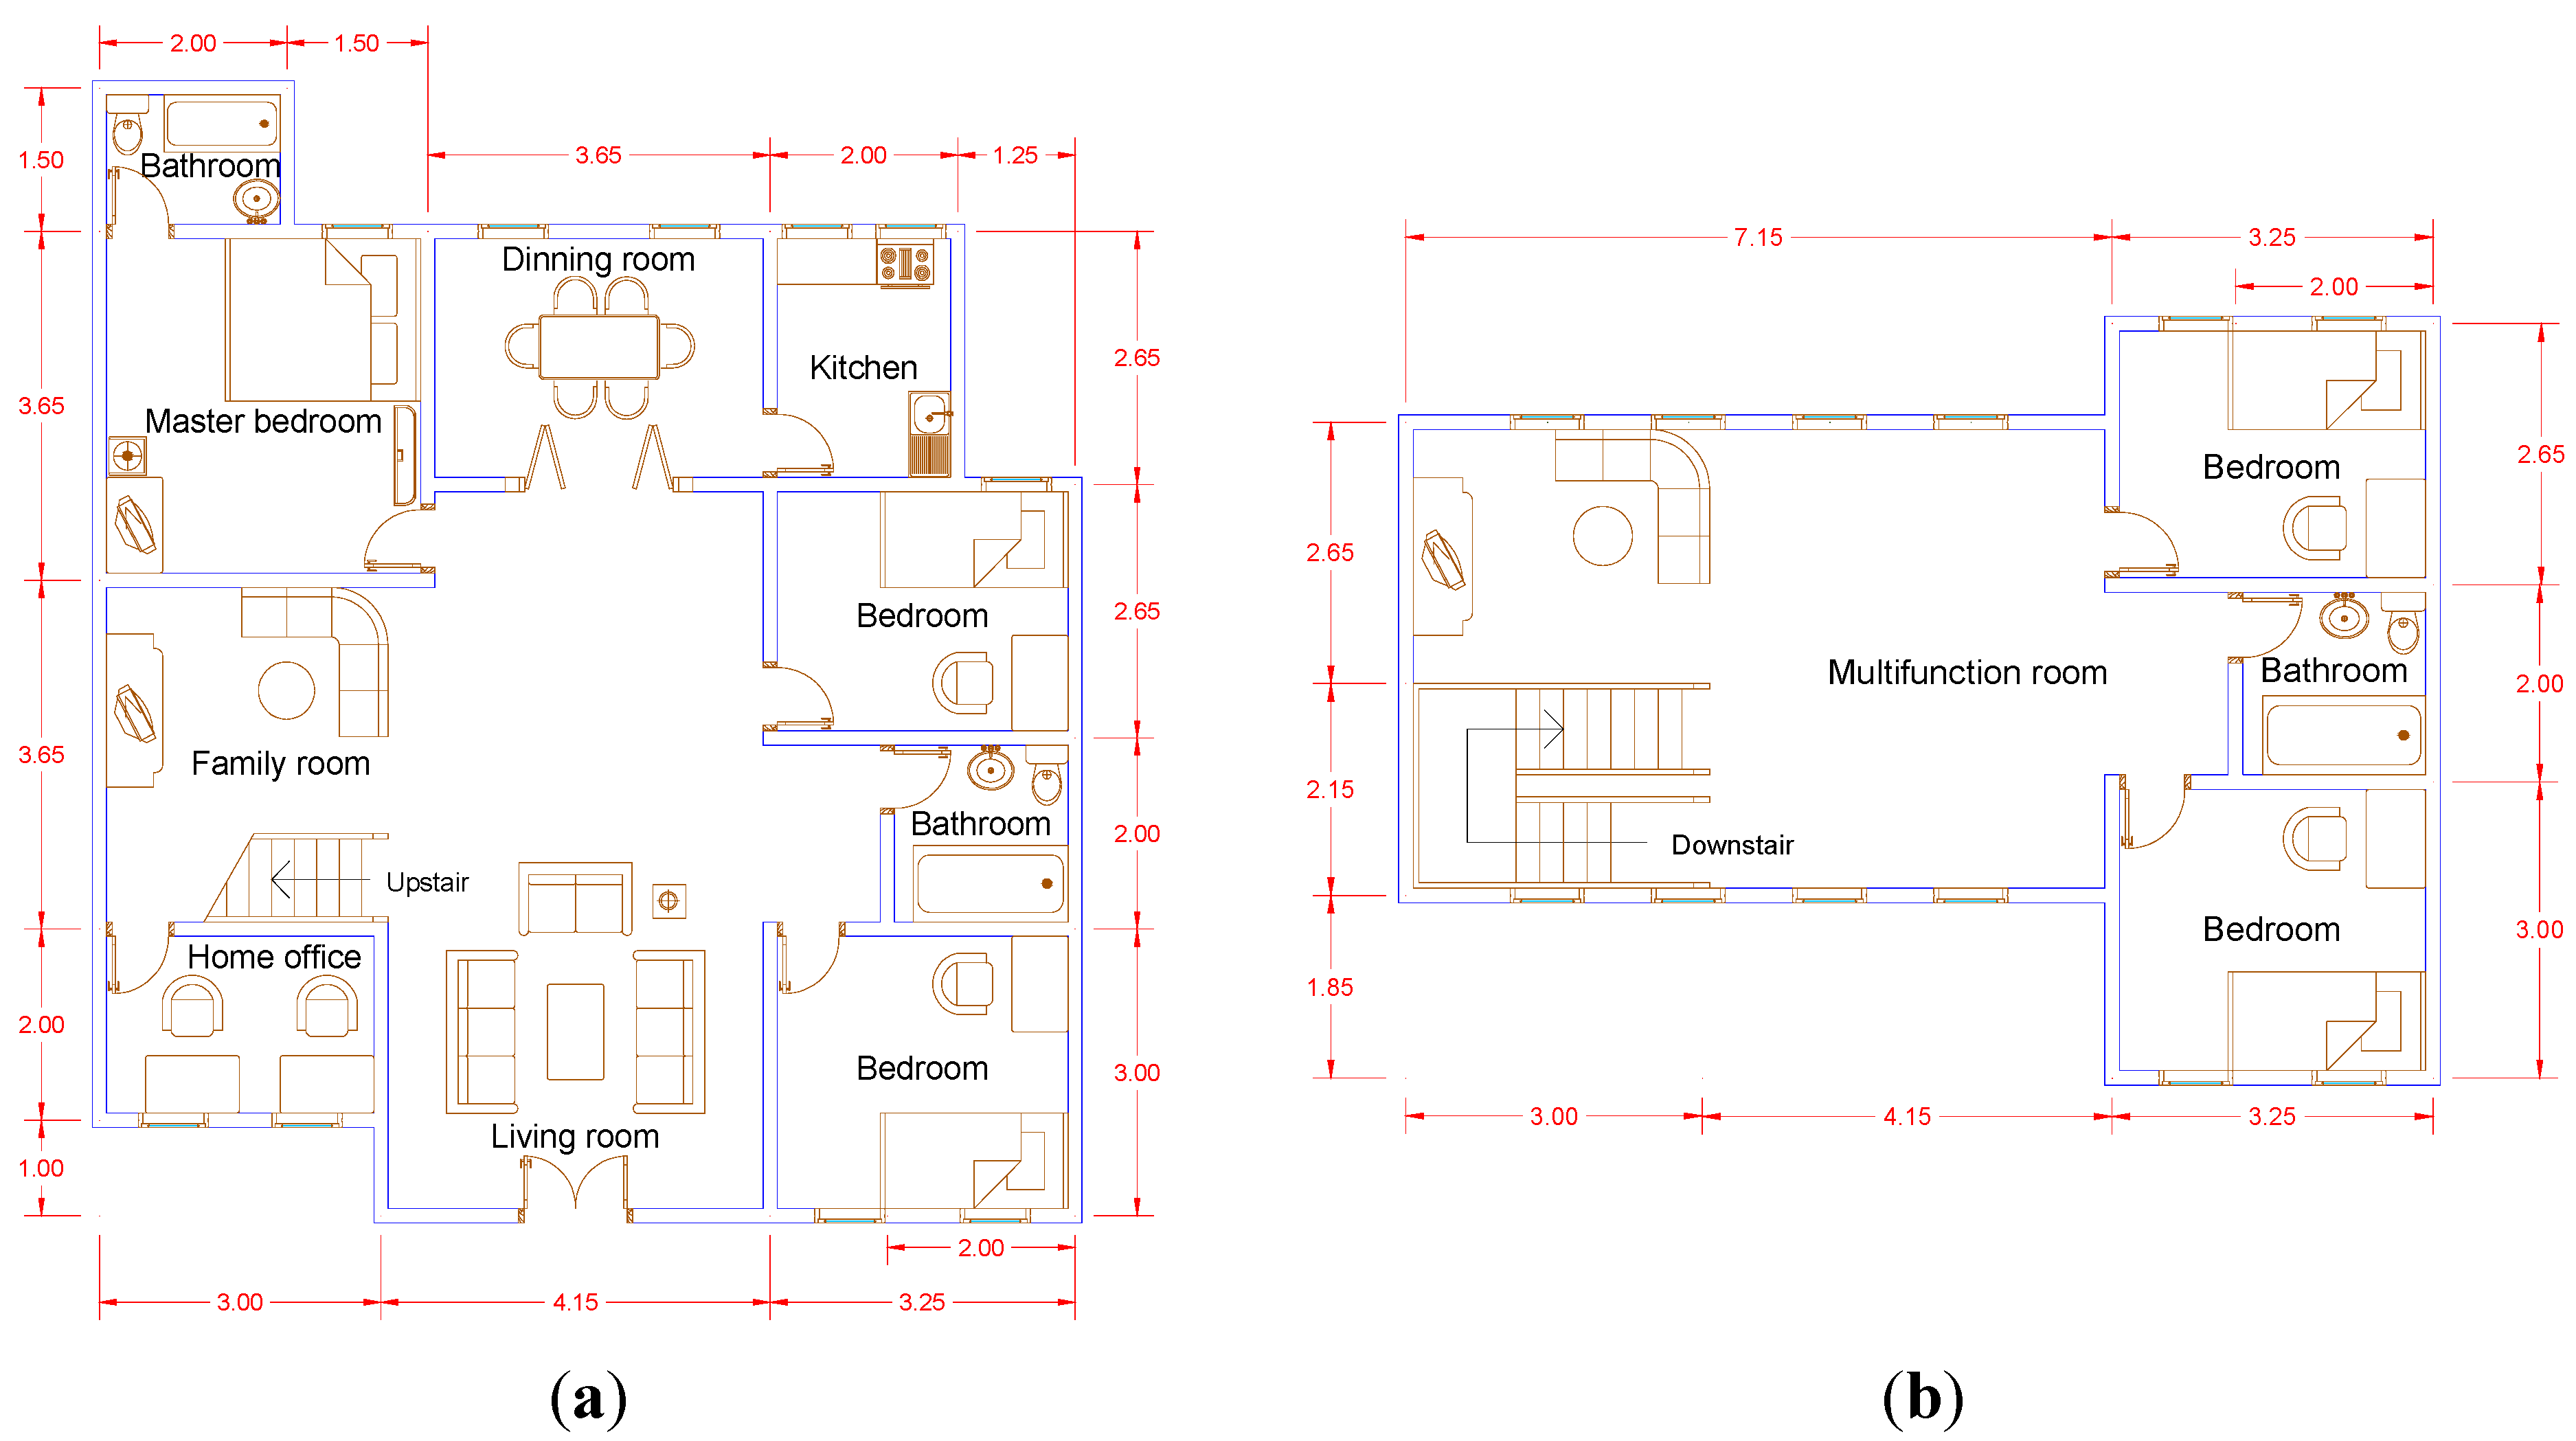
Limited research results are available regarding important aspects of the energy-saving design of the building envelope in Indonesia. Therefore, this study used the eQUEST software to investigate how different types of roof construction, glazing and sunshield types affect energy consumption in residential buildings in common scenarios.

2. Research Method

The QUick Energy Simulation Tool (eQUEST) is a sophisticated yet easy-to-use building energy use analysis tool that provides professional-level results with an affordable level of effort. Please see http://www.doe2.com for documentation [14]. In this paper, eQUEST version 3.65 was adopted as an analysis tool to investigate how different types of roof construction, windows and sunshield types affect energy consumption in residential buildings. The model development and validation are described in [5].

2.1. Study Objective

One unit within a city block, composed of attached residential buildings, was chosen as the simulation target. The unit has two floors and is located in Jakarta, the capital city of Indonesia. The height of the first floor is 4 m, and that of the second floor is 3 m. The building areas of the first and second floors are 103.81 and 59.18 m2, respectively. This study performed an analysis using the eQUEST software to model a building in a three-dimensional model. The output of this analysis is a measure of the amount of energy consumed by buildings in different scenarios and using different design alternatives. This study also focuses on a comparison between related design alternatives to determine an optimal design in terms of reducing energy consumption in residential structures. The building plans of the main simulation target are shown in Figure 1.
Figure 1. Floor plans of the main simulation target (not to scale) (unit: m). (a) First floor plans; (b) second floor plans
Energies 08 02788 g001

2.2. Building Materials of the Baseline Building

In general, residential structures in Indonesia are commonly composed of reinforced concrete (RC) structures. Although steel structures are increasingly used, they are still mainly used only for high-rise buildings in Indonesia [15]. Therefore, the structural material of the residential building set in this research is mainly RC.

2.2.1. Wall Construction

A wall is a structure that defines an area, carries a load, or provides shelter or security. Most of the residential building walls in Indonesia are brick-wall structures, which will be used as the baseline building in this research. Table 1 presents detailed illustrations and thermal properties of the external wall.
Table 1. Detail of the exterior brick wall and thermal properties of each layer of material [5].
IllustrationDetailed ConstructionThermal Conductivity (W/m·K)Thickness (cm)R-Value (m2·K/W)U-Value (W/m2·K)
Energies 08 02788 i001Outdoor convection23.00-0.043.05
Cement mortar1.501.50.01
Bricks0.9815.00.25
Cement mortar1.501.50.01
Indoor convection9.00-0.11

2.2.2. Roof Construction

Common types of roofing for residential buildings in Indonesia are RC flat-roof and clay roof tile. In this case, the type of roof that is used as a baseline model is a RC flat-roof structure (see Table 2 for its thermal properties).
Table 2. Detail of the flat-roof RC and thermal properties of each layer of material [5].
IllustrationDetailed ConstructionThermal Conductivity (W/m·K)Thickness (cm)R-Value (m2·K/W)U-Value (W/m2·K)
Energies 08 02788 i002Outdoor convection23.00-0.042.83
Waterproof layer0.050.20.04
Cement mortar1.501.50.01
Reinforced concrete1.4015.00.11
Cement mortar1.501.50.01
Indoor convection7.00-0.14

2.2.3. Glazing

The glazing is assumed to be a clear glass with a thickness of 3 mm, a thermal transmittance (U-value) of 5.9 W/m2·K, a shading coefficient (SC) of 0.86, and a visible light transmittance (VT) of 0.9.

2.3. Design Alternatives under Investigation

There are many factors that affect a residential building’s energy demand, ranging from the indoor lifestyle of the residents to the type of exterior building materials used. This research explored how the roof structure, glazing, and sunshield design affect the energy consumption of buildings facing east. The analyzed design alternatives are shown in Table 3.
Table 3. Design alternatives under investigation.
LocationBaselineDesign Alternatives
RoofRC flat-roofClay roof tile, modified RC flat-roof
Glazing3-mm clear glassReflective glassSingle-layer, low-E glassDouble-layer, low-E glass
SunshieldNoneHorizontal shadingVertical shadingBox shading

2.3.1. Roof Constructions

Energy-efficient roofing materials can reduce household energy demands and decrease greenhouse gas emissions [16]. A sloped-roof structure is selected as a design alternative. The construction of the sloped roof consists of a standard wood frame with clay tile as the exterior finish. In addition, the RC flat roof was also modified in the analysis of the model (the layers of the RC flat-roof that are modified are shown in Table 4).
Table 4. Thermal properties of the modified RC flat roof.
IllustrationDetailed ConstructionThermal Conductivity (W/m·K)Thickness (cm)R-Value (m2·K/W)U-Value (W/m2·K)
Energies 08 02788 i003Outdoor Convection--0.0431.14
Insulation bricks1.503.500.023
Styrofoam0.042.000.500
Waterproof layer0.050.200.040
Cement mortar1.501.500.010
Reinforced Concrete1.4015.000.107
Cement mortar1.501.500.010
Indoor Convection--0.143

2.3.2. Glazing

Glazing is an energy-saving option that affects the energy efficiency of a building. The type of glazing can affect heat losses, and the proper selection of glass types can increase the energy efficiency of a home [17]. In this research, three types of glazing are used to investigate the influence on the building’s energy consumption namely, reflective glass, single-layer low-E glass, and double-layer low-E glass. Table 5 presents the thermal properties of the glazing alternatives considered in this study.
Table 5. Thermal properties of the glazing alternatives.
Alternative glazingThermal transmittance (w/m2 k)Shading coefficient (SC)Visible light transmittance (VT)
Reflective glass: 6.38-mm, green PVB laminated5.80.460.28
Single-layer low-E glass: 6-mm gray glass4.10.500.34
Two-layer low-E glass: 6-mm green glass/12 mm argon gas filled/6-mm clear glass1.60.390.55

2.3.3. Sun shielding

Shading design is an important alternative for enhancing the energy performance of a building. Both interior and exterior shading options can be used to protect glazing that is not directly exposed to sunlight. Shading devices, including horizontal shading (with overhangs only), vertical shading (with fins only) and integrative/box shading (with overhangs and fins), placed outside windows are simply referred to as exterior shading [18]. In general, exterior shading devices are superior to indoor shading designs [19]. Hence, external shading is used to investigate the energy consumption of the residential structure. The properties of the sunshield (exterior shading) used in this study are provided in Table 6.
Table 6. Properties of the exterior shading used in this study.
Shading typeOverhangs (m)Fins (m)
Horizontal shading0.3, 0.6, 0.9-
Vertical shading-0.3, 0.6, 0.9
Box shading0.30.3, 0.6, 0.9
0.60.3, 0.6, 0.9
0.90.3, 0.6, 0.9

2.4. Other Parameters

In addition to the building construction (wall construction, roof construction, glazing material, and sunshield devices), the number of residents, lighting power density, equipment power, occupancy and air conditioning system are variables that affect the building’s energy consumption and must thus be considered in the simulation.

2.4.1. Determining the Number of Residents

According to Indonesian Statistics, the average number of members in each residence in Indonesia is 3.9–4.0 [20]. Hence, the number of members in each residence is set to four.

2.4.2. Electrical Appliances

In this study, the electrical appliances are limited due to difficulties involved in listing all electrical appliances because each residence has different living conditions and needs. Thus, only necessary and frequently used appliances were considered (see Table 7).
Table 7. Electricity consumption values assumed for household appliances.
SpacePower consumed (W)Illumination density (W/m2)
Living RoomTelevision: 3007.16
Dining RoomCooker: 600, Blender: 3008.27
KitchenRefrigerator: 6007.55
OfficeComputer: 250, Printer: 756.67
Master BedroomTelevision: 300, Laptop: 756.26
BedroomLaptop: 754.36
RestroomNone4.29

2.4.3. Occupation Period

The typical occupation periods in the target building are shown in Figure 2.
Figure 2. Daily occupation period of building (00:00–23:00) (colored indicates that the house is occupied).
Energies 08 02788 g002

2.4.4. Air Conditioner Capacities and Operating Period

Air conditioners can be classified as window type, wall/split type, packaged type, or central type. Wall/split air conditioners are the most common type of air conditioner used for residential structures in Indonesia. This type of air conditioner includes an indoor and outdoor unit or one outdoor unit combined with multiple indoor units. The cooling capacity of the air conditioner that is used in this simulation is 2.64 kW. The operating periods were based on the assumed time periods shown in Figure 2. The system automatically activated when the temperature was higher than 28 °C and within the indicated time periods; the room temperature was maintained at 25 °C once activated. The energy efficiency ratio (EER) of the air conditioners was set at 3.14 (W·h/W·h) for the simulation. The technical specifications of the air conditioning unit are shown in Table 8.
Table 8. Technical specifications of the air conditioners used in the simulation.
Specification itemValue
Cooling Capacity (kW)2.64
EER (W h/W h)3.14
Power Input (kW)1.465
Air Flow rate (Indoor Unit): max. CFM (m3/min)6.5 (230)
Air Circulation (Outdoor Unit): max. CFM (m3/min)20 (706)

3. Results and Discussion

3.1. Building Orientation Effect and Baseline Results

The model building was analyzed for four different orientations: north, west, south, and east (see Figure 3). The results show that the building orientations produce different electricity consumption results. The simulation results shown in Figure 4 illustrate that the building facing the west had the largest energy consumption density, whereas the building facing the south was the most energy efficient. Therefore, the west-facing building was used as the target in the following simulations, in which the various building envelope alternatives were investigated. Then, a performance comparison with the baseline case was performed. The simulation results for the baseline case are shown in Figure 5. Only two months (January and February) were observed to have slightly lower energy consumptions, and the energy consumption of the remaining months were similar. The main source of electricity consumption originated from the air conditioners, which accounted for at least 67% of the total consumption.
Figure 3. Investigated orientation of the model building: facing (a) north; (b) west; (c) south; and (d) east.
Energies 08 02788 g003
Figure 4. Comparison of the annual energy consumption densities for different building orientations.
Energies 08 02788 g004
Figure 5. Monthly and HVAC energy consumption of the baseline case (facing west).
Energies 08 02788 g005

3.2. Roof Construction Effect

The effects of installing a sloped roof or a modified roof on the building’s energy consumption were examined and are shown in Figure 6. The results show that the sloped-roofed building consumed more energy than did the RC flat-roofed building (baseline model). This demonstrated that a sloped roof was not better than a baseline roof. In another case, the modified-roofed building consumed less energy than did the baseline model. The use of a sloped roof results in a 117.1 kWh increase in energy consumption compared to that of the baseline roof, whereas the modified roof saves approximately 75.8 kWh of energy. Therefore, the modified roof performs better than the sloped roof and baseline roof.
Figure 6. Comparison of the annual energy consumption densities for different roof types.
Energies 08 02788 g006

3.3. Glazing Effect

The glazed area covers 70%–80% of an entire window; therefore, the glazing includes a heat conduction coefficient and solar heat gain coefficient (SHGC) that greatly influence the building’s energy consumption.
The results showed that the double-layer low-E glass exhibits the best efficiency in terms of energy savings, with an annual energy consumption decrease of 3165.5 kWh. This energy reduction was greater than that of the roof alternative, where the modified roof only produces a decrease of 75.8 kWh of the total annual energy consumption. A comparison of the simulation results for the energy consumption for the various types of glazing is shown in Figure 7. The energy efficiencies using either reflective glass or low-E glass were better than that of the baseline case because of the lower U-value and shading coefficient (SC). When comparing the reflective glass and single-layer low-E glass, the two samples used in this study exhibited only a slight difference in energy efficiency. Reflective glass reduced the energy consumption by 3092.2 kWh, whereas single-layer low-E glass reduced the energy consumption by 2893.9 kWh. The double-glazed window can decrease the heat conduction coefficient and reduce the energy consumption to a greater degree than can a single-glazed window. The low-E glazing and reflective glazing can strengthen the reflection of solar radiation, thus greatly decreasing the annual energy consumption.
Figure 7. Comparison of the annual energy consumption densities for different types of glazing.
Energies 08 02788 g007

3.4. Sun Shading Effect

The effects of window exterior shading on annual energy consumption are shown in Figure 8. The results showed that box shading resulted in the greatest energy efficiency among the three shading techniques.
Figure 8. Comparison of the annual energy consumption densities between the baseline and various shading designs.
Energies 08 02788 g008
The annual energy savings obtained from using a box shading device compared with the baseline case was approximately 2776–5482.5 kWh. Shading using only horizontal shields could also save 850.6–1757.9 kWh of electricity, whereas 2284.0–4209.2 kWh of electricity was saved when using only the vertical shading. Overall, the energy efficiency performance of the various types of exterior shading can be compared listed in the following order: box shading > horizontal shading > vertical shading.

3.5. Comparison of Roof Construction, Glazing and Sun Shading Effects

A comparison of the annual electricity consumption and HVAC electric consumption among the various design alternatives is shown in Table 9. The size of the sunshields was set to 0.9 m for the comparison. For residential buildings in Indonesia, the results showed that the buildings that used a 0.9 m × 0.9 m box shading resulted in the highest energy efficiency, whereas buildings with roofs that underwent retrofitting measures obtained a limited improvement in terms of energy efficiency. Overall, the retrofitting measures implemented on the external sunshields had the greatest influence on energy efficiency and occasionally even exhibited a better performance than did the installation of glass. All of the alternatives related to the energy efficiency of residential buildings show that annual energy-efficiency benefits of up to approximately 14.01% could be obtained, and air conditioning could experience a benefit of up to 20.16%.
Table 9. Comparison of the electricity consumption and percentage reduction among different alternatives.
VariablesElectric consumption (kWh/year)Percentage reduction (%)
AnnualHVACAnnualHVAC
Baseline39,121.526,375.5--
Clay Roof Tile39,238.626,478.70.30%0.39%
Modified Roof39,045.726,291.7−0.19%−0.32%
Reflective Glass36,029.323,374.6−7.90%−11.38%
Single Low-E Glass36,227.623,576.1−7.40%−10.61%
Double Low-E Glass35,956.023,297.6−8.09%−11.67%
Horizontal Shading (0.9 m)37,363.624,673.2−4.49%−6.45%
Vertical Shading (0.9 m)34,912.322,288.5−10.76%−15.50%
Box Shading (0.9 × 0.9 m)33,639.021,057.0−14.01%−20.16%

3.6. Energy-Saving Enhancement

The recommended design alternatives were combined as the design mix. This study tested two types of design mixes. Design mix 1 combined the alternatives of the modified RC flat roof, double-layered low-E glass, and box shading device (0.9 m × 0.9 m), whereas design mix 2 only combined the modified RC flat roof and box shading device (0.9 m × 0.9 m). The results showed that design mix 1 can produce a reduction of approximately 19.16% of the total annual energy consumption, whereas design mix 2 can produce a reduction of approximately 17.51% of the total annual energy consumption (see Table 10). The difference between the two design mixes is limited; however, design mix 1 is expensive due to the use of expensive low-E glass.
Table 10. Comparison of the electricity consumption, electric consumption difference and percentage reduction of the different combinations.
CombinationElectric consumption (kWh/year)Electric consumption difference (kWh)Percentage reduction
AnnualHVACAnnualHVACAnnualHVAC
Baseline39,121.526,375.5----
Design mix 131,624.819,091.2−7,496.7−7,284.3−19.16%−27.62%
Design mix 232,269.919,729.2−6,851.6−6,646.3−17.51%−25.20%

4. Conclusions

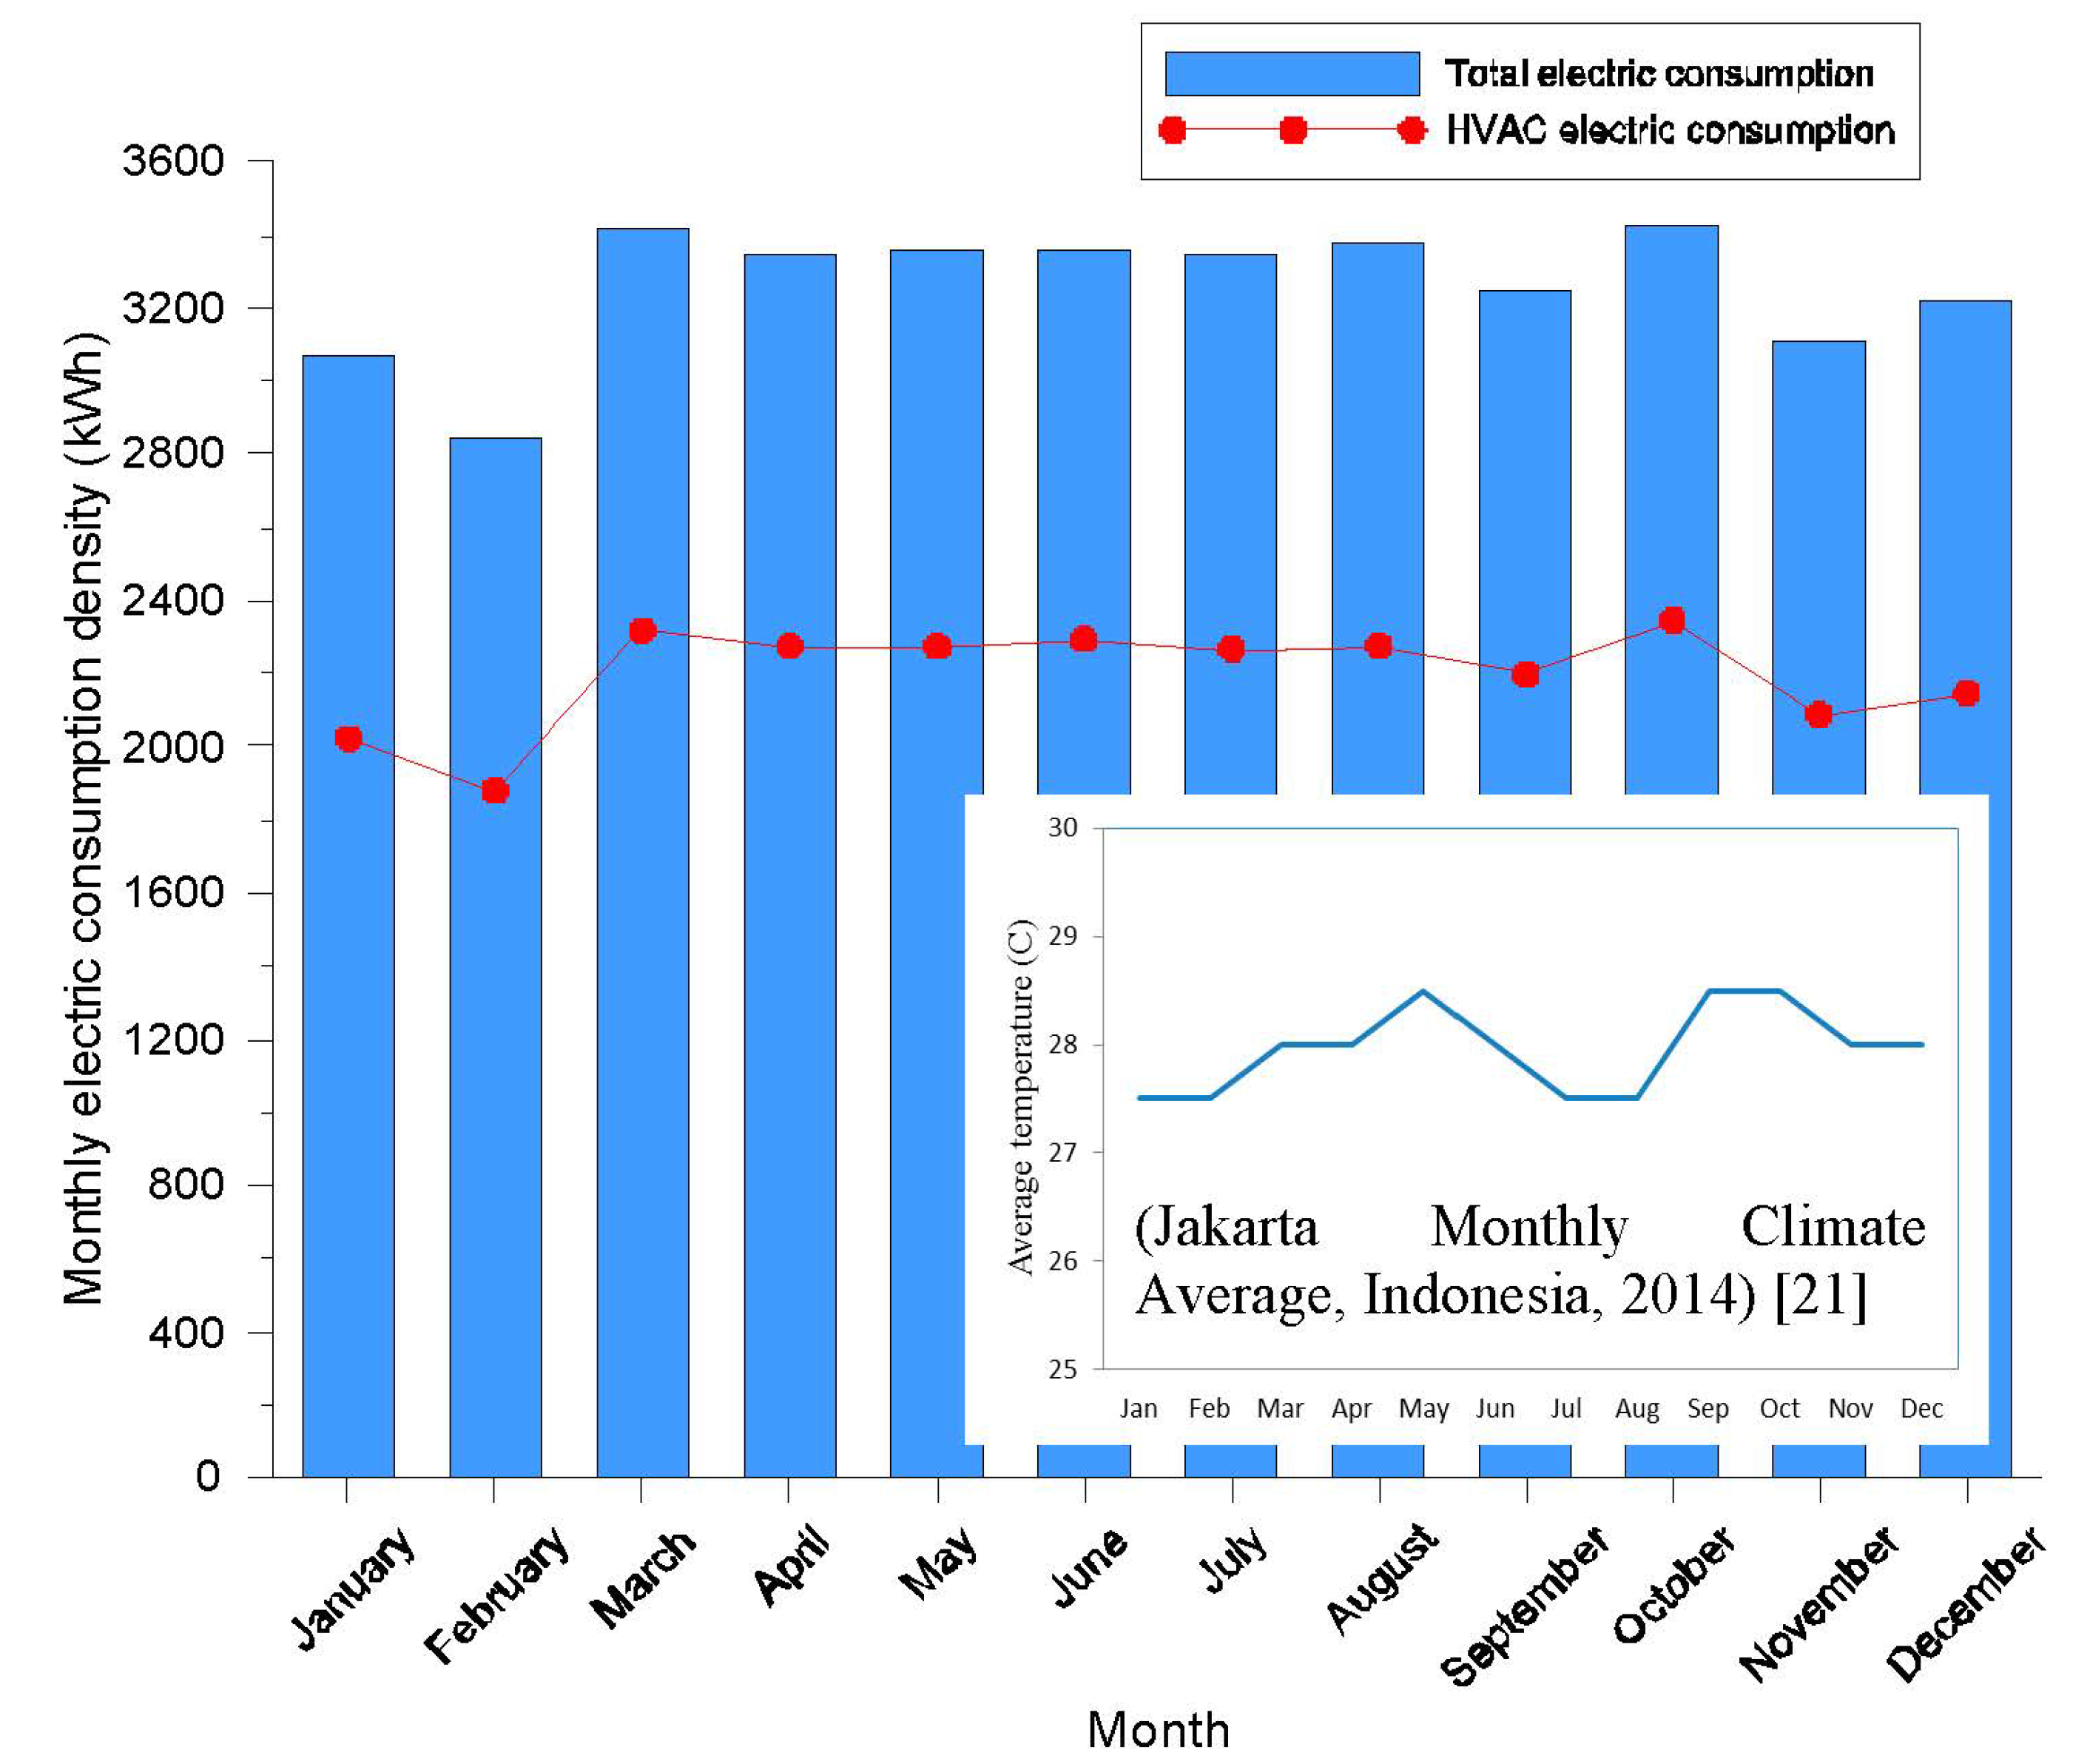
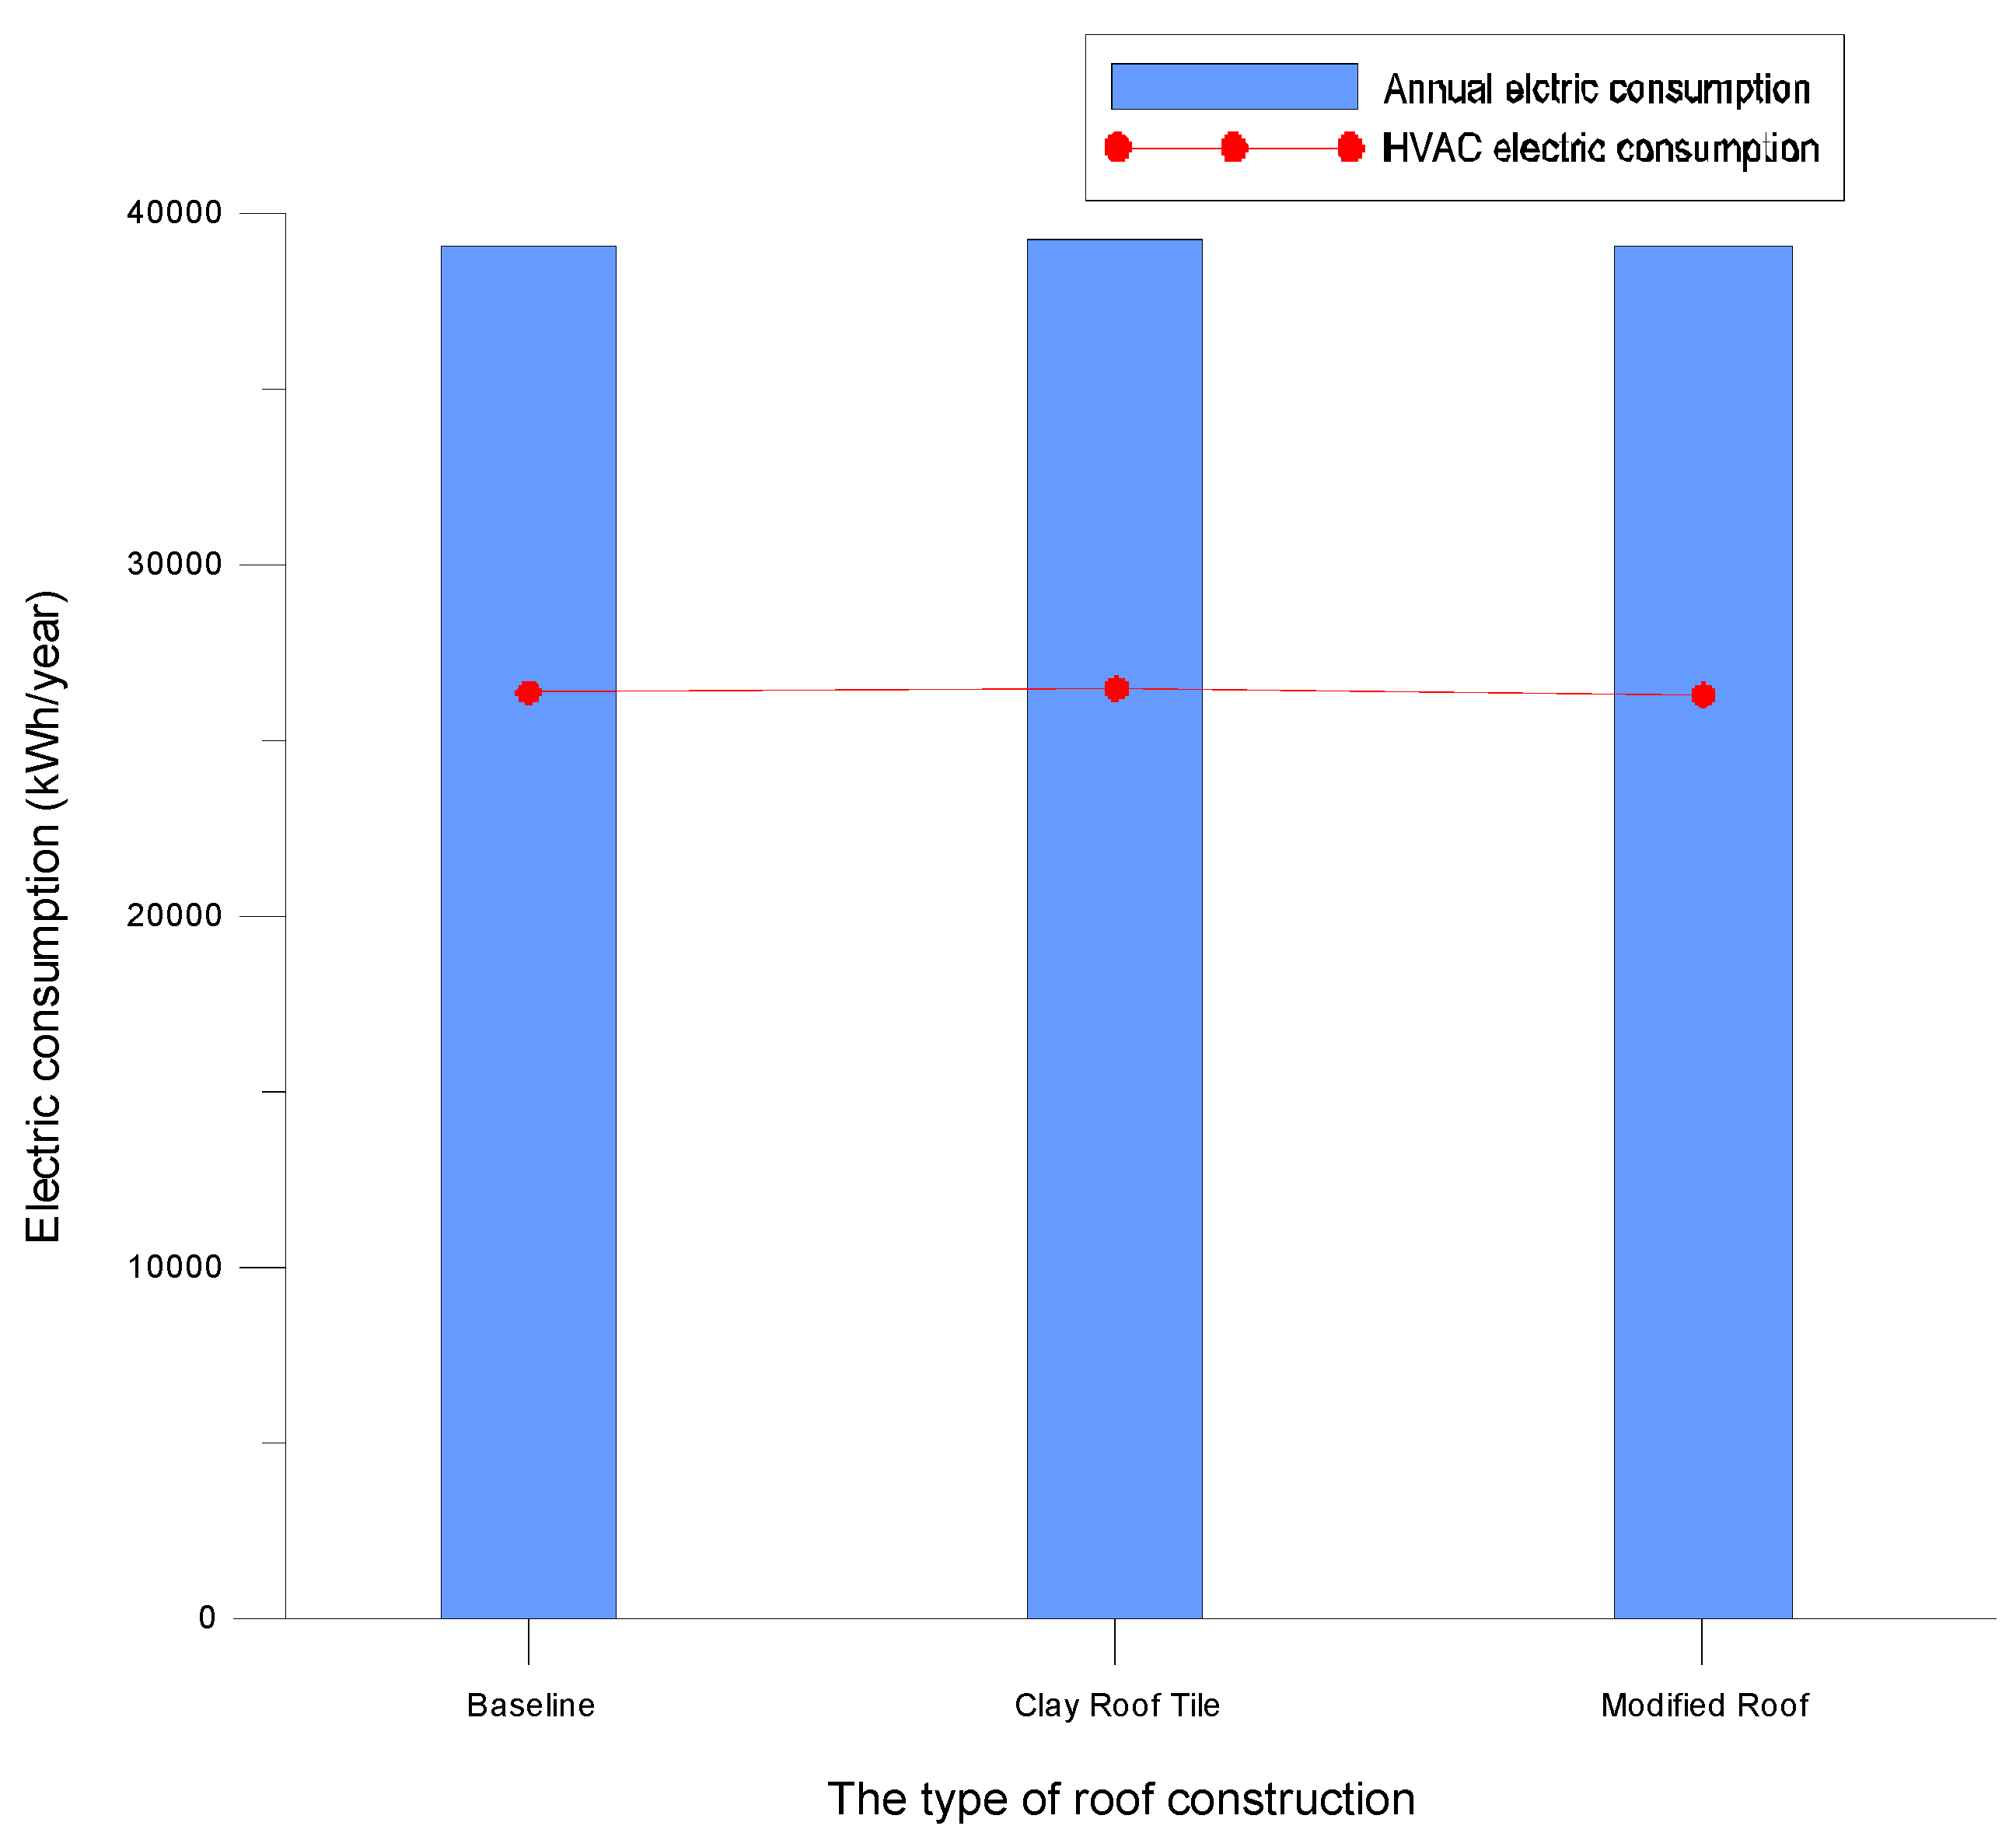
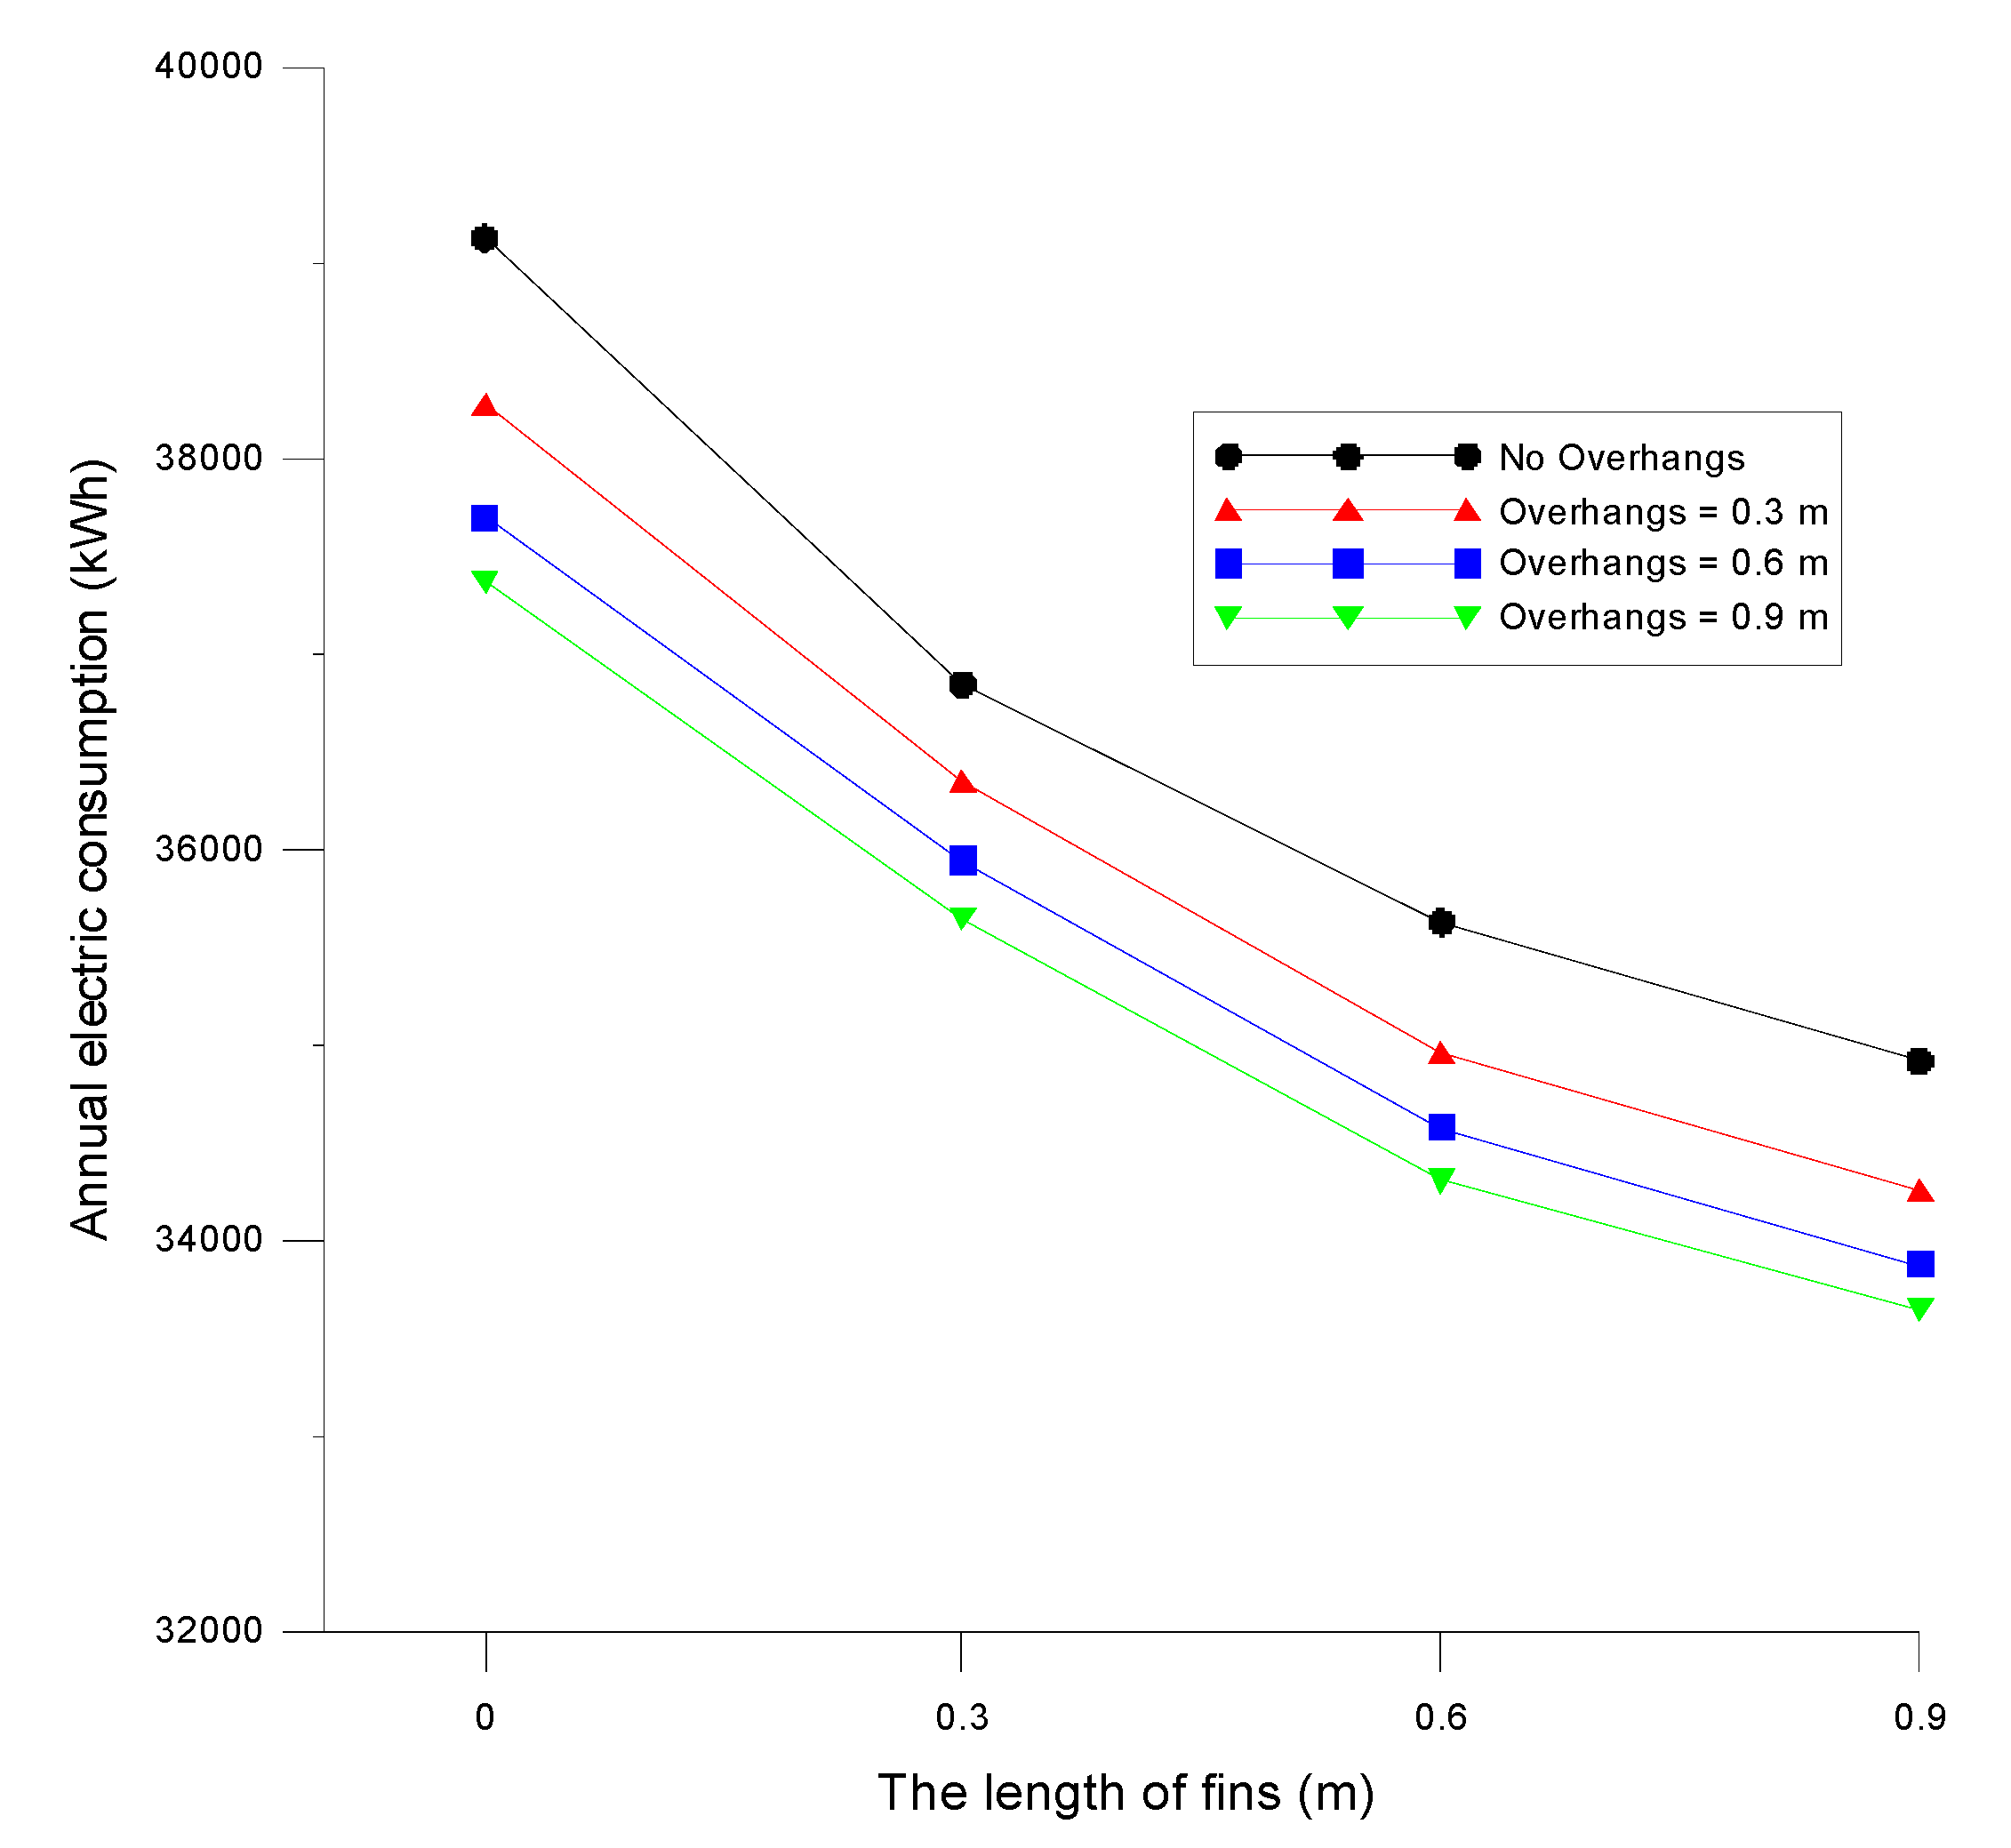
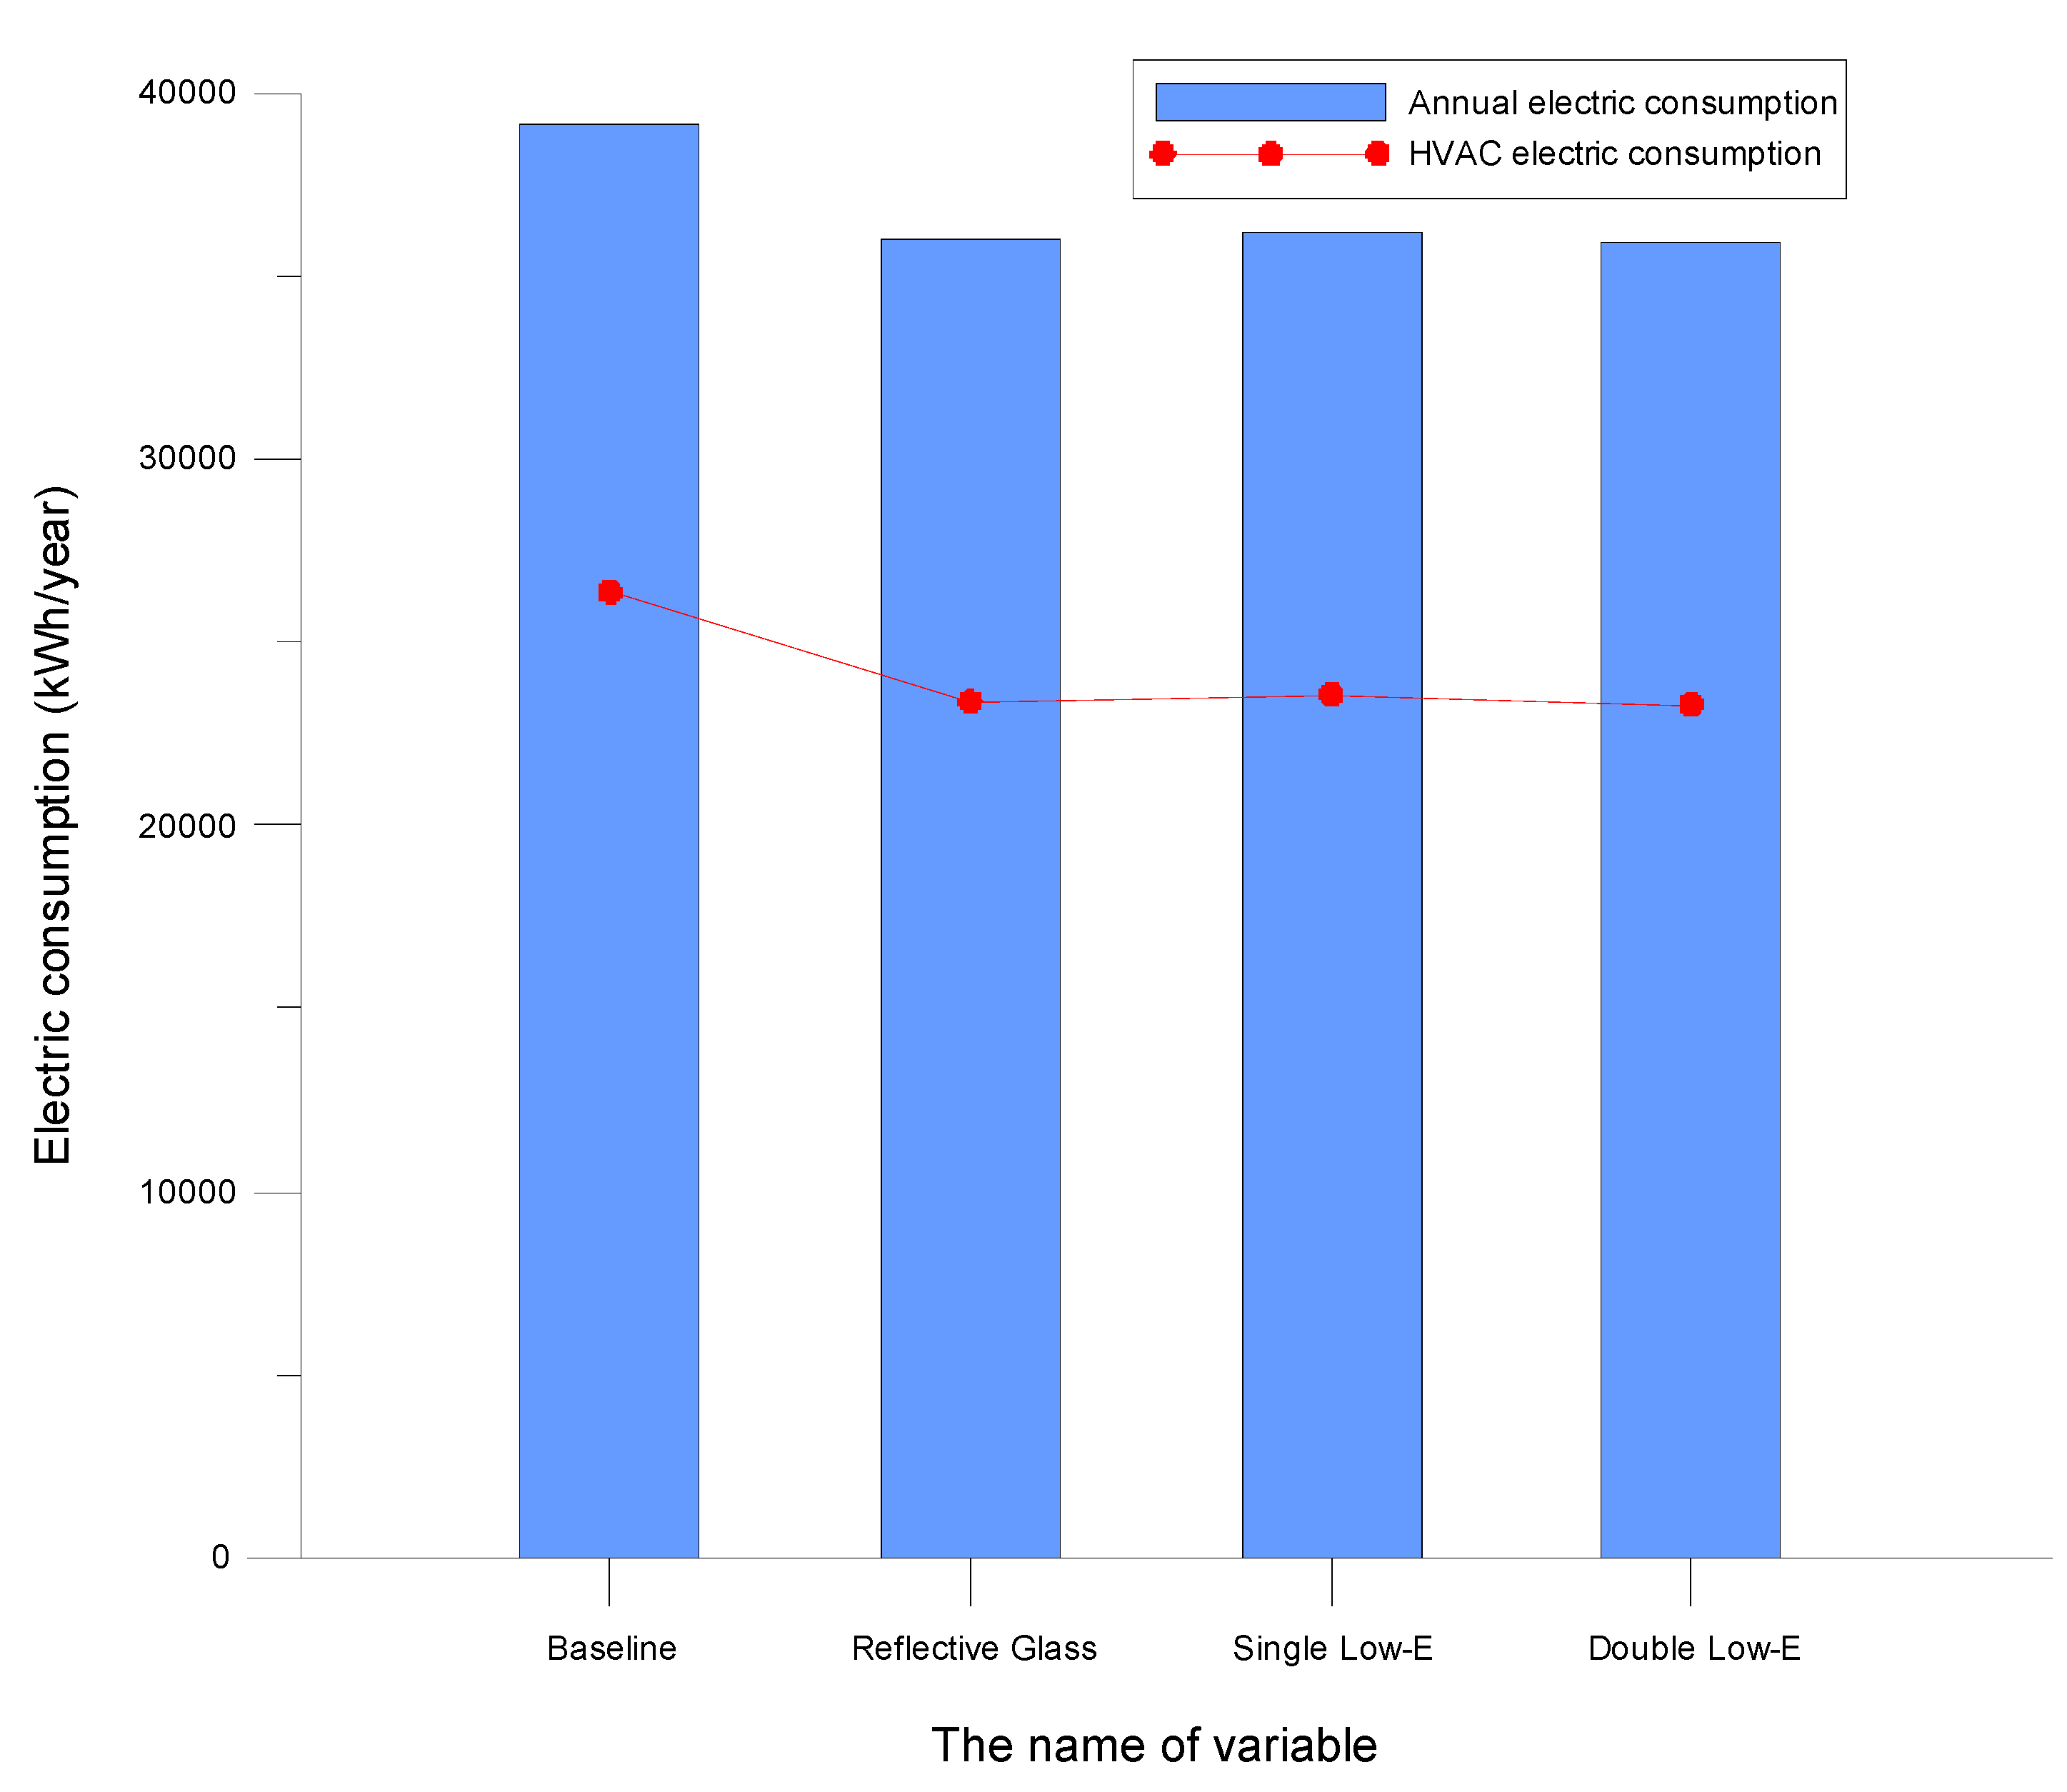
This study used the eQUEST simulation software package to analyze the effects of envelope design alternatives on energy savings in terms of air conditioning, including effects from roof construction, types of glazing, and types of shading. The results showed that the main electricity consumption for residential buildings was caused by air conditioning. The use of a clay roof tile increased the overall energy consumption by 0.3%, whereas the use of a modified RC flat roof reduced the overall energy consumption by 0.19%. This result indicated that the building’s roof has a small impact on the energy demands. Compared to general glass, installing a reflective glazing, single-layered low-E glass, and double-layered low-E glass can reduce the overall building energy consumption by 7.9%, 7.4%, and 8.09%, respectively. This result showed that the glass material has a significant effect on the building’s energy consumption. When horizontal shading, vertical shading, and box shading were used, the changes in the energy consumption benefits for air conditioning were 3.12%–6.45%, 8.39%–15.5%, and 10.24%–20.16%, respectively. This result showed that shading devices can have significant impacts on the building’s energy consumption for air conditioning.
Compared to the baseline results, design mix 1 can reduce the overall building energy consumption by 19.16%, whereas design mix 2 can reduce the overall building energy consumption by 17.51%. In conclusion, among all examined energy consumption parameters, the shading device has the most significant impact on the building’s overall energy consumption, followed by the use of an appropriate glazing, whereas the roof construction produced smaller energy-saving benefits. Therefore, shading system improvements are highly recommended for this residential structure in Indonesia to obtain improved energy efficiency.

Author Contributions

Chi-Ming Lai and Chun-Ta Tzeng designed the simulation modellings; Andre Feliks Setiawan and Tzu-Ling Huang performed the simulations; Andre Feliks Setiawan and Tzu-Ling Huang analyzed the data; and Chi-Ming Lai wrote the paper.

Conflicts of Interest

The authors declare no conflict of interest.

References

  1. Shahbaz, M.; Hye, Q.M.A.; Tiwari, A.K.; Leitão, N.C. Economic growth, energy consumption, financial development, international trade and CO2 emissions in Indonesia. Renew. Sustain. Energy Rev. 2013, 25, 109–121. [Google Scholar] [CrossRef] [Green Version]
  2. Mujiyanto, S.; Tiess, G. Secure energy supply in 2025: Indonesia’s need for an energy policy strategy. Energy Policy 2013, 61, 31–41. [Google Scholar] [CrossRef]
  3. Ministry of Energy and Mineral Resources of Indonesia (MEMR). Indonesia Energy Statistics 2010; Center for Data and Information on Energy and Mineral Resources: Jakarta, Indonesia, 2010. [Google Scholar]
  4. National Electricity Master Plan 2008–2027; Ministry of Energy and Mineral Resources: Jakarta, Indonesia, 2008.
  5. Lai, C.M.; Wang, Y.H. Energy-saving potential of building envelope designs in residential houses in Taiwan. Energies 2011, 4, 2061–2076. [Google Scholar] [CrossRef]
  6. Stavrakakis, G.M.; Zervas, P.L.; Sarimveis, H.; Markatos, N.C. Development of a computational tool to quantify architectural-design effects on thermal comfort in naturally ventilated rural houses. Build. Environ. 2010, 45, 65–80. [Google Scholar] [CrossRef]
  7. Stavrakakis, G.M.; Karadimou, D.P.; Zervas, P.L.; Sarimveis, H.; Markatos, N.C. Selection of window sizes for optimizing occupational comfort and hygiene based on computational fluid dynamics and neural networks. Build. Environ. 2011, 46, 298–314. [Google Scholar] [CrossRef]
  8. Karadimou, D.P.; Markatos, N.C. A novel flow-oriented discretization scheme for reducing false diffusion in three-dimensional (3D) flows: An application in the indoor environment. Atmos. Environ. 2012, 61, 327–339. [Google Scholar] [CrossRef]
  9. Hawaii Commercial Building Guidelines for Energy Efficiency; Energy, Resources & Technology Division, Department of Business, Economic Development and Tourism, State of Hawaii: Honolulu, HI, USA, 2004.
  10. Chirarattananon, S.; Taweekun, J.A. Technical review of energy conservation program for commercial and government buildings in Thailand. Energy Convers. Manag. 2003, 44, 745–764. [Google Scholar]
  11. Medrano, M.; Brouwer, J.; McDonell, V.; Mauzey, J.; Samuelsen, S. Integration of distributed generation systems into generic types of commercial buildings in California. Energy Build. 2008, 40, 537–548. [Google Scholar] [CrossRef]
  12. Yu, J.; Yang, C.; Tian, L. Low-energy envelope design of residential building in hot summer and cold winter zone in China. Energy Build. 2008, 40, 1536–1546. [Google Scholar] [CrossRef]
  13. Waltz, P.J. Computerized Building Energy Simulation Handbook; Marcel Dekker: New York, NY, USA, 2000. [Google Scholar]
  14. Zhu, Y. Applying computer-based simulation to energy auditing: A case study. Energy Build. 2006, 38, 421–428. [Google Scholar] [CrossRef]
  15. Nas, P.J.M. The house in Indonesia—Between globalization and localization. Bijdragen Tot De Taal- Land- En Volkenkunde 1998, 154, 335–360. [Google Scholar] [CrossRef]
  16. Davidson, J.E.; Heinberg, J.; Williamson, B. Guide to Energy Efficient Homes in Louisiana; Louisiana Department of Natural Resources: Baton Rouge, LA, USA, 2010. [Google Scholar]
  17. The Energy and Resources Institute (TERI). Development of Building Regulations and Guidelines for Energy Efficiency in Bangalore City; TERI: New Delhi, India, 2010. [Google Scholar]
  18. O’Connor, J.; Lee, E.; Rubinstein, F.; Selkowitz, S. Tips for Daylighting with Windows; Ernest Orlando Lawrence Berkeley National Laboratory: Berkeley, CA, USA, 1997. [Google Scholar]
  19. Kim, J.T.; Kim, G. Advanced external shading device to maximize visual and view performance. Indoor Built Environ. 2010, 19, 65–72. [Google Scholar] [CrossRef]
  20. Jakarta Monthly Climate Average, Indonesia. Available online: http://www.worldweatheronline.com/Jakarta-weather-averages/Jakarta-Raya/ID.aspx (accessed on 6 June 2014).

