1. Introduction
In the past few years, miniature fuel cells without a polymer electrolyte membrane, called membraneless fuel cells or microfluidic fuel cells, have been widely proposed and tested. Some of those microfluidic fuel cells operate a co-laminar flow in a microchannel to keep both the fuel and oxidant streams separated, such that both anode and cathode half-cell reactions are able to properly take place at relative catalyst-coated electrodes with slight mixing at the inter-diffusion zone. Various aqueous fuel/oxidant combinations for generating electricity from microfluidic fuel cells can be found. Ferrigno
et al. [
1] and Kjeang
et al. [
2] tested the performance of microfluidic fuel cells using redox couples V(V)/V(IV) and V(III)/V(II) dissolved in sulfuric acid solution as aqueous oxidant and fuel, respectively. Accompanying a cathodic half-cell reaction using hydrogen peroxide or oxygen-saturated electrolyte as oxidant, methanol or formic acid is another common aqueous fuel [
3,
4,
5,
6] for microfluidic fuel cells. Zhu
et al. [
7] proposed an air-breathing direct formic acid microfluidic fuel cell using graphite cylinder arrays as the anode, in order to extend the reactive surface area and improve fuel utilization by the three-dimensional anode. Various effects including the spacer configuration, fuel and electrolyte concentration, reactant flow rate, and dynamic behavior of generated CO
2 bubbles on the cell performance were investigated. With a formic acid concentration and electrolyte concentration of 0.5 M and 1.0 M, respectively, their microfluidic fuel cell yielded a peak power density of 21.5 mW/cm
3 at a flow rate of 20 mL/h, and a maximum fuel utilization of 87.6% at the flow rate of 1 mL/h. Moreover, there is a particular electrochemical reaction for microfluidic fuel cells that uses hydrogen peroxide as both fuel and oxidant [
8,
9].
However, microfluidic fuel cells using an aqueous reactant suffer a low species diffusivity and low oxidant concentration, and thus hinder the cell from enhancing cell output. In order to address such problems, another kind of microfluidic fuel cell that reacts with air as a gaseous oxidant by breathing air through a porous gas diffusion electrode was proposed.
The first prototype of an air-breathing microfluidic fuel cell was proposed by Jayashree
et al. [
10] in 2005. Their fuel cell used formic acid containing 0.5-M sulfuric acid as fuel and breathed air as an oxidant through an air-exposed porous GDE. Results showed that both the fuel utilization and the power density for this microfluidic fuel cell were able to significantly improve, compared with the traditional microfluidic fuel cell using an aqueous oxidant. At lower flow rates (e.g., 0.1 mL/min), fuel utilization was 33% for a single pass. In addition, a power density in air-breathing laminar flow fuel cells of 26 mW/cm
2 was obtained.
Because of the marked performance improvement of the air-breathing microfluidic fuel cells, several studies investigating the various effects on the performance of similar fuel cells reacting with either methanol or formic acid were carried out [
11,
12,
13,
14,
15,
16]. In order to have a notable microfluidic fuel cell performance, the anodic gas diffusion electrodes of those fuel cells were always heavily loaded with a catalyst, ranging from 7 mg/cm
2 to 10 mg/cm
2. Besides electricity, a gaseous product, CO
2, is also produced in the anode based on the electrochemical reaction. Based on a careful examination of the related literature [
10,
11,
12,
13,
14,
15,
16], it can be found that the anode catalyst loading of an air-breathing microfluidic fuel cell is usually so high (>8 mg/cm
2) that the bubbles are most likely to be presented on the electrode due to the high cell current output.
Therefore, this study aims to fabricate an air-breathing direct formic acid microfluidic fuel cell employing soft-lithography process and laser machining in order to investigate the cell performance under various operating conditions. The anodic gas diffusion electrode, having Pd nanoparticles as catalyst, was home-made to assure an efficient formic acid oxidation. Both cell performance and flow visualization were performed with various formic acid concentrations at various volumetric flow rates to characterize the relationship between cell output and bubble behavior.
2. Experimental Setup
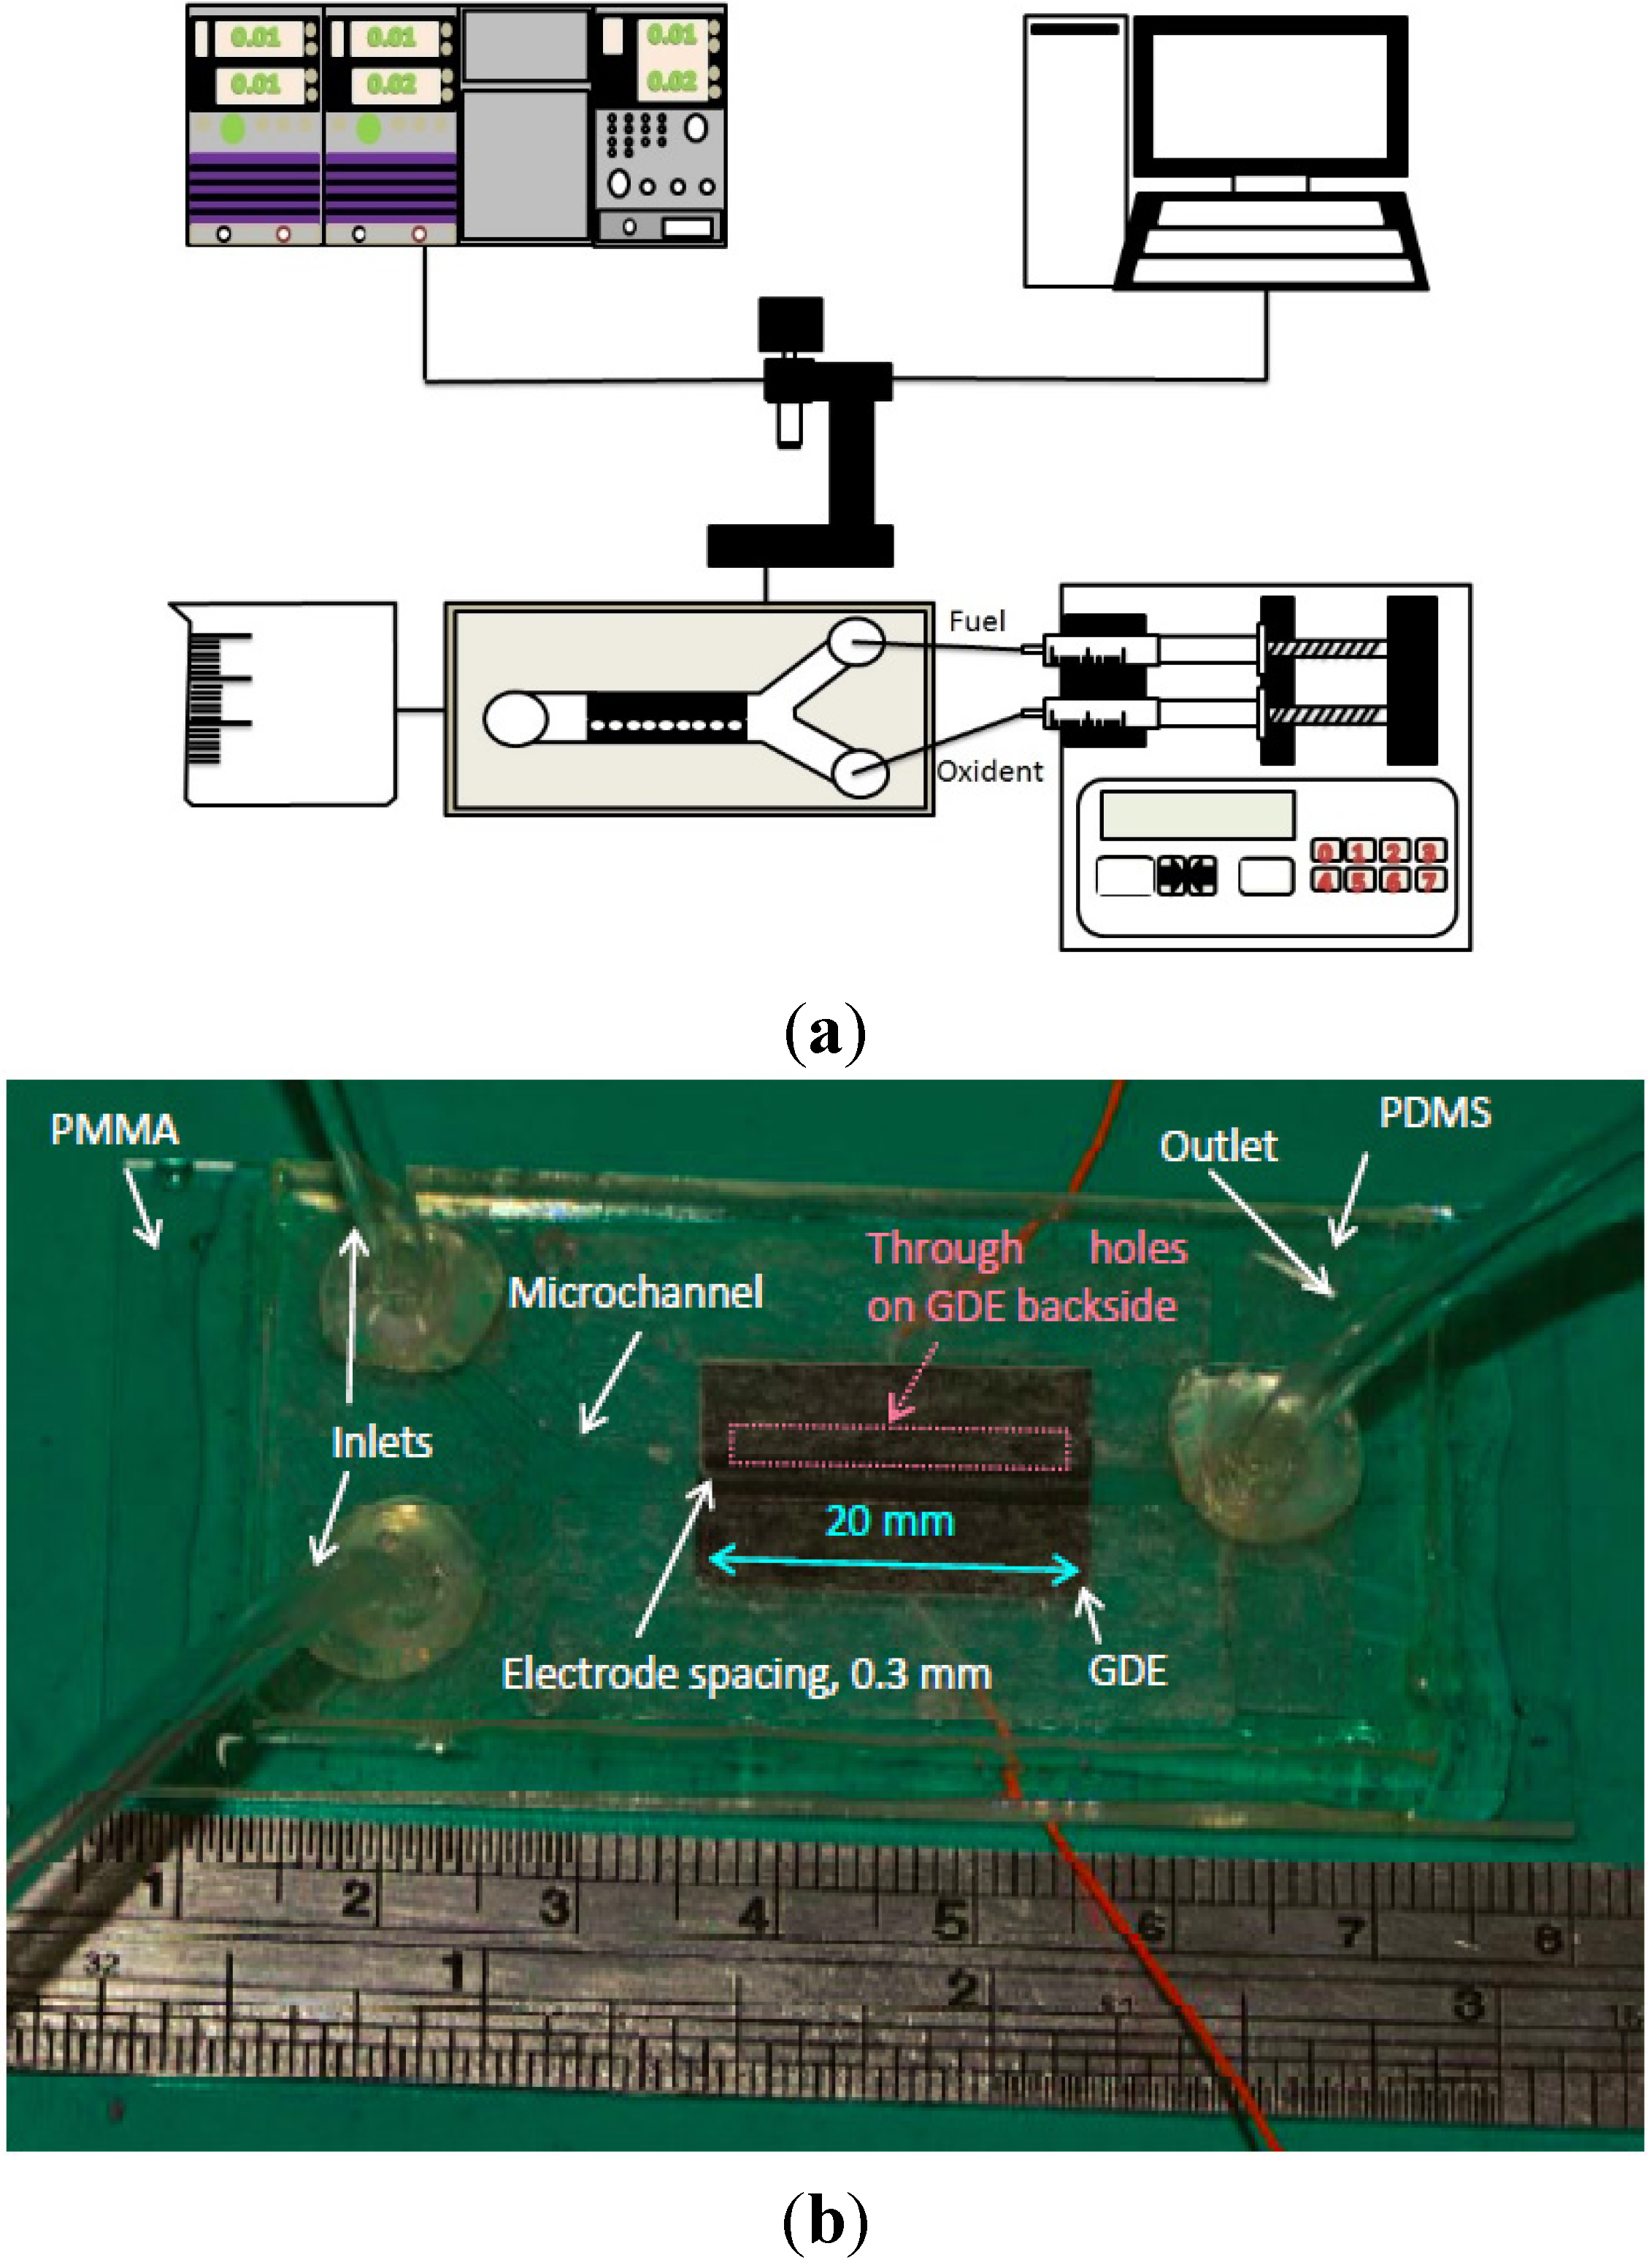
A schematic of the present experimental setup is shown in
Figure 1a. It consists of four major components, including a microfluidic fuel cell with a Y-shaped microchannel in
Figure 1b, a fluid delivery system, an electronic load for cell performance measurement, and a high-speed video camera.
Figure 1.
(a) Experimental apparatus; (b) the microfluidic fuel cell of the study.
Figure 1.
(a) Experimental apparatus; (b) the microfluidic fuel cell of the study.
During the experiments, both electrodes of a horizontally oriented fuel cell were connected to an electronic load (KIKUSUI PLZ-70UA) to measure the voltage-current (V-I) curve at room temperature and ambient pressure under stepwise potentiostatic control. The electronic load enabled a maximum voltage and current of 150 V and 15 A, respectively. The resolution of voltage and current for the present electronic load are 0.1 mV and 0.01 mA, respectively. All V-I curves in the manuscript were measured with a potential step of 50 mV from 0.95 V to 0 V. The duration of each potential step was 10 s and data were recorded once every 0.5 s. The mean of all values recorded at each potential step was then calculated.
For the fluid delivery system, a syringe pump (KDS 210, KD Scientific Inc., Holliston, MA, USA) with two syringes was employed. Polyethylene tubing was used to deliver liquid into the microfluidic fuel cell and to guide the waste stream out of the fuel cell. Both aqueous fuel and supporting electrolyte were simultaneously pumped into the microfluidic fuel cell via individual inlets with the same volumetric flow rate. Note that the volumetric flow rate described in this study represents the inlet volumetric flow of a single stream, and the total volumetric flow rate in the microchannel is twice that value.
A high-speed video camera (Fastec HiSpec 1, Fastec Imaging, San Diego, CA, USA) with a lens (InfiniVar CFM-2) was used for simultaneous flow visualization and image acquisition. For each test, the images were taken at 0.5 V and 0.2 V with a recording rate of 10 frames/s and 30 frames/s, respectively. The images’ recording duration was 240 s and 100 s at 0.5 V and 0.2 V, respectively.
An air-breathing microfluidic fuel cell having a 1.5-mm-wide and 0.5-mm-deep microchannel was tested at volumetric flow rates ranging from 0.1 mL/min to 0.7 mL/min. The spacing between two gas diffusion electrodes in a cell was 0.3 mm. The mixture of formic acid and 0.5-M H
2SO
4 was used as the fuel, and the other 0.5-M H
2SO
4 (Merck KGaA, Darmstadt, Germany) stream served as the liquid electrolyte of the present microfluidic fuel cells. The concentration of formic acid was 0.3 M, 0.5 M, or 1.0 M. Millipore water (18.3 MΩ-cm, Millipore Milli-Q) was used for the preparation of all tested solutions. All experimental conditions are shown in
Table 1.
Table 1.
Experimental conditions and anode parameters.
Table 1.
Experimental conditions and anode parameters.
| Reactants | Anode: HCOOH + 0.5-M H2SO4 |
|---|
| Cathode: Air + 0.5-M H2SO4 |
|---|
| HCOOH Conc., M | 0.3, 0.5, 1.0 |
| Channel shape | Rectangular |
| Main channel size, mm | Length: 35; Width: 1.5; Depth: 0.05 |
| Electrode area, mm | 0.6 × 20 |
| Electrode spacing, mm | 0.3 |
| Pd loading, mg/cm2 | 10 |
| Pd/C | 85% |
| Nafion content, mg/cm2 | 6 |
| Flow rate, mL/min | 0.1, 0.2, 0.3, 0.4, 0.5, 0.6, 0.7 |
3. Fabrication of Microfluidic Fuel Cells
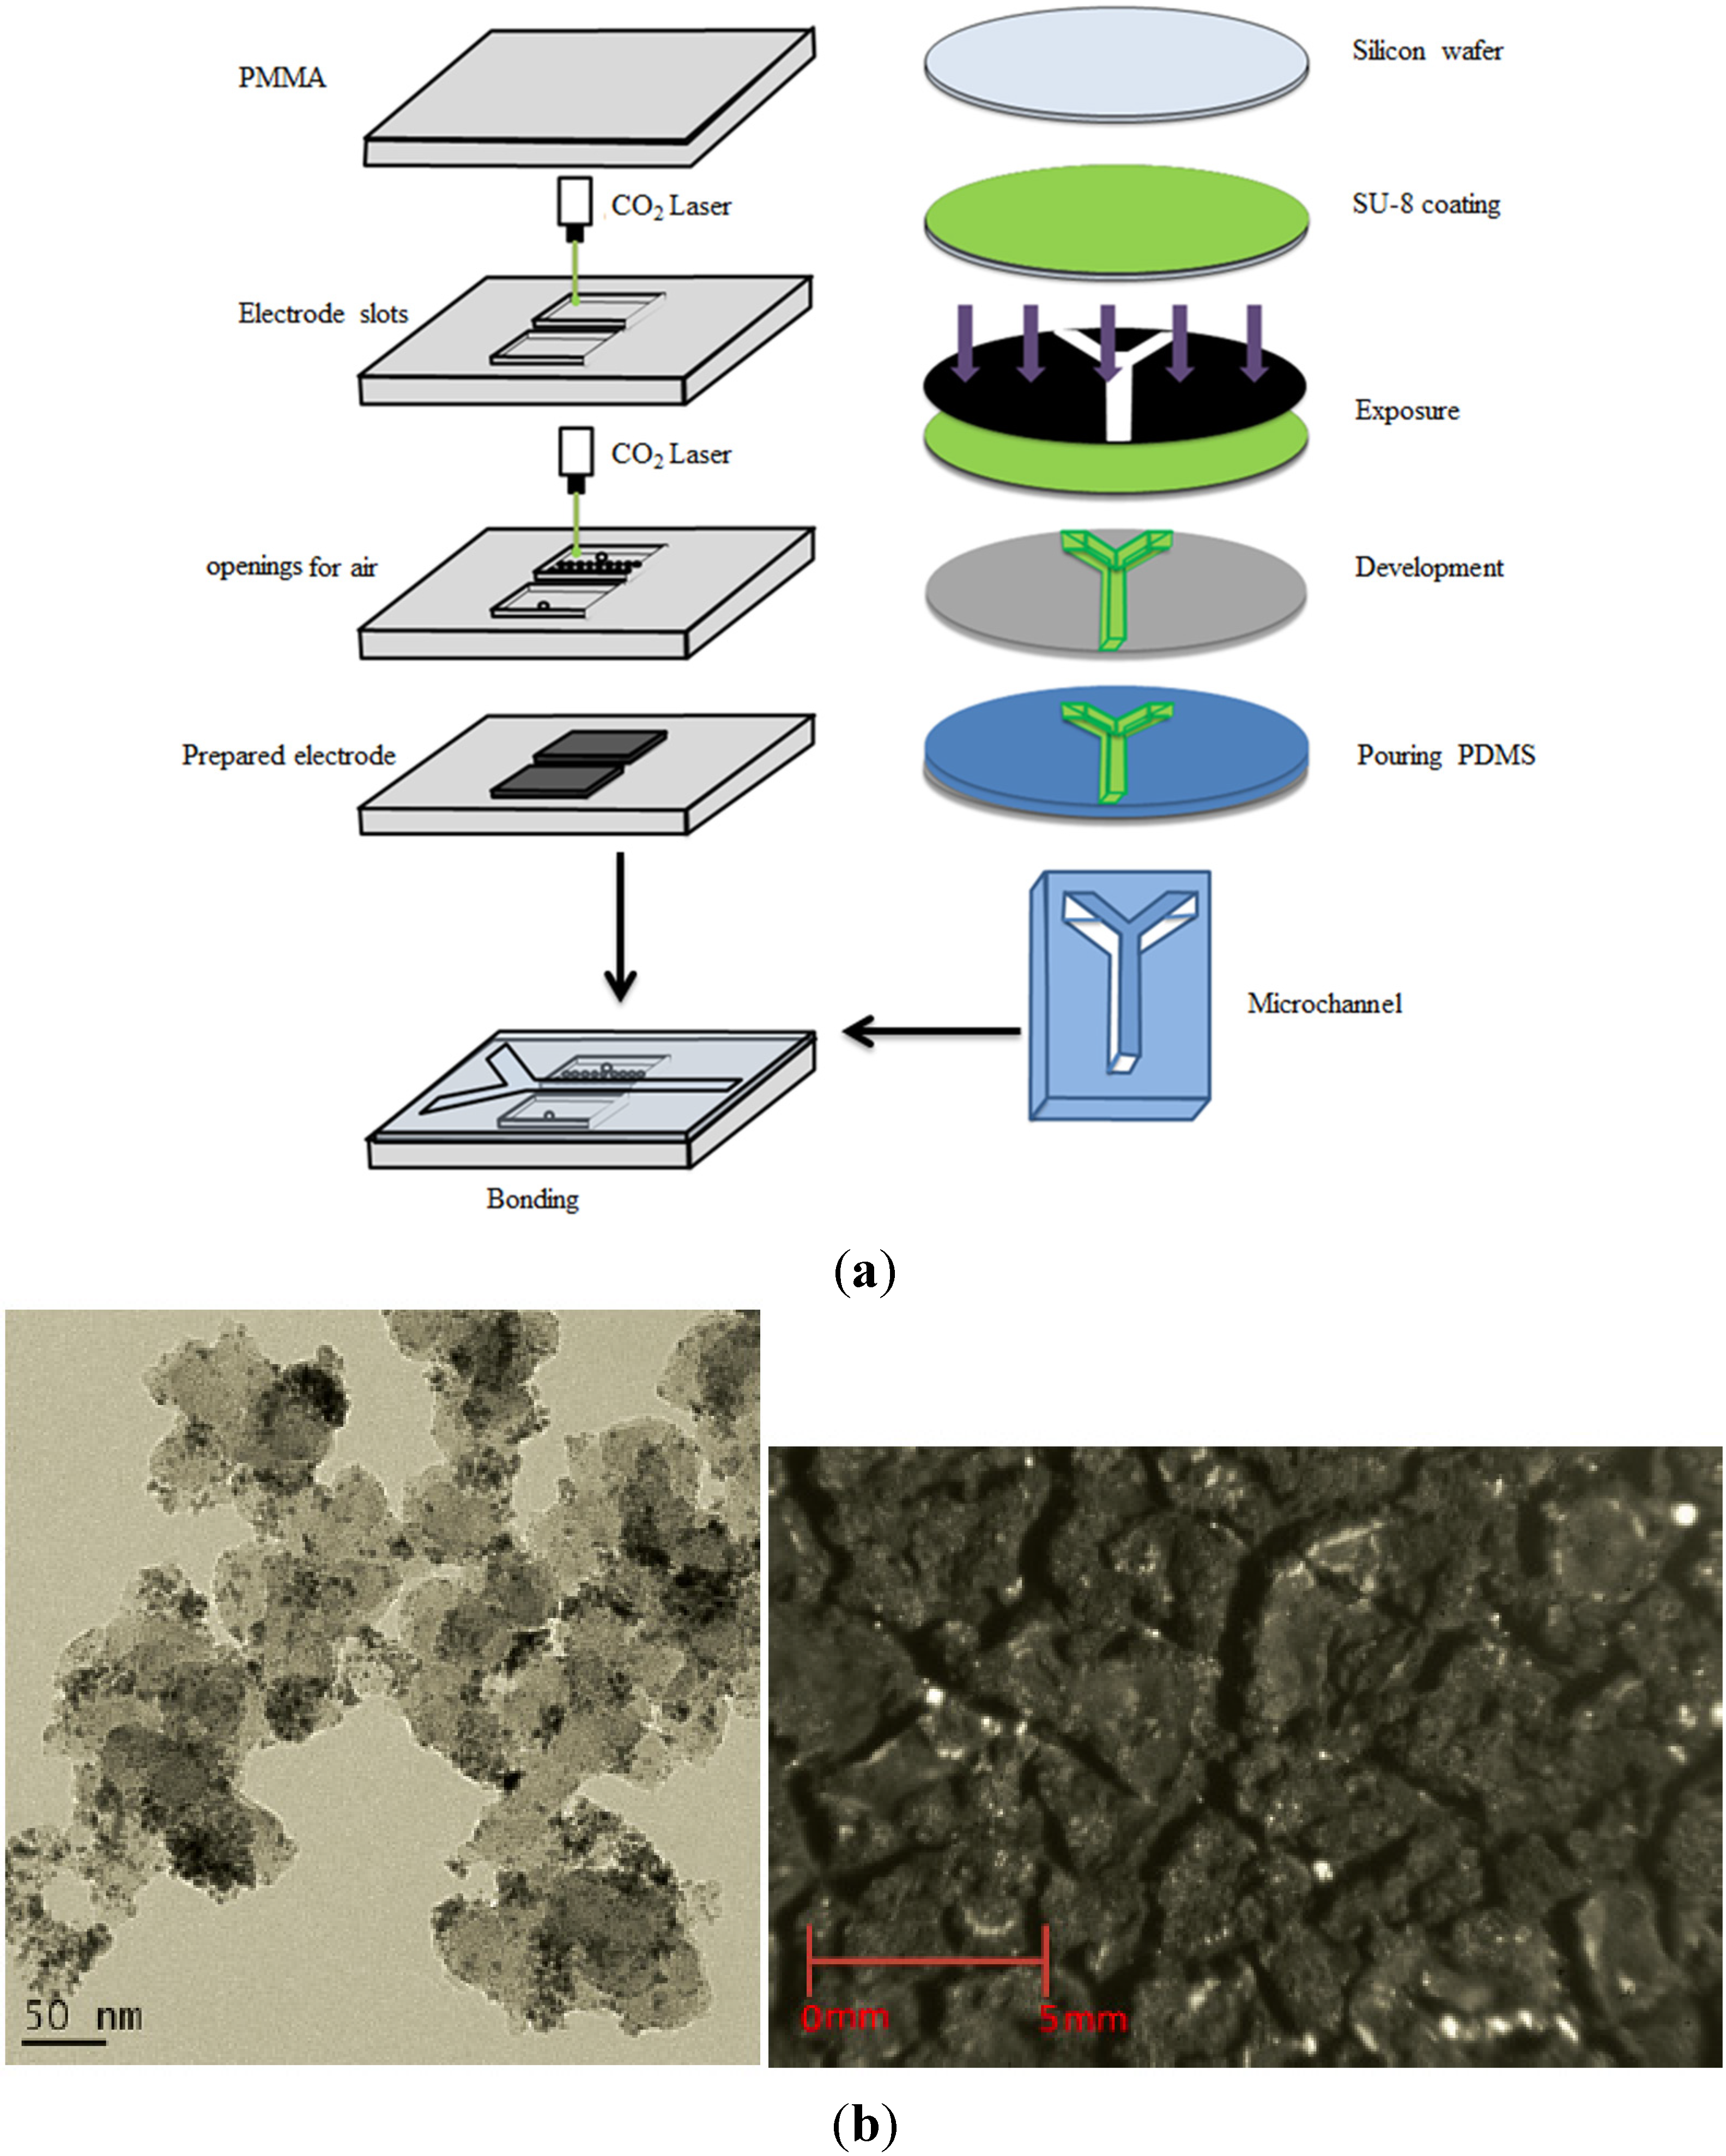
The fabrication process to achieve a Y-shaped microchannel for the present microfluidic fuel cell is schematically shown in
Figure 2a. Firstly, a polydimethylsiloxane (PDMS)-based Y-shaped microchannel was fabricated using a standard soft-lithography process via one photolithography step, including spin-coating of a negative photoresist (SU-8, MicroChem) layer, UV light exposure with a mask, and photoresist development. After complete development, the wafer was rinsed with isopropanol and dried under gentle pure nitrogen. The final device was molded with a mixture of PDMS and crosslinker at a ratio of 10:1 based on a mold replica technique. After being cured in an oven, the PDMS slab was peeled off from the mold and formed the designated 50-μm-deep Y-shaped microchannel, whose dimension was 1.5 mm × 30 mm.
Figure 2.
(a) Fabrication process of microfluidic fuel cell; (b) the TEM image and picture of the self-made anode.
Figure 2.
(a) Fabrication process of microfluidic fuel cell; (b) the TEM image and picture of the self-made anode.
Following the PDMS microchannel fabrication, a 3-mm-thick PMMA sheet was engraved with two 6 mm × 20 mm rectangular slots, using a CO2 laser for the arrangement of gas diffusion electrodes. One of the rectangular slots in the PMMA sheet was further drilled with 50 through holes with a diameter of 0.5 mm to achieve an air-breathing cathode.
Appropriate amounts of Vulcan XC-72 carbon black and NaC
12H
25SO
4 (SDS) were mixed and ultrasonically dispersed in DI water for several hours. Then, Pd(O
2CCH
3)
2 powder was added into the mixture in a reflux system for another several hours at 130 °C. After a reflux process, the mixture was poured into a separatory funnel with CHCl
3 for extraction in a rotary vacuum evaporator. The catalyst slurry was diluted with alcohol in a centrifuge. Subsequently, the Pd/C solution was put into an oven at 60 °C to obtain the Pd/C powder. As soon as the 85 wt% Pd/C nanoparticle powder was obtained, the catalyst ink was prepared by mixing the Pd/C catalysts powder ultrasonically in a mixture of DI water, n-propanol, and a certain volume of Nafion solution
® (5%, DuPont, Wilmington, DE, USA). Finally, the catalyst ink was brushed onto carbon paper (Toray TGP-H-090, Tokyo, Japan) and then baked on a hot plate to obtain an anode electrode with catalyst loading and Nafion content of approximately 10 mg/cm
2 and 6 mg/cm
2, respectively. The TEM image, which shows a satisfactory Pd distribution on the carbon black, and electrode picture were shown in
Figure 2b. As regards the cathode, a commercially available gas diffusion electrode containing catalyst loading of 2 mg/cm
2 Pt black supported by Vulcan XC-72 was used. Subsequently, the PDMS microchannel and the PMMA sheet adhered to each other using twin adhesive with the aid of the alignment marks designated on both the PDMS and PMMA to form the microfluidic fuel cell. Finally, the microfluidic chip was drilled with three holes as two inlets and an outlet for aqueous reactant to obtain the tested fuel cell in
Figure 2.
4. Results and Discussion
The fuel oxidation reaction at the anode and the air reduction reaction at the cathode in the direct formic acid microfluidic fuel cell and their standard potential are expressed, respectively, as follows [
15]:
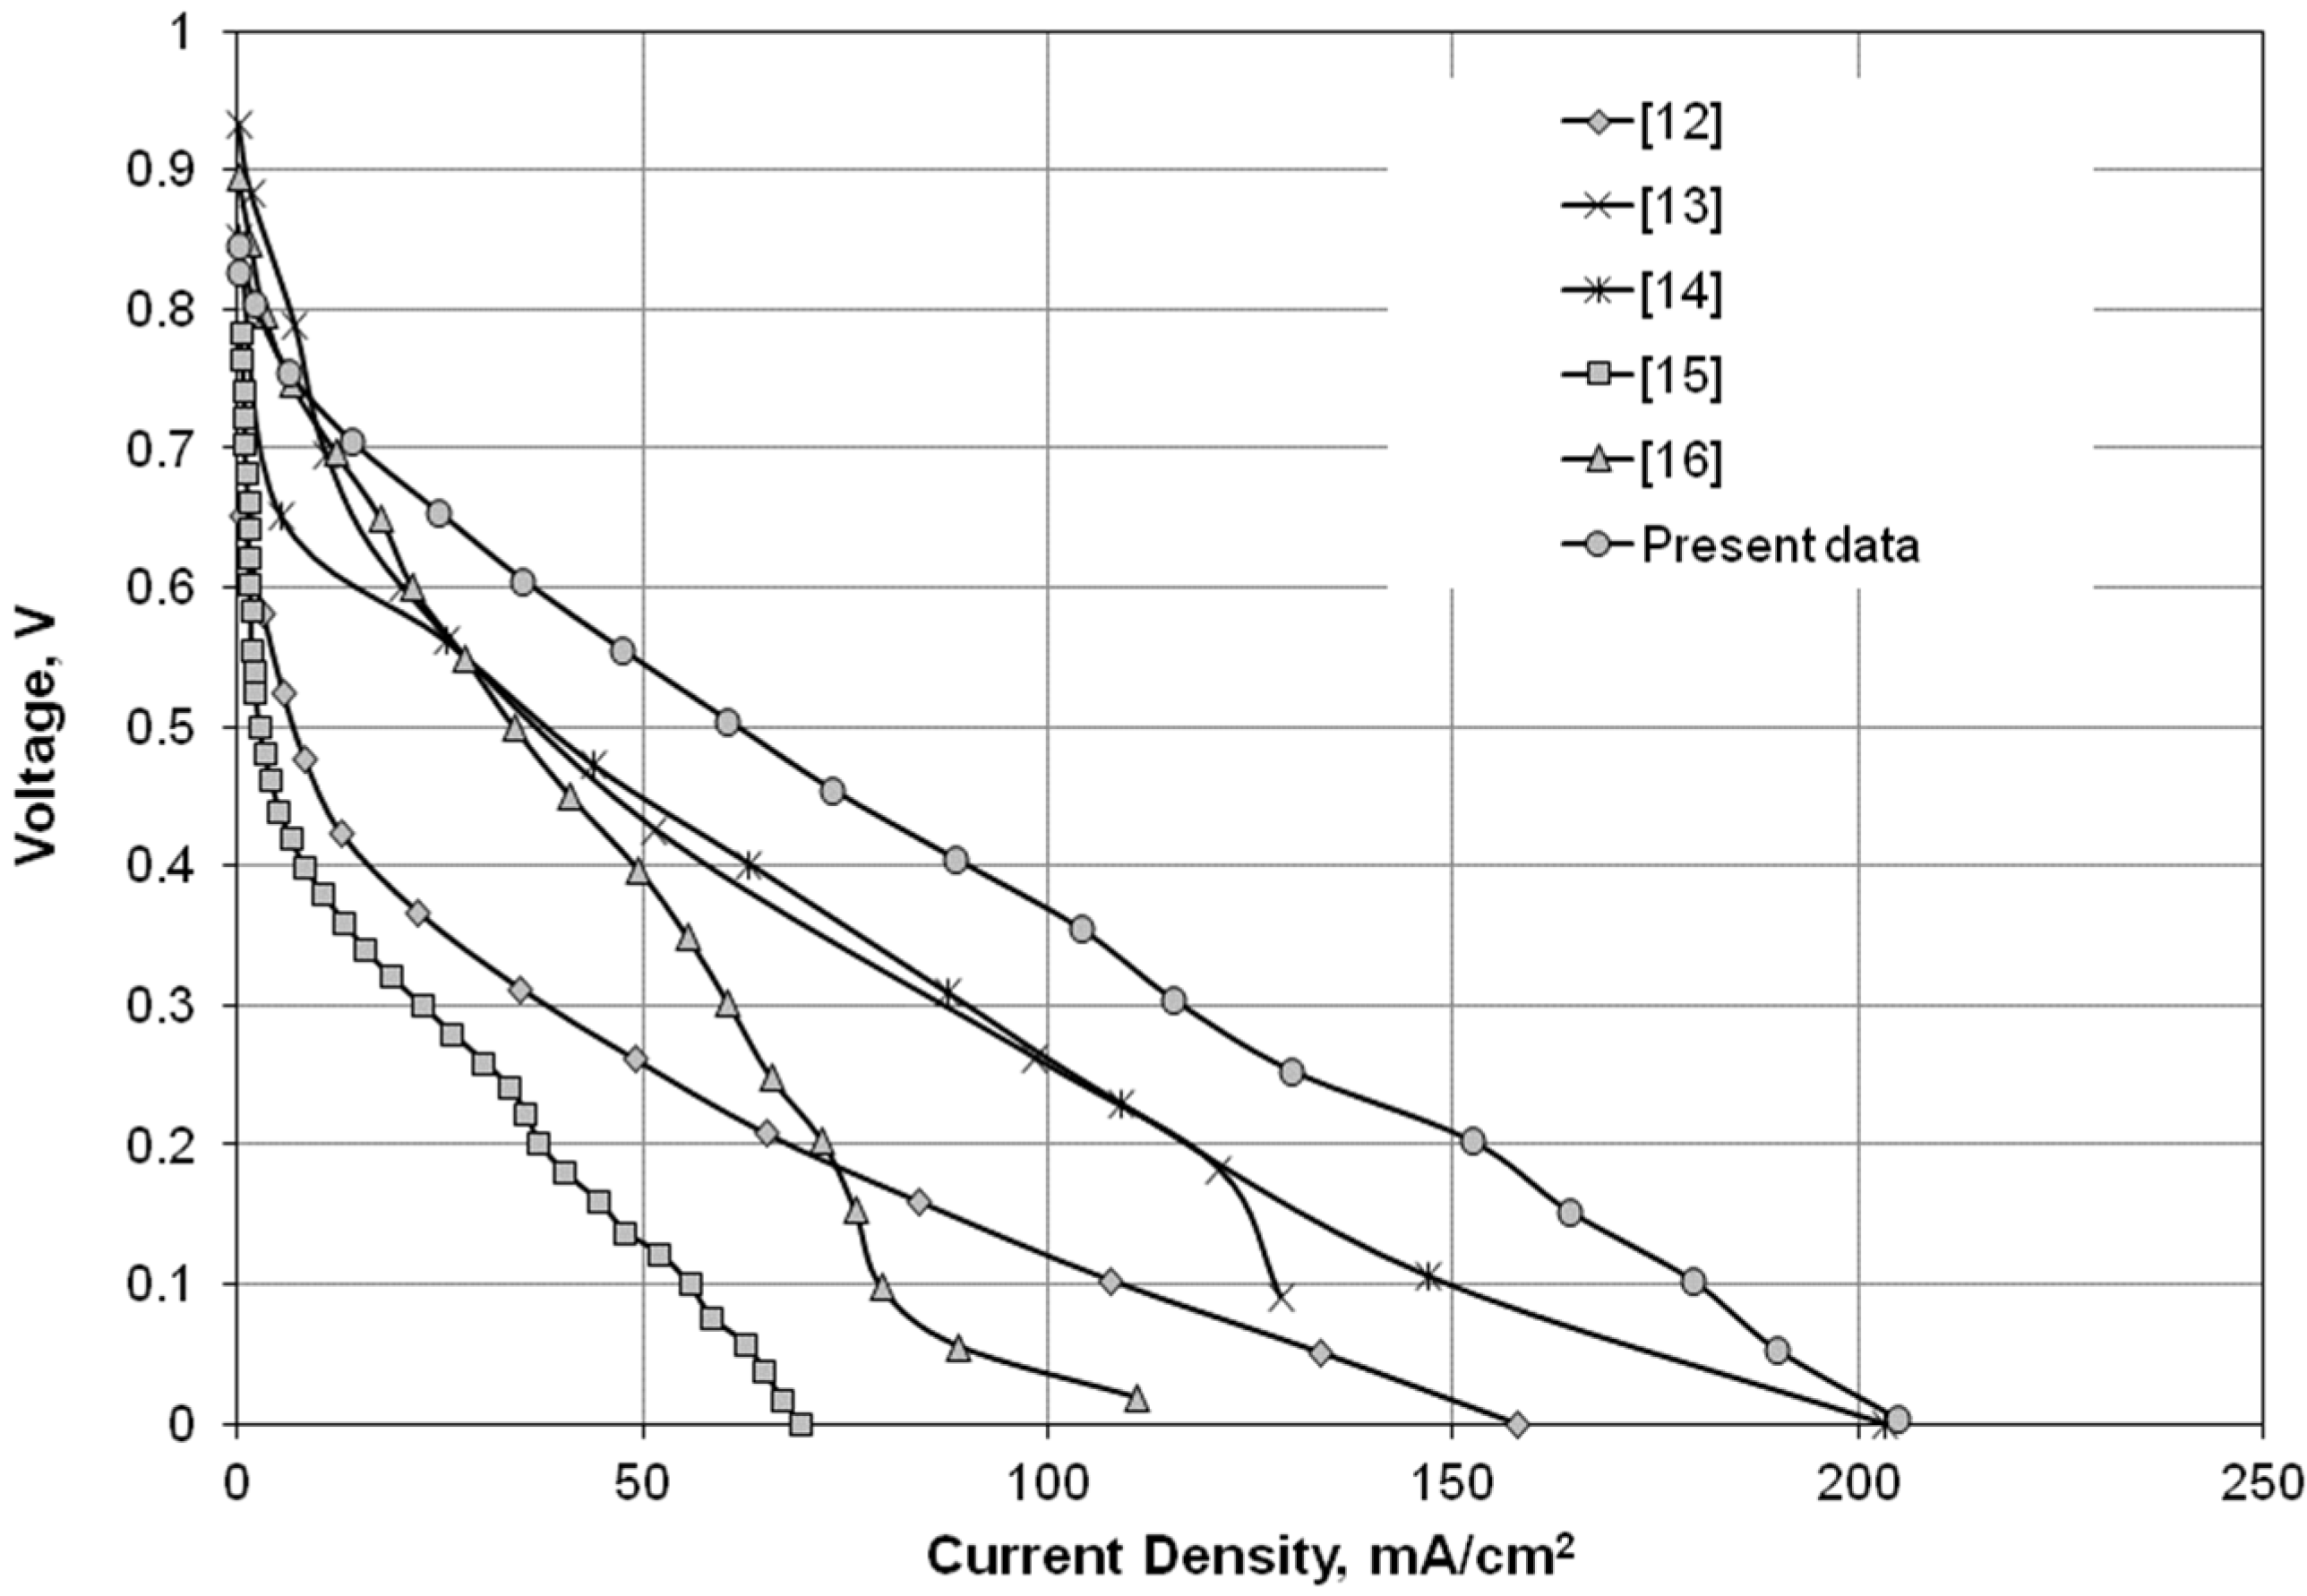
Figure 3 shows the performance comparison between the present air-breathing microfluidic fuel cell, which operated with 1.0-M HCOOH at 0.5 mL/min, and other published data that used either 1.0-M methanol or 1.0-M formic acid as fuel and had an anode catalyst loading of 8–10 mg/cm
2, akin to the present study. The results in
Figure 3 showed that the direct formic acid microfluidic fuel cell [
13,
14,
15,
16] exhibited a higher open circuit voltage (≥0.8 V) than a direct methanol microfluidic fuel cell [
12]. Additionally, the worst cell performance measured by Shaegh
et al. [
15] was likely because the anode catalyst was Pt/Ru for formic acid oxidization, instead of Pd. The highest cell output presently measured in
Figure 3 showed that both anode electrode preparation and the microfluidic fuel cell fabrication were comparable to those fuel cells published in similar field.
Figure 3.
Performance comparison of air-breathing microfluidic fuel cells between the present study (1.0-M HCOOH, 0.5 mL/min) and other published data [
12,
13,
14,
15,
16].
Figure 3.
Performance comparison of air-breathing microfluidic fuel cells between the present study (1.0-M HCOOH, 0.5 mL/min) and other published data [
12,
13,
14,
15,
16].
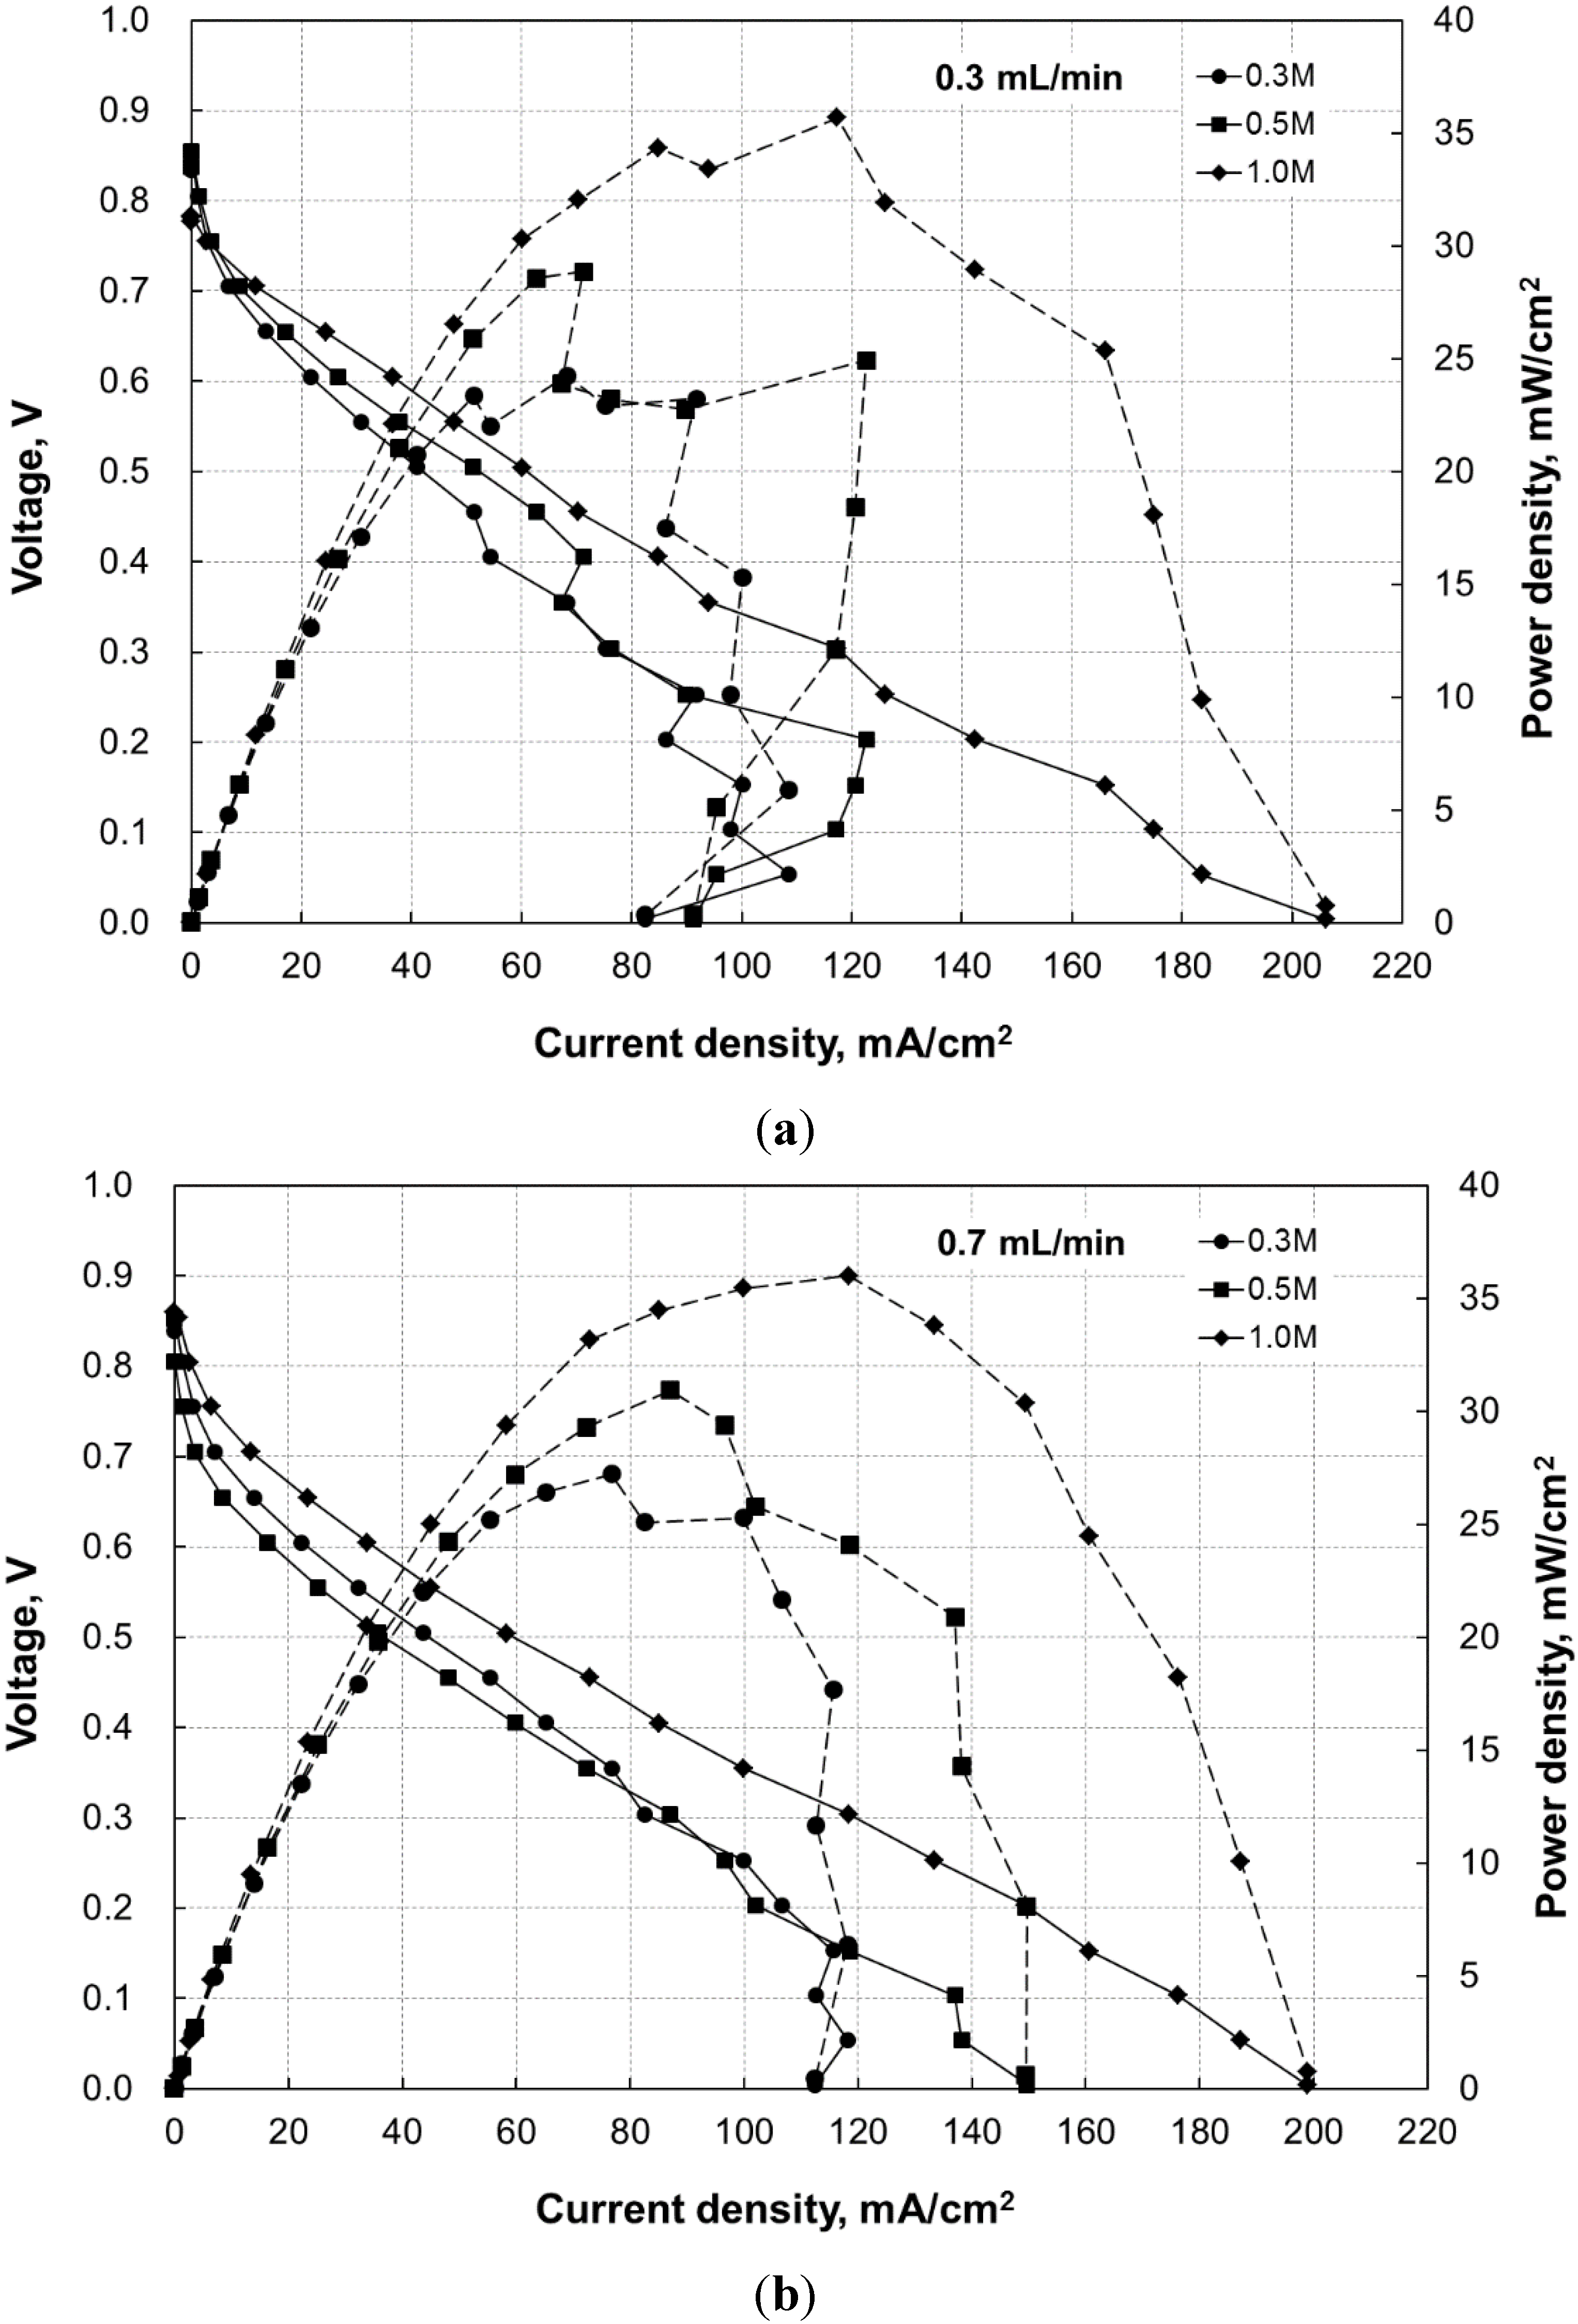
Figure 4a,b shows both the
V-
I (solid line) and
P-
I (dashed line) curves of the fuel cells operated with [HCOOH] = 0.3, 0.5 and 1.0 M at volumetric flow rates of 0.3 and 0.7 mL/min, respectively.
Figure 4a,b shows that the increase of either flow rate or formic acid concentration enhances the cell performance. Furthermore, as the fuel cell generated higher electric current,
i.e., <0.25 V, the
V-
I curves measured at a low flow rate in
Figure 4a exhibited some jumps, whereas smoother
V-
I curves were presented at a high flow rate in
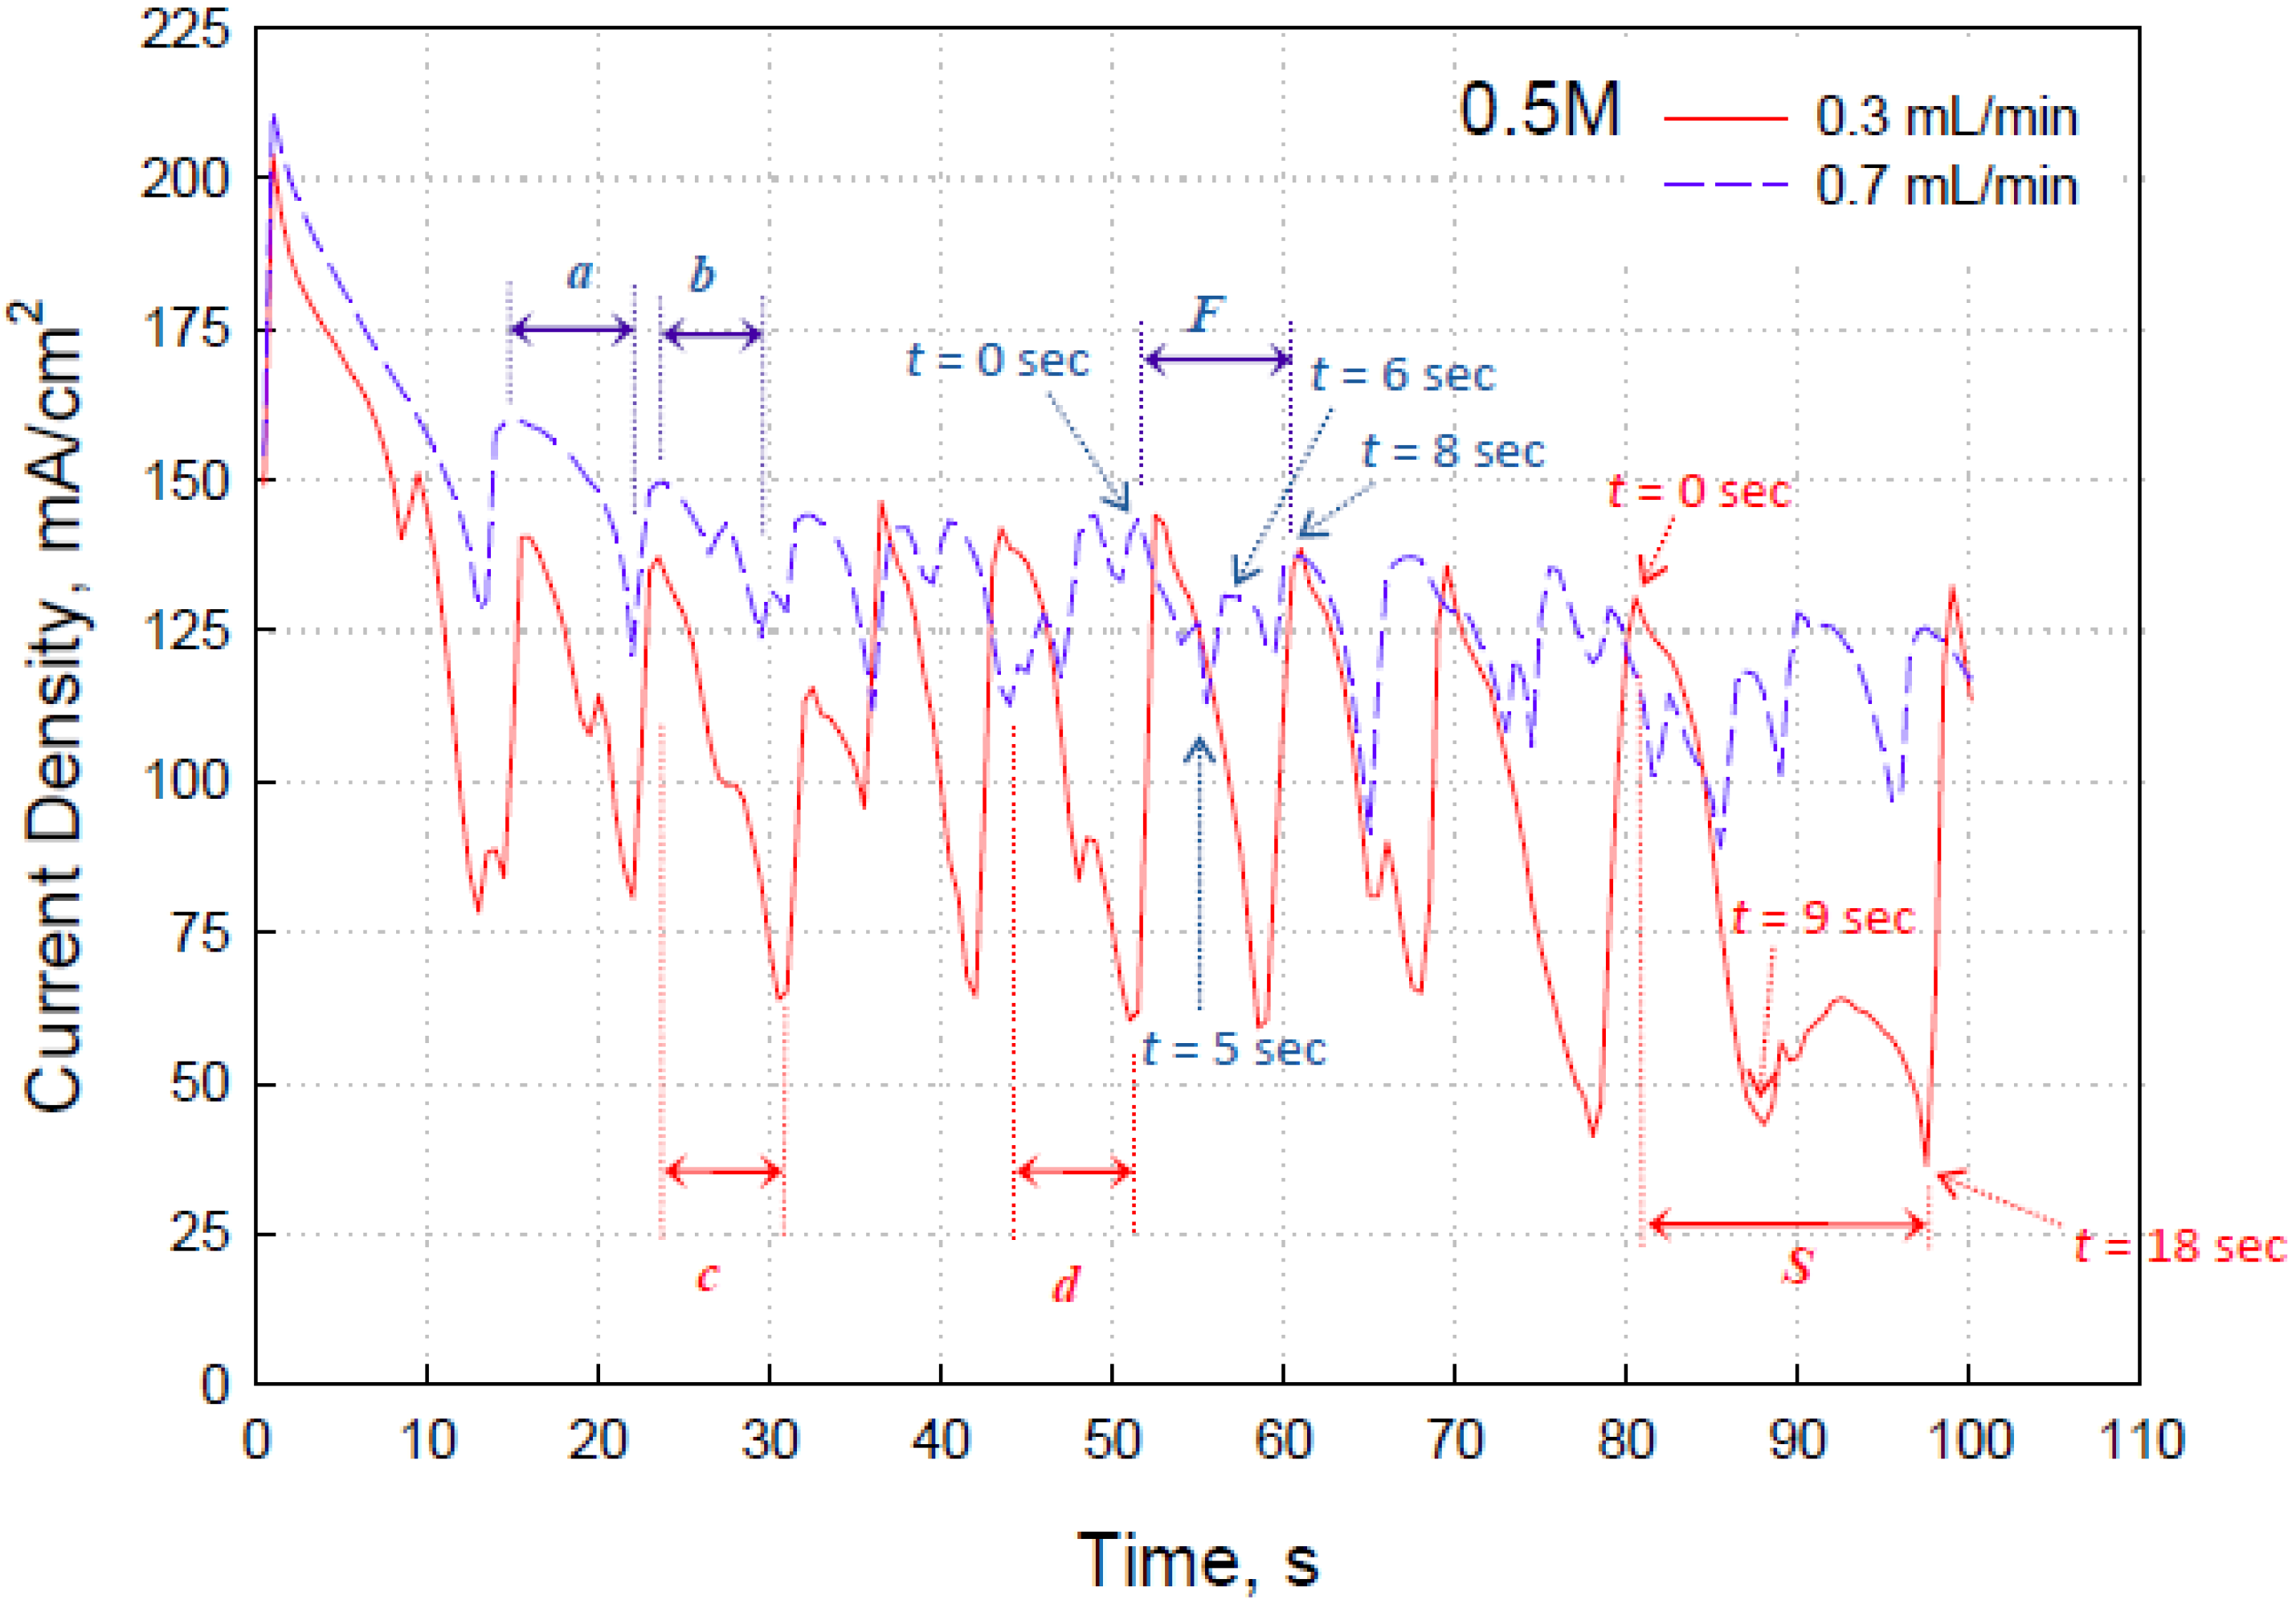
Figure 4b. The electric current recorded over a time interval of 100 s at 0.2 V in the present study shows a nearly periodic “fall-and-rise” phenomenon, as displayed by the blue and red curves in
Figure 5.
Figure 5 shows that the higher the flow rate supplied to the fuel cell, the less the current density oscillation amplitude of the fuel cell was. Besides the amplitude of the current density fluctuation within a cycle, the volumetric flow rate through the fuel cell microchannel also influenced the frequency of the current density fluctuation, as shown in
Figure 5. The waveform of each current density fluctuation, including both period and amplitude, at a given flow rate was generally similar, such as the period
a and
b at 0.7 mL/min and period
c and
d at 0.3 mL/min, as indicated in
Figure 5. However, irregular waveform sometimes occurred, as indicated by
F and
S in
Figure 5.
In order to elaborate the reason for the periodic oscillation of the current density at a constant voltage,
Figure 6 and
Figure 7 are presented to show the CO
2 bubble evolution and development on the anode surface during the period
S and
F, respectively, in
Figure 5.
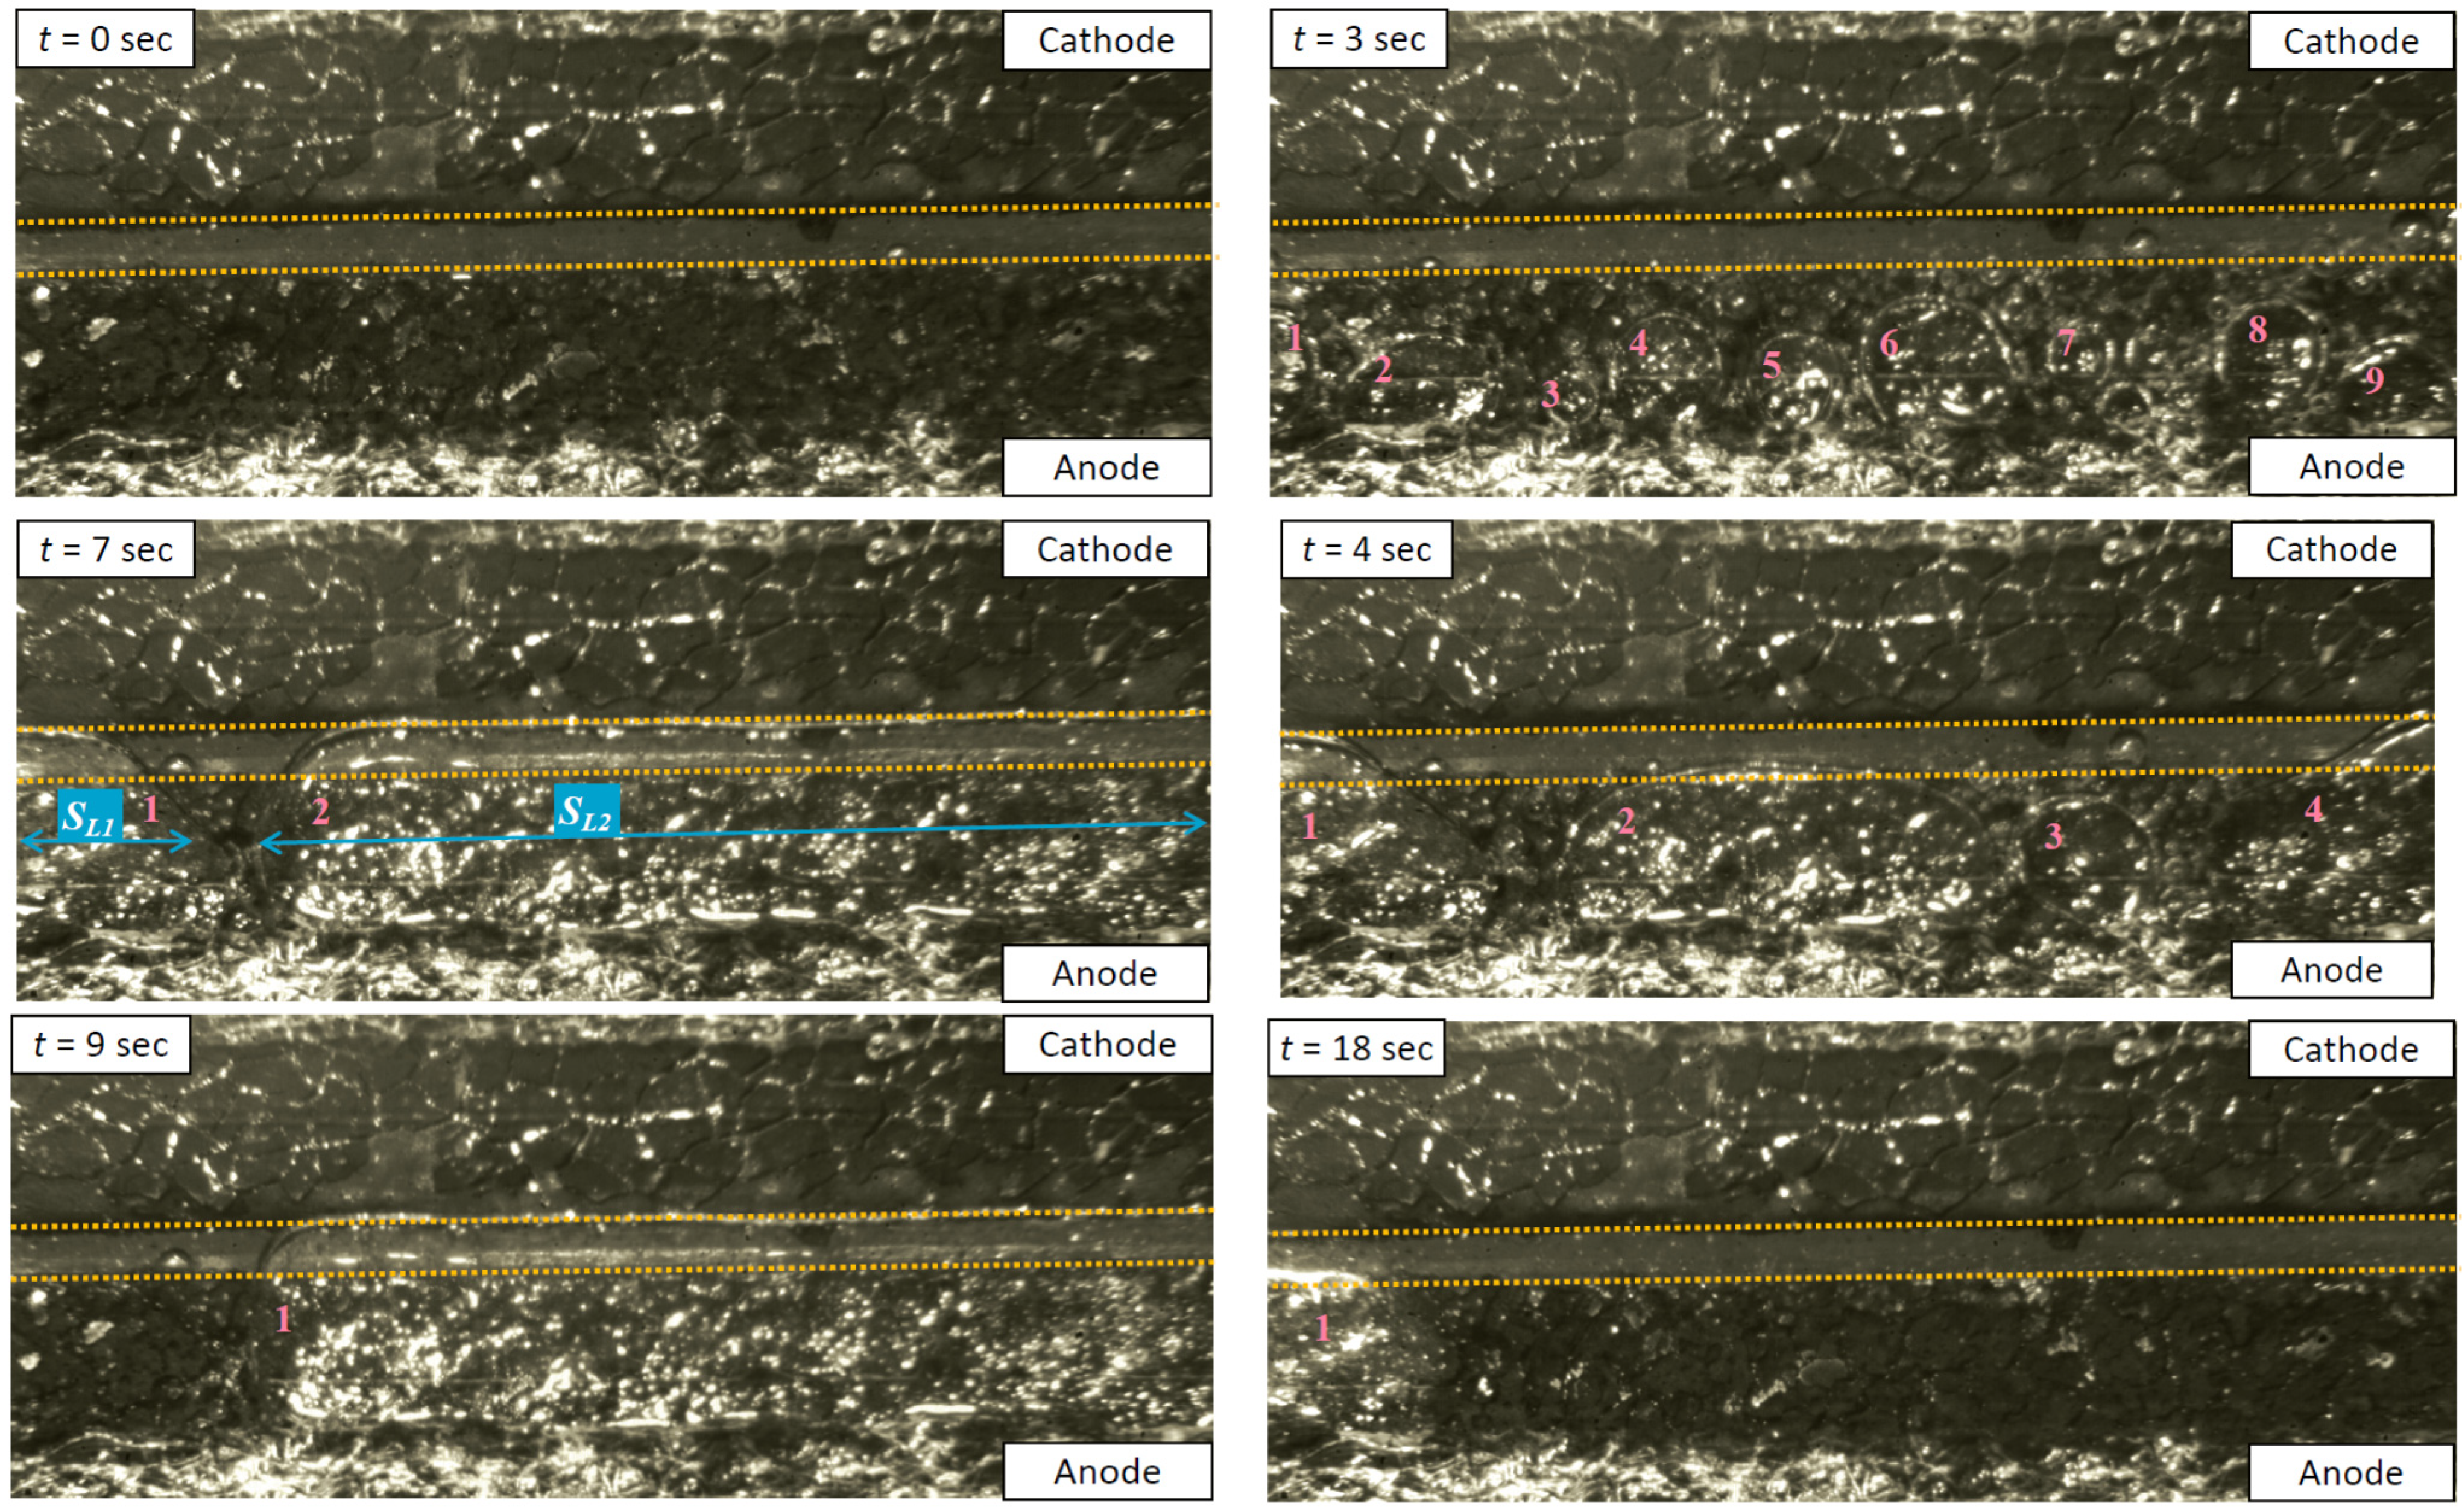
Figure 6 referred to the period
S in
Figure 5, which recorded the flow in the fuel cell operated with 0.5-M HCOOH at a volumetric flow rate of 0.3 mL/min. It shows that the anode surface is clear of CO
2 bubbles at
t = 0 s and has a maximal current density at that moment, as indicated in
Figure 5. After that, numerous gas bubbles were generated on the anode surface that were marked with numbers at
t = 3 s and then became large and elongated because of the mergence at
t = 4 s and
t = 7 s. Meanwhile, the current density in
Figure 5 continued to fall until one of the two elongated gas bubbles (#1 and #2), which almost occupied the entire anode surface in this picture, was pushed downstream and vanished in this picture at
t = 9 s. However, the other elongated CO
2 bubble slug that occupied approximately two-thirds of the anode surface slowly moved downstream until it vanished in the picture at
t = 18 s, accounting for the hill-like current density variation from
t = 9 s through
t = 18 s in
Figure 5.
Figure 4.
(a) V-I (solid line) and P-I (dashed line) curves of the fuel cell operated with [HCOOH] = 0.3, 0.5 M and 1.0 M with a volumetric flow rate of (a) 0.3 mL/min or (b) 0.7 mL/min.
Figure 4.
(a) V-I (solid line) and P-I (dashed line) curves of the fuel cell operated with [HCOOH] = 0.3, 0.5 M and 1.0 M with a volumetric flow rate of (a) 0.3 mL/min or (b) 0.7 mL/min.
Figure 5.
Current density fluctuation at 0.2 V of fuel cell during a period of time at volumetric flow of 0.3 and 0.7 mL/min with [HCOOH] = 0.5 M.
Figure 5.
Current density fluctuation at 0.2 V of fuel cell during a period of time at volumetric flow of 0.3 and 0.7 mL/min with [HCOOH] = 0.5 M.
Figure 6.
A series of bubble growth during period S in the middle section of the microchannel of the fuel cell operated with 0.5-M HCOOH at a flow rate of 0.3 mL/min. The parallel dashed lines in the pictures denote the spacing between anode and cathode and the liquid flows toward the left of the picture.
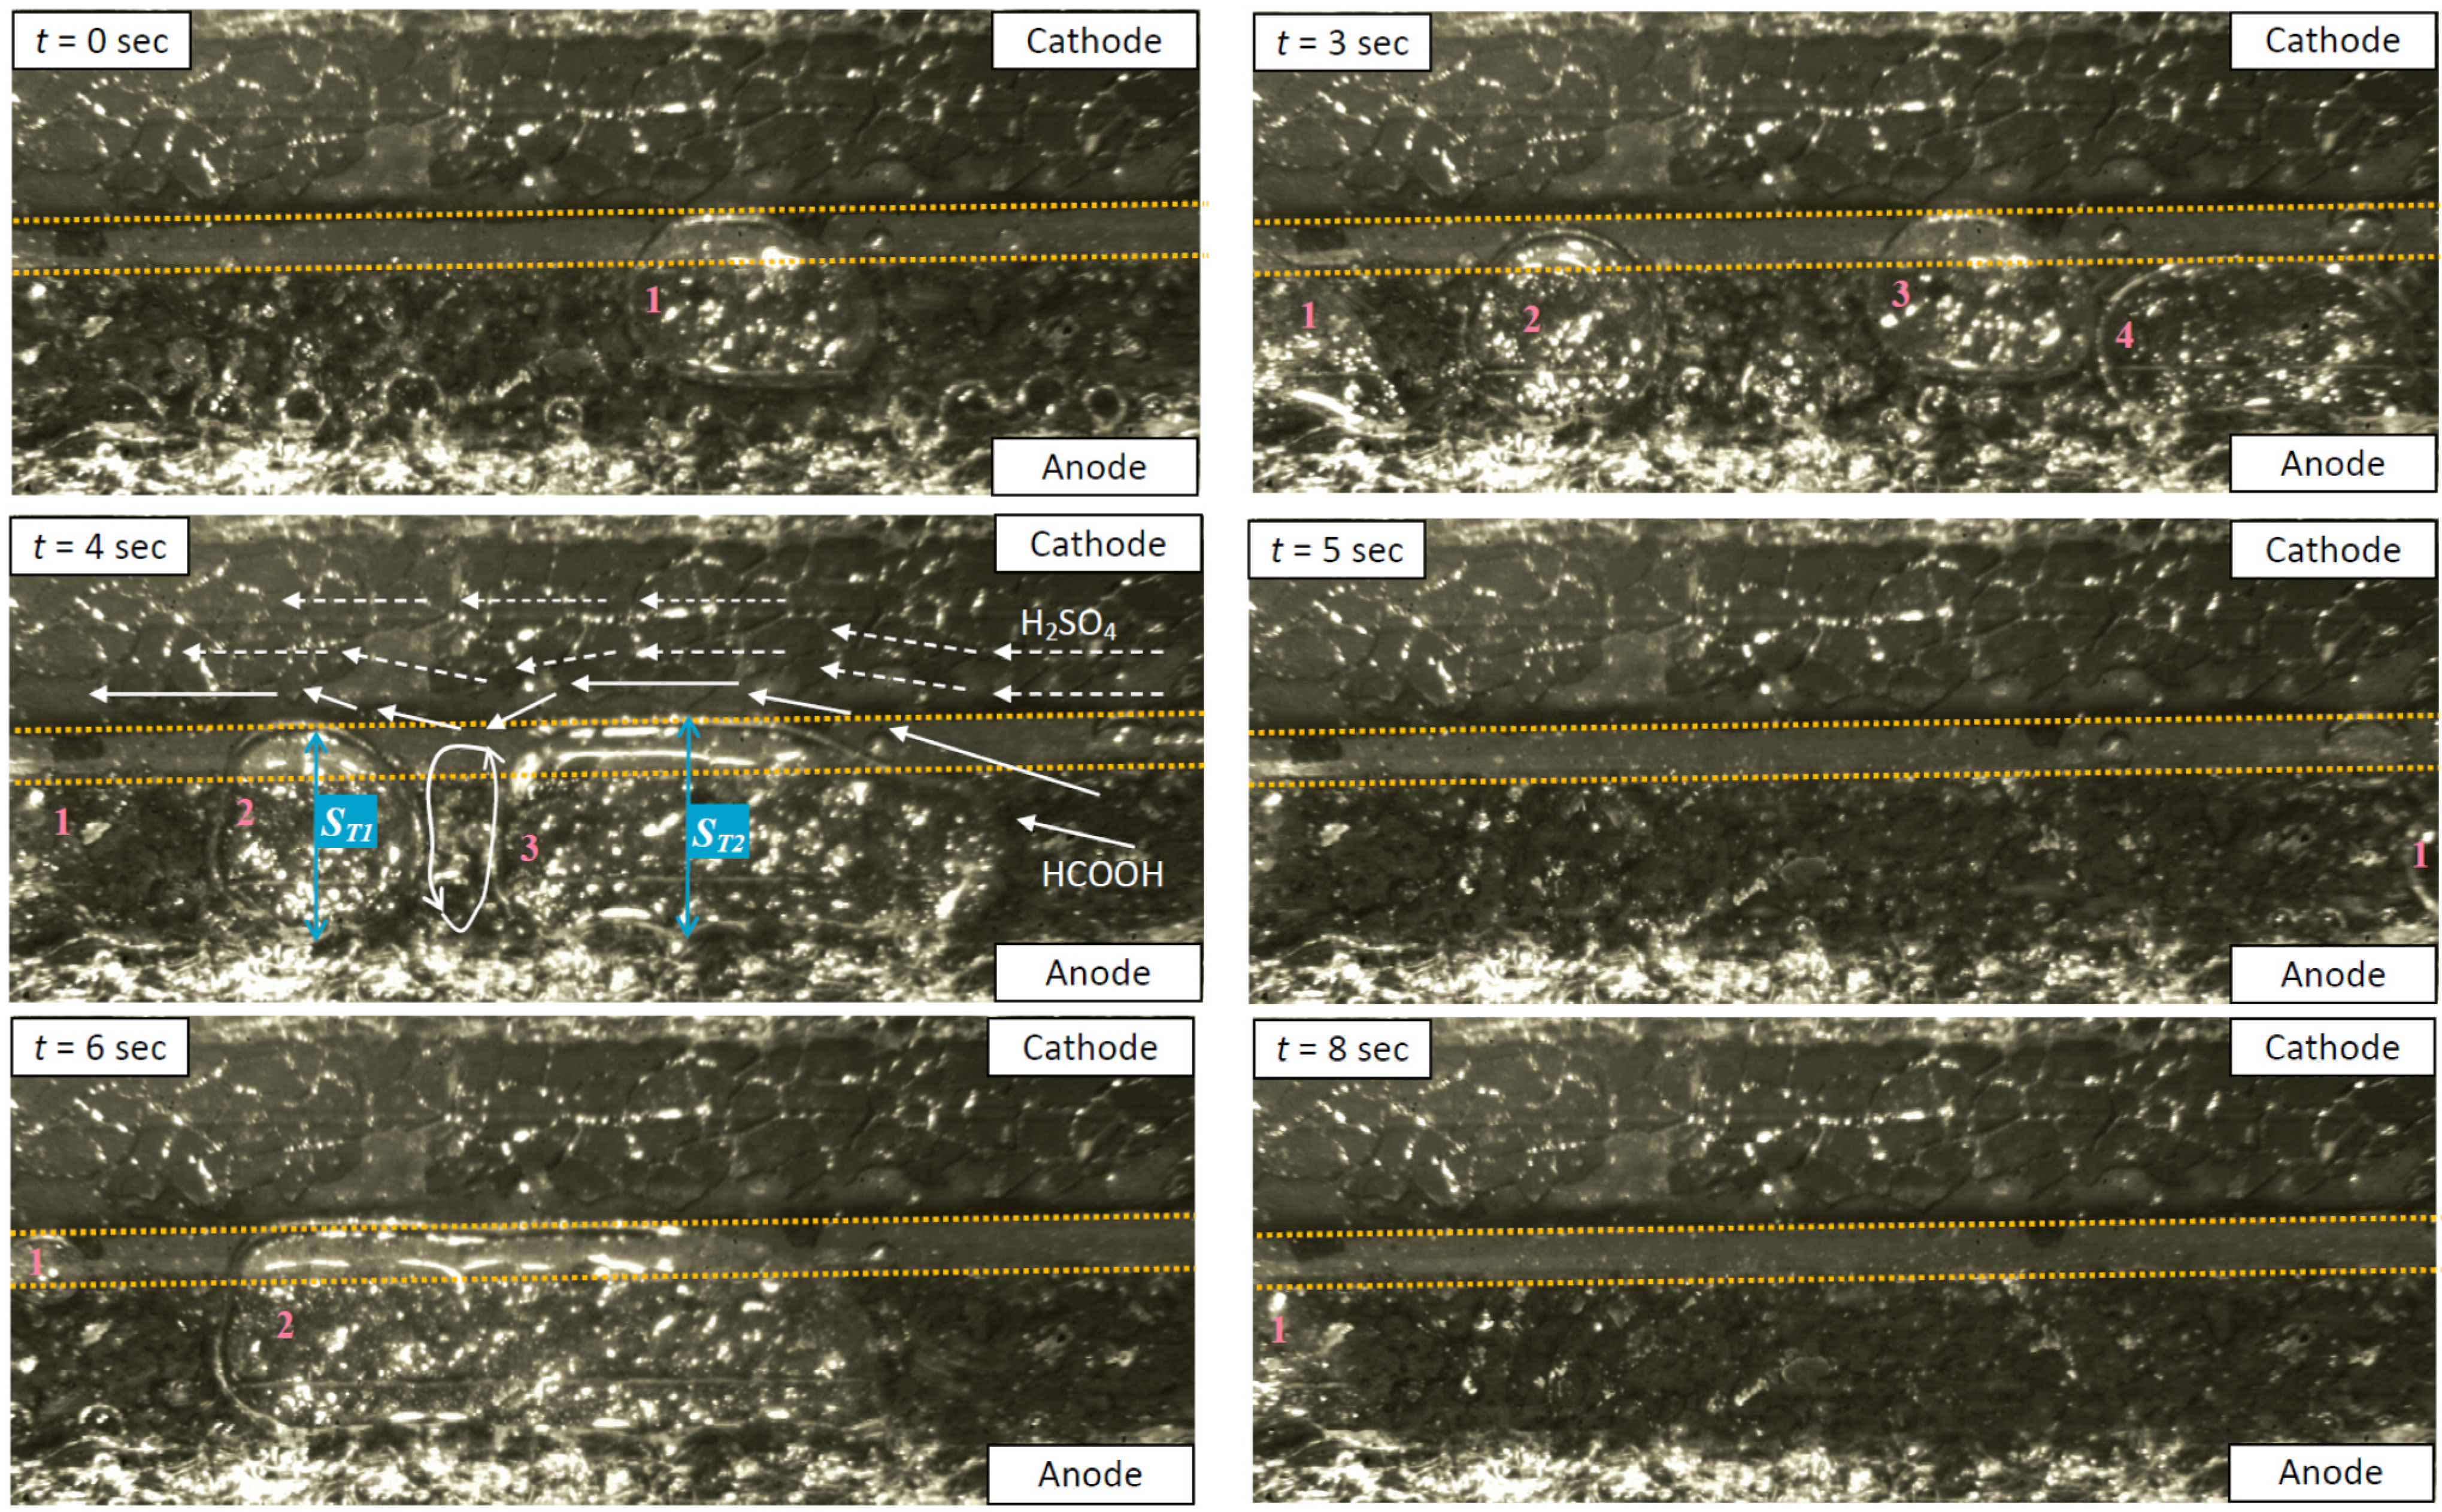
Figure 7.
A series of bubble growth during period F in the middle section of the microchannel of the fuel cell operated with 0.5-M HCOOH at a flow rate of 0.7 mL/min. The parallel dashed lines in the pictures denote the spacing between anode and cathode and the liquid flows toward the left of the picture.
Figure 7 referred to the period
F in
Figure 5 that recorded the flow in the fuel cell operated with 0.5-M HCOOH at volumetric flow rate of 0.7 mL/min. Firstly, one still gas bubble stayed on the anode surface for 3 s from
t = 0 s (#1) through
t = 3 s (#3). Subsequently, a gas bubble (#4) moved downstream and merged with the still gas bubble (#3) into one elongated gas bubble at
t = 4 s, while another gas bubble (#1) vanished in this photo. All presented gas bubbles were pushed toward the outlet at
t = 5 s, which possibly caused a shape rise in current density, indicated by
t = 5 s in
Figure 5. However, another elongated gas bubble (#2) appeared at
t = 6 s in
Figure 7, causing a drop in current density, as indicated in
Figure 5. A clear electrode surface was restored after that bubble slug was pushed downstream at
t = 8 s.
Compared to those bubbles in
Figure 7, the bubbles in
Figure 6 were sustained on the electrode for a longer time because of the lesser inertia being exerted on those bubbles with a lower flow rate. Therefore, much larger bubbles can be formed on the electrode surface, such as the elongated bubble at
t = 7 s (#2) and the bubble at
t = 9 s (#1) in
Figure 6. According to the two-phase flow observation and current recording at a constant voltage, it was found that each rise of the current density at a constant voltage reflected the fact that bubbles in the microchannel either detached from their growing sites and were discharged from the outlet, or visibly moved a little downstream and agglomerated with other bubble to become a larger one. Either situation caused formic acid to refill the electrode surface that was originally occupied by the gas bubbles and restarted the electrochemical reaction on that part of the electrode surface. On the other hand, the current density drop at a constant voltage reflected the fact that either more electrode surface was occupied by initiating and expanding gas bubbles, or the inter-diffusion zone, namely spacing between electrodes, was more severely disturbed. In fact, two characteristic dimensions of the gas bubbles on the anode electrode are possibly associated with the up-and-down current density oscillation recorded in this study. Firstly, the area occupied by anodic gas bubbles in the longitudinal direction, like
SL1 and
SL2 in
Figure 6, causes a reduction in electrode areas that should be effective for electrochemical reactions if the electrode were clear of bubble. In addition, the bubble length in the transverse direction, as in
ST1 and
ST2 in
Figure 7, crosses the electrode spacing, which may cause the inter-diffusion zone between formic acid and sulfuric acid to be disturbed and cause the cathode electrode to react with both air through the backside and formic acid on the front. An additional effect arising from the two in-line bubbles of high transverse length on the liquid flow is illustrated at
t = 4 s in
Figure 7. A circulation is likely to be presented between two elongated bubbles as the distance between them is not too far, and thus prevents fresh formic acid from refilling.
Therefore, the amplitude of each electric current drop in
Figure 5 can be attributed to how much electrode area was cleared because of the bubbles’ movement, while the slope of each electric current drop in
Figure 5 depended on how fast the electrode surface was occupied by the growing bubbles.
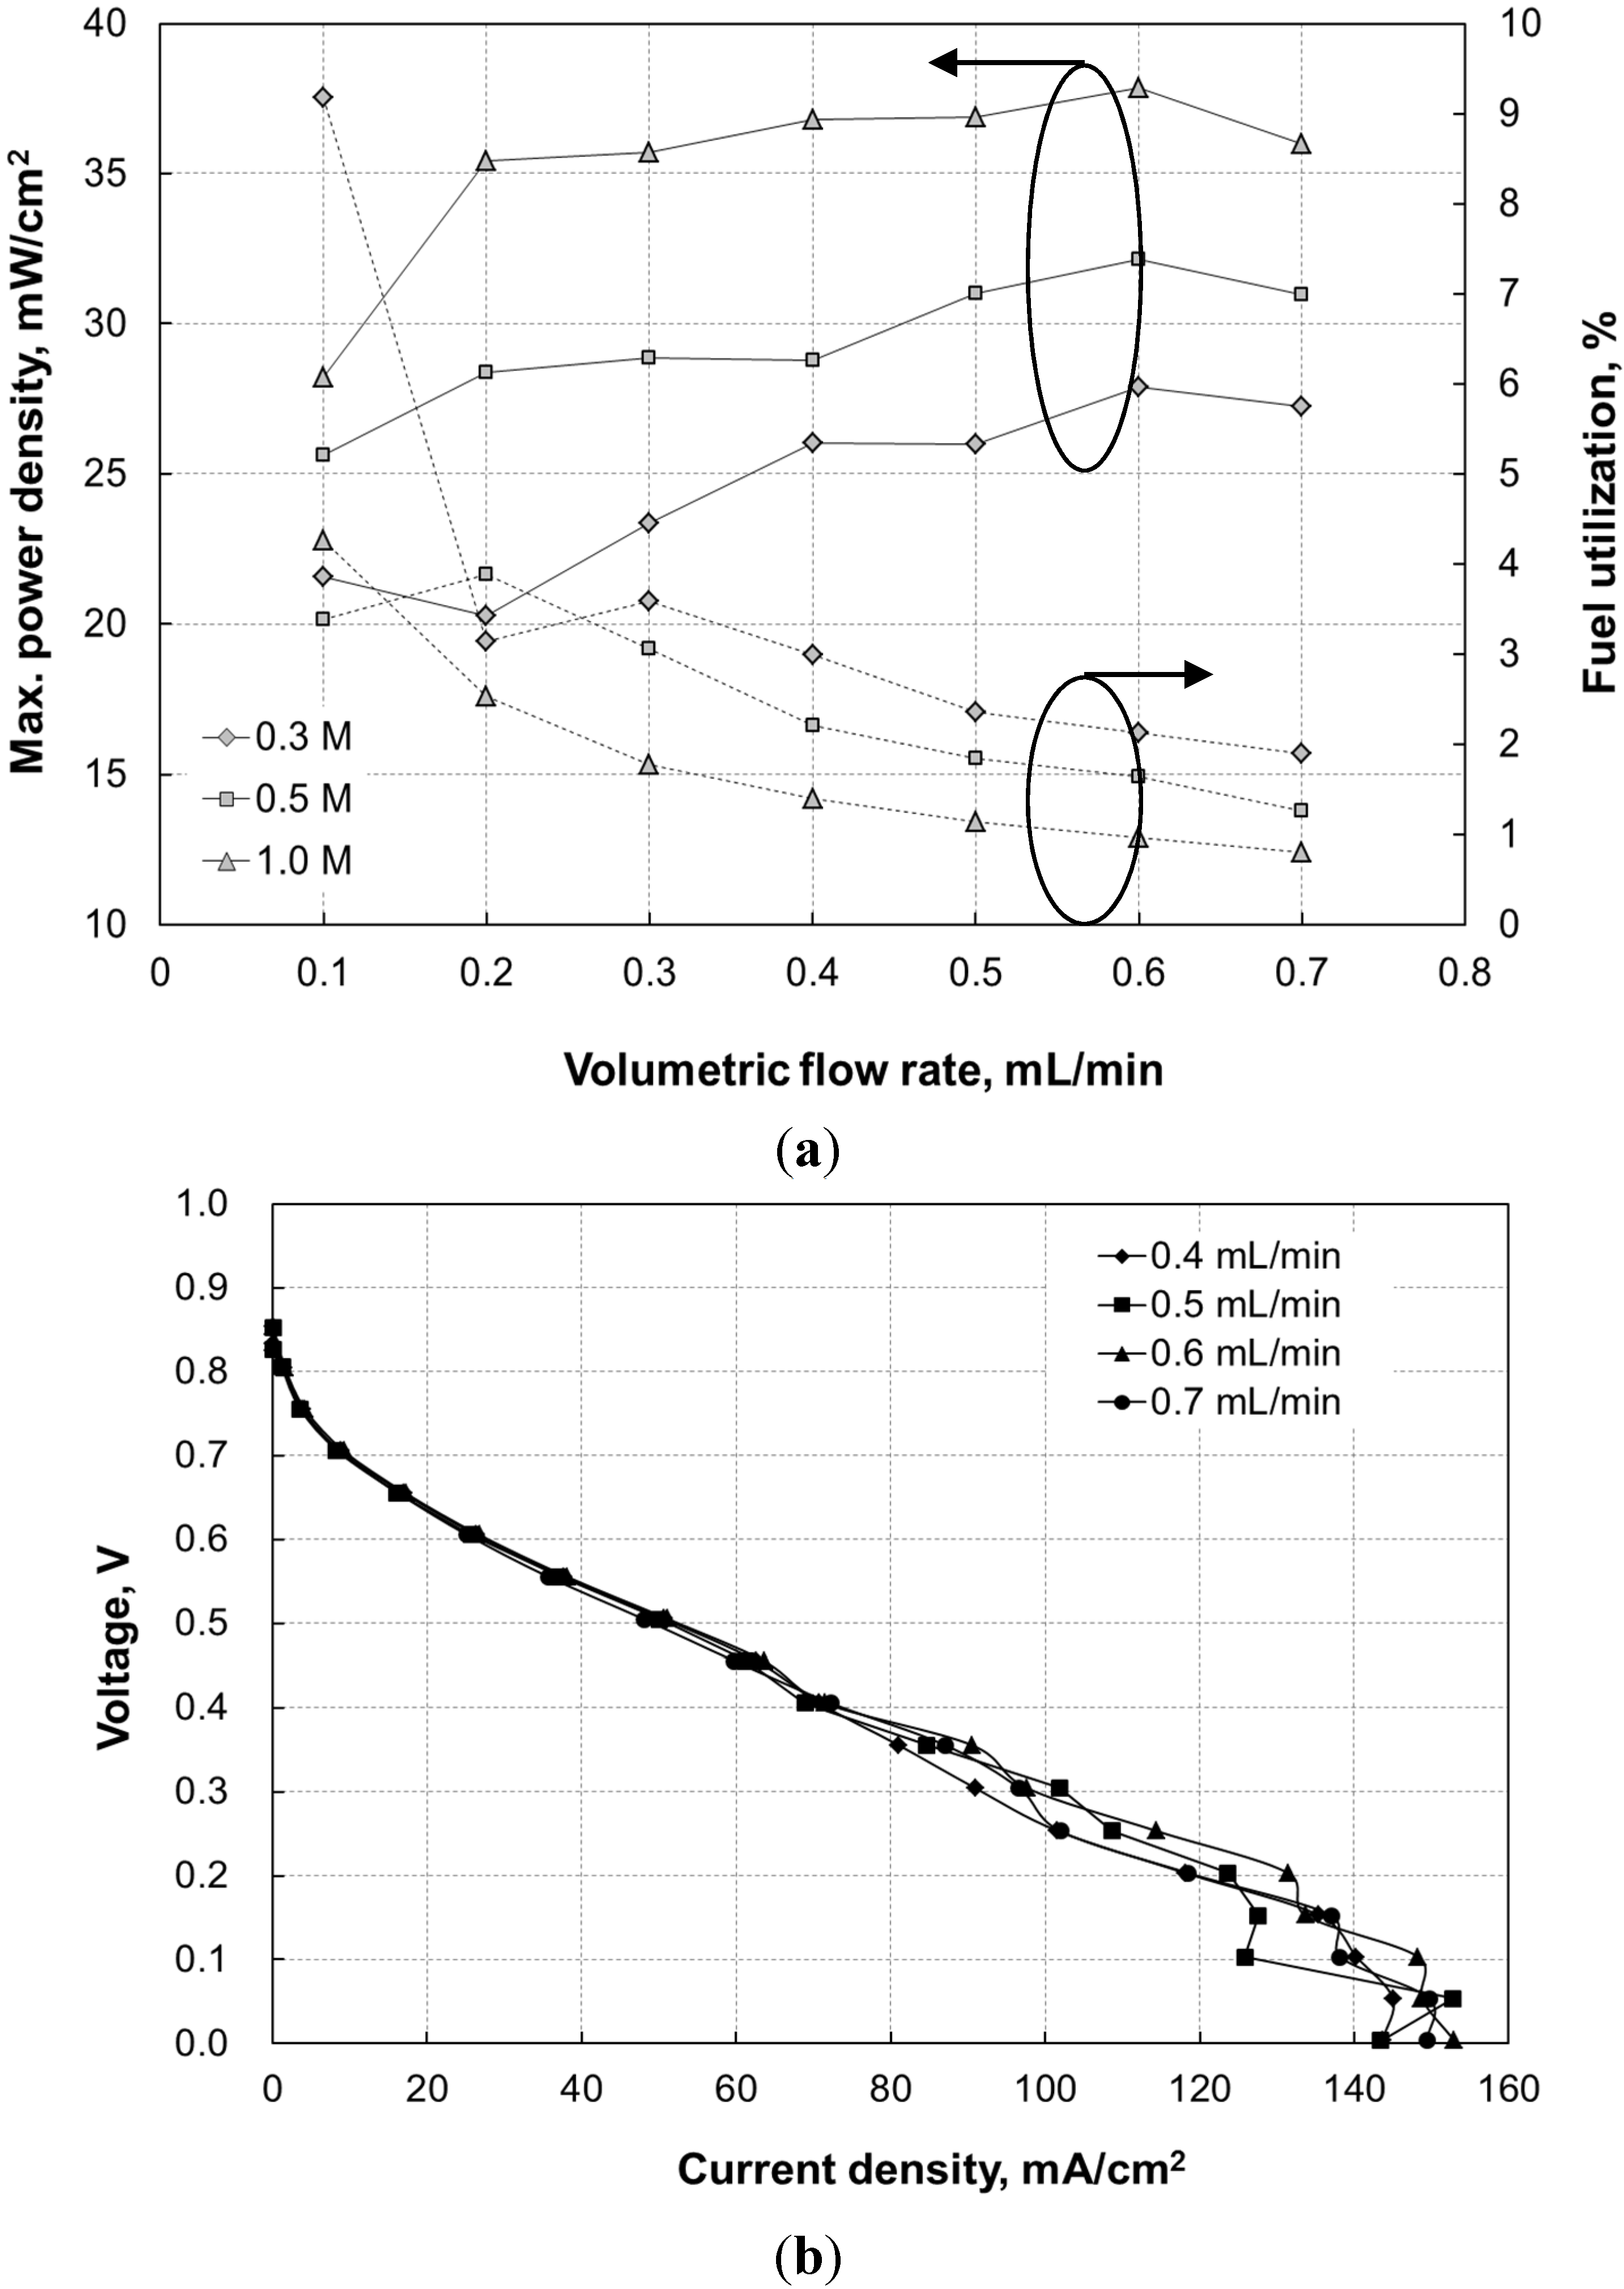
Figure 8a shows the maximum power density and the formic acid utilization at 0.2 V of the microfluidic fuel cell at various flow rates and formic acid concentrations. The fuel utilization is estimated as follows [
17]:
where
J is the current generated by the fuel cell at 0.2 V,
qf represents the rate at which fuel is supplied to the fuel cell with unit of mol/s,
F is the Faraday constant, and
n is the number of released electrons per formic acid molecule.
It can be observed that, regardless of the concentration, the maximum power density (the solid curves) increased as the flow rate increased, until it peaked at a volumetric flow rate of 0.6 mL/min. Subsequently, it began to decline as the flow rate further increased to 0.7 mL/min. However, the fuel utilization (the dashed curves) for each HCOOH concentration reduced as the flow rate increased. Although the cell current output of the present microfluidic fuel cell was relatively high, as shown in
Figure 3, the fuel utilization was rather low because of the short length—20 mm—of the single-pass microchannel, and relatively high flow rates (≥6 mL/h). In contrast to the fuel utilization in [
10], which was 8%, the fuel utilization of the present microfluidic fuel cell with 1-M formic acid at a flow rate of 0.3 mL/min with a similar Pd loading and less Pt loading than the microfluidic fuel cell [
10], was 1.8%. A long channel,
i.e., 40 mm, was also the way to let the air-breathing microfluidic fuel cell proposed by Zhu
et al. [
7] have a peak power density of 21.5 mW/cm
3 and a rather high fuel utilization of approximately 14%, at a flow rate of 0.3 mL/min with formic acid concentration of 0.5 M. In addition, the results in [
7] also revealed that the fuel utilization significantly reduced as the flow rate increased from 1 mL/h to 10 mL/h. Therefore, the present microfluidic fuel cell would have a fuel utilization higher than 4%, which was the fuel utilization at 0.1 mL/min with 1-M formic acid, as shown in
Figure 8a, if the channel of the microfluidic fuel cell had been lengthened at the expense of a lower peak power density. All
V-
I curves of the 0.5-M-HCOOH microfluidic fuel cell that were measured at flow rates ranging from 0.4 mL/min to 0.7 mL/min in
Figure 8b seem to have a concentration overpotential effect in low voltage regions (≤0.2 V). Because the maximum power density of the microfluidic fuel cell always occurred at a voltage between 0.4 V and 0.3 V, the faster drop in
V-I curve at 0.7 mL/min than at 0.5 mL/min and 0.6 mL/min at 0.35 V in
Figure 8b caused a lower maximum power density.
Figure 8.
(a) Maximum power density (solid curves) and fuel utilization (dashed curves) of the microfluidic fuel cell at a formic acid concentration of 0.3 M, 0.5 M, and 1.0 M at various volumetric flow rates; and (b) the V-I curves of microfluidic fuel cell operated at [HCOOH] = 0.5 M and at a flow rate ranging from 0.4 mL/min to 0.7 mL/min.
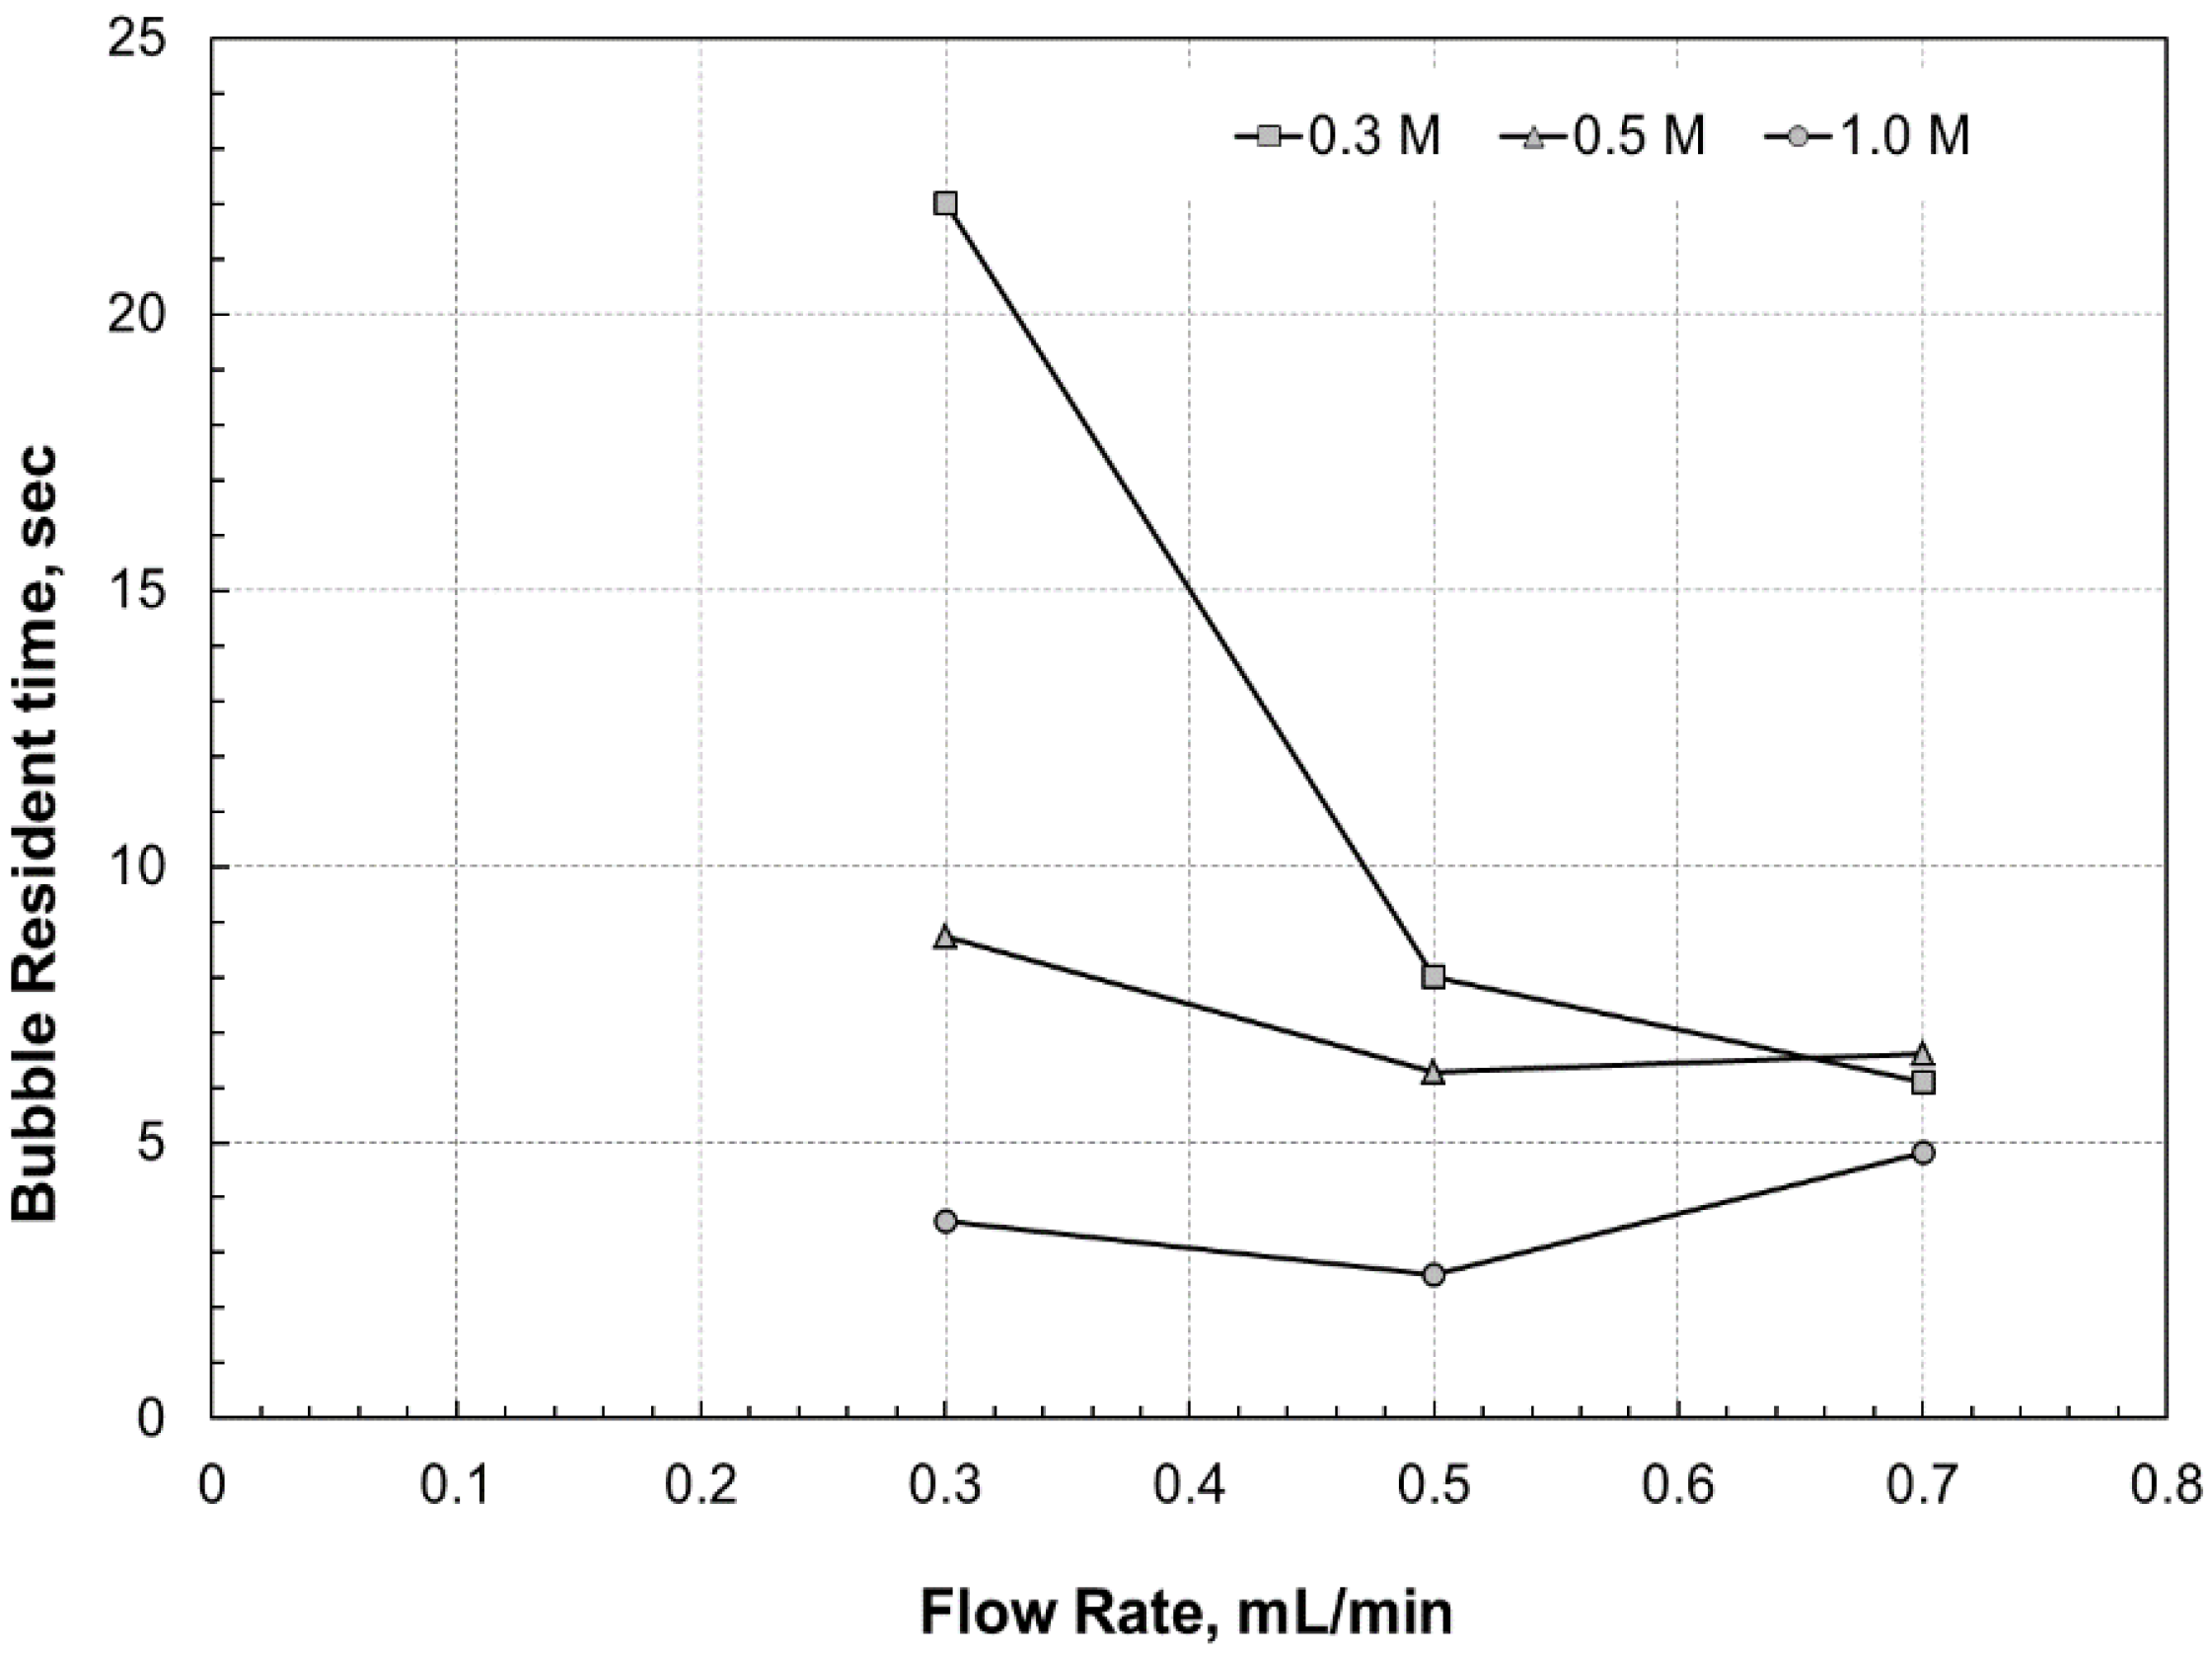
In order to explain the reason for the faster drop in the
V-
I curve of the microfluidic fuel cell that operated at 0.7 mL/min at approximately 0.35 V, the resident time of the bubble that was evolved on the monitored electrode surface of the microfluidic fuel cell with [HCOOH] = 0.5 M was discussed in
Figure 9. This shows that the bubble resident time in the microfluidic fuel cell that was operated at 0.3, 0.5, and 0.7 mL/min with various formic acid concentrations becomes longer at 0.7 mL/min at a concentration of 0.5 M and 1.0 M. The longer bubble resident time at 0.7 mL/min could be because the pattern of the bubbles presented on the electrode was different from that at a flow rate of 0.5 mL/min or 0.6 mL/min. Since the flow rate was so high that large or elongated bubbles could not remain in the microchannel, numerous small bubbles were likely to scatter over the entire anode surface in the microfluidic fuel cell at 0.7 mL/min. However, under such circumstances, the path of the formic acid flow would be winding and would cause the anode flow to touch the cathode, as is the case in
Figure 7. This reduced the current output of the fuel cell, and thus resulted in both a lower bubble growth rate due to the lower current output [
18] and a longer bubble resident time. In addition, the bubble would also grow very slowly in the microfluidic fuel cell with a formic acid concentration of 0.3 M at a flow rate of 0.3 mL/min because of the inferior cell performance, as shown in
Figure 8a. Consequently, the bubbles were able to stick on the anode surface for a long time, until the CO
2 bubble on the electrode was large enough to be moved by the liquid flow. However, as the flow rate increased, the performance of the microfluidic fuel cell fed with 0.3-M formic acid increased, causing a faster bubble growth, while the CO
2 bubbles that could stick on the electrode surface would be smaller than those bubbles presented at 0.3 mL/min. Therefore, it might be likely to cause a different bubble pattern on the anode surface and a significant drop in the bubble resident time from 0.3 mL/min to 0.5 mL/min, as shown in
Figure 9. However, since the power density of the microfluidic fuel cell fed with 0.5-M and 1.0-M formic acid at a flow rate of 0.3 mL/min was so high that the characteristic of those CO
2 bubbles, such as the bubble growth, bubble size, and bubble distribution, on the electrode would not undergo a significant change as the flow rate increased to 0.5 mL/min. Therefore, the bubble resident time would not dramatically reduce as the flow rate increased.
Figure 9.
The bubble resident time vs. flow rate at a formic concentration at 0.3 M, 0.5 M, and 1.0 M.
Figure 9.
The bubble resident time vs. flow rate at a formic concentration at 0.3 M, 0.5 M, and 1.0 M.


 ,
, 
