Article

Energetic and Exergetic Analysis of Combined Cycle Power Plant: Part-1 Operation and Performance

by
Abdulrahman Almutairi
1,*,
Pericles Pilidis
1 and
Nawaf Al-Mutawa
2
1
Power and Propulsion Department, School of Aerospace, Transport and Manufacturing, Cranfield University, Cranfield, Bedfordshire MK43 0AL, UK
2
Mechanical Engineering Department, College of Engineering and Petroleum, Kuwait University, Al Asimah, P.O. Box 5969 Safat 13060, Khalidiya 72301, Kuwait
*
Author to whom correspondence should be addressed.
Energies 2015, 8(12), 14118-14135; https://doi.org/10.3390/en81212418
Submission received: 12 August 2015 / Revised: 4 November 2015 / Accepted: 9 December 2015 / Published: 14 December 2015

Abstract

:
Energetic and exergetic analyses are conducted using operating data for Sabiya, a combined cycle power plant (CCPP) with an advanced triple pressure reheat heat recovery steam generator (HRSG). Furthermore, a sensitivity analysis is carried out on the HRSG using a recent approach to differentiate between the sources of irreversibility. The proposed system was modelled using the IPSEpro software and further validated by the manufacturer’s data. The performance of the Sabiya CCPP was examined for different climatic conditions, pressure ratios, pinch point temperatures, high-pressure steam, and condenser pressure values. The results confirmed that 60.9% of the total exergy destruction occurs in the combustion chamber, which constitutes the main source of irreversibilities within a system. The exergy destruction was significantly affected by both the pressure ratio and the high-pressure steam, where the relation between them was seen to be inversely proportional. The high-pressure stage contributes about 50% of the exergy destruction within the HRSG compared to other stages and the reheat system, due to the high temperature difference between the streams and the large number of components, which leads to high energy loss to the surroundings. Numerous possibilities for improving the CCPP’s performance are introduced, based on the obtained results.

1. Introduction

Power systems diagnosis is conducted, using thermal analysis tools, to determine the locations, magnitudes, and types of waste and losses within these systems. Identifying the sizes and locations of the deficiencies will assist in making modifications to improve the system. The primary analysis and assessment tools used in optimising the thermal energy systems are energy and exergy analyses [1,2]. Thermal energy systems have long been analysed and evaluated using energy tools; however, in the last two decades, exergy analysis has been increasingly used to evaluate and optimise the thermal system designs, for more efficient usage of energy resources. Currently, many researchers perform exergy and energy analysis simultaneously, to increase the value of the research, and provide a complete illustration of energy system characteristics.
Energy analysis, based on the first law of thermodynamics, cannot provide sufficient information about the degradation of energy during a process, or the quality of the various forms of energy. These limitations have been overcome by exergetic analysis, which is based on both the first and second law of thermodynamics. Exergy analysis allows the identification of irreversibility sources, or the inefficiencies in a thermal power system, to be revealed. Exergy within a thermal process is constantly consumed due to irreversibilities [2]. As energy analysis is unable to determine the irreversibilities within a thermal system, this successfully demonstrates the importance of exergy analysis, which allows for, and increases, the possibility of enhancing thermal systems, by using different modifications, to reduce the irreversibilities resulted from entropy generation [3,4].
In the current work, a CCPP, with triple pressure HRSG system, was investigated, due to their high energy conversion efficiency, which is necessary in order to delay the depletion of non-renewable resources, by reducing fossil fuel consumption, through utilising and recovering part of the waste energy from a gas turbine engine. From an environmental perspective, it reduces greenhouse gas emissions, and, thus, the changes in the climate decrease significantly. The environment is significantly affected by inefficiencies within the power system.
Many researchers, such as Kotas [5], Facchini et al. [6], Moran et al. [7], Rahim [8,9], Ersayin and Ozgener [10], Ameri et al. [11], Deng-Chern and Chuang [12] and Petrakopoulou et al. [13] have carried out exergy analyses on combined cycles power plants. Although numerous studies are available in the literature for CCPP, nevertheless none have explored a triple pressure reheat HRSG using a real set of data based on exergy analysis.
The aims of the present study are to analyse a very advanced CCPP, with a triple pressure reheat HRSG, using actual operating data from an energetic and exergetic perspective, which has not previously been considered in literature. Furthermore, the study aims to investigate an HRSG’s performance, using recent methods, in order to distinguish between the sources of irreversibilities. Finally, in the context of the results, the study will introduce certain suggestions in order to improve plant performance.

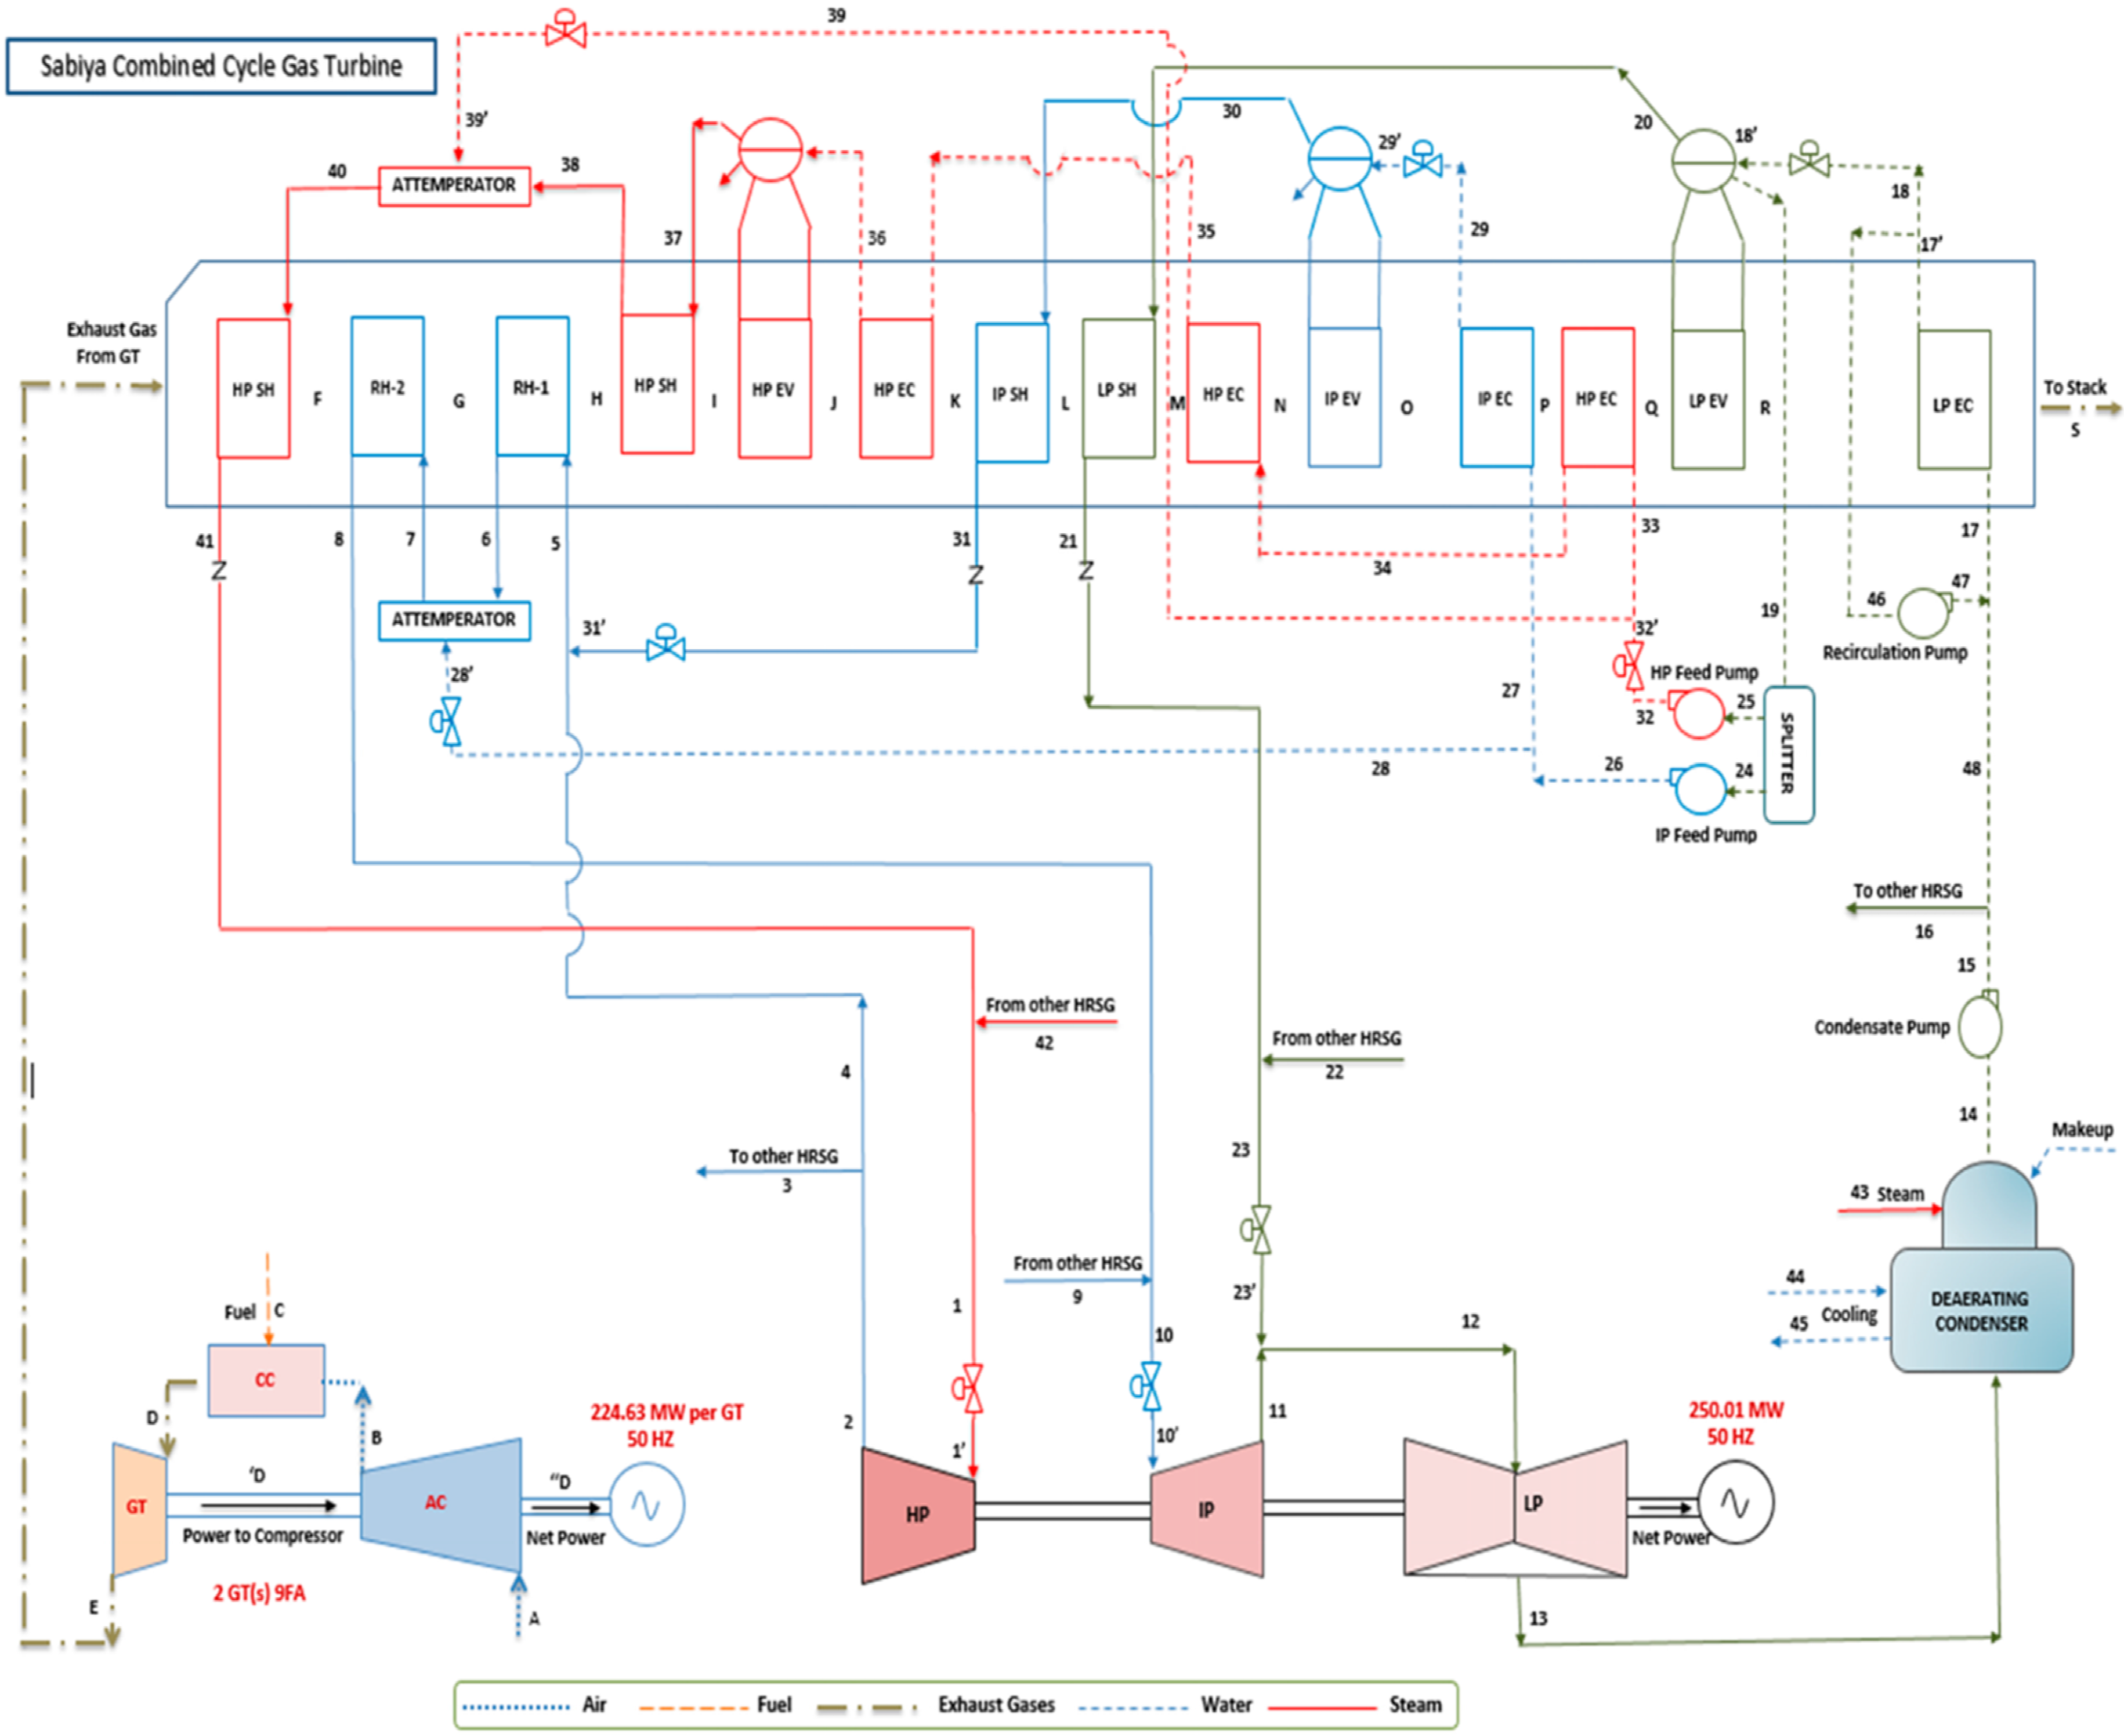
2. Sabiya Power Plant Specification

The Sabiya CCPP consists of three blocks. Each containing two GE gas turbine frame 9FAs, with two triple pressure reheat HRSGs, and one steam turbine. A typical block is illustrated in Figure 1. The plant’s power output and efficiency is more than 2000 MW at local conditions, and 54.5%, respectively.
The exhaust gases’ stream passes through 14 heat exchangers in each HRSG before it reaches the stack. The pressure and a temperature at the exit of stack are 101.325 kPa and 107 °C respectively. In the steam cycles there are three levels of steam pressures on each evaporator. Which are at 131.8, 28.78, and 5.208 bars. The steam inlet temperatures for the high pressure (HP) and intermediate pressure (IP) steam turbine are equal to 565 °C. They are identical and this is a consequence of the reheat effect. As seen in Figure 1, there are two high pressure superheaters (HP SH) as well as two reheaters (RH-1&2). Between both the two superheaters and reheaters there are two attemperators, which help to adjust the steam temperature. The intermediate pressure steam stream exits from the superheater (IP SH) and mixes with the reheat stream, before entering reheater-1. The low pressure superheater (LP SH) before entering the (LP) low pressure steam turbine mixes with the exit stream coming from the intermediate steam turbine. The low pressure stream expands to 0.1 bar, before entering the deaerating condenser, which is the more preferable equipment in the combined cycle power plant, rather than the separating one, due to its smaller size, which saves equipment space and is easy to deaerate makeup water. The steam condensate is then directed to the condensate pump, to convey the feed water to the low pressure economizer (LP EC). In the low pressure evaporator (LP EV), the flow is divided into three streams, based on the flow pressure, to continue the cycle. The operational data at different operating conditions was collected from the Ministry of Electricity and Water (MEW) and the plant manufacturer. This data includes the state of all streams and the power output at different ambient conditions and loads.
Figure 1. Schematic diagram for a Single Block of Sabiya Combined Cycle Power Plant [14].
Energies 08 12418 g001

3. Performance Analysis

The present study introduces a comparative energy and exergy analysis for Sabiya power plant. The analysis investigated the effects of different ambient temperatures, pressure ratios, pinch point temperatures, and condenser pressures. The following assumptions were made in modelling the gas turbine:
  • The gas turbine model operated at a steady state.
  • An ideal gas mixture concept is applied in both air and combustion products.
  • Gas leakage is negligible.
  • The kinetic and potential exergies of fluid streams are negligible.
  • The combustion reaction is complete and N2 is inert.
  • Heat transfer from the combustor is 2% of the natural gas lower heating value (LHV)
  • Natural gas is supplied to the system as fuel (the composition is given in Table 1).
Table 1. Molar fraction of the natural gas components.
ComponentMolar Fraction (%)
Methane (CH4)93.34
Ethane (C2H6)0.211
Propane (C3H8)0.029
Nitrogen (N2)6.42
The fuel is provided to the combustor at high pressure with different mass flow rates, depending on the load variations and inlet temperature to the annular combustor. The air stream mass flow rate also varies, in the cold section, where the air composition is given in Table 2.
Table 2. Molar fraction of air.
ComponentMolar Fraction (%)
Nitrogen (N2)77.48
Oxygen (O2)20.59
Water Vapour (H2O)1.9
Carbon dioxide (CO2)0.03
The air-to-fuel ratio (AFR) should always be higher than the stoichiometric air-to-fuel ratio, which means more air than theoretical air is used, and the mixture is called weak or lean. The stoichiometric air-to-fuel ratio represents the minimum amount of air required to achieve a complete burning of a given mass of fuel [1]. In reality, it is difficult to have a stoichiometric combustion system due to time limitations, air-fuel mixing and the presence of inert molecules, which obstruct the reaction between the active molecules. For these reasons, most combustion systems supply excess air in order to avoid the formation of smoke and carbon monoxide, and to achieve good, clean combustion.

3.1. Energy Analysis

The energy analysis is based on the first law of thermodynamics, which states that the exchange of energy for a system is the result of the applied work and heat transfer through that region. The first law of thermodynamics is based on two main concepts: (1) the energy cannot be destroyed; and (2) the energy can be transferred to other forms. In a thermal power plant, the energy is transferred from the chemical energy of the fuel to mechanical and/or electrical energies. The first law of thermodynamics in steady state form can be expressed as:
Q ˙ W ˙ = Δ H + Δ Ke + Δ Pe
The left-hand side of Equation (1) represents the net energy transfer by either heat and/or work, whereas the right-hand side shows the rate of change in enthalpy, kinetic and potential energies, respectively.
The combustion chamber performance is affected significantly by the plant operating conditions, which are based on the AFR variations. Molar analyses were performed in order to calculate the stoichiometric AFR, as elaborated by Bejan and Moran [1] and Moran et al. [7]. The molar analyses and energy balances for the proposed system components are derived, as illustrated in Appendix A.

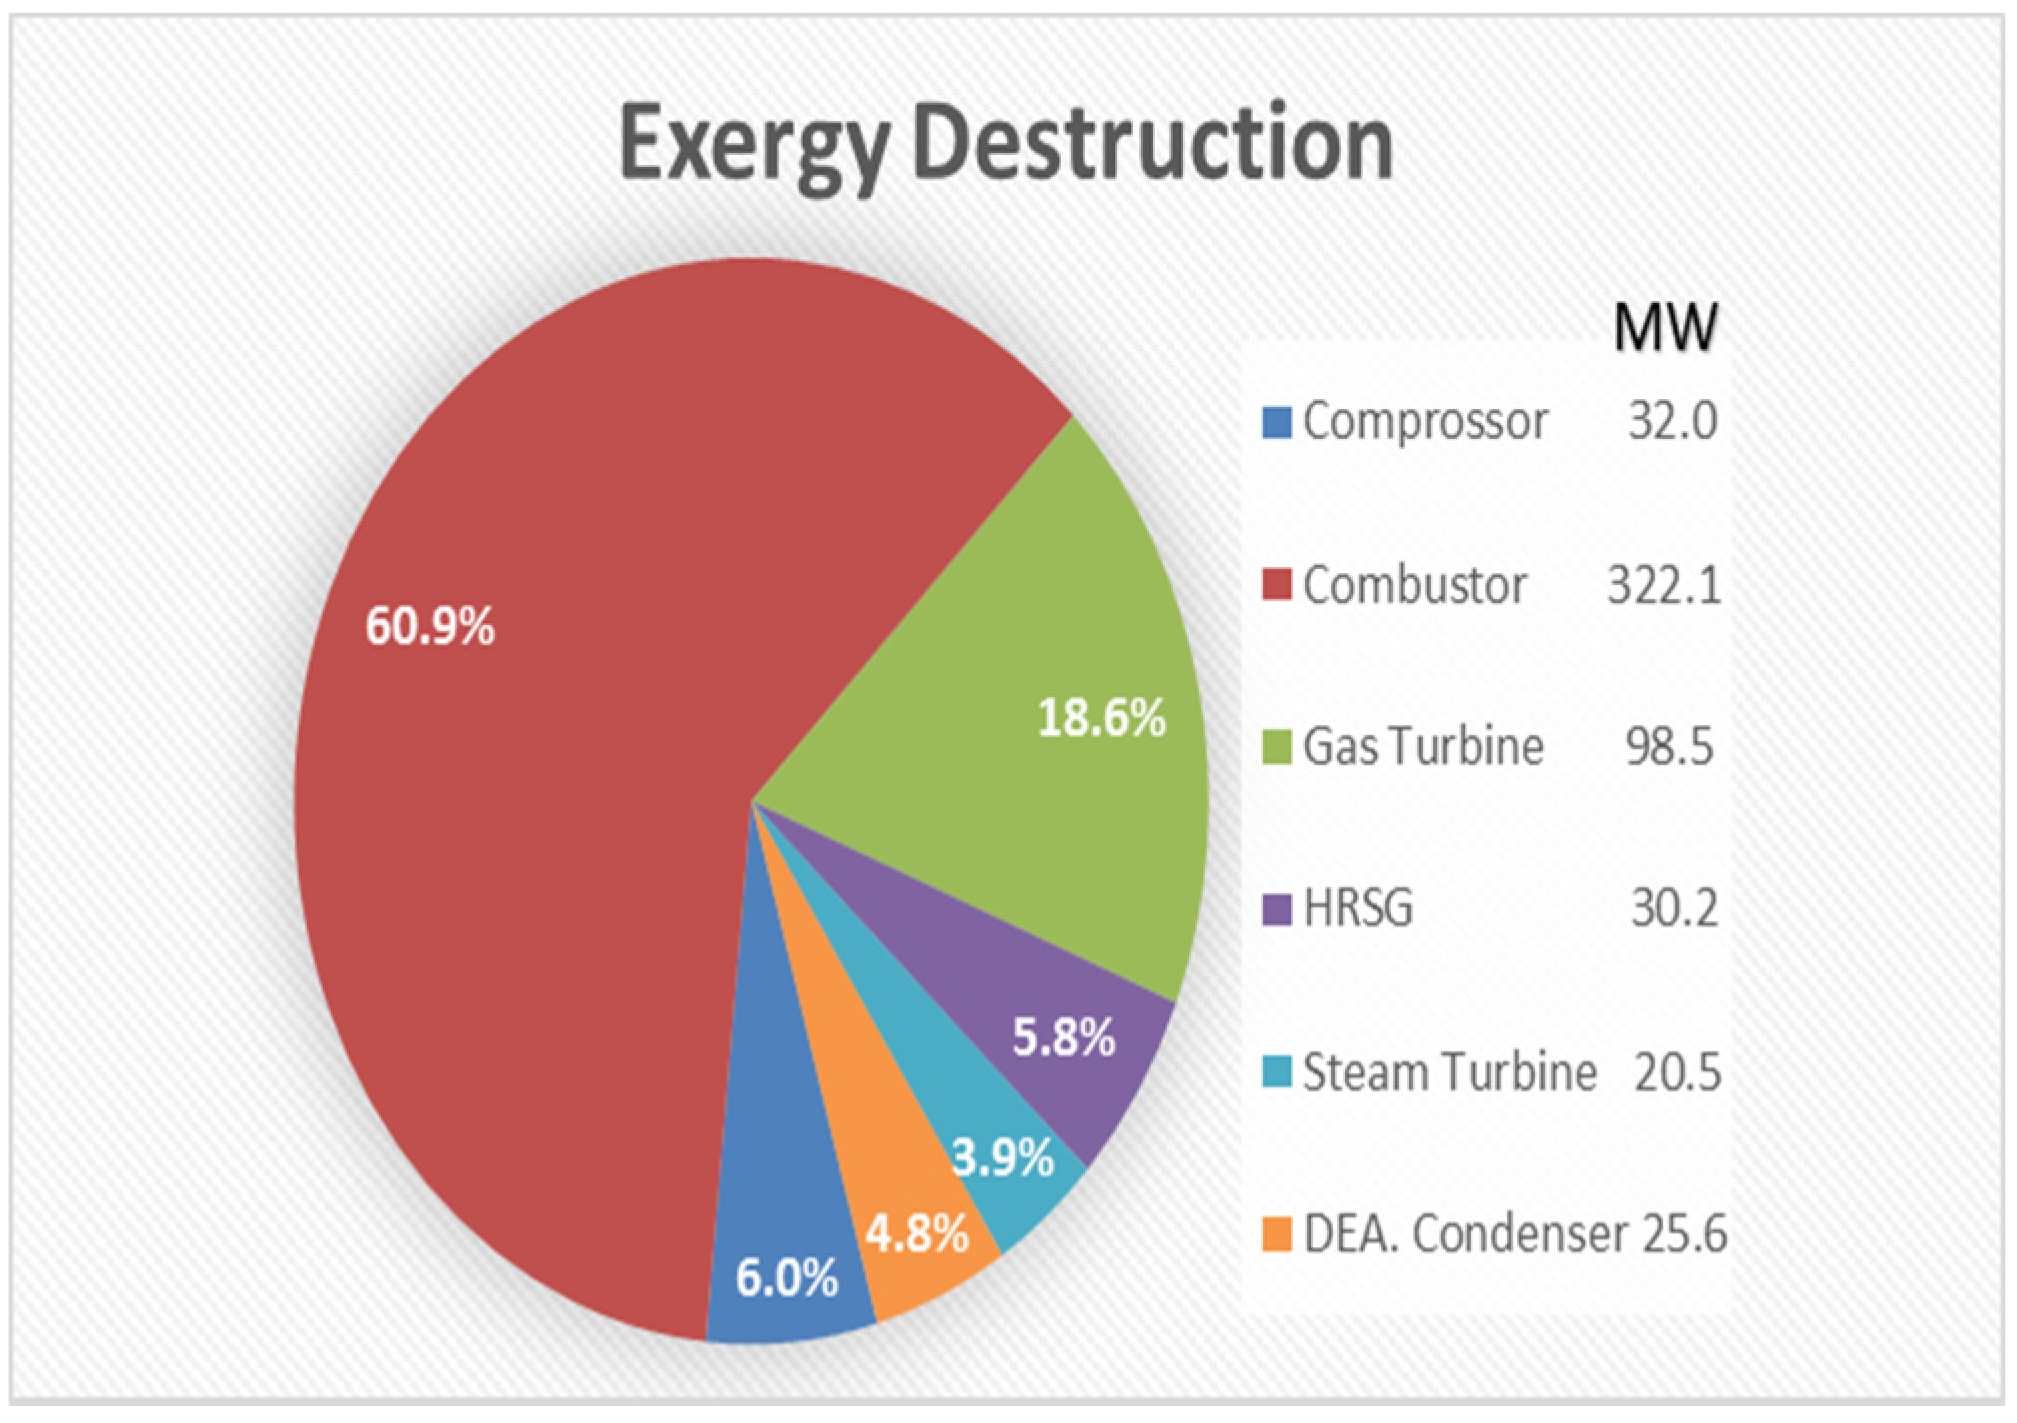
3.2. Exergy Analysis

Exergy is the maximum amount of useful work that may be produced by a system in a reversible operation. Exergy consists of four components: physical, kinetic, potential and chemical. The general exergy balance of a system can be written as:
E ˙ x = E ˙ p h + E ˙ k e + E ˙ p e + E ˙ c h
The kinetic E ˙ k e and potential E ˙ p e exergies are related to ordered movement and to the elevation of particles, respectively. These forms of exergy, which do not function as substance or mixture, depend only on the mass and are fully convertible to work. There are no destruction or entropy generation terms in both types, and their equations are identical to potential and kinetic energies.
E ˙ k e = 1 2 m ˙ V 2
E ˙ p e = m ˙ g z
The kinetic exergy is curial when exhaust gases directly interact with the environment at high velocity, where it is considered an exergy loss. Otherwise, in the present study, the kinetic and potential exergies are omitted due to insignificant effects in other locations.
Physical exergy is the maximum useful work that can be extracted from a unit mass of substance passing through a specified state (Ts, ps) to the environmental or reference state (To, po) in purely physical processes. The physical exergy consists of two parts, mechanical and thermal exergy, and it is given by the expression:
E ˙ p h = m ˙ [ ( h s h o ) T o ( s s s o ) ]
Once the specified temperature is equal to the reference temperature Ts = To with the ideal gas relation, the Equation (5) becomes:
E ˙ p h = m ˙ e R T o l n P e P o
Chemical exergy represents the maximum useful energy that can be extracted while the flow moves from an environmental state to a dead state due to differences in concentration and molecular structure. In the environmental state, the system is mechanically and thermally at equilibrium state, but not chemically. The chemical exergy of a gas mixture can be calculated by:
E ˙ c h = n ˙ [ y k e ¯ k c h + R ¯ T o y k ln y k ]
where e ¯ k c h is the molar chemical exergy for component k in the mixture, which can be selected from the standard chemical exergies table, as presented in [9]. The chemical exergy for fuel stream is given by:
E ˙ c h = n ˙ L H V ¯
In all system components, the rate of exergy outlet is less than the rate at inlet due to exergy destruction and exergy loss. These quantities in steady state can be related by the following:
E ˙ i = E ˙ e + E ˙ d + E ˙ L
where E ˙ d and E ˙ L represent rates of exergy destruction and exergy loss, respectively. The exergy destruction during a process is proportional to entropy generation due to irreversibilities within each component in the process. There are many sources that cause irreversibilities, such as chemical reaction, mixing, friction, heat transfer driven by finite temperature difference, and non-quasi-equilibrium compression or expansion. The system inefficiencies can be measured from exergy destruction and exergy loss, as illustrated in Table 3, for all components.
Table 3. Exergy destruction rate and exergetic efficiency for different component at steady state [1].
ComponentExergy Destruction E ˙ d Exergetic Efficiency η e x
Compressor & Pump E ˙ e   E ˙ i E ˙ e   E ˙ i W ˙ i
Gas & Steam Turbine E ˙ i   E ˙ e W ˙ e E ˙ i   E ˙ e
Combustion Chamber E ˙ i 1 + E ˙ i 2   E ˙ e E ˙ e E ˙ i 1 + E ˙ i 2
Heat Exchanger E ˙ h i + E ˙ c e   E ˙ h e E ˙ c i E ˙ h e + E ˙ c i E ˙ h i + E ˙ c e
Cycle components E ˙ d , k 1 E ˙ d + E ˙ L E ˙ f
The exergetic efficiency measures the performance of the thermal plant system from a thermodynamic prospective. The type of product and fuel are necessary to be defined because exergy analysis depends on the quality of energy. In the thermal plant system with single generation, thermal and exergetic efficiency are close to each other, whereas, in a multi-generation thermal plant system, the difference between them is obvious. The exergetic efficiency indicates how much can be extracted from the maximum available work, whereas thermal efficiency shows how much work output can be extracted from a specified input fuel. However, the exergetic efficiency is defined as the ratio of total exergy output to the total exergy input or the ratio of produced exergy to fuel exergy supplied to the system.

3.3. Waste Exergy in Heat Recovery Steam Generator (HRSG)

The HRSG consists of an economizer, an evaporator with a drum, and a superheater. In the economizer and the superheater, the phase does not change, whereas, in an evaporator, the latent heat dominates, by changing the phase of the water from liquid into the gaseous form (steam).
Exergy waste in thermal power systems is divided into two parts: exergy destruction, which is directly related to irreversibility within a system, and exergy loss, which is associated with the rejection of energy to the environment, at the end of the process. There are three forms of exergy waste across the heat exchanger, listed as follows:
  • Exergy destroyed due to temperature difference between fluids.
  • Exergy destroyed due to fluid friction as a result of movement along the pipes; and
  • Energy release to the heat exchanger surroundings.
The waste exergy value of HRSG unit can be obtained based on the source of irreversibilities, using a new approach proposed by Paniagua et al. [15]. The waste exergy results from exergy destruction and exergy release to the environment, and can be calculated by:
E ˙ w = Q ˙ s u r + T o S ˙ Δ T + T o S ˙ Δ P
where E ˙ w and S ˙ are the total wasted exergy and entropy generation respectively. Applying exergetic analysis into the HRSG or a heat exchanger is required to evaluate all three terms independently, which are highly affected by the temperature distribution inside each of the components in the HRSG. Thus, this shows some difficulty in calculation, as reported by Zunlong et al. [16].Theoretically, each term in Equation (9) can be developed as follows:
Q ˙ s u r = d Q ˙ s u r r ( 1 T o T )
S ˙ Δ T = d Q ˙ e x c h ( 1 T c 1 T h )
S ˙ Δ P = m ˙ c c v c d P c T c m ˙ h h v h d P h   T h
where the subscripts  c  and h represent cold and hot fluid and v is the specific volume.
The proposed method is also known as the “black-box”, which evaluates all sources of irreversibilities, from a thermodynamic perspective, at specified boundary conditions. The first step is to calculate the total wasted exergy, then obtain the temperature distribution in order to solve both the Equations (10) and (11). Finally, from Equation (9), the entropy generation due to pressure drop can be determined. There are a number of ways to solve the integral, using numerical integration. The Gaussian numerical integration was used in the analysis to simplify the calculations with more accurate results. More details about the proposed method and the Gaussian numerical integration are fully discussed in reference [15].

4. Simulation Tools

The proposed models in the current study have been modelled using a software package called IPSEpro (SimTech GmbH, Graz, Austria). This software is highly flexible for modelling and analysing processes in energy systems and in several other related areas. IPSEpro can perform heat balance calculations and simulates industrial processes. In general, the thermal process can be simulated and examined according to the specified thermodynamic properties. The Sabiya combined cycle power plant was validated with manufacturer’s published data for different operating conditions and the results showed high compatibility with the proposed model.

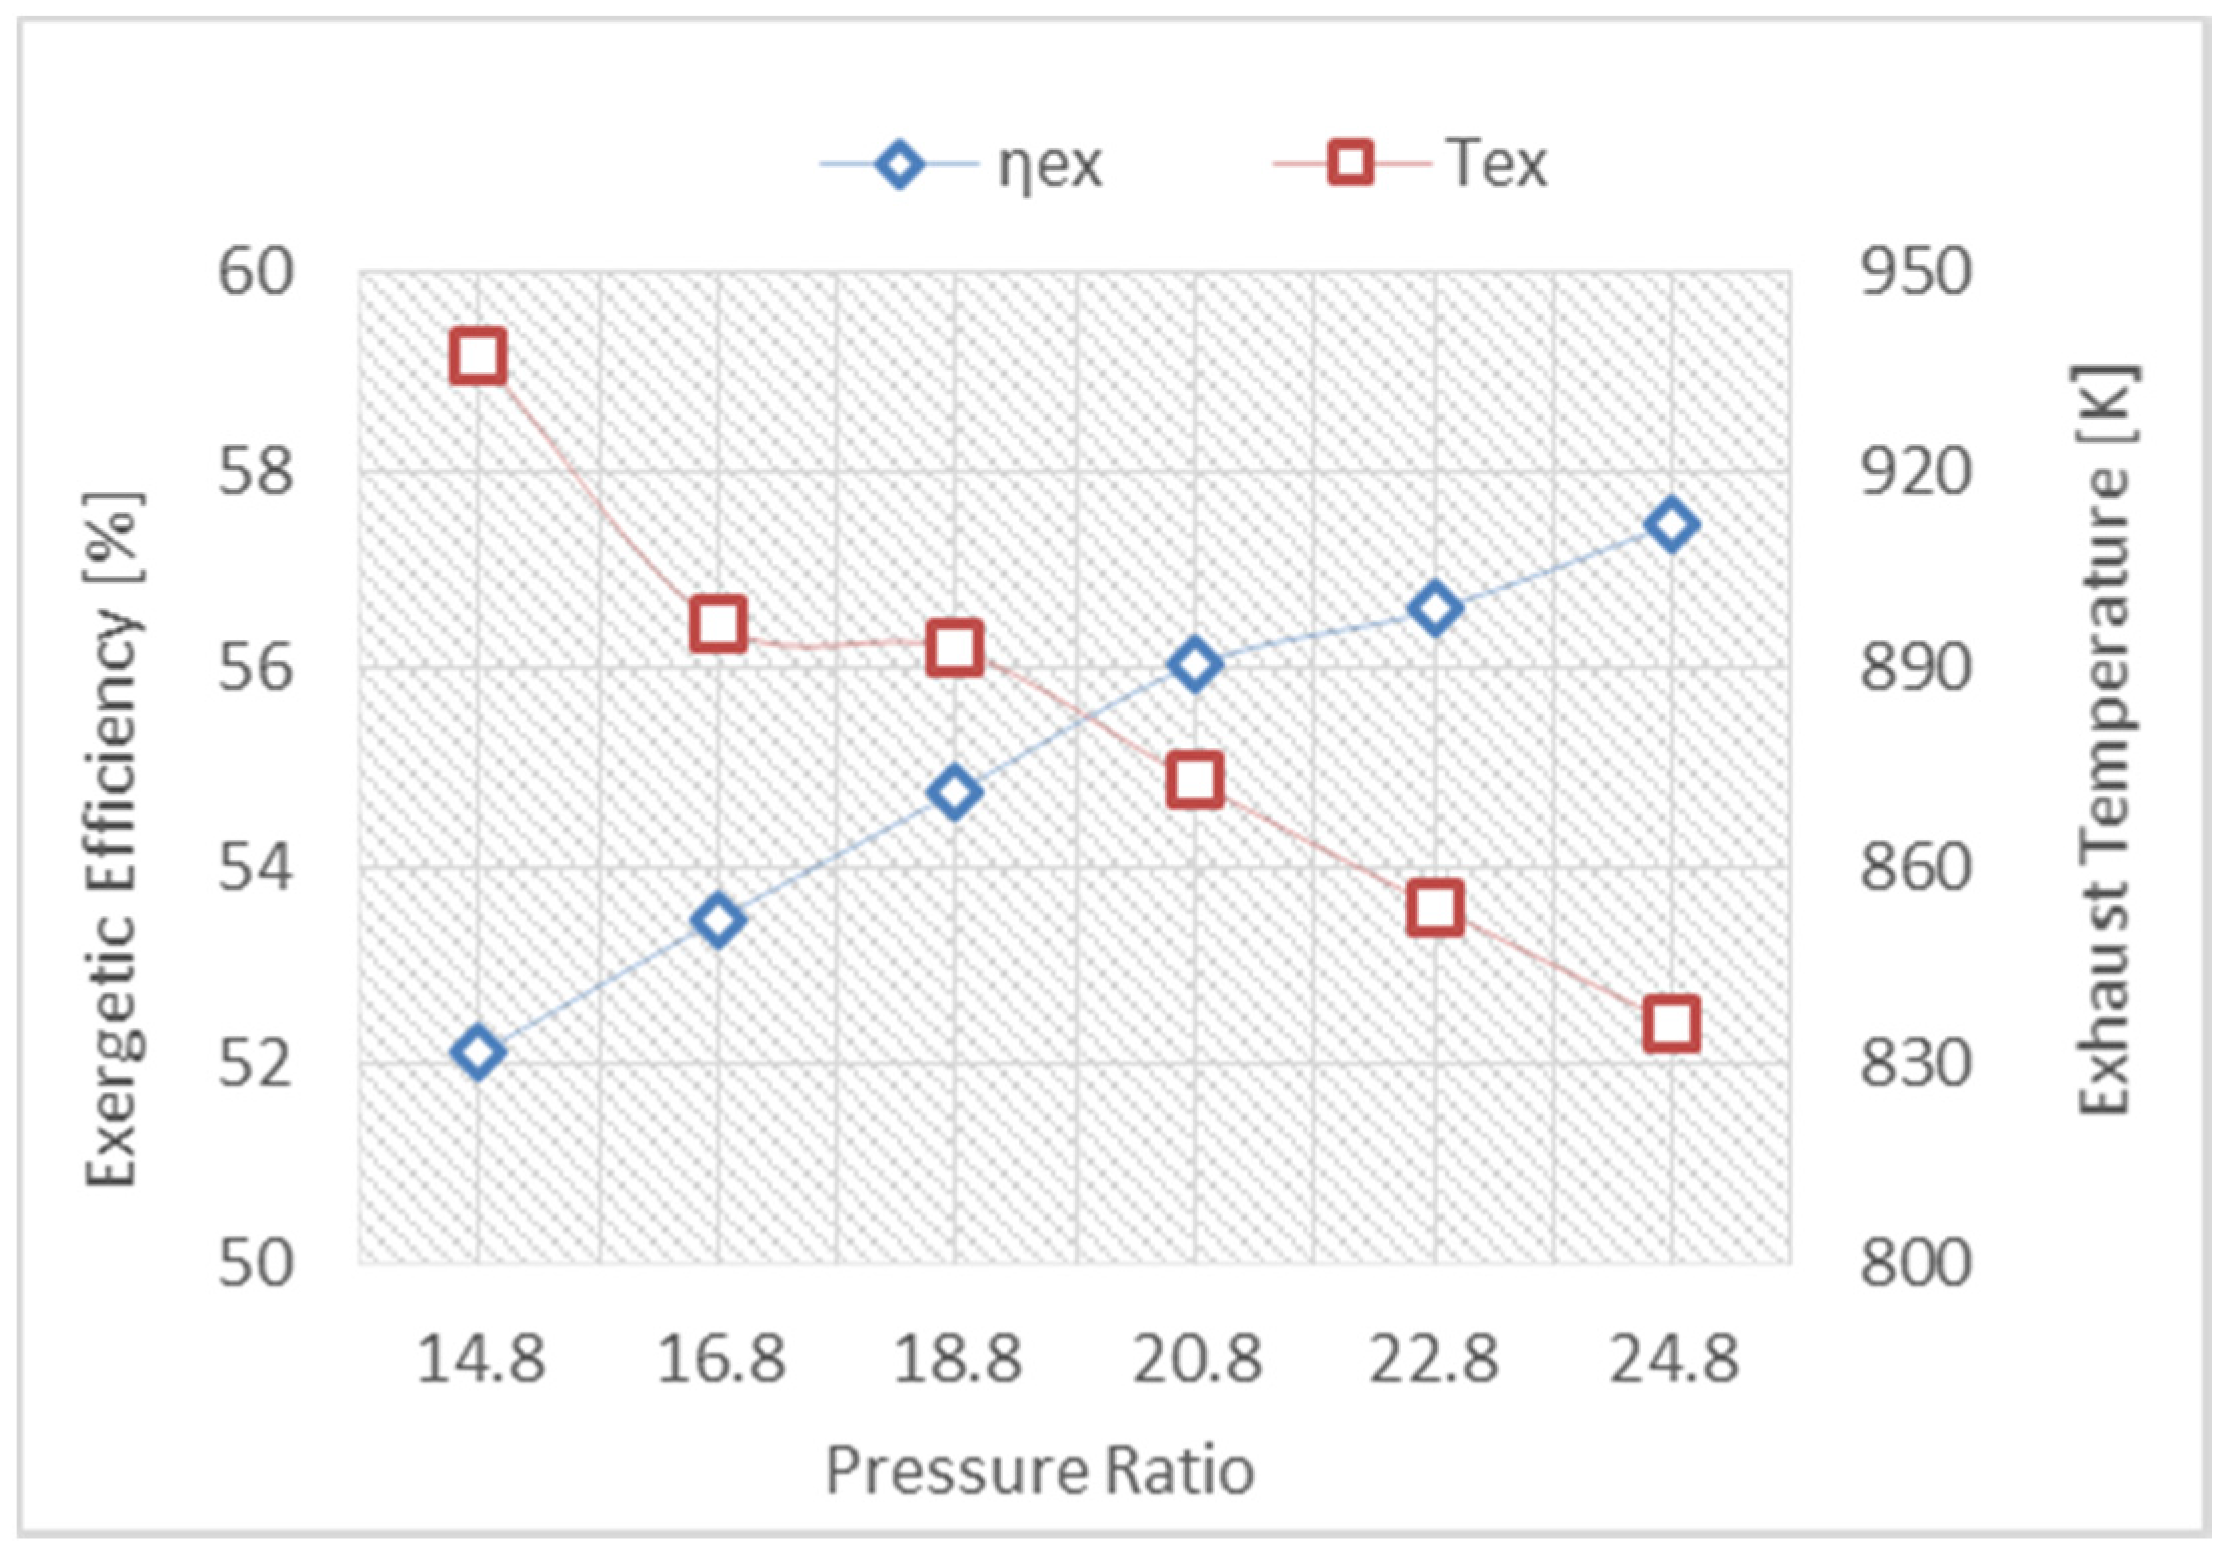
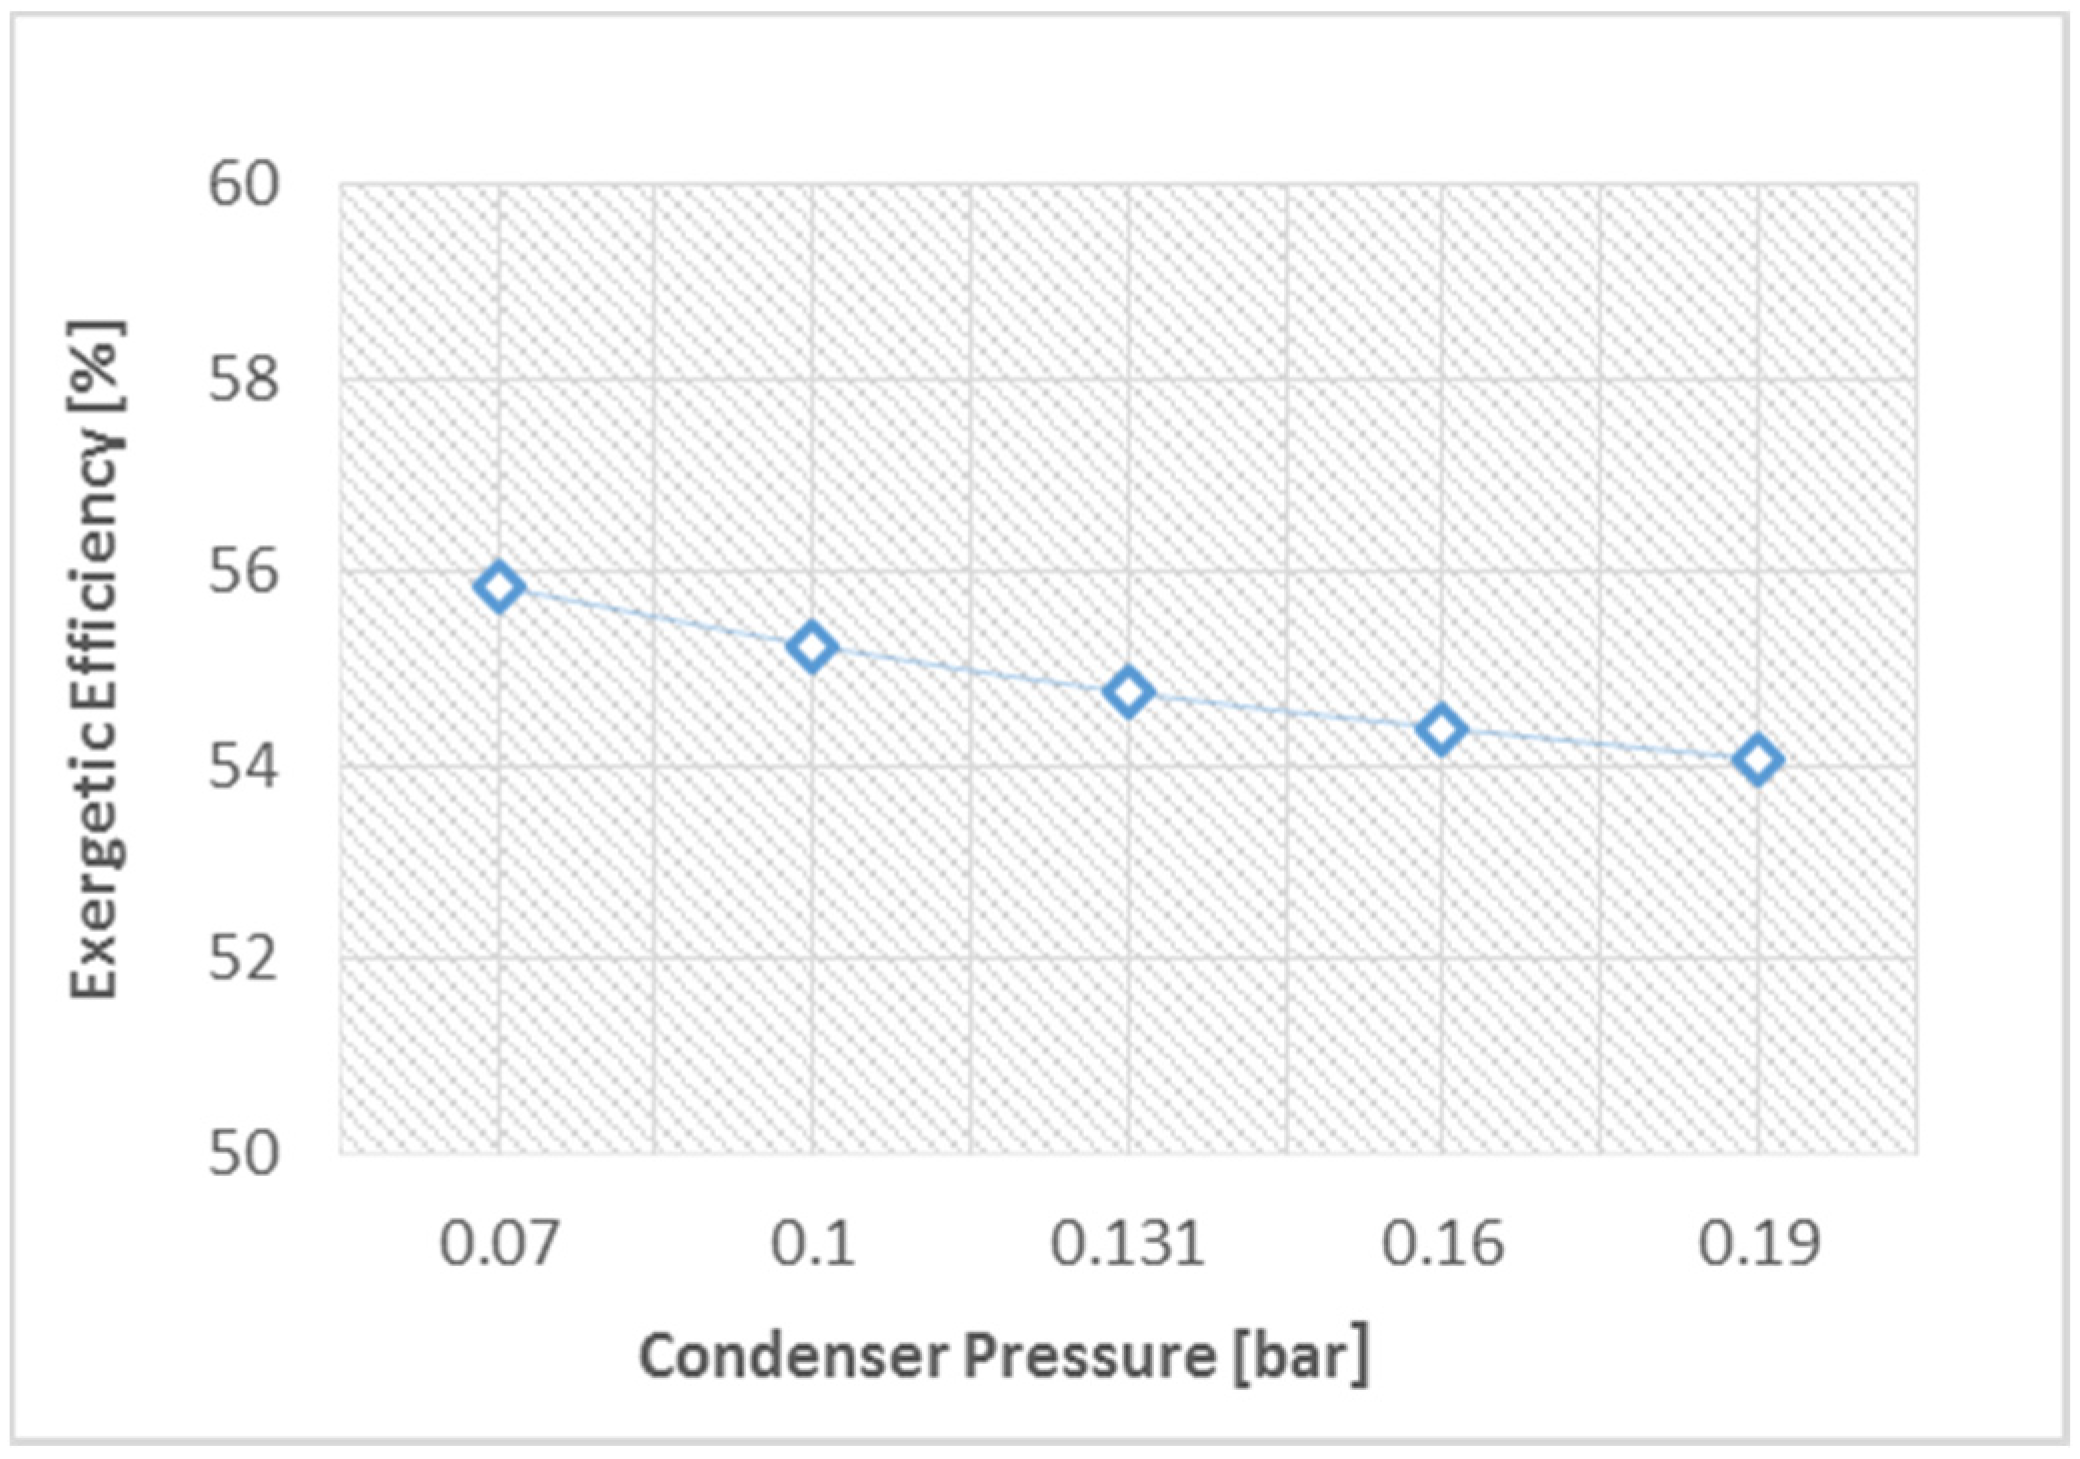
5. Results and Discussion

In this section, the results of energy and exergy analysis are presented for Sabiya CCPP at different ambient temperatures, pressure ratios, pinch point temperatures, condenser pressure and high pressure steam. A proper diagnosis leads to the identification of the sizes and locations of any deficiencies, which would assist in the modification or improvement of the plant, to reduce the environmental impact and energy costs and to achieve sustainable development, especially when fossil fuels are employed.
Similarly, analyses were performed at different operation conditions. The environmental state was selected at a temperature of 288 K, and an ambient pressure of 1.01 bar, for all streams. Table B-1 and Table B-2 in Appendix-B present the thermodynamic data, which include the exergy analysis at International Standards Organization (ISO) condition for the bottoming cycle and topping cycle and, respectively. Figure 1 illustrates two cycle streams at different states, with the topping cycle states (air and exhaust gases) indicated with letters, while the bottoming cycle states (steam) are represented by numbers.
Figure 2 shows the effect of ambient temperature variation on the exergetic efficiency, and the net power output per block in Sabiya CCPP. The rising ambient temperature leads to an increased exergy loss, which then leads to adverse effects on the system performance. The effect of ambient temperature is extended to the compressor’s power consumption, which increases with high ambient temperatures, due to the increase in air density. Thus, the net power output will reduce as the ambient temperature rises. The exergetic efficiency and the net power output have the same trend, with ambient temperature variation, as they are inversely proportional with the ambient temperature.
Figure 2. Exergetic efficiency and block net power output verses ambient temperatures.
Energies 08 12418 g002
The slope of the net power is higher than that of the exergetic efficiency, due to more power consumption in the compressor compared to energy saving as a result of increasing combustion chamber inlet temperature. The exergy destruction rates, for all Sabiya CCPP components at the ISO conditions, is shown in Figure 3. The greatest exergy destruction rate is shown at the combustion chamber, due to chemical reactions, mixing and large temperature differences, as confirmed by Kotas [5] and Ersayin and Ozgener [10].
Figure 3. Exergy destruction rates for all components in Sabiya CCPP at ISO condition.
Energies 08 12418 g003
The gas turbine represents the second major source of irreversibility, as a result of high exergy input, temperature difference, expansion and friction. It is notable that the compressor has higher exergy destruction when compared to all bottoming cycle components. The HRSG represents the fourth source of irreversibility in the system, which may attribute to the temperature differences among the streams, friction and the heat dissipated to the surroundings. The fifth source of irreversibility occurs in deaerating condenser, due to the high energy loss to the coolant during the condensation process, in order to continue the cycle. The steam turbine constitutes the lowest source of irreversibility in the system. In spite of the fact that it occurs due to the same reasons as the gas turbine—due to the differences in the inlet temperature and the type of working fluid, which highly affect the heat capacity—the effect of reheat in HRSG leads to improve the steam turbine performance.
Figure 4 illustrates the exergetic efficiency and gas turbine exhaust gases temperature, against the pressure ratios for Sabiya CCPP. Numerous outcomes can be extracted from this figure. Initially, as the pressure ratio increases, the performance of the gas turbine improves—the reverse occurs for steam turbines—due to the substantial reduction in the exhaust gas temperatures. In spite of that, the whole plant’s exergetic efficiency improves, because the reduction rate in the fuel consumption is higher than the steam turbine net power output. The reason behind that may be attributed to the result of the high inlet temperature in the combustion chamber for the former, and low gas turbine exhaust gases temperature, which significantly affects the steam capacity in the bottoming cycle and the steam turbine inlet temperature for the latter. The exhaust gas temperatures decrease as the pressure ratio increases at a constant power output due to the increase in the expansion ratio. The main constraint for increasing pressure ratio is the gas turbine exhaust temperature, which is confined by the HRSG configuration. The maximum exergetic efficiency is achievable at pressure ratio of 24.8, while, beyond that, the HRSG arrangement should be changed, due to low exhaust gases temperature. The Sabiya CCPP can be improved by using another gas turbine engine, with high pressure ratio, such as an industrial reheat gas turbine, in order to guarantee the high exhaust temperature, which will be more compatible with existing advanced HRSG.
Figure 4. Exergetic efficiency and gas turbine exhaust gases temperature versus pressure ratios at ISO condition.
Energies 08 12418 g004
The relation between exergetic efficiency and condenser pressure is shown in Figure 5. Increasing the pressure in the condenser leads to creating an adverse effect in the performance, due to a reduction in the power output from the steam turbine. In addition, the temperature difference in the low pressure economizer is reduced, which is highly effective on heat transfer rate and increasing stack temperature. Adjusting condenser pressure significantly can have an effect on the plant performance and is highly recommended to sustain it at low level.
Figure 5. Exergetic efficiency versus condenser pressure at ISO condition.
Energies 08 12418 g005
A triple-pressure reheat combined cycle consists of three levels of steam pressures at three different evaporators. The high pressure steam was investigated at different values, which are higher or lower than the design point at constant mass flow rate. It has significant influence on the CCPP performance, as illustrated in Figure 6. The relation between high pressure steam in HRSG, with exergetic efficiency, and block net power output is directly proportional. Increasing the pressure leads to reducing the latent heat of vaporisation, as well as the energy required to change the phase of water. Additionally, more power is produced due to an increase in the expansion range across the steam turbine with enthalpy. The exergetic efficiency increases, mainly due to the increase of net power output, which is interpreted by the trend similarity. The relation between steam pressure and plant performance is clear; therefore, high pressure is always preferable and is considered to be one of the important recommendations to achieve high plant efficiency.
Figure 6. Exergetic efficiency and block net power output versus high pressure steam in HRSG.
Energies 08 12418 g006
Another significant parameter in plant performance is the pinch point of HRSG across three stages. The pinch point temperature is defined as the difference between the saturation temperature of the evaporator at specified pressure and the outlet exhaust gas temperature. From an operational perspective, adjusting the pinch point is achievable by changing the evaporator pressure, otherwise by modifying the HRSG design by changing the heat transfer area.
The effect of HP pinch temperature on plant performance was investigated while keeping the IP and LP pinch temperatures at design values, as seen in Figure 7. It is noticed that, as HP pinch temperature reduces, the plant exergetic efficiency increases, due to the improvement of HRSG performance and the reduction of irreversibilities. The exergy destruction rate decreased as a result of improving the effectiveness of the evaporator and enhancement of the heat transfer rate between the two streams. The effect of HP pinch temperature and operating conditions are extremely dependent on HRSG configurations and the approach temperature, which represents the difference between the saturation temperature at the evaporator and water temperature, which exit from the economizer. The higher approach temperature at the same pinch temperature leads to a more efficient HRSG, and it increases the heat recovery. Thermodynamic and economical views must be taken into account, in order to achieve optimum HRSG design, that reflect on the plant’s efficiency. In spite of the impact of the pinch and approach temperatures on thermal system performance, they are highly limited for existing systems in comparison to new plants. The HRSG configuration is considered to be a crucial factor in determining the behaviour of CCPP performance, specifically in the wasted heat recovery from the gas turbine.
Figure 7. Exergetic efficiency and exergy destruction versus HP Pinch Temperature.
Energies 08 12418 g007
The exergetic analysis was performed on triple pressure reheat HRSG, using the new approach, in order to determine the sources of irreversibilities and exergy destruction per stage pressure. Figure 8 shows the exergy destruction for all HRSG stages. The exergy destruction at the high pressure stage [HP] achieves a high level, which is equivalent to all other stages. This is due to many reasons, such as the large number of components, high loss to the surroundings and high temperature difference between the streams. In contrast, the lowest level of exergy destruction occurs in the intermediate pressure stages [IP], as a result of the low heat loss, temperature differences between the streams, especially at superheater components, and mass flow rate. In the reheat section [RH] and low pressure stage [LP], the effect of the temperature difference is obvious.
Figure 8. Exergy destruction for all HRSG stages at ISO condition.
Energies 08 12418 g008
The exergy destruction is significantly affected by the streams’ pressures, and the relation between them is directly proportional. The overall exergy destruction of the HRSG, with the sources of irreversibilities, is illustrated in Figure 9. The highest source of irreversibilities caused from the temperature difference can be treated by preheating the cold stream, or adjusting the stream pressure. The second source comes from the heat loss to the surroundings, which mainly occurs due to a high temperature difference between the saturated temperature at the evaporator, and superheated steam at the inlet of steam turbine. The third source is related to the fluid friction, as a result of the movement along the pipes, and it appears in the form of pressure reduction. The order of exergy destruction is exactly identical to the previous literature [15], whereas, the level change is based on the HRSG configuration. However, knowing the sources of irreversibilities is considered to be useful information, in order to improve the component by eliminating, or limiting, the causes behind that.
Figure 9. HRSG exergy destruction with different sources of Irreversibilities at ISO condition.
Energies 08 12418 g009
Finally, integrating Sabiya CCPP with low-grade heat source technologies, such as the organic Rankine cycle, absorption chiller and desalination plant, is highly recommended to improve plant efficiency. It is well known that an improvement in energy conversion level can be achieved by producing more useful types of energy from the same source of fuel. Low-grade heat source technologies will enhance plant performance without adding extra fuel in different forms. For example, this will:
  • Produce more power by using the organic Rankine cycle.
  • Improve the primary mover performance by cooling the intake area using an absorption chiller.
  • Alternatively, save amount of energy consumed to cool the plant building.
  • Save a considerable amount of the fuel required by the industrial boiler to operate the desalination system.

6. Conclusions

A detailed energetic and exergetic analysis of a 2000 MW CCPP has been carried out, based on a very advanced HRSG. The thermodynamic data were extracted from the CCPP model, developed by the IPSEpro software and validated with the manufacturer’s published data, and it presented a high level of compatibility. The main conclusions that have been extracted from this study are listed below.
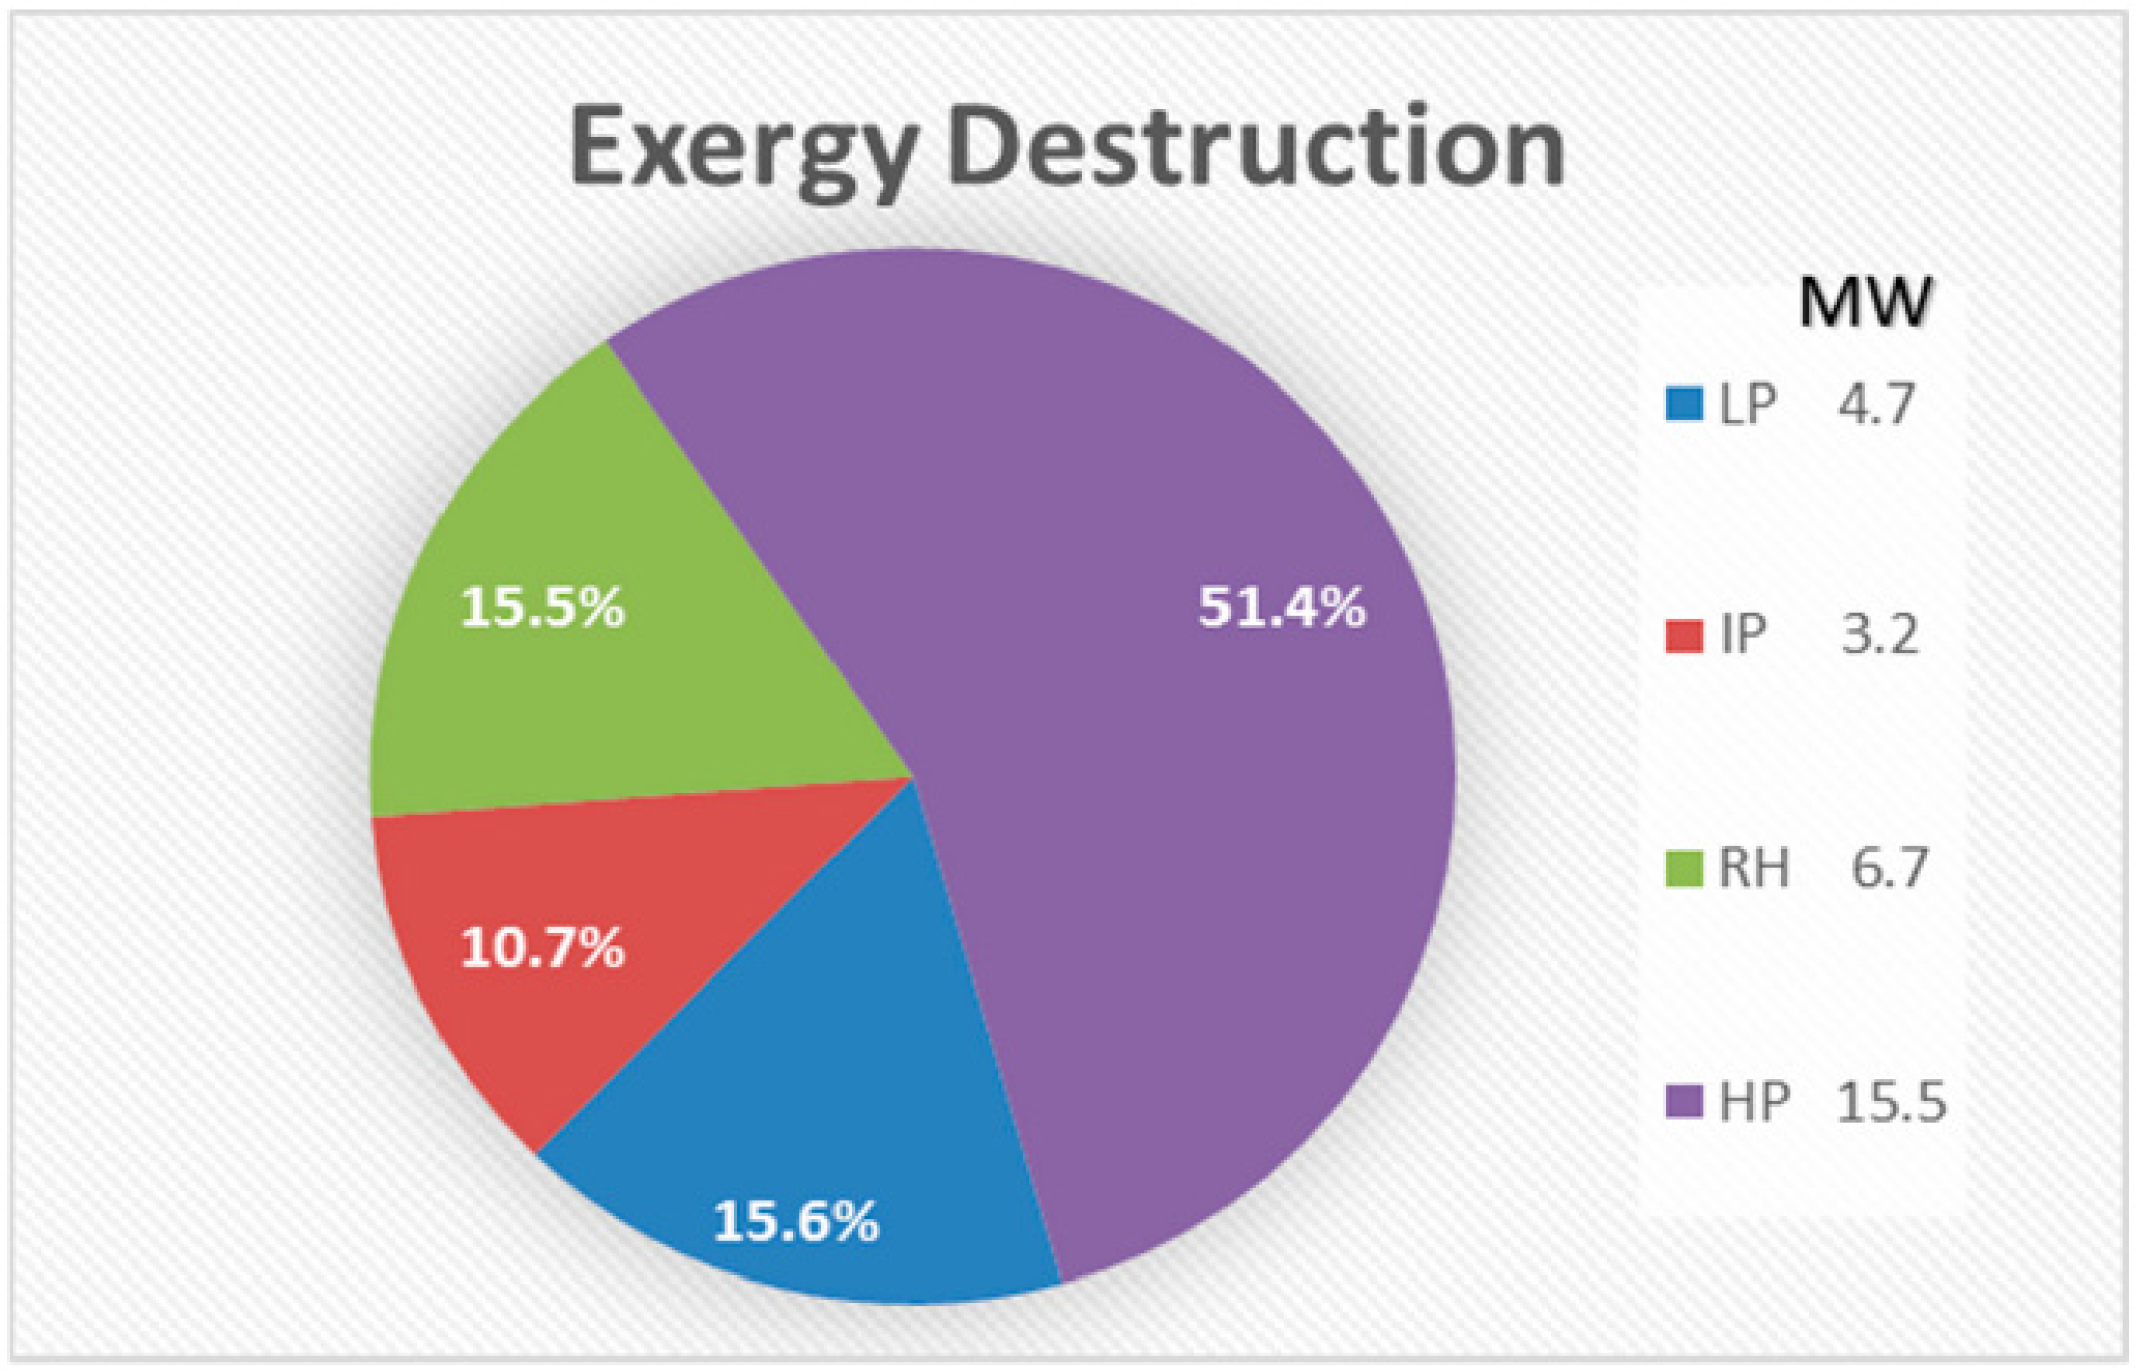
  • The combustion chamber is the main source of irreversibility, with high exergy destruction attributable to three reasons: (i.) combined diffusion/fuel oxidation; (ii.) internal energy exchange–heat transfer; and (iii.) the mixing process.
  • Inefficiency in the combustor can be reduced by improving the combustion process, adding an air preheater and reducing the air-to-fuel ratio.
  • The steam turbine constitutes the lowest source of irreversibility as a result of the reheating system and the type of working fluid.
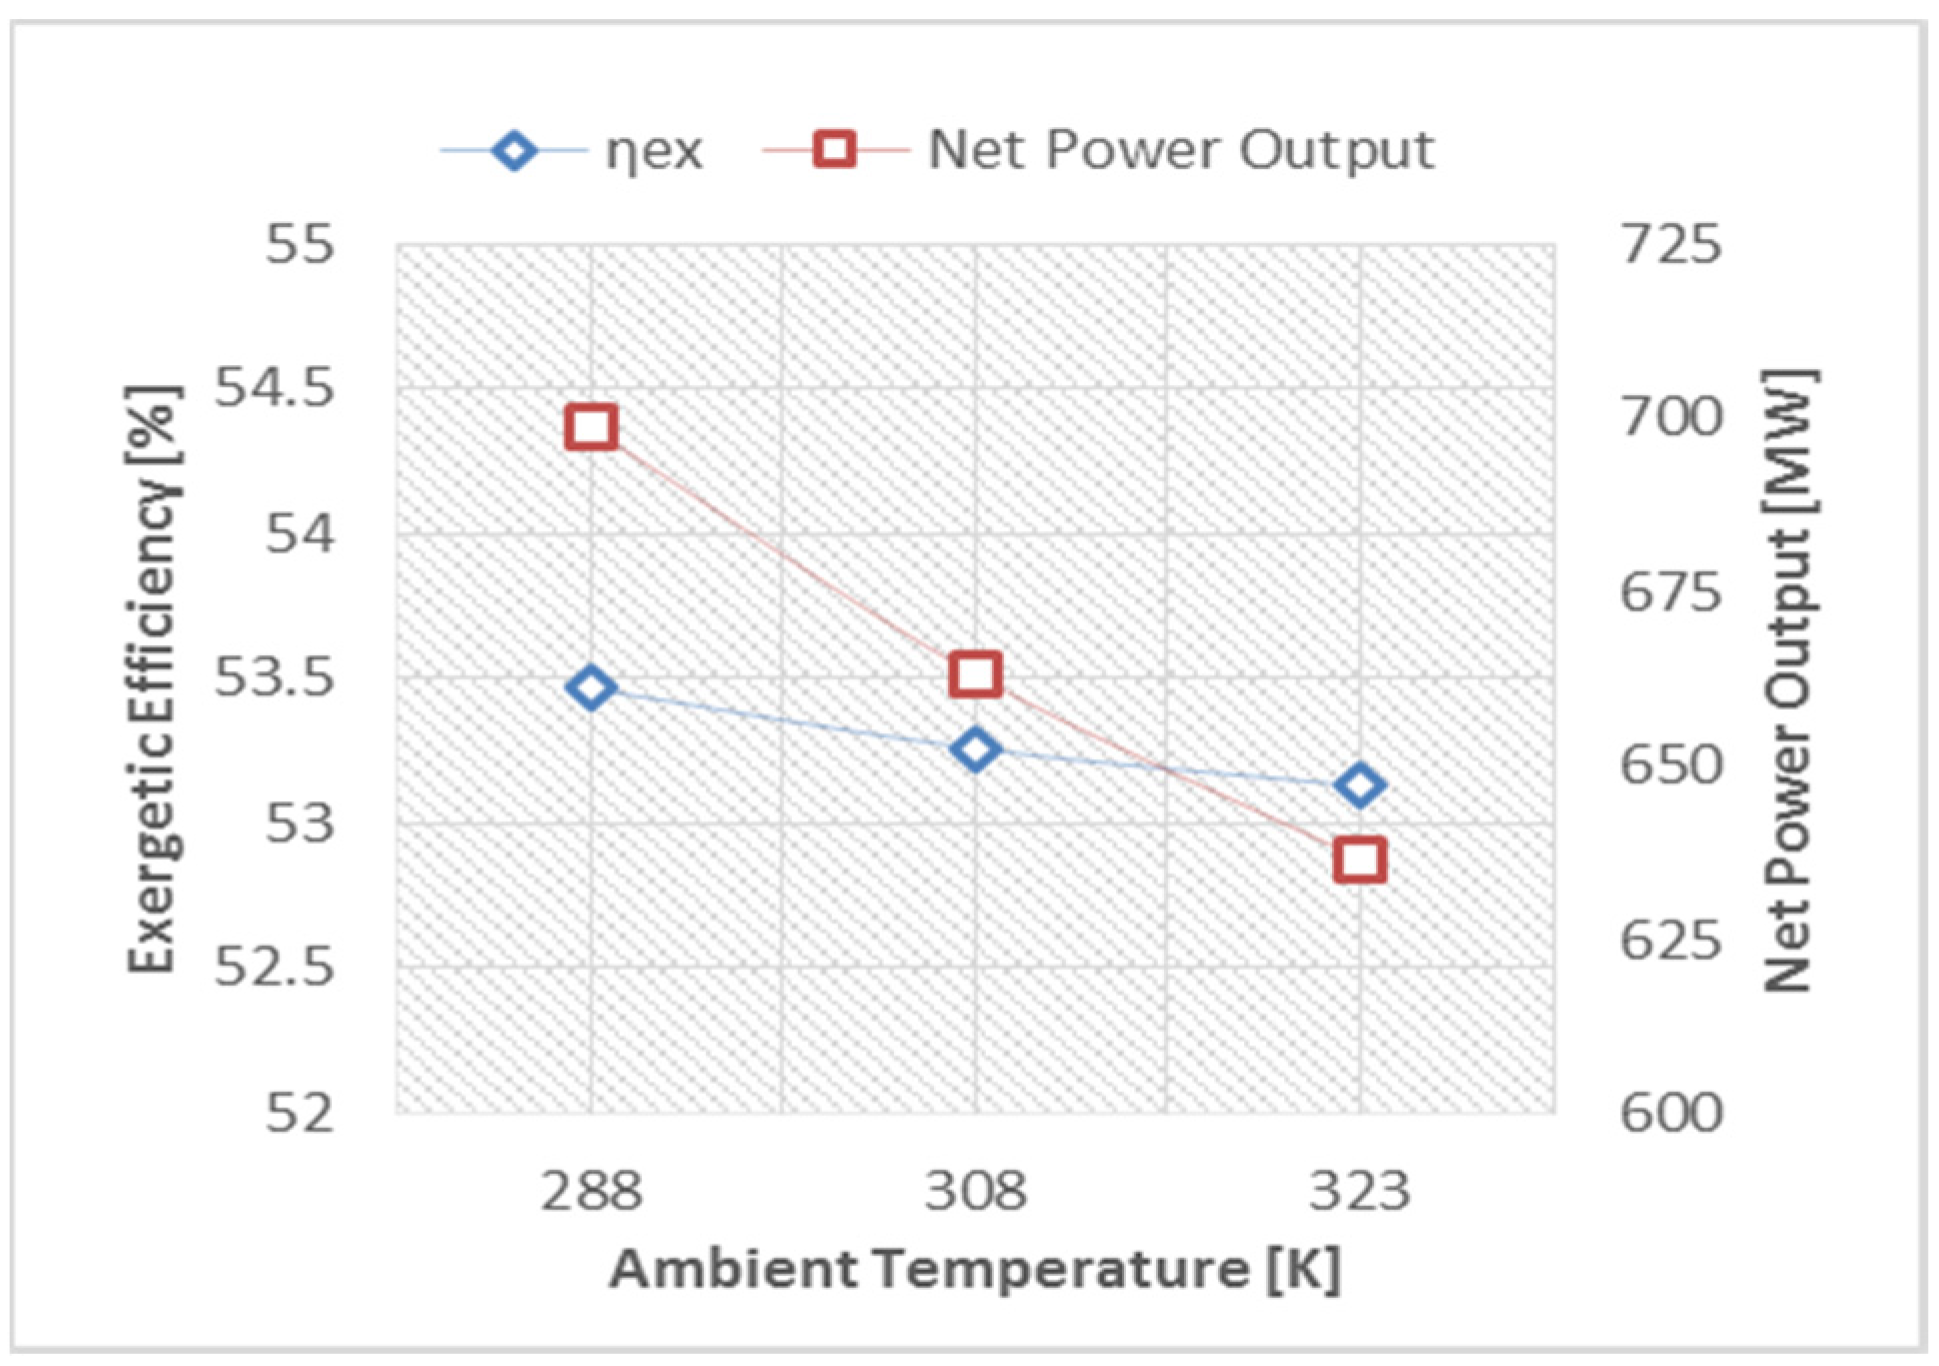
  • The variation in ambient temperature has a significant effect on the CCPP’s exergetic efficiency and net power output, and it is recommended to use a cooling system at the point of intake of the gas turbine engine in order to achieve high power output and exergetic efficiency.
  • The reheat gas turbine engine, with a high-pressure ratio, will achieve substantial improvement in the CCPP due to a reduction in the fuel consumption, producing more power and maintaining the exhaust temperature at a high level, which is compatible with the triple pressure reheat HRSG.
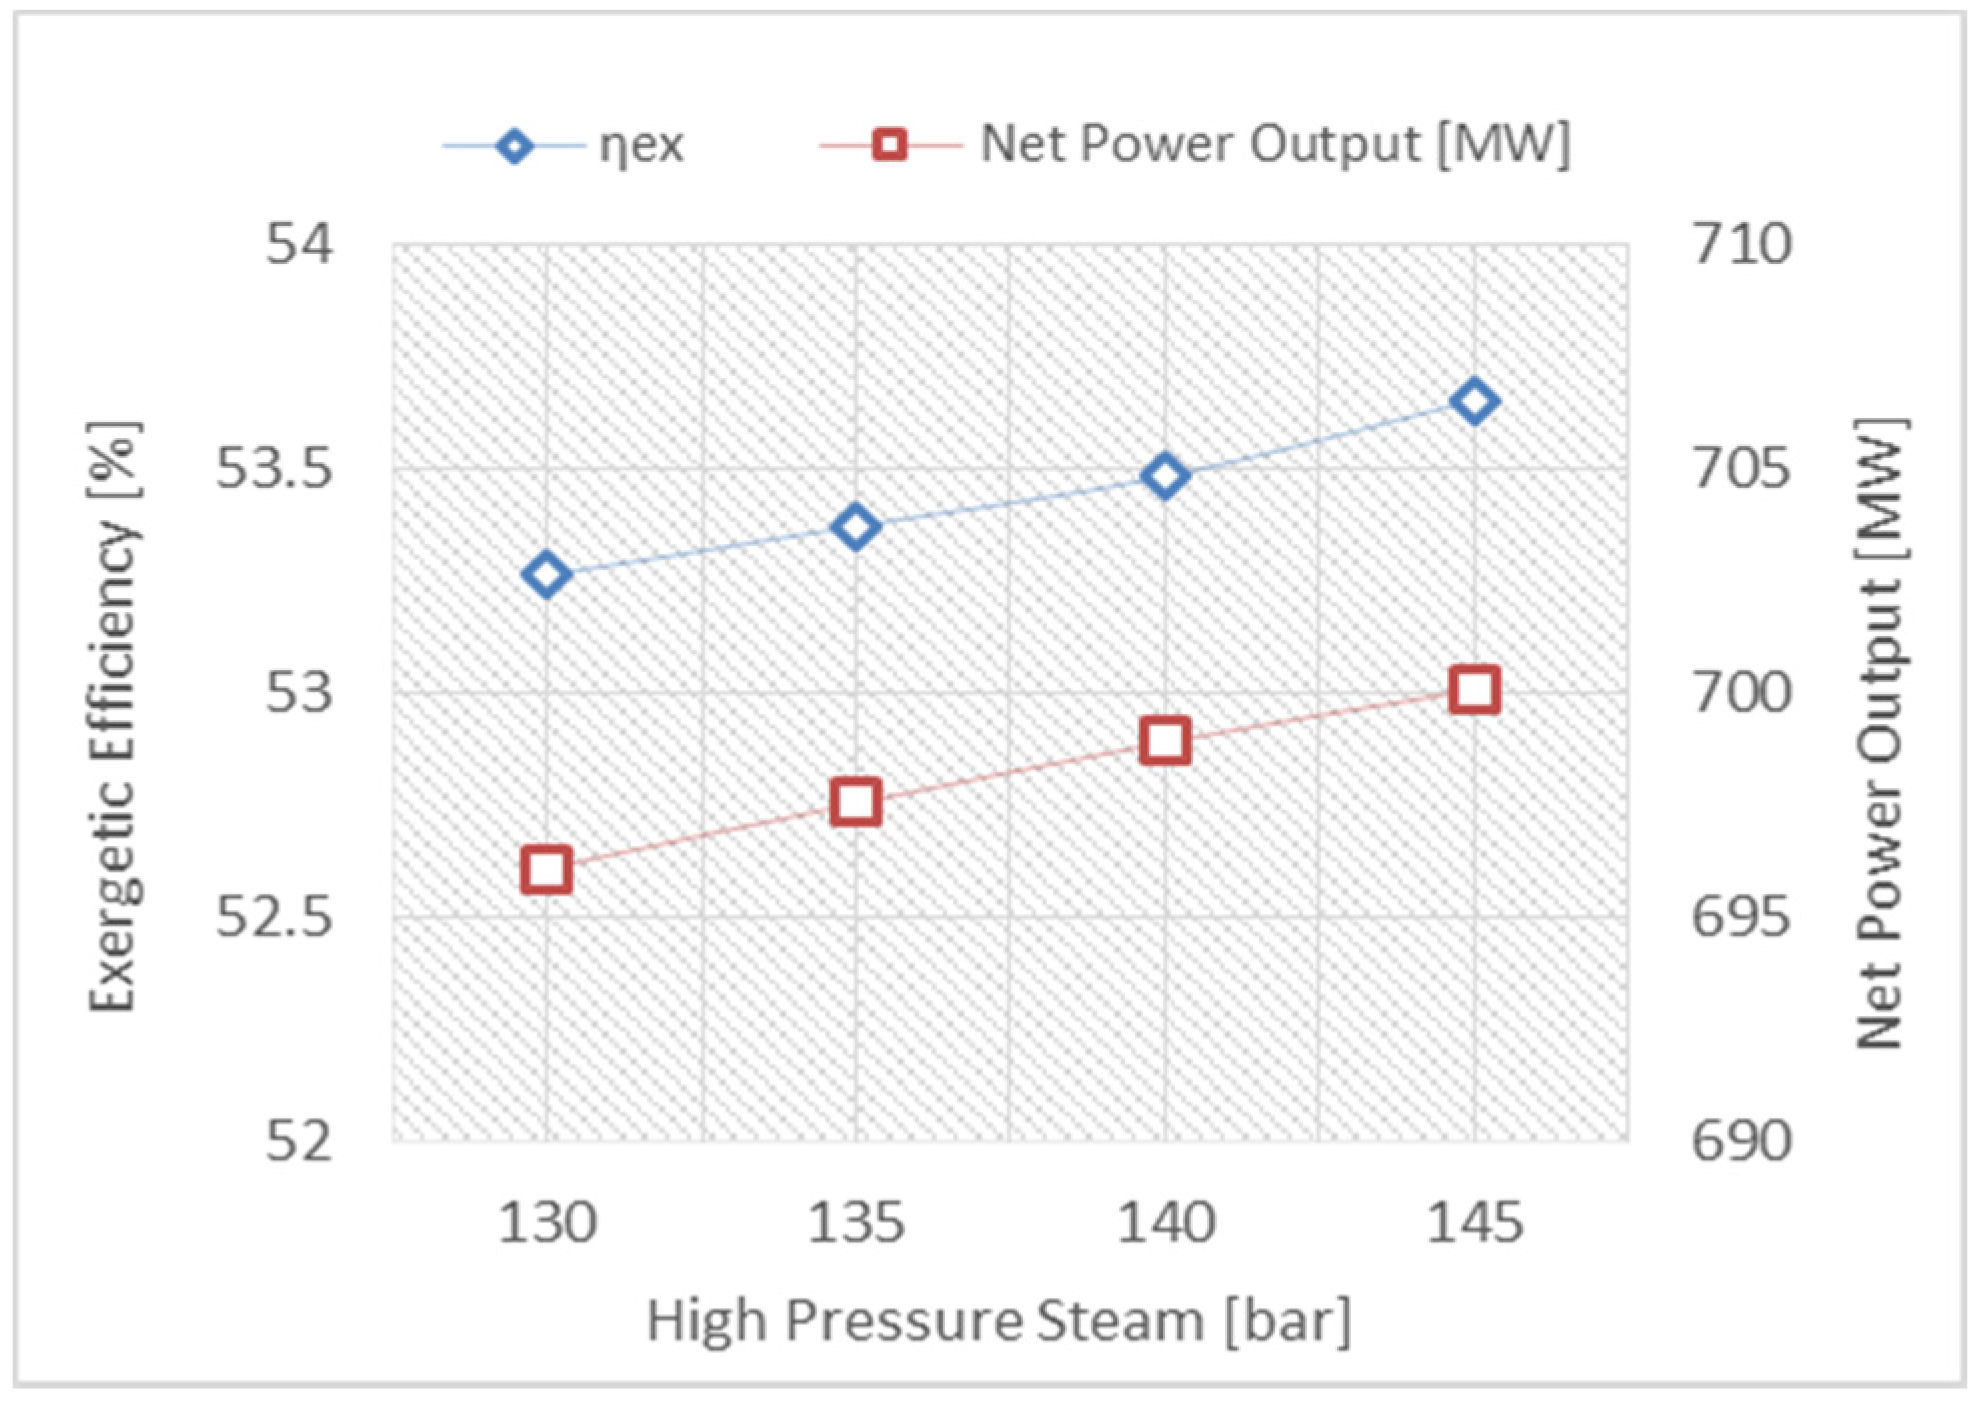
  • Adjusting the steam pressure at a high value and the condenser pressure at a low value can be proposed in order to improve the CCPP’s efficiency.
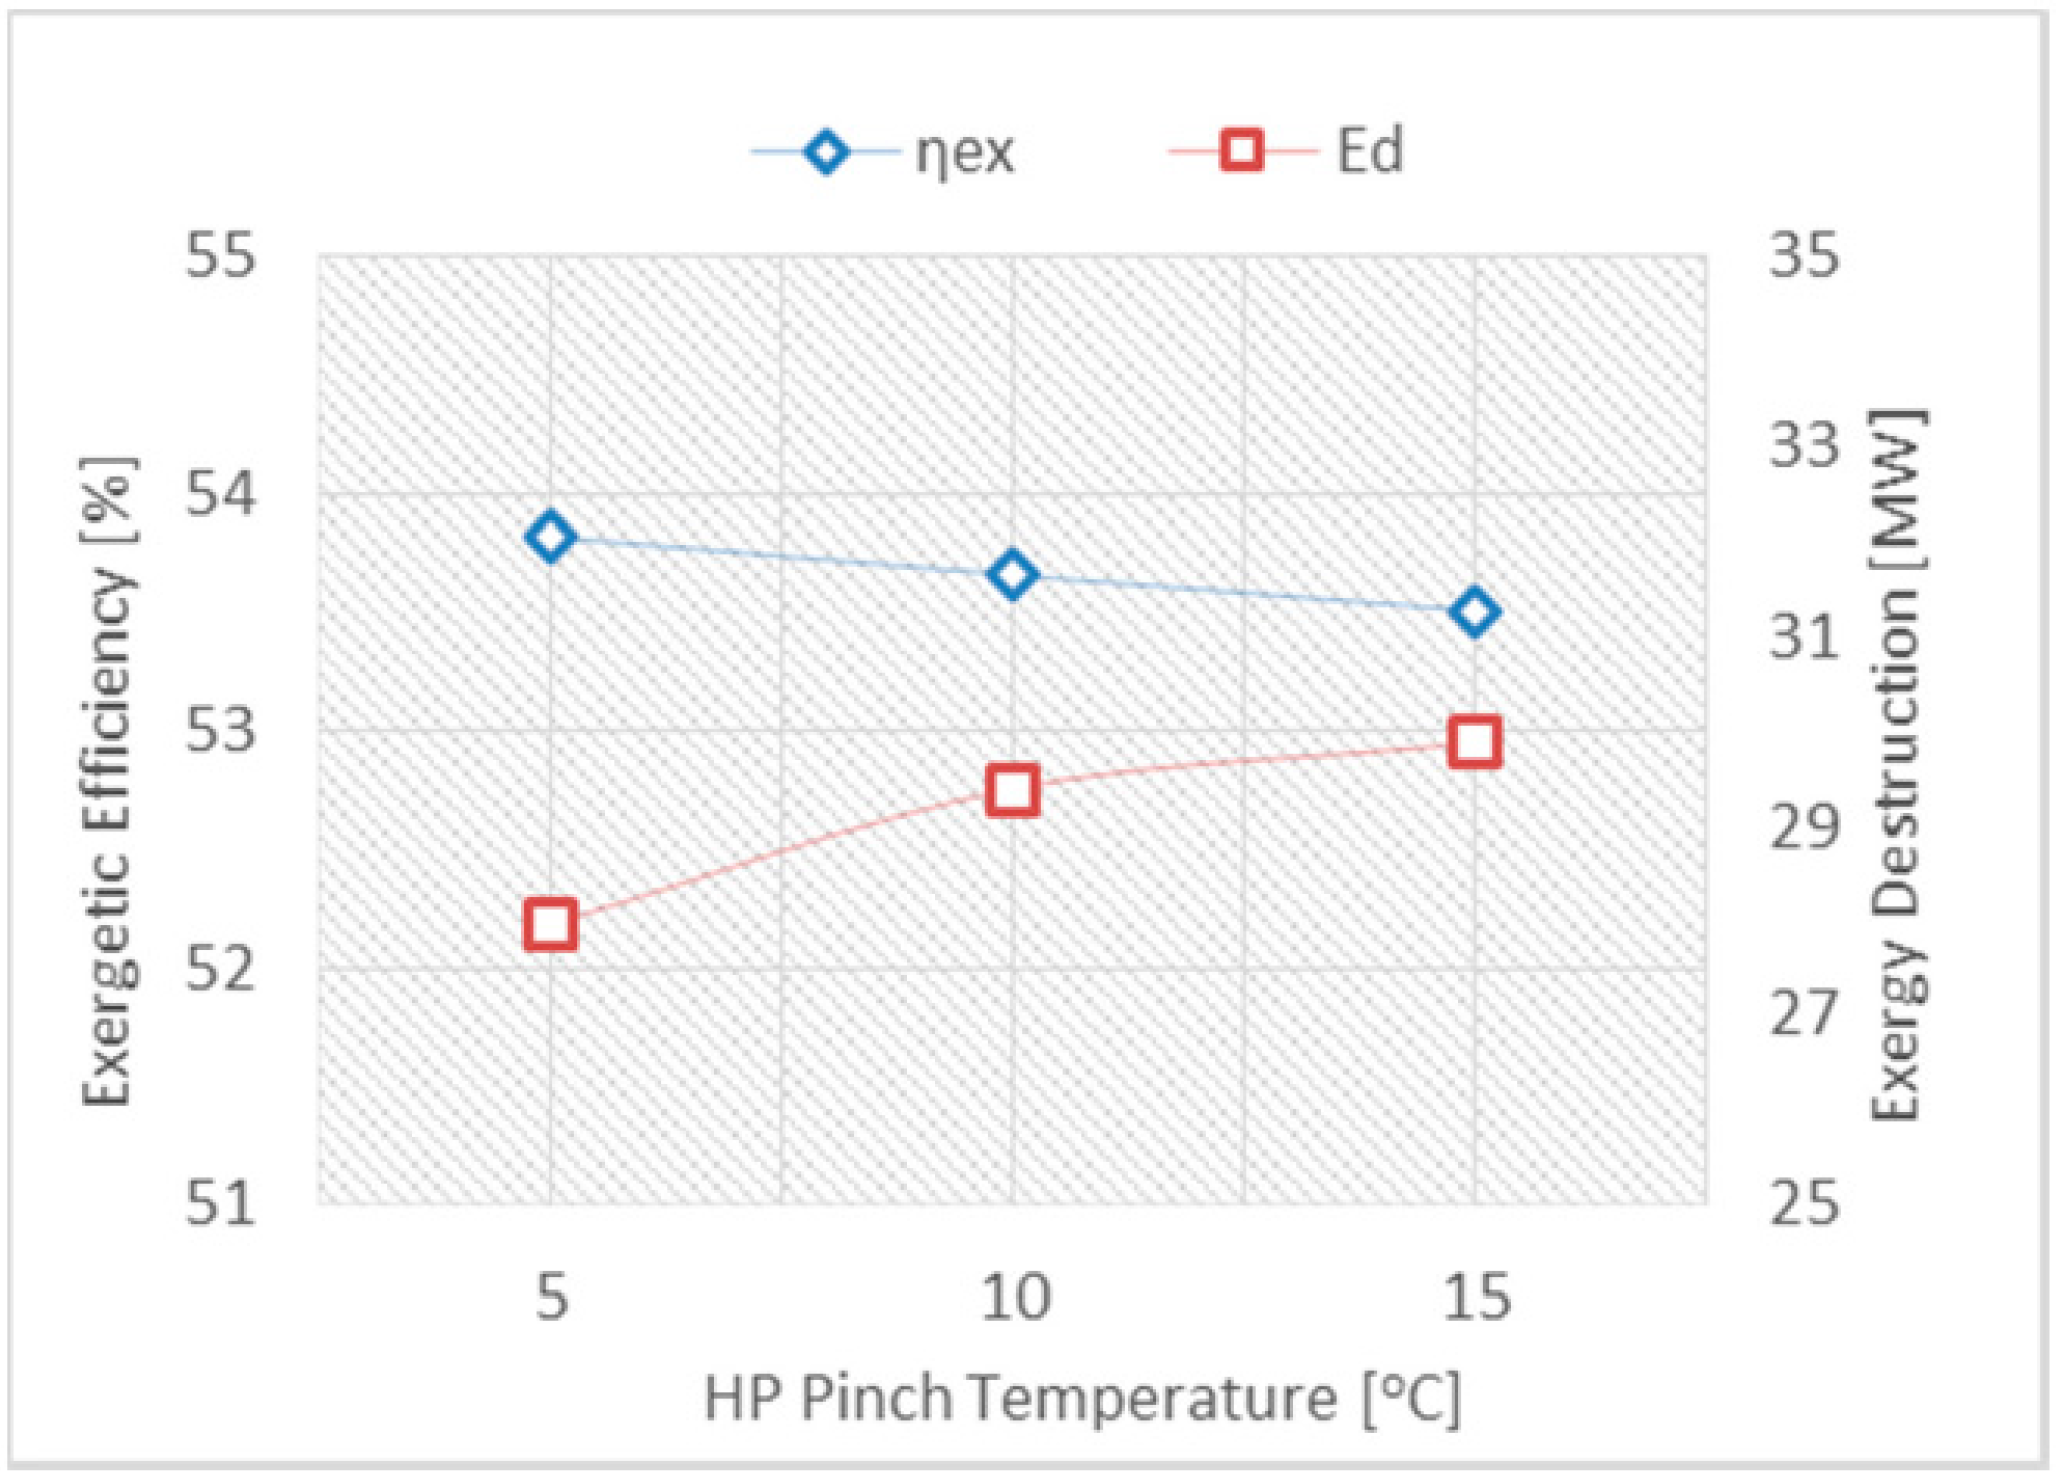
  • Regulating the HP pinch temperature at a low level will augment the CCPP’s efficiency, while a high approach temperature is always preferable in order to recover more energy from the exhaust gases from the gas turbine.
  • The temperature difference between the streams represents the major source of irreversibilities in the HRSG, and can be reduced either by preheating or adjusting the stream pressure.
  • A large number of components in high pressure stream is not desirable, and can create an adverse effect on the performance, based on the optimum design criteria of the thermal system.
From the analysis conducted above, it can be concluded that there are abundant possibilities for improving the Sabiya CCPP, using the existing designs, by optimising the operating conditions. Improving the thermodynamic performance always has both economic and environmental implications, as will be published in the forthcoming second part of this study, using exergoeconomic and exergoenvironmental analysis of the same power plant.

Acknowledgments

The authors wish to express their sincere thanks to the Ministry of Electricity and Water (MEW) in the state of Kuwait for its valuable support and assistance to the current work.

Author Contributions

The authors have contributed equally in writing and revision of this manuscript.

Conflicts of Interest

The authors declare no conflict of interest.

Nomenclature

E ˙
Rate of exergy flow in stream
e ˙ k ch
Specific molar chemical exergy
g
Acceleration of gravity
h
Specific enthalpy
h f g
Latent heat of vaporisation
LHV ¯
Low heating value in molar basis
m ˙
Mass flow rate
n ˙
Number of mole
P
Pressure of the stream
Q ˙
Heat transfer rate
R
Gas constant
R ¯
Universal gas constant
s
Specific entropy
S ˙
Entropy generation
T
Temperature of the stream
y
Mole fraction
v
Velocity
V
Specific volume
Z
Altitude
w ˙
Power

Greek letters

η e x
Exergetic Efficiency
Δ
Difference
λ ¯
Fuel-to-air ratio

Superscripts

ac
Actual
c
Cold Stream
ch
Chemical
cv
Control volume
d
Destruction
e
Outlet
f
Fuel
h
Hot Stream
i
Inlet
k
Component
ke
Kinetic energy
L
Loss
o
Reference state
p
Product
ph
Physical
pe
Potentials
S
Steam
st
Stoichiometric
sur
Surrounding

Abbreviations

AFR
Air to fuel ratio
AC
Air compressor
ATT
Attemperator
CC
Combustion chamber
CCPP
Combined Cycles Power Plant
EC
Economizer
EV
Evaporator
GE
General Electric
GT
Gas Turbine
HP
High-Pressure
IP
Intermediate-Pressure
ISO
International Standards Organization
LP
Low-Pressure
MEW
Ministry of Electricity and Water
RH
Reheat
SH
Super-Heater
ST
Steam Turbine

Appendix A: Molar and Energy Analysis

The molar air flow rate to fuel is related by:
1 λ ¯ = n ˙ a n ˙ f
where λ ¯ is the fuel-to-air ratio on a molar basis, while n ˙ a   and n ˙ f   represent the number of moles rate for air and fuel, respectively [1]. The number of mole rate is the ratio of mass flow rate to molecular weight.
n ˙ = m ˙ M
The chemical equation in mole fraction (y) terms takes the form:
λ ¯   [ 0.9334  CH 4 0.00211  C 2 H 6 0.00029  C 3 H 8 0.0642   N 2   ] + [ 0.7748    N 2   0.2059    O 2 0.019   H 2 O 0.0003  C O 2 ] ( 1 + λ ¯ ) [ y N 2   N 2   y O 2   O 2   y H 2 O   H 2 O y CO 2 C O 2 ]
Accordingly, the mole fractions of the combustion products at equilibrium mixture are:
y N 2   =   0.7748 + 0.0642 λ ¯ ( 1 + λ ¯ )
y CO 2 =   ( 0.0003 + 0.93849 λ ¯ ) ( 1 + λ ¯ )
y O 2 =   ( 0.2059 1.8763075 λ ¯ ) ( 1 + λ ¯ )
y H 2 O =   ( 0.019 + 1.87429 λ ¯ )   ( 1 + λ ¯ )
Once calculating   λ ¯ , the composition of combustion products can be determined. The AFR is obtained from the energy equation across the combustion chamber:
Q ˙ c v = n ˙ p h ¯ p n ˙ f h ¯ f n ˙ a h ¯ a
The heat transfer rate can be calculated from the LHV in molar bases while taking into account a 2% heat loss:
Q ˙ c v = 0.02   n ˙ f L H V ¯ = n ˙ a ( 0.02 λ ¯ ) L H V ¯
The fuel mass flow rate can be calculated by the balance between energy supplied by the fuel and combustion product enthalpies changed due to heat addition. Both air and combustion product enthalpies were determined at inlet and outlet temperatures of combustor using the principles of ideal gas mixture.
The energy rate balance for gas turbine rotating adiabatic components is given by:
Compressor : W ˙ A c = m ˙ a   ( h e h i )
Gas Turbine : W ˙ G T = m ˙ p   ( h i h e )
The adiabatic superheaters or reheaters, evaporators and economizers are the constituents of the heat recovery steam generator (HRSG) unit, and their energy rate balance equations are listed as follows:
Superheater  : m ˙ s   ( h e h i )   = m ˙ p   ( h i h e )
Evaporator : m ˙ s   h f g   = m ˙ p   ( h i h e )
Economizer : m ˙ w   ( h e h i )   = m ˙ p   ( h i h e )
where the subscripts   p   , s and w represent the combustion product, steam and water, respectively. The energy balance equations for the remaining steam cycle components (adiabatic steam turbine, deaerating condenser and the adiabatic pump) are given below:
Steam Turbine : W ˙ S T = m ˙ s   ( h i h e )
Dea-Condenser :   Q ˙ o u t = m ˙ w   ( h i h e )
Pump  : W ˙ p = m ˙ w   ( h e h i )

Appendix B: Properties and Exergy Flow Rates

Table B1. Exergetic data for the bottoming cycle at ISO condition.
PointLocation inlet outlet FluidMass flow rate (kg/s)Temperature (K)Pressure (bar)Enthalpy (kJ/kg)Entropy (kJ/kg. K)Exergy rate (MW)
1HP-ValveHP SH-2Steam149.65838.44119.903521.056.70238.28
1′HP STHP-ValveSteam149.65838.06118.903521.056.71238.12
2SplitterHP STSteam149.65625.8227.893126.916.79175.37
3To other HRSGSplitterSteam72.00625.8227.893126.916.7984.37
4MixerSplitterSteam77.65625.8227.893126.916.7991.00
5RH-1MixerSteam88.36620.0526.713116.116.80102.55
6IP ATTRH-1Steam88.36785.0025.213488.767.35121.25
7RH-2IP ATTSteam88.36765.0025.213444.207.30118.77
8MixerRH-2Steam88.36838.0024.013608.437.52127.50
9MixerFrom other HRSGSteam78.00838.0025.153607.437.50112.98
10IP-ValveMixerSteam166.36837.7523.913607.967.53239.92
10′IP STIP-ValveSteam166.36837.7423.893607.967.53239.89
11MixerIP STSteam166.36605.764.603132.867.62156.59
12LP STMixerSteam184.31603.554.603128.317.61173.05
13DEA-CondenserLP STSteam184.31324.340.132516.567.8249.17
14Condensate PumpDEA-CondenserWater192.99322.190.13205.300.691.51
15SplitterCondensate PumpWater192.99322.3322.31207.810.691.95
16To other HRSGSplitterWater96.49322.3322.31207.810.690.98
17LP ECMixerWater193.05367.7718.26397.731.247.91
17′SplitterLP ECWater193.05411.1712.26581.201.7217.01
18LP EV -ValueLP ECWater96.55411.1512.26581.201.728.51
18′LP EVLP EV -ValueWater96.55411.275.31581.201.728.46
19SplitterLP EVWater87.58426.565.71646.911.889.47
20LP SHLP EVSteam8.97426.525.212749.926.817.10
21MixerLP SHSteam8.97584.854.913088.997.518.32
22MixerFrom other HRSGSteam8.97582.004.853083.247.518.28
23LP-ValveMixerSteam17.95583.394.853086.117.5116.59
23′MixerLP-ValveSteam17.95583.284.753086.117.5216.54
24IP Feed pumpSplitterWater11.43426.565.71646.911.881.24
25HP Feed pumpSplitterWater76.15426.565.71646.911.888.23
26SplitterIP Feed pumpWater11.43426.8929.38649.791.881.27
27IP ECSplitterWater11.11426.8929.38649.791.881.23
28IP ATT -ValueSplitterWater0.32426.8929.38649.791.880.04
29IP EV -ValueIP ECWater11.11499.1428.98971.522.572.58
29′IP EVIP EV -ValueWater11.11499.1328.88971.522.572.58
30IP SHIP EVSteam11.11504.7128.782803.156.2010.91
31RH -ValueIP SHSteam10.71588.1527.883037.766.6512.05
31′MixerRH -ValueSteam10.71588.1327.873037.766.6512.05
32HP EC -ValueHP Feed pumpWater76.15428.68158.30665.441.889.55
32′SplitterHP EC -ValueWater76.15429.06132.30665.441.899.41
33HP EC-1SplitterWater76.15429.06132.30665.441.899.31
34HP EC-2HP EC-1Water75.36506.45132.251007.742.6219.21
35HP EC-3HP EC-2Water75.36583.98131.851401.503.3433.21
36HP EVHP EC-3Steam75.36604.01131.801530.683.5638.23
37HP SP-1HP EVSteam74.65604.79131.302659.795.4382.02
38HP ATTHP SP-1Steam74.65693.29128.303101.546.12100.00
39HP ATT -ValueSplitterWater0.78429.06132.30665.441.890.10
40HP SP-2IP ATT Steam74.65672.29128.203028.956.0296.87
41MixerHP SP-2Steam74.65841.65125.203524.216.69119.42
42MixerFrom other HRSGSteam75.00838.00122.003517.916.69119.42
Table B2. Exergetic data for the topping cycle at ISO condition.
PointLocation inlet outletFluidMass flow rate (kg/s)Temperature (K)Pressure (bar)Enthalpy (kJ/kg)Entropy (kJ/kg. K)Exergy rate (MW)
AAC AirAir577.22288.001.0115.016.850.00
BCC ACAir577.22684.6417.02426.476.93223.91
CCC FuelFuel14.05368.0018.91142.27---- 663.47
DGT CCExhaust Gases591.271550.0016.521532.688.22717.15
EHP SH-3 GTExhaust Gases591.27897.811.05702.148.34205.62
FRH-2 HP SH-3Exhaust Gases591.27845.641.05639.618.27180.77
GRH-1 RH-2Exhaust Gases591.27825.001.05615.078.24171.17
HHP SH-2 RH-1Exhaust Gases591.27777.801.05559.388.17149.98
IHP EV HP SH-2Exhaust Gases591.27730.001.05503.618.10129.51
JHP EC-3 HP EVExhaust Gases591.27613.001.04369.787.9084.29
KIP SH HP EC-3Exhaust Gases591.27598.371.04353.327.8779.09
LLP SH IP SHExhaust Gases591.27594.591.04349.077.8677.69
MHP EC-2 LP SHExhaust Gases591.27590.001.04343.927.8676.03
NIP EV HP EC-2Exhaust Gases591.27545.001.04293.737.7761.33
OIP EC IP EVExhaust Gases591.27513.871.03259.337.7051.96
PHP EC-1 IP ECExhaust Gases591.27508.381.03253.287.6950.30
QLP EV HP EC-1Exhaust Gases591.27468.551.03209.657.6039.62
RLP EC LP EVExhaust Gases591.27429.501.03167.237.5130.54
S ------- LP ECExhaust Gases591.27373.881.03107.337.3620.46

References

  1. Bejan, A.; Moran, M.J. Thermal Design and Optimization; John Wiley & Sons: Hoboken, NJ, USA, 1996. [Google Scholar]
  2. Dincer, I.; Rosen, M.A. Exergy: Energy, Environment and Sustainable Development; Elsevier: Amsterdam, The Netherlands, 2012. [Google Scholar]
  3. Aydin, H. Exergetic sustainability analysis of LM6000 gas turbine power plant with steam cycle. Energy 2013, 57, 766–774. [Google Scholar] [CrossRef]
  4. Tawney, R.K.; Ugolini, D.J.; Wengert, T.J.; Narula, R.G. Steam cycle selection considerations for combined cycleplant. In Proceedings of the Joint Power Generation Conference, Boston, MA, USA, 21–25 October 1990.
  5. Kotas, T.J. The Exergy Method of Thermal Plant Analysis; Elsevier: Amsterdam, The Netherlands, 2013. [Google Scholar]
  6. Facchini, B.; Fiaschi, D.; Manfrida, G. Exergy analysis of combined cycles using latest generation gas turbines. J. Eng. Gas Turbines Power 2000, 122, 233–238. [Google Scholar] [CrossRef]
  7. Moran, M.J.; Shapiro, H.N.; Boettner, D.D.; Bailey, M.B. Fundamentals of Engineering Thermodynamics; John Wiley & Sons: Hoboken, NJ, USA, 2010. [Google Scholar]
  8. Rahim, M.A. Combined cycle power plant performance analyses based on the single-pressure and multipressure heat recovery steam generator. J. Energy Eng. 2011, 138, 136–145. [Google Scholar] [CrossRef]
  9. Rahim, M.A. Thermodynamic evaluation and parametric study of a combined cycle power plant: Application for Ankara City. J. Energy Eng. 2013, 140, 1–10. [Google Scholar] [CrossRef]
  10. Ersayin, E.; Ozgener, L. Performance analysis of combined cycle power plants: A case study. Renew. Sustain. Energy Rev. 2015, 43, 832–842. [Google Scholar] [CrossRef]
  11. Ameri, M.; Ahmadi, P.; Khanmohammadi, S.H. Exergy analysis of a 420 MW combined cycle power plant. Int. J. Energy Res. 2008, 32, 175–183. [Google Scholar] [CrossRef]
  12. Sue, D.-C.; Chuang, C.-C. Engineering design and exergy analyses for combustion gas turbine based power generation system. Energy 2004, 29, 1183–1205. [Google Scholar] [CrossRef]
  13. Petrakopoulou, F.; Tsatsaronis, G.; Morosuk, T.; Carassai, A. Conventional and advanced exergetic analyses applied to a combined cycle power plant. Energy 2012, 41, 146–152. [Google Scholar] [CrossRef]
  14. Ministry of Electricity and Water (MEW), State of Kuwait. Private Communication.
  15. López Paniagua, I.; Rodríguez Martín, J.; González Fernandez, C.; Jiménez Alvaro, Á.; Nieto Carlier, R. A new simple method for estimating exergy destruction in heat exchangers. Entropy 2013, 15, 474–489. [Google Scholar] [CrossRef]
  16. Jin, Z.; Dong, Q.; Liu, M. Exergy study of fouling factors in heat exchanger networks. J. Heat Transf. 2010, 132, 011802. [Google Scholar] [CrossRef]

