
Power Transmission Scheduling for Generators in a Deregulated Environment Based on a Game-Theoretic Approach

Abstract
:1. Introduction
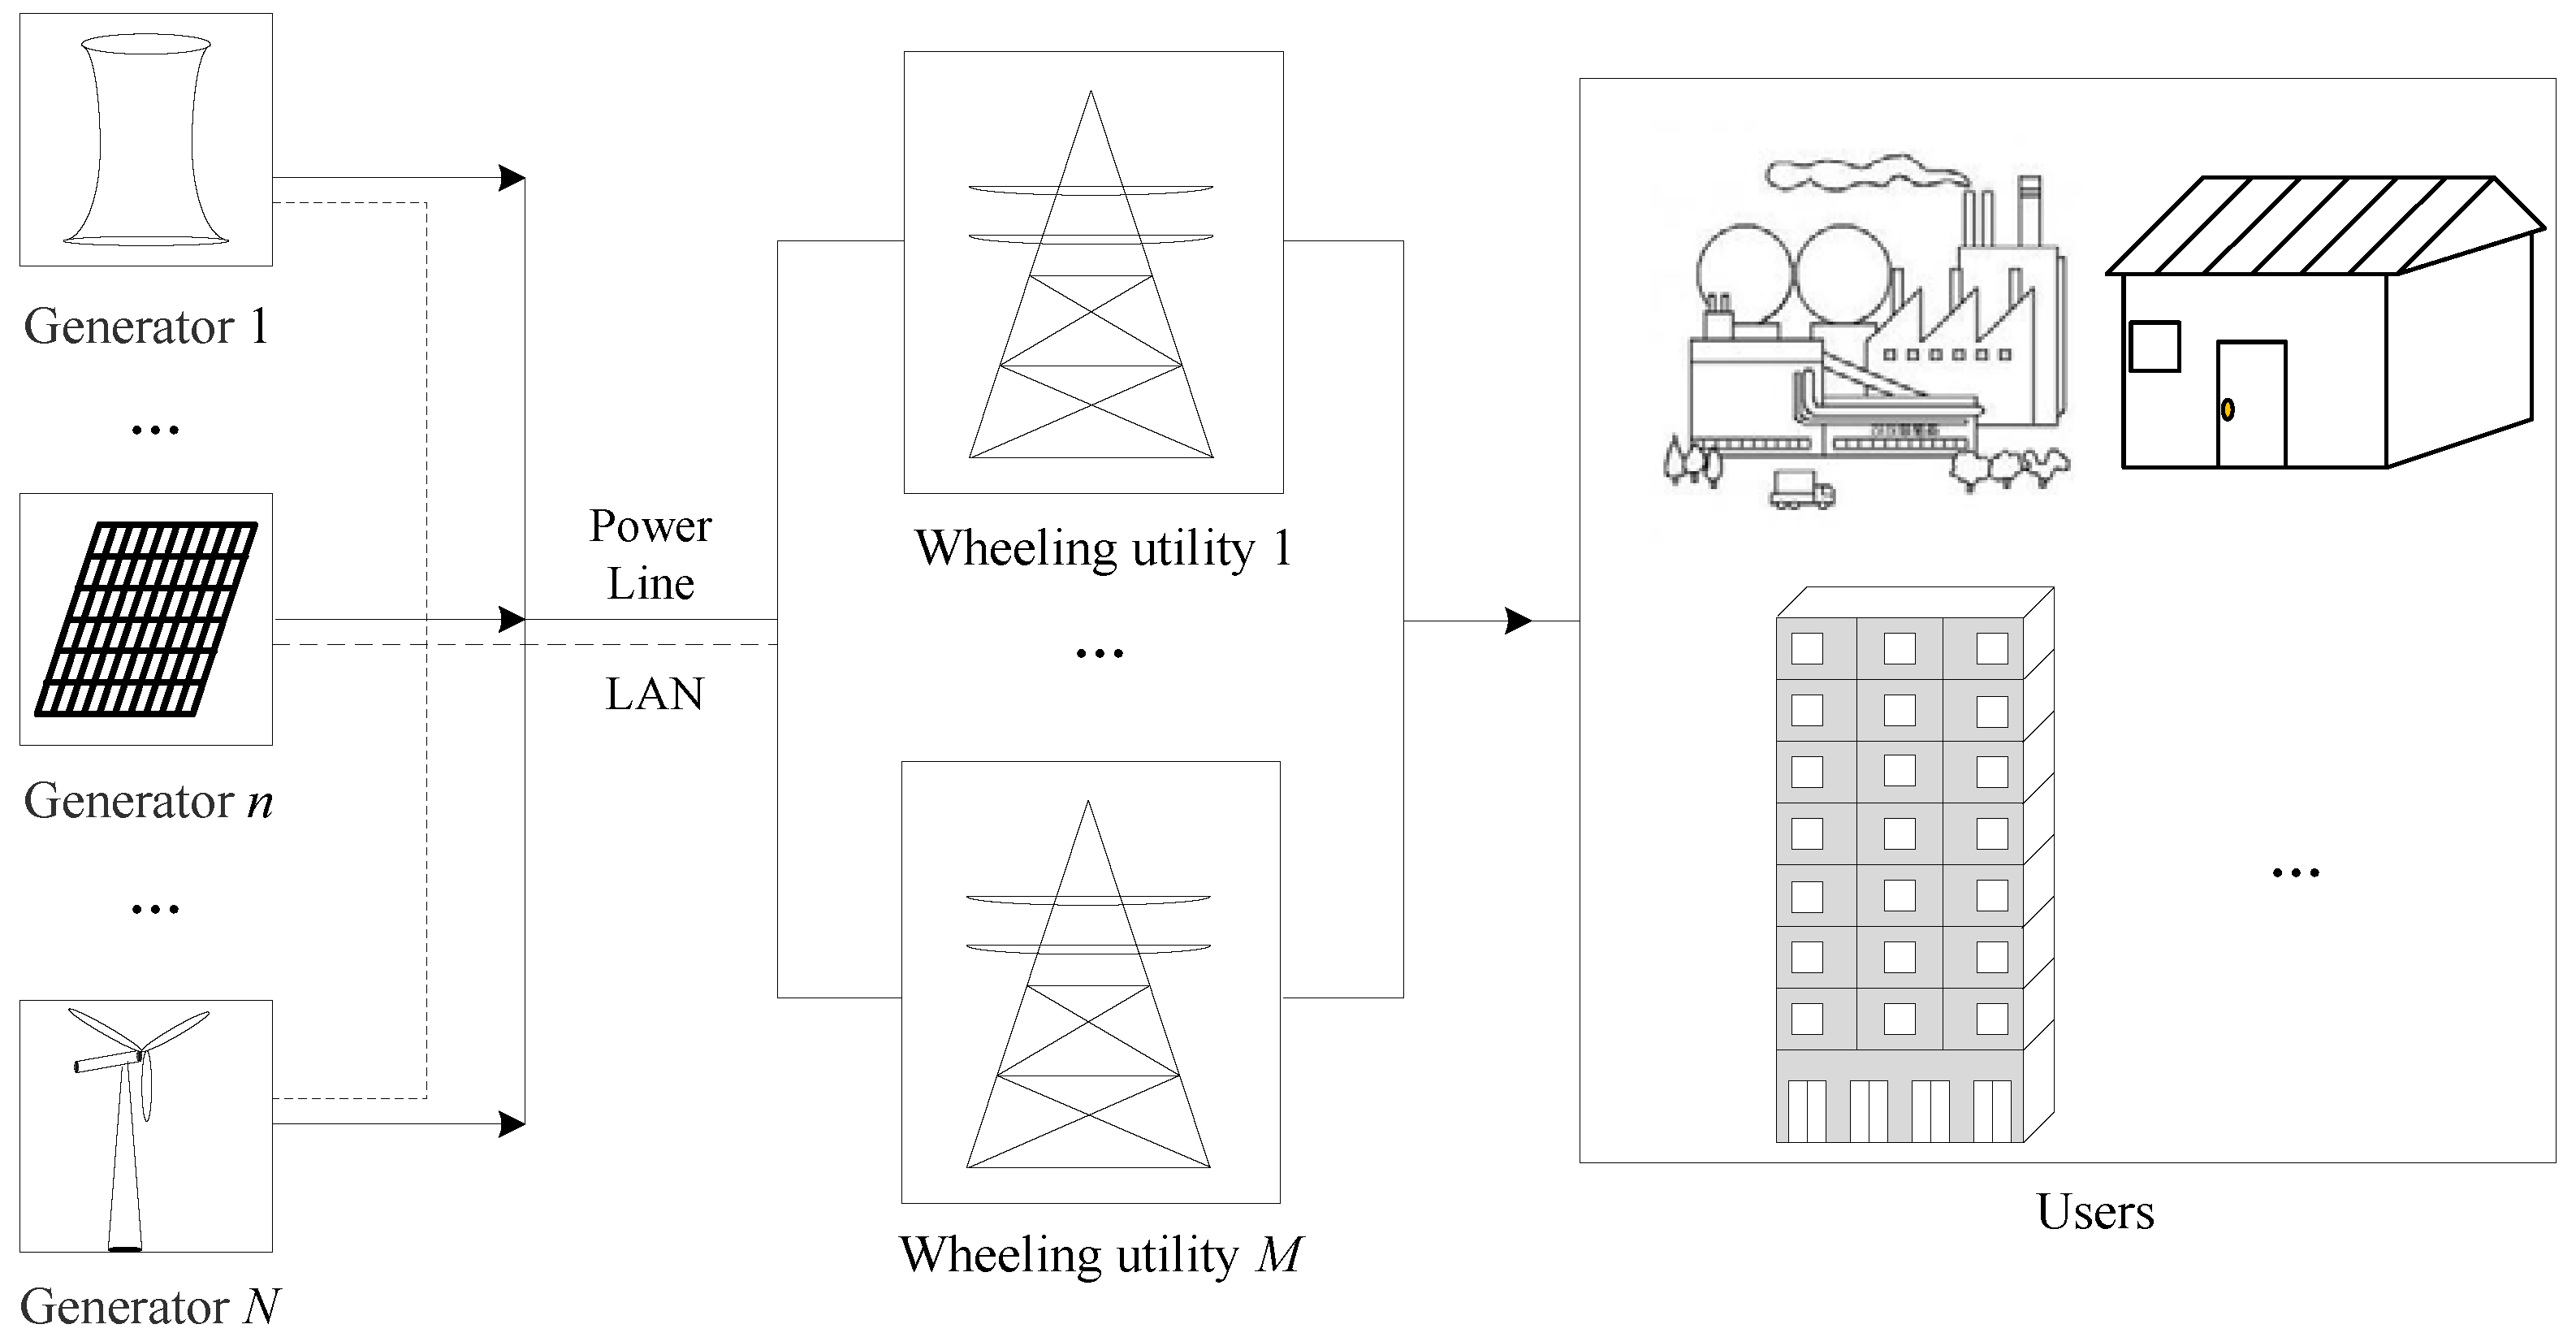
2. System Model
2.1. Wheeling Cost Model

2.2. Cost Model of Generators
3. Non-cooperative Game-Theoretic Approach
3.1. Non-Cooperative Game
- Players: Generators in the set .
- Strategies: Each generator selects its power transmission strategy to maximize its payoff.
- Payoffs: Gains and costs from adjusting power transmission scheduling for each generator . Given a certain strategy choice by any generator, the utility function can be characterized by:where denotes the power transmission scheduling for all generators except the generator n.
- Nash equilibrium: Consider the game played among a set of players. The power transmission scheduling for each generator form a unique Nash equilibrium if and only if we have:
3.2. Algorithm for the Wheeling Cost Game
| Algorithm 1: Executed by generator n. |
|
4. Simulation and Discussion
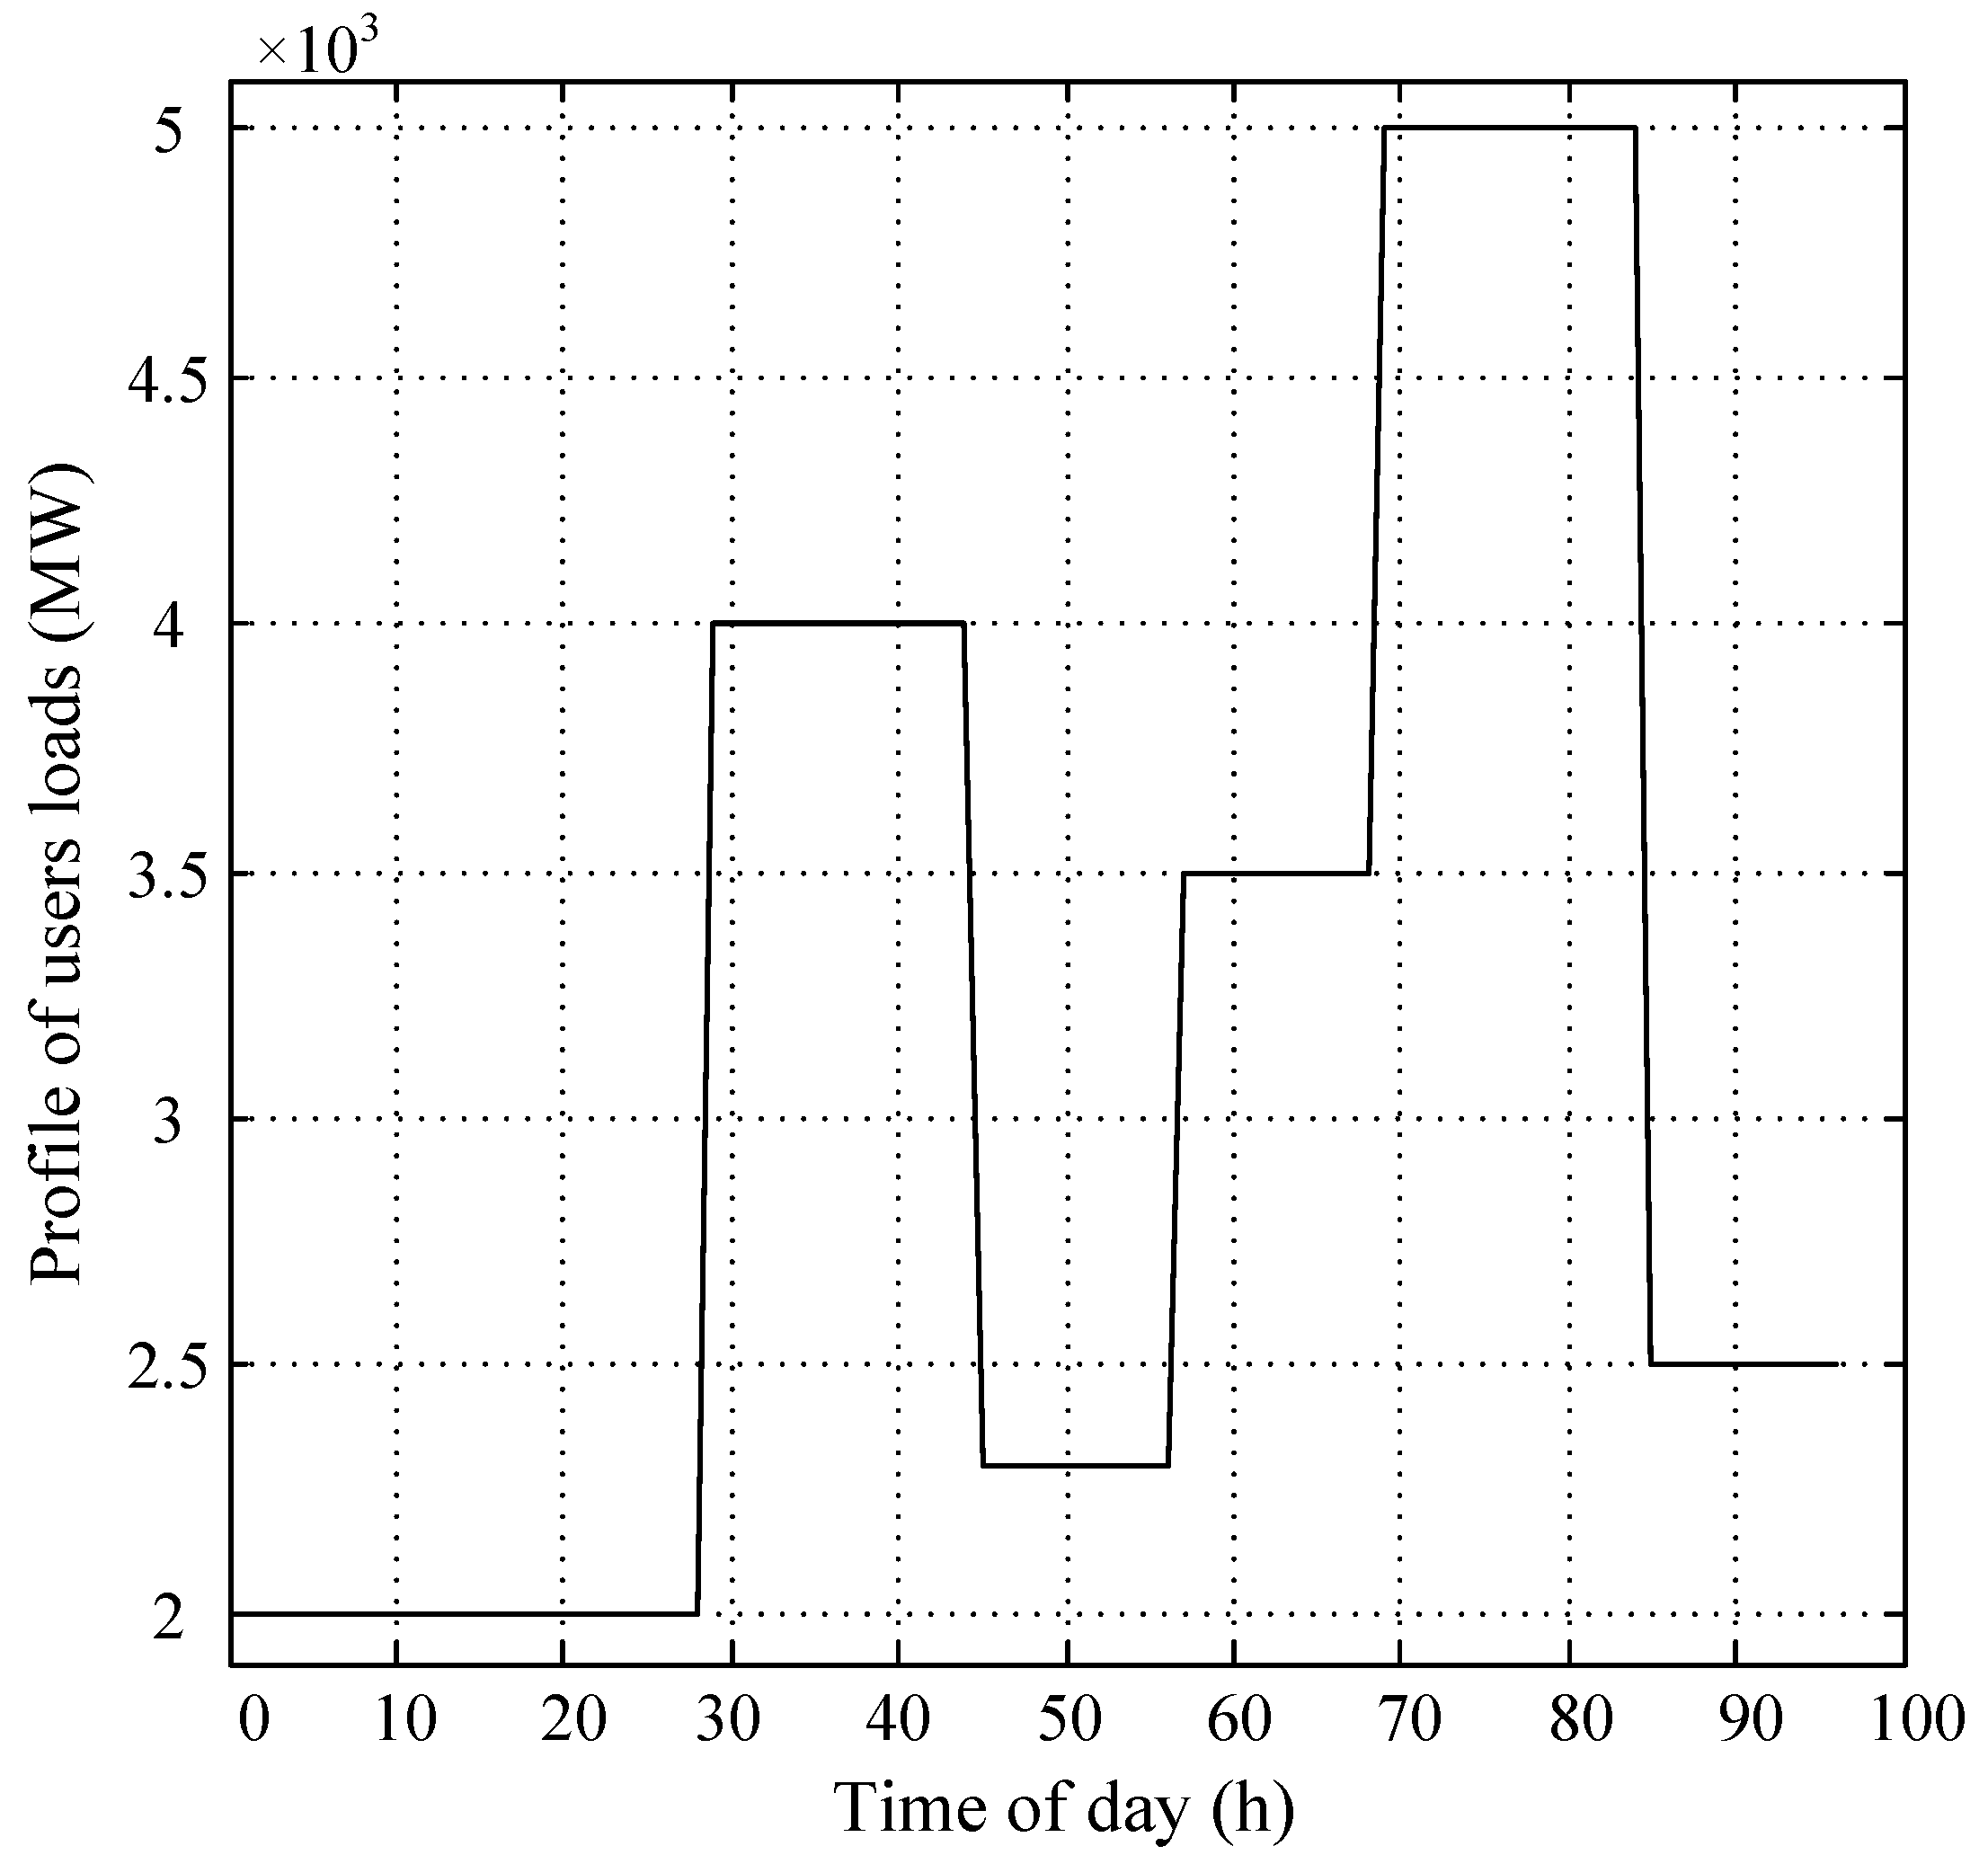
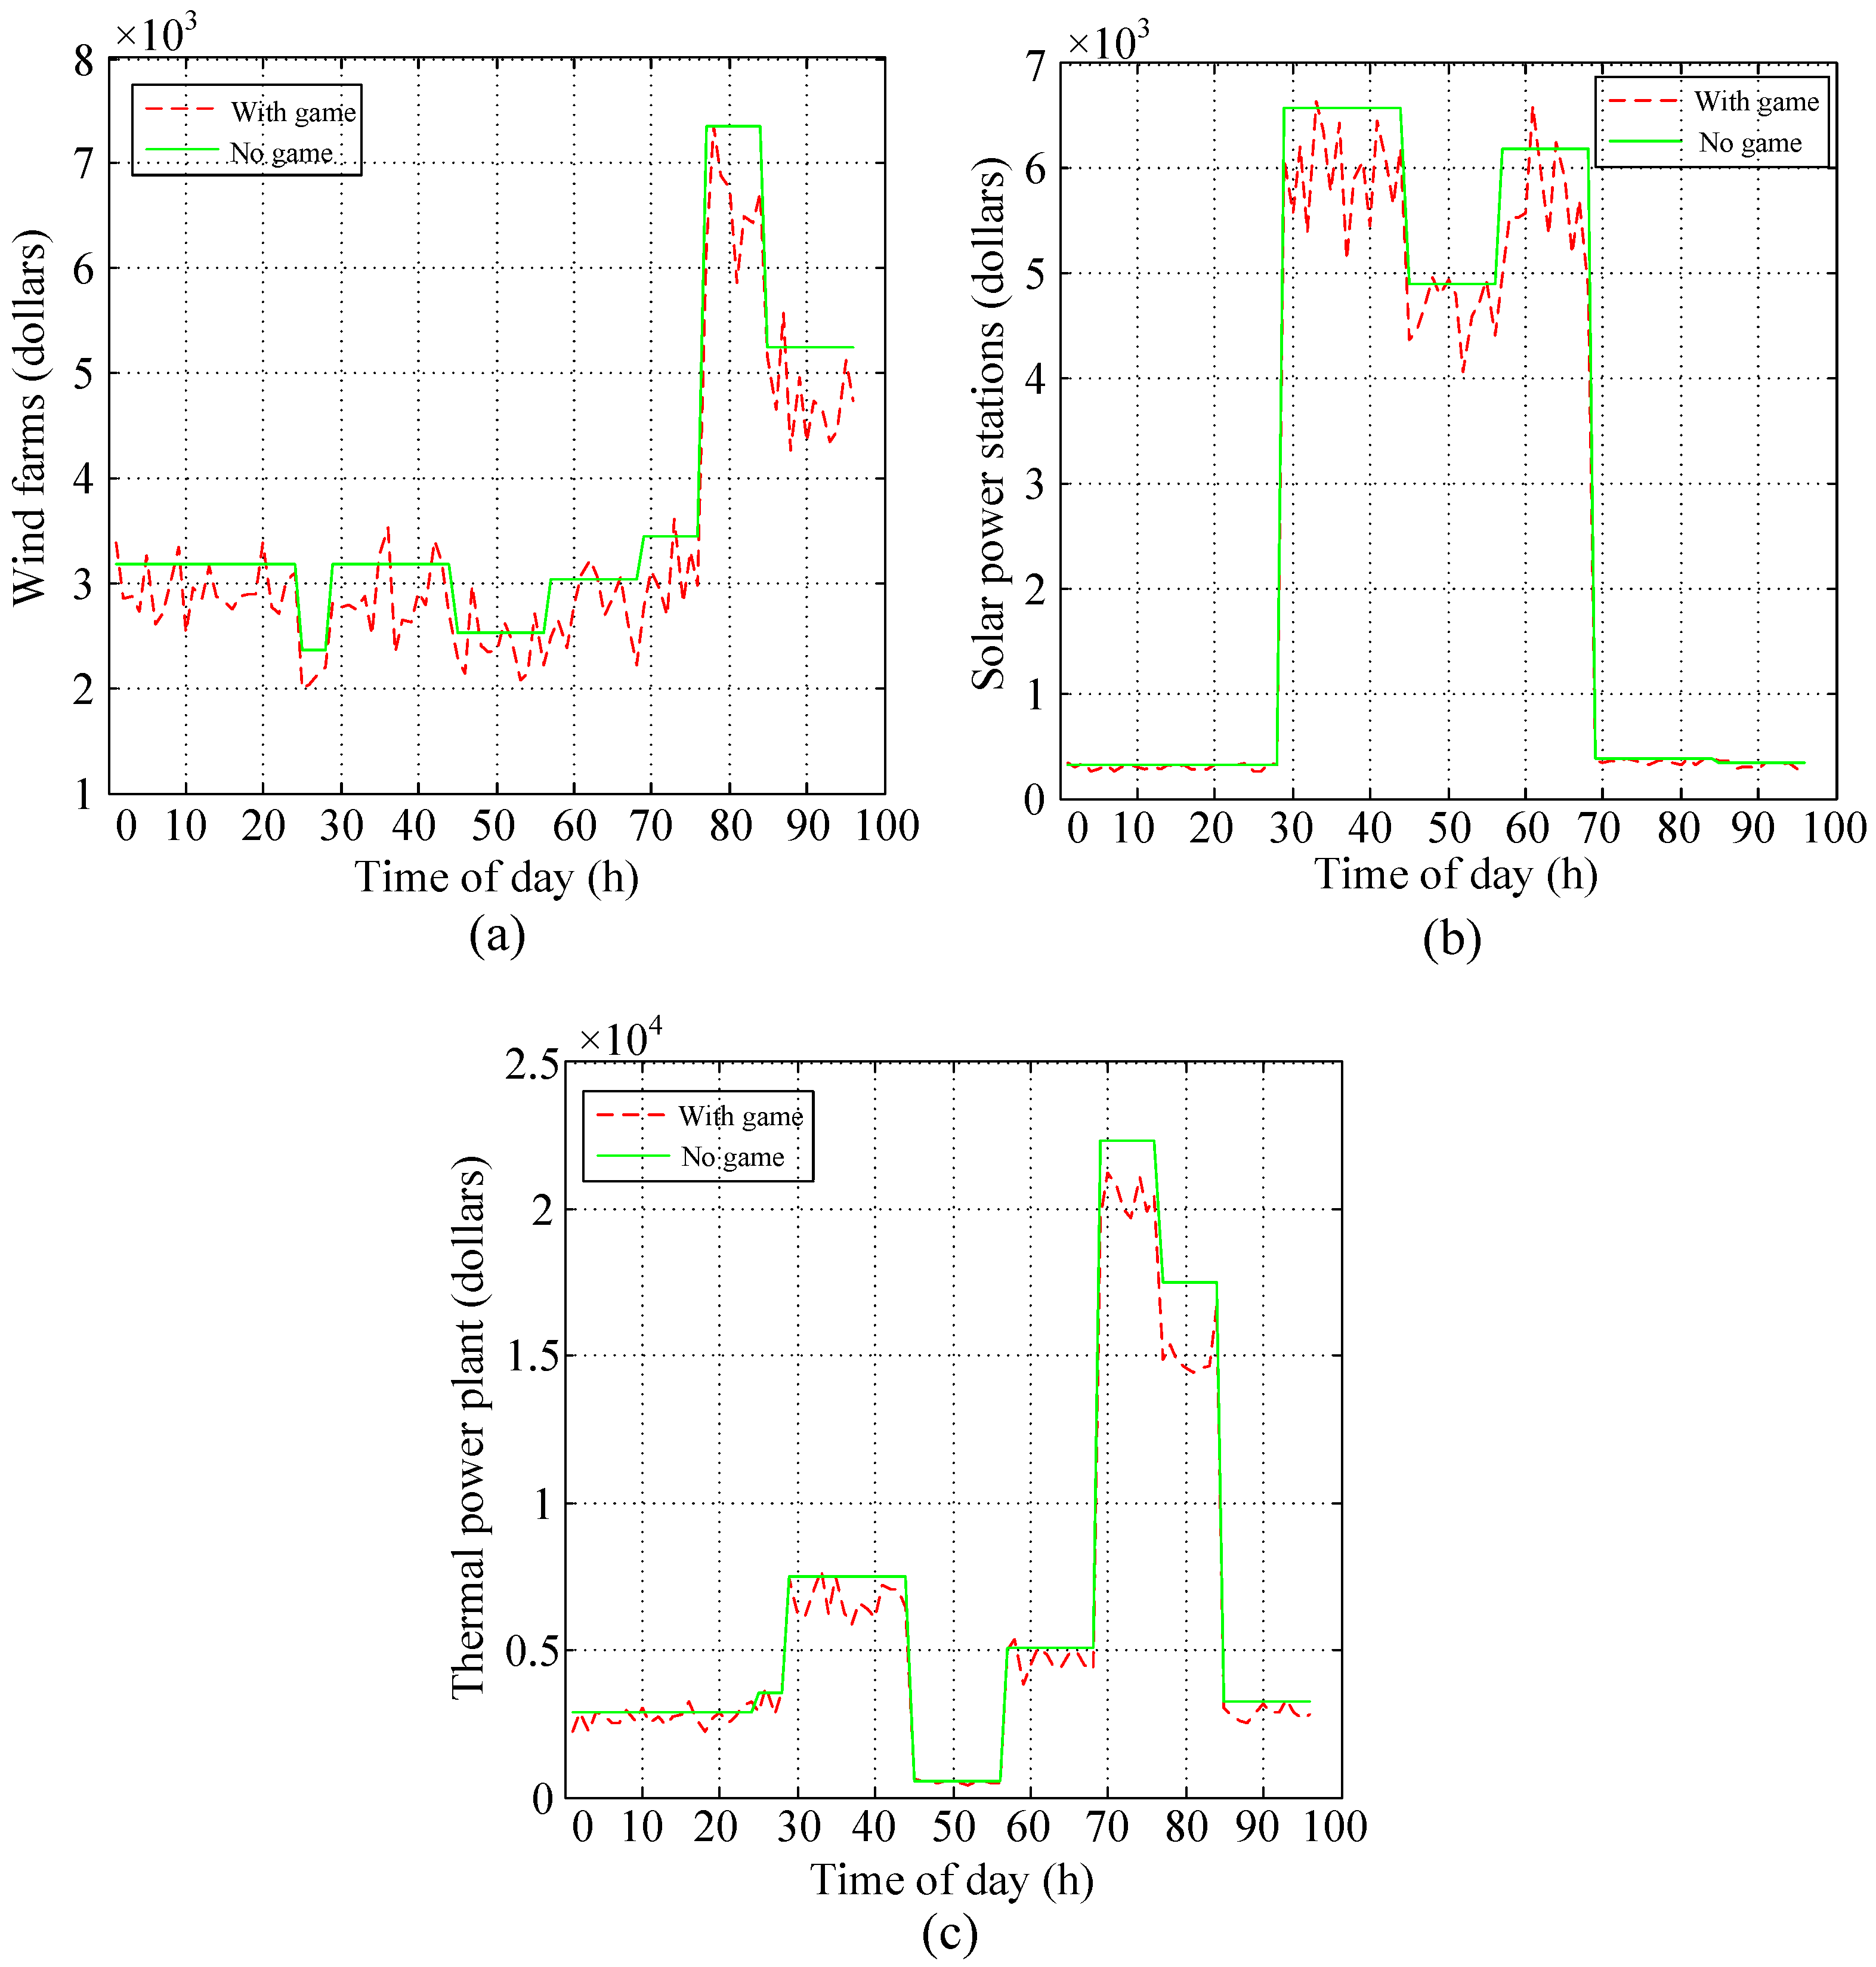
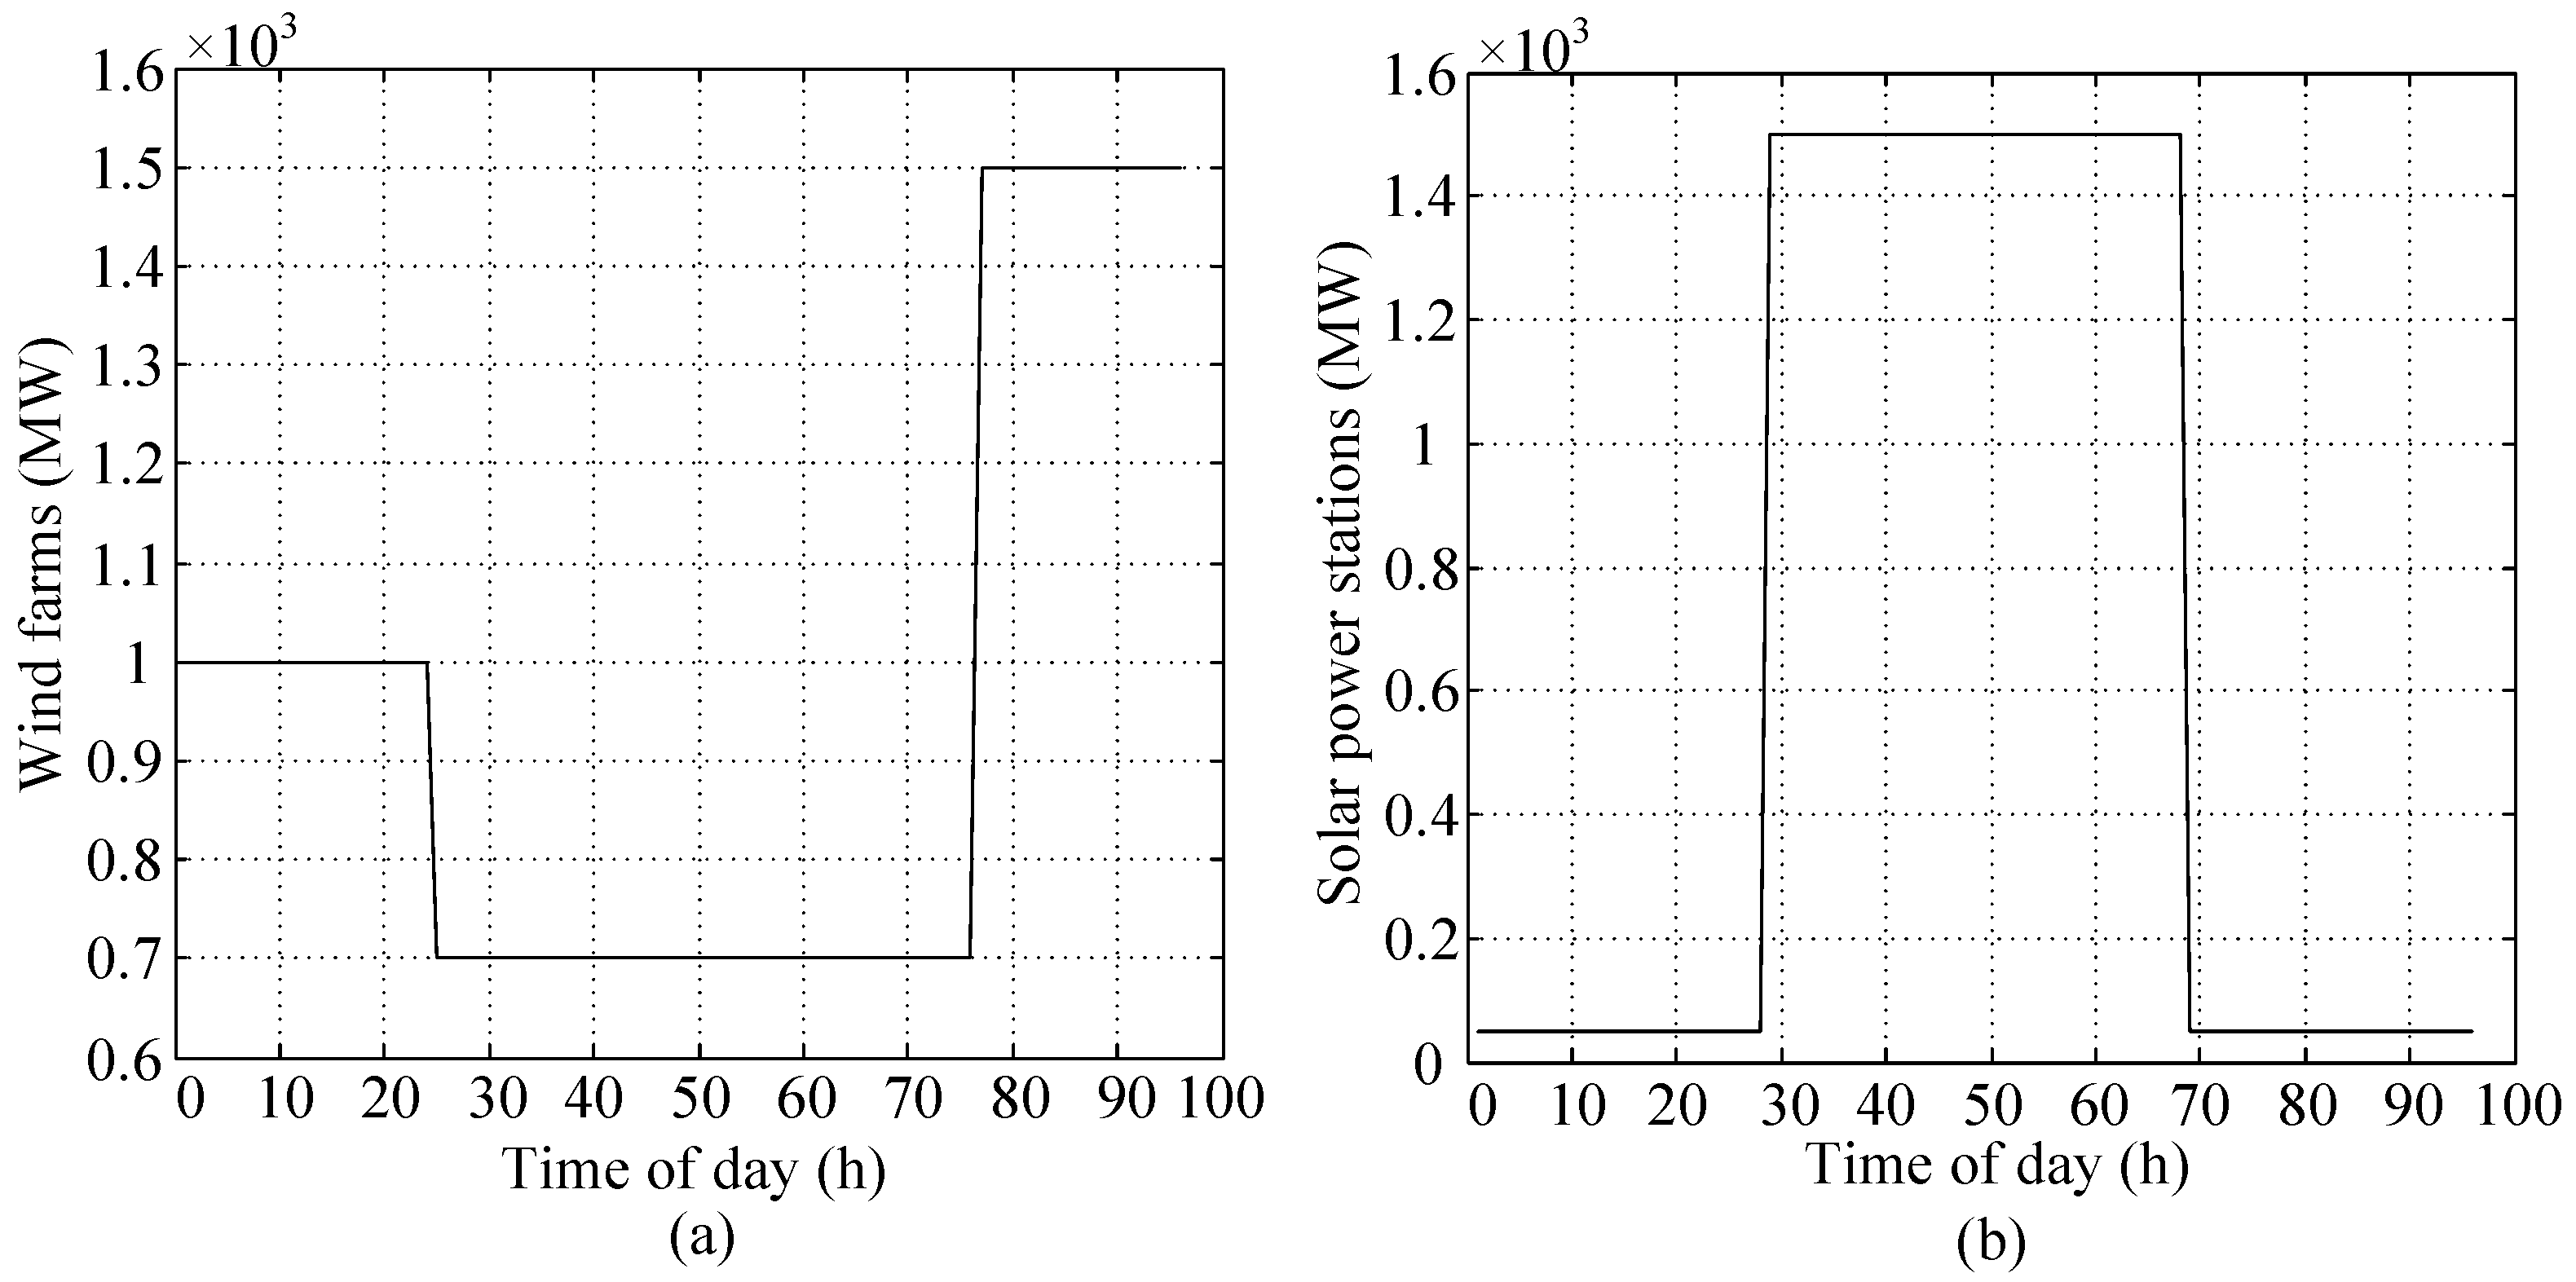
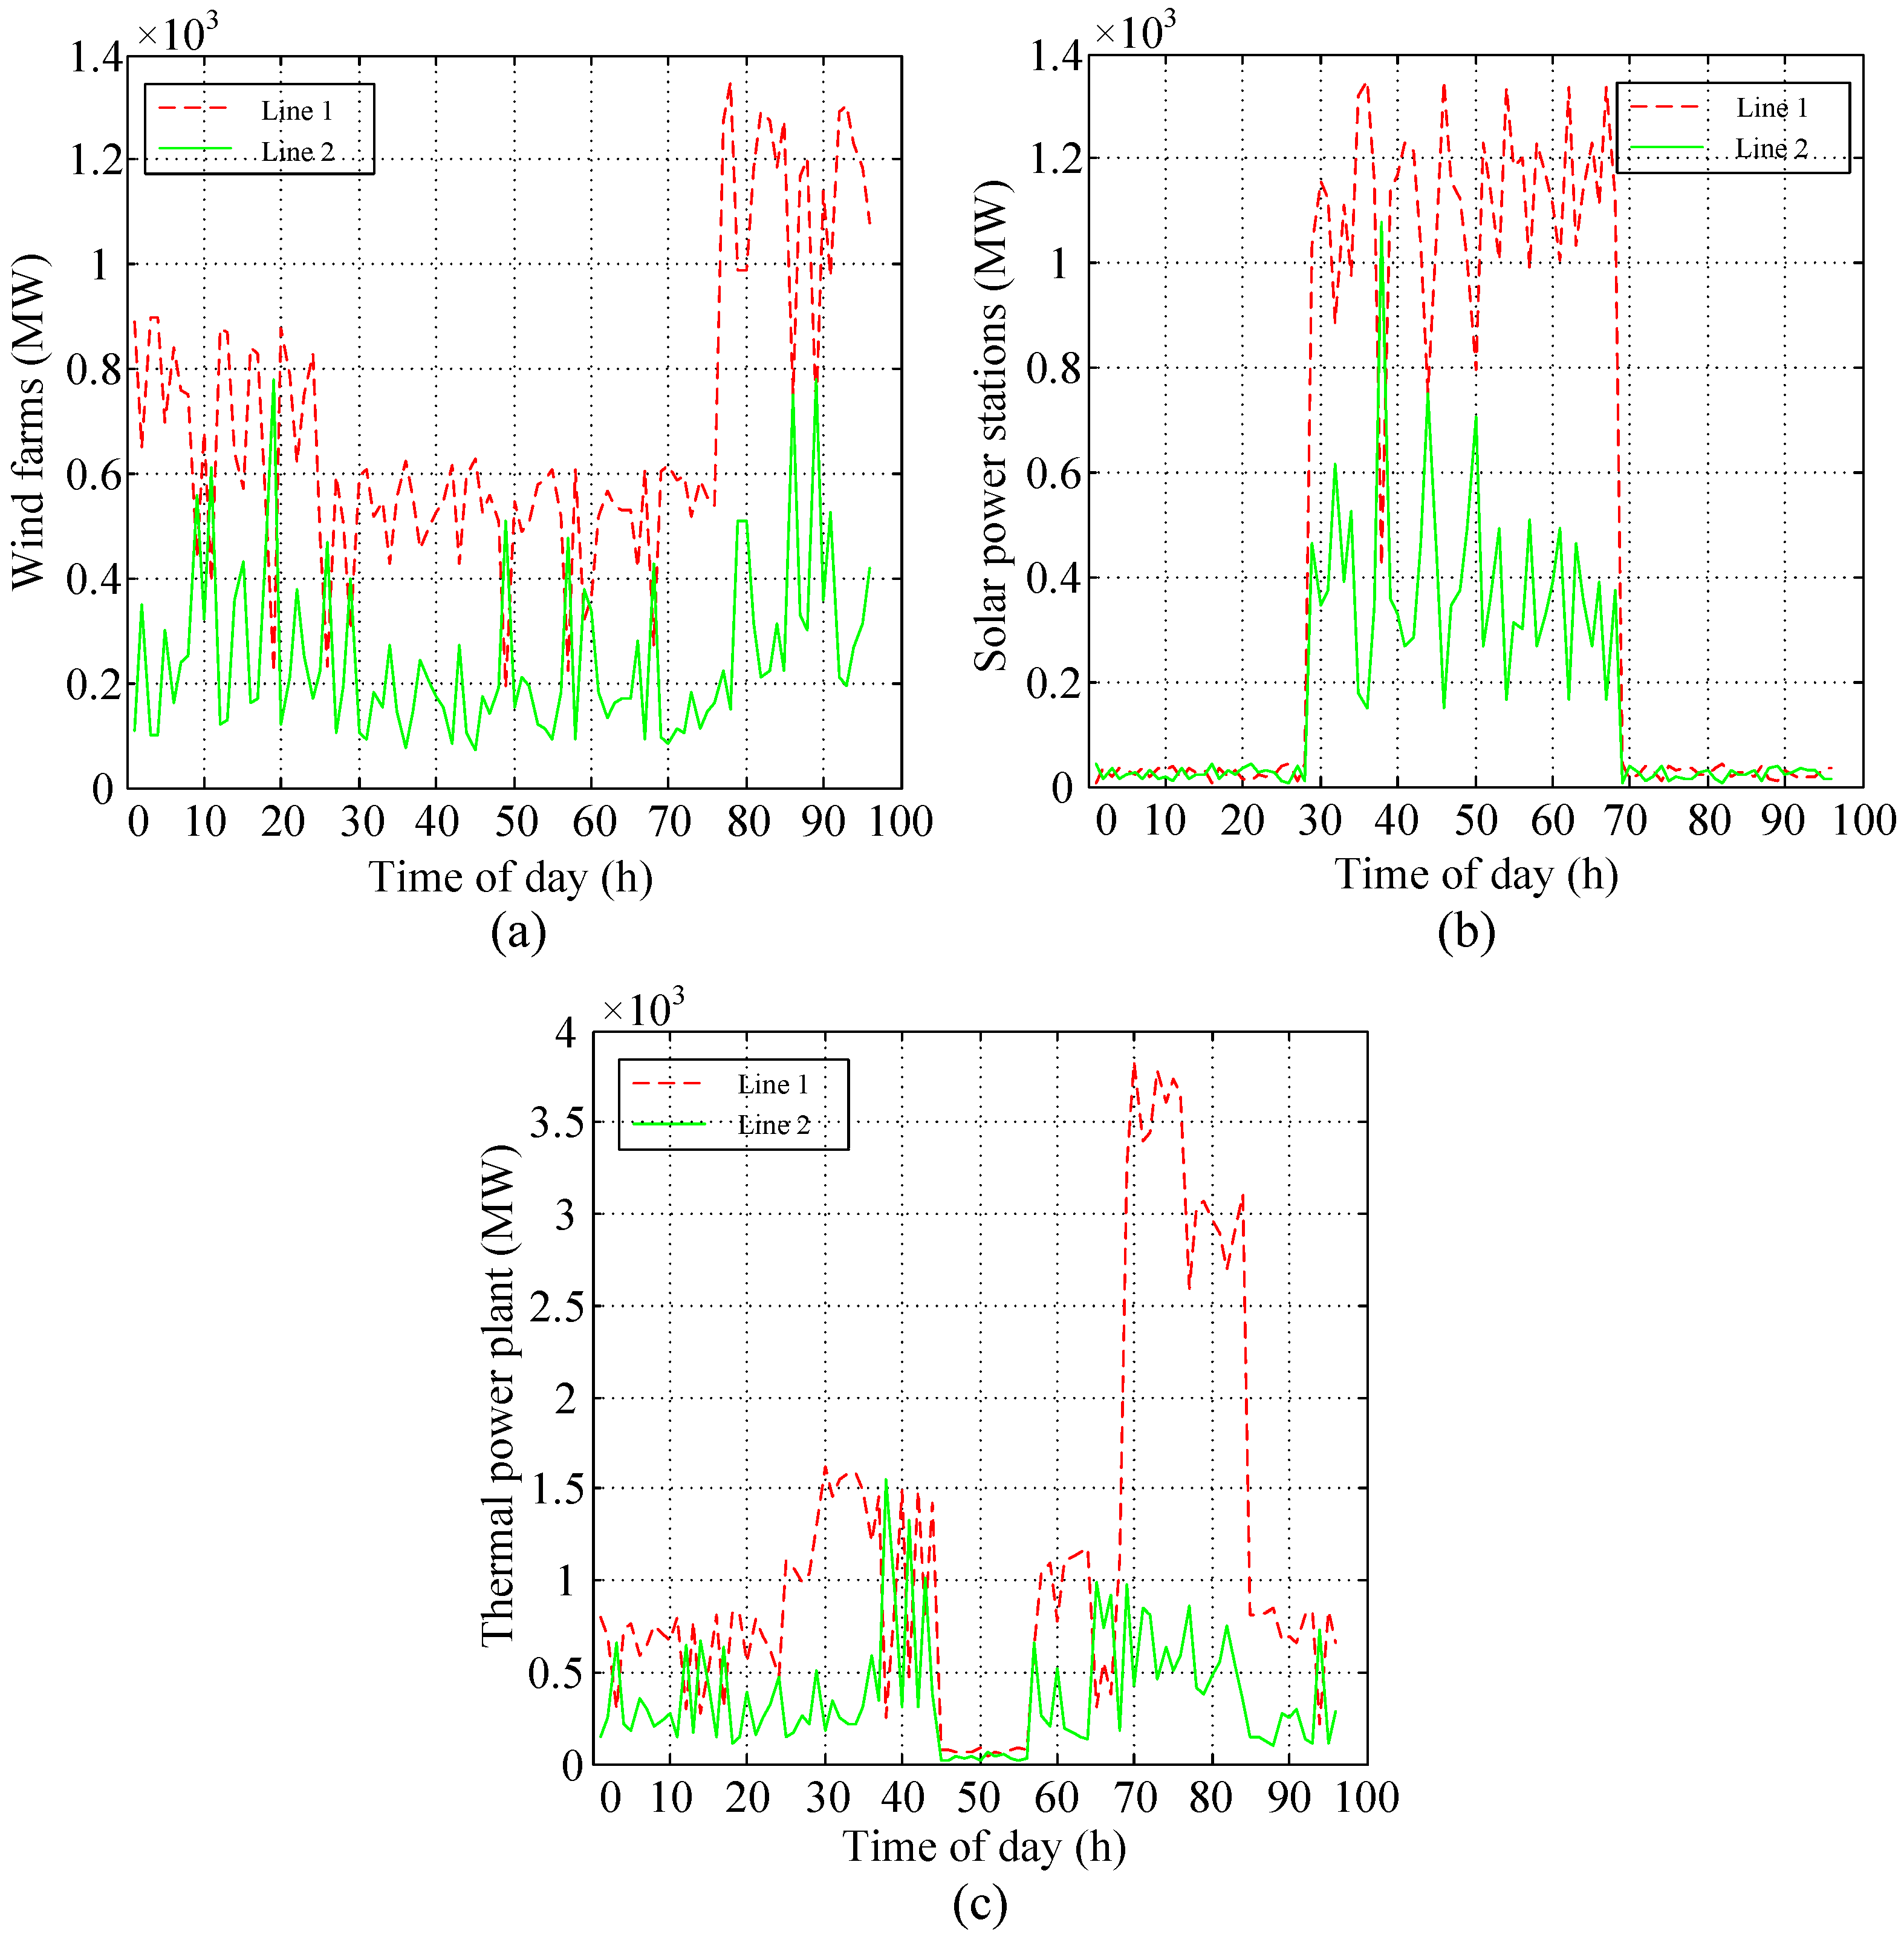
4.1. Simulation Results


| Generators | With Game | No Game | |
|---|---|---|---|
| Wind farm | 79,372 | 88,198 | 8826 |
| Solar power station | 64,681 | 68,571 | 3890 |
| Thermal power plant | 139,950 | 152,590 | 12,640 |
| Condition | No Game | With Game | Central Control | ||
|---|---|---|---|---|---|
| Wheeling cost | 309,359 | 284,003 | 285,675 | 25,356 | 23,684 |
4.2. Discussions
5. Conclusions
Acknowledgments
Author Contributions
Conflicts of Interest
Nomenclature
Set of indices of generators | |
| N | Number of generators |
Set of indices of transmission lines | |
| M | Number of transmission lines |
| q | Transmitted electricity energy |
| R | Cost of transmission capacity |
| W | Cost of losses |
| Z | Congestion cost |
| r | Discount rate |
| t | Recovery period |
| Tm | Investment cost of transmission line m |
| Qm,year | Predicted transmission capacity of transmission line m during one year |
| C (q) | Generation cost |
| σ | Line loss rate |
| qm,max | Maximum transmission capacity of transmission line m |
| qm,all | Power flow on transmission line m of all generators |
| qn,m | Power flow related to generator n on transmission line m |
Generated energy at time slot h | |
Set of indices of time slots | |
| H | Number of time slots |
| qn | Vector of generation scheduling for generator n in a whole day |
| xn,m | Vector of power transmission scheduling |
Proportion of energy transported by line m in total energy generated by generator n at time slot h | |
The minimum proportion | |
The maximum proportion | |
Total energy consumption of end users at each time slot h | |
Set of power transmission scheduling | |
| qn,m | Vector of electric quantity transported by transmission line m of each generator n |
| qm,all | Vector of total power transmission of transmission line m |
| cn,m | Electric quantity transported by transmission line m of all generators except generator n |
| Pn | Total cost of each generator n |
Appendix A
Appendix B
References
- Electricity price reform project group of economic and technical research institute of Hubei electric power company. Enlightenment of reform pilot of transmission and distribution price in Shenzhen. China Power Enterp. Manag. 2015, 13, 58–63. (in Chinese). [Google Scholar]
- Lee, W.J.; Lin, C.H.; Swift, L.D. Wheeling charge under a deregulated environment. IEEE Trans. Ind. Appl. 2001, 37, 178–183. [Google Scholar]
- Happ, H.H. Cost of wheeling methodologies. IEEE Trans. Power Syst. 1994, 9, 147–156. [Google Scholar] [CrossRef]
- Bashian, A.; Hojat, M.; Javidi, M.H.; Golmohamadi, H. Security-based tariff for wheeling contracts considering fair congestion cost allocation. J. Control Autom. Electr. Syst. 2014, 25, 368–380. [Google Scholar] [CrossRef]
- Kumar, N.; Reddy, Y.R.V.; Das, D.; Padhy, N.P. Transmission cost allocation by using MW-Mile approaches in a restructured Indian power system. In Proceedings of the Power and Energy Society General Meeting, Minneapolis, MN, USA, 25–29 July 2010; pp. 1–8.
- Orfanos, G.A.; Georgilakis, P.S.; Hatziargyriou, N.D. A more fair power flow based transmission cost allocation scheme considering maximum line loading for N-1 security. IEEE Trans. Power Syst. 2013, 28, 3344–3352. [Google Scholar] [CrossRef]
- Shirmohammadi, D.; Gribik, P.R.; Law, E.T.K.; Malinowski, J.H.; O’Donnell, R.E. Evaluation of transmission network capacity use for wheeling transactions. IEEE Trans. Power Syst. 1989, 4, 1405–1413. [Google Scholar] [CrossRef]
- Gu, C.; Li, F. Long-run marginal cost pricing based on analytical method for revenue reconciliation. IEEE Trans. Power Syst. 2011, 26, 103–110. [Google Scholar] [CrossRef] [Green Version]
- Rao, M.S.S.; Soman, S.A. Marginal pricing of transmission services using min-max fairness policy. IEEE Trans. Power Syst. 2015, 30, 573–584. [Google Scholar] [CrossRef]
- Rubio-Oderiz, F.J.; Perez-Arriaga, I.J. Marginal pricing of transmission services: A comparative analysis of network cost allocation methods. IEEE Trans. Power Syst. 2000, 15, 448–454. [Google Scholar] [CrossRef]
- Nojeng, S.; Hassan, M.Y.; Said, D.M.; Abdullah, M.P.; Hussin, F. Improving the MW-Mile method using the power factor-based approach for pricing the transmission services. IEEE Trans. Power Syst. 2014, 29, 2042–2048. [Google Scholar] [CrossRef]
- Monsef, H.; Jaefari, M. Transmission cost allocation based on use of reliability margin under contingency conditions. IET Gener. Transm. Distrib. 2009, 3, 574–585. [Google Scholar] [CrossRef]
- Molina, Y.P.; Saavedra, O.R.; Amaris, H. Transmission network cost allocation based on circuit theory and the Aumann-Shapley method. IEEE Trans. Power Syst. 2013, 28, 4568–4577. [Google Scholar] [CrossRef]
- Pandya, K.S.; Joshi, S.K. Sensitivity and particle swarm optimization-based congestion management. Electr. Power Compon. Syst. 2013, 41, 465–484. [Google Scholar] [CrossRef]
- Hazra, J.; Sinha, A.K. Congestion management using multiobjective particle swarm optimization. IEEE Trans. Power Syst. 2007, 22, 1726–1734. [Google Scholar] [CrossRef]
- Pandi, V.R.; Biswas, A.; Dasgupta, S.; Panigrahi, B.K. A hybrid bacterial foraging and differential evolution algorithm for congestion management. Eur. Trans. Electr. Power 2010, 20, 862–871. [Google Scholar] [CrossRef]
- Panigrahi, B.K.; Pandi, R.V. Congestion management using adaptive bacterial foraging algorithm. Energy Convers. Manag. 2009, 50, 1202–1209. [Google Scholar] [CrossRef]
- Singh, K.; Yadav, V.K.; Padhy, N.P.; Sharma, J. Congestion management considering optimal placement of distributed generator in deregulated power system networks. Electr. Power Compon. Syst. 2014, 42, 13–22. [Google Scholar] [CrossRef]
- Singh, H.; Hao, S.Y.; Papalexopoulos, A. Transmission congestion management in competitive electricity markets. IEEE Trans. Power Syst. 1998, 13, 672–680. [Google Scholar] [CrossRef]
- Erli, G.; Takahasi, K.; Chen, L.; Kurihara, I. Transmission expansion cost allocation based on cooperative game theory for congestion relief. Electr. Power Energy Syst. 2005, 27, 61–67. [Google Scholar] [CrossRef]
- Kiani, A.; Annaswamy, A. Wholesale energy market in a smart grid: Dynamic modeling and stability. In Proceedings of the 50th IEEE Conference on Decision and Control and European Control Conference, Orlando, FL, USA, 12–15 December 2011; pp. 2202–2207.
- Bejestani, A.K.; Annaswamy, A. A dynamic mechanism for wholesale energy market: Stability and robustness. IEEE Trans. Smart Grid 2014, 5, 2877–2888. [Google Scholar] [CrossRef]
- Papavasiliou, A.; Hindi, H.; Greene, D. Market-based control mechanisms for electric power demand response. In Proceedings of the 49th IEEE Conference on Decision and Control, Atlanta, MS, USA, 15–17 December 2010; pp. 1891–1898.
- Tadahiro, T.; Koki, K.; Yoshiro, F.; Tomohiro, T.; Shiro, Y. Automated dinear function submission-based double auction as bottom-up real-time pricing in a regional prosumers’ electricity network. Energies 2015, 8, 7381–7406. [Google Scholar]
- Luo, Q.; Lu, L. Wheeling price calculating method in the price of direct power transmission to large customers. Electr. Power Sci. Eng. 2008, 24, 38–41. (in Chinese). [Google Scholar]
- Kang, M.-S. Generation cost assessment of an isolated power system with a fuzzy wind power generation model. IEEE Trans. Energy Convers. 2007, 22, 397–404. [Google Scholar] [CrossRef]
- Frihauf, P.; Krstic, M.; Basar, T. Nash equilibrium seeking in noncooperative games. IEEE Trans. Autom. Control 2012, 57, 1192–1207. [Google Scholar] [CrossRef]
- Wang, Y.P.; Saad, W.; Zhu, H.; Poor, H.V.; Basar, T. A game-theoretic approach to energy trading in the smart grid. IEEE Trans. Smart Grid 2014, 5, 1439–1450. [Google Scholar] [CrossRef]
- Dasgupta, P.; Maskin, E. The existence of equilibrium in discontinuous economic games, I: Theory. Rev. Econ. Stud. 1986, 53, 1–26. [Google Scholar] [CrossRef]
© 2015 by the authors; licensee MDPI, Basel, Switzerland. This article is an open access article distributed under the terms and conditions of the Creative Commons by Attribution (CC-BY) license (http://creativecommons.org/licenses/by/4.0/).
Share and Cite
Gao, B.; Ma, T.; Tang, Y. Power Transmission Scheduling for Generators in a Deregulated Environment Based on a Game-Theoretic Approach. Energies 2015, 8, 13879-13893. https://doi.org/10.3390/en81212401
Gao B, Ma T, Tang Y. Power Transmission Scheduling for Generators in a Deregulated Environment Based on a Game-Theoretic Approach. Energies. 2015; 8(12):13879-13893. https://doi.org/10.3390/en81212401
Chicago/Turabian StyleGao, Bingtuan, Tingting Ma, and Yi Tang. 2015. "Power Transmission Scheduling for Generators in a Deregulated Environment Based on a Game-Theoretic Approach" Energies 8, no. 12: 13879-13893. https://doi.org/10.3390/en81212401