Article

Effects of Alkali and Alkaline Earth Metals on N-Containing Species Release during Rice Straw Pyrolysis

National Engineering Laboratory for Biomass Power Generation Equipment, North China Electric Power University, 2 Beinong Road, Beijing 102206, China
*
Author to whom correspondence should be addressed.
Energies 2015, 8(11), 13021-13032; https://doi.org/10.3390/en81112356
Submission received: 28 September 2015 / Revised: 29 October 2015 / Accepted: 10 November 2015 / Published: 17 November 2015
(This article belongs to the Collection Bioenergy and Biofuel)

Abstract

:
To study the effects of inherent and external alkali and alkaline earth metallic species (AAEMs, i.e., K, Ca and Mg) on the behavior of N-containing species release during rice straw (RS) pyrolysis, different pretreatments were applied in numerous experiments. Results indicate that ammonia (NH3) and hydrogen cyanide (HCN) are the major N-containing species and that the yields of isocyanic acid (HNCO) and nitric oxide (NO) are relatively low. The removal of inhert AAEMs shifts N-containing species release to a high-temperature zone according to volatile release behavior because of the increase in activation energy. The formation selectivity of NH3, HNCO, and NO increases by demineralized pretreatment, whereas HCN selectivity decreases. The formation of HNCO is mainly affected by alkaline earth metal. N-containing species release occurs in low temperatures with the addition of external AAEMs. The activation energy of samples impregnated with CaCl2 and MgCl2 sharply decreases compared to the original RS. The total yields of N-containing species are reduced significantly in the presence of KCl, CaCl2, and MgCl2 as additives. The inhibition ability of AAEMs follows the sequence MgCl2 > CaCl2 > KCl. The inhibition effect of MgCl2 can be improved by solution immersion compared with solid powder mixing. The clean biomass pyrolysis and gasification technology with low N-containing species content may be developed according to the results.

Graphical Abstract

1. Introduction

As an alternative fuel, biomass has drawn a significant attention in the past decades. Rice straw (RS), wheat straw, and cornstalk are the main biomass resources of biomass power plants in China [1,2,3]. The capacity of biomass power generation plants will reach 13,000 MW by the end of 2015. At present, approximately 1 × 10⁹ MT of biomass is used to generate power per year in China. Although the nitrogen mass contents of biomass and coal are similar, the NOx emission of biomass in per heat combustion is higher than that of coal at a lower calorific value. With regard to air pollution and public health concerns, the NOx emissions of power plants have been strictly limited to 100 mg/Nm3 by law in China. Considerable attention has been given on NOx reduction to meet increasingly strict environmental standards. However, traditional Selective Catalytic Reduction (SCR) denitrification technology is unsuitable for biomass power plants because high alkali content in biomass leads to rapid catalyst deactivation [4]. The flue gas denitrification of biomass power plants is a significant challenge. Thus, detailed information on the release of N-containing species during biomass pyrolysis has received increasing attention for optimal NOx emission control [5].
Pyrolysis is the initial step of biomass thermal utilization, wherein fuel nitrogen will be converted to volatile-N and char-N during biomass pyrolysis. Volatile-N such as ammonia (NH3), hydrogen cyanide (HCN), and isocyanic acid (HNCO) will be oxidized to NOx in the subsequent oxidation process [6]. N-containing species release during coal pyrolysis has been studied for more than 20 years. However, the N conversions of biomass and coal are caused by different N occurrence forms. The main N-containing compounds of coal are pyrrole and pyridine, whereas the main N-containing compounds of biomass are proteins and amino acids [7]. In recent years, N release and conversion during biomass pyrolysis have been considered by several researchers. Most previous studies focus on the effects of pyrolysis conditions, such as temperature, particle size, biomass type, and atmosphere on N-containing species formation [8,9,10,11]. Furthermore, model compounds such as amino acids, proteins, and 6-disubstituted-2,5-diketopiperazines have been selected to study N conversion during biomass pyrolysis [6,7,12].
Biomass contains considerable amounts of alkaline earth metallic species (AAEMs) from the soil during growth. Minerals have a significant effect on biomass pyrolysis products and pyrolysis kinetic parameters [13,14,15,16]. However, the effects of AAEMs on N release during biomass pyrolysis have not been thoroughly investigated. Water washing and acid washing were utilized to remove the AAEMs of wheat straw, and the effect of mineral matter on NOx precursor formation has been studied [17]. However, water washing and acid washing may change the contents and forms of N in the samples. According to a previous study [17], KCl and CaO were mixed into wheat straw that has been pretreated by water washing. Alkali earth metal in biomass has low solubility and cannot be easily eliminated by water washing. Thus, the effect of KCl and CaO has been drawn from experiments containing the contribution of biomass with alkali earth metal. This study provides effective information and a helpful reference for related research.
In this paper, RS was chosen as the representative agricultural waste for biomass pyrolysis. The experiments were conducted by using a thermogravimetric analyzer coupled with a Fourier transform infrared spectrometer in Ar atmosphere. Pyrolysis gas products can be gathered and analyzed continuously. The release characteristics of volatile compounds and the distributions of N-containing species during RS pyrolysis have been studied with water washing and acid washing to remove inherent AAEMs. The nitrogen contents of samples with different pretreatments were investigated by element analysis. The selectivity and relative yields of N-containing species formation were analyzed at the same nitrogen content. KCl, CaCl2, and MgCl2 were added into the sample pretreated by acid washing, and the effects of external AAEMs on N-containing species release were studied. Furthermore, two additional methods for external AAEMs, namely, solution impregnation and solid phase physical mixing were studied and compared.

2. Materials and Methods

2.1. Materials and Pretreatments

The RS was collected from a local farm in a Beijing suburb. The materials were sufficiently crushed and sieved to select samples that are 200 μm (mean particle size) in diameter. The ultimate and proximate analyses of the samples are shown in Table 1. The alkali metals (K, Na) of biomass mostly exist in the form of water soluble salts. Most of the potassium salt and sodium salt of RS can be removed by washing with deionized water; this sample was marked as RS-H2O. Alkaline earth metals (Ca, Mg) have low solubility in water. Thus, these metals were removed by 5 wt % HCl solution (RS-HCl) following deionized water washing to remove the remaining HCl. Both water washing and acid washing were conducted by stirring with a speed of 1400 r/min for 12 h. The samples were then dried in an oven at 105 °C for 12 h.
The AAEM contents of samples were tested by an inductively coupled plasma mass spectrometry (ICP-AES, Plasma1000, NCS Testing Technology Co., Ltd., Beijing, China). All samples were digested by 1 mL HF (38 wt %), 2 mL H2O2 (30 wt %), and 10 mL HNO3 (65 wt %) mixture agents. The reagents were bought from Aladdin Reagents Co., Ltd. (Shanghai, China). The digestion mixture was measured by ICP-AES according to the procedure in [18]. Quantification was repeated three times to ensure data accuracy. The AAEM content and demineralization efficiency of the samples is shown in Table 2.
Table 1. Ultimate and proximate analysis of the samples. RS: rice straw.
SampleProximate analysis (wt %, air-dried basis)Ultimate analysis (wt %, air-dried basis)
MoistureVolatileAshFixed carbonCHO aNS
RS7.5666.6310.5615.2538.484.96371.030.27
RS-H2O7.2368.398.2316.1540.825.16370.860.25
RS-HCl7.4168.617.7416.2440.865.33370.620.21
a By difference.
Table 2. Alkali and alkaline earth metallic species (AAEMs) content and demineralization efficiency of the samples.
SampleAAEMs (wt %, by dry weight)Demineralization efficiency (%)
KNaCaMgKNaCaMg
RS2.2140.2000.6410.250----
RS-H2O0.0300.0390.5610.24698.6380.3512.571.260
RS-HCl0.0100.0100.0170.01299.5795.0497.3995.13
Most K and Na elements can be removed by deionized water washing at a removal rate of 98.63% and 80.35%. Ca and Mg contents change slightly by deionized water washing but decrease sharply by acid washing; the removal efficiencies were 97.39% and 95.1%, respectively. Deionized water washing and acid washing can be employed as an effective method to remove the alkali and alkaline earth metal elements of RS respectively. Therefore, the effects of alkali metal and alkaline earth metal on RS pyrolysis characteristics can be compared.
Given that the contents of K, Ca, and Mg are obviously higher than that of Na in biomass, K, Ca, and Mg were chosen in this study as representative AAEMs in the samples. RS-HCl samples were soaked in aqueous KCl, CaCl2, and MgCl2 solutions, and the mass content of AAEMs was 10% in the mixture. The mixtures were stirred adequately in an electromagnetic stirrer for 4 h at room temperature. The mixtures were dried in an oven at 105 °C for 12 h and then stored in an airtight container before use. Samples added with AAEMs were named RS-KCl, RS-CaCl2, and RS-MgCl2.

2.2. Pyrolysis and Product Analysis

Pyrolysis progress was analyzed by a thermogravimetric analyzer (Perkin Elmer STA 6000, Waltham, MA, USA) coupled with a Fourier transform infrared spectrometer (Perkin Elmer Spectrum100, Waltham, MA, USA) from 30 °C to 900 °C. In the experiment, 10 mg samples were placed in a pyrolysis tube under an Ar environment (99.999%) at a flow rate of 40 mL/min. The curves of thermal gravity (TG) and differential thermal gravity (DTG) can be obtained. The spectrum scope of the Fourier transform infrared spectrometer was located in the range of 4000–500 cm−1 with a resolution of 4 cm−1. A linear relation between spectral absorbance at a given wave number and concentration of gaseous compounds is postulated by the Beer–Lambert law [12]. The concentration of each N-compound was identified on the basis of the integral value of the release curves against temperature (time) under specific IR absorptions of 966, 714, 2251, and 1900 cm−1. Further details on the analysis method can be found in [17,18,19].

2.3. Pyrolysis Kinetic Analysis

Pyrolysis kinetic parameters were estimated by the method of distributed activation energy model (DAEM) [20]. The model assumes that many independent first-order parallel reactions that have different activation energy occur simultaneously and the activation energy of each reaction is a function of a continuous distribution. The model is represented as follows:
  1 V / V * = 0 exp ( k 0 0 t e E / R T d t ) f ( E ) d E
where V is the total volatiles evolved by time t, V* is the effective volatile content of biomass, E is the activation energy, f(E) is a distribution curve of the activation energy, k0 is the frequency factor corresponding to the E value, T is the pyrolysis temperature and R is the universal gas constant. The exponential function present in Equation (1) is the so-called Φ function which can be transformed for a constant heating rate, α, as follows [21]:
Φ ( E , T ) = exp ( k 0 0 t e E / R T d t ) exp ( k 0 α 0 T e E / R T d T )
Equation (1) can be simplified to Equation (3):
V / V * 1 E s f ( E ) d E = 0 E s f ( E ) d E
The activation energy Es was selected to satisfy Φ(Es,T)   0.58 and the relationship can be described as:
0.545 α E s / k 0 R T 2 = e E s / R T
and the Φ function can be approximated to:
Φ ( E , T ) exp ( k 0 R T 2 α E e E / R T )
DAEM states that the reactions with an associated activation energy occurs at specified T and α. The approximation is given mathematically by:
d V / d t d ( Δ V ) / d t = k 0 e E / R T ( Δ V * Δ V )
Equation (6) can be integrated for a constant heating rate α as:
1 Δ V / Δ V * = exp ( k 0 0 t e E / R T d t ) exp ( k 0 R T 2 α E e E / R T )
which can be rewritten as:
ln ( α T 2 ) = ln ( k 0 R E ) ln { ln ( 1 Δ V Δ V * ) } E R 1 T
Because 1 Δ V / Δ V * = Φ ( E s , T ) 0.58 , Equation (8) can be simplified to:
ln ( α T 2 ) = ln ( k 0 R E ) + 0.6075 E R 1 T
Miura proposed a simple procedure to obtain the activation energy and pre-exponential factor of the sample. Measure V/V* vs. T relationships with three different heating rates. Plot ln(α/T2) vs. 1/T at the selected V/V* values and both the E and k0 values can be obtained from the slope and the intercept in each Arrhenius plot [22].

3. Results and Discussion

3.1. Thermal Gravity/Differential Thermal Gravity (TG/DTG) and Kinetic Analysis

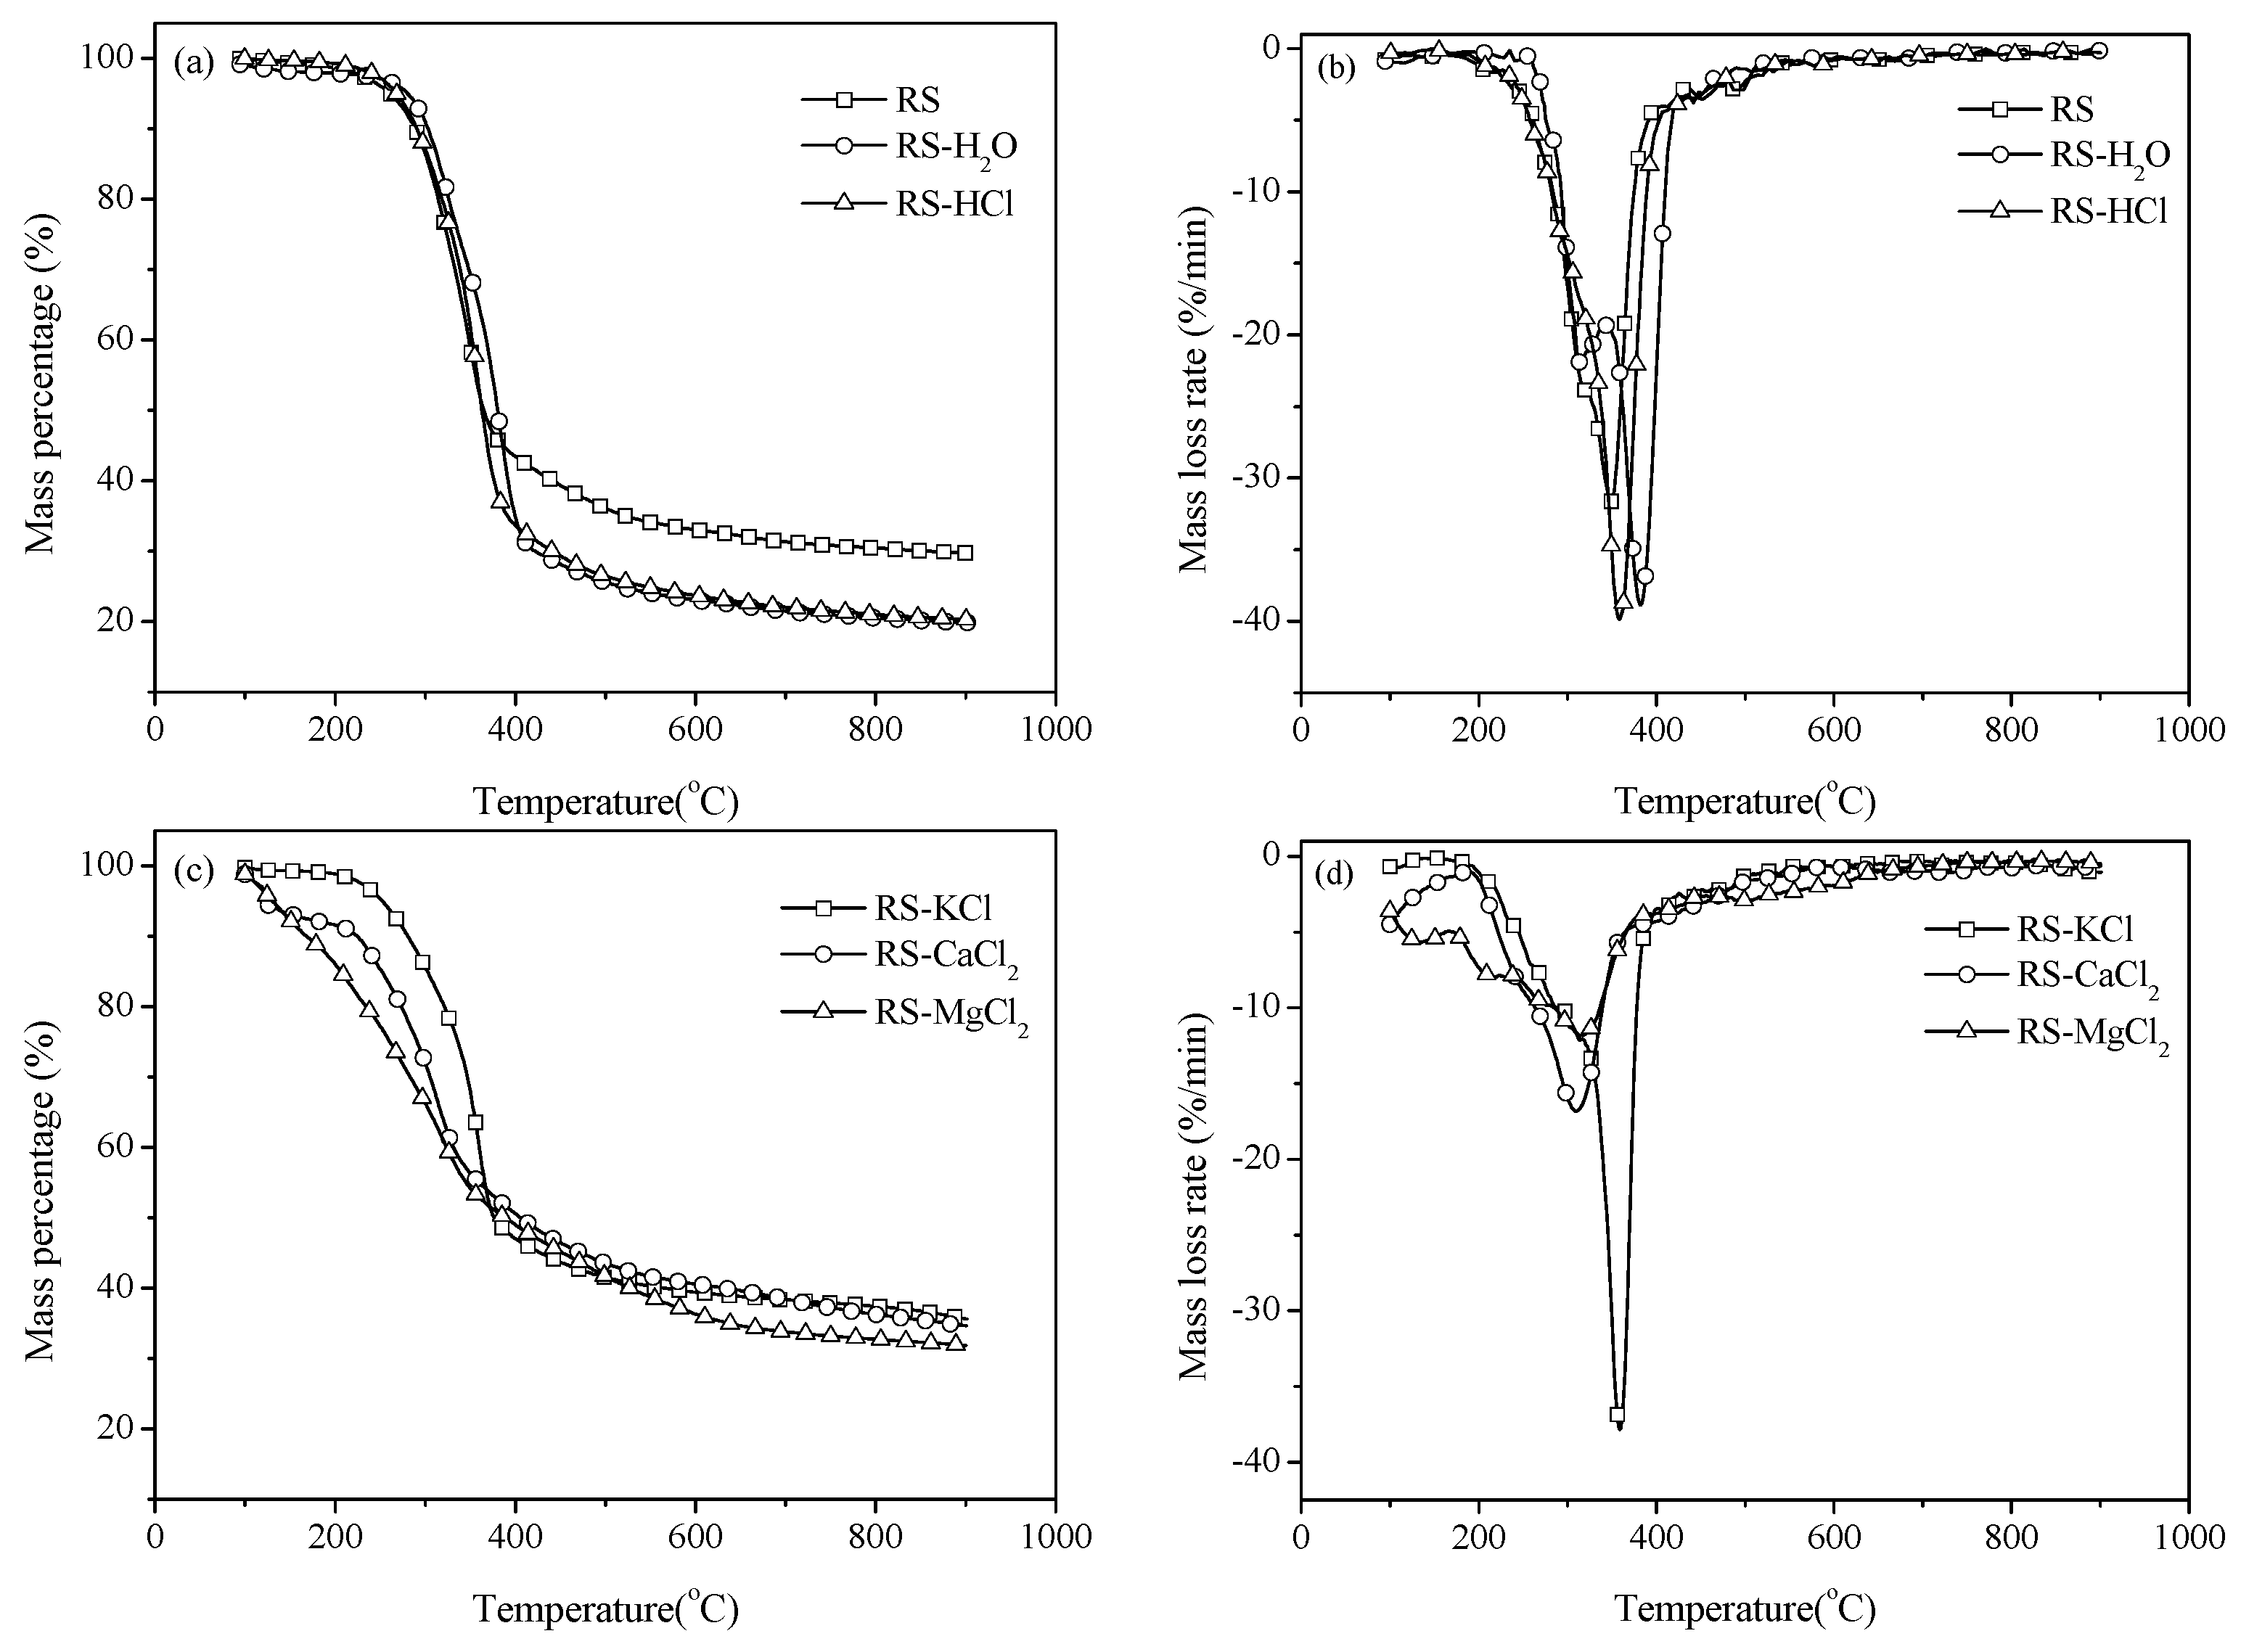
Given that N-containing species are mainly accompanied by the release of volatile compounds, the pyrolysis characteristics of samples with different pretreatments should be studied. The experiments were carried out at a heating rate of 40 °C/min and the result is shown in Figure 1. Weight loss mainly occurs at 250–400 °C, and the weight loss rate decreases when the temperature exceeds 400 °C (Figure 1a). The residual mass percentages are 29.7%, 19.87%, and 20.28% for RS, RS-H2O, and RS-HCl, respectively. This result illustrates that water washing and acid washing pretreatments can promote the generation of volatile compounds and decrease the solid product yield of pyrolysis. This result can be attributed to the change in physical structure because of the pretreatments. The average pore diameter of samples increases by water washing and acid washing, in accordance with the result of Long et al. [23]. This result can be attributed to the removal of minerals in the pore structure. The pore size also enlarges. These changes in pore structure are conducive to volatile release; thus, the residual solid mass percentage decreases. As shown in the DTG curves of Figure 1b, the maximum weight loss rate increases with the removal of AAEMs and the corresponding peak temperature shifts to a high-temperature zone.
The TG and DTG curves of samples with external AAEMs are shown in Figure 1c,d. The weight loss of RS-KCl is similar to that of RS. However, the weight loss curves of RS-CaCl2 and RS-MgCl2 obviously shift to a low-temperature zone. This result indicates that the volatile can be released at low temperatures in the presence of CaCl2 and MgCl2. As shown in Figure 1d, the maximum weight loss rate of RS-KCl shows an insignificant difference with that of RS. However, the values of RS-CaCl2 and RS-MgCl2 are significantly smaller than that of RS. Thus, alkaline earth metals can suppress the volatile release rate.
Figure 1. Thermal gravity (TG) and differential thermal gravity (DTG) curves of samples pyrolysis with a heating rate of 40 °C/min. (a) TG curves; (b) DTG curves; (c) TG curves with additives; (d) DTG curves with additives.
Energies 08 12356 g001
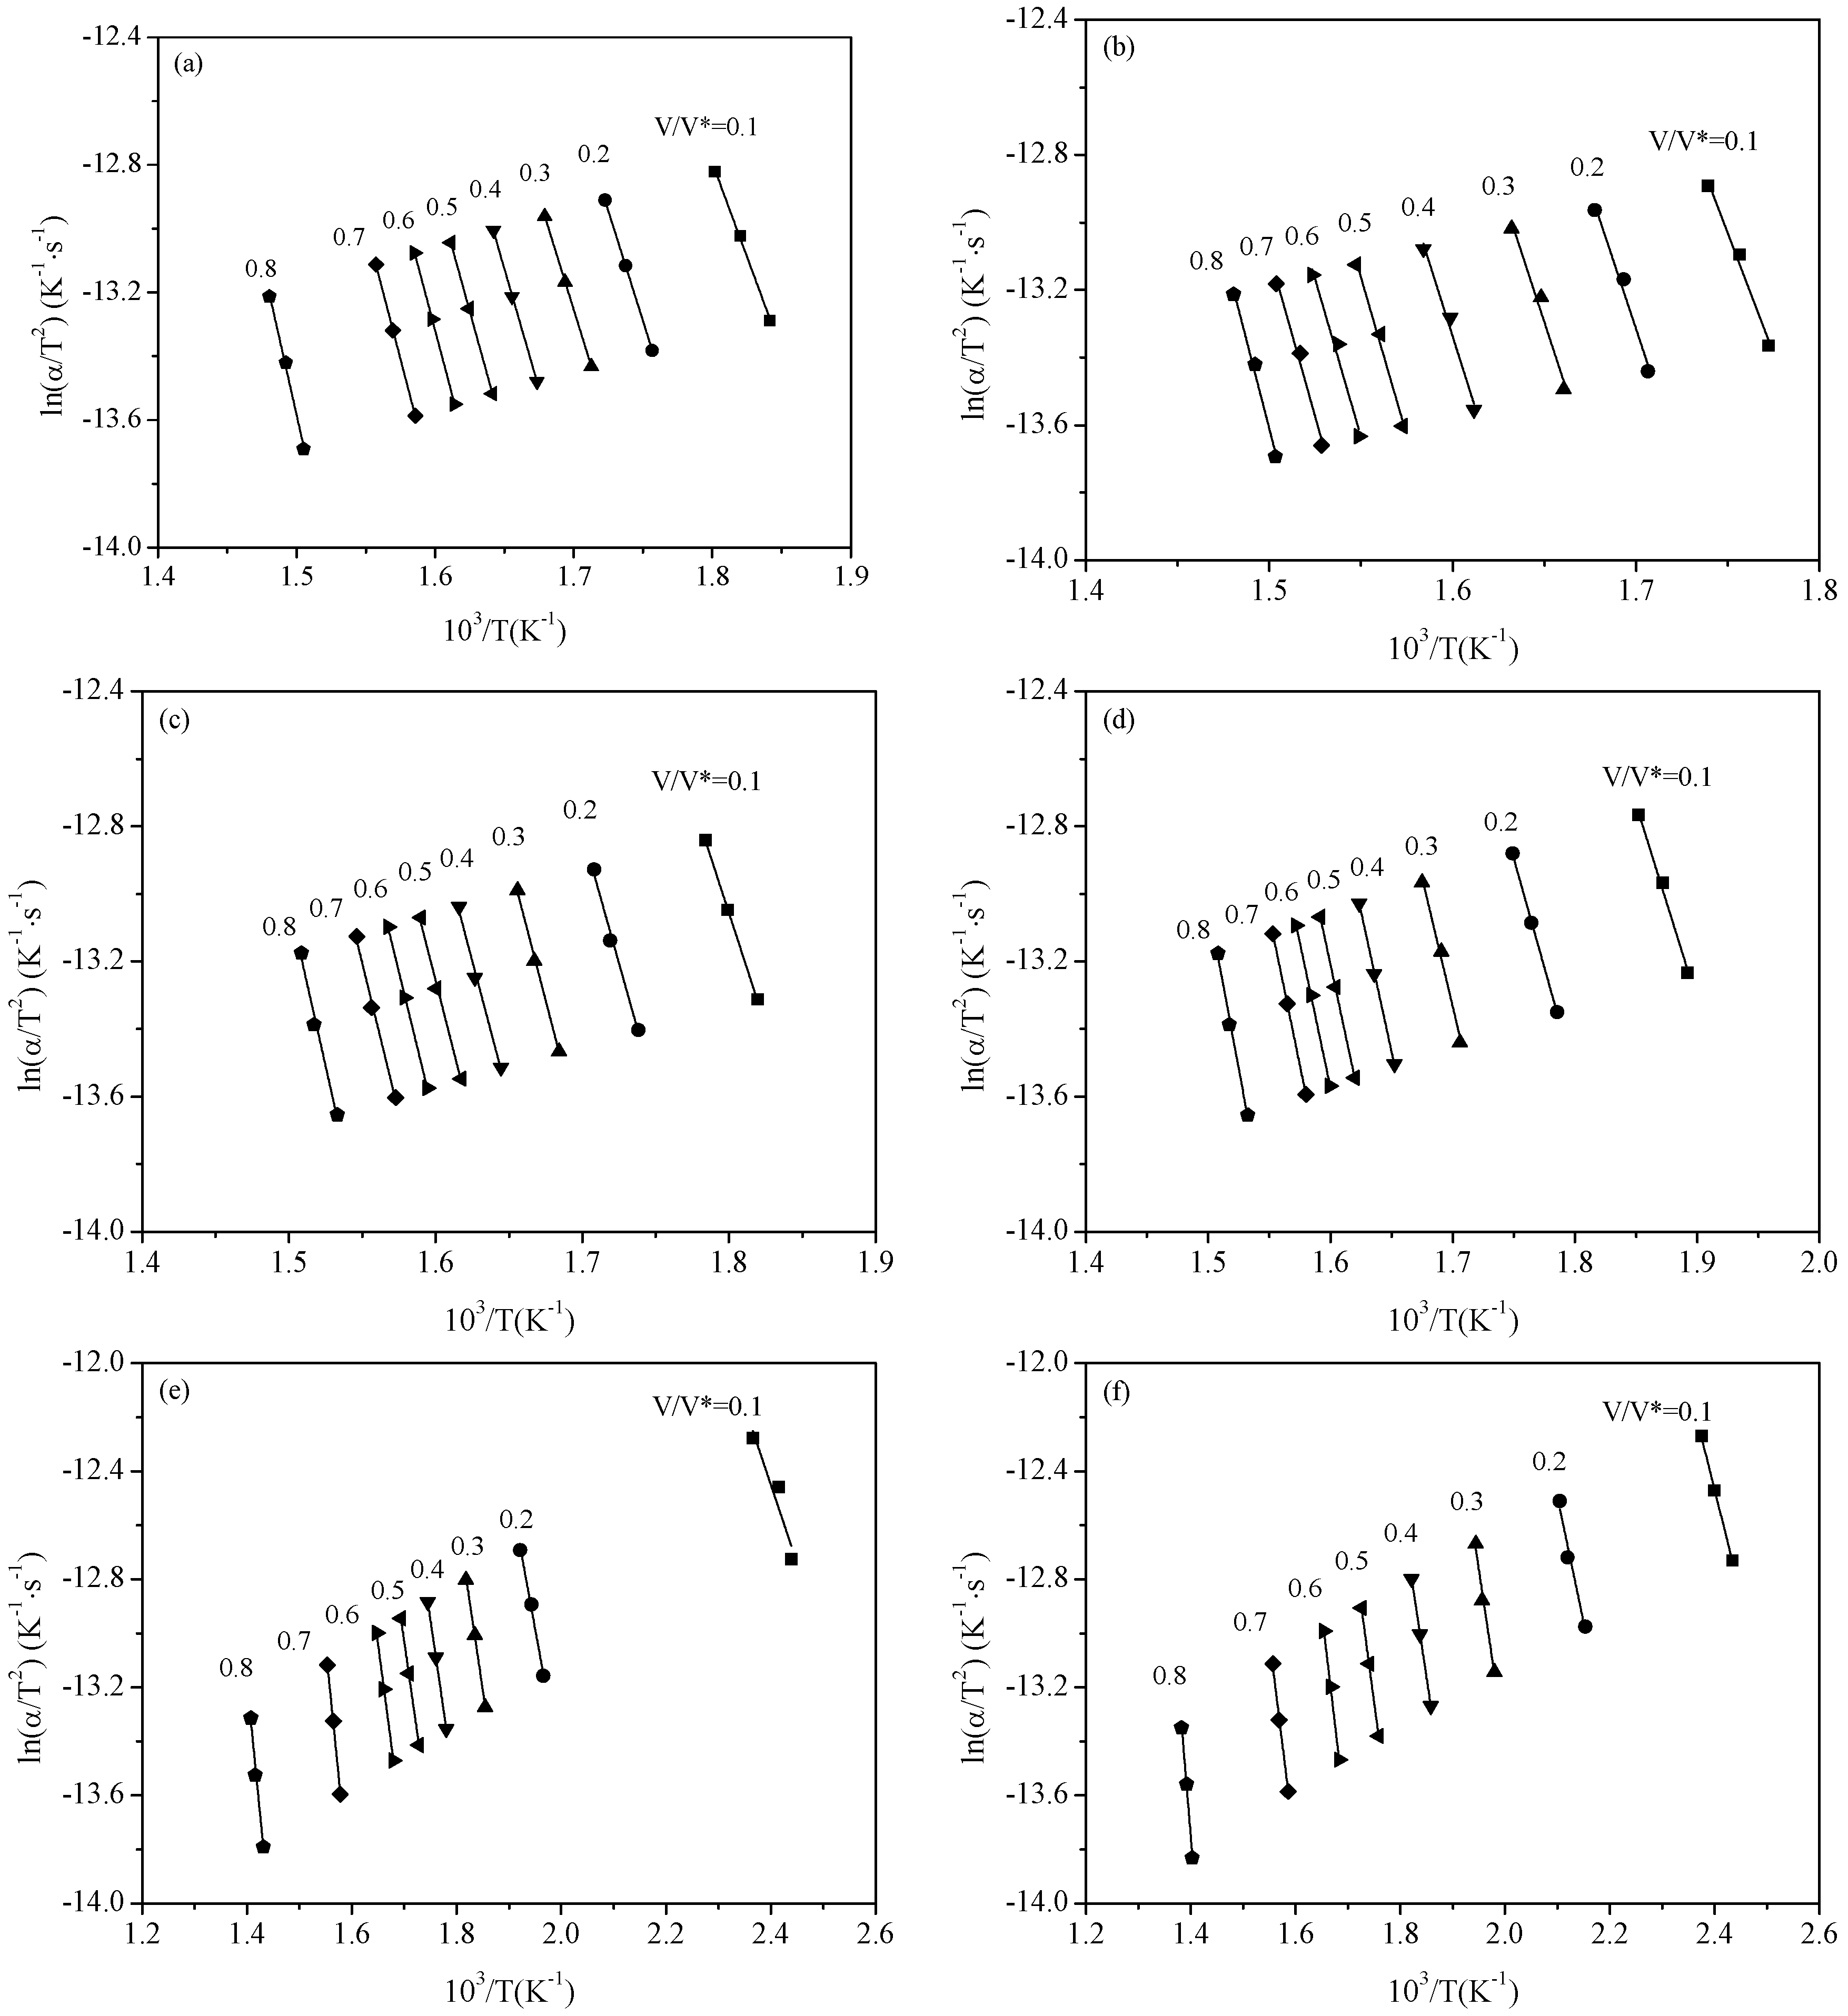
As mentioned above, the pyrolysis characteristics for the six samples under different pretreatment conditions significantly differ to each other. Therefore, to obtain a further understanding of the effect of AAEMs on RS pyrolysis, experiments with different heating rates (30 °C/min, 40 °C/min and 50 °C/min) were conducted and the kinetic parameters were estimated according to the DAEM method. Figure 2 shows the Arrhenius plots of ln(α/T2) vs. 1/T for the six samples. From Figure 2, it can be observed that ln(α/T2) is in a linear relationship with 1/T for each sample under different reacted fraction V/V*.
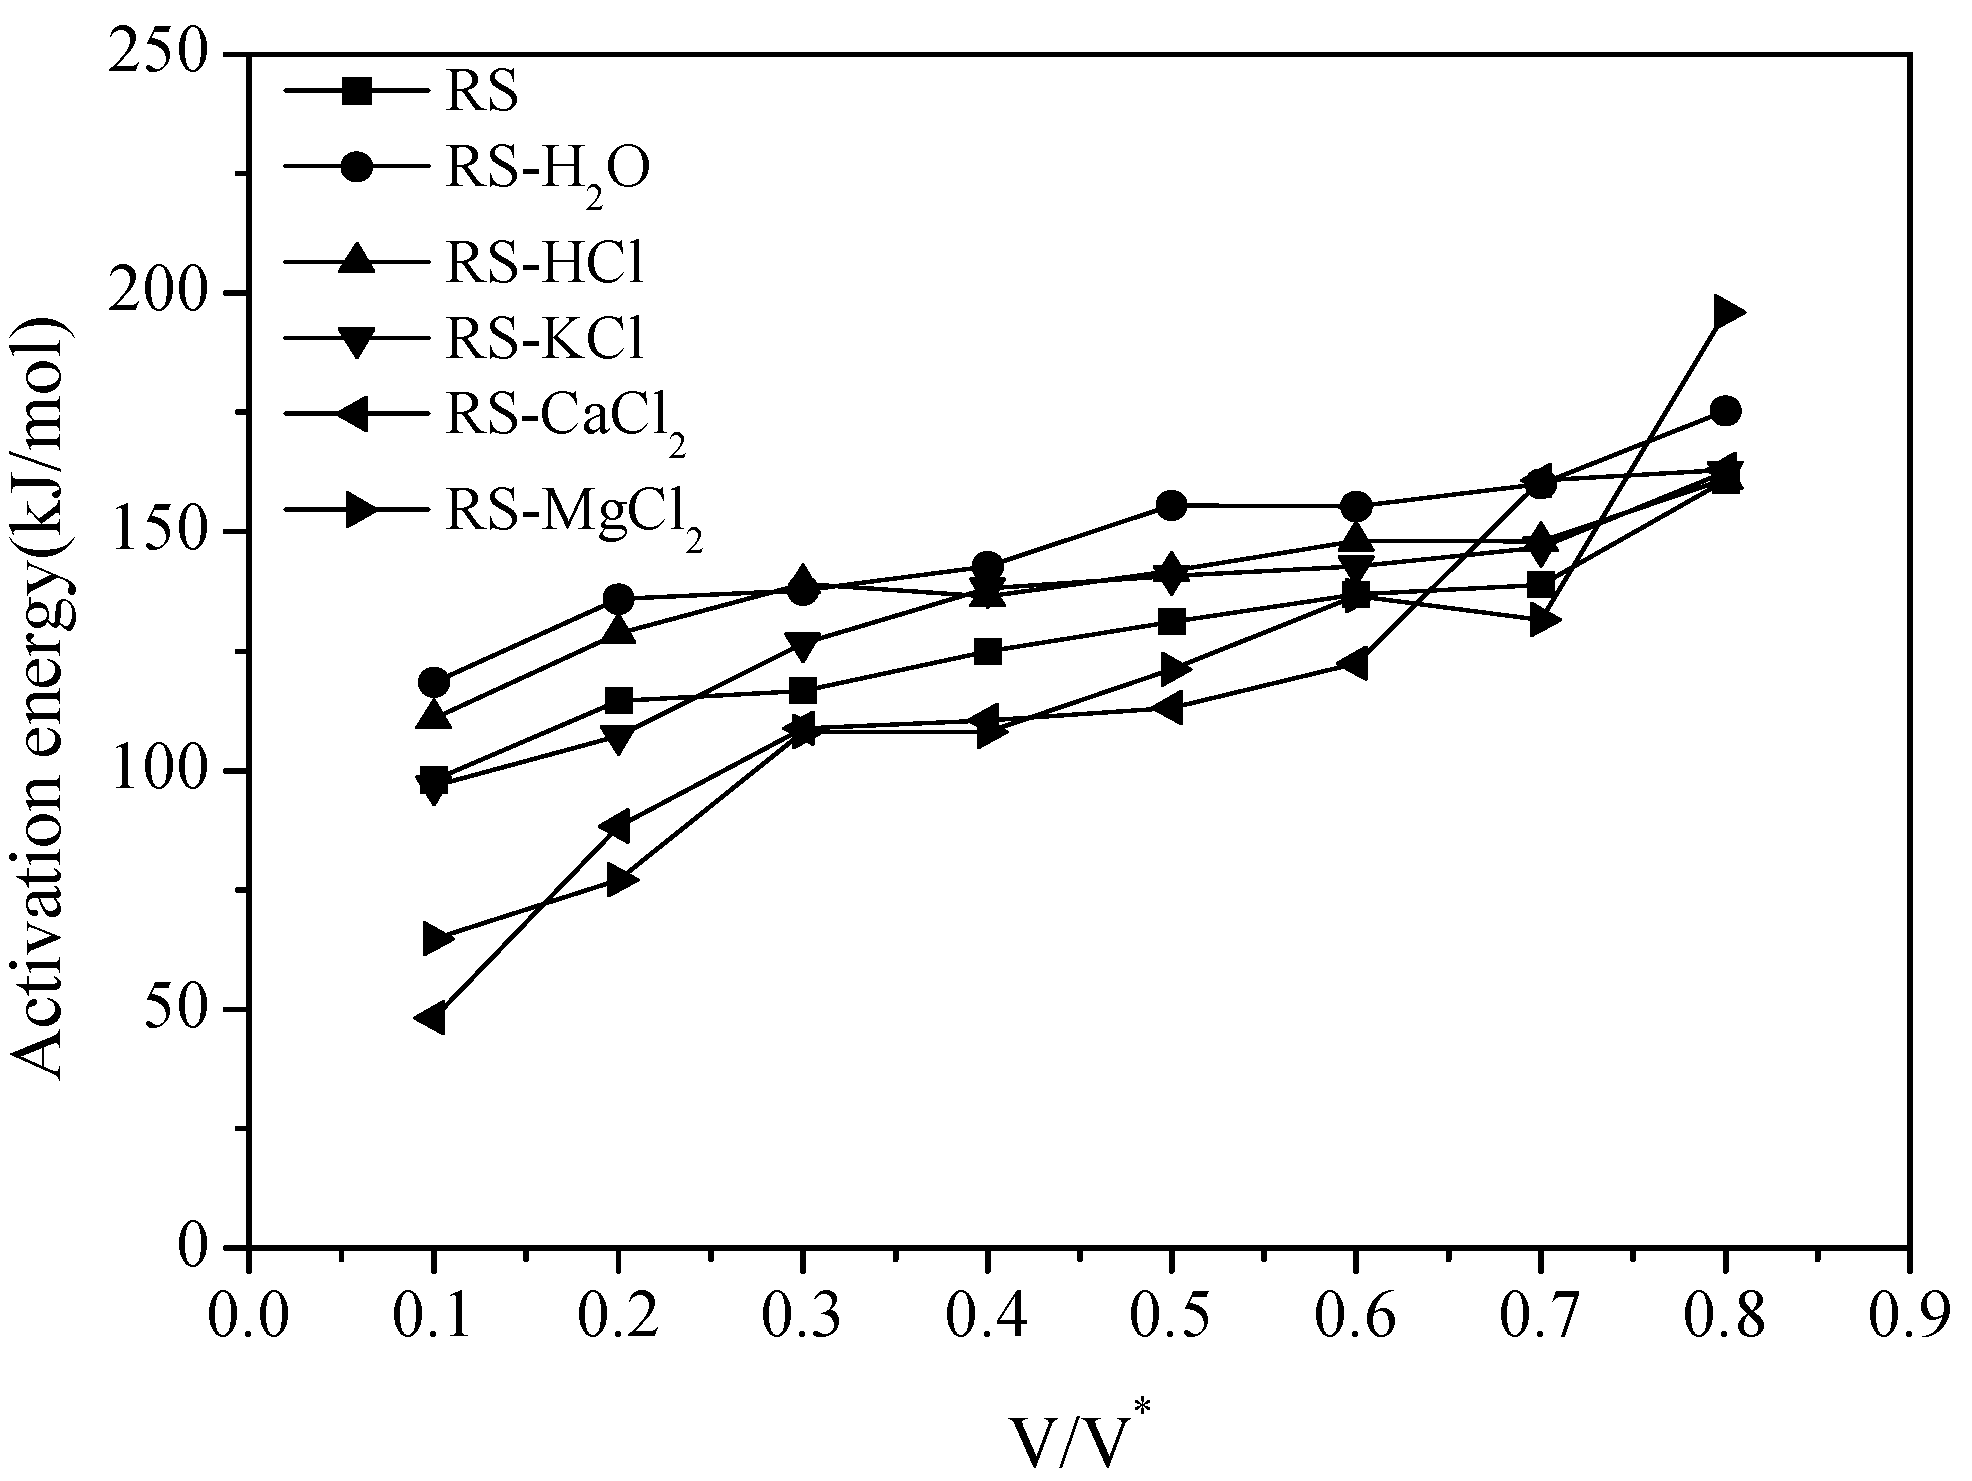
The activation energy values can be calculated from the slope in each Arrhenius plot and the result is shown in Figure 3. The activation energy values of all samples increase with the increase of the reacted fraction V/V*. As can be seen from Figure 3, the activation energy values of RS-H2O and RS-HCl are both higher than that of RS. The increase of activation energy requires high reaction temperatures, which explains the slight shift of the volatile release curve of RS-H2O and RS-HCl toward the high-temperature zone. The activation energy values of RS-CaCl2 and RS-MgCl2 are lower that of RS when the reacted fraction V/V* below 0.6. Thus, the pyrolysis reaction of samples with the addition of CaCl2 and MgCl2 can be obtained at low temperatures (Figure 1c).
Figure 2. Arrhenius plots of α/T2 vs. 1/T at selected V/V* values. (a) Rice straw (RS); (b) RS-H2O; (c) RS-HCl; (d) RS-KCl; (e) RS-CaCl2; (f) RS-MgCl2.
Energies 08 12356 g002
Figure 3. Activation energy curves with different V/V*.
Energies 08 12356 g003

3.2. Effect of Inherent Alkaline Earth Metallic Species (AAEMs) on N-Containing Species Release

Alkali metals and alkaline metals can be respectively removed by water washing and acid washing (Table 1). To study the effect of inherent AAEMs on the release of N-containing species, pyrolysis experiments were conducted by using RS. RS-H
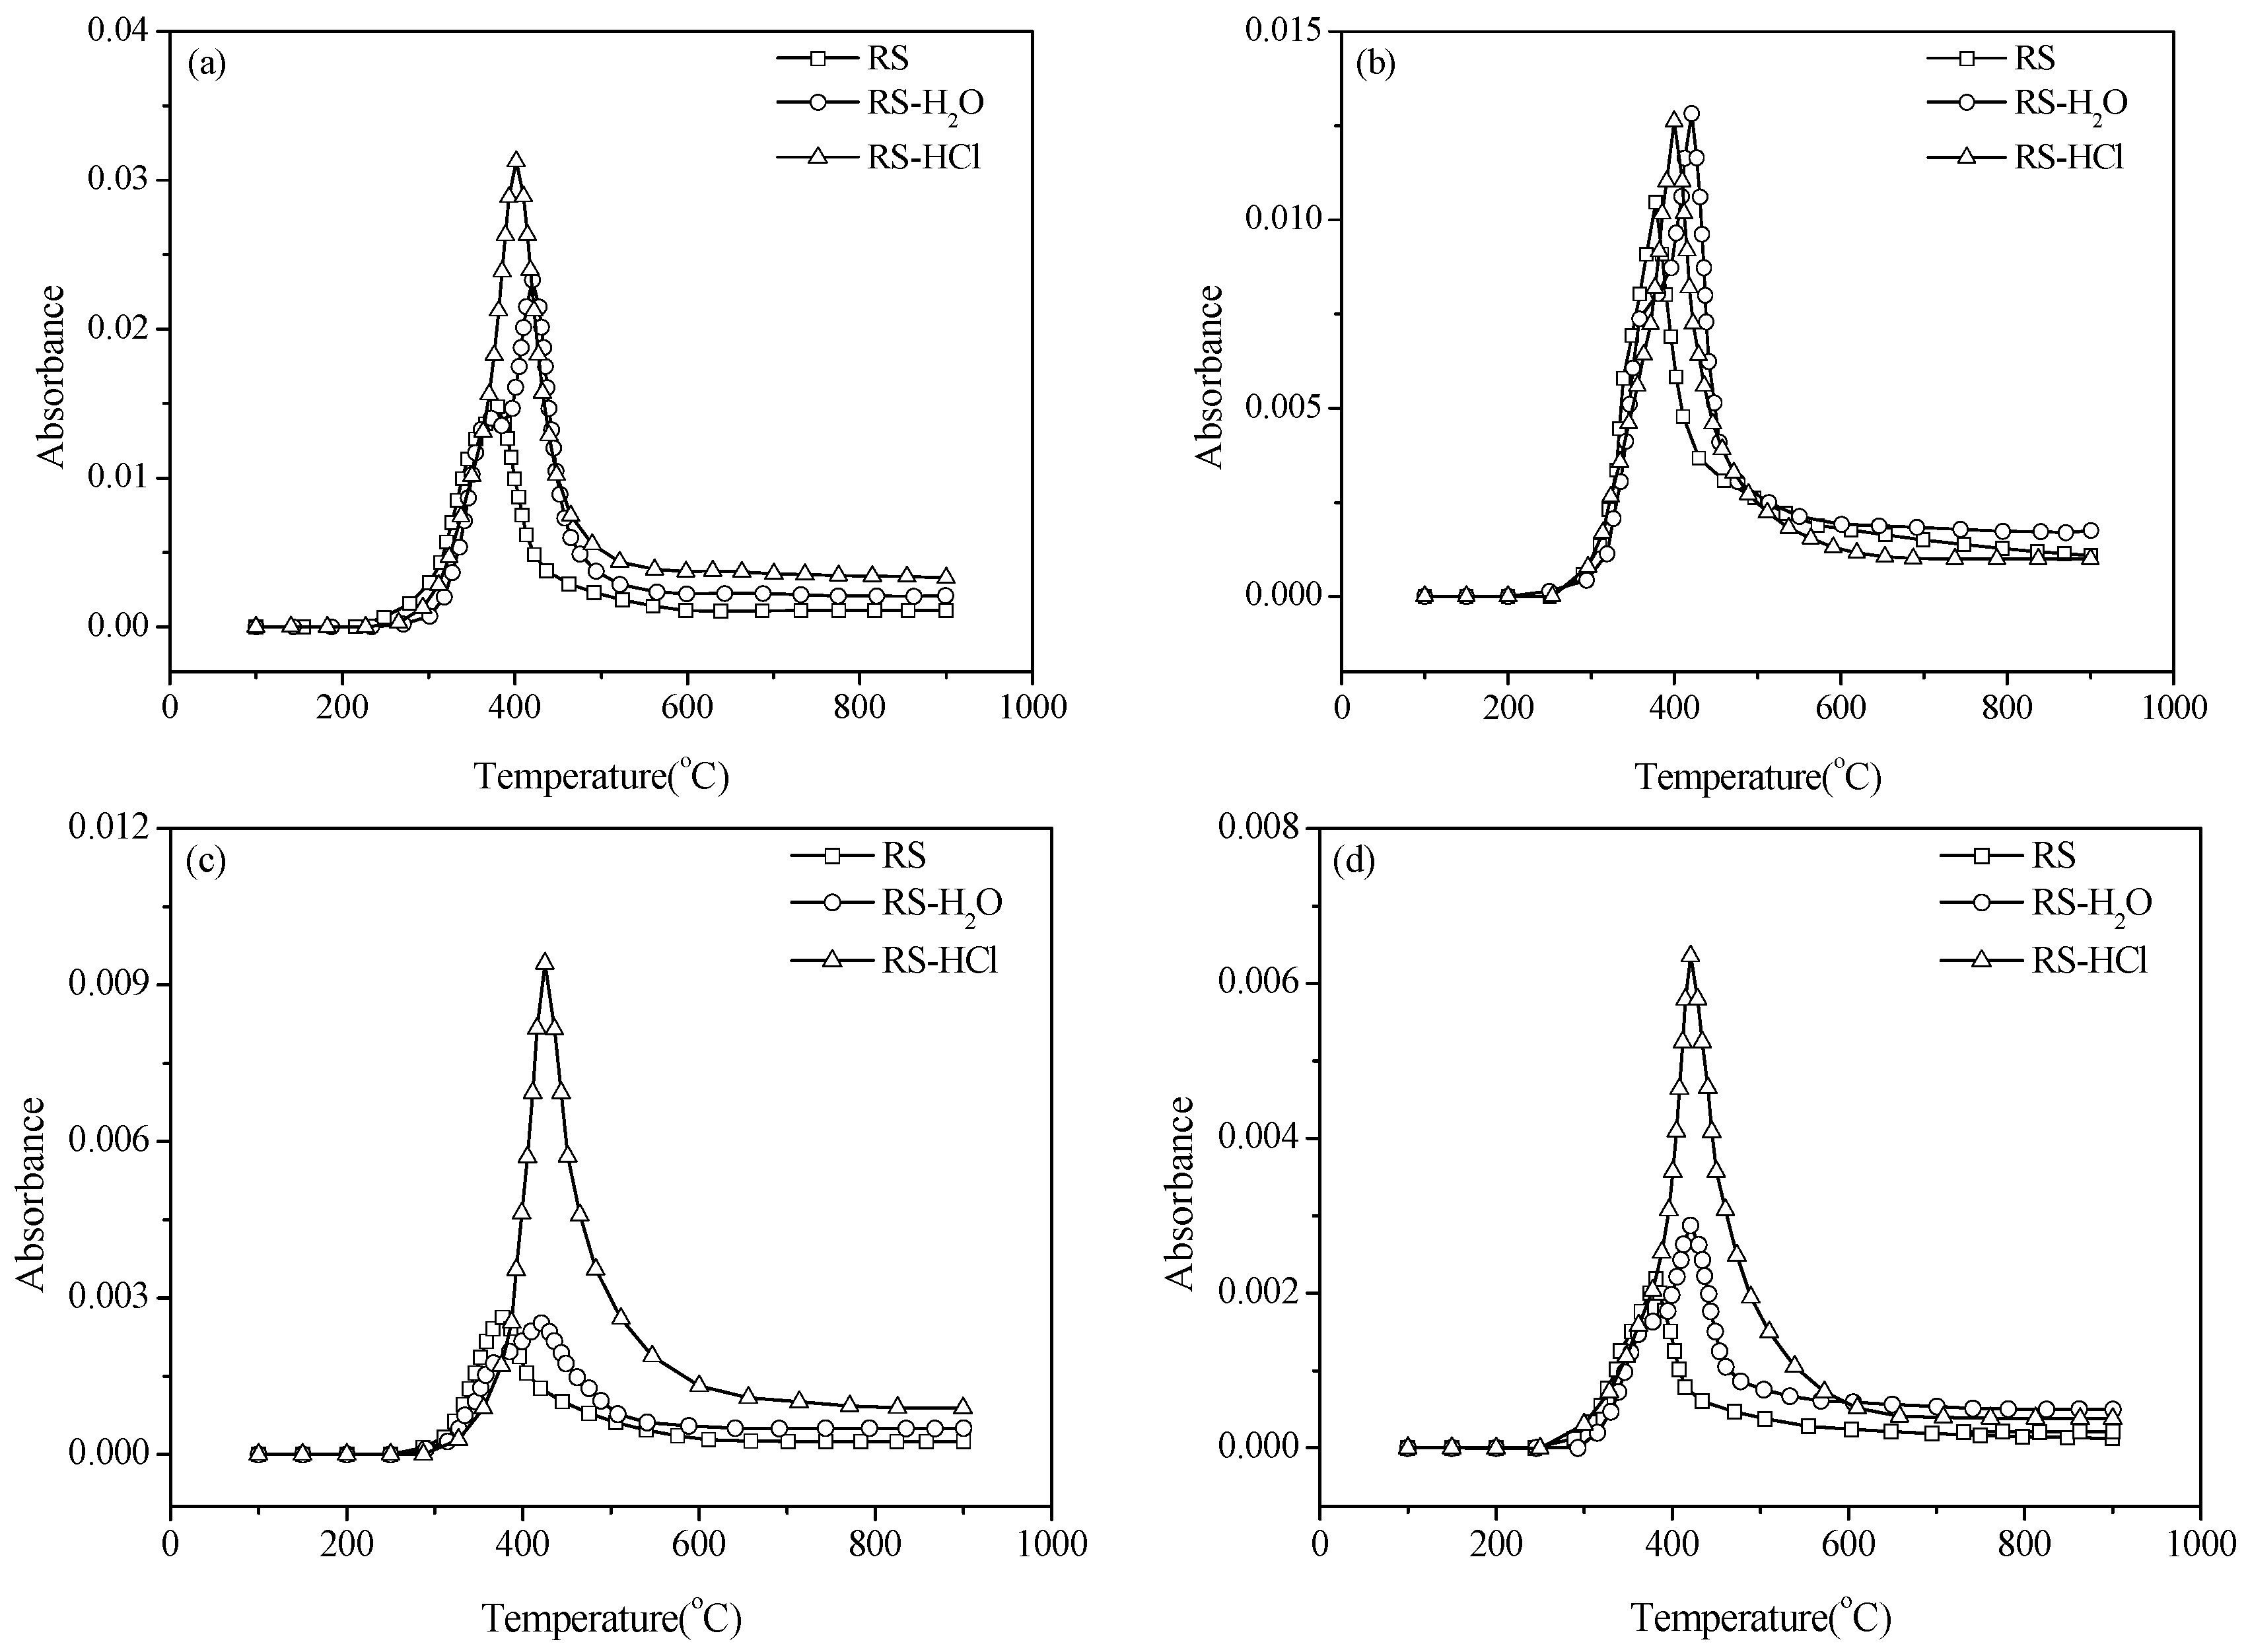
2O and RS-HCl as samples have a fixed heating rate of 40 °C/min. The release curves of NH3, HCN, nitric oxide (NO), and HNCO are illustrated in Figure 4. The formation of N-containing species is significantly affected by the demineralization pretreatments. The NH3 release curves of RS-H2O and RS-HCl shift to a high-temperature zone compared with the RS sample. This result is mainly caused by the volatile release behavior without inherent AAEMs.
Figure 4. Release of N-compounds for RS, RS-H2O, and RS-HCl. (a) ammonia (NH3); (b) hydrogen cyanide (HCN); (c) isocyanic acid (HNCO); (d) nitric oxide (NO).
Energies 08 12356 g004
The NH3 yield of RS-H2O is slightly lower than that of RS at <375 °C, whereas the yield of RS-HCl is almost the same as that of RS. The NH3 yields of RS-DW and RS-HCl both increase obviously in a high-temperature zone (>375 °C), and the NH3 release curve of RS-HCl has the highest peak value. Corresponding peak temperatures of RS, RS-H2O, and RS-HCl are 398, 420, and 401 °C, respectively. HCN, HNCO, and NO release curves shift to a high-temperature zone for RS-DW and RS-HCl compared with RS, which have similar trends with NH3. The peak value of the HCN release curve is also increased by pretreatment, but the increase is smaller than that of NH3. The peak value of the HNCO release curve for RS-H2O is almost identical with that of RS. However, the peak value for RS-HCl is obviously higher than those of RS and RS-H2O. This result indicates that the alkaline earth metals of RS have a greater impact on the formation of HNCO than alkali metals. The release characteristic of NO is similar to HNCO except that the peak value of the NO release curve for RS-H2O is higher than that of RS. Figure 4 shows that AAEMs can inhibit the conversion of fuel N to gas N-compounds but the inhibition of minerals is weakened by the demineralization pretreatments.
Given that the nitrogen in biomass is mainly protein N, water washing and acid washing pretreatments can change the contents of N in the samples. The N contents of samples were determined accurately by elemental analysis, and the values are 1.03%, 0.86%, and 0.62% for RS, RS-H2O, and RS-HCl, respectively (Table 1). The N content of RS-H2O and RS-HCl accounts for 83.5% and 60.2% of that of RS. The change in N content in the sample is significant; thus, the change in the study of N-species formation yield and selectivity should be considered. However, no relevant research has been conducted for this topic. Therefore, the effect of inherent AAEMs on the release of N-containing species is not comprehensive without considering the change of N content and composition. The calculation of the relative yield of nitrogen should be conducted at the same total-N content. In other words, the relative yield of N-species of RS-H2O and RS-HCl should be multiplied by 1.20 and 1.66, respectively.
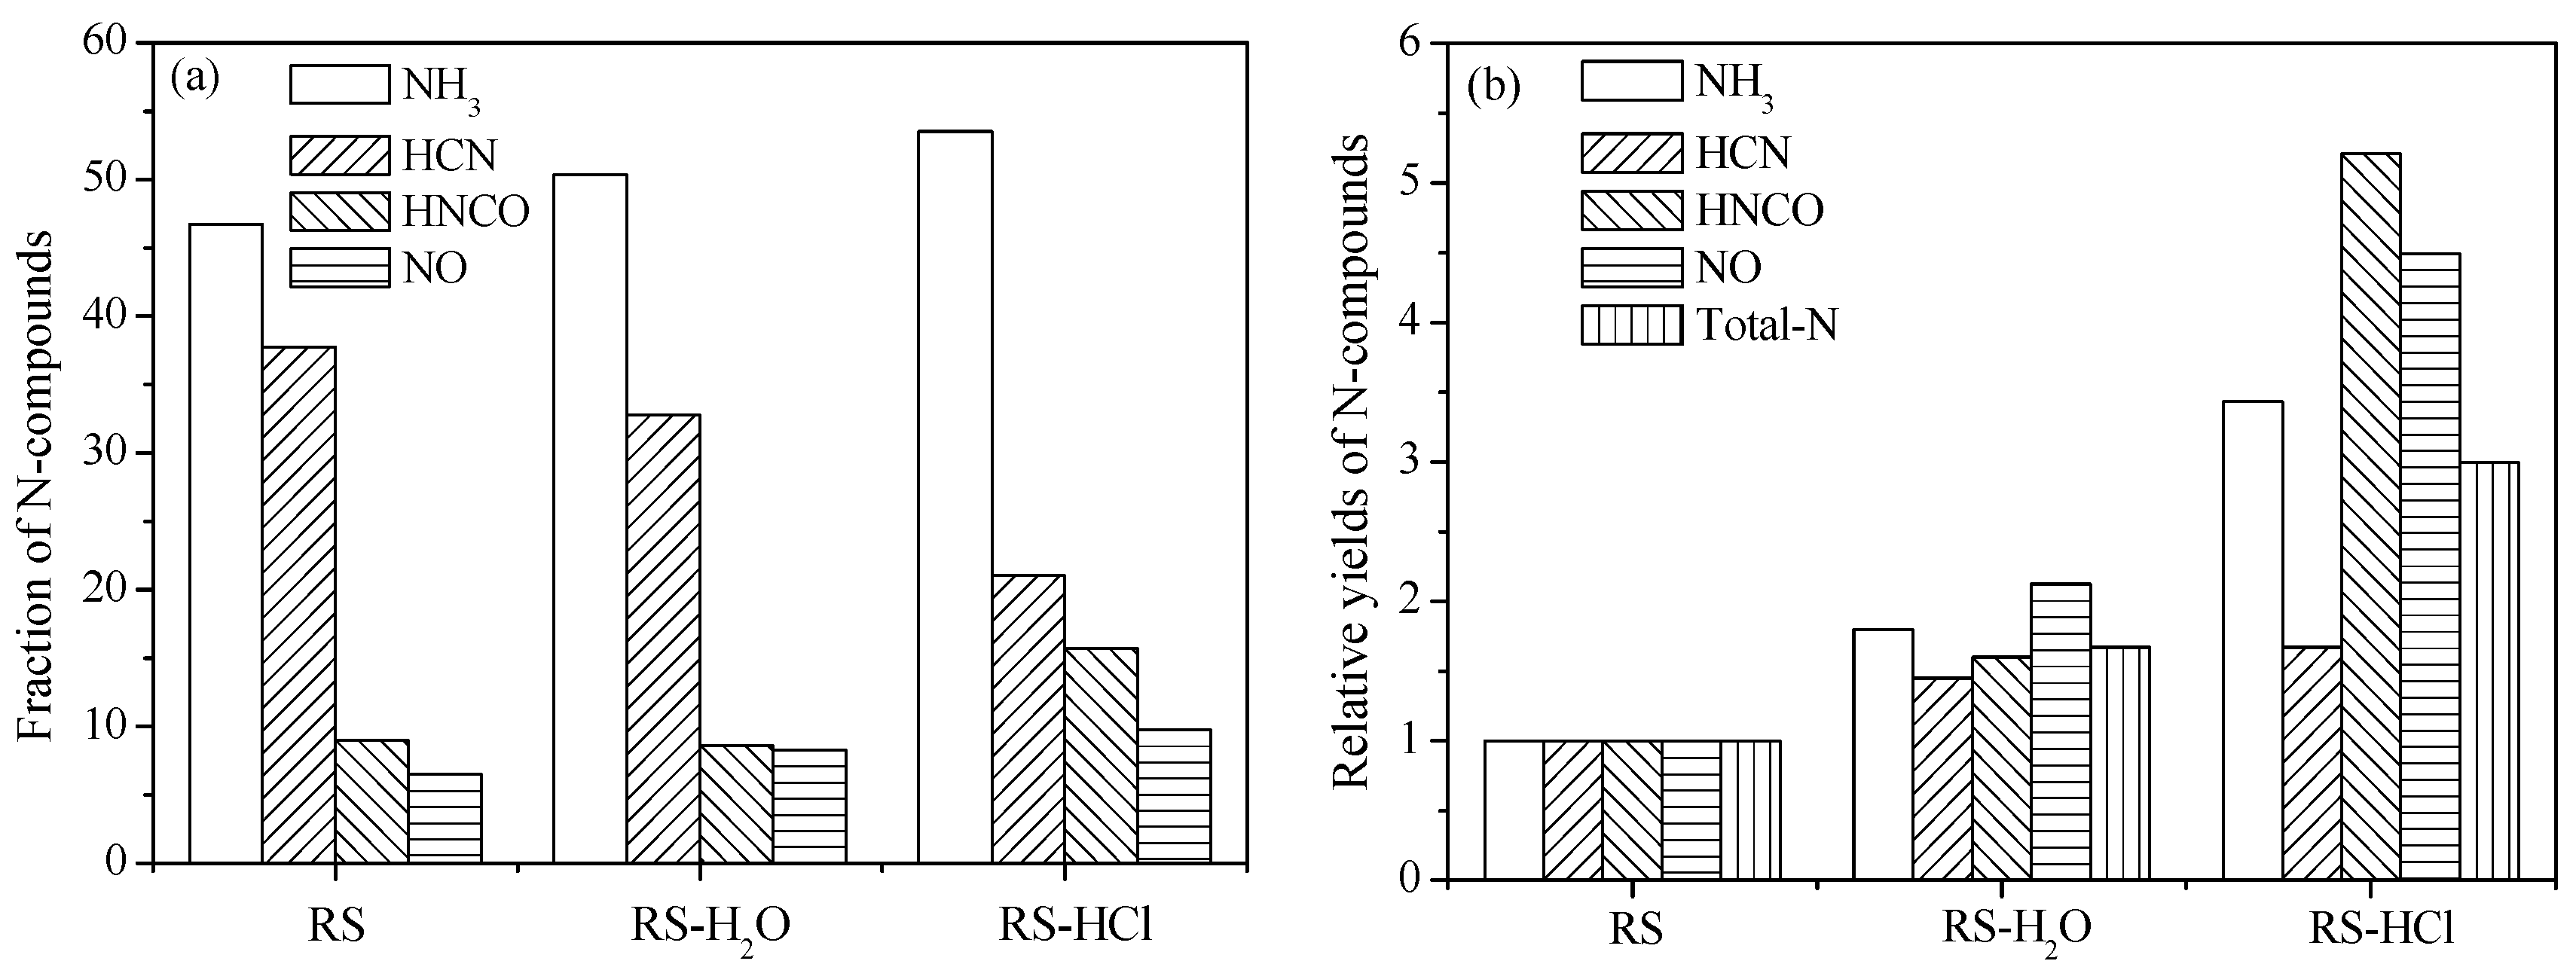
Figure 5a shows the N-containing species formation selectively of RS, RS-H2O, and RS-HCl. The fraction of NH3 is enhanced by demineralization pretreatment, whereas the fraction of HCN is decreased. Thus, AAEMs removal can improve NH3 formation selectivity and inhibit HCN selectivity. The HNCO fraction of RS-H2O is slightly lower than that of RS, thus indicating that alkali metals (K, Na) have little effect on HNCO formation. The HNCO fraction of RS-HCl is obviously higher than those of RS and RS-H2O. The results show that the formation of HNCO is mainly affected by the influence of alkaline earth metals (Ca, Mg). Furthermore, NO formation selectivity is improved by water washing and acid washing, similar to NH3.
Figure 5. Selectivity and relative yields of N-compounds. (a) Selectivity; (b) yield.
Energies 08 12356 g005
N-compound yields during RS pyrolysis were set to units, and the relative yields of RS-H2O and RS-HCl were calculated (Figure 5b). The four types of N-containing species yields were enhanced by demineralization pretreatment. The total-N relative yields of RS-H2O and RS-HCl are 1.67 and 3.0 times higher than that of RS. The relative yields of NH3, HNCO, and NO for RS-HCl increases obviously compared with that of RS-H2O, whereas HCN relative yield is slightly enhanced.

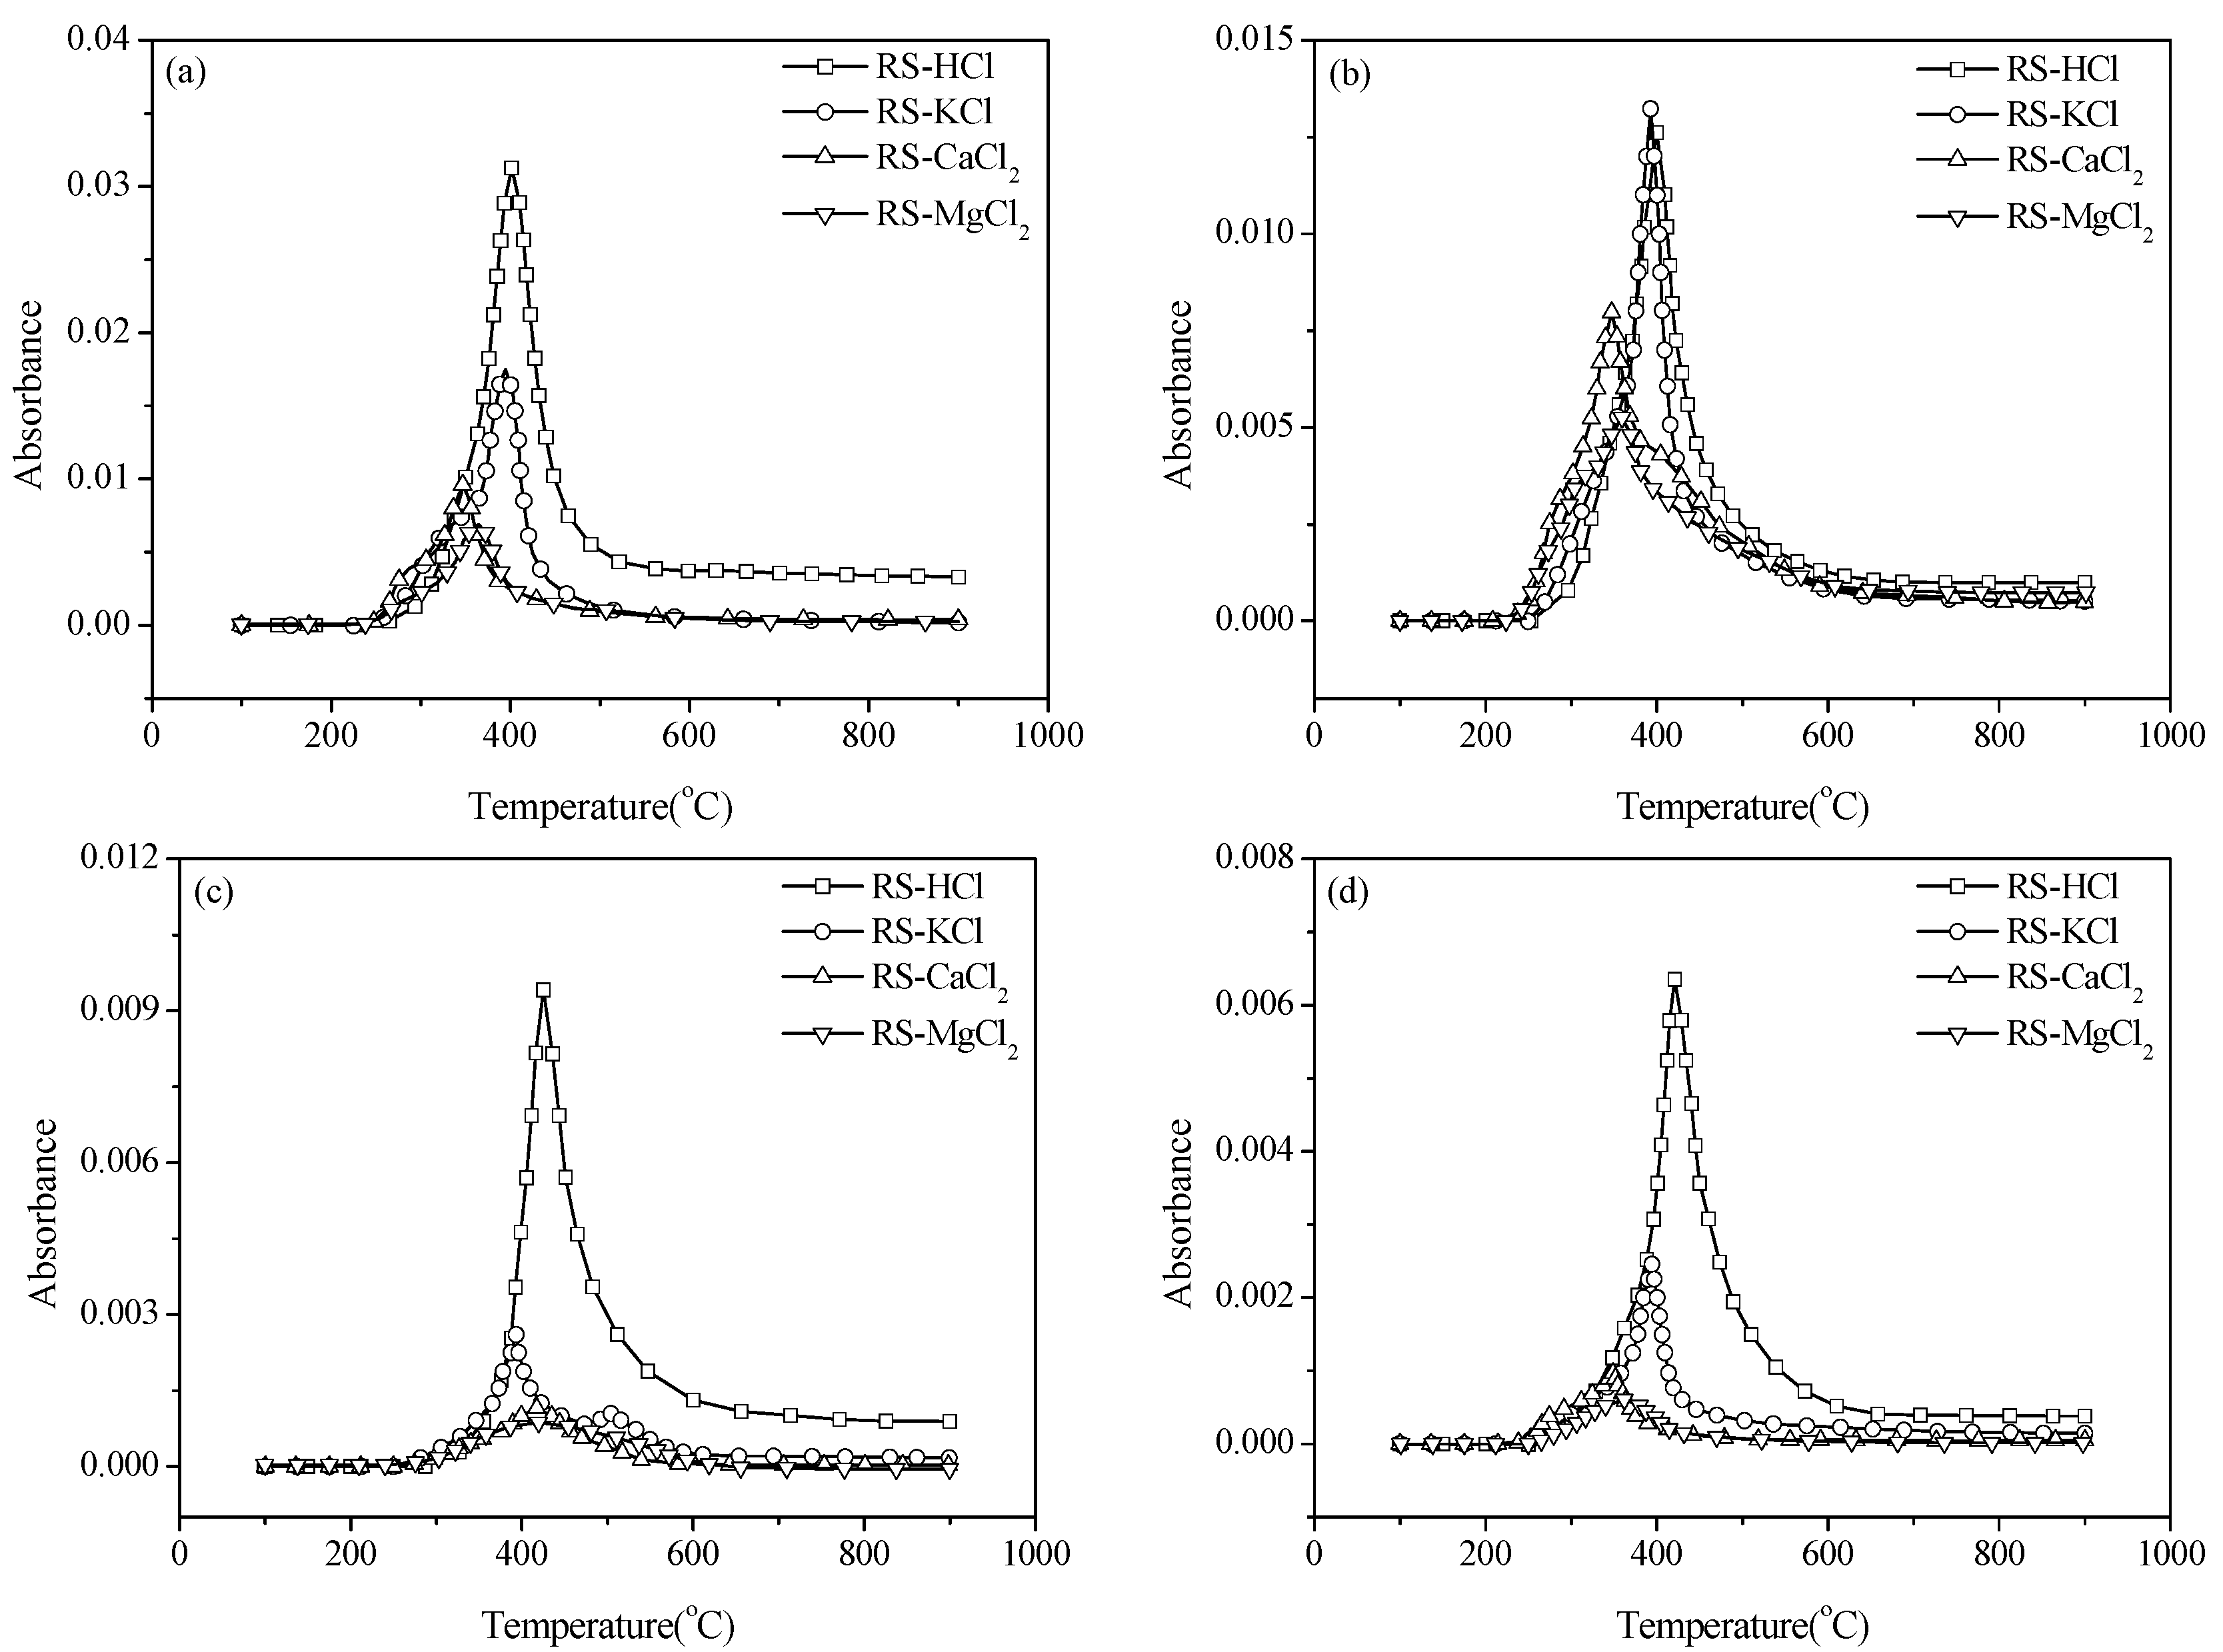
3.3. Effect of External Alkaline Earth Metallic Species on N-Containing Species Release

Although the effect of AAEMs on N-containing species transformation can be drawn qualitatively, the inhibition ability cannot be compared with each other for different mass percent of AAEMs in RS. Therefore, the same mass percent (10 wt %) of KCl, CaCl2, and MgCl2 were added into the RS-HCl sample by solution impregnation. The pyrolysis of RS-KCl, RS-CaCl2, and RS-MgCl2 were conducted by using the same condition as that of RS-HCl (Figure 6). In the presence of AAEM, the NH3 release curve remains a single peak structure, the curve becomes narrow, and the peak value decreases significantly compared with the release curve of RS-HCl. This result indicates that NH3 release was suppressed by the addition of AAEM. The peak values of RS-CaCl2 and RS-MgCl2 are obviously lower than that of RS-KCl.
The HCN release curve of RS-KCl is slightly narrow, and the peak value is almost at the same level. Therefore, the effect of KCl on HCN release behavior is insignificant. The release peak temperature of RS-CaCl2 and RS-MgCl2 shifts to a low-temperature zone for 52.6 and 40.7 °C, respectively, and the release peak value of RS-MgCl2 is lower than that of RS-CaCl2. Compared with RS-HCl, the HNCO release of RS-KCl is significantly inhibited and the release curve is changed from a single peak to a double peak structure. The peak temperature is 393.2 and 491.7 °C for RS-HCl and RS-KCl, respectively, but the second release peak value is relatively small. The release curves of RS-CaCl2 and RS-MgCl2 are still a single peak structure and are lower than that of RS-KCl.
Figure 6. Release of N-compounds with alkaline earth metallic specie (AAEM) additives (a) NH3; (b) HCN; (c) HNCO; (d) NO.
Energies 08 12356 g006
The NO release change of RS-KCl, RS-CaCl2, and RS-MgCl2 is comparable to that of NH3, which remains a single peak structure. However, the curve is narrow and the peak value is low. The temperatures corresponding to the release curve peak shift to a low-temperature zone for 26.8, 71.9, and 58.8 °C compared with that of RS-HCl. The NO release curves of RS-CaCl2 and RS-MgCl2 are similar to each other, and both curves are lower than that of RS-KCl. The N-containing species release is suppressed for all AAEM additives when the pyrolysis temperature above 600 °C.
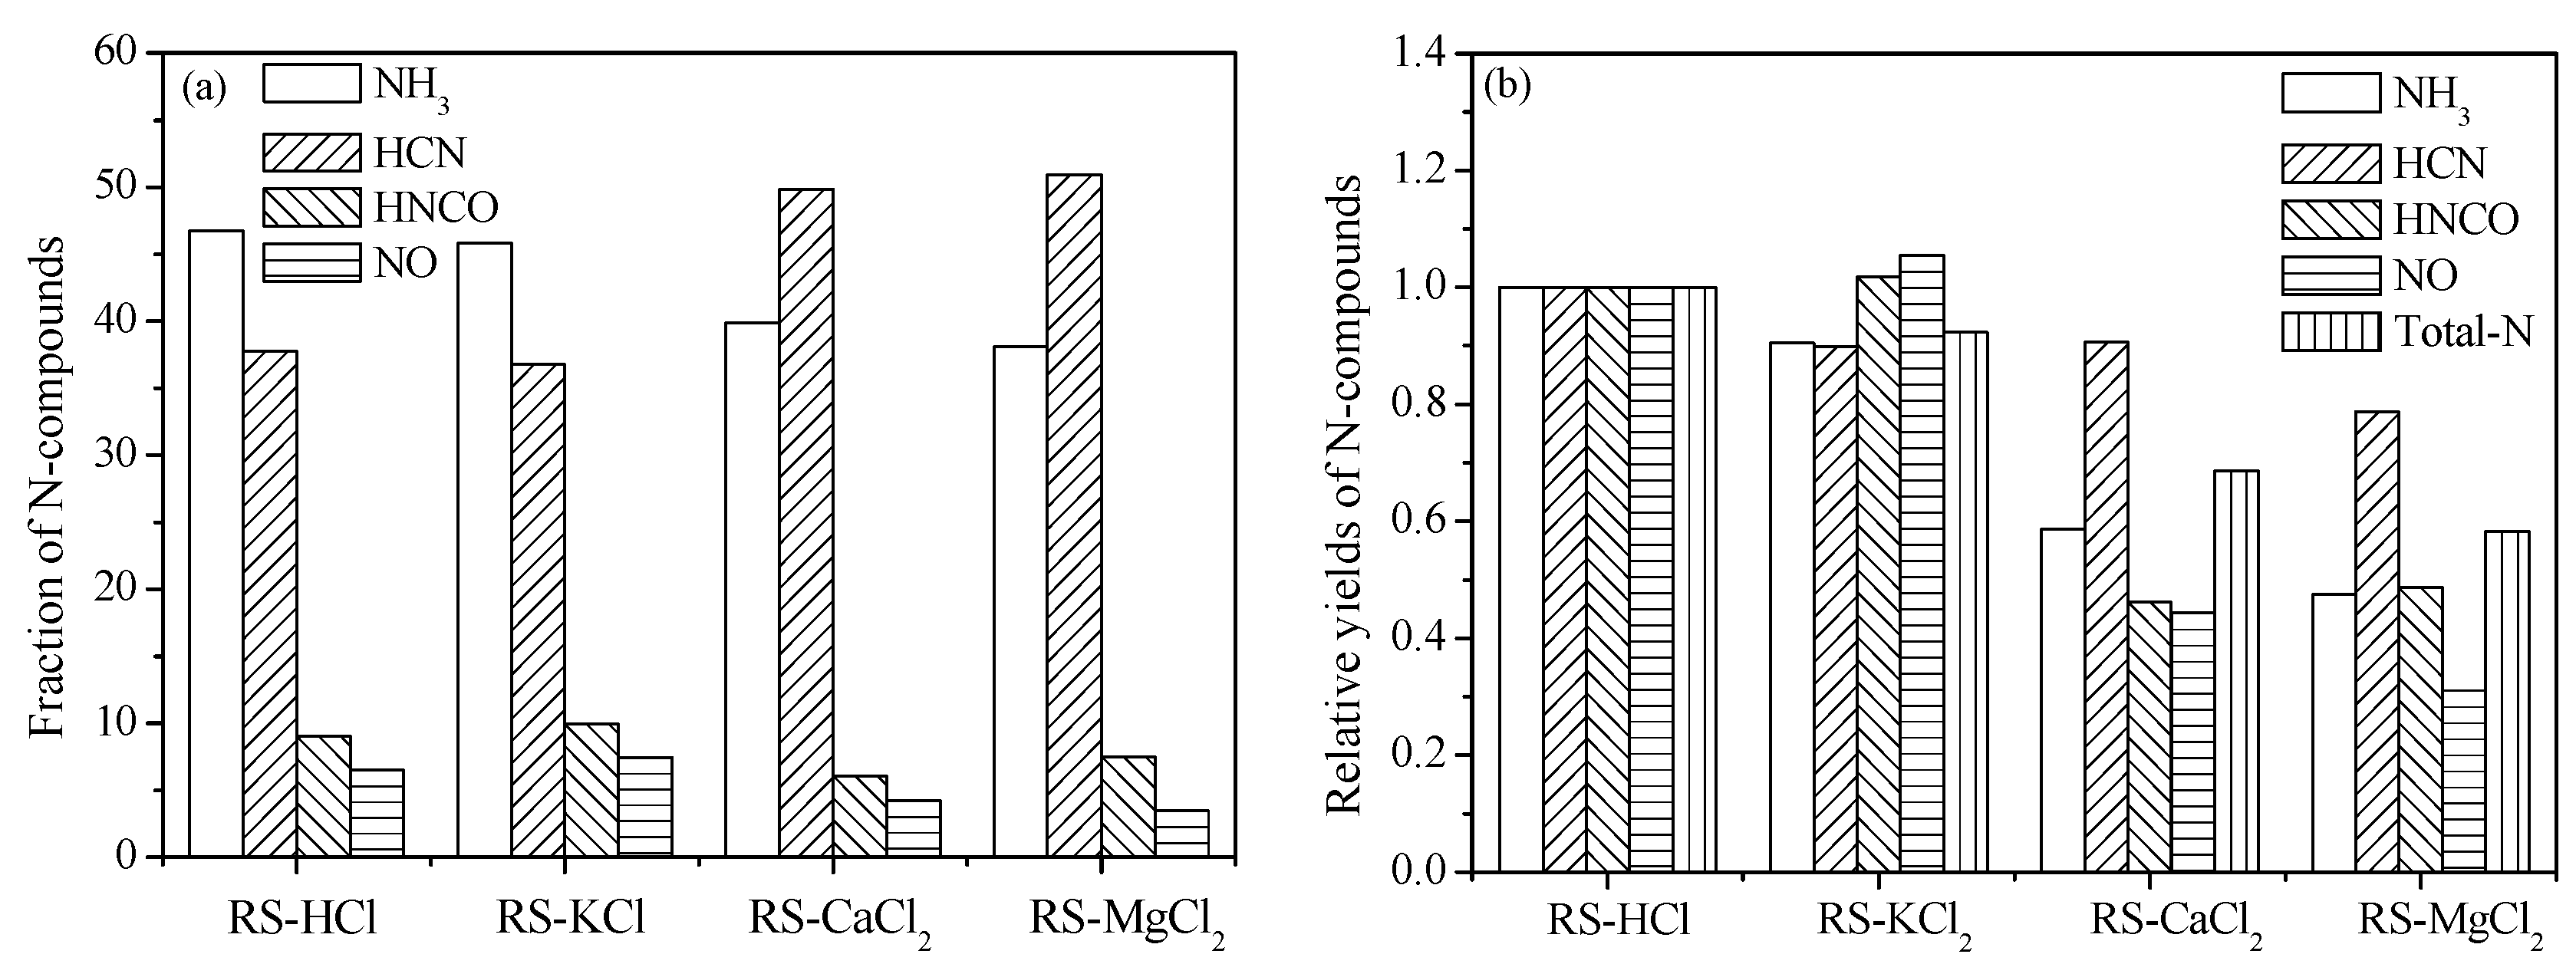
Figure 7a shows the fraction of N-containing compounds in the presence of AAEMs additives. Fractions of NH3 and HCN are slightly decreased, and the values of HNCO and NO increased mildly. Therefore, the effect of KCl on N-containing species formation selectivity is relatively little. The fractions of NH3, HNCO, and NO decrease and the value of HCN increases obviously in the presence of CaCl2 and MgCl2. The formation selectivity of HCN is promoted by adding alkaline earth metals.
To obtain the inhibition ability quantitatively on the N-containing species of three types of AAEM additives, the relative yields of N-containing species should be calculated at the same nitrogen content. Thus, yields of RS-KCl, RS-CaCl2, and RS-MgCl2 were multiplied by 1.111 because the mass percent of AAEM is 10% in samples. The N-containing species yields of samples with additives were calculated and displayed in Figure 7b. For RS-KCl, the relative yields of NH3 and HCN are decreased and the values of HNCO and NO increase compared with that of RS-HCl. This result is seemly contradictory with the result of inherent K metals possibly because different K forms with K metals contain inorganic salts and organic potassium [24], whereas KCl is only considered an additive. The relative yields of all four types of N-containing species decreases in the presence of CaCl2 and MgCl2. The total-N relative yield of RS-KCl, RS-CaCl2, and RS-MgCl2 is 92.3%, 68.7%, and 58.3% of RS-HCl, respectively. Therefore, MgCl2 shows the strongest inhibition ability on N-containing species formation followed by CaCl2 and KCl.
Figure 7. Selectivity and relative yields of N-compounds with AAEM additives. (a) Selectivity; (b) yield.
Energies 08 12356 g007
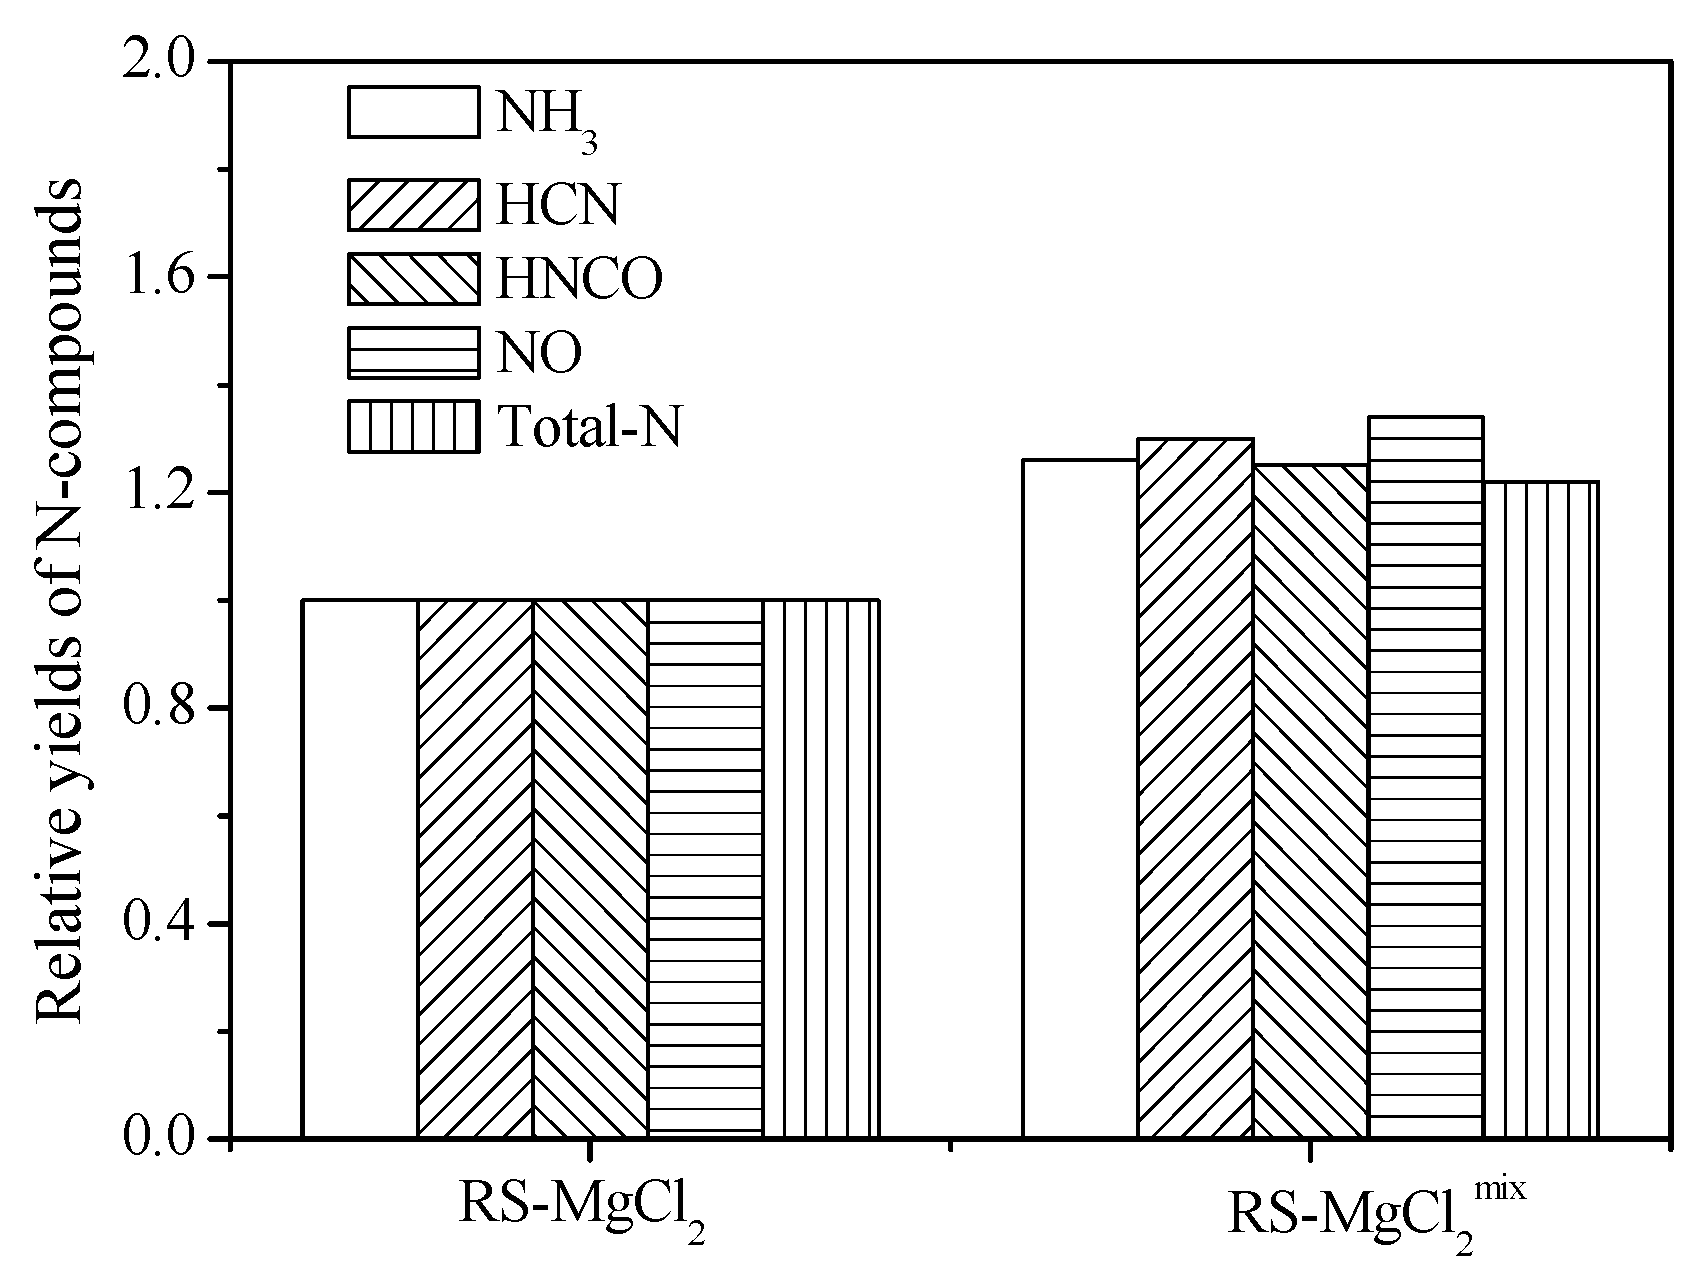
For further information on the AAEM inhibition of N-species release during RS pyrolysis, two adding methods (solution impregnation and solid phase physical mixing) were studied. Solid powders of MgCl2 were added into RS-HCl samples with a mass content of 10%, and the sample was signed as RS-MgCl2mix. The N-species relative yields of RS-MgCl2mix were compared with that of RS-MgCl2, which was set as units. Figure 8 shows that the relative yields of RS-MgCl2mix are obviously higher than that of RS-MgCl2. Thus, the inhibition ability of RS-MgCl2mix is lower than that of RS-MgCl2 because of two reasons. First, MgCl2 can enter the interior pores of the sample by diffusion via solution impregnation. The uniform dispersion in the interior and surface of the sample particle can be expected. Material mixing uniformity by solution impregnation is better than that of dry powder mixing. Second, the inhibition mechanism may be different that the reaction of N-species on the surface of MgCl2 during RS-MgCl2mix pyrolysis. Mg2+ can be directly combined with chemical bonds of N in RS by solution impregnation. The specific inhibition mechanism of AAEMs needs to be further studied.
Figure 8. Relative yields of N-compounds for different adding methods.
Energies 08 12356 g008

4. Conclusions

This study investigated the effects of inherent and external AAEMs on N-containing species formation during RS pyrolysis. The removal of inherent AAEMs shifts N-containing species release to a high-temperature zone because of volatile release behavior with increasing activation energy. In the presence of external AAMEs, N-species release can be observed at a low temperature because of the decreased activation energy, particularly for CaCl2 and MgCl2. The N content of RS is reduced to 83.5% and 60.2% by water washing and acid washing, respectively. The formation selectivity and relative yield were studied under the same N content. The formation selectivity of NH3, HNCO, and NO increase for demineralized pretreatment, whereas HCN selectivity decreased. The formation of HNCO is mainly affected by alkaline earth metals. The total yields of N-containing species are reduced significantly in the presence of KCl, CaCl2, and MgCl2 as external AAEMs additives; the respective values are 92.3%, 68.7% and 58.3% compared with that of the sample pretreated by acid washing. The inhibition ability of AAEMs follows the order MgCl2 > CaCl2 > KCl. A better inhibition effect of MgCl2 can be obtained by solution immersion than by solid powder mixing. The new clean biomass thermal utilization technology may be developed by co-pyrolysis of biomass and AAEMs salts for the low contents of NOx precursors.

Acknowledgments

The authors gratefully acknowledge the financial support of the National Natural Science Foundation of China (Grant No. 51206045) and the Fundamental Research Funds for Central Universities (Grant No. 2015 MS21).

Author Contributions

The corresponding author was responsible for the literature review, the design of experiments, and the initial writing of the manuscript. The co-authors contributed to the evaluation of the experimental results and to the review of the manuscript before submission.

Conflicts of Interest

The authors declare no conflict of interest.

References

  1. Wang, W.Y.; Wei, O.Y.; Hao, F.H. A supply-chain analysis framework for assessing densified biomass solid fuel utilization policies in China. Energies 2015, 8, 7122–7139. [Google Scholar] [CrossRef]
  2. Lu, K.M.; Lee, W.J.; Chen, W.H.; Lin, T.C. Thermogravimetric analysis and kinetics of co-pyrolysis of raw/torrefied wood and coal blends. Appl. Energy 2013, 105, 57–65. [Google Scholar] [CrossRef]
  3. Zhao, X.G.; Feng, T.T.; Ma, Y.; Yang, Y.S.; Pan, X.F. Analysis on investment strategies in China: The case of biomass direct combustion power generation sector. Renew. Sustain. Energy Rev. 2015, 42, 760–772. [Google Scholar] [CrossRef]
  4. Siva, S.R.P.; Anders, R.; Rasmus, F. Alkali resistant Cu/zeolite deNOx catalysts for flue gas cleaning in biomass fired applications. Appl. Catal. B Environ. 2011, 101, 183–188. [Google Scholar] [CrossRef]
  5. Li, Z.Q.; Zhao, W.; Li, R.Y.; Wang, Z.W.; Li, Y.; Zhao, G.B. Combustion characteristics and NO formation for biomass blends in a 35-ton-per-hour traveling grate utility boiler. Bioresour. Technol. 2009, 100, 2278–2283. [Google Scholar] [CrossRef] [PubMed]
  6. Hansson, K.M.; Samuelsson, J.; Åmand, L.E.; Tullin, C. The temperature’s influence on the selectivity between HNCO and HCN from pyrolysis of 2,5-diketopiperazine and 2-pyridone. Fuel 2003, 82, 2163–2172. [Google Scholar] [CrossRef]
  7. Hansson, K.M.; Samuelsson, J.; Tullin, C.; Åmand, L.E. Formation of HNCO, HCN, and NH3 from the pyrolysis of bark and nitrogen-containing model compounds. Combust. Flame 2004, 137, 265–277. [Google Scholar] [CrossRef]
  8. Sun, S.Z.; Tian, H.M.; Zhao, Y.J.; Sun, R.; Zhou, H. Experimental and numerical study of biomass flash pyrolysis in an entrained flow reactor. Bioresour. Technol. 2010, 101, 3678–3684. [Google Scholar] [CrossRef] [PubMed]
  9. Tian, F.J.; Yu, J.L.; Mckenzie, L.J.; Hayashi, J.; Li, C.Z. Conversion of fuel-N into HCN and NH3 during the pyrolysis and gasification in steam: A comparative study of coal and biomass. Energy Fuel. 2007, 21, 517–521. [Google Scholar] [CrossRef]
  10. Wu, J.G.; Gao, S.; Wan, J.L.; Zeng, Y.L.; Ma, F.Y.; Zhang, X.Y. Thermogravimetric kinetics of corn stalk pretreated by oleaginous fungi Cunninghamella echinulate. Bioresour. Technol. 2011, 102, 5255–5258. [Google Scholar] [CrossRef] [PubMed]
  11. Zhou, H.; Jensen, A.D.; Glarborg, P.P.; Jensen, A.; Kavaliauskas, A. Numerical modeling of straw combustion in a fixed bed. Fuel 2005, 84, 389–403. [Google Scholar] [CrossRef]
  12. Ren, Q.Q.; Zhao, C.S. NOx and N2O precursors (NH3 and HCN) from biomass pyrolysis: Interaction between amino acid and mineral matter. Appl. Energy 2013, 112, 170–174. [Google Scholar] [CrossRef]
  13. Raveendran, K.; Ganesh, A.; Khilart, K.C. Influence of mineral matter on biomass pyrolysis characteristics. Fuel 1995, 74, 1812–1822. [Google Scholar] [CrossRef]
  14. Wei, X.L.; Schnell, U.; Hein, K.R.G. Behavior of gaseous chlorine and alkali metals during biomass thermal utilization. Fuel 2005, 84, 841–848. [Google Scholar] [CrossRef]
  15. Williams, P.; Horne, P.A. The role of metal salts in the pyrolysis of biomass. Renew. Energy 1994, 4, 1–13. [Google Scholar] [CrossRef]
  16. Yang, H.P.; Yan, R.; Chen, H.P.; Zheng, C.G.; Lee, D.H.; Liang, D.T. Influence of mineral matter on pyrolysis of palm oil waste. Combust. Flame 2006, 164, 605–611. [Google Scholar] [CrossRef]
  17. Ren, Q.Q.; Zhao, C.S.; Wu, X.; Liang, C.; Chen, X.P.; Shen, J.Z.; Tang, G.Y.; Wang, Z. Effect of mineral matter on the formation of NOx precursors during biomass pyrolysis. J. Anal. Appl. Pyrolysis 2009, 85, 447–453. [Google Scholar] [CrossRef]
  18. Zhu, H.M.; Jiang, X.G.; Yan, J.H.; Chi, Y.; Cen, K.F. TG-FTIR analysis of PVC thermal degradation and HCl removal. J. Anal. Appl. Pyrolysis 2008, 82, 1–9. [Google Scholar] [CrossRef]
  19. Gao, P.; Sun, Z.X.; Kong, Y.; Zhou, J.Q.; Dong, C.Q.; Yang, Y.P. Experimental study of nitrogen transformation in biomass pyrolysis. Chin. Sol. Energy Soc. 2014, 35, 2541–2546. (In Chinese) [Google Scholar]
  20. Kouichi, M.; Taisuke, M. A simple method for estimating f(E) and k0(E) in the distributed activation energy model. Energy Fuel 1998, 12, 864–869. [Google Scholar] [CrossRef]
  21. Kouichi, M. A new and simple method to estimate f(E) and k0(E) in the distributed activation energy model from three sets of experimental data. Energy Fuel. 1995, 9, 302–307. [Google Scholar] [CrossRef]
  22. Antonio, S.V.; Elke, G.; Nestor, G.H. Effect of the number of TGA curves employed on the biomass pyrolysis kinetics results obtained using the distributed activation energy model. Fuel Process. Technol. 2015, 134, 360–371. [Google Scholar] [CrossRef]
  23. Long, J.; Song, H.; Sun, L.S.; Su, S.; Xu, K.; He, L.M.; Xiang, J. Influence of different demineralization treatments on physicochemical structure and thermal degradation of biomass. Bioresour. Technol. 2013, 146, 254–260. [Google Scholar] [CrossRef] [PubMed]
  24. Xu, R.; Ferrante, L.; Briens, C.; Berruti, F. Flash pyrolysis of grape residues into biofuel in a bubbling fluid bed. J. Anal. Appl. Pyrolysis 2009, 86, 58–65. [Google Scholar] [CrossRef]

