Article

Carbon and Energy Footprints of Prefabricated Industrial Buildings: A Systematic Life Cycle Assessment Analysis

CIRIAF—Interuniversity Research Center on Pollution and Environment “M. Felli”, Università degli Studi di Perugia, Via G. Duranti 67, 06125 Perugia, Italy
*
Author to whom correspondence should be addressed.
Energies 2015, 8(11), 12685-12701; https://doi.org/10.3390/en81112333
Submission received: 1 September 2015 / Revised: 20 October 2015 / Accepted: 28 October 2015 / Published: 6 November 2015
(This article belongs to the Special Issue Energy Efficient Building Design 2016)

Abstract

:
A systematic analysis of green-house gases emission (carbon footprint) and primary energy consumption (energy footprint) of prefabricated industrial buildings during their entire life cycle is presented. The life cycle assessment (LCA) study was performed in a cradle-to grave approach: site-specific data from an Italian company, directly involved in all the phases from raw material manufacturing to in-situ assembly, were used to analyze the impacts as a function of different design choices. Four buildings were analyzed and results were used to setup a parameterized model that was used to study the impacts of industrial prefabricated buildings over the input parameter space. The model vs. data agreement is within 4% for both carbon and energy footprint. The functional unit is 1 m3 of prefabricated building, considering a 50-year lifetime. The results of the four buildings decrease from 144.6 kgCO2eq/m3 and 649.5 kWh/m3 down to 123.5 kgCO2eq/m3 and 556.8 kWh/m3 as the building floor area increases from 1048 m2 to 21,910 m2. The use phase accounts for the major impact (approximate 76%). It is found that the carbon footprint is proportional to the energy footprint, the proportional factor being 0.222 kgCO2eq/kWh within 0.5% accuracy. Finally, a systematic study of the sensitivity of input parameters (insulation, lifetime, foundation type) is presented.

1. Introduction

The effect of anthropic activities on the environment [1,2] is quickly guiding the international community to find effective strategies to cope with global warming and to elaborate strategies for climate change mitigation [3,4,5]. The worldwide effort to reduce the environmental impact associated to the industrial sector is quickly producing an increasing feedback on national and international decision makers [6,7]. It is estimated that up to 60% of the overall raw materials extracted from the Earth is consumed by this sector, and that consequently roughly 50% of the green-house gas (GHG) emissions in the atmosphere is attributable to their transformation into construction materials [8]. In this context, the analysis of lifecycle-based assessments on the main impact categories associated to the pre-production, production, assembly, use, and end-of-life phases represents a strategic asset towards a holistic interpretation of the footprint from industrial buildings [9], and to guide the design phase towards the most energy and environmentally efficient option [10,11].
The application of the lifecycle approach is fundamental to understand the real impact of the construction sector on the environment, especially for industrial buildings [12,13], which represent an important portion of the overall environmental impact, with still a few contributions investigating their lifetime environmental behavior. Impacts can be assessed in different fields:
-
Environment, focusing on siting, energy consumption, water usage, and material usage [14,15];
-
Economic, following the life-cycle costing scheme [16];
-
Social [17];
-
Safety and industrial risk prevention [18];
-
Functionality [19];
-
Aesthetics [20].
Carbon and energy footprints are gaining an increasing consideration among the scientific community, governments, construction companies, and customers as key criteria in assessing the sustainability performance of buildings [21,22,23]. Dedicated carbon footprint studies of residential and commercial buildings in the U.S. [24] indicate that direct purchase of electricity (scope 2, [25]) accounts for 48%, representing the largest impact during the building lifecycle (scope 3 and scope 2 accounting for 32% and 20%, respectively). The construction supply chain is an important contributor to the building carbon footprint with 6% share. Finally, the use phase are found to be the highest, with 91% of the total emissions through all of the lifecycle. Embodied energy is also a useful estimator of the environmental performance of different building technologies [26]. The choice of materials may play an important role in the overall lifecycle greenhouse gas emissions and energy analysis of prefabricated buildings. The use of reusable prefabricated modules, for example, can reduce the material consumption up to 75% if compared to conventional concrete buildings. Even if prefabricated steel buildings result in a significant increase (~50%) in embodied energy, it is found that reuse of prefabricated steel modules can contribute significantly to the improvement of the environmental sustainability of the construction industry. Reuse of materials can save up to 81% in embodied energy and produce 51% materials saving by mass.
The life cycle assessment (LCA) is a quantitative technique that allows the determination of the environmental impact resulting from the entire life cycle of a given product (e.g., any good or service) taking into account all the inputs (raw materials, use of resources, energy, etc.) and outputs (waste, emissions, byproducts, etc.) [27]. An LCA study is a very powerful tool to identify the phases where some of the most environmentally-critic processes take place, the subjects that are involved (manufacturer, user, etc.), and the information needed to implement improvements and solutions [28].
The lifecycle analysis, or cradle-to-grave analysis, methodology is an internationally-standardized method that is considered one of the most effective management tools for identifying and assessing the environmental impacts related with a product or service. LCA studies can verify the impact on the environment during the entire life cycle [29,30].
The quantification of GHG emissions associated to a given activity (e.g., any good or service, operations of organizations and governments, etc.) is defined as carbon footprint (CF) [31,32]. The CF monitors the emission produced by a wide range of human activities, in terms of equivalent CO2 (CO2eq), which are the primary cause of global warming and climate change. The CF is generally based on long-lived greenhouse gases using a 100-year global warming potential as specified in the Kyoto Protocol [33]. In addition to the CF, the consumption of primary energy associated to the entire lifecycle of industrial prefabricated buildings was also evaluated. This indicator is referred to as energy footprint (EF). The calculation in this study is made with the SimaPro 8.0 software (PRé Consultants bv, Amersfoort, The Netherlands) [34], featuring an optimized calculation engine and including the newly-released ecoinvent 3.0 database [35], one of the most extensive internationally-recognized LCI databases.
The methodology for the evaluation of carbon and energy footprints and the modeling procedure are presented in Section 2. In particular, four buildings were analyzed and a parameterized model for prefabricated industrial buildings was elaborated. Section 3 contains the results of the study, including data vs. model comparison and sensitivity analysis of design parameters. Conclusions are given in Section 4.

2. Methodology

The goal of this study is to develop a methodology to assess the environmental performance of different typologies of industrial prefabricated buildings. Similar layouts can be affected in different ways due to different boundary conditions (e.g., location, usage, etc.). In this perspective, a tool that is able to produce a reliable feedback about the impact of a given design choice can be considered as an important support to guide the building project definition [13].
The analysis presented in this paper is a two-step procedure: (i) primary data were collected for a sample of four prefabricated buildings (Section 2.1) including input materials, manufacturing and building processes, transportation, energy consumption, and end-of-life, and an LCA analysis was performed; (ii) an interpolation algorithm (i.e., modeling, Section 2.2) was setup to compute the incidence of input materials, manufacturing and building, transportation, and end-of-life as a function of a range of design parameters, and a systematic LCA analysis was performed using those data. The modeling, rather than being performed on the LCA results of the four selected buildings, was performed using the data computed with the modeling procedure. The result of the modeling procedure are primary data which were used as input for the LCA assessments performed in the second part of the work (Section 3.2). Since design requirements may vary within a large number of options, depending mainly on the destination of use and the installation site of the prefabricated building, particular attention was dedicated to the identification and the parameterization of the characterizing features. The LCA approach is fundamental to understand, at the same time, the overall impact in terms of carbon and energy footprint, and to spot, and possibly to suggest, effective solutions to minimize the most impacting phases. Two main impact categories were chosen:
-
Carbon footprint, which quantifies the sum of direct and indirect emission of GHGs associated to the prefabricated building lifecycle; and
-
Energy footprint, which similarly quantifies the primary energy required during the entire lifecycle.
Both impact categories (CF and EF) were assessed based on an LCA approach, including the end-of-life stage (
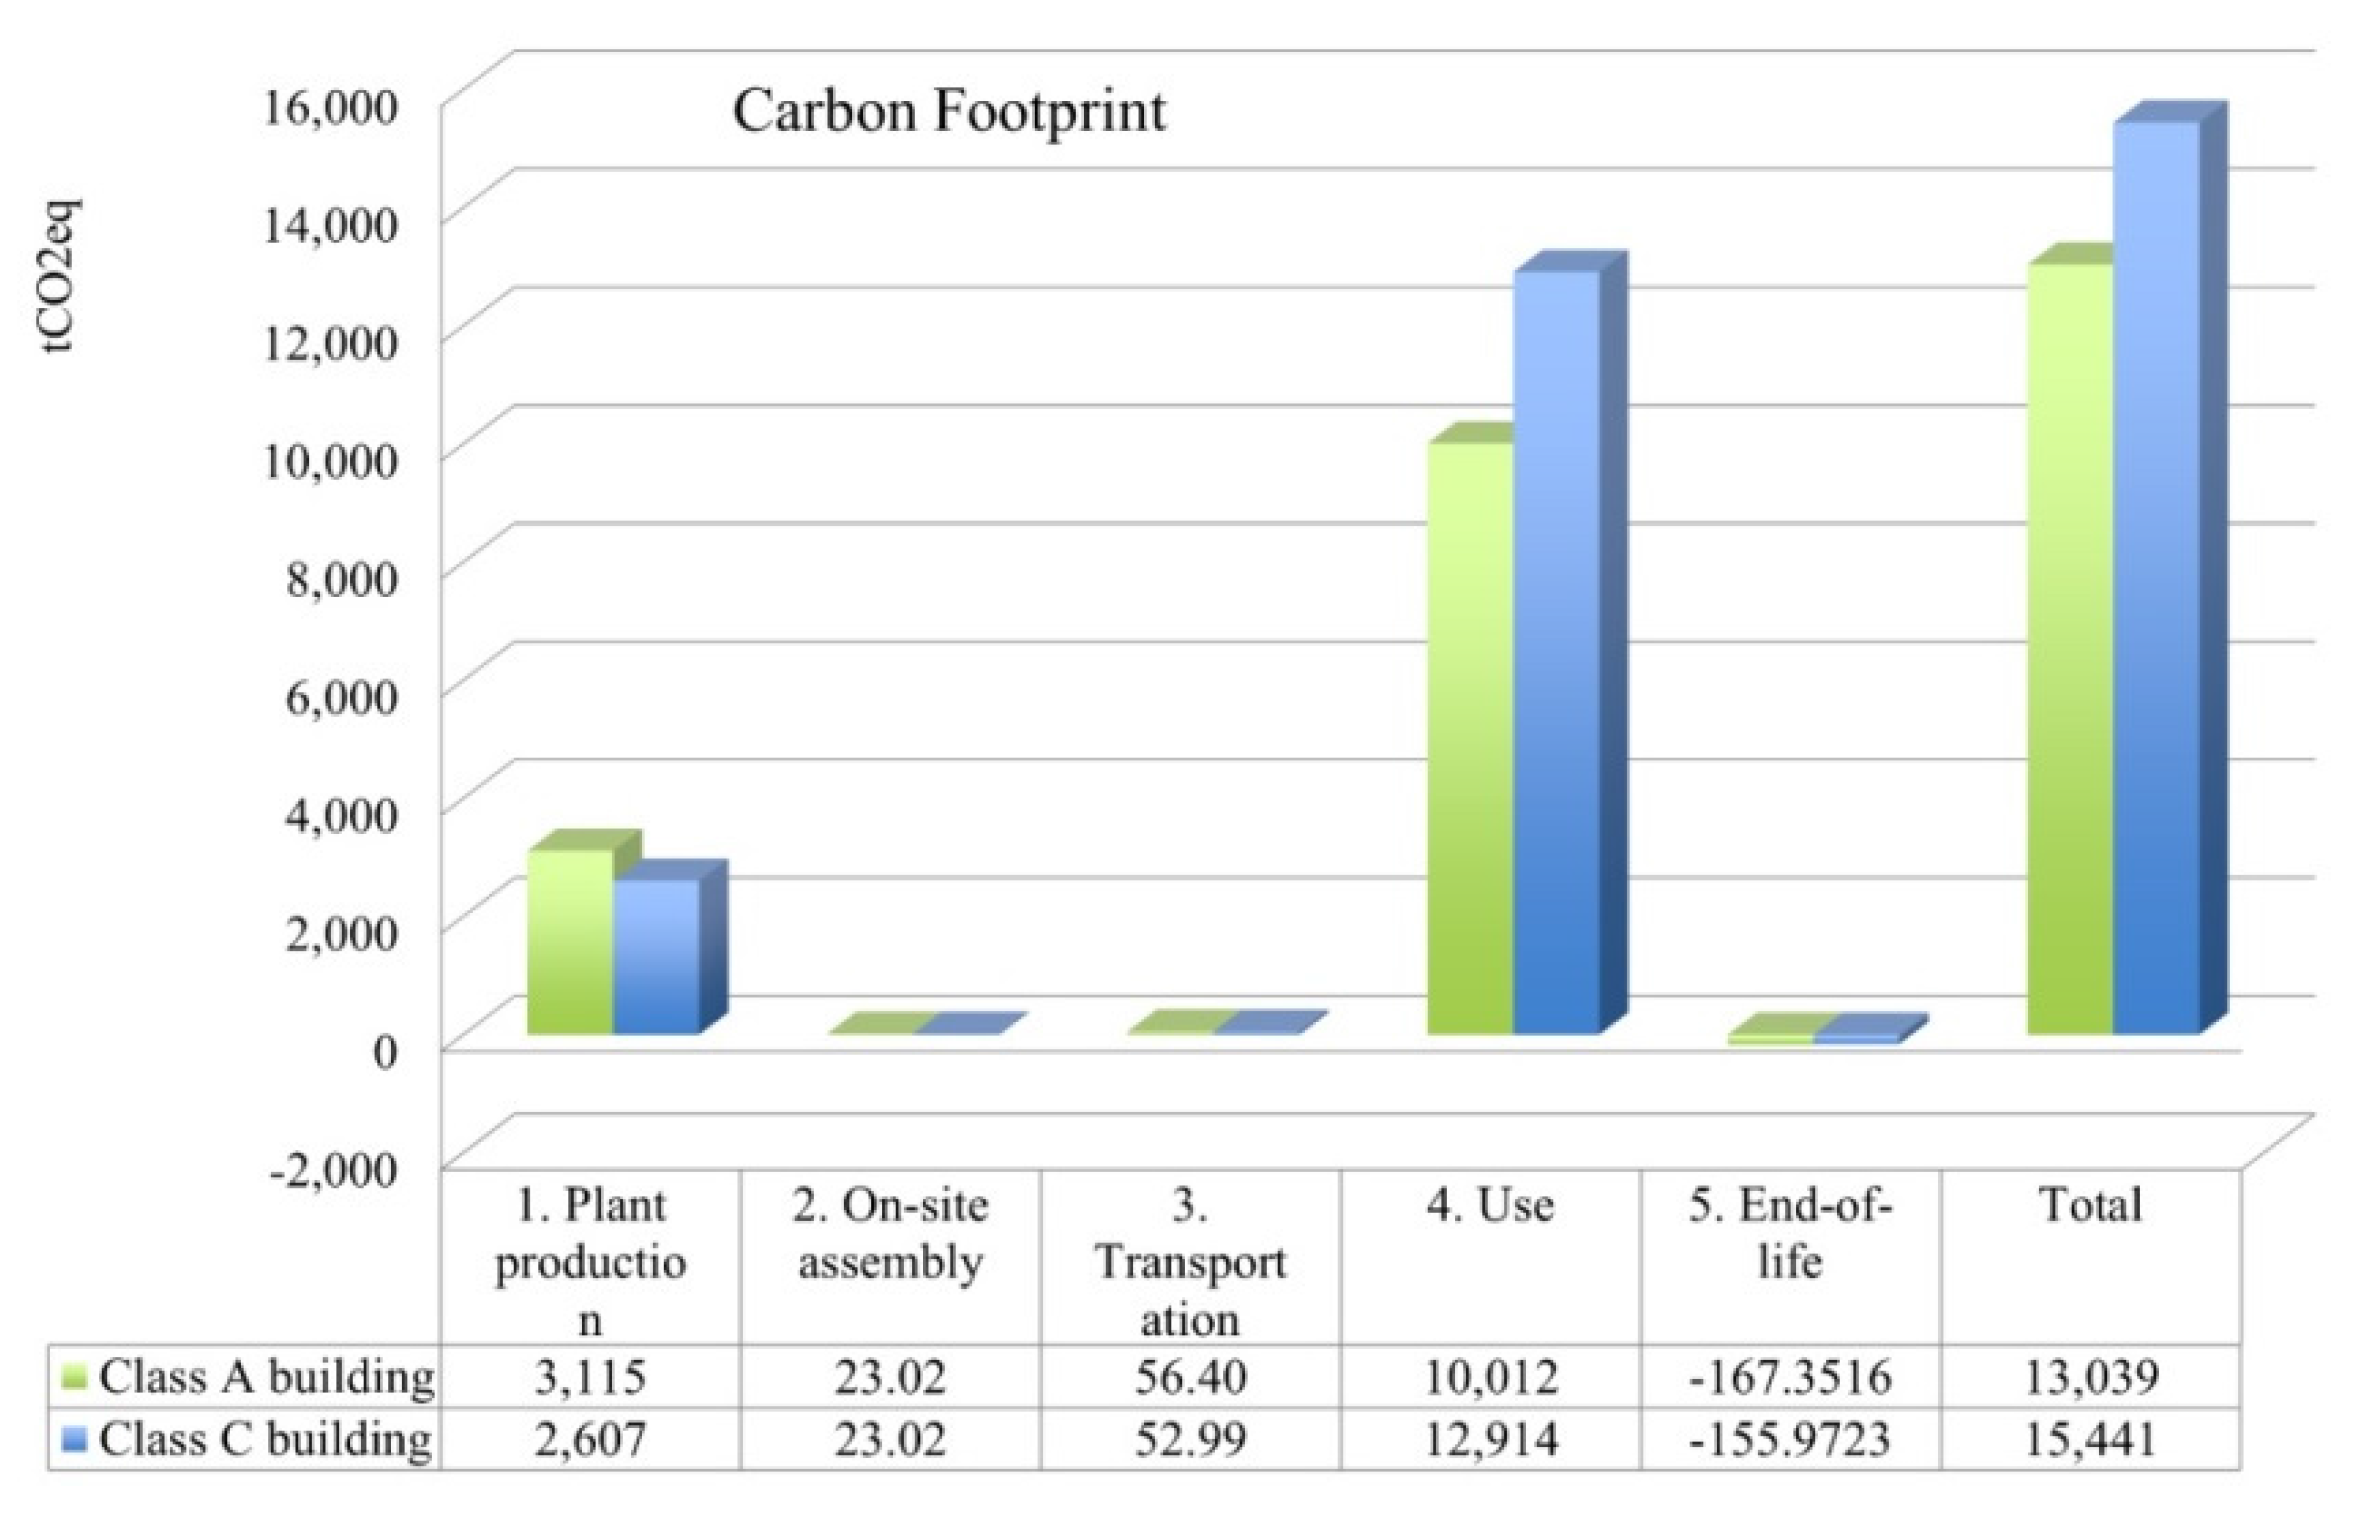
i.e., cradle-to-grave study). For each category, the impact was divided according to five main phases:
-
Plant production, including raw material acquisition, transportation to the production facility, and manufacturing of prefabricated modules;
-
On-site assembly, including site preparation, on-site building of foundations, and assembly of prefabricated modules;
-
Transport, including prefabricated modules, raw materials, and machinery to/from the assembly site;
-
Use, including heat, electricity, and other specific power requirements;
-
End-of-life, including dismantling of the above-ground structure and recycling of reinforcing steel and concrete.
All the processing phases, inputs, and outputs were considered using 1% as a general cut-off rule.

2.1. Studied Building and Analysis Boundaries

Primary data were collected from a large Italian company that manufactures and assembles prefabricated buildings and covers the entire national territory with four main manufacturing sites. The study was focused on industrial buildings recently built (as of 2014) and in compliance with current national requirements. The availability, from one single subject, of all the primary data required for the analysis (i.e., for every LCA phase of different building types) ensures the homogeneity of the procedure and the robustness of the results, especially in a comparative perspective.
With the aim of providing an overview of the environmental footprint as a function of the typical design choices, a survey of processes and available construction options was performed. Four buildings were selected with floor areas spanning from 1048 up to 21,910 m2. The roof-top height is between 8.4 m and 9.7 m. The layout of the four selected buildings and their main properties are shown in Table 1.
Table 1. Layout and main properties of the four selected buildings.
BuildingLayout (not to scale)Floor areaAspect ratioHeightFoundation pillarsWindow area
WallsRoof
(m2)(length/width)(m)(No.)(m2)(m2)
No. 1 Energies 08 12333 i00110481.78.41213212
No. 2 Energies 08 12333 i00230002.49.7280208
No. 3 Energies 08 12333 i00312,7202.09.5762,170662
No. 4 Energies 08 12333 i00421,9102.68.6102840300

2.2. Modeling

The four selected buildings were analyzed in detail with the aim of producing a toy prefabricated building (i.e., the model), featuring average properties with respect to the four selected buildings. The model was setup considering the incidence of raw materials, manufacturing, and assembly on the four selected buildings as a function of the design choice: floor area, height, insulation level, and foundation type. The consistency of the outputs of the modelling procedure was checked against the four selected buildings and it was also verified by the technicians of the construction company that provided the data used in this work.

2.2.1. Floor Area

Raw materials were then classified within two groups: surface-scaling materials (used for foundations, floor, and roof), and perimeter-scaling materials (used for walls). Their incidence is reported in Table 2.
Table 2. Properties of the four selected buildings and values used for the model, grouped as surface- and perimeter-scaling quantities.
BuildingNo. 1No. 2No. 3No. 4Model
Surface(m2)1048300012,72021,9101000–25,000
FoundationConcrete(m3/m2)0.06720.06850.03300.03310.0504
Steel(kg/m2)9.708.774.645.437.13
Pillars(no./m2)0.01150.00930.00600.00470.00785
Excavation volume(m3/m2)0.2530.2060.1320.1030.173
FloorConcrete(m3/m2)0.1650.1840.1680.1720.172
Steel(kg/m2)0.1830.2040.1870.1910.191
Roof *Concrete(m3/m2)0.09220.1770.07190.06840.102
Steel(kg/m2)16.520.312.112.015.2
Pillars(No./m2)0.01150.009330.005970.004660.00785
Window(m2/m2)0.12600.1710.03820.0837
Insulation(kg/m2)4.0344.5384.1022.2633.73
Perimeter(m)132245456637-
Walls *Concrete(m3/m)0.8630.2120.7841.270.781
Steel(kg/m)85.833.556.497.768.4
Window(m2/m)0.1060.8991.470.4820.740
Aspect ratio(length/width)1.872.402.042.642.24
(*) values normalized to a reference height of 10 m (roof-top).
In particular, it can be noted that the incidence of raw materials used for foundation in buildings 1 and 2 is sensibly different from buildings 3 and 4. This is because buildings 1 and 2 were designed for a soil requiring deeper foundations that buildings 3 and 4. According to the manufacturer’s advice, the average value is to be considered as representative for a typical application.
After the first step of the parameterization procedure, the incidence of raw materials can be computed for a building model having a floor area between 1000 m2 and 25,000 m2, a roof-top height of 10 m (corresponding to a maximum indoor clearance of 8.65 m), standard insulation, and standard foundations.

2.2.2. Height, Insulation, and Foundations

The second step of the parameterization procedure was dedicated to include height, insulation level, and foundation type as input parameters for the model. The incidence of wall materials (perimeter-scaling quantities) and roof pillars (surface-scaling quantity) depends on the building height. For roof-top heights between 7 m and 12 m (which cover most of the building manufactured by the company), walls and pillars have the same stratigraphy: the incidence of materials is directly proportional to the height of the building.
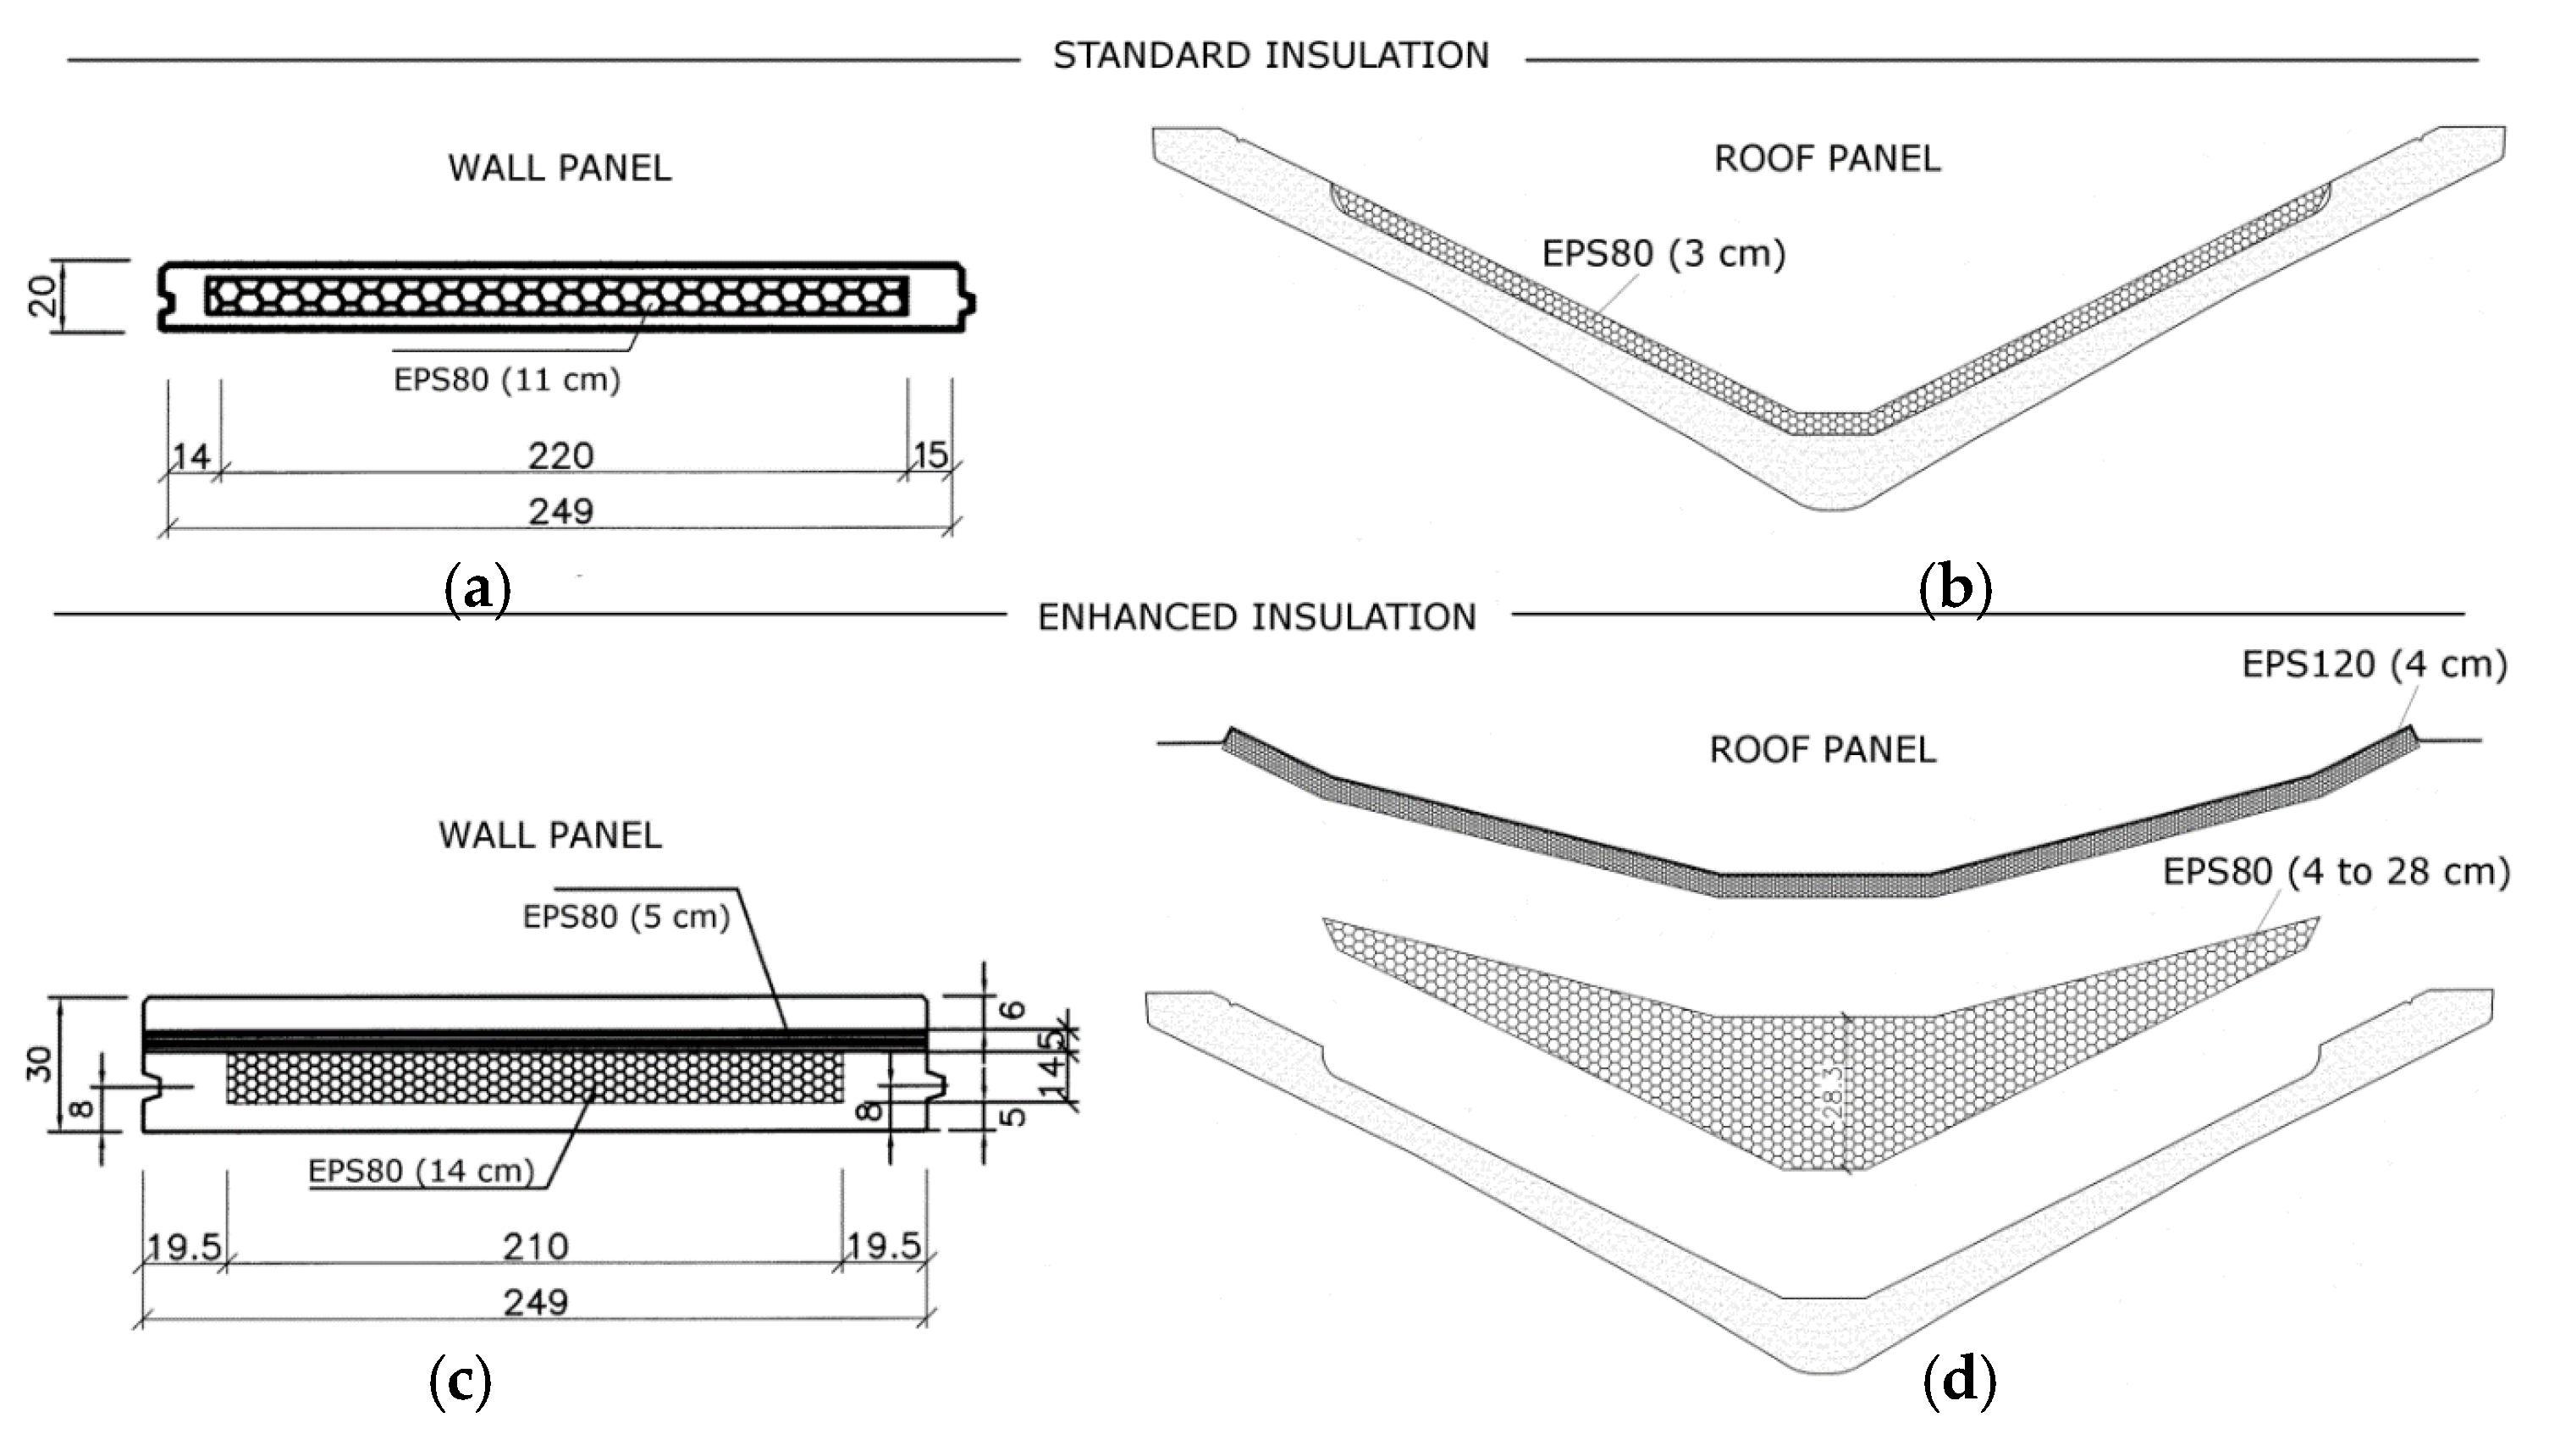
Two different types of insulation were also taken into account. Wall and roof panels are a sandwich of precast concrete and expanded polystyrene foam (EPS). The stratigraphy is shown in Figure 1. A standard insulation level was considered as a reference scenario for the model. In this case the wall panels are 20 cm thick and 11-cm EPS80 panels are encapsulated within the concrete shell. The average EPS80 incidence is 0.087 m3/m2 of panel area. The roof panels are insulated with a layer of 3-cm EPS80 foam (0.024 m3/m2). As a result, the average U value for the building approximate 1 W/m2/K. According to the national energy classification [36], the standard insulation corresponds to the energy class C (approximate 10 kWh/m3/year for a 10-m-high building with a floor area of 1000 m2 located in the city of Perugia, Italy).
Figure 1. Top-view section of the wall panels (a,c) and front-view section of the roof panels (b,d) for standard insulation (a,b) and enhanced insulation (c,d).
Energies 08 12333 g001
An enhanced insulation option (in fulfillment with requirements from [37], was also included in the model. In this case wall panels are 30 cm thick, and the higher insulation is guaranteed by 14-cm EPS80 panel enclosed in the concrete shell, plus and an additional 5-cm EPS80 layer that crosses the entire panel to minimize the thermal bridge. The incidence of EPS80 is 0.153 m3/m2. Roof panels have a 4-cm EPS120 layer (0.035 m3/m2) and a 4- to 28-cm EPS80 layer (0.132 m3/m2). As a result, the average U value for the building approximate 0.5 W/m2/K). The enhanced insulation features an increased width of EPS within the panel and it is able to reach the energy class A level (approximate 5 kWh/m3/year for the same building). In both cases aluminum-frame windows with a U value of 1.6 W/m2/K are considered.
Finally, two options for the foundation type (with and without foundation pillars) are included in the model. The enhanced foundation type increases the incidence of concrete and steel during the on-site-assembly phase of approximate 18% and 59%, respectively, for a 1000 m2 building.

2.2.3. Site, Use, and Lifetime

Other specific inputs can also be specified to complete the life-cycle modeling of the building. Impacts from transportation of prefabricated materials and machinery from the production facility depend on the construction site. The construction site also affects the energy requirements because of the specific climate conditions. The use phase was modeled considering minimum space heating and lighting requirements. Energy for space heating is computed according to the specified energy class of building (see Section 2.2.2), which depends on the building layout and location [36]. Heat-pumps with a reference coefficient of performance equal to 4 are considered. Hot-water production and summer cooling are not considered. A minimum lighting level (300 lux provided with fluorescent lamps) are also included in the use phase. Other energy consumption for the specific industrial activity taking place during the building lifetime (natural gas and/or electricity) could be added according to the specific use of the buildings. This extra energy, however, was not considered in the impacts assessment.

2.2.4. The reference Scenario

For comparative analyses, a reference scenario was setup considering a prototype building characterized by basic properties. The reference scenario includes all the five LCA phases evaluated using the following design conditions:
-
Enhanced insulation;
-
Minimum energy consumption during the use phase;
-
Meteorological conditions as the city of Perugia, Italy;
-
Distance of the production facility from the construction site: 100 km;
-
Foundations with pillars;
-
Height (roof-top):10 m;
-
Lifetime: 50 years.

3. Results

In this section, results of the carbon and energy footprint of prefabricated industrial buildings, based on a cradle-to-grave approach, are presented. The reference functional unit in this study is a unit volume of prefabricated buildings (1 m3) during the entire life cycle (50 years). However, for completeness and a better interpretation of the results, impacts are also shown for the entire building and per unit surface (1 m2). In particular, a detailed discussion of the four selected buildings, the data vs. model comparison, and the model validation are shown in Section 3.1. A systematic study of the impacts as a function of different design parameters, using the parameterized model, is presented in Section 3.2. Finally, sensitivity to input parameters is discussed in Section 3.3.

3.1. Carbon Footprint (CF) and Energy Footprint (EF) of the Four Selected Buildings

The carbon and energy footprint of the four selected buildings in the reference scenario (Section 2.2.4) are shown in Table 3. Figure 2 and Figure 3 show the contribution of the five phases to the carbon and energy footprints, respectively, including the average values. The major impact is relative to the use phase (75.1% and 77.3% for CF and EF, respectively), the second contribution is given by the plant production phase (25.6% and 23.0%), which includes raw materials production and processing. Other phases account for less than 2%.
Table 3. Carbon and Energy Footprint of the four selected buildings for the reference scenario.
BuildingNo. 1No. 2No. 3No. 4
Floor area (m2)1048300012,72021,910
Carbon Footprint (CF) (tCO2eq)
1. Plant production478.2104042165370
2. On-site assembly3.0357.21525.5941.54
3. Transportation9.97421.6461.32109.0
4. Use1,0493,00412,73521,936
5. End-of-life−24.77−51.87−179.9−367.8
Total1516402116,85827,089
Energy Footprint (EF) (MWh)
1. Plant production1963412117,79320,950
2. On-site assembly12.4429.57104.9170.2
3. Transportation44.8397.42276.3491.3
4. Use486213,91859,012101,647
5. End-of-life−75.76−161.8−596.0−1268
Total680718,00476,591121,991
Figure 2. Contributions of the five life cycle assessment (LCA) phases to the carbon footprint of the four selected buildings.
Energies 08 12333 g002
Figure 3. Contributions of the five LCA phases to the energy footprint of the four selected buildings.
Energies 08 12333 g003
The comparison of the four selected buildings results with the model under the reference scenario hypotheses is shown in Table 4 in terms of total carbon and energy footprint (tCO2eq and MWh, respectively), carbon and energy footprint per unit surface (kgCO2eq/m2 and kWh/m2), and per unit volume (kgCO2eq/m3 and kWh/m3). The modeling, performed according to the procedure described in Section 2.2, is characterized by average features among the four selected buildings as shown in Table 2. A good overall agreement (within 4%) is obtained between data and model for both the carbon and energy footprints, despite the fact that only 4 buildings were considered. More robust results, however, could be obtained with a larger sample. Figure 4 shows the data vs. model comparison as a function of the floor area considering the entire building lifetime. The same results, shown per unit volume, are given in Figure 5. It can be noticed that, as the floor area increases, both the CF and EF decrease, up to −14.5%. This trend, in the quantities shown per unit volume, is driven by the decrease of the plant production phase: while the use phase remains unchanged (same energy requirements per unit volume), the plant production phase for building No. 4 is approximate 50% smaller than building No. 1.
Table 4. Carbon and Energy footprint comparison of the four selected buildings (data) vs. the model for the reference scenario.
CF
BuildingFloor area (m2)Data (tCO2eq)Model (tCO2eq)Data (kgCO2eq/m2)Model (kgCO2eq/m2)Data (kgCO2eq/m3)Model (kgCO2eq/m3)
No. 110481516150214461433144.6143.3
No. 230004021406513401355134.0135.5
No. 312,72016,85816,49713251297132.5129.7
No. 421,91027,08928,12912361284123.6128.4
EF
BuildingFloor area (m2)Data (MWh)Model (MWh)Data (kWh/m2)Model (kWh/m2)Data (kWh/m3)Model (kWh/m3)
No. 110486807679064956479649.5647.9
No. 2300018,00418,32160016107600.1610.7
No. 312,72076,59174,16960215831602.1583.1
No. 421,910121,991126,39655685769556.8576.9
Figure 4. Carbon (blue) and Energy (red) footprint comparison of the four selected buildings (points) vs. the model (lines) for the reference scenario.
Energies 08 12333 g004
Figure 5. Carbon (blue) and Energy (red) footprint comparison of the four selected buildings (points) vs. the model (lines) for the reference scenario per unit volume.
Energies 08 12333 g005

3.2. CF and EF of Industrial Prefabricated Buildings

The carbon and energy footprints of model buildings (reference scenario) as a function of the floor area are shown in Figure 6 and Figure 7, respectively. The main contribution is from the use phase (not shown), followed by the plant production phase. Other phases account for less than 2%. The use phase is directly proportional to the building volume and accounts for 100.12 kgCO2eq/m3 (CF) and 463.93 kWh/m3 (EF). Both carbon and energy footprints, computed per unit volume, show a decreasing trend as the floor area increases. In particular, the contribution of the use phase to the total carbon footprint increases from 69.6% to 78.2% as the floor area increases (71.4% to 80.6% for the energy footprint). On the other hand, the contribution of the plant production phase to the total carbon footprint decreases from 31.1% to 22.5% as the floor area increase (28.9% to 19.8% for the energy footprint). As a result, as the floor area increases from 1000 to 25,000 m2, the total CF decreases from 143.78 kgCO2eq/m3 down to 128.12 kgCO2eq/m3; the total EF decreases from 650.05 kWh/m3 down to 575.62 kWh/m3. Detailed results are shown in Table 5. Percentages for each LCA phase are shown in Table 6 (CF) and Table 7 (EF).
Figure 6. Carbon footprint (reference scenario) as a function of the floor area. The use phase (not shown) is constant (100.12 kgCO2eq/m3).
Energies 08 12333 g006
Figure 7. EF (reference scenario) as a function of the floor area. The use phase (not shown) is constant (463.93 kWh/m3).
Energies 08 12333 g007
Table 5. Carbon and energy footprint results for the reference scenario.
Floor area (m2)100030005000750010,00012,50015,00017,50020,00022,50025,000
CF (kgCO2eq/m3)
1. Plant production44.6836.3233.7432.1231.1530.4930.0029.6229.3229.0728.85
2. On-site assembly0.23020.23020.23020.23020.23020.23020.23020.23020.23020.23020.2302
3. Transportation0.85920.67170.61720.58370.56400.55070.54090.53340.52730.52230.5181
4. Use100.1100.1100.1100.1100.1100.1100.1100.1100.1100.1100.1
5. End-of-life−2.110−1.840−1.757−1.705−1.674−1.652−1.636−1.624−1.614−1.606−1.599
Total143.8135.5133.0131.3130.4129.7129.3128.9128.6128.3128.1
EF (kWh/m3)
1. Plant production187.8148.7136.7129.1124.5121.5119.2117.4116.0114.8113.8
2. On-site assembly0.94340.94340.94340.94340.94340.94340.94340.94340.94340.94340.9434
3. Transportation3.8603.0232.7792.6292.5412.4812.4372.4032.3762.3542.335
4. Use463.9463.9463.9463.9463.9463.9463.9463.9463.9463.9463.9
5. End-of-life−6.446−5.886−5.714−5.605−5.540−5.496−5.463−5.438−5.417−5.400−5.386
Total650.0610.7598.6591.0586.4583.3581.0579.2577.8576.6575.6
The total carbon and energy footprints are strictly correlated and, even if contributions from single LCA phases may show an irregular behavior, the total CF is directly proportional to the total EF (Figure 8) within 0.5%. The proportional constant is 0.222 kgCO2eq/kWh (i.e., 0.222 kgCO2eq per kWh of primary energy required during the building life cycle). If not taking into account the use phase (four-phases LCA), an increasing trend is observed as the floor area increases. However, the proportionality still holds within 5%: 0.246 kgCO2eq/kWh.
Figure 8. CF per unit primary energy. The four-phases LCA does not include the use phase.
Energies 08 12333 g008
Table 6. CF: enhanced vs. standard insulation.
CF
Floor Area (m2)100030005000750010,00012,50015,00017,50020,00022,50025,000
Energy Class A
1. Plant production31.08%26.80%25.38%24.45%23.89%23.50%23.21%22.99%22.80%22.65%22.52%
2. On-site assembly0.16%0.17%0.17%0.18%0.18%0.18%0.18%0.18%0.18%0.18%0.18%
3. Transportation0.60%0.50%0.46%0.44%0.43%0.42%0.42%0.41%0.41%0.41%0.40%
4. Use69.63%73.89%75.30%76.22%76.78%77.17%77.46%77.68%77.86%78.02%78.15%
5. End-of-life−1.47%−1.36%−1.32%−1.30%−1.28%−1.27%−1.27%−1.26%−1.26%−1.25%−1.25%
Total (kgCO2eq/m3)143.8135.5133.0131.3130.4129.7129.3128.9128.6128.3128.1
Energy Class C
1. Plant production22.13%18.97%17.94%17.28%16.89%16.61%16.41%16.25%16.12%16.01%15.92%
2. On-site assembly0.14%0.15%0.15%0.15%0.15%0.15%0.15%0.15%0.15%0.15%0.15%
3. Transportation0.47%0.39%0.37%0.35%0.34%0.34%0.33%0.33%0.33%0.33%0.32%
4. Use78.32%81.52%82.56%83.23%83.63%83.91%84.12%84.28%84.41%84.51%84.60%
5. End-of-life−1.05%−1.03%−1.02%−1.01%−1.01%−1.01%−1.01%−1.00%−1.00%−1.00%−1.00%
Total (kgCO2eq/m3)164.9158.4156.4155.2154.4153.9153.5153.2153.0152.8152.6
Table 7. EF: enhanced vs. standard insulation.
EF
Floor Area (m2)100030005000750010,00012,50015,00017,50020,00022,50025,000
Energy Class A
1. Plant production28.88%24.35%22.83%21.84%21.24%20.82%20.51%20.27%20.07%19.91%19.77%
2. On-site assembly0.15%0.15%0.16%0.16%0.16%0.16%0.16%0.16%0.16%0.16%0.16%
3. Transportation0.59%0.50%0.46%0.44%0.43%0.43%0.42%0.41%0.41%0.41%0.41%
4. Use71.37%75.97%77.50%78.50%79.11%79.53%79.85%80.09%80.29%80.46%80.60%
5. End-of-life−0.99%−0.96%−0.95%−0.95%−0.94%−0.94%−0.94%−0.94%−0.94%−0.94%−0.94%
Total (kWh/m3)650.0610.7598.6591.0586.4583.3581.0579.2577.8576.6575.6
Energy Class C
1. Plant production18.84%15.53%14.45%13.75%13.33%13.04%12.83%12.66%12.53%12.41%12.32%
2. On-site assembly0.13%0.13%0.14%0.14%0.14%0.14%0.14%0.14%0.14%0.14%0.14%
3. Transportation0.47%0.39%0.37%0.36%0.35%0.34%0.34%0.33%0.33%0.33%0.33%
4. Use81.28%84.69%85.80%86.51%86.94%87.24%87.46%87.63%87.77%87.88%87.98%
5. End-of-life−0.72%−0.74%−0.75%−0.75%−0.76%−0.76%−0.76%−0.76%−0.76%−0.76%−0.77%
Total (kWh/m3)734.0704.5695.4689.6686.2683.9682.2680.8679.8678.9678.1

3.3. Sensitivity to Design Parameters

Since insulation plays a major role in the production phase, a sensitivity analysis was performed in order to study the dependence on this parameter in the LCA approach. The comparison between the enhanced- and standard-insulation projects is shown in Figure 9 (CF) and Figure 10 (EF). In this case a 10,000 m2 building was modeled under the reference scenario with different two different thermal performances: energy class A (approximate 5 kWh/m3/year) and energy class C (approximate 10 kWh/m3/year), respectively. The enhanced insulation option increases the incidence of insulating material (EPS) in the walls of approximate 75%, and 7 times in the roof. As a consequence, the average increase of the environmental impact associated to the insulation material, is between 100% and 200%, as a function of other input parameters. Even if the enhanced-insulation case produces a higher impact during the plant production phase, because of higher raw material and processing requirements (+19.5% CF and +36.1% EF), the use phase has a lower impact (−22.5% CF and −22.2% EF) with respect to the standard-insulation case, producing a net reduction, during the entire lifecycle both in CF (−15.6%) and in EF (−14.5%). Detailed results for different floor areas are shown in Table 6 (CF) and Table 7 (EF).
Figure 9. CF of a 10,000 m2 building under the reference scenario (green); Results for an energy class C building with standard insulation is also shown (blue).
Energies 08 12333 g009
Figure 10. EF of a 10,000 m2 building under the reference scenario (green); Results for an energy class C building with standard insulation is also shown (blue).
Energies 08 12333 g010
The 10,000 m2 reference building was also used to assess the sensitivity of the model against foundation type. Results are shown in Table 8. Shorter foundations (i.e., without pillars) produce smaller impacts from plant production (−6.05% CF, −3.77% EF), on-site assembly (−1.11% CF, −1.14% EF), and transportation (−6.86% CF, −6.86% EF) phases. The resulting in a total CF is 1.48% smaller than the reference building, energy footprint is 0.83% smaller.
Table 8. Carbon and energy footprint for a reference building (10,000 m2) in case of foundations without pillars. The variation is shown with respect to the reference scenario (with pillars).
LCA phaseCFEF
(kgCO2eq/m3)(Variation)(kWh/m3)(Variation)
1. Plant production29.26−6.05%119.9−3.77%
2. On-site assembly0.2277−1.11%0.9327−1.14%
3. Transportation0.5253−6.86%2.366−6.86%
4. Use100.10.00%463.90.00%
5. End-of-life−1.6740.00%−5.5400.00%
Total128.5−1.48%581.5−0.83%
The model was finally tested against lifetime and insulation levels in a multidimensional analysis. Results are shown for 50-year (Figure 11) and 20-year lifetime (Figure 12) and for energy classes A (approximate 5 kWh/m3/year), B (approximate 7.5 kWh/m3/year), C (approximate 10 kWh/m3/year), and G (approximate 25 kWh/m3/year). Energy classes A and B are both characterized by the same insulation level (enhanced): the different thermal performance simulates different climatic conditions (e.g., latitude of the construction site). Similarly, classes C and G (extreme conditions) have both a standard insulation. The minimum impact is produced with enhanced insulation (Class A), longer lifetimes (50 years), and larger floor areas (25,000 m2): 2.562 kgCO2eq/m3/year (CF) and 11.51 kWh/m3/year (EF). For shorter lifetimes, the environmental performance is less dependent from the use phase and the LCA results show very similar values obtained with energy class C standard insulation and energy Class B enhanced insulation (e.g., 2.898 and 3.088 kgCO2eq/m3/year, respectively). In any other cases (i.e., longer lifetime and/or larger energetic performance gaps) higher insulation levels produce a sensible reduction of both carbon and energy footprints. When considering a maximum thermal performance gap (energy Class G vs. A), longer lifetimes (50 years), and larger floor areas (25,000 m2), an overall reduction of up to 48% is obtained.
If additional energy is needed for the industrial activity, the impacts associated to electric energy and natural gas consumption can be added separately considering the appropriate emission factors. As of 2013, national emission factors are 326.78 gCO2eq/kWh for electric energy taken from the grid and 1953 gCO2eq/Nm3 for combustion of natural gas [38].
Figure 11. CF as a function of floor area and insulation level under reference hypotheses. Results (kgCO2eq/m3/year) are shown for 50-year lifetime (a) and 20-year lifetime (b).
Energies 08 12333 g011
Figure 12. EF as a function of floor area and insulation level under reference hypotheses. Results (kWh/m3/year) are shown for 50-year lifetime (a) and 20-year lifetime (b).
Energies 08 12333 g012

4. Conclusions

A systematic study of the impacts associated to the entire lifecycle of industrial prefabricated buildings is presented. The carbon and energy footprint assessment is divided in two steps. First, a survey of construction, assembly, and dismantling processes was performed using site-specific data from a large Italian construction company. Data from four selected buildings, with floor areas between 1048 m2 and 21,910 m2, were used to model five LCA phases: Plant production, On-site assembly, Transport, Use, and End-of-life. Carbon and Energy footprint of the four selected buildings were computed in a cradle-to-grave approach. Second, a model building, characterized by average properties with respect to the four selected buildings, was elaborated. The impacts of the model buildings were assessed as a function of sensible input parameters: floor area, height, foundation type, insulation level, energy class, distance from production plant, lifetime. In this analysis, only minimum space-heating and lighting were included in the use phase. Additional energy demand for specific industrial activities should be considered separately.
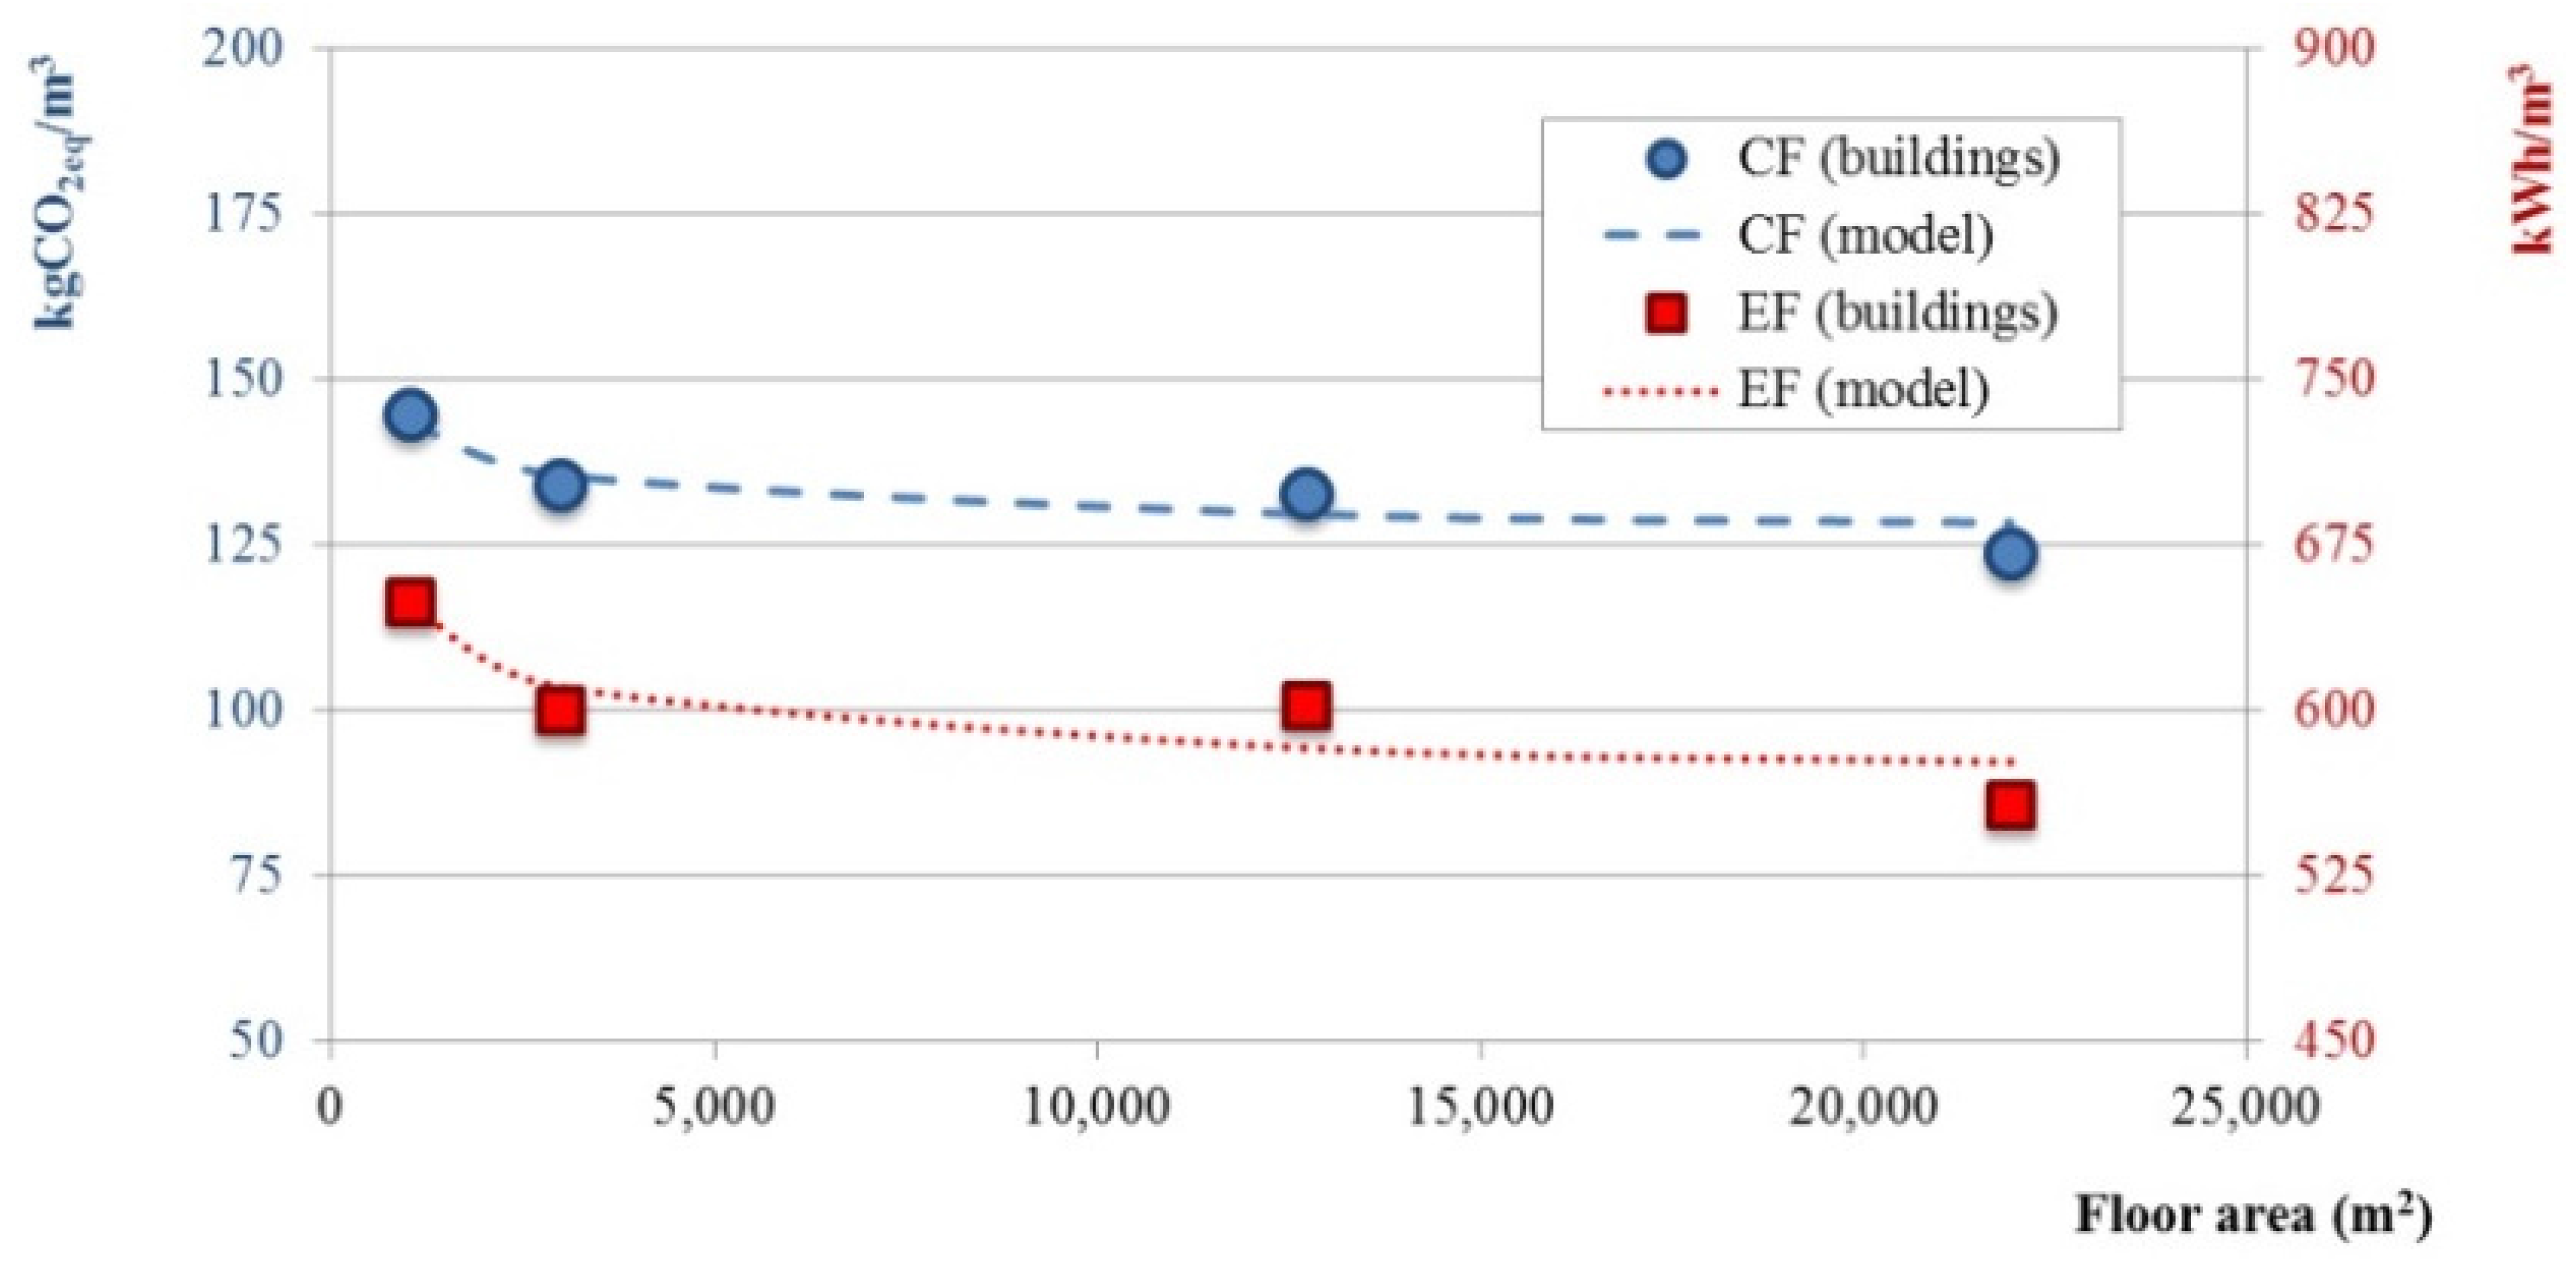
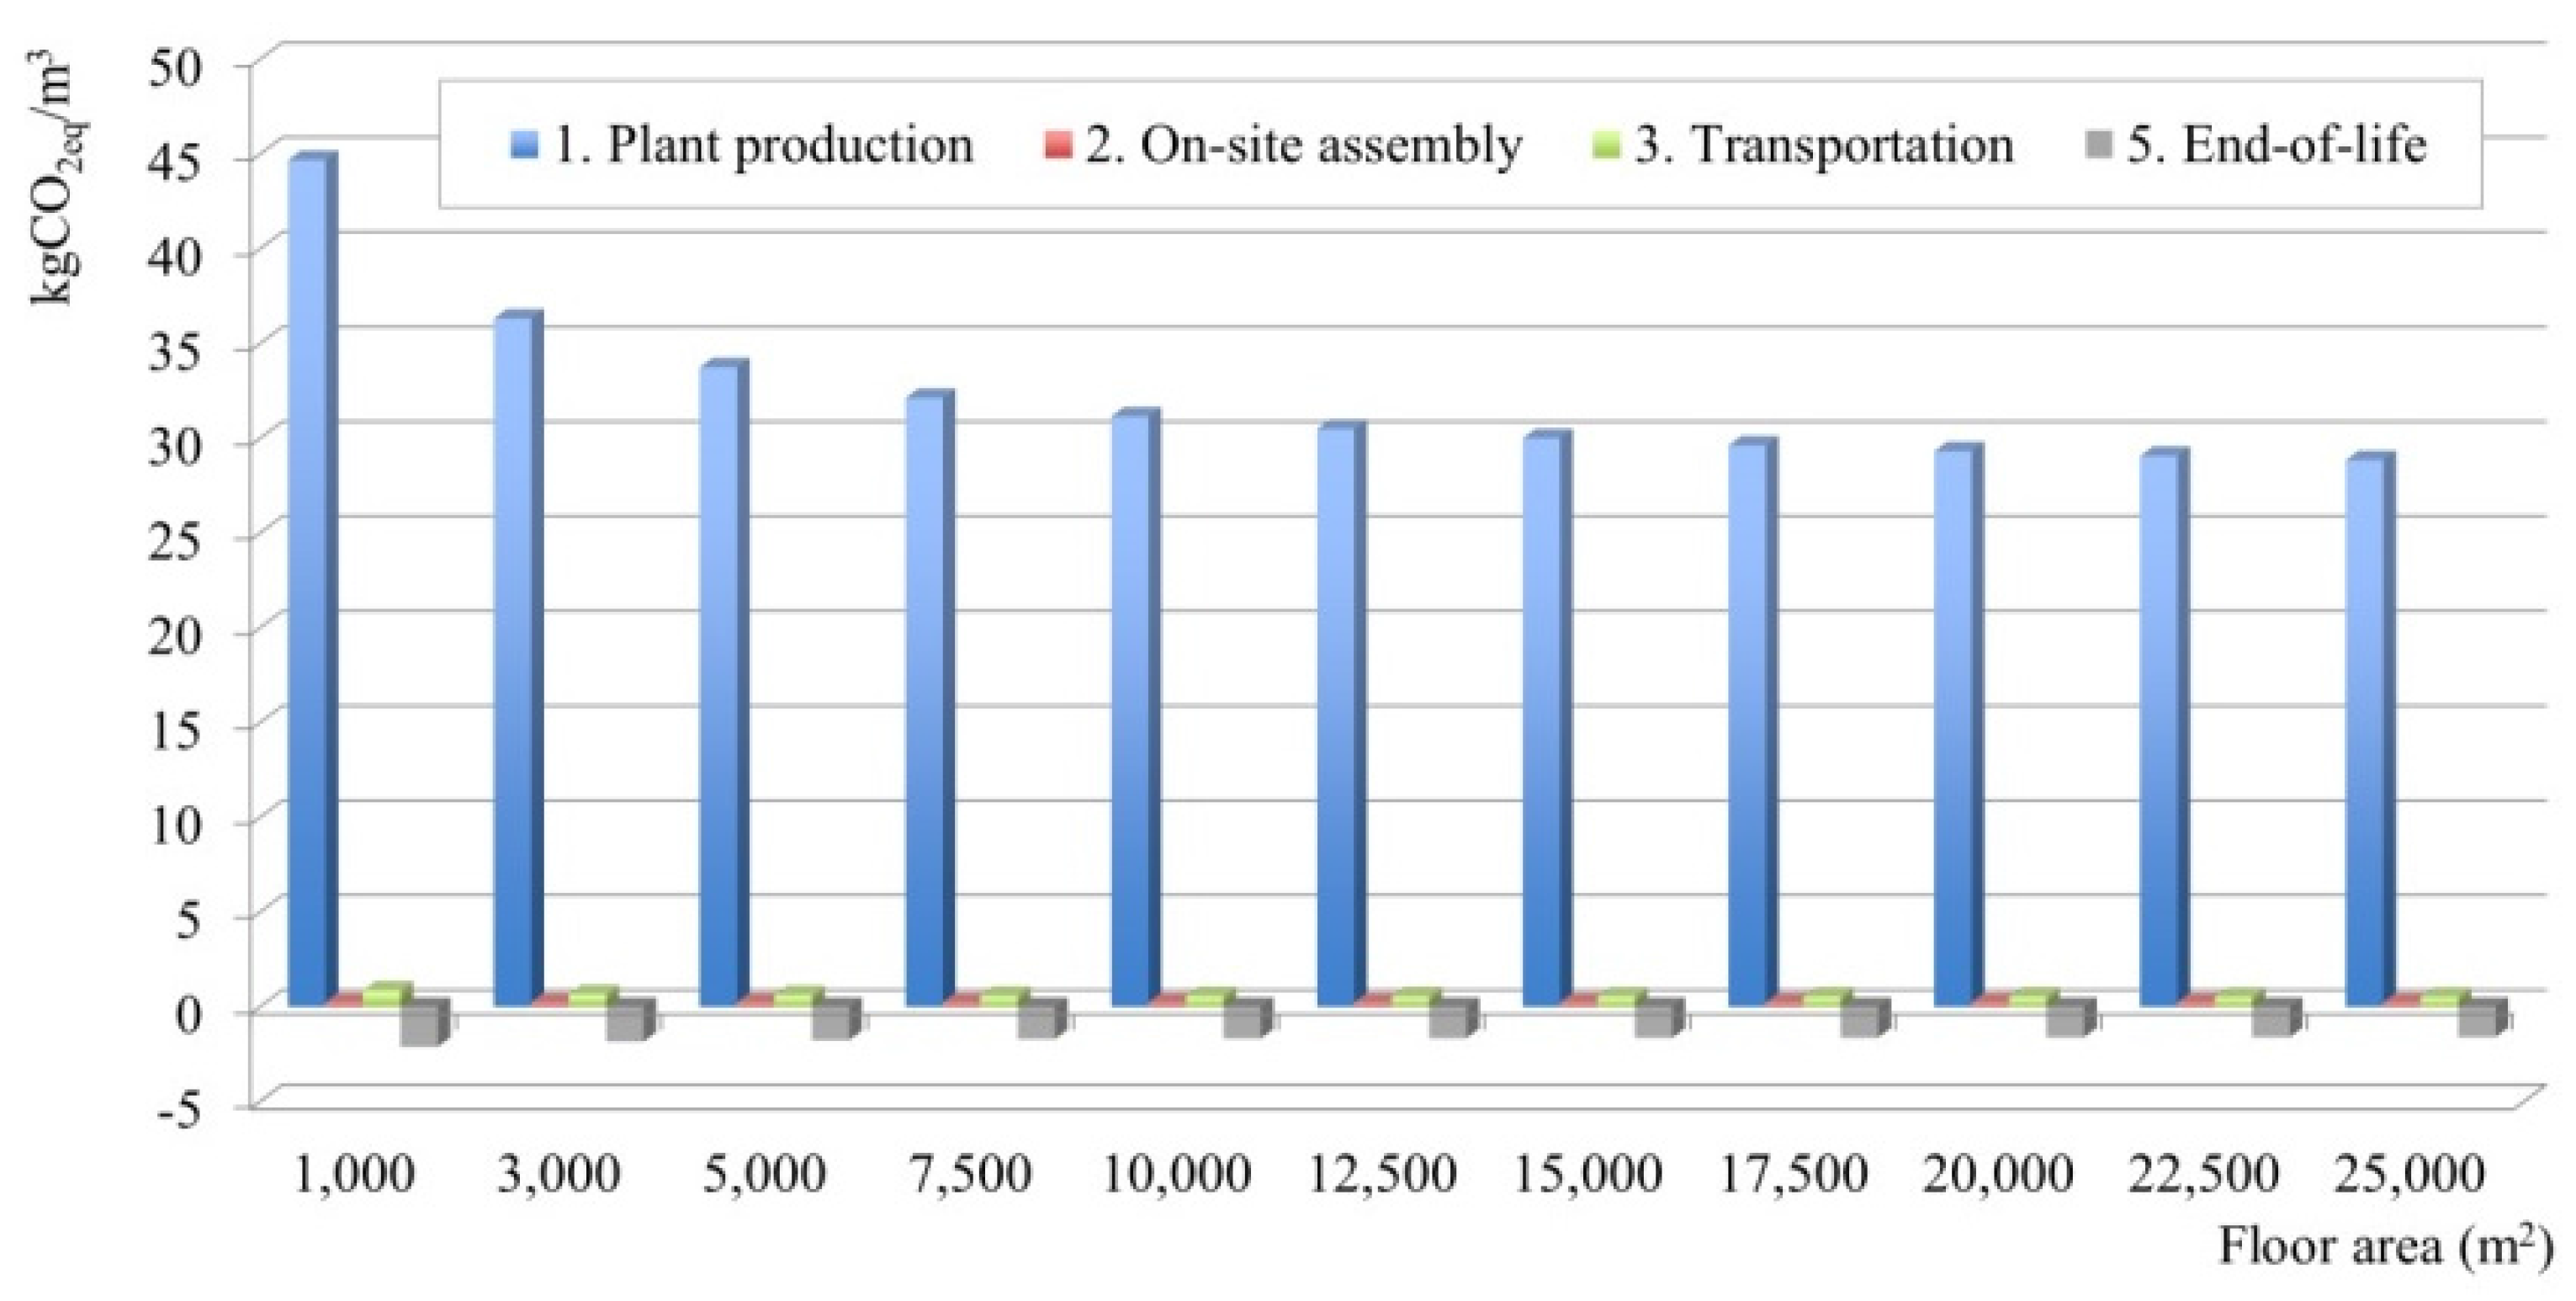
The average carbon footprint of the four selected buildings, considering a reference scenario (50-year lifetime, high energy performance, deep foundations) is 133.7 kgCO2eq/m3 (33.95 kgCO2eq/m
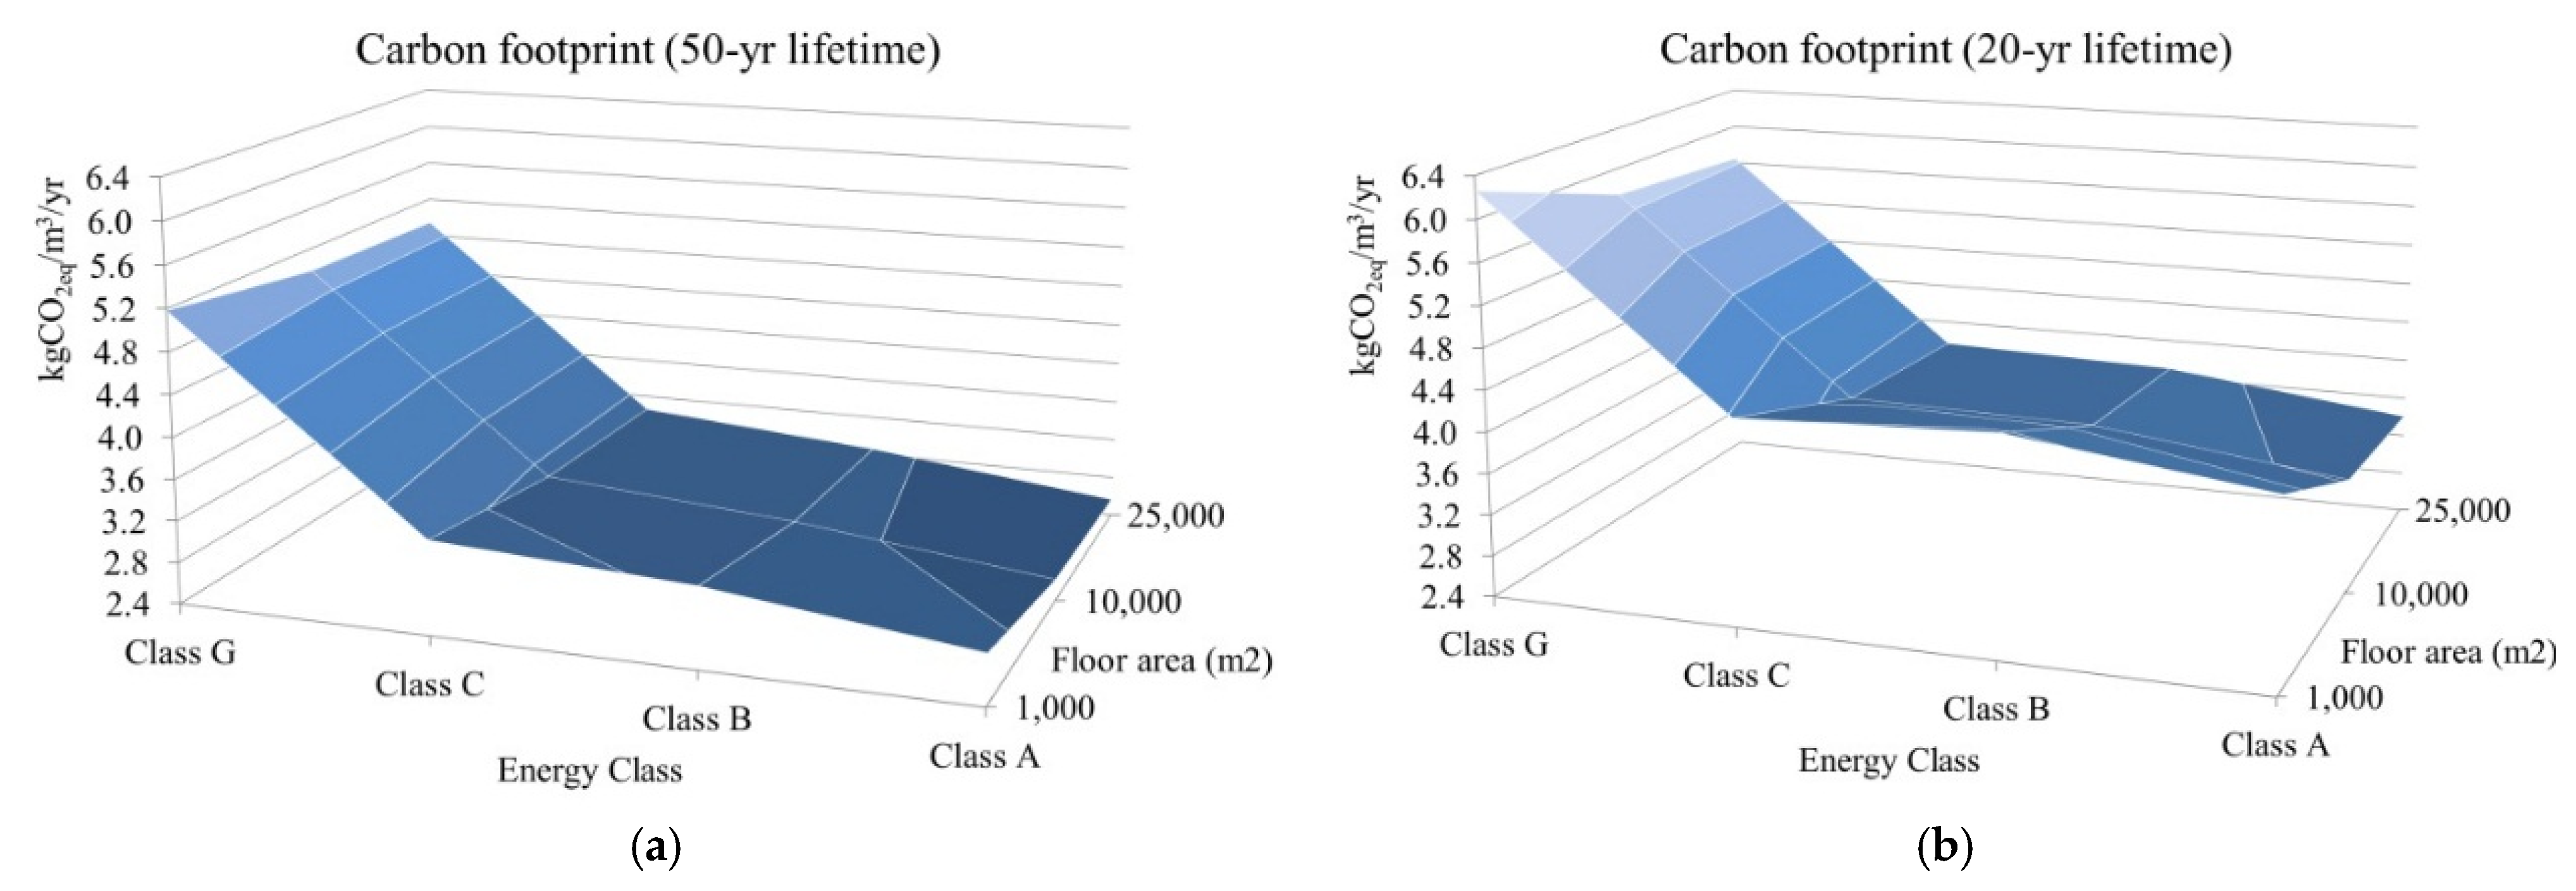
3 not considering the use phase). The CF decreases as the floor area increases (144.7 kgCO2eq/m3 for 1048 m2, 123.6 kgCO2eq/m3 for 21,910 m
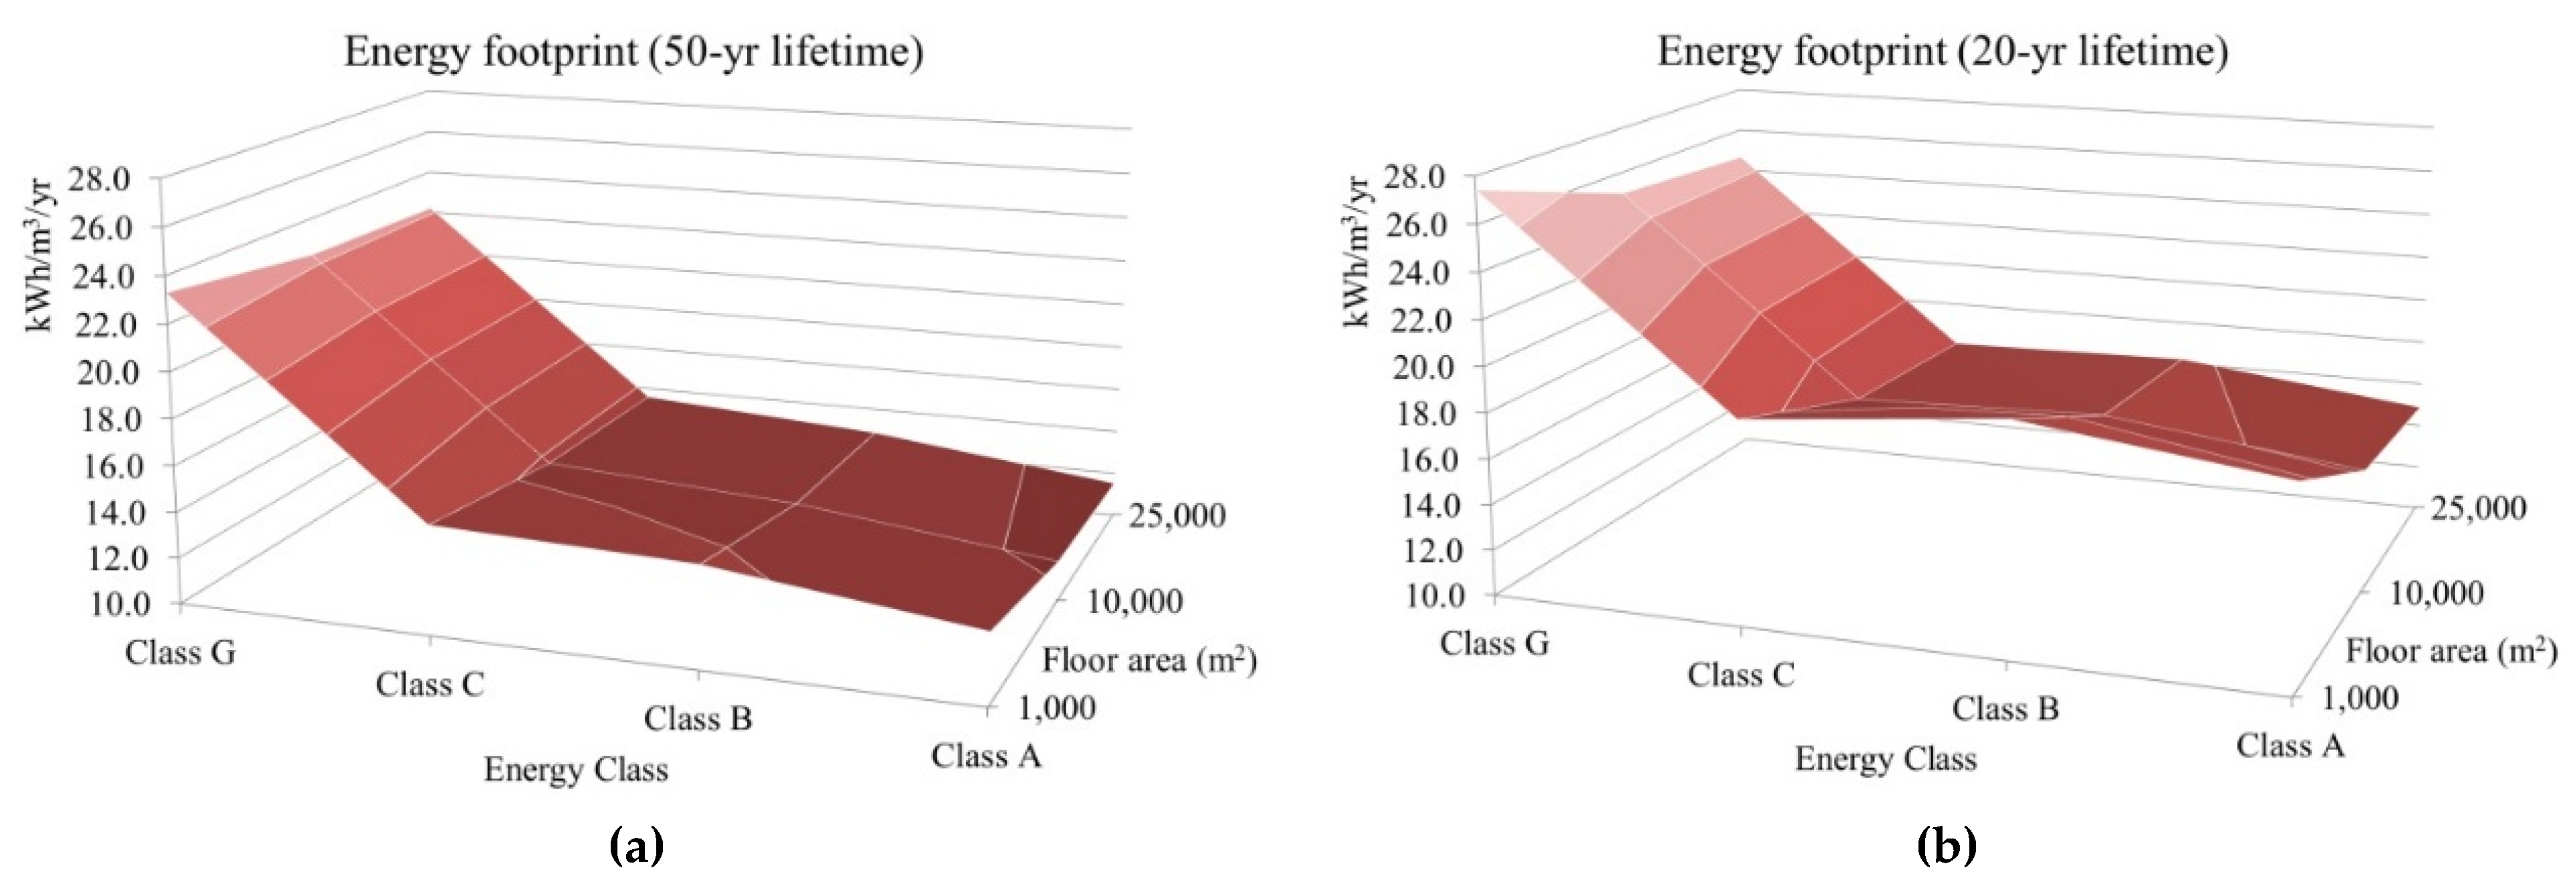
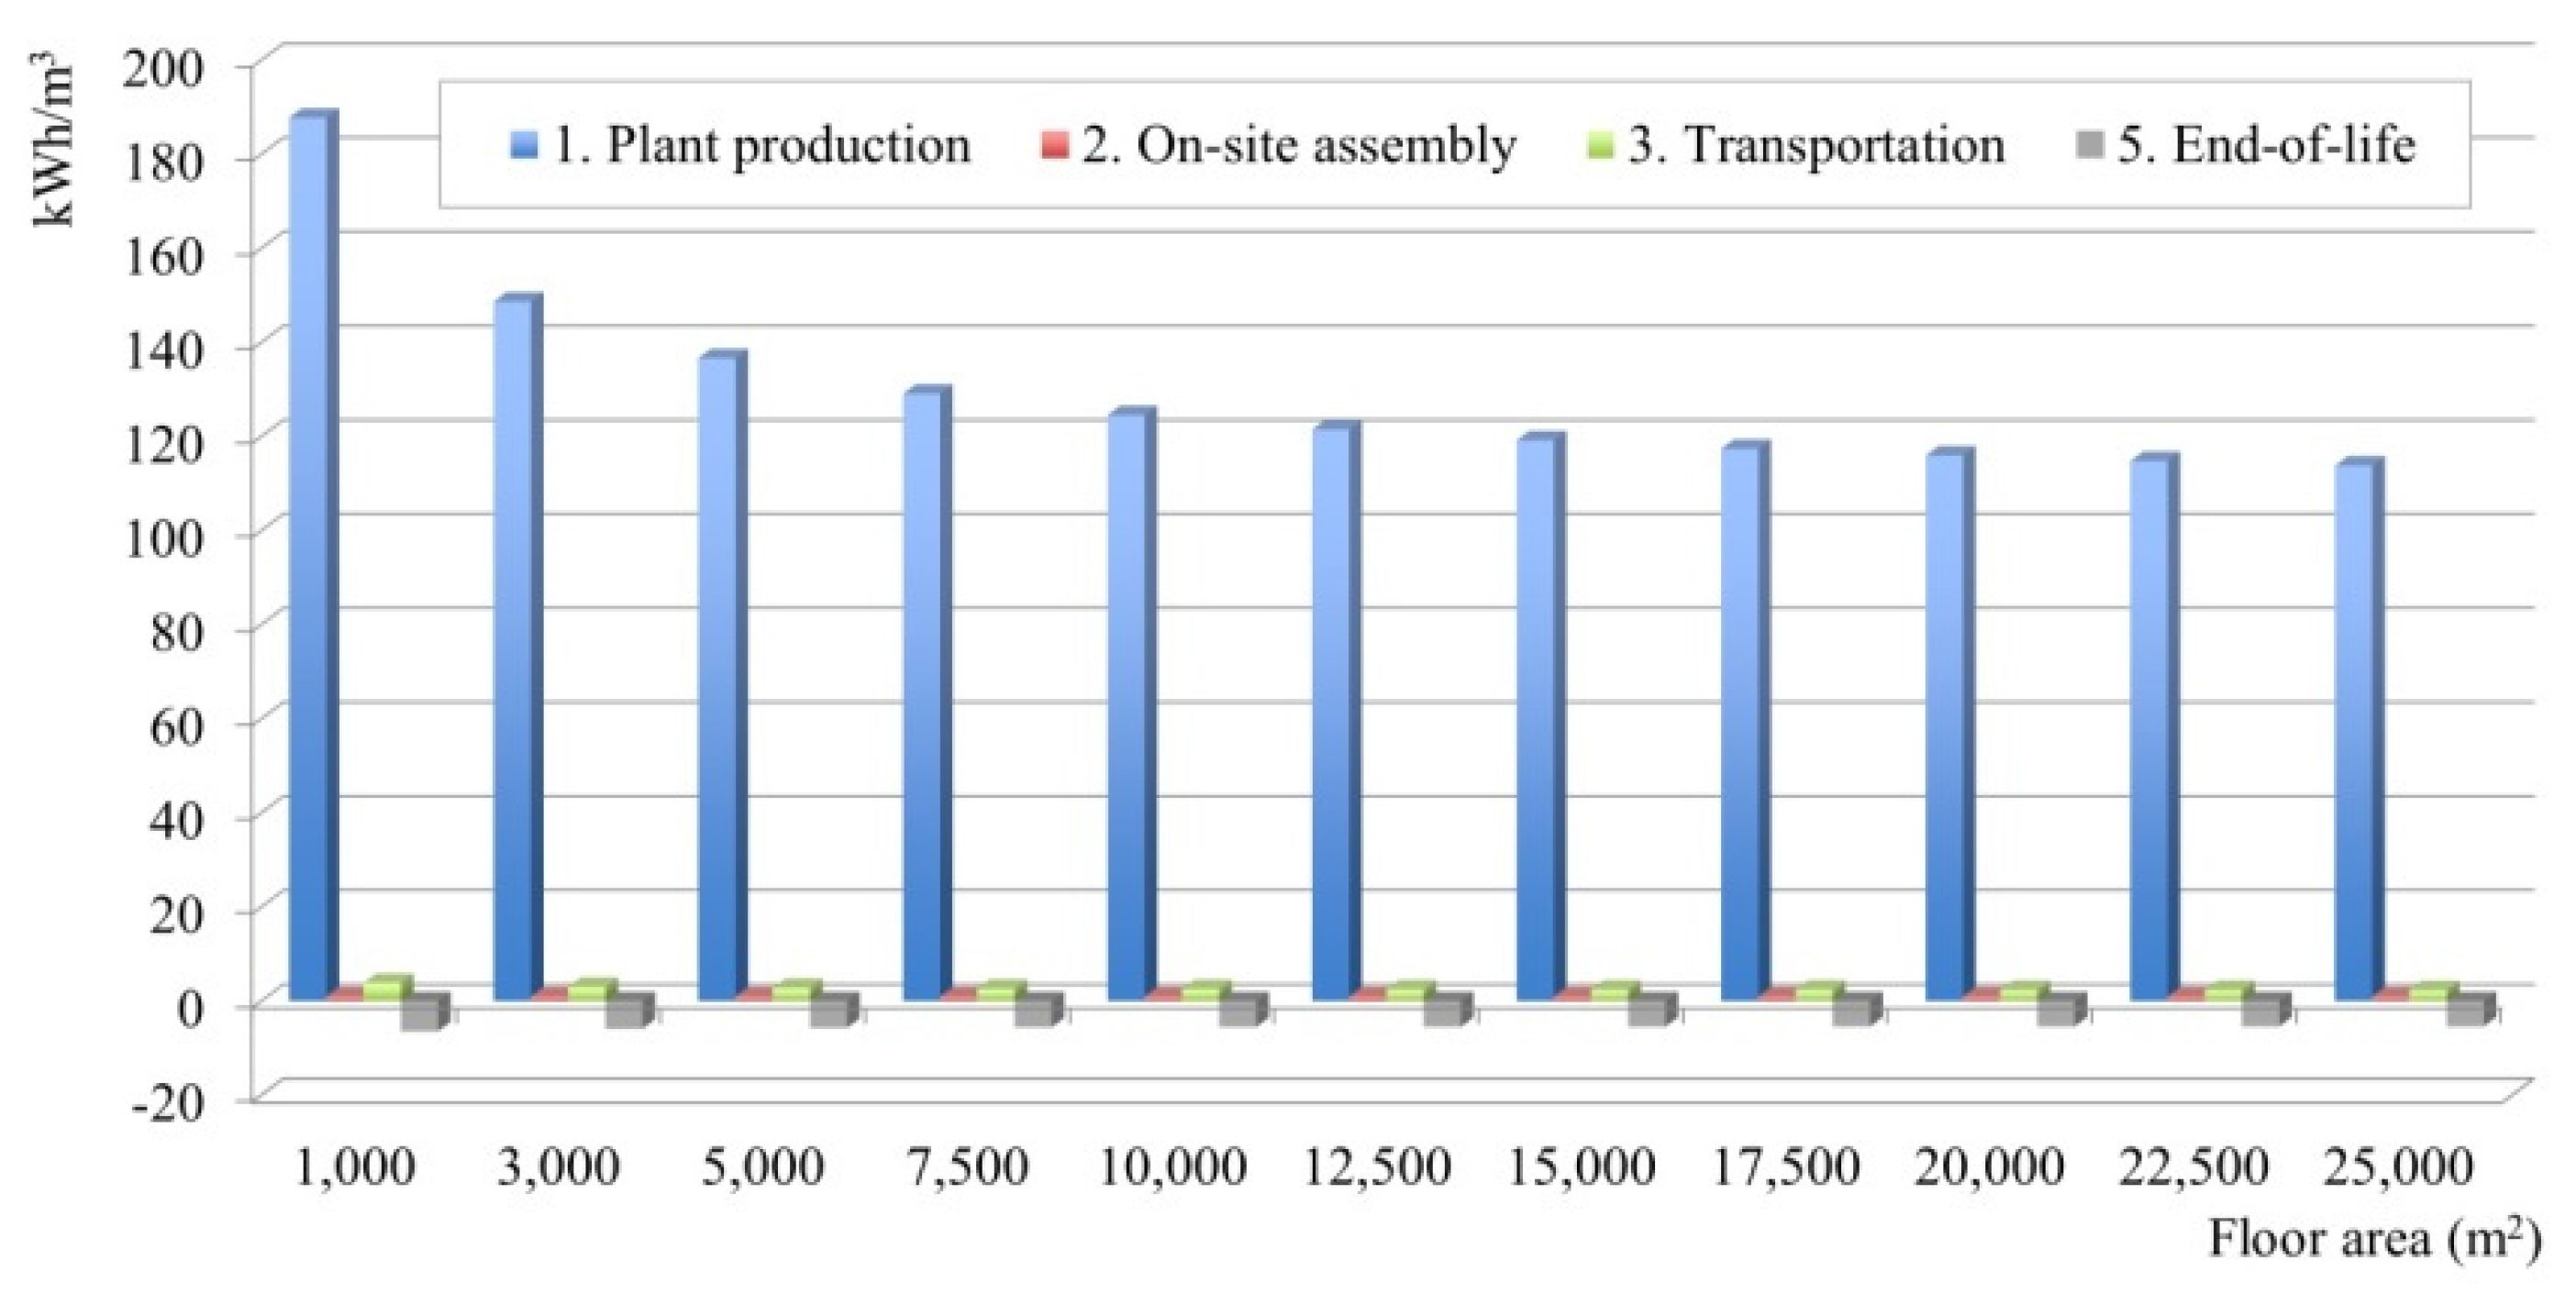
2). The energy footprint is 602.1 kWh/m3 (138.2 kWh/m3 without the use phase), and it shows the same behavior (649.5 to 556.8 kWh/m
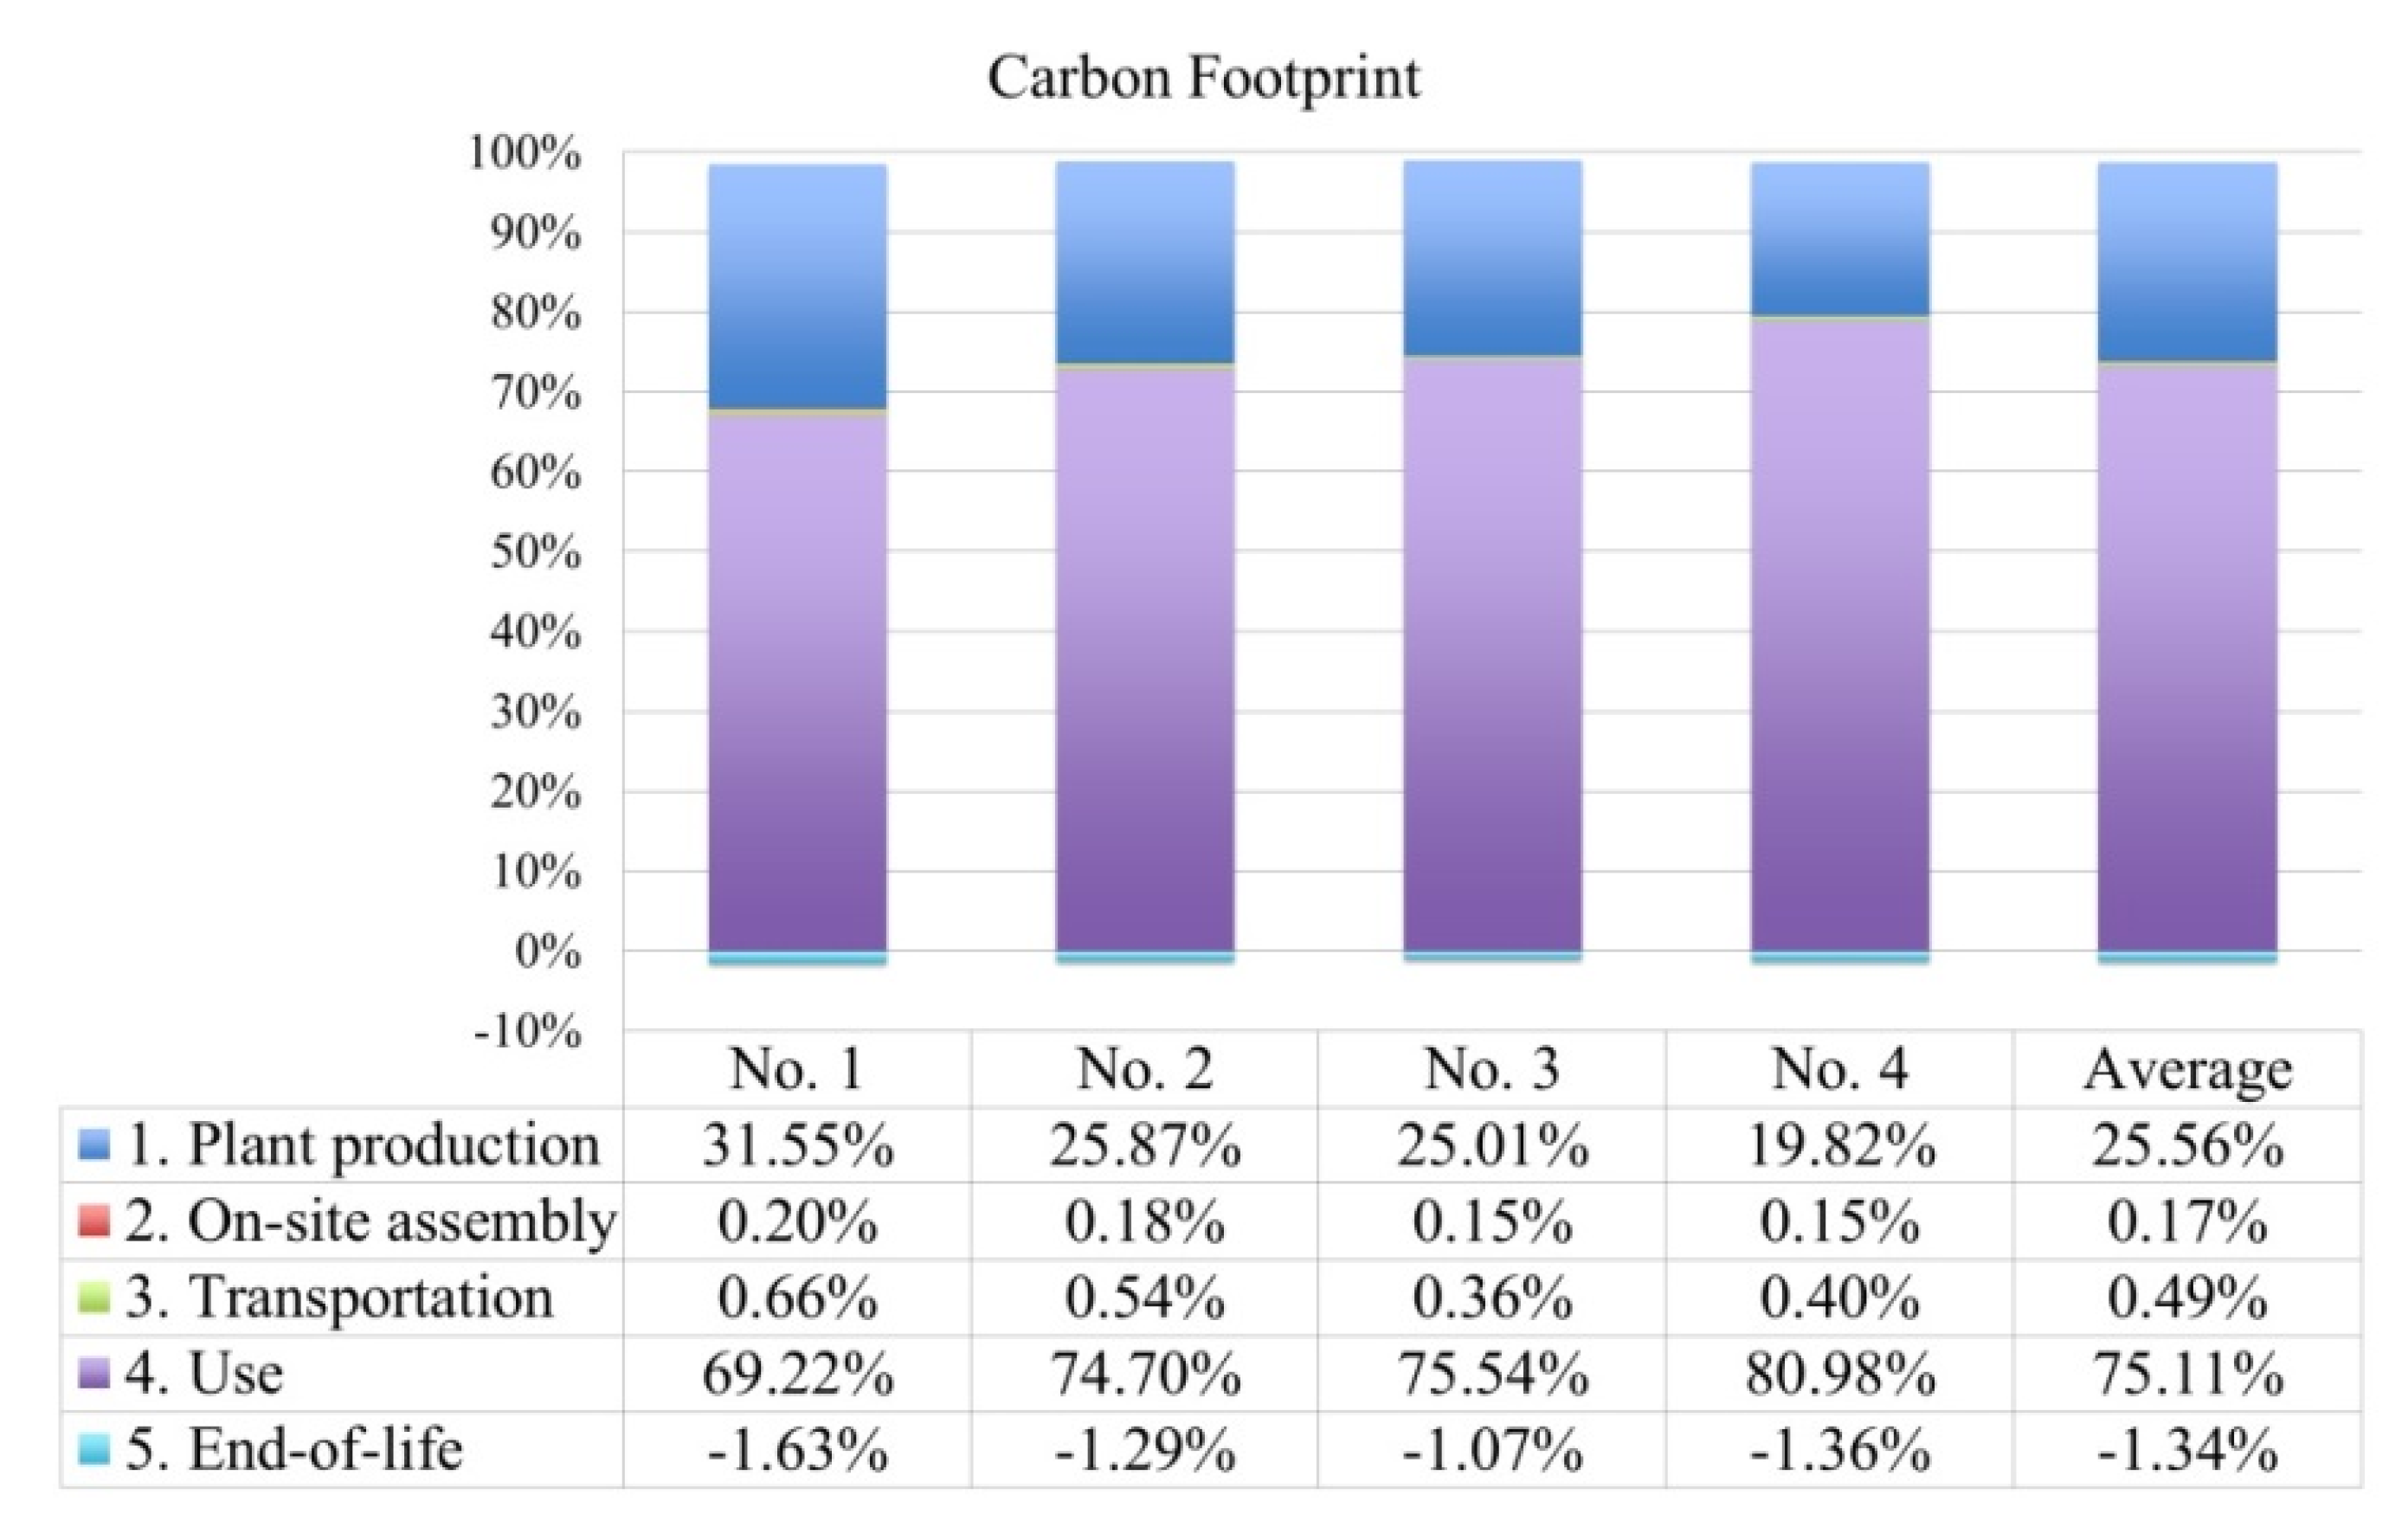
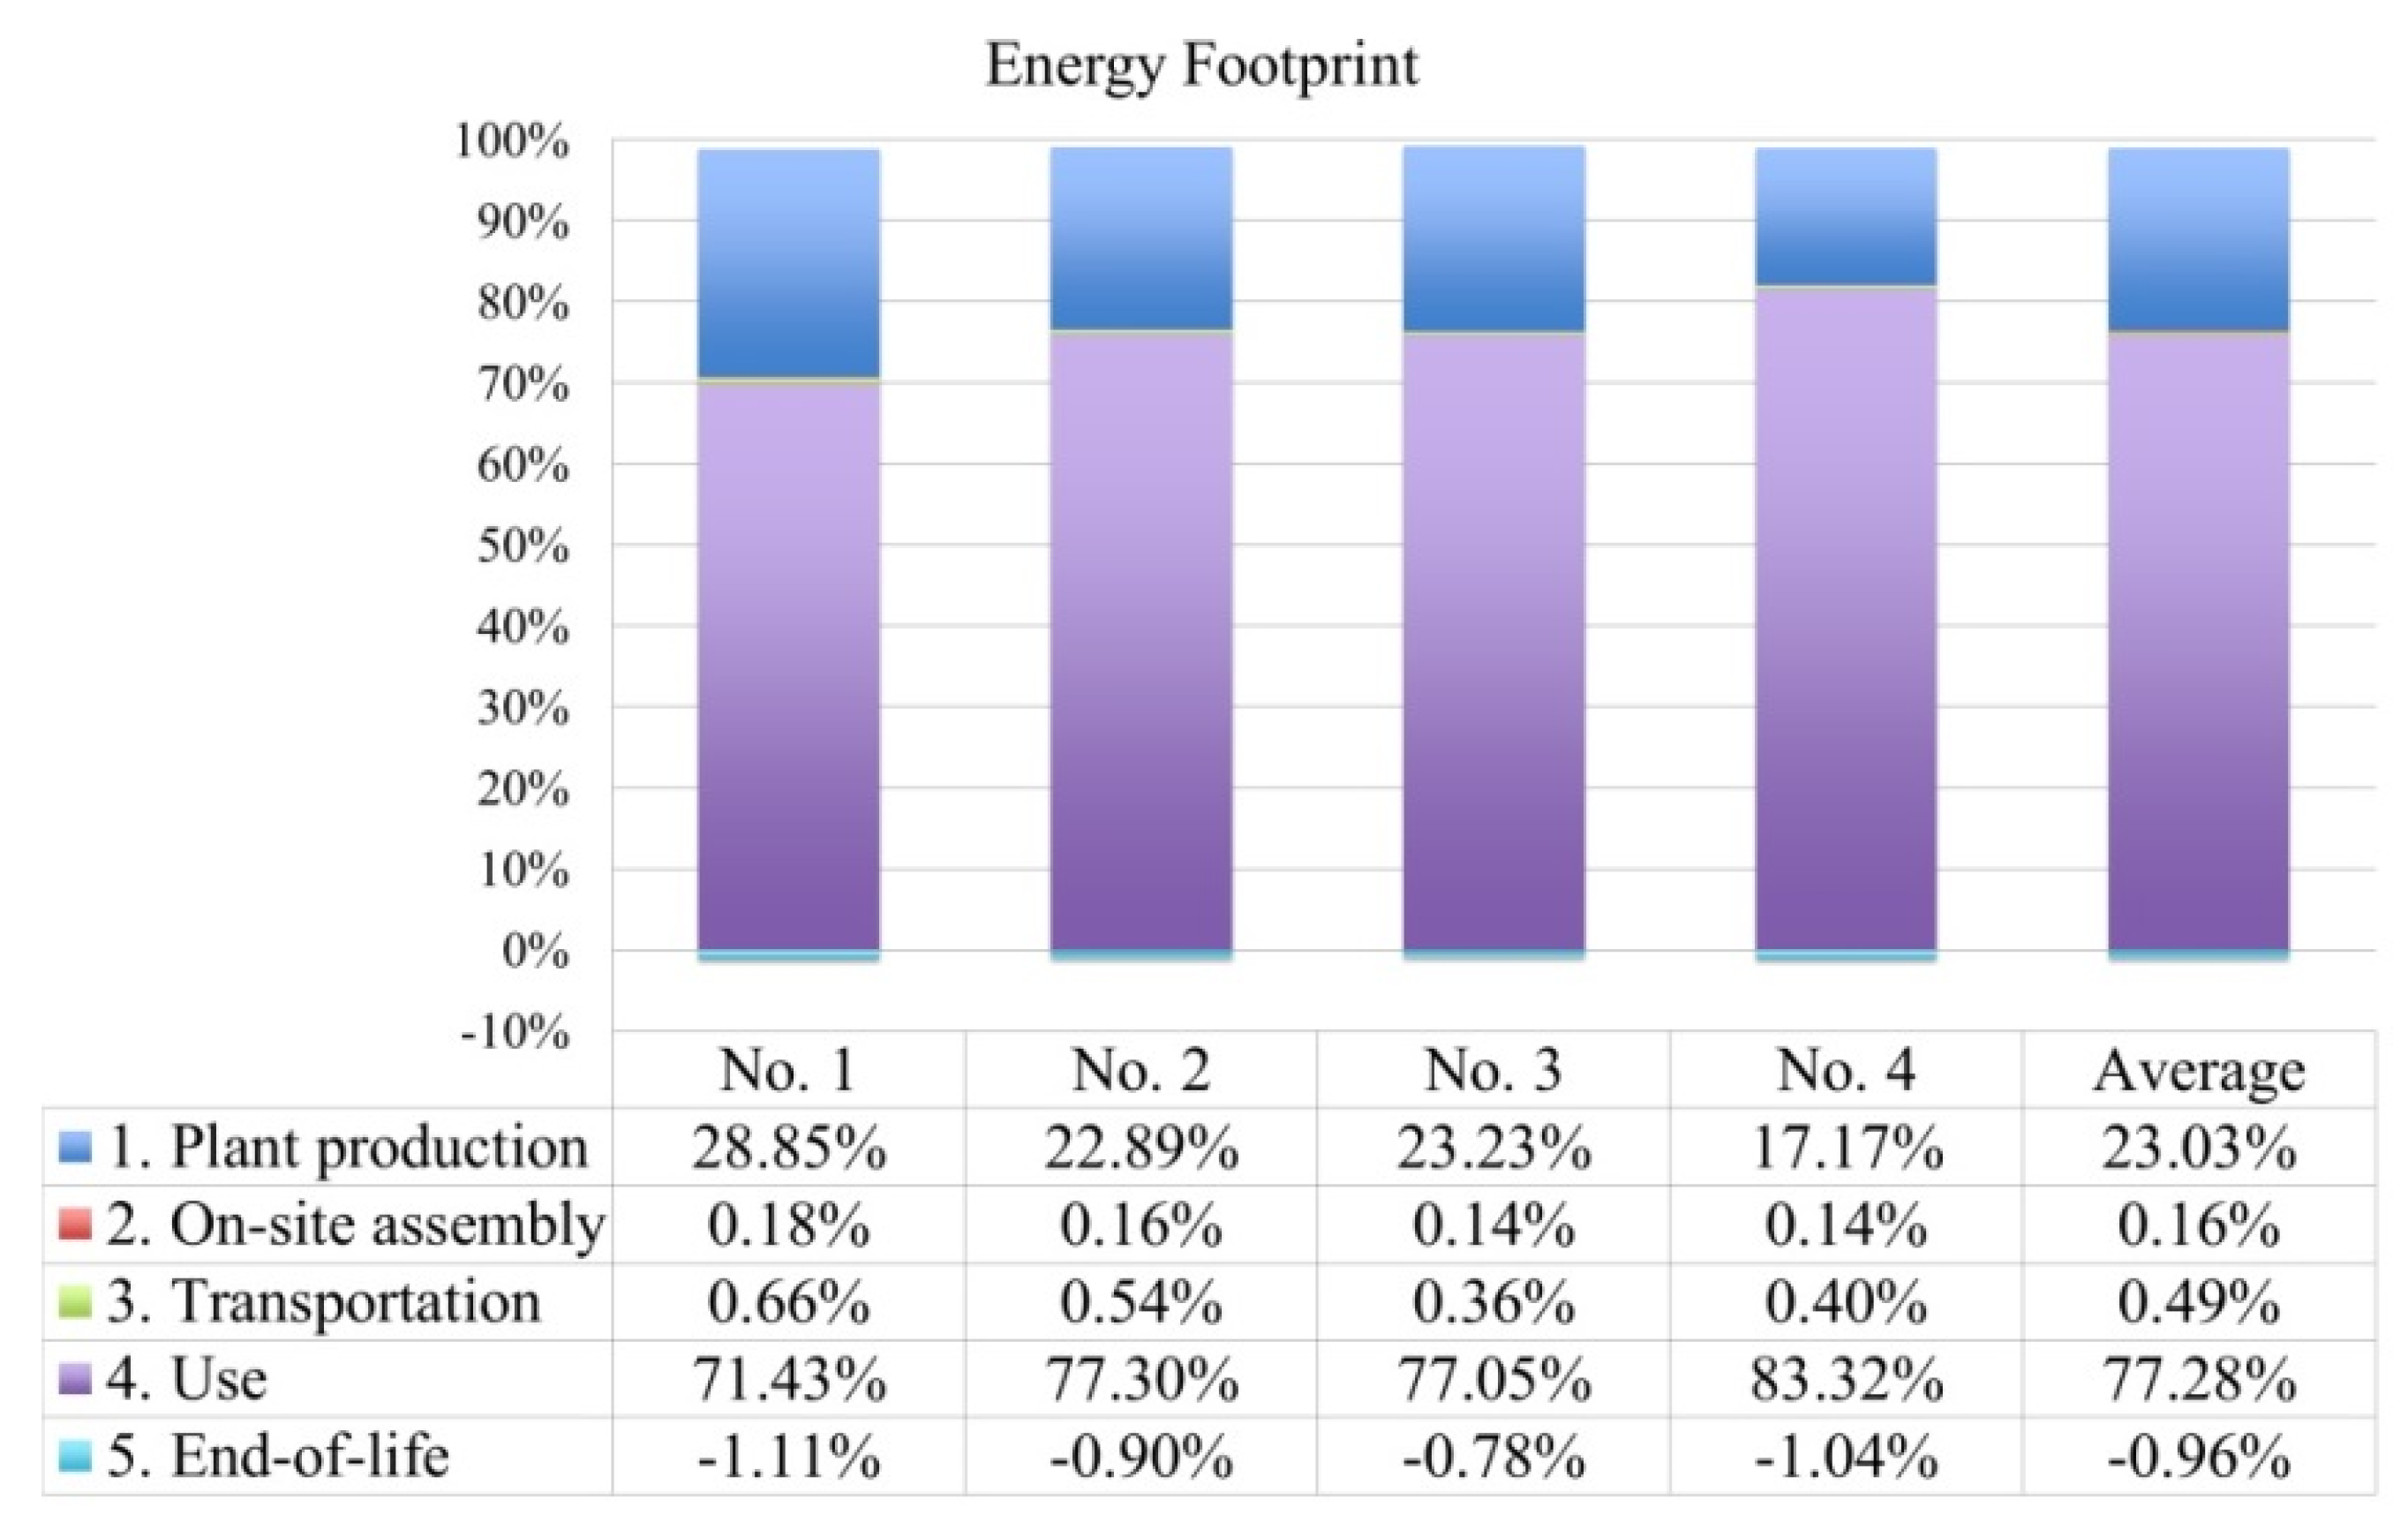
3). The use phase represents 75.11% of the total CF (77.28% of EF), in agreement with literature results [11,24]; the plant production phase represents 25.56% of the total CF (23.03% of EF).
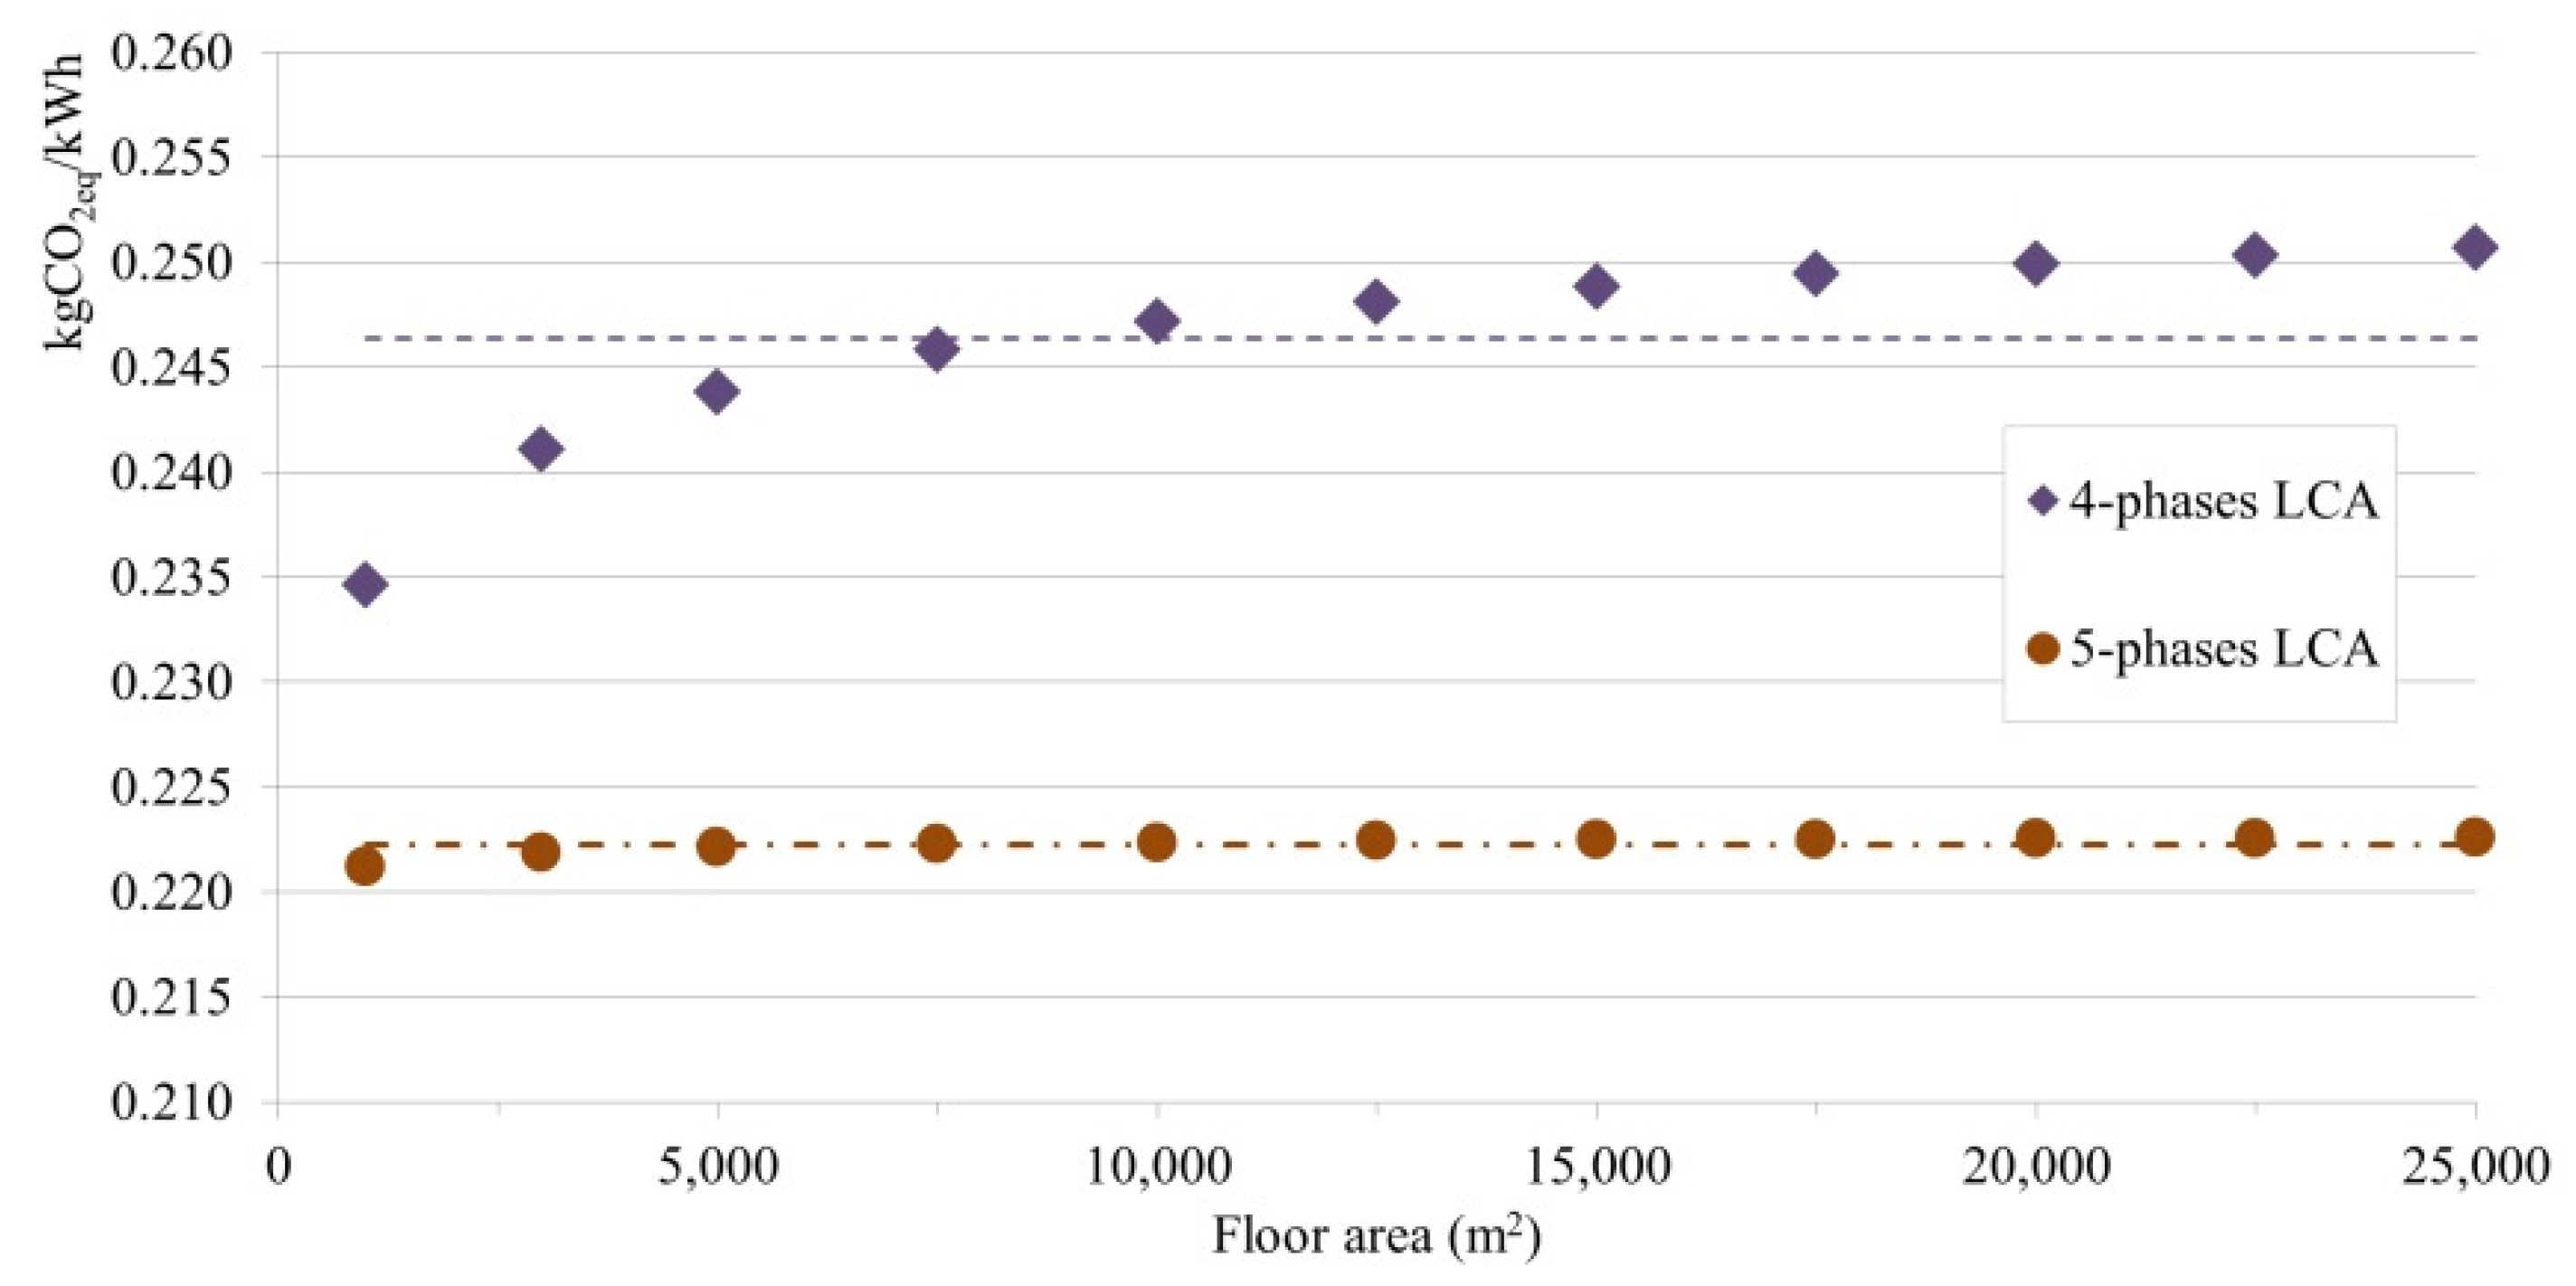
The analysis of modeled buildings show similar behavior for both CF and EF. In particular, it is found that the total carbon footprint is directly proportional to the total energy footprint: 0.222 kgCO2eq/kWh with a 0.5% accuracy. When not including the use phase, the ratio is 0.246 kgCO2eq/kWh with a 5% accuracy.
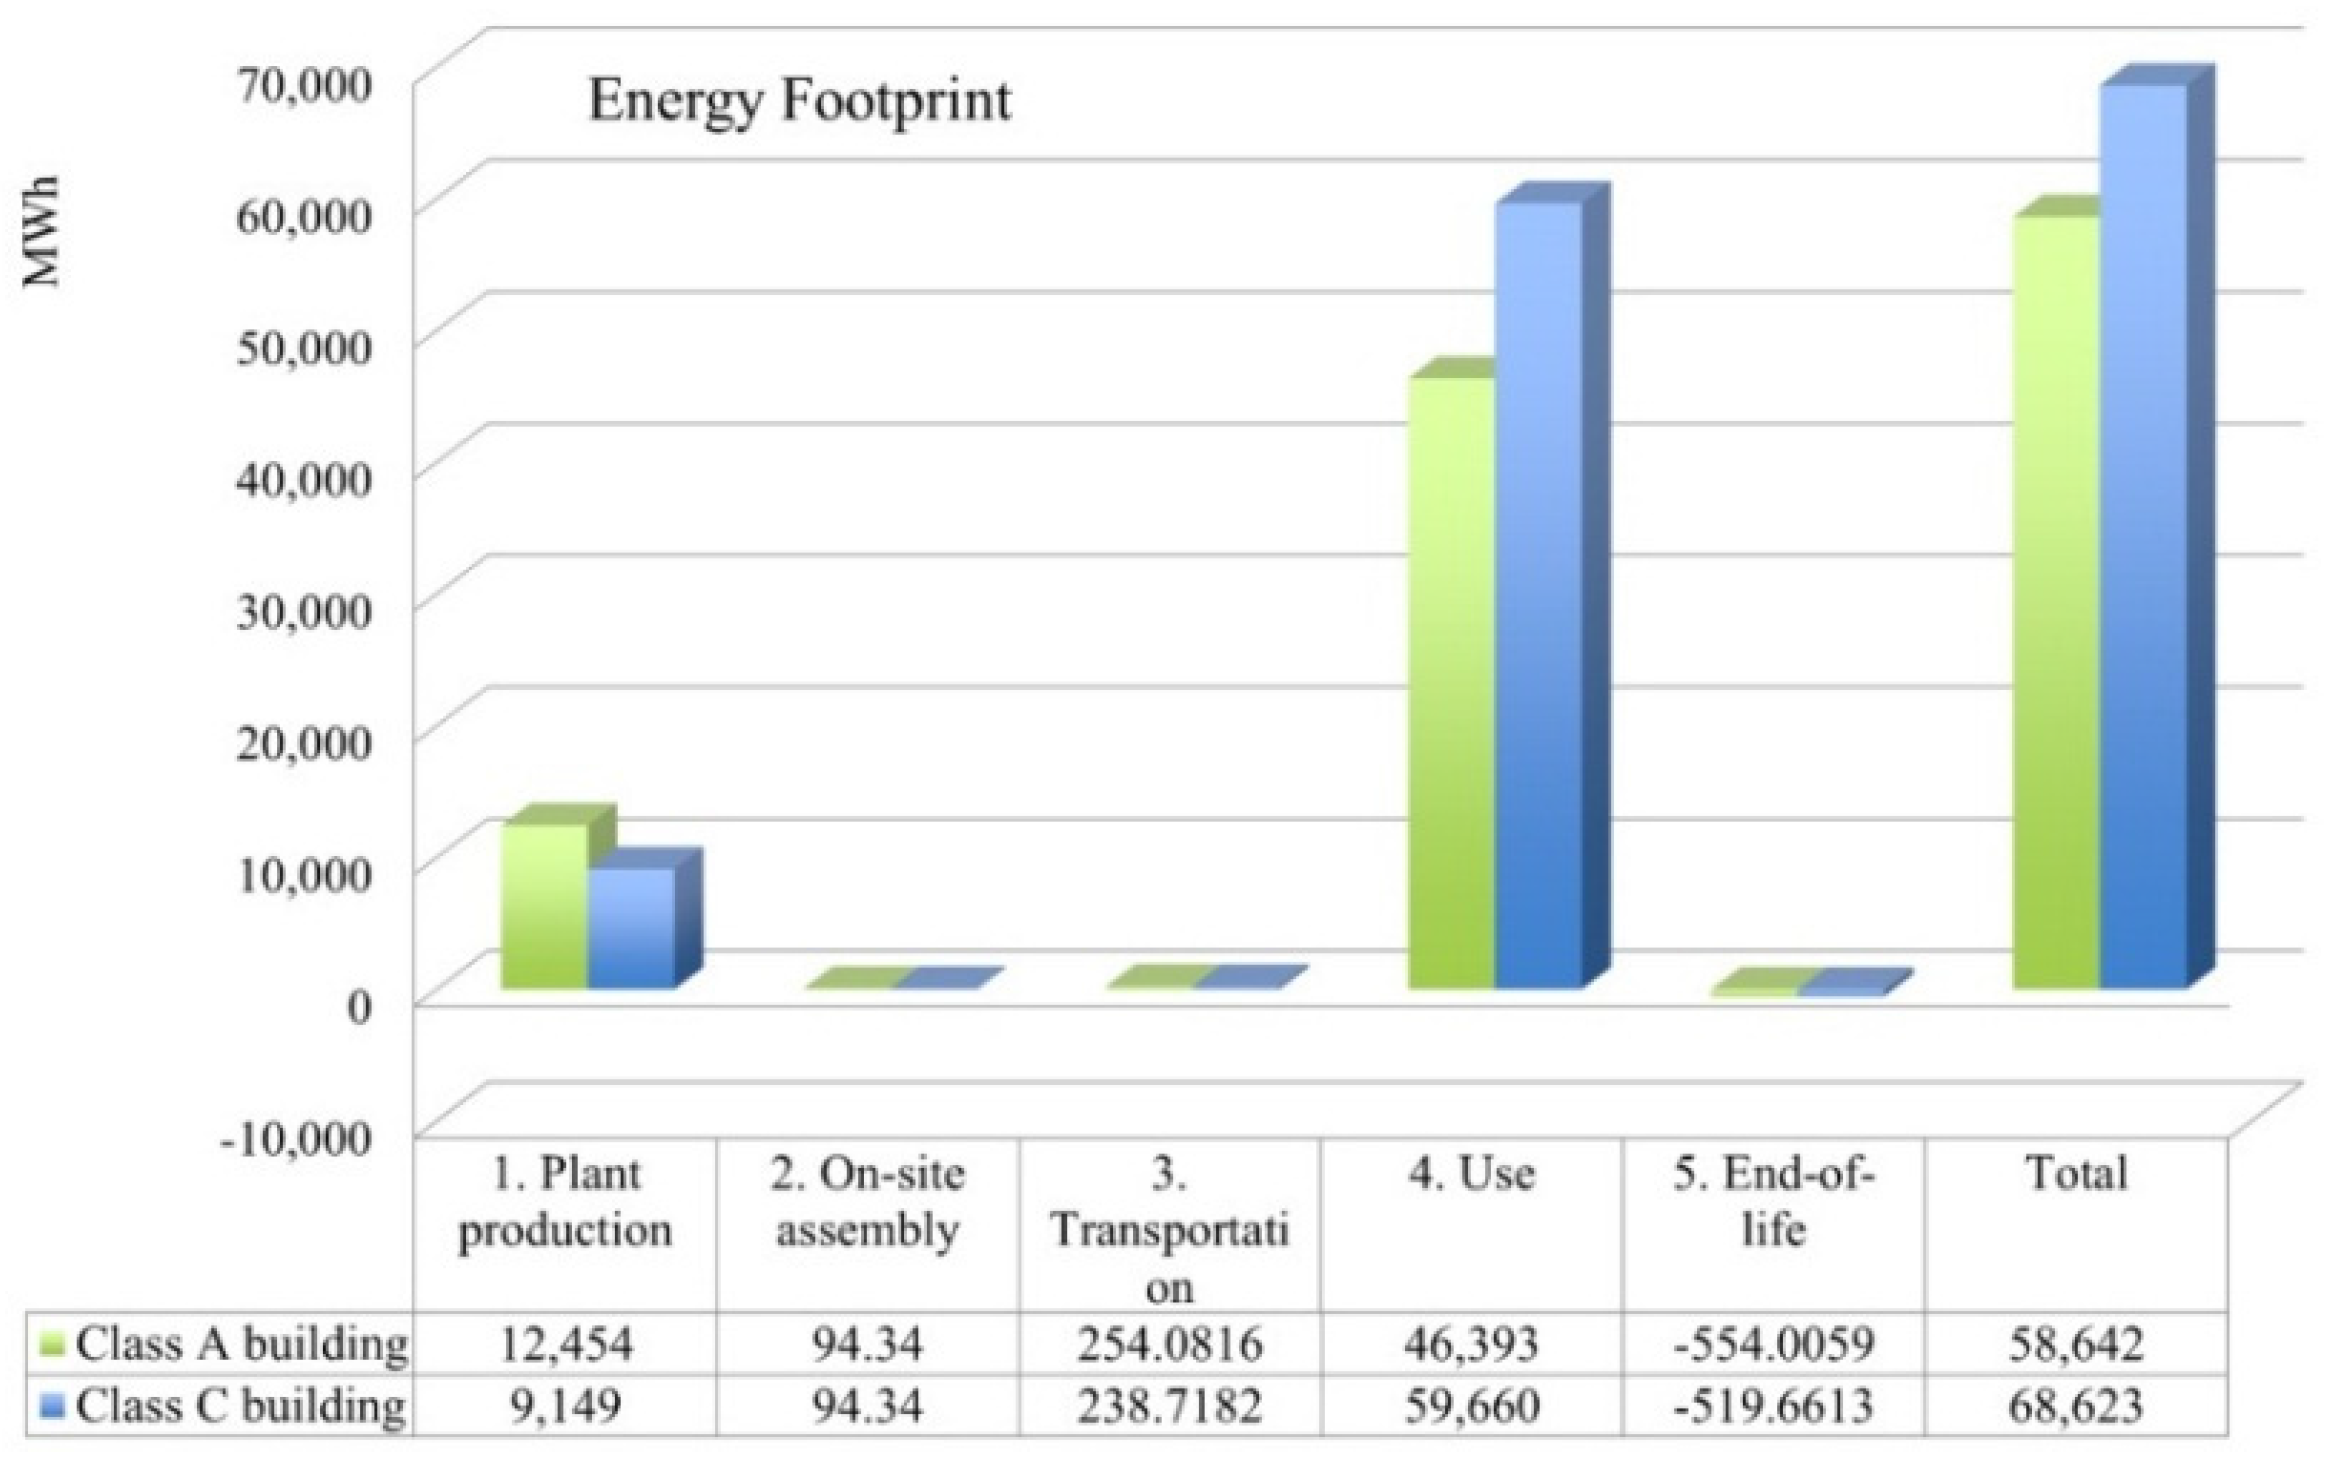
A detailed analysis of the sensibility to input parameters was performed. In particular, it is found that buildings designed to have better thermal performance have a lower overall impact: highly-insulated buildings are characterized by higher impacts from the production phase (+19.5% CF and +36.1% EF). However, the smaller impact from the use phase (−22.5% CF and −22.2% EF) produce an overall reduction of both CF (−15.6%) and EF (−14.5%). Foundation type (with- or without pillars) changes the total CF and EF of 1.48% and 0.83%, respectively. The carbon and energy footprints are more sensitive to the building lifetime. For a 10,000 m2 building, assuming 50- and 20-year lifetimes, the carbon footprint is 2.608 kgCO2eq/m3/year and 3.516 kgCO2eq/m3/year, respectively. The energy footprint is 11.73 kWh/m3/year and 15.40 kWh/m3/year.

Acknowledgments

The authors would like to thank Manini Prefabbricati S.p.A. for supporting this work.

Author Contributions

Emanuele Bonamente collected data for life cycle inventory, set up the modeling procedure, and evaluated LCA impacts. Franco Cotana supervised the research project.

Conflicts of Interest

The authors declare no conflict of interest.

References

  1. Stocker, T.F.; Qin, D.; Plattner, G.-K.; Tignor, M.; Allen, S.K.; Boschung, J.; Nauels, A.; Xia, Y.; Bex, V.; Midgley, P.M. Climate Change 2013: The Physical Science Basis. Contribution of Working Group I to the Fifth Assessment Report of the Intergovernmental Panel on Climate Change; Cambridge University Press: Cambridge, UK; New York, NY, USA, 2013. [Google Scholar]
  2. WWAP (United Nations World Water Assessment Programme). The United Nations World Water Development Report 2015; United Nations Educational, Scientific and Cultural Organization, Water for a Sustainable World: Paris, France, 2015. [Google Scholar]
  3. Rubio-Bellido, C.; Pulido-Arcas, J.A.; Cabeza-Lainez, J.M. Adaptation Strategies and Resilience to Climate Change of Historic Dwellings. Sustainability 2015, 7, 3695–3713. [Google Scholar] [CrossRef]
  4. Salata, F.; Golasi, I.; de Lieto Vollaro, A.; de Lieto Vollaro, R. How high albedo and traditional buildings’ materials and vegetation affect the quality of urban microclimate. A case study. Energy Build. 2015, 99, 32–49. [Google Scholar] [CrossRef]
  5. Cotana, F.; Rossi, F.; Filipponi, M.; Coccia, V.; Piselloa, A.L.; Bonamentea, E.; Petrozzib, A.; Cavalaglioa, G. Albedo control as an effective strategy to tackle Global Warming: A case study. Appl. Energy 2014, 130, 641–647. [Google Scholar] [CrossRef]
  6. Consultation on Sustainable Buildings; European Commission, DG Environment: Brussels, Belgium, 2013.
  7. Roadmap to a Resource Efficient Europe; The European Commission: Brussels, Belgium, 2011.
  8. Worldwatch Institute. Vital Signs; W.W. Norton & Company: New York, NY, USA, 2005. [Google Scholar]
  9. Finnveden, G.; Hauschild, M.Z.; Ekvall, T.; Guinée, J.; Heijungs, R.; Hellweg, S.; Koehler, A.; Pennington, D.; Suh, S. Recent developments in life cycle assessment. J. Environ. Manag. 2009, 91, 1–21. [Google Scholar] [CrossRef] [PubMed]
  10. De Lieto, R.; Cavalesi, M.; Battista, G.; Evangelisti, L.; Botta, F. Calculation model for optimization design of low impact energy systems for buildings. Energy Procedia 2014, 48, 1459–1467. [Google Scholar] [CrossRef]
  11. Airaksinen, M.; Matilainen, P. A Carbon Footprint of an Office Building. Energies 2011, 4, 1197–1210. [Google Scholar] [CrossRef]
  12. Lombera, J.-T.S.-J.; Aprea, I.G. A system approach to the environmental analysis of industrial buildings. Build. Environ. 2010, 45, 673–683. [Google Scholar] [CrossRef]
  13. Bonamente, E.; Merico, M.C.; Rinaldi, S.; Pignatta, G.; Pisello, A.L.; Cotana, F.; Nicolini, A. Environmental Impact of Industrial Prefabricated Buildings: Carbon and Energy Footprint Analysis Based on an LCA Approach. Energy Procedia 2014, 61, 2841–2844. [Google Scholar] [CrossRef]
  14. San-Jose, J.T.; Garrucho, I.; Cuadrado, J. First sustainable projects of industrial buildings. Proc. Inst. Civ. Eng. Munic. Eng. 2006, 159, 147–153. [Google Scholar]
  15. Bonamente, E.; Scrucca, F.; Asdrubali, F.; Cotana, F.; Presciutti, A. The Water Footprint of the Wine Industry: Implementation of an Assessment Methodology and Application to a Case Study. Sustainability 2015, 7, 12190–12208. [Google Scholar] [CrossRef]
  16. Sarja, A. Integrated Life Cycle Design of Structures; Spon Press: London, UK, 2002. [Google Scholar]
  17. Neugebauer, S.; Traverso, M.; Scheumann, R. Impact Pathways to Address Social Well-Being and Social Justice in SLCA—Fair Wage and Level of Education. Sustainability 2014, 6, 4839–4857. [Google Scholar] [CrossRef]
  18. Rodrigues, M.A.; Arezes, P.M.; Leão, C.P. Defining risk acceptance criteria in occupational settings: A case study in the furniture industrial sector. Saf. Sci. 2015, 80, 288–295. [Google Scholar] [CrossRef]
  19. Bocken, N.M.P.; Short, S.W.; Rana, P.; Evans, S. A literature and practice review to develop sustainable business model archetypes. J. Clean. Prod. 2014, 65, 42–56. [Google Scholar] [CrossRef]
  20. Zhang, S.; Li, J.; Liu, Y. A study of color design in industry landscape architecture environment. Adv. Mater. Res. 2013, 726–731, 3622–3626. [Google Scholar] [CrossRef]
  21. Canto-Perello, J.; Martinez-Garcia, M.P.; Curiel-Esparza, J.; Martin-Utrillas, M. Implementing Sustainability Criteria for Selecting a Roof Assembly Typology in Medium Span Buildings. Sustainability 2015, 7, 6854–6871. [Google Scholar] [CrossRef]
  22. Kissinger, M.; Sussman, C.; Moore, J.; Rees, W.E. Accounting for the Ecological Footprint of Materials in Consumer Goods at the Urban Scale. Sustainability 2013, 5, 1960–1973. [Google Scholar] [CrossRef]
  23. Castellani, V.; Sala, S. Sustainability Indicators Integrating Consumption Patterns in Strategic Environmental Assessment for Urban Planning. Sustainability 2013, 5, 3426–3446. [Google Scholar] [CrossRef]
  24. Onat, N.C.; Kucukvar, M.; Tatari, O. Scope-based carbon footprint analysis of U.S. residential and commercial buildings: An input–output hybrid life cycle assessment approach. Build. Environ. 2014, 72, 53–62. [Google Scholar] [CrossRef]
  25. Greenhouse Gases—Part 1: Specification with Guidance at the Organization Level for Quantification and Reporting of Greenhouse Gas Emissions and Removals; ISO 14064–1:2006International; Organization for Standardization: Geneva, Switzerland, 2006.
  26. Aye, L.; Ngo, T.; Gammampila, R.; Mendis, P. Life cycle greenhouse gas emissions and energy analysis of prefabricated reusable building modules. Energy Build. 2012, 47, 159–168. [Google Scholar] [CrossRef]
  27. Asdrubali, F.; Baldinelli, G.D.; Alessandro, F.; Scrucca, F. Life Cycle Assessment of electricity production from renewable energies: review and results harmonization. Renew. Sustain. Energy Rev. 2015, 42, 1113–1122. [Google Scholar] [CrossRef]
  28. Kjaer, L.L.; Høst-Madsen, N.K.; Schmidt, J.H.; McAloone, T.C. Application of Environmental Input-Output Analysis for Corporate and Product Environmental Footprints—Learnings from Three Cases. Sustainability 2015, 7, 11438–11461. [Google Scholar] [CrossRef] [Green Version]
  29. Environmental Management—Life Cycle Assessment—Principles and Framework; ISO 14040:2006; International Organization for Standardization: Geneva, Switzerland, 1997.
  30. Environmental Management—Life Cycle Assessment—Requirements and Guidelines; ISO 14044:2006; International Organization for Standardization: Geneva, Switzerland, 2006.
  31. Greenhouse Gases—Carbon Footprint of Products—Requirements and Guidelines for Quantification and Communication; ISO/TS 14067:2013; International Organization for Standardization: Geneva, Switzerland, 2013.
  32. Rossi, F.; Bonamente, E.; Nicolini, A.; Anderini, E.; Cotana, F. A carbon footprint and energy consumption assessment methodology for UHI-affected lighting systems in built areas. Energy Build. 2015. [Google Scholar] [CrossRef]
  33. United Nations Framework Convention on Climate Change. Kyoto Protocol to the United Nations Framework Convention on Climate Change; Kyoto Protocol: Kyoto, Japan, 1997. [Google Scholar]
  34. SimaPro LCA Software. Available online: http://www.pre-sustainability.com/simapro (accessed on 21 August 2015).
  35. Ecoinvent Version 3. Available online: http://www.ecoinvent.org/database/ecoinvent-version-3/ (accessed on 21 August 2015).
  36. Decreto Ministeriale 26 June 2009—Ministero dello Sviluppo Economico Linee guida nazionali per la certificazione energetica degli edifici (G.U. 10 July 2009 n. 158—in vigore dal 25 July 2009); Italian Ministry for the Economic Development: Rome, Italy, 2009. (In Italian)
  37. Decreto Legislativo 29 September 2006, n.311. GU n.26, 1 February 2007—Suppl. ordinario n.26; Italian Ministry for the Economic Development: Rome, Italy, 2006. (In Italian)
  38. Caputo, A.; Sarti, C. Fattori di emissione atmosferica di CO2 e sviluppo delle fonti rinnovabili nel settore elettrico; Rapporti 212/15; Istituto Superiore per la Protezione e la Ricerca Ambientale: Roma, Italy, 2015. (In Italian) [Google Scholar]

