Article

The Influence of Non-Uniform High Heat Flux on Thermal Stress of Thermoelectric Power Generator

1
School of Civil Engineering and Architecture, Wuhan University of Technology, No. 122, Luoshi Road, Wuhan 430070, China
2
School of Energy and Power Engineering, Huazhong University of Science and Technology, No. 1037, Luoyu Road, Wuhan 430074, China
3
School of Foreign Languages, Wuhan University of Engineering Science. N0. 8, Xiongtingbi Road, Jiangxia District, Wuhan 430200, China
4
Department of Mechanical Engineering, Virginia Polytechnic Institute and State University, Blacksburg, VA 24061, USA
*
Authors to whom correspondence should be addressed.
These authors contributed equally to this work.
Energies 2015, 8(11), 12584-12602; https://doi.org/10.3390/en81112332
Submission received: 6 September 2015 / Revised: 24 October 2015 / Accepted: 28 October 2015 / Published: 6 November 2015
(This article belongs to the Special Issue Thermoelectric Energy Harvesting)

Abstract

:
A thermoelectric generator (TEG) device which uses solar energy as heat source would achieve higher efficiency if there is a higher temperature difference between the hot-cold ends. However, higher temperature or higher heat flux being imposed upon the hot end will cause strong thermal stress, which will have a negative influence on the life cycle of the thermoelectric module. Meanwhile, in order to get high heat flux, a Fresnel lens is required to concentrate solar energy, which will cause non-uniformity of heat flux on the hot end of the TEG and further influence the thermal stress of the device. This phenomenon is very common in solar TEG devices but seldom research work has been reported. In this paper, numerical analysis on the heat transfer and thermal stress performance of a TEG module has been performed considering the variation on the power of the heat flux being imposed upon the hot-end; the influence of non-uniform high heat flux on thermal stress has also been analyzed. It is found that non-uniformity of high heat flux being imposed upon the hot end has a significant effect on the thermal stress of TEG and life expectation of the device. Taking the uniformity of 100% as standard, when the heating uniformity is 70%, 50%, 30%, and 10%, respectively, the maximum thermal stress of TEG module increased by 3%, 6%, 12%, and 22% respectively. If we increase the heat flux on the hot end, the influence of non-uniformity on the thermal stress will be more remarkable.

1. Introduction

The need for renewable and environmentally friendly green energies to substitute for fossil fuels has gained a lot of attention all over the world, especially in China.The rapid development of the economy increased people’s income significantly, but was accompanied by a lot of serious pollution problems. Thermoelectric is an attractive technology to convert various low quality heat energies to electricity to meet people’s increasing demand on clean energy. In thermoelectric materials, electrons or holes, diffusion is driven by a temperature drop between the hot- and cold- ends, which induces an electrical potential between them. Thermoelectric generators (TEG) are compact, highly reliable, have no moving parts, an endless shelf life, are silent in operation, and no pollution; as such, it has many advantages over other energy technologies [1,2]. Since the Seebeck effect was found in 1821, researchers did many works to accelerate the extensive application of thermoelectric devices in cooling and electricity generation.
During the past 20 years, thermoelectric devices were widely used to convert waste-heat energy from power plants and power localized autonomous sensors, to collect waste energy from the exhaust of automotive vehicles, and to cool the electronic devices with high heat flux being used in aerospace systems [3,4,5,6,7,8,9,10,11,12].
Many researchers focused on improving system performance by various methods. Sahin et al. [13] investigated the influence of thermoelectric pin geometry on the module’s efficiency and maximum power output. The results indicated that pin geometry has an obvious effect on the modules, with various temperature differences applied on the two ends. The feasibility of the use of TEG to power a thermoelectric cooling (TEC) device was explored by Khattab et al. [14]. They finally obtained a best match number of TEC and TEG and achieved the desired result using a solar thermoelectric generator to drive a small thermoelectric cooler for the greater part of a year. Rodríguez et al. [15] designed a calculation model to examine the thermal and electrical properties of the thermoelectric module. Using the fewest boundary conditions, they managed to obtain a design method with better encapsulation characteristics. The research group led by O’Brien et al. [16] made a comparison between several radioisotope heat sources which were thought to be much easier to get than traditional ones and made a comprehensive analysis of the thermal characters and radiation barrier problems. Yilbas et al. [17] explored the influence of dimensionless size and external load parameters on a thermoelectric module's efficiency. A two-stage solar concentrator designed by Omer and Infield [18] was applied to increase the temperature on the hot ends of a thermoelectric module. The device improved the module's stability and efficiency by reducing its sensitivity to light angle as well as keeping the concentration ratio at 20. The two-stage structure not only enhanced the light-gathering efficiency but also confined the air convection intensity in the tube. A device integrating traditional rooftop solar isolation material and thermoelectric power generator improved by Maneewan et al. [19,20] was applied to reduce indoor temperature in Thailand. Fans powered by a thermoelectric module were used to cool the cold end of the thermoelectric module. The device reduced heat flux into the house and increased the efficiency of the thermoelectric module, which had a negative effect on the fan’s total power and air convection intensity. An idea that incorporates commercially available thermoelectric generators (TEGs) to a water-fed heat exchanger was examined by Zhou et al. [21]. They demonstrated that, when reducing pin length while increasing the number of pins, the resulting reduction in flow resistance was found to facilitate an increase in convective heat transfer, as well as in ΔT, and thus a great increase in conversion efficiency. Xiao et al. [22] built a three-dimensional finite element model of a thermoelectric module based on the low-temperature thermoelectric material bismuth telluride and the medium-temperature thermoelectric material filled-skutterudite. The numerical simulation results showed that reasonable thermal design of multi-stage models would take full advantage of the characteristics of thermoelectric materials and effectively improve the performance of power generation. Nguyen et al. [23] explored the behavior of thermoelectric generators exposed to transient heat sources. Comparing the simulation results with experimental results, they found that the Thomson effect plays a significant role in accurately predicting the power generated by the device. Rezania et al. [24] executed co-optimized design of microchannel heat exchangers and thermoelectric generators. Zhang et al. [25] designed a novel solar thermoelectric cogenerator that can supply electric power and heat simultaneously by adding TEG modules to the heat pipe in evacuated tubular solar collectors—the collector efficiency, output electrical power, and electrical efficiency are calculated to be 47.54%, 64.80 W, and 1.59%, respectively. Recently, Chen et al. [26,27,28,29] presented comprehensive numerical and analytical investigations on the thermoelectric system under various working conditions, together with the influence of key geometric parameters of the integrated thermoelectric power generating-cooling system on cooling power and overall performance. In addition, Chen et al. [30] reported an experimental study on thermoelectric modules for power generation at various operating conditions. They declared that a thermoelectric module is a better choice for power generation in recovering waste heat if the temperature of a system is below 150 °C. After that, Wang et al. [31] investigated the performance of a TEG combined with an air-cooling system designed using two-stage optimization. In this research, they used an analytical method to model the heat transfer of the heat sink and employed a numerical method with a finite element scheme to predict the performance of the thermoelectric generator. They found that using the obtained compromise point, despite the fact that the heat sink efficiency is reduced by 20.93% compared to that without the optimal design, the system output power density is increased by 88.70%, which is recommended for the design of the heat sink.
From the research shown above, we found that increasing the hot-cold ends’ temperature difference is a good method for increasing the thermoelectric efficiency limited by Carnot efficiency if appropriate TEG materials are selected. A high temperature difference will cause thermal stress along the materials and between the interfaces of different materials, however: the higher the temperature difference, the larger the thermal stress. This phenomenon has attracted the attention of several researchers. Merbati et al. [32] carried out a thermodynamic and thermal stress analysis of thermoelectric power generators with different pin geometry configurations. They managed to get a temperature and thermal stress field and tested the thermal efficiency, maximum power output, and thermal stress in the modules. Their findings showed that trapezoidal pins could alleviate thermal stress in the module and simultaneously increase efficiency. Ziabari et al. [33] addressed the problem of reducing interfacial shearing stress in a thermoelectric module (TEM) structure using analytical and finite-element-analysis (FEA) modeling. They also calculated the maximum shearing stress occurring at the ends of the peripheral legs (supposedly responsible for the structural robustness of the assembly) for different leg sizes. The results concluded that shearing stress can be effectively reduced by using thinner (smaller fractional area coverage) and longer (in the through thickness direction of the module) legs and compliant interfacial materials. Wu et al. [34] performed a numerical analysis on the thermodynamics and thermal stress performance of the thermoelectric module. They considered the variation of the thickness of materials and examined the influence of high heat flux on thermal efficiency, power output, and thermal stress. The results indicated that under high heat flux being imposed upon the hot end, the thermal stress is so strong that it has a decisive effect on the life expectancy of the device.
Much investigation has been carried out to examine the thermodynamic performance of the thermoelectric device. Thermal stress generated in different heating uniformity in TEG modules due to temperature gradients is neglected to a certain extent, however. Thermal stress induced by a high temperature gradient in the device undoubtedly decreases the predicted life cycle of the module [34]. For solar thermoelectric modules, a much higher focus of solar energy will be applied to the hot end of the TEG to achieve higher system efficiency. However, higher focus of solar energy may lead to heating non-uniformity on the hot end and thus cause larger thermal stress among different materials [35], which will significantly influence the life cycle of the TEG. A better understanding of the operating features of thermoelectric modules with different heating uniformity becomes essential, but seldom can similar work be found in the previous studies. The location of the maximum stress and the level of thermal stress intensity are obscure and the positions with the highest probability of cracking are not given. An optimum structure is one that decreases thermal stress while having little impact or even a positive effect on the device’s thermoelectric performance. In this paper, a numerical model is presented to examine the effect of the heating uniformity on the module’s stress level.

2. Model Description
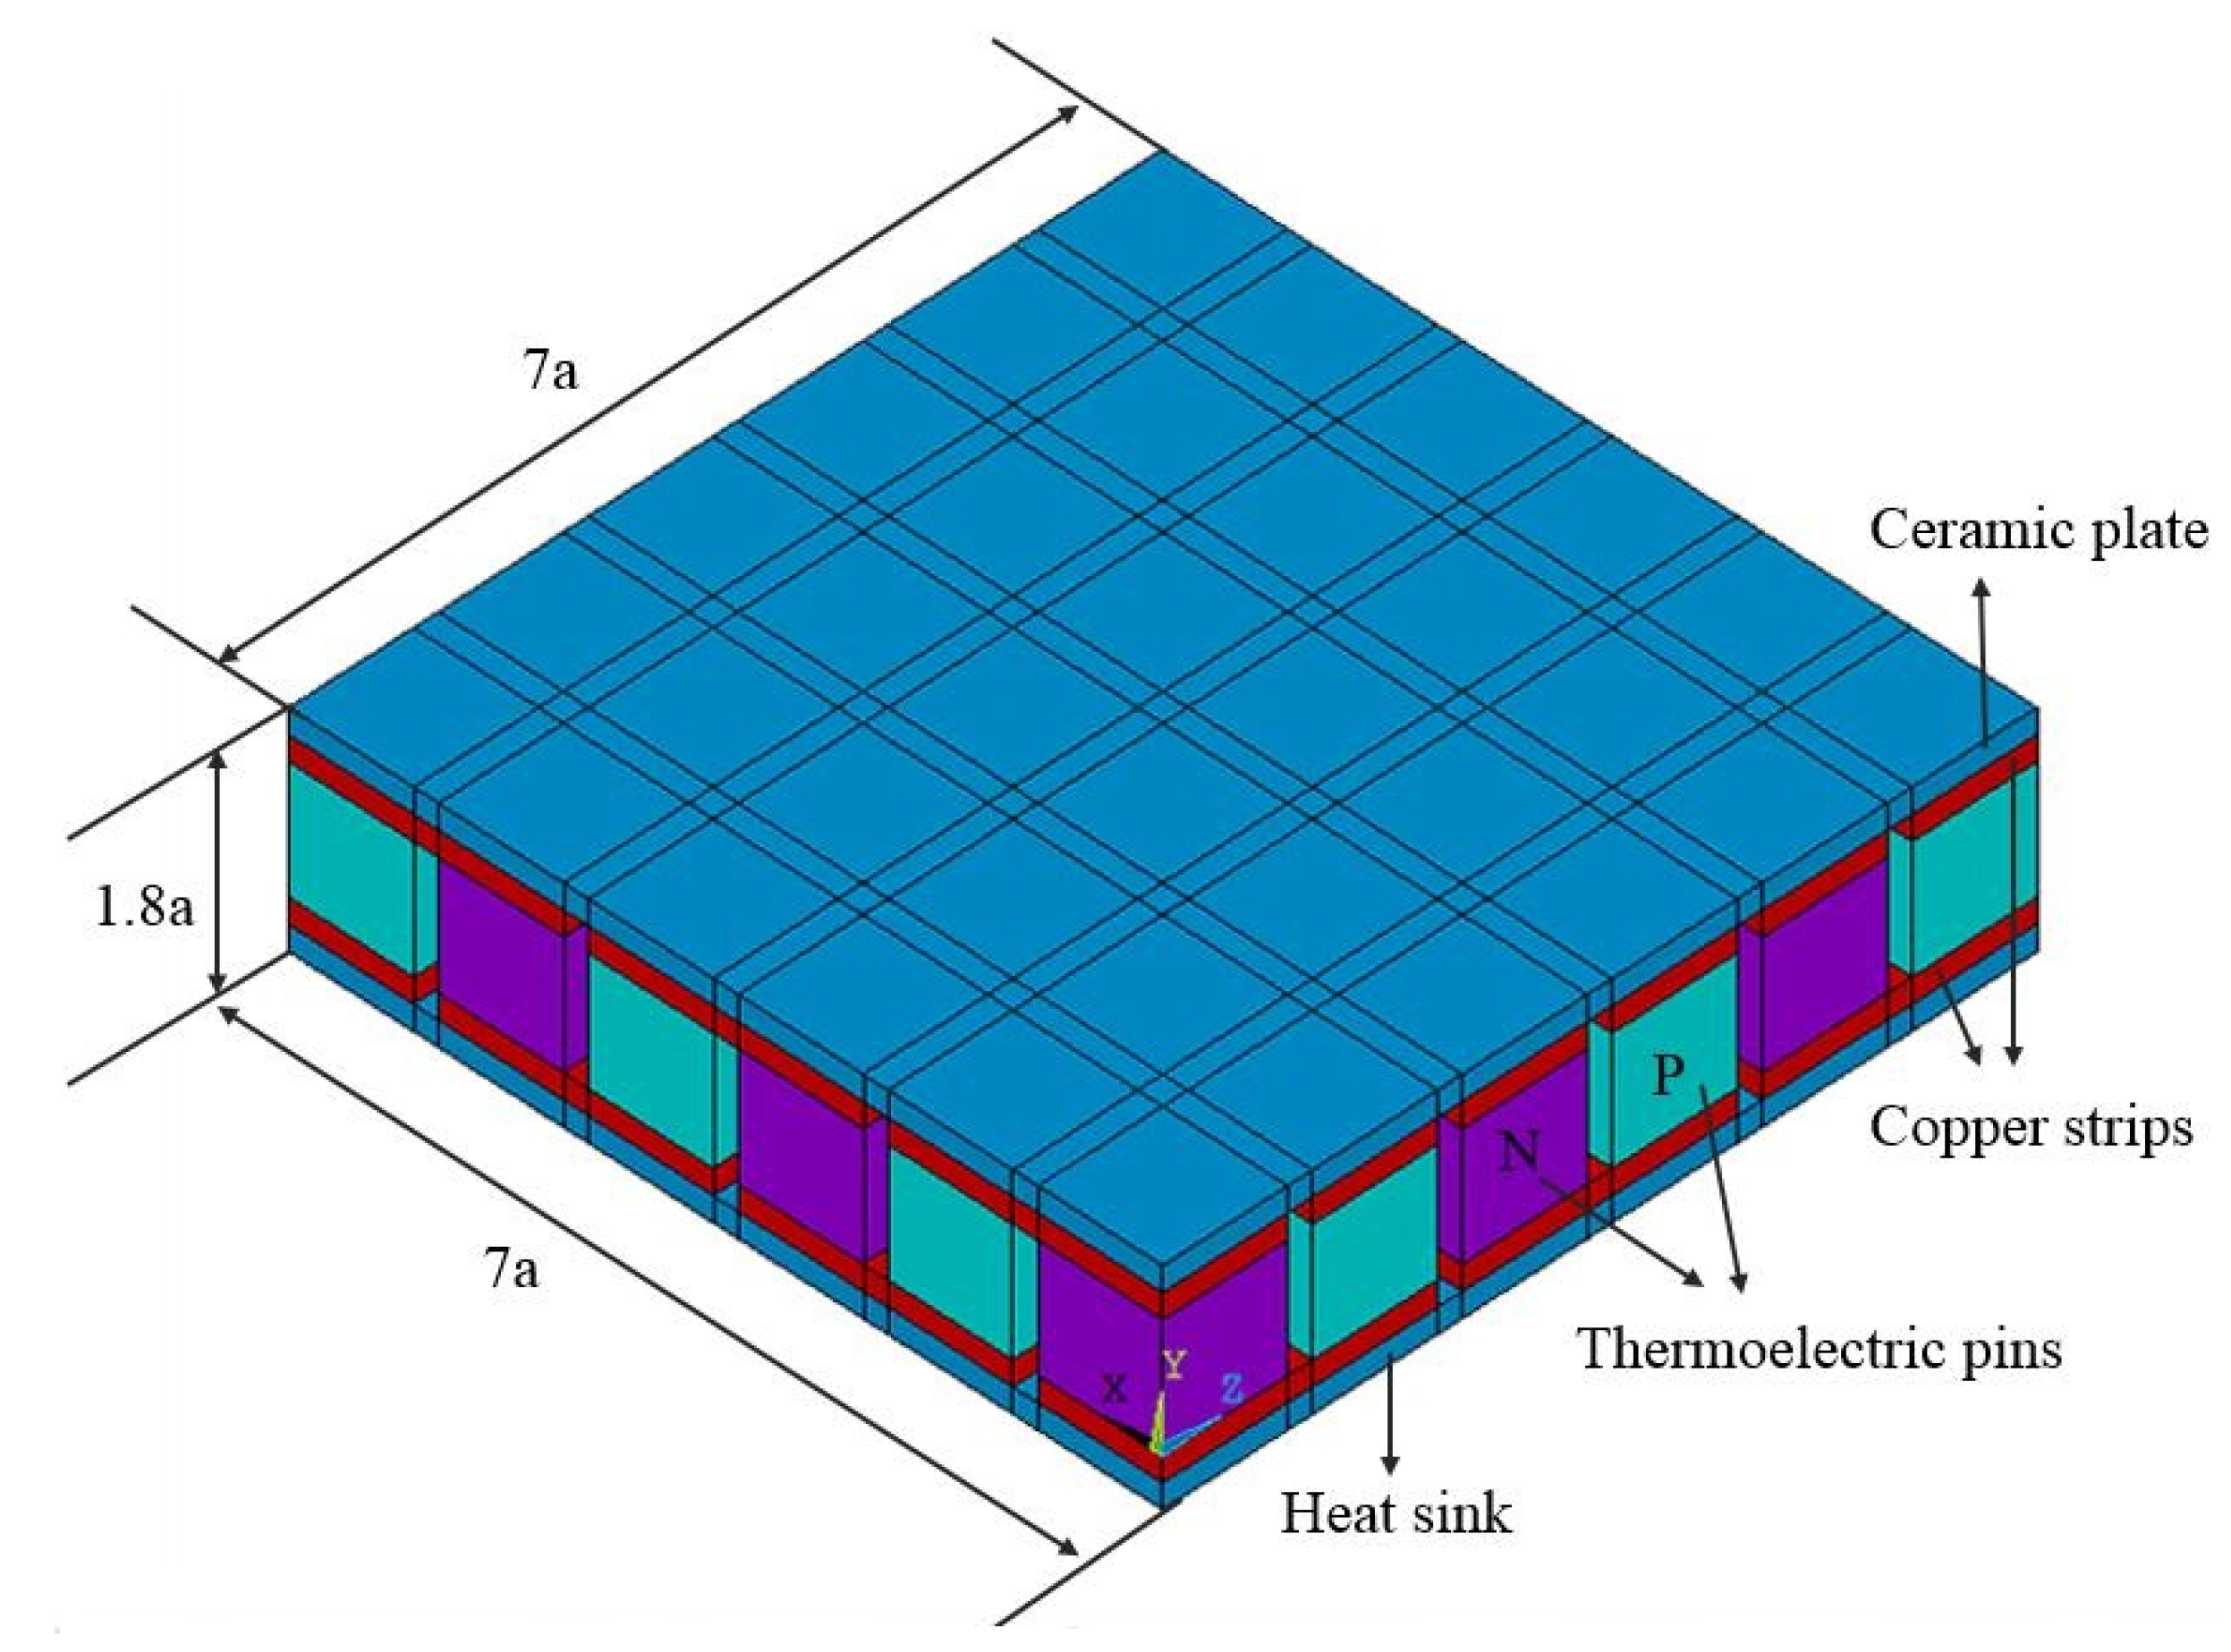
2.1. Physical Model

The thermoelectric model tested in the paper is presented in Figure 1, including a ceramic plate, conducting strips (copper), and thermoelectric pins. It is considered that the basic thicknesses of copper strip and ceramic plates are 0.6 mm. The size of thermoelectric pins is a × a × a = 3.00 mm × 3.00 mm × 3.00 mm. The distance between the two pins is 0.60 mm. The TEG model, with 18 P-type and N-type legs, is thermally parallel-connected and electrically series-connected in order to achieve considerable power and voltage output. The most commonly used low-temperature thermoelectric material Bi2Te3 is selected. Aluminum oxide (Al2O3) ceramic was selected as the material of the ceramic plate.
Figure 1. Geometric dimensions of the thermoelectric model.
Energies 08 12332 g001
Actually, a single thermoelectric module’s life cycle is random, but the distribution of the life cycles of a large number of thermoelectric modules could be expected. The decisive factor for the life cycle of the module is thermal stress intensity. The Young’s modulus of aluminum oxide ceramics (Al2O3) and Bi2Te3 vary greatly, so the positions that are most likely to crack are the interfaces of the copper strips and ceramic plates and the edges of the thermo-pins.
The material properties used in the previous study [35] are incorporated in the present simulations, which are listed in Table 1 and Table 2.
Table 1. Properties of Bi2Te3 [32].
Temperature (°C)Thermal expansion (10−5 m/°C)
240.8
311.01
921.21
1781.24
3401.32
5201.33
5911.41
Temperature (°C)Poisson’s ratioYoung’s modulus (GPa)
−730.2365
270.2363
1270.2362
2270.2360
3270.2359
Table 2. Properties of other materials [32].
MaterialsThermal conductivity (W/(m·°C))Thermal expansion (10−5m/°C)Poisson’s ratioYoung’s modulus (GPa)Electrical resistivity (Ω·m)
Cu4001.70.311102.5 × 10−8
Al2O3250.750.223001.14 × 107

2.2. Mathematical Model and Boundary Conditions

The analysis of the TEG model is divided into two-sub steps including heat transfer analysis and thermal stress formulations.

2.2.1. Heat Transfer Analysis

(1) Governing equations
In this paper, a finite element method is employed to simulate the temperature field in the thermoelectric modules. Equations coupling temperature T and electric potential V are:
( k T ) + ρ J 2 T J [ ( α T ) T + ( α ) T ] = 0
J = 0
where
J = σ [ ( μ e + V ) + α T ]
q = α T J k T
In the equations, k is thermal conductivity at zero current; vector J is the electric current per unit area; ρ is electric resistivity; σ = 1/ρ is electric conductivity; α is the Seebeck coefficient; μ is the chemical potential; e is the charge of a charged particle. Note that k, ρ, α, and σ of TE materials are a function of temperature ([35], Table 1).
Thermoelectric modules are not ideally one dimensional in structure. Equation (1) reflects the multidimensional effects that can be obvious in interfaces of the module. Equations (1) and (2) form a system coupled with two partial differential equations with two dependent variables: temperature and electric potential. Equation (1) can be separated into four parts, which respectively reflect the magnitude of thermal energy transferred by conducting, Joule heat, heat absorbed by Peltier effect, and heat absorbed or released by Thomson effect.
(2) Boundary conditions
Some reasonable assumptions are made to simplify the mathematical model without too much deviation from real conditions.
(a)
All surfaces of the model except the hot end and cold end are considered to be heat insulation.
(b)
Neglect heat convection on all the surfaces.
(c)
There is no difference in properties as a function of position.
(d)
Electrical contact resistance and thermal contact resistance are not taken into consideration.
Note that all assumptions introduced above are aimed at excluding other unimportant factors that have little effect on the results and avoiding analyzing two or more factors simultaneously.
The boundary conditions for thermoelectric heat transfer analysis are shown as follows:
The actual TEG device is cooled by the heat sink connected to the cold end, with the water serving as working medium. The cooling of the TEG device is considered to be very good and the first boundary condition is applied to the cold end of the TEG module with a fixed value of 25 °C. This is reasonable for the TEG model and can be seen as a temperature buffer such that slight temperature change in cold end can be neglected. Then a specified temperature was applied to the cold end:
Tc = 25 °C
In this paper, the total heat flow applied on the hot end is assumed to be of a constant value P, and the values of P for different case series were 4.41 W, 8.82 W, 13.23 W, 17.64 W, and 22.05 W, respectively.
Considering that the heat flux being imposed upon the surface of the hot end is sometimes different from the total area of the hot end because the irradiance beam of solar energy concentrated on the system will not be exactly the same as the surface of the thermoelectric system’s hot end. Thereby, we define the parameter of heating uniformity as:
U f = A S × 100 %
where A is the heating area of the hot end which receives the radiation energy, and S is the total area of the hot end.
Total heat flow (P) is the same in one case series and thus the heat fluxes vary in one case series with Uf being 10%, 30%, 50%, 70%, and 100%, respectively.
The relationship between heat flow and heat flux in one case is as follows:
H F = P A
where HF is heat flux. The magnitude of heat flux chosen in this paper is common in the electronic components. The corresponding peak temperature of the hot end of the TEG is not higher than 250 °C, which is a reasonable value for thermoelectric power generator devices.
Reference voltage applied to a point on the copper strip surface:
E ( x = 7 a , y = 0 , z = 7 a ) = 0
All the surfaces of the legs are exposed to electric insulating gas, and the current must be parallel to the surfaces.
J n = 0

2.2.2. Thermal Stress Analysis

(1) Governing equations
Because the thermal conductivity of a material is a function of temperature, a thermoelectric module is not strictly one-dimensional. The thermodynamic and mechanical characteristics in the diection of the y-axis are nonlinear. When the temperature distribution in the system is considered, the part of heat converted to electric energy is neglected, as it accounts for only a small portion (i.e., less than 5%) of the total heat flow and it would have virtually no effect on the conclusions. The steady state energy equation in the whole TEG is presented as:
x [ k T x ] + y [ k T y ] + z [ k T z ] = 0
where k is a function of temperature as shown in Figure 2. From the equations shown above, a temperature field is obtained by numerical simulation, which is applied to thermal stress analysis.
A similar thermal stress analysis method, utilized in [34,35], is employed to evaluate thermal intensity in the model. In this paper, the analysis of the thermoelectric generator is divided into two sub-steps, including thermodynamic analysis and thermal stress formulations. Temperature field obtained from thermodynamic analysis is used to calculate the thermal stress field in the model. There is no doubt that temperature field and deformation will influence each other. It should be mentioned, however, that the temperature field will significantly affect the thermal stress field while the opposite is not obvious, as the deformation is quite small when compared to the model’s geometric magnitude.
Figure 2. Mesh generation of model.
Energies 08 12332 g002
To identify the displacement-strain relations, the dimensionless equations are as follows:
ε ¯ x x = u ¯ x ¯ , ε ¯ y y = ν ¯ y ¯ , ε ¯ z z = w ¯ z ¯
ε ¯ x y = 0.5 ( u ¯ y ¯ + v ¯ x ¯ ) , ε ¯ y z = 0.5 ( w ¯ y ¯ + v ¯ z ¯ ) , ε ¯ z x = 0.5 ( w ¯ x ¯ + u ¯ z ¯ )
A non-symmetrical Jacobian matrix expresses the stress-strain relationship in dimensionless form:
{ σ x x ¯ σ y y ¯ σ z z ¯ σ y z ¯ σ z x ¯ σ x y ¯ } = E ¯ ( 1 + v ) ( 1 2 v ) [ 1 v v v 0 0 0 v 1 v v 0 0 0 v v 1 v 0 0 0 0 0 0 1 2 v 0 0 0 0 0 0 1 2 v 0 0 0 0 0 0 1 2 v ] { ε x x ¯ ε y y ¯ ε z z ¯ ε y z ¯ ε z x ¯ ε x y ¯ } - { 1 1 1 0 0 0 } α ¯ E T ¯ 1 2 v
The mechanical and thermodynamic equations are coupled to obtain the temperature and thermal stress field in the module.
If the three principal stress values are not equal to zero in the module, we mark them σ1, σ2, and σ3 (supposing σ1 ≥ σ2 ≥ σ3). Then, we get maximum normal stress σmax, the minimum normal stress σmin, and maximum shear stress τmax:
R g = m ( ρ n l n A n + ρ p l p A p + 2 ( r c h + r c c ) ) , K g = 1 m ( λ n A n l n + λ p A p l p ) , τ max = | σ 1 σ 3 | 2
(2) Boundary conditions
Boundary conditions for heat transfer analysis are listed in Equations (5) to (9). In this case, corresponding heat flux magnitude is common in electronic products. High heat flux leads to considerable thermal stress level in the model.
The boundary conditions for thermal stress analysis are shown below in Equations (10)–(13). On surface Y = 1.4 × a (hot end) and 0.0 mm (cold end), strains in Y direction and all shear deformations are set to be zero:
ε ¯ y y ( y = 1.4 a ) = ε x y ¯ ( y = 1.4 a ) = ε z y ¯ ( y = 1.4 a ) = 0
ε y y ¯ ( y = 0.0 m m ) = ε ¯ x y ( y = 0.0 m m ) = ε ¯ z y ( y = 0.0 m m ) = 0
All the boundary conditions are set to be similar to the real ones.

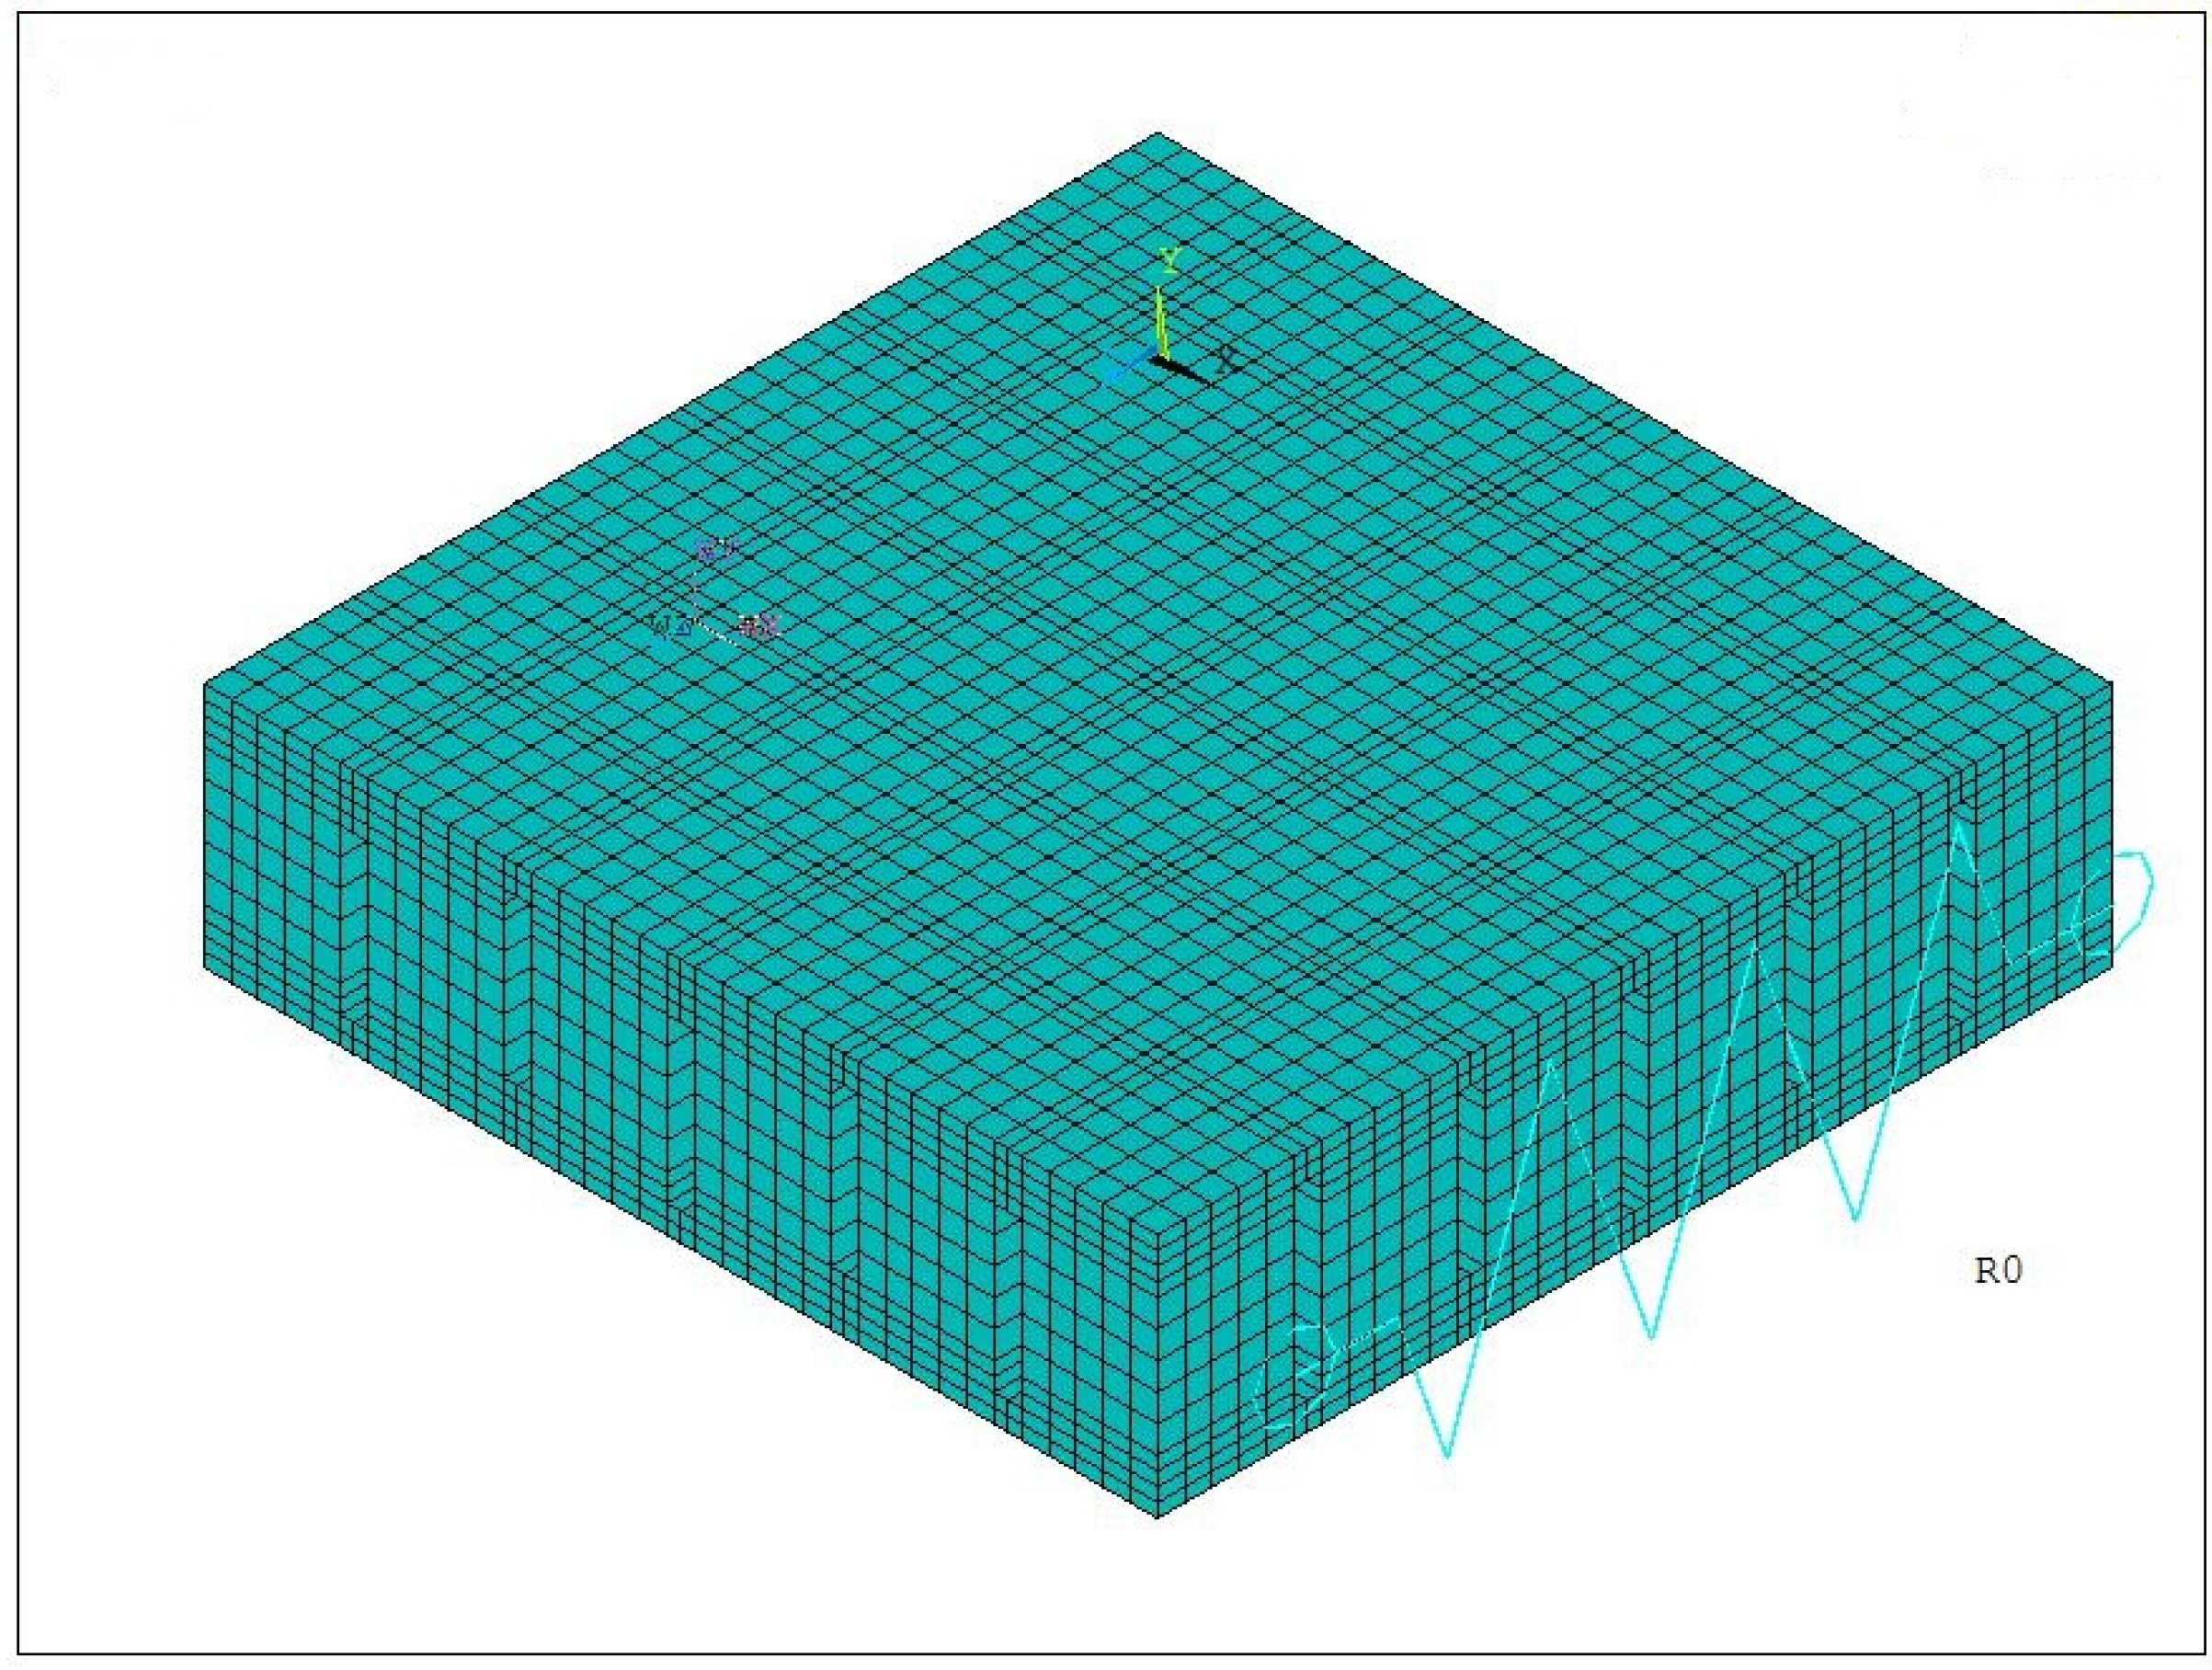
2.3. Computational Procedure and Verification

A grid system identical to the one employed in thermodynamics and thermoelectric analysis is applied to thermal stress analysis. Finite element method (FEM) calculations are performed by using the general thermoelectric analysis package ANSYS 14.0. Thermal solid brick 8note 70 element and structural solid brick 8note 185 element are used to discretize the computational domain. The iterations continue until the relative errors of heat flow and electric current are both below 1 × 10⁻⁴. It has been verified that the commercial software ANSYS package can present credible results [29].
In order to test the grid-independence of the grid system in numerical simulation, three cases with grid numbers of 11,025, 45,325 and 88,200 are tested (for single couple thermo-pins, the respective numbers are 612, 2518 and 4900) in the same boundary conditions. When the external resistance is chosen as 0.165 Ω, numerical simulation results indicate that the external voltages respectively are 0.2205, 0.2202, and 0.2199 V. Another series of tests were carried out to check the stress intensity in a single couple thermo-pins; the respective grid numbers are 11,025, 45,325, and 88,200. The maximum thermal stresses are 876, 877, and 877 MPa, respectively. We find that the deviation is negligible, which demonstrates that numerical calculations are grid-independent for these cases. Here a grid number of 45,325 shown in Figure 2 is thus selected as the mesh system in this paper.
Few results coupling the temperature and thermal stress of thermoelectric system have been reported in recent years. One way to verify the simulation method used in this work is to employ the previous geometrical model [34] and compare the temperature and thermal stress results to those results reported in [34]. It is shown that the deviations between the present results and previous results at given points in the same geometrical model are less than 2%. Further validation of numerical simulation will be executed by experimental results concerning both the system output power and thermal stress under non-uniform high heat fluxes.

3. The Discussion of Simulation Results

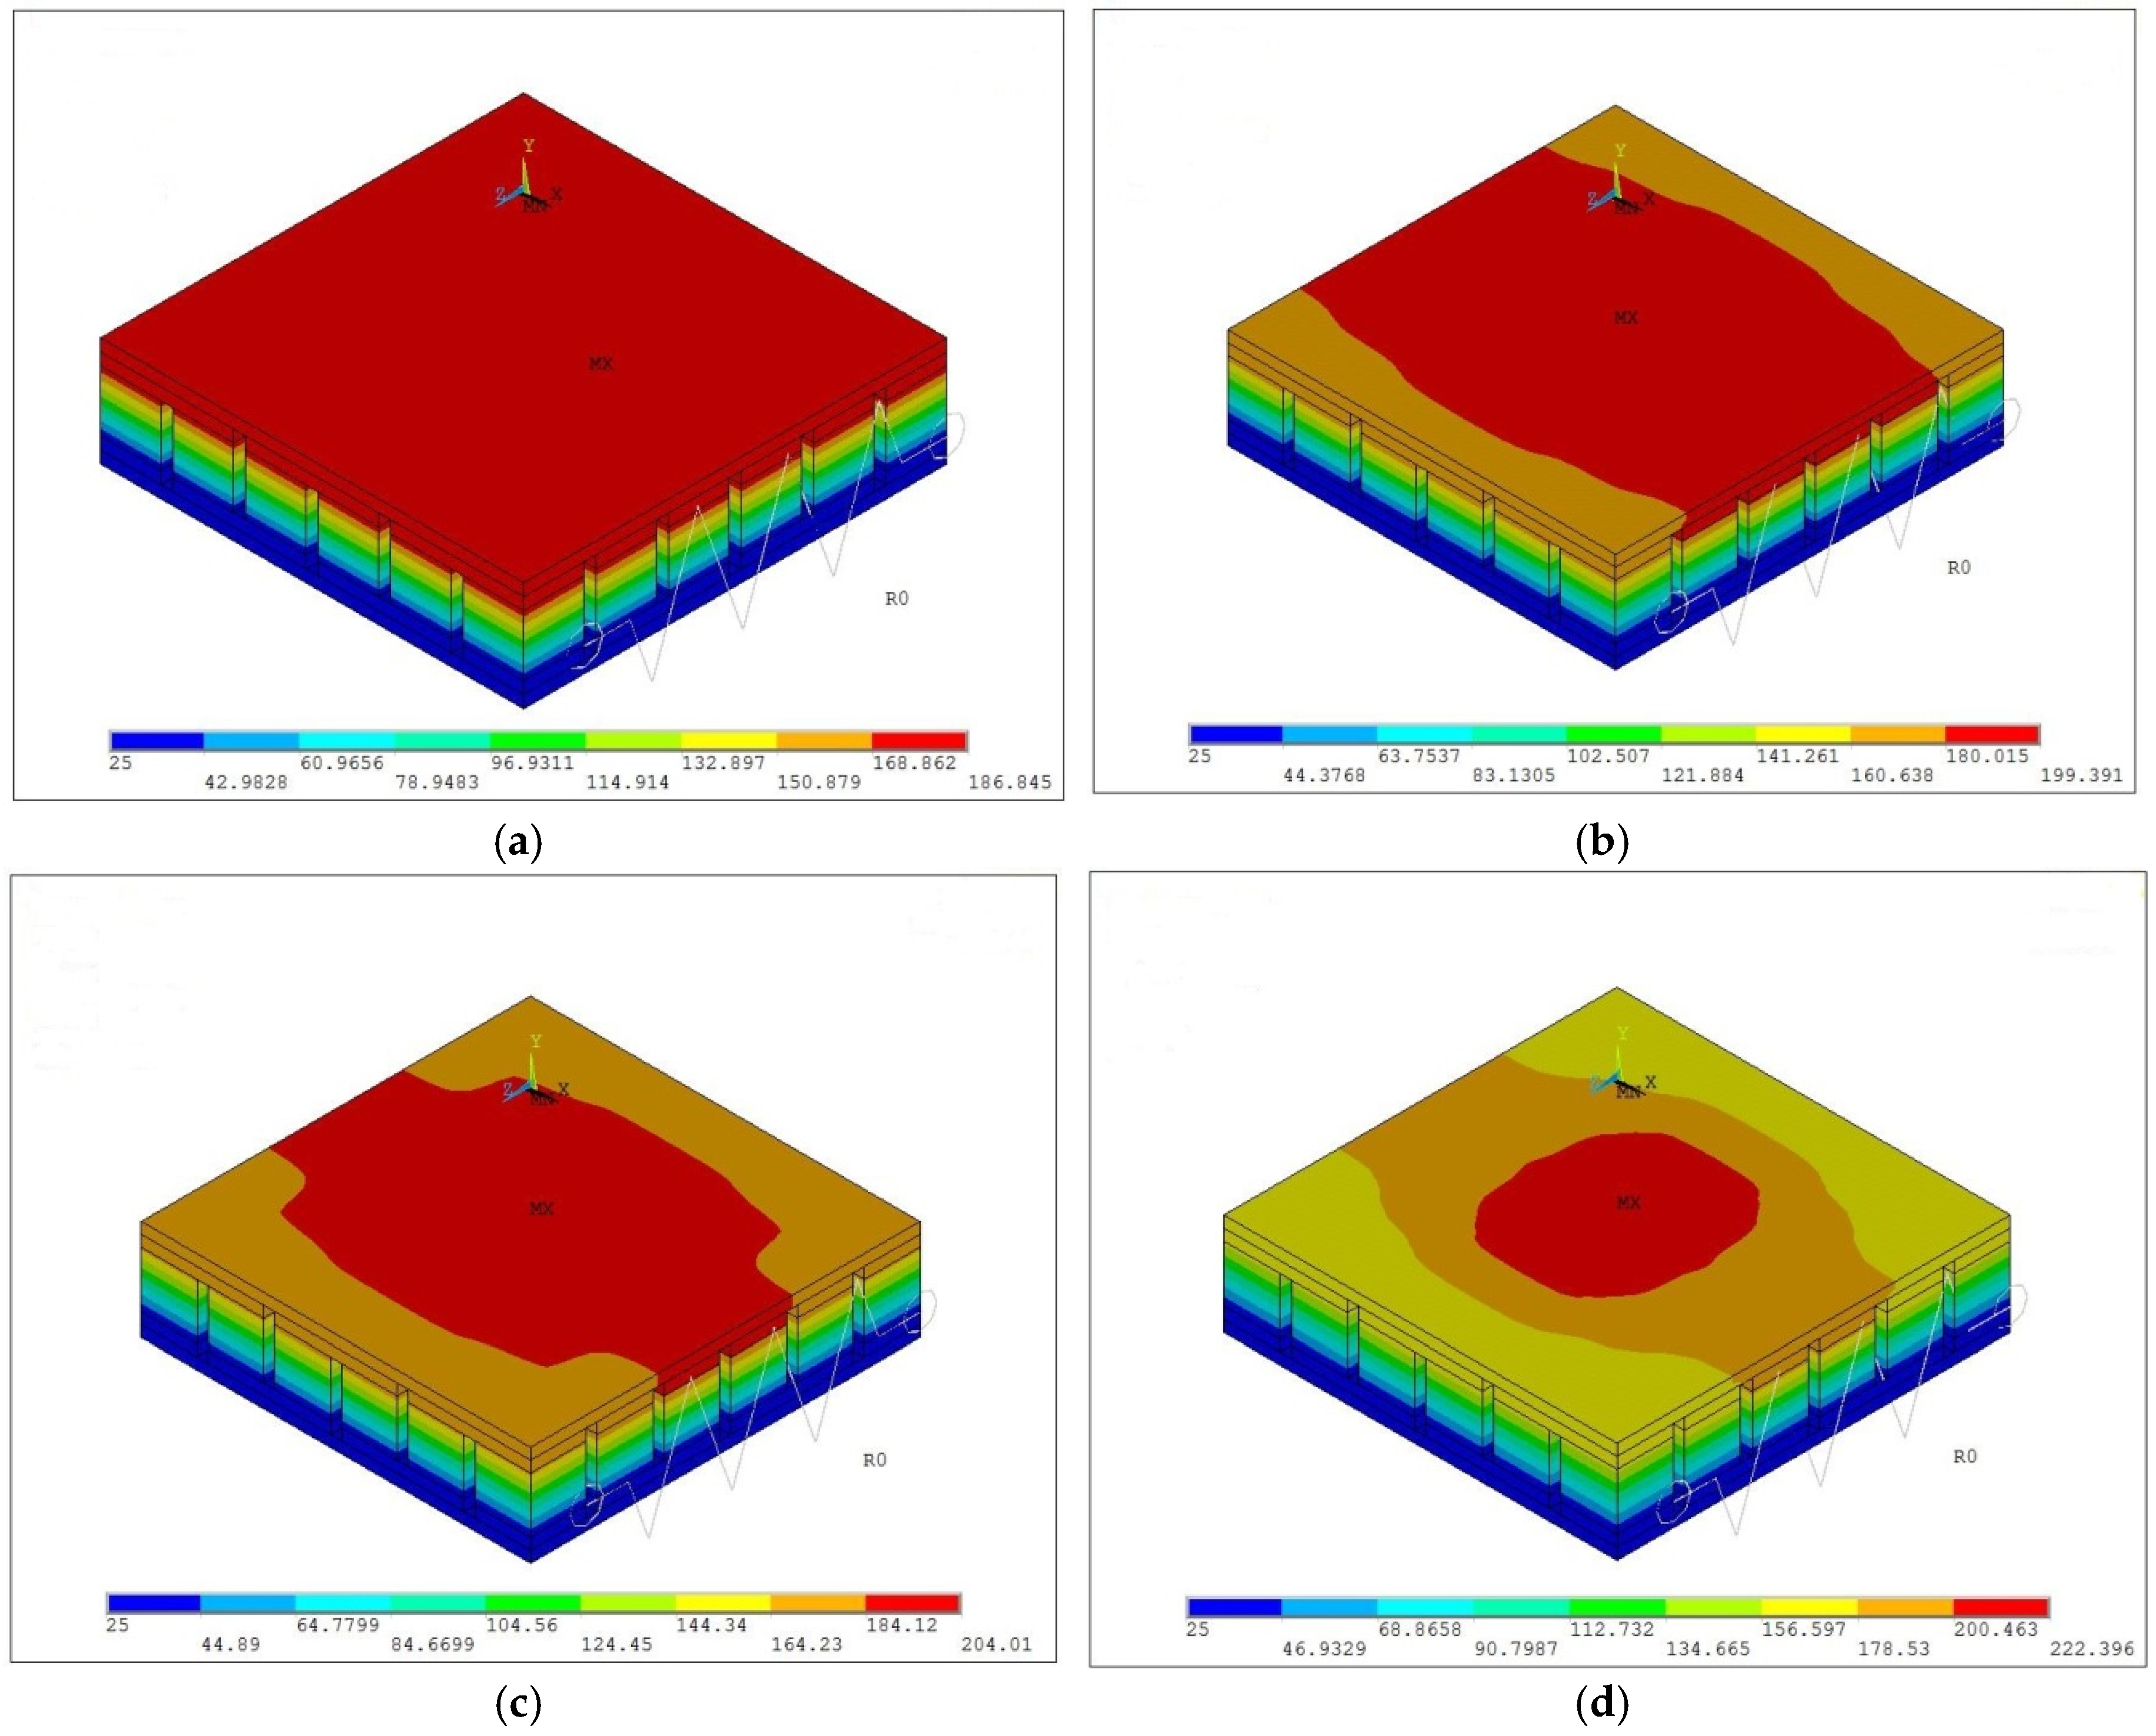
3.1. Temperature Distribution of the TEG Model

As we can see from Figure 3, the highest temperature appears on the center of the top surface for all cases. With the heating uniformity decreasing from 100% to 30%, temperature becomes increasingly inhomogeneous on the surface of the TEG hot end. The temperature gradient becomes higher, and the maximum temperature increases from 187 °C to 222 °C, which is consistent with our prediction. The temperature increases quite moderately, however, and it seems that the ceramic plates play an important role in dispersal of heat flux. As we see in Figure 3b–d, even though the heating power area on the hot end has the geometrical characteristics of both central and axial symmetry, the temperature distribution only shows the feature of axial symmetry, which is because the heat conductivity of the copper sheets connecting the thermocouple arm is far larger than that of the thermocouple arm and ceramic plates.
Figure 3. The effect of heating uniformity (Uf) on the temperature distribution of the top surface of the thermoelectric generator (TEG) when P is 22.05 W (Unit: °C): (a) Uf = 100%; (b) Uf = 70%; (c) Uf = 50%; (d) Uf = 30%.
Energies 08 12332 g003
There is no doubt that the difference in temperature distributions in the module will lead to voltage output variations for different heat flux concentration rates. At the center of the module, thermoelectric couples working under a higher temperature difference will have a larger Seebeck voltage output, while the voltage outputs for the couples at the margins are much lower. The Seebeck voltage generated by the module is a function of the temperature distribution of the model, thus the heat concentration rate will exert a significant influence on the energy conversion efficiency of the module. As displayed in the figures, the temperature gradients in the model increase with the concentration rate, which should be reflected in the increasing thermal stresses for these cases.

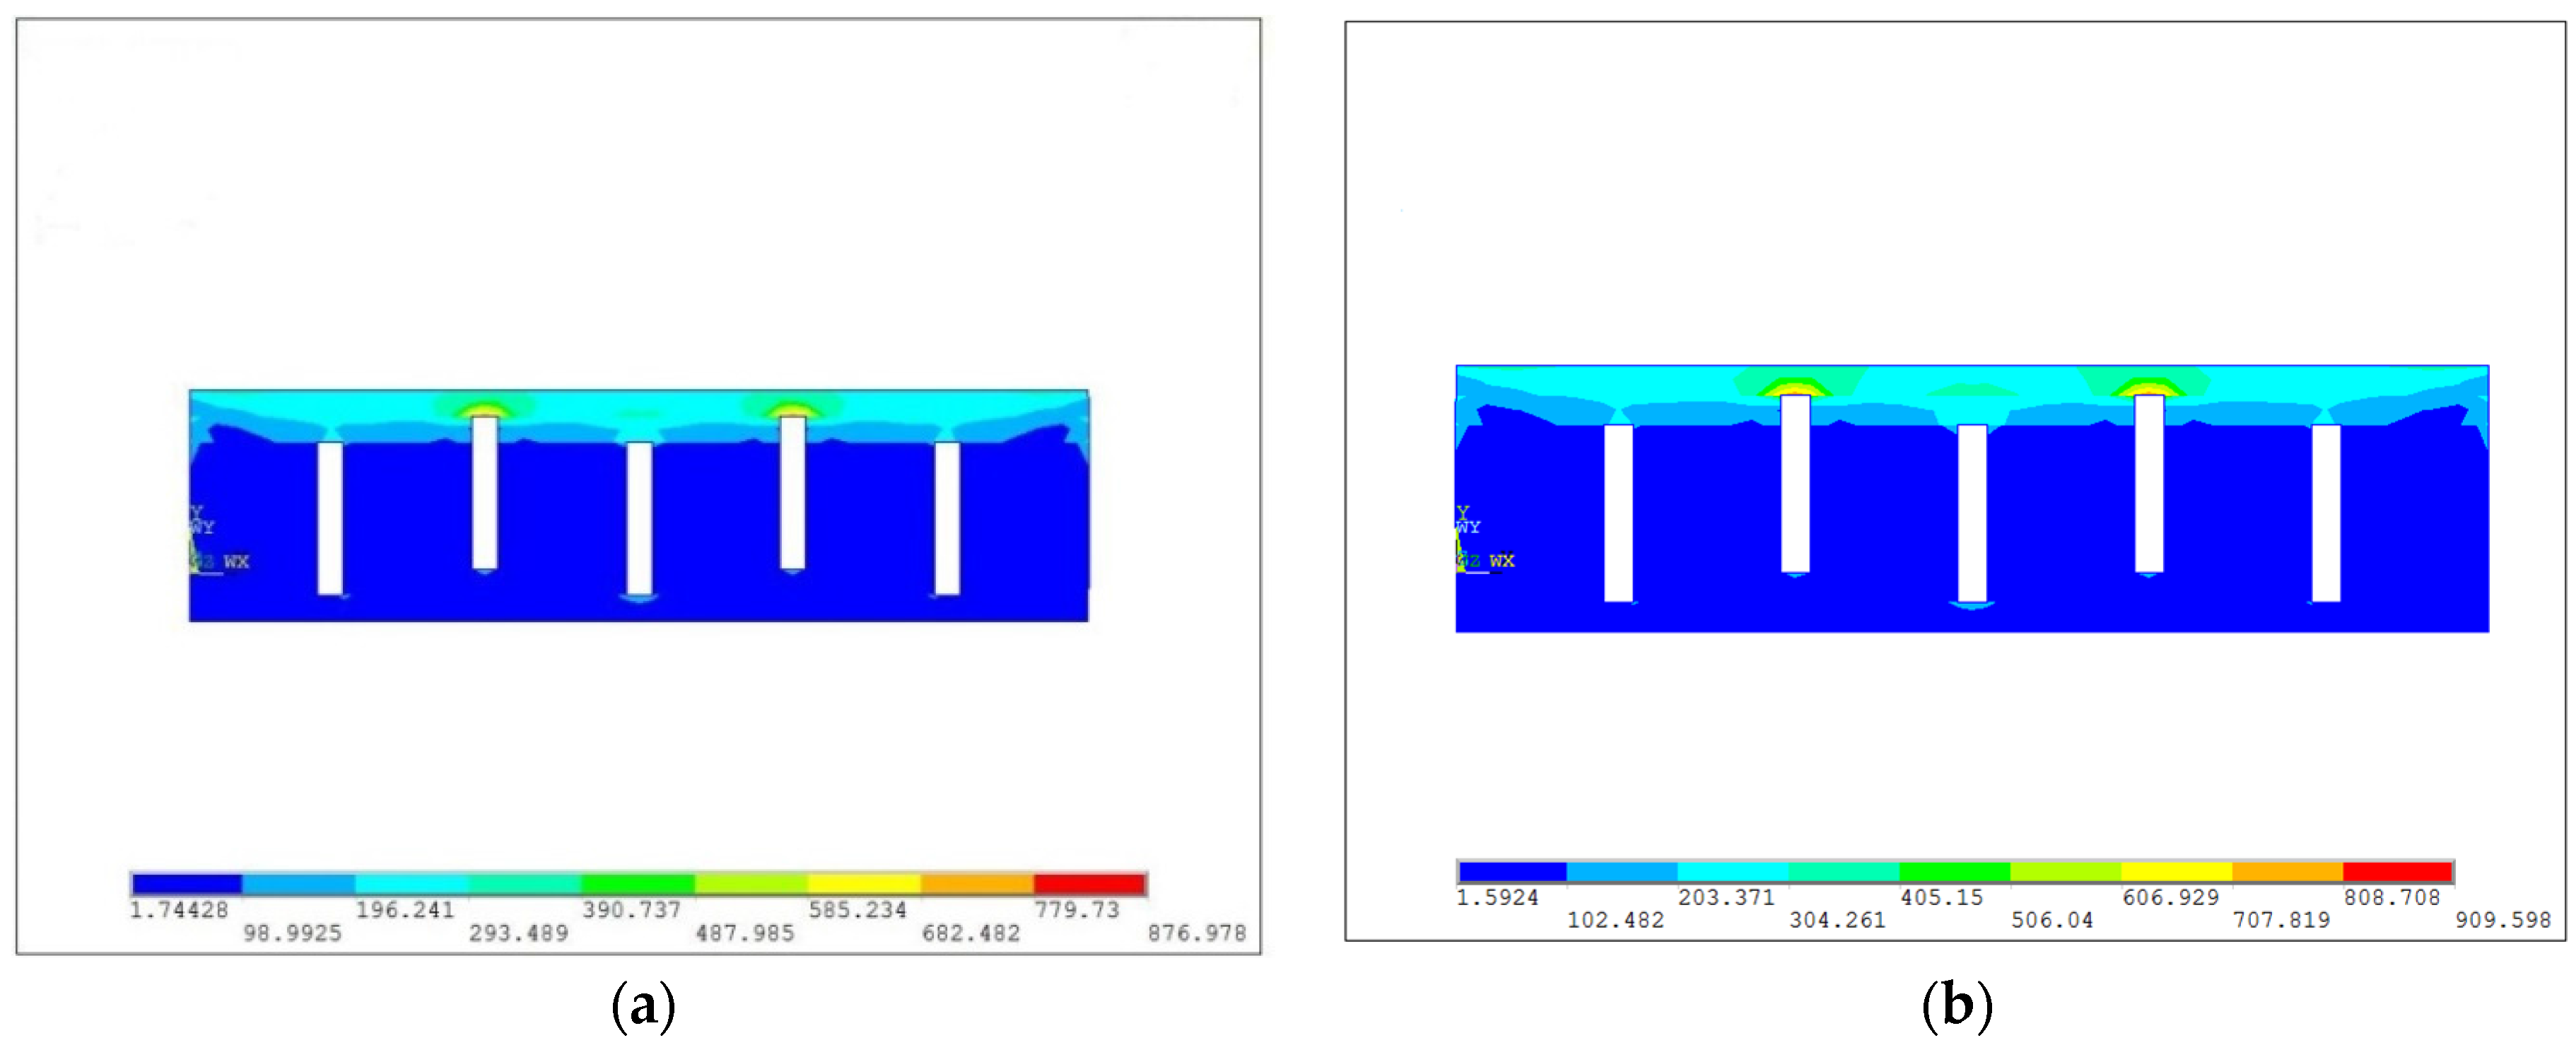
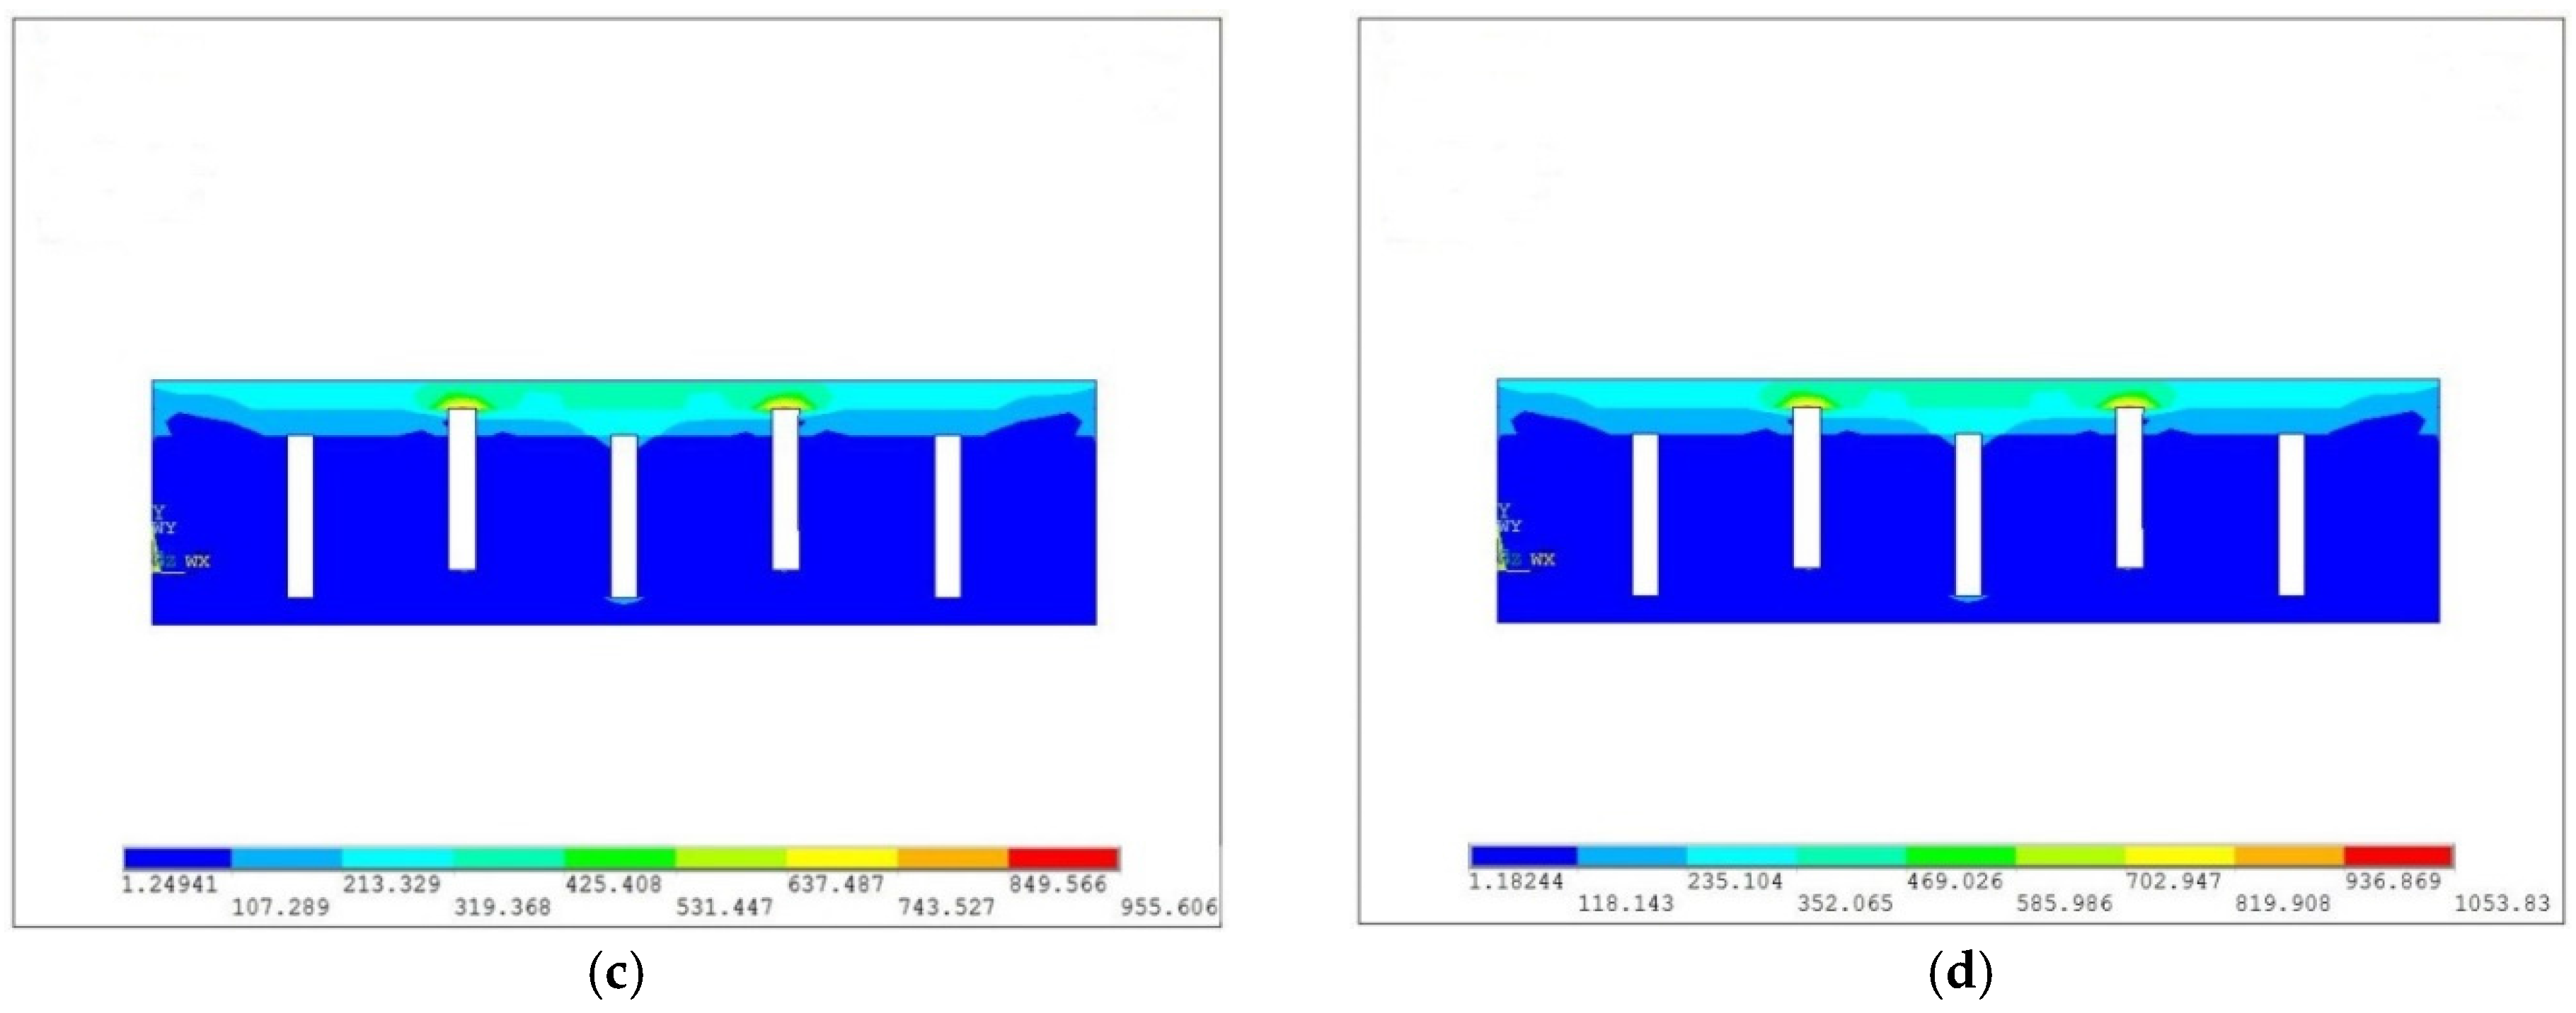
3.2. Thermal Stress Distribution of the TEG Model

Figure 4 shows that as the heating uniformity decreases from 100% to 30%, the maximum stress increases from 1330 MPa to 1467 MPa. The highest thermal stress locations are mainly distributed over the interspace between two copper sheets and the ceramic plate on the hot end. The relatively low thermal conductivity of the ceramic, and the super thermal conductivity of the copper in this region will stimulate high temperature gradients between these two materials, which is responsible for the high thermal stress in these regions.
It seems that the thermal stress differences among these cases are not as large as expected. It can be reasoned by the buffering effect of the ceramic plate. Though the temperature gradients reach the peak value on the hot end of the model, the highest thermal stress happens at the edges of interface between the copper and the ceramic, where the expansion coefficient differences between the two materials will exacerbate the thermal stress intensity.
Figure 4. The effect of heating uniformity (Uf )on the distribution of thermal stress when P is 22.05 W (Unit: MPa): (a) Uf = 100%; (b) Uf = 70%; (c) Uf = 50%; (d) Uf = 30%.
Energies 08 12332 g004

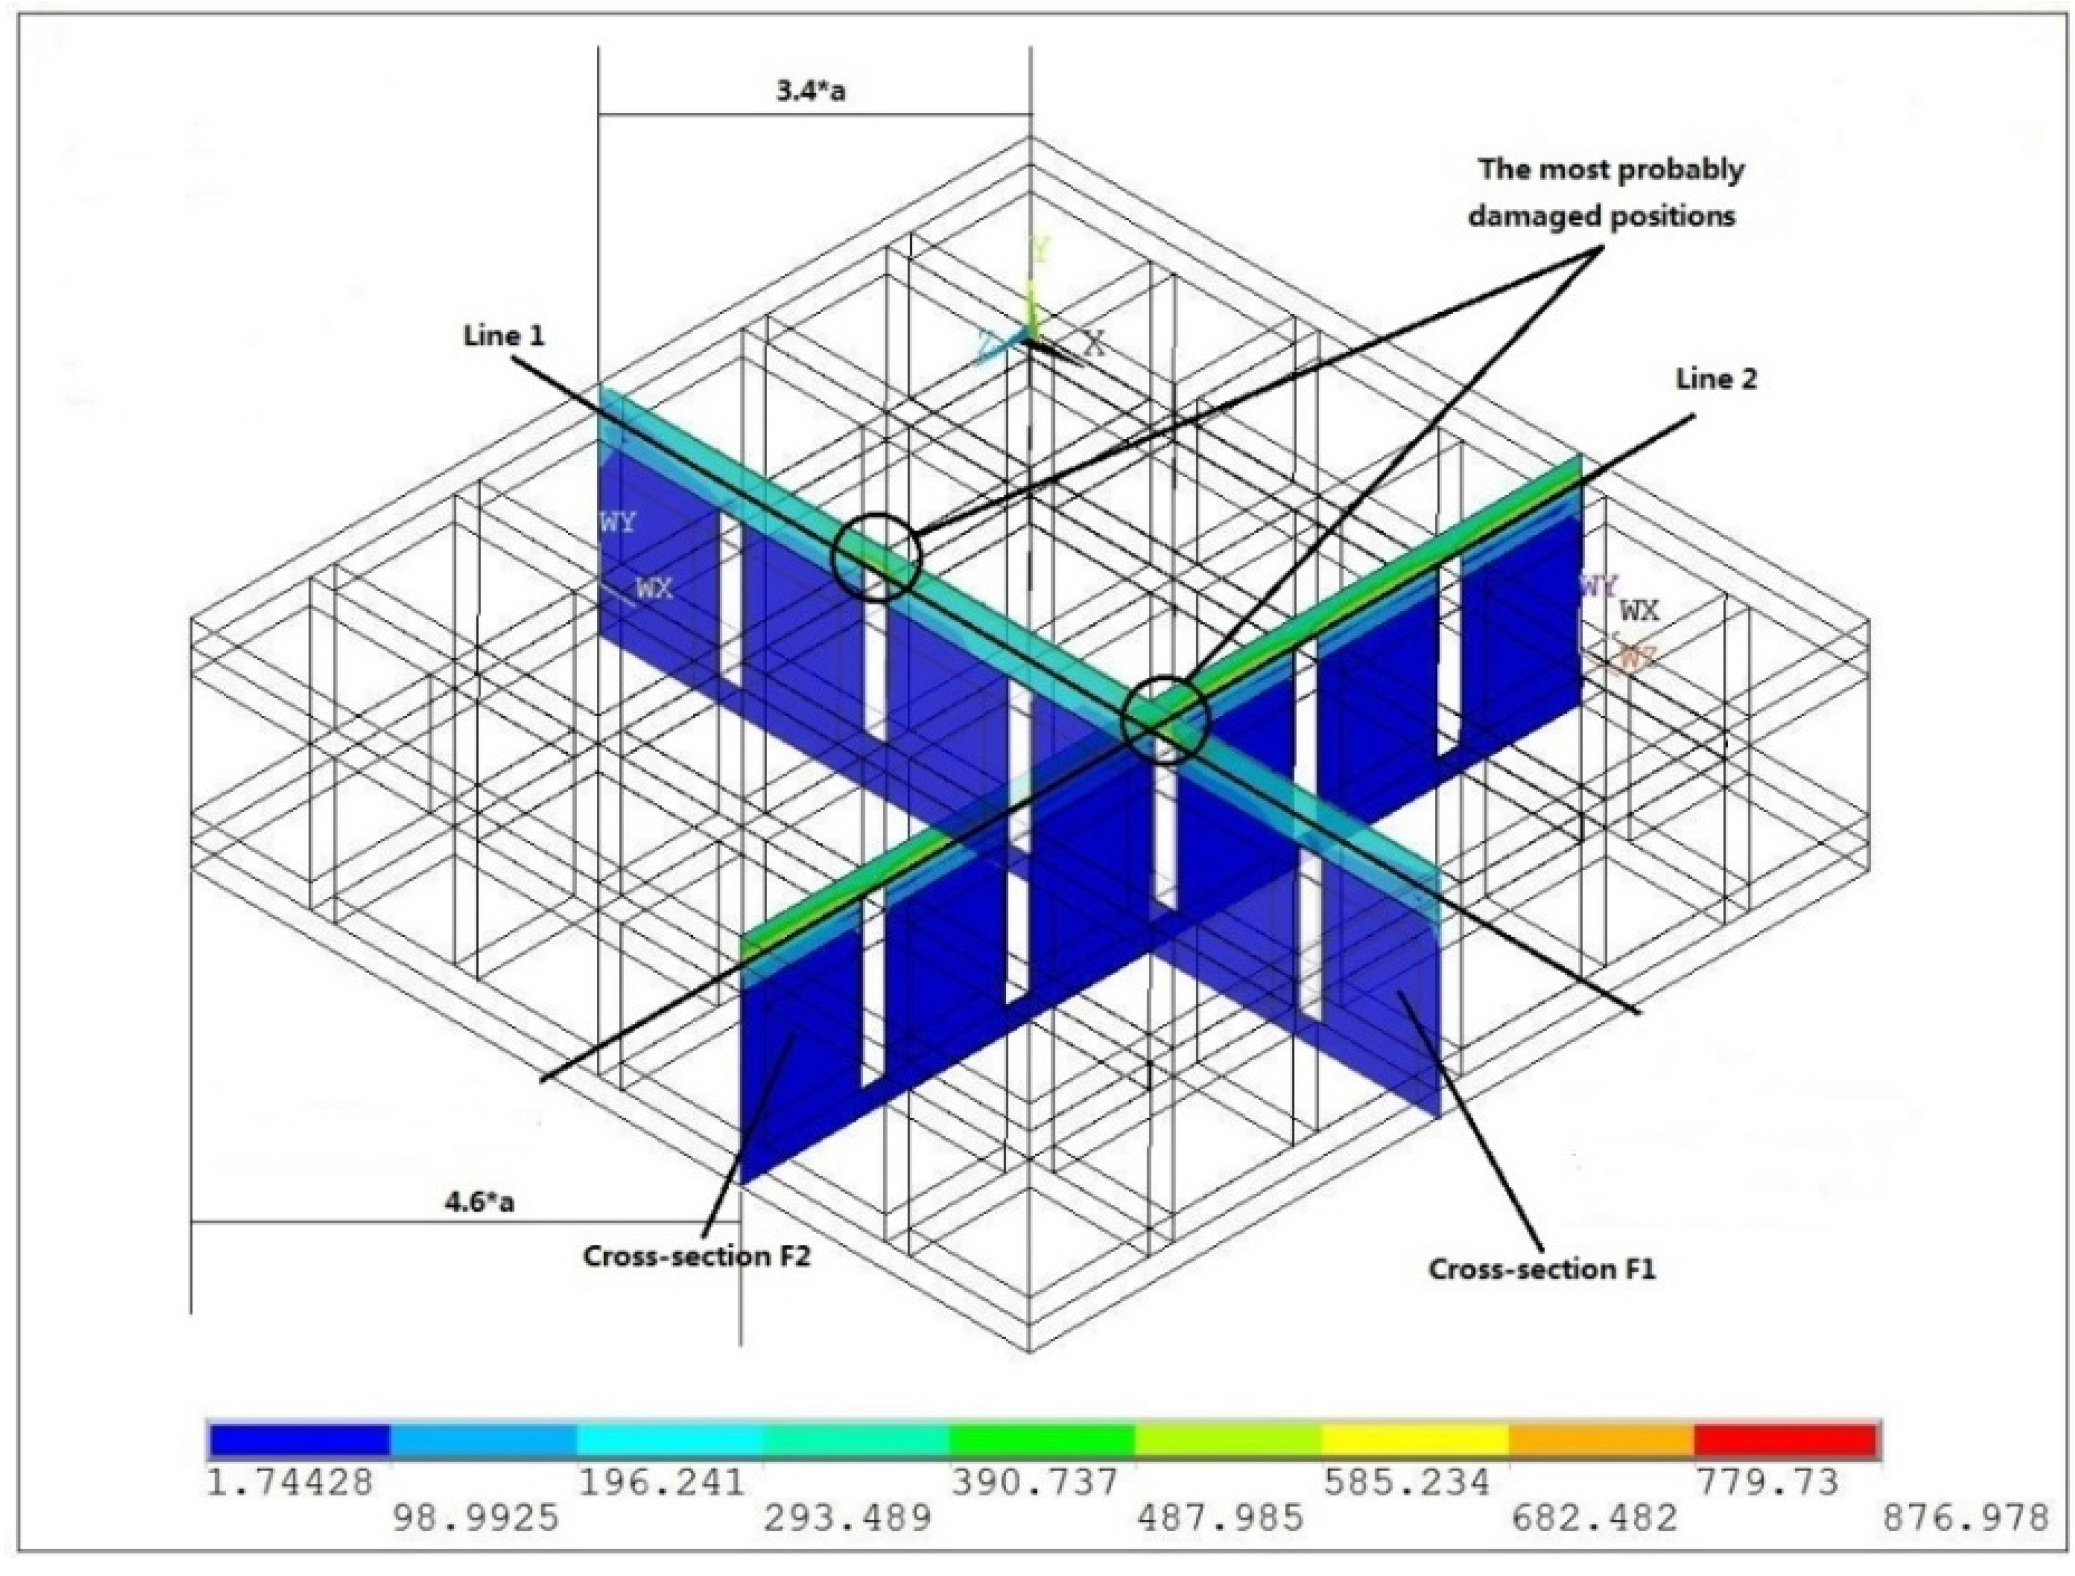
3.3. Thermal Stress Distribution on the Horizontal and Longitudinal Cross-Section

The detailed positions of Lines 1 and 2, which will serve as reference lines for the thermal stress distribution on horizontal and longitudinal directions, are shown in Figure 5 and Figure 6, and the results are shown in Figure 5, Figure 7 and Figure 8. As clearly shown in Figure 5 and Figure 7, the high thermal stress region of the TEG model is mainly distributed in the upper part of the model. This is reasonable, since the temperature near the hot end is much higher, thus intensive local deformation will arouse severe thermal stress concentration. The phenomenon is typically reflected at the central parts of thermo-pins, where the mismatch of the deformations greatly enhances the possibility of material failure. To make the situation worse, the interface between different materials is often connected by metal alloy solder, which is more likely to be damaged. This agrees with the longitudinal distribution of copper sheets. The larger thermal conductivity of cooper sheets lowers the longitudinal temperature gradient of the TEG model, and as a result, the longitudinal stress is lowered.
In Figure 7, the highest thermal stresses in the F1 section for Uf = 100%, 50%, 30%, and 10% are 877, 910, 956, and 1054 MPa, respectively. The thermal stress for the last case is 67.3% higher than the first case, while the energy conversion efficiency difference for the two cases is quite small. In Figure 8, the highest thermal stress in the F2 section for Uf = 100%, 50%, 30%, and 10% are 877, 910, 956, and 1054 MPa, respectively. A trend similar to Figure 6 is presented. It is obvious that non-uniform heat flux distributions weaken the reliability of the model while doing little good to improve the efficiency of the module. Measures should be taken to keep the concentration uniformity of the solar energy concentration system.
Figure 5. The position of cross-section F1, F2 and Line1, Line2 in the TEG model (unit of the legend: MPa for thermal stress).
Energies 08 12332 g005
Figure 6. Front view of the referenced thermoelectric power generator.
Energies 08 12332 g006
Figure 7. The thermal stress distribution on F1 cross-section at different heating powers and different heating uniformities (Unit: MPa). (a) P = 13.23 W Uf = 100%; (b) P = 13.23 W Uf = 50%; (c) P = 13.23 W Uf = 30%; (d) P = 13.23 W Uf = 10%.
Energies 08 12332 g007aEnergies 08 12332 g007b
Figure 8. The evolution of thermal stress distribution on F2 at different heating powers and different heating uniformities (Unit: MPa). (a) P = 13.23 W Uf = 100%; (b) P = 13.23 W Uf = 50%; (c) P = 13.23 W Uf = 30%; (d) P = 13.23 W Uf = 10%.
Energies 08 12332 g008
From Figure 5, Figure 7 and Figure 8, we can conclude that the concentration of thermal stress is more likely to happen where the shorter edge of the copper sheet connects with the ceramic plates. As for the TEG model, the most fragile parts are the regions shown in Figure 5. Therefore, it’s quite necessary to increase the strength of the material or to alleviate the thermal stress magnitude at these regions.

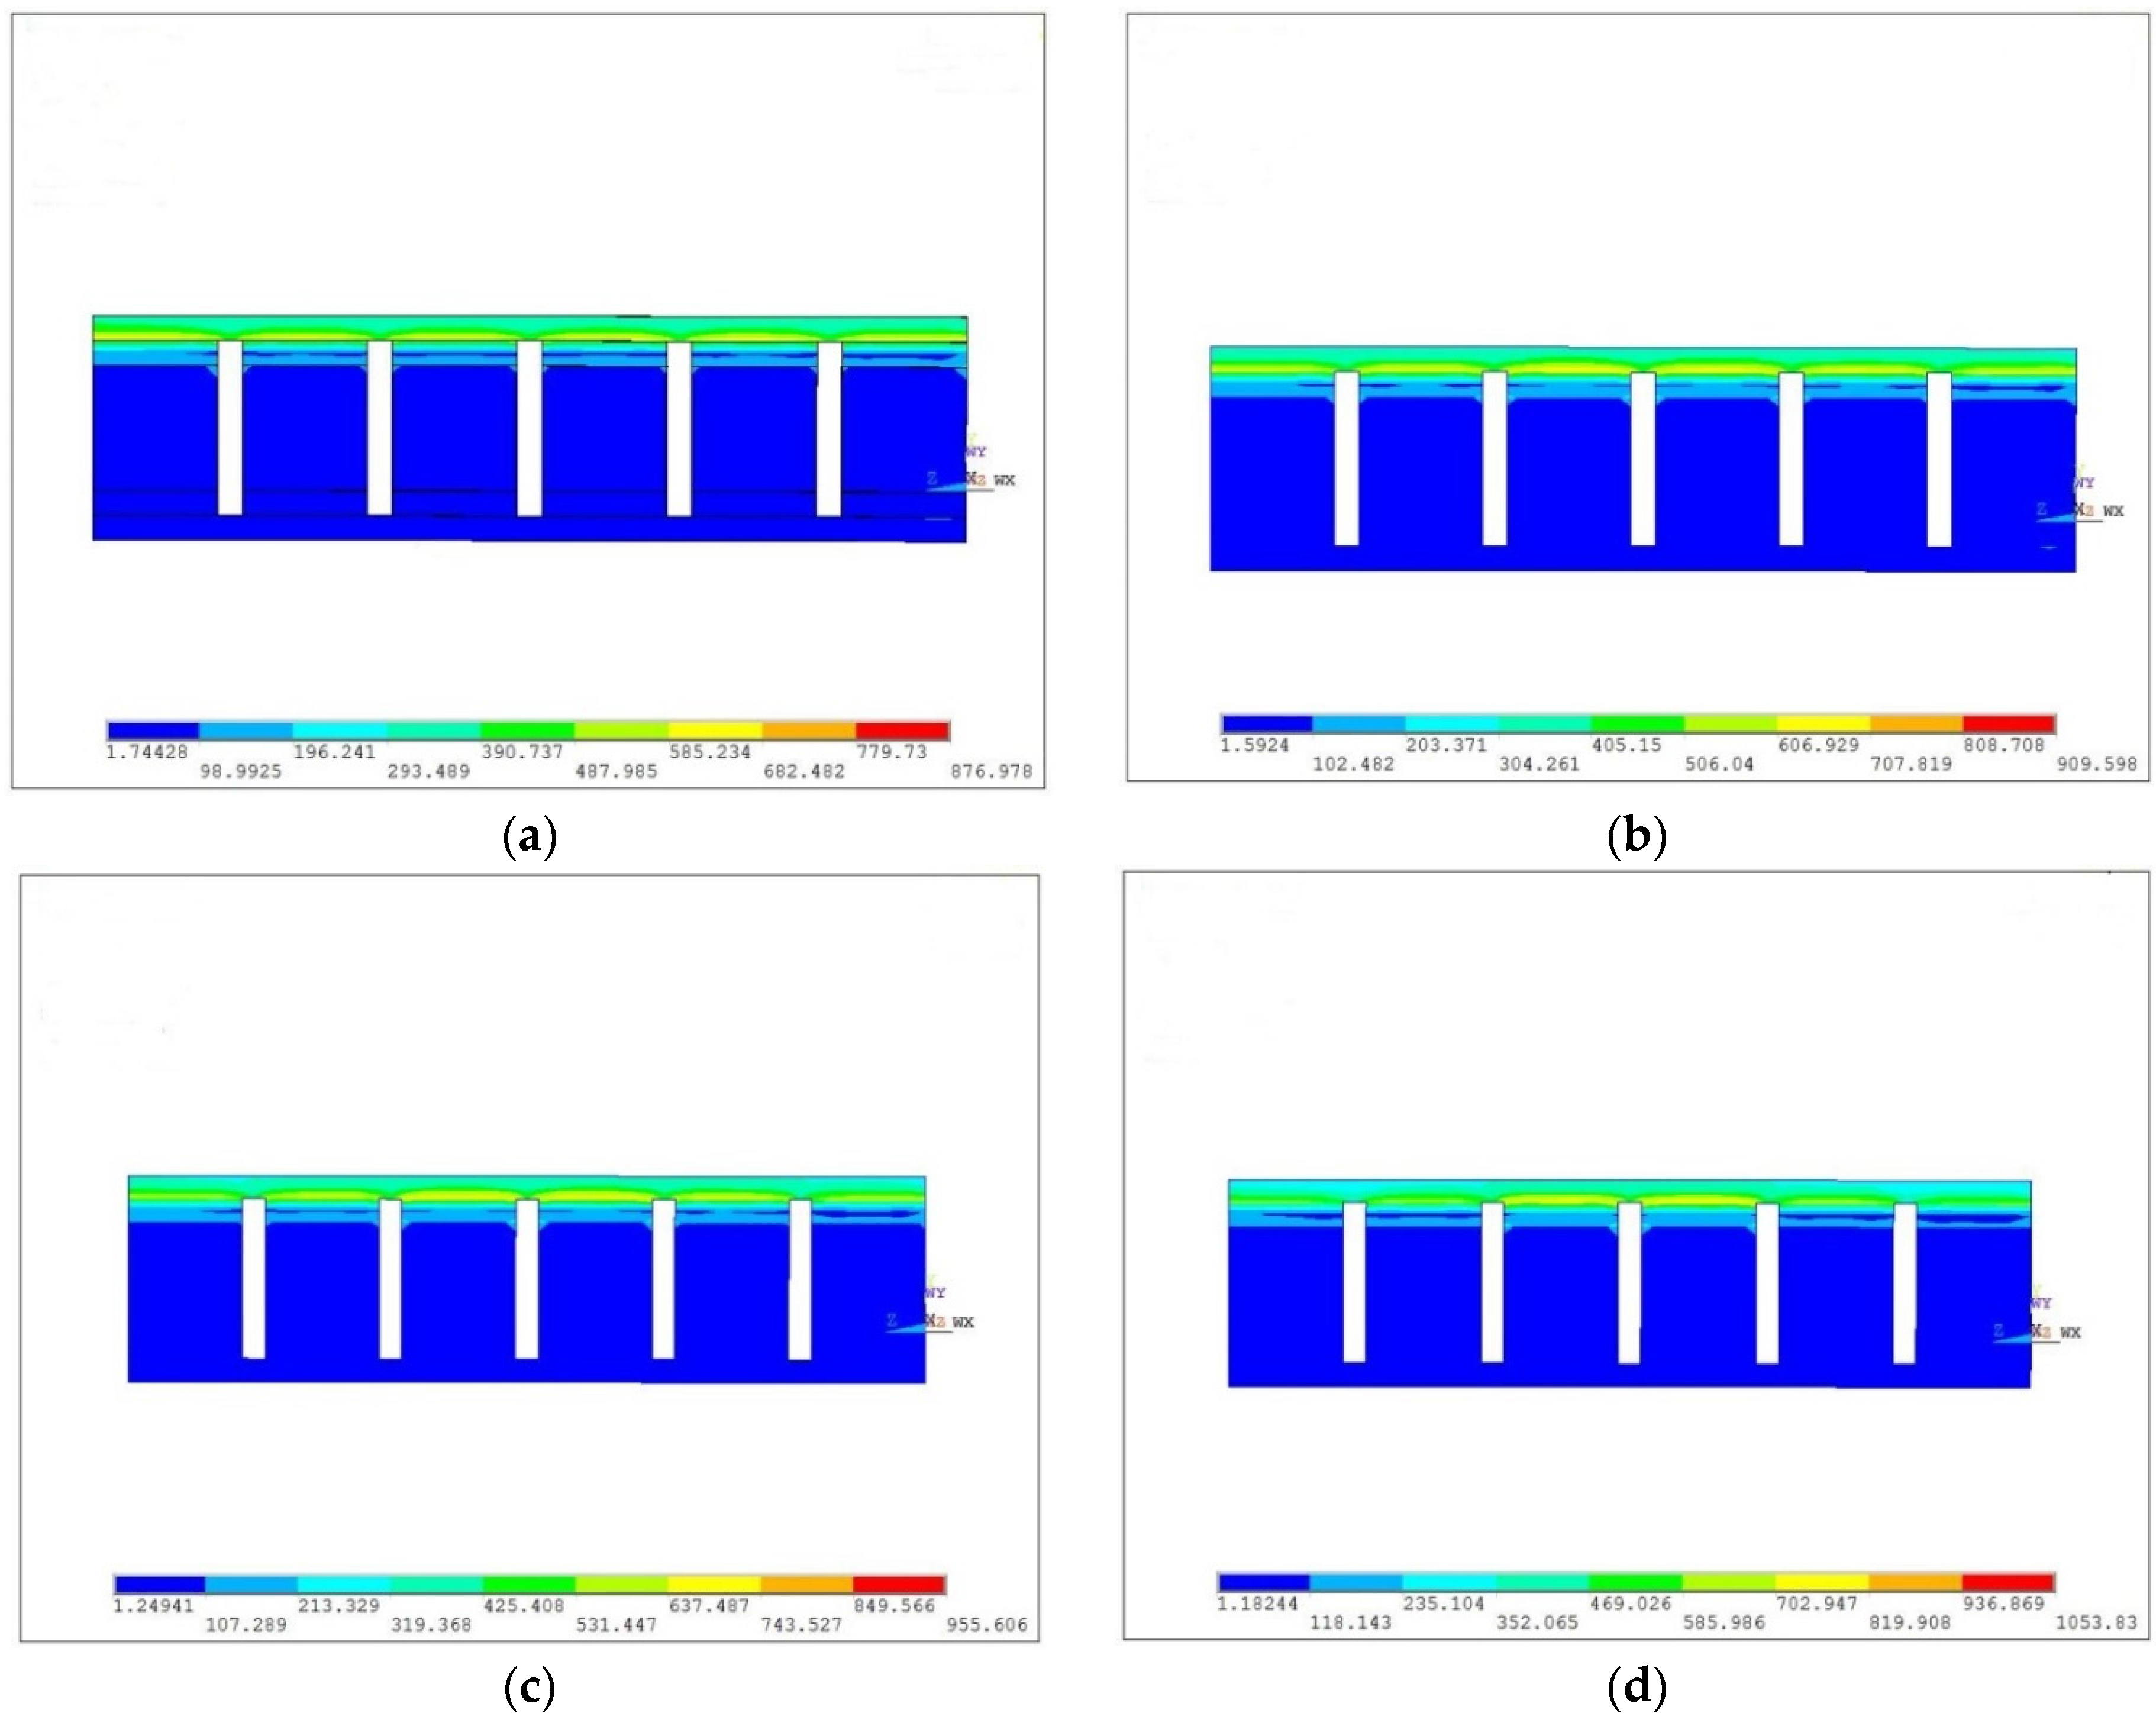
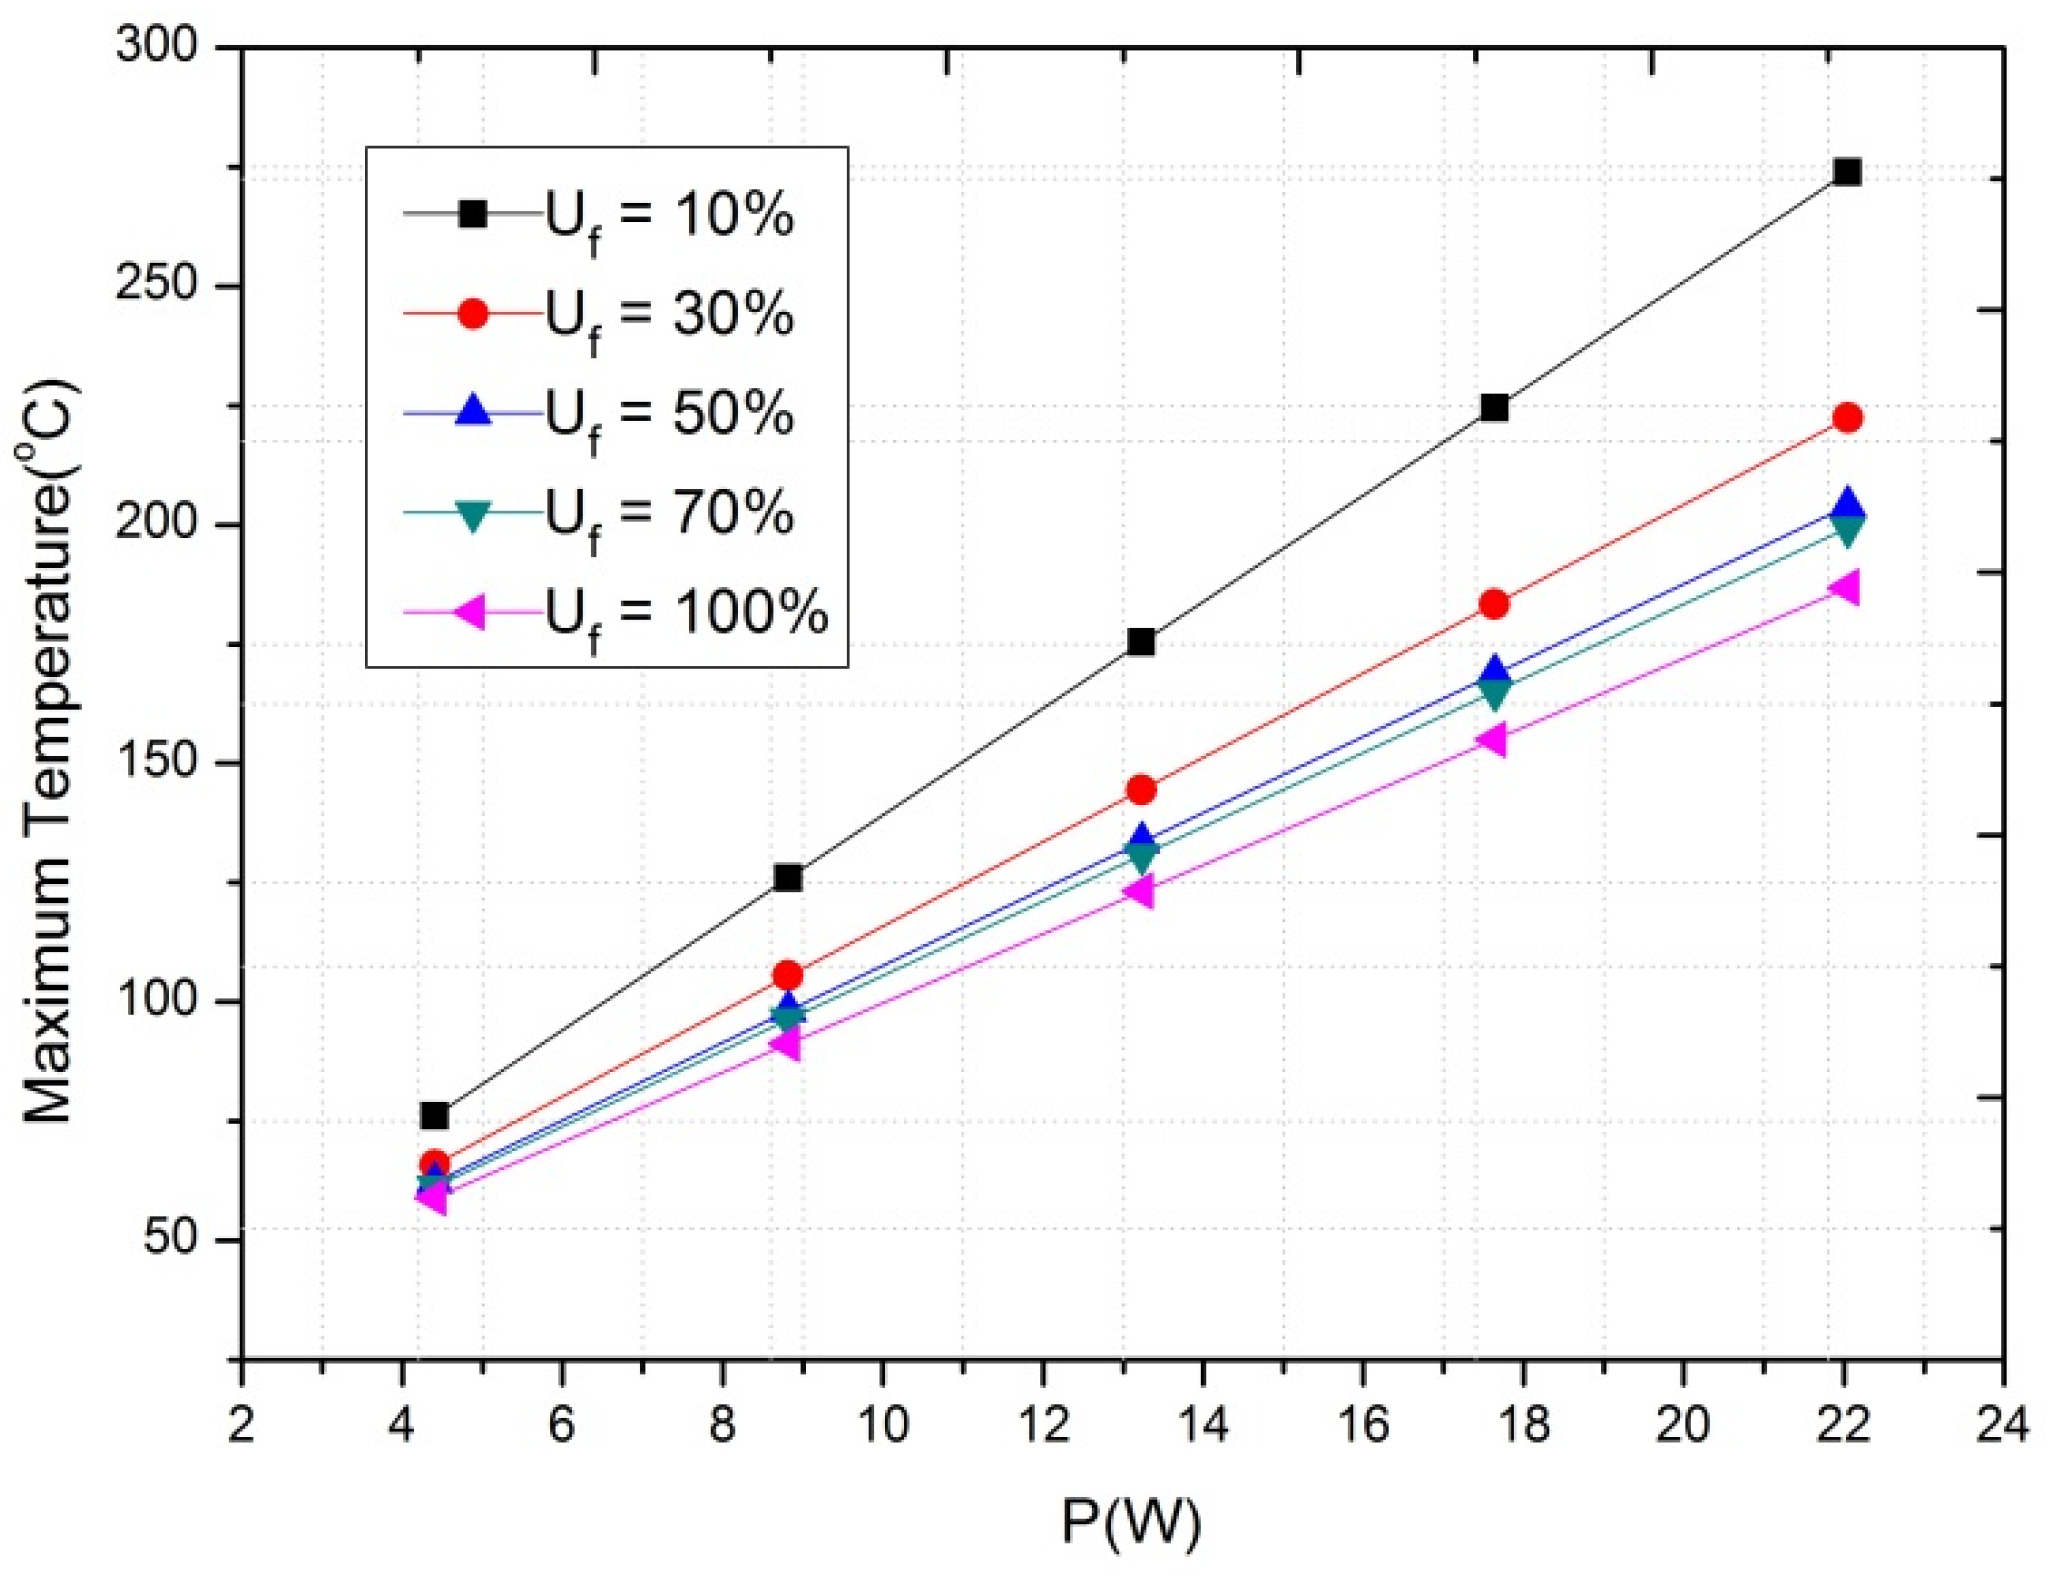
3.4. The Effect of Heating Power on Temperature and Thermal Stress

As shown in Figure 9 and Figure 10, there is a linear relationship between heating power and the highest temperature as well as maximum stress. As the heating power increases from 4.41 W to 22.05 W, the highest temperature increases from 56 °C to 187 °C, and the maximum stress increases from 420 GPa to 1330 MPa (Uf = 100%). The efficiency of the TEG is positively correlated with the temperature difference between the hot and cold ends. The high efficiency of the model is at the cost of TEG reliability.
Figure 9. The effect of heating power on the highest temperature of TEG.
Energies 08 12332 g009
Figure 10. The effect of heating power on the thermal stress of TEG.
Energies 08 12332 g010

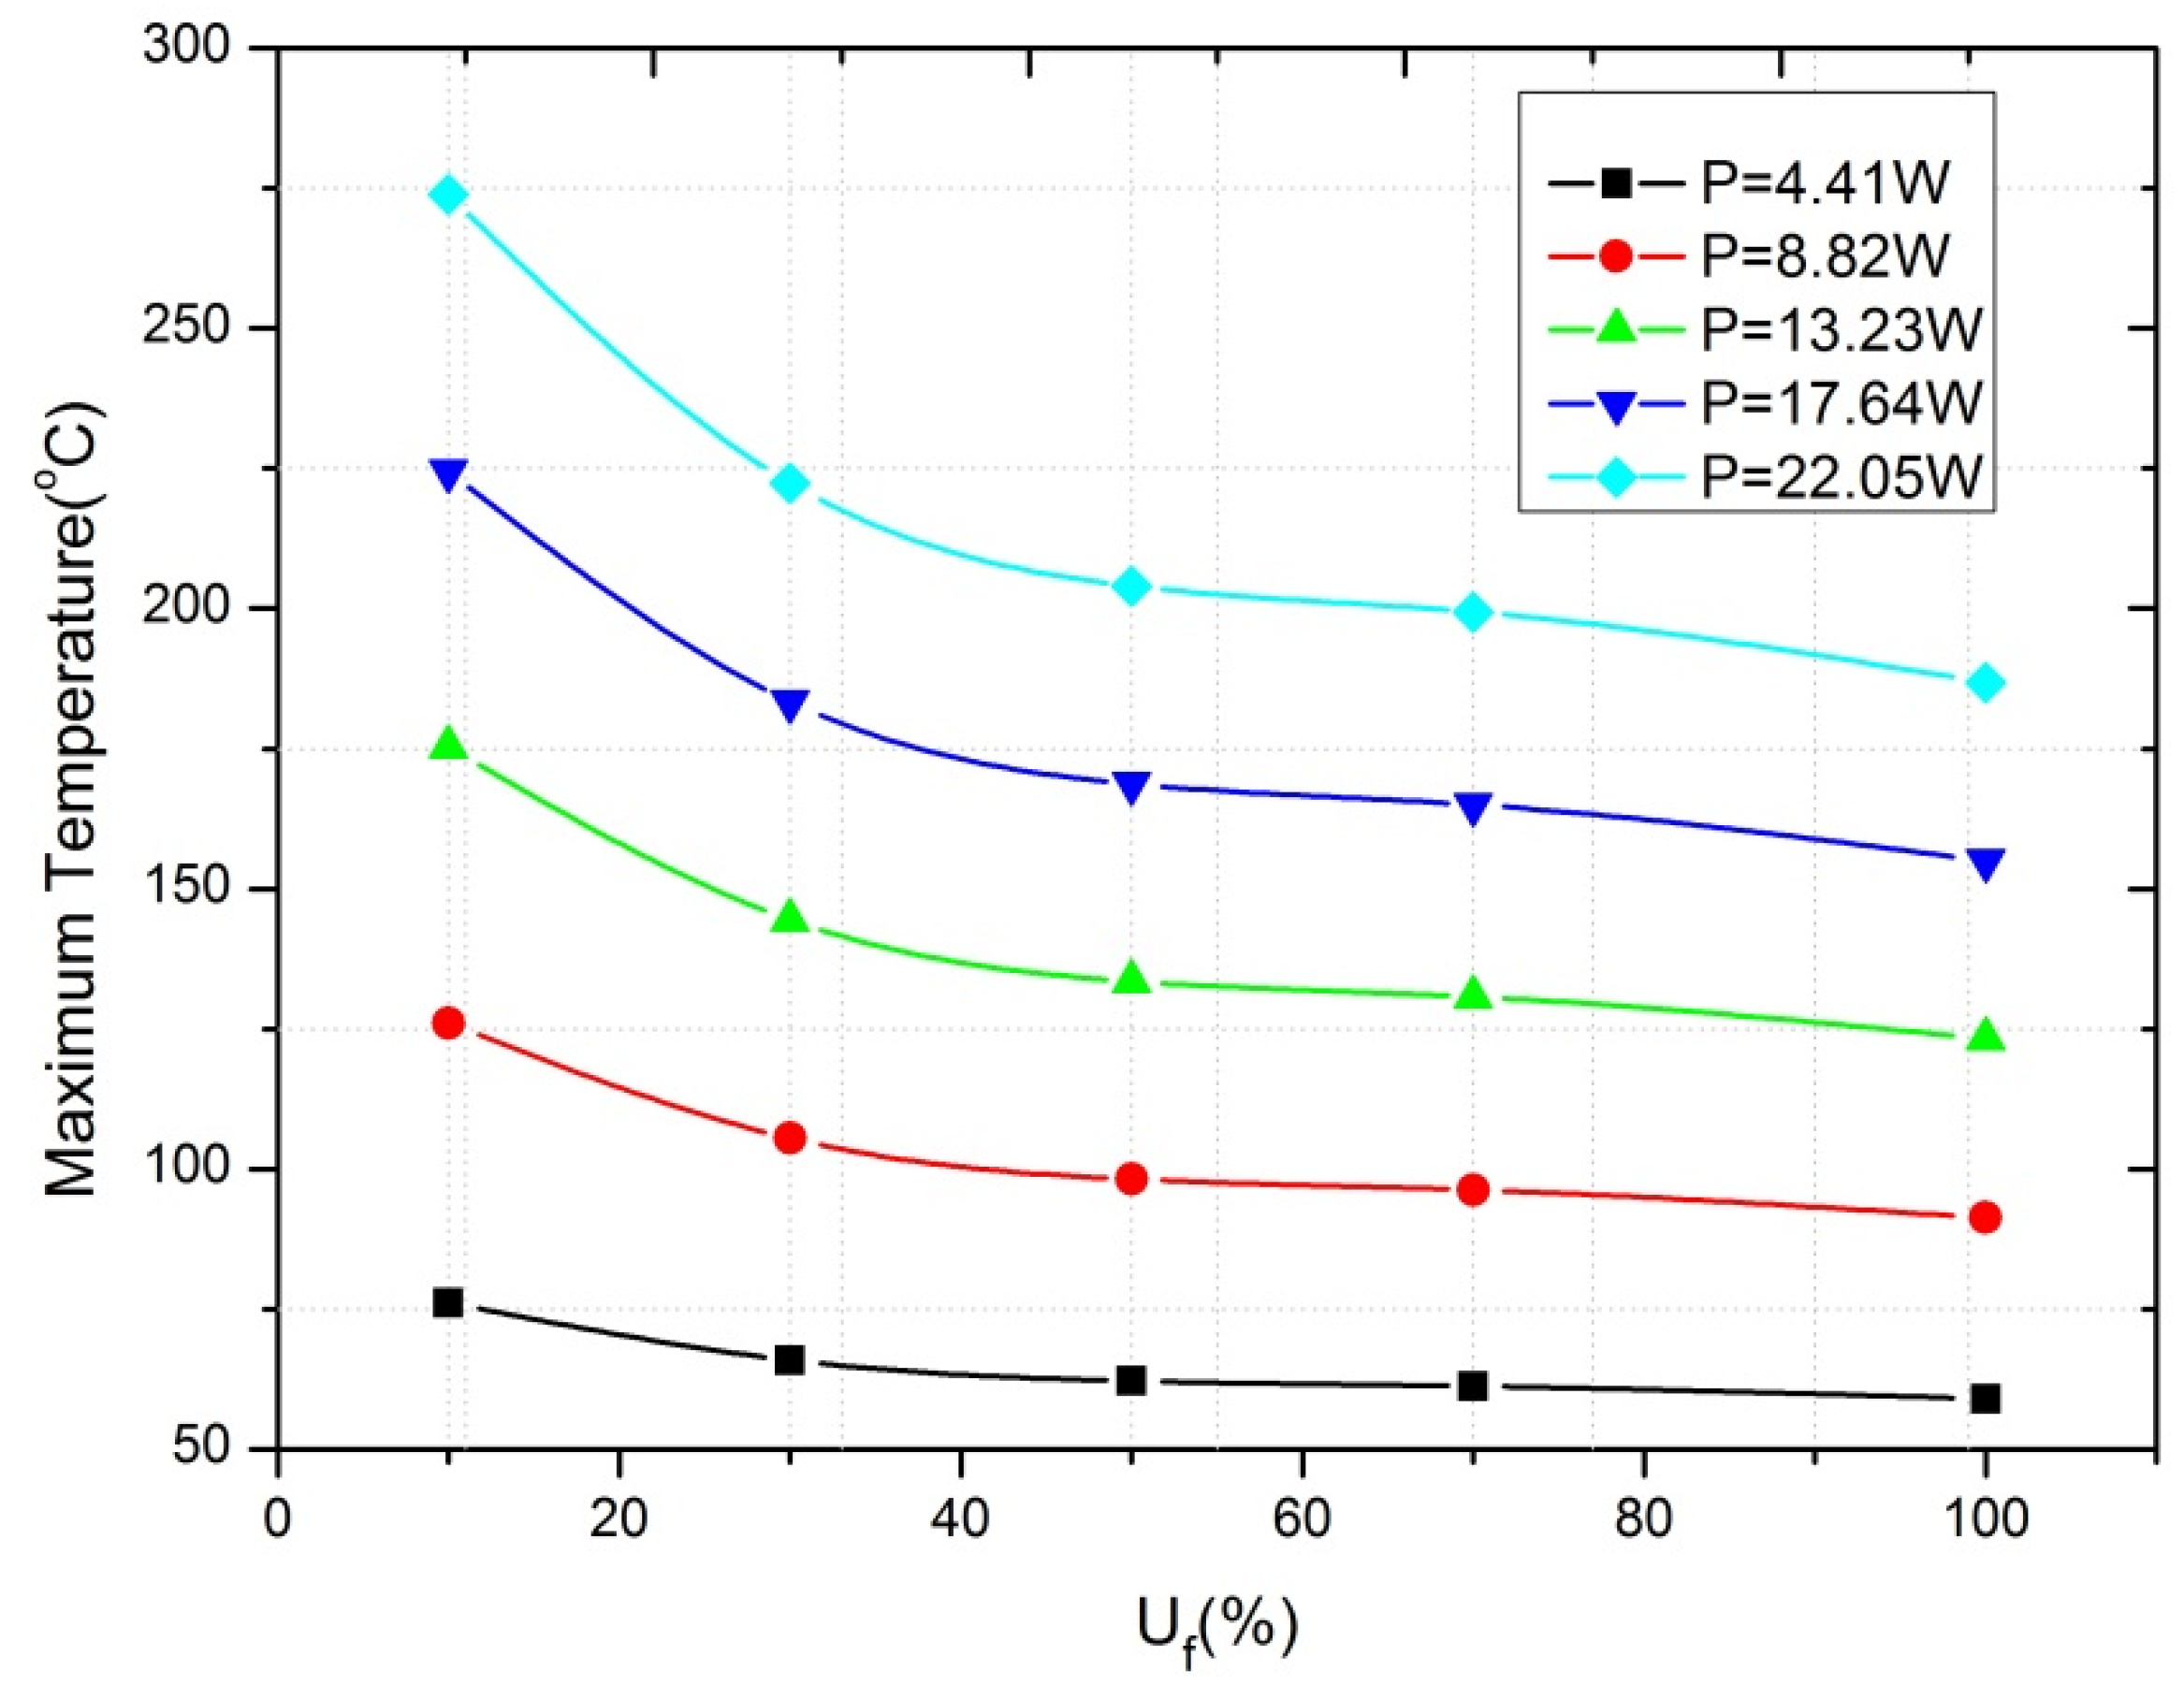
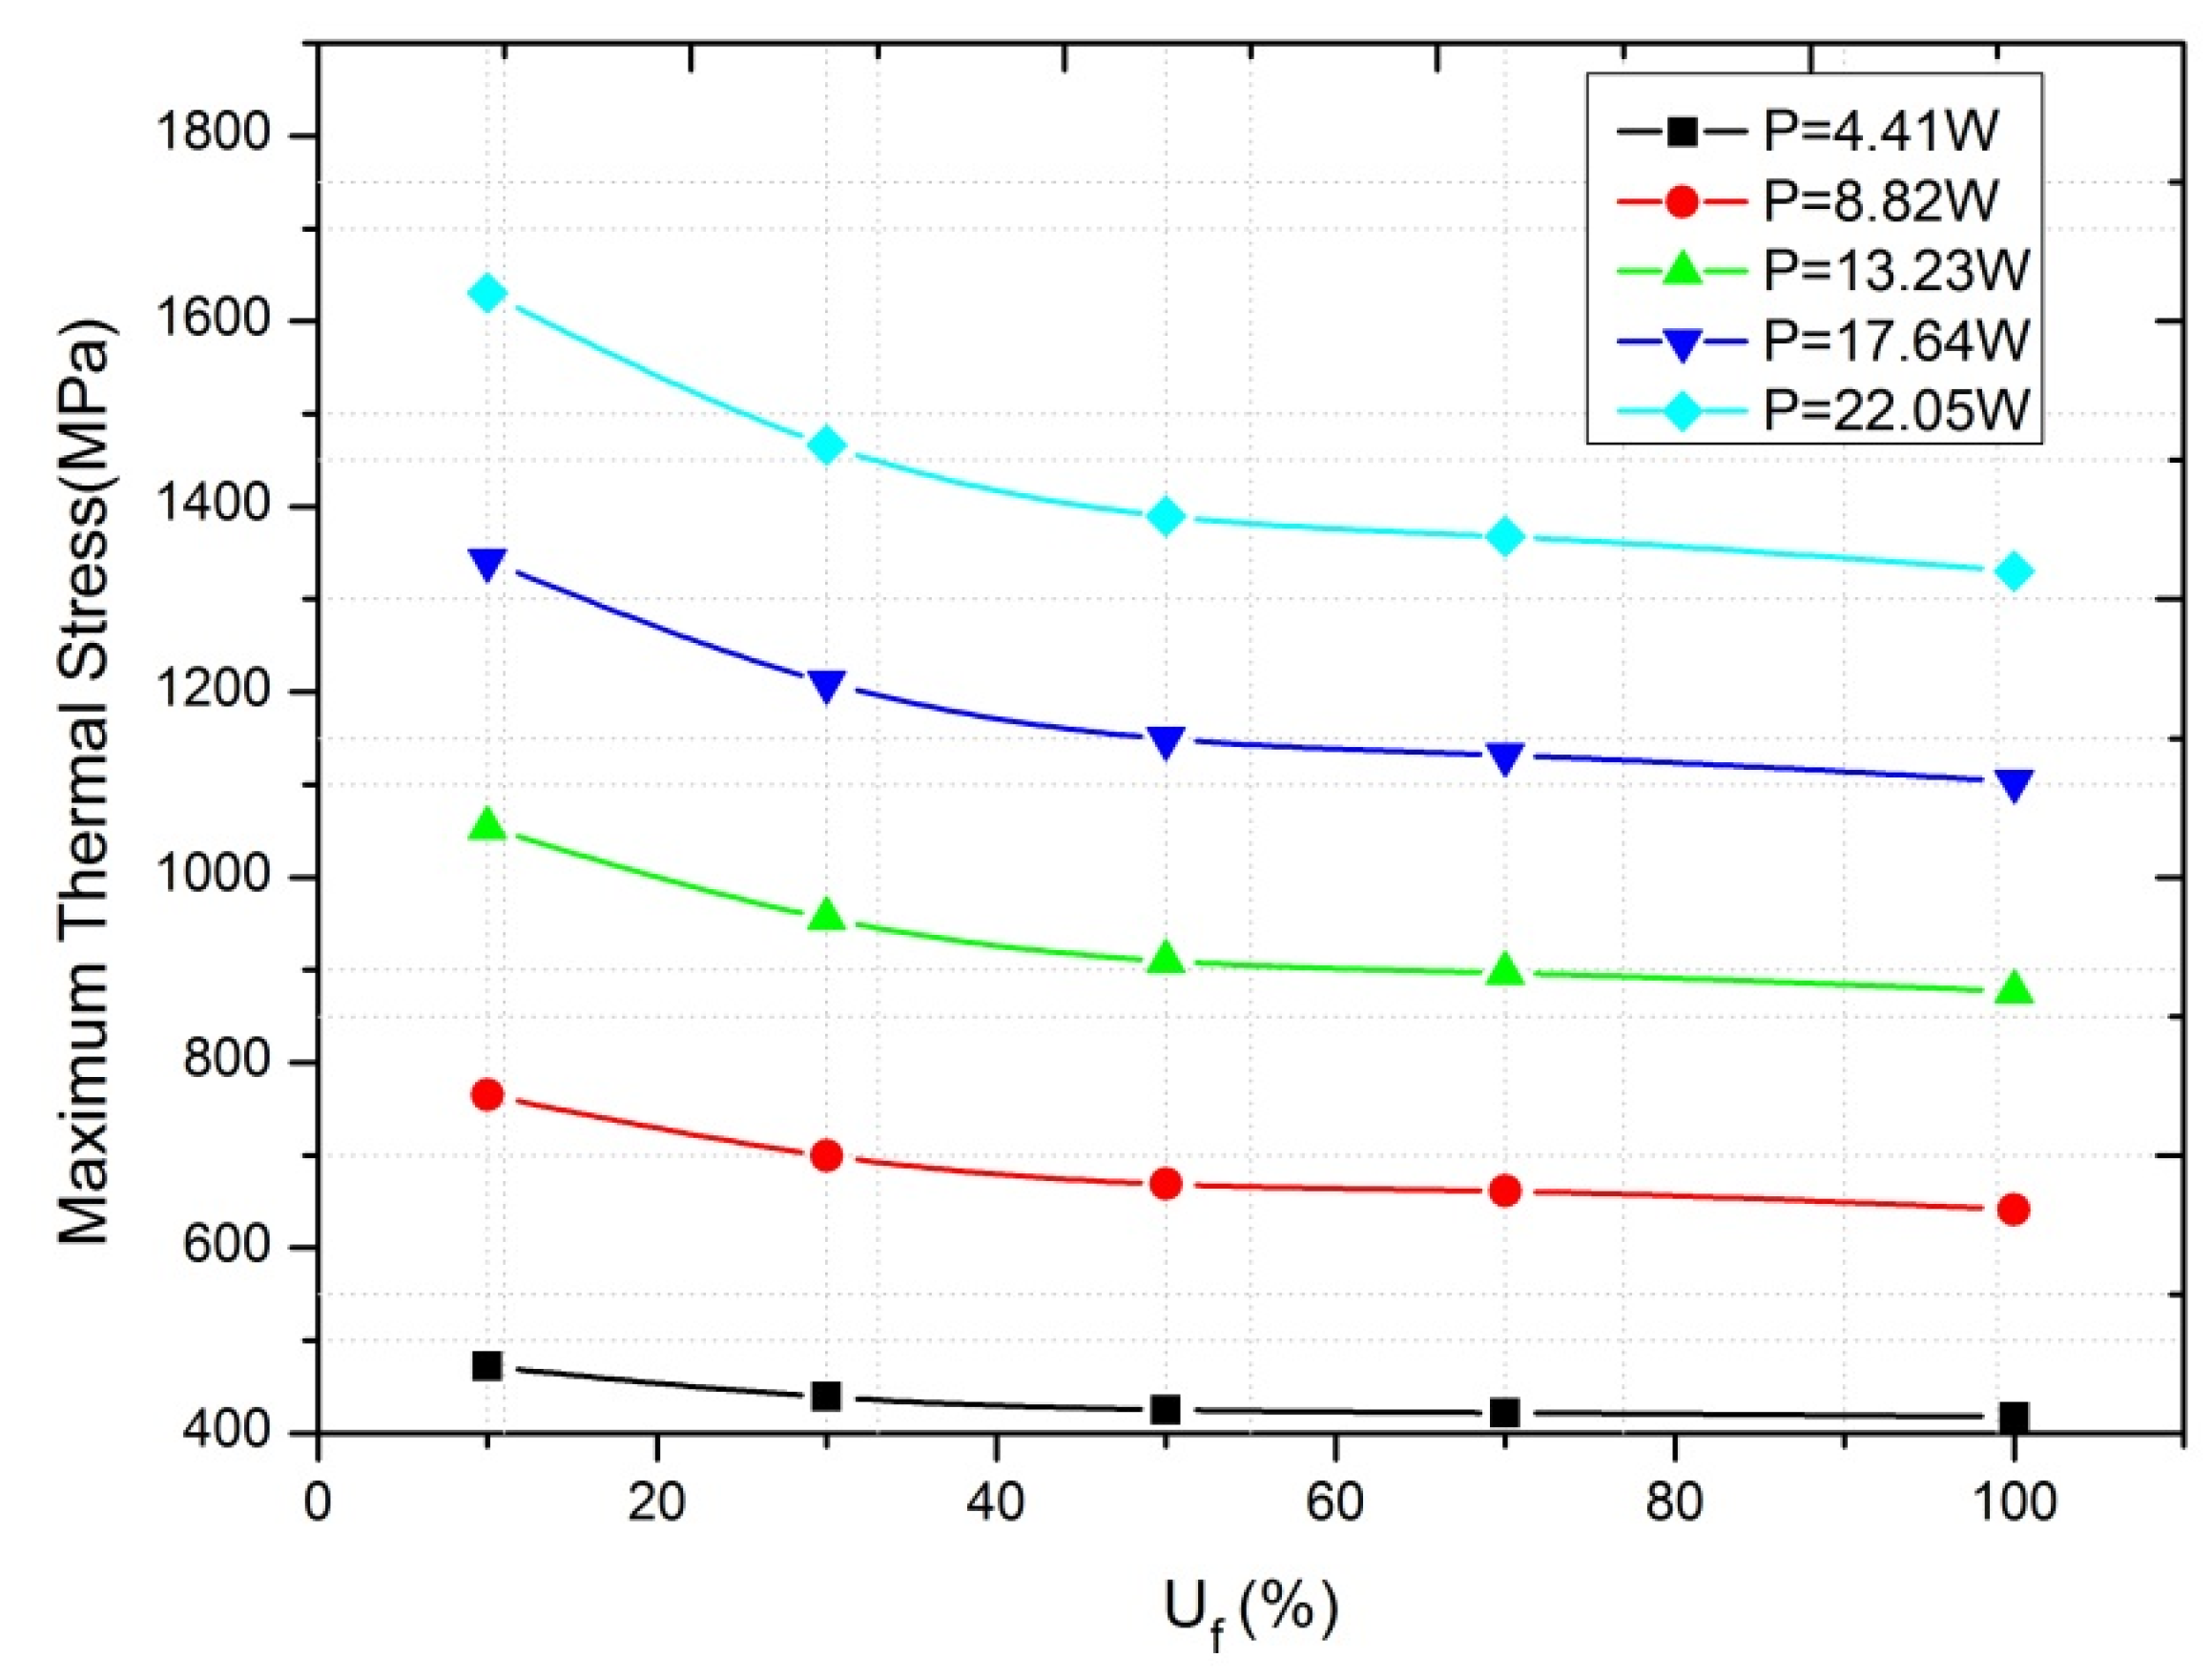
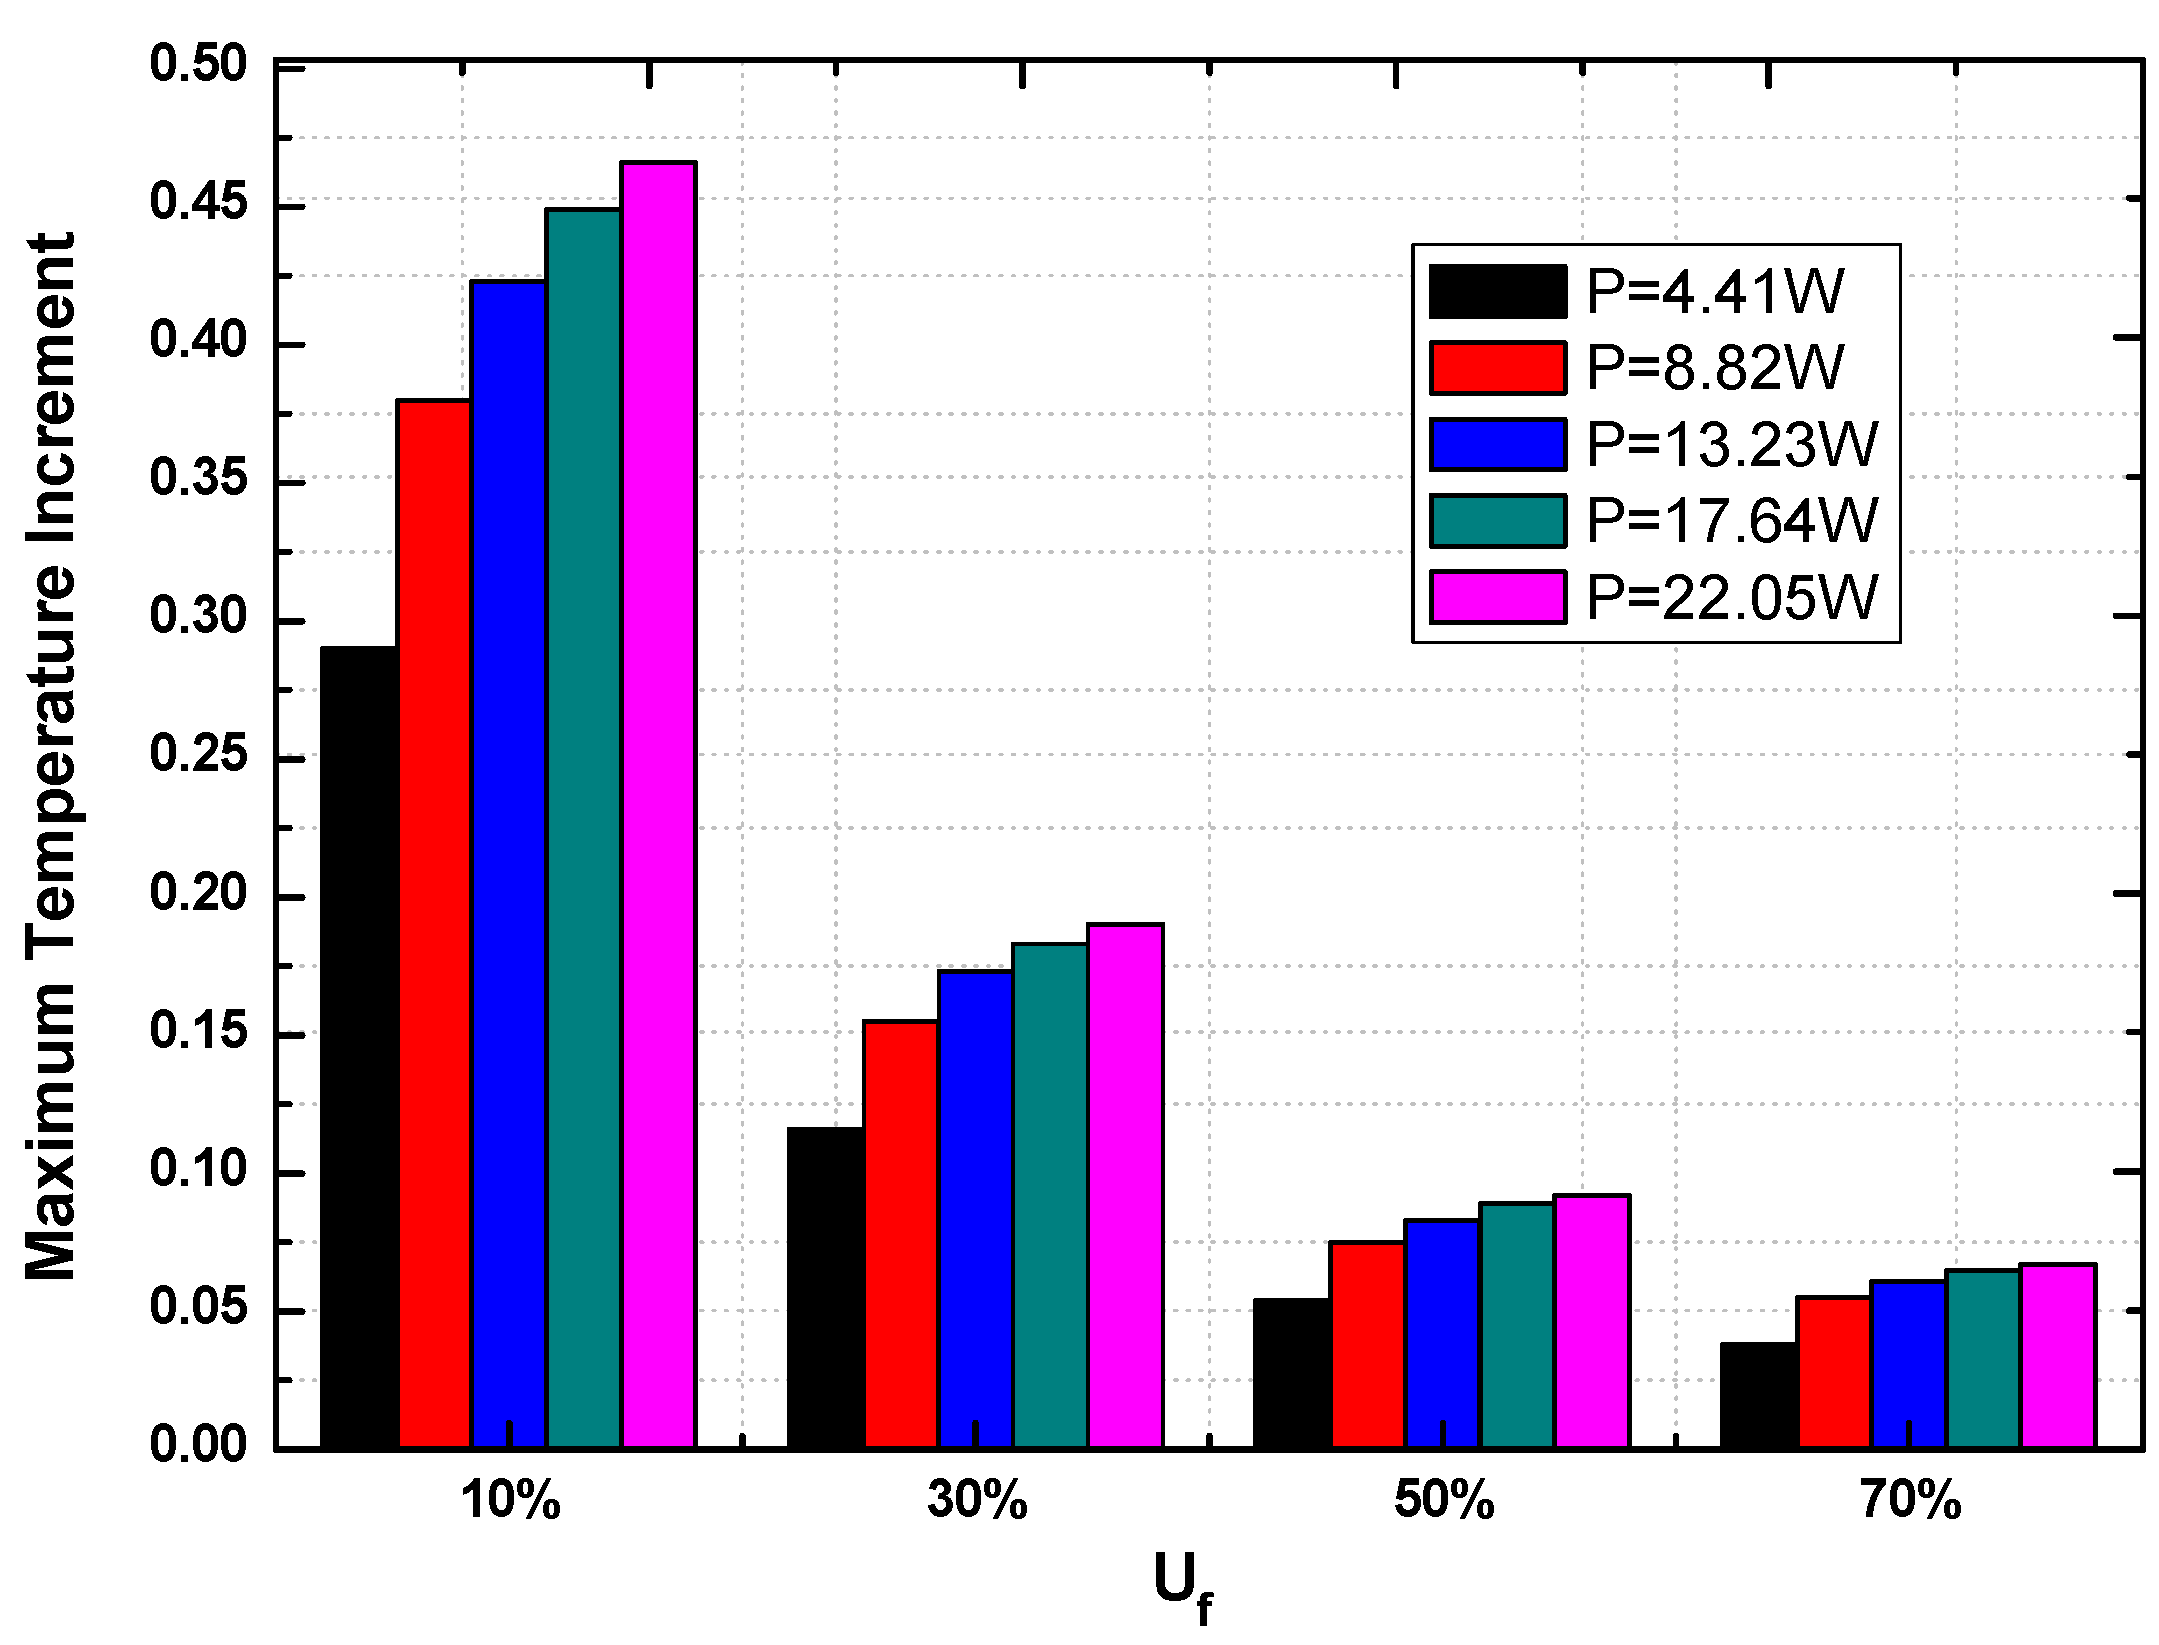
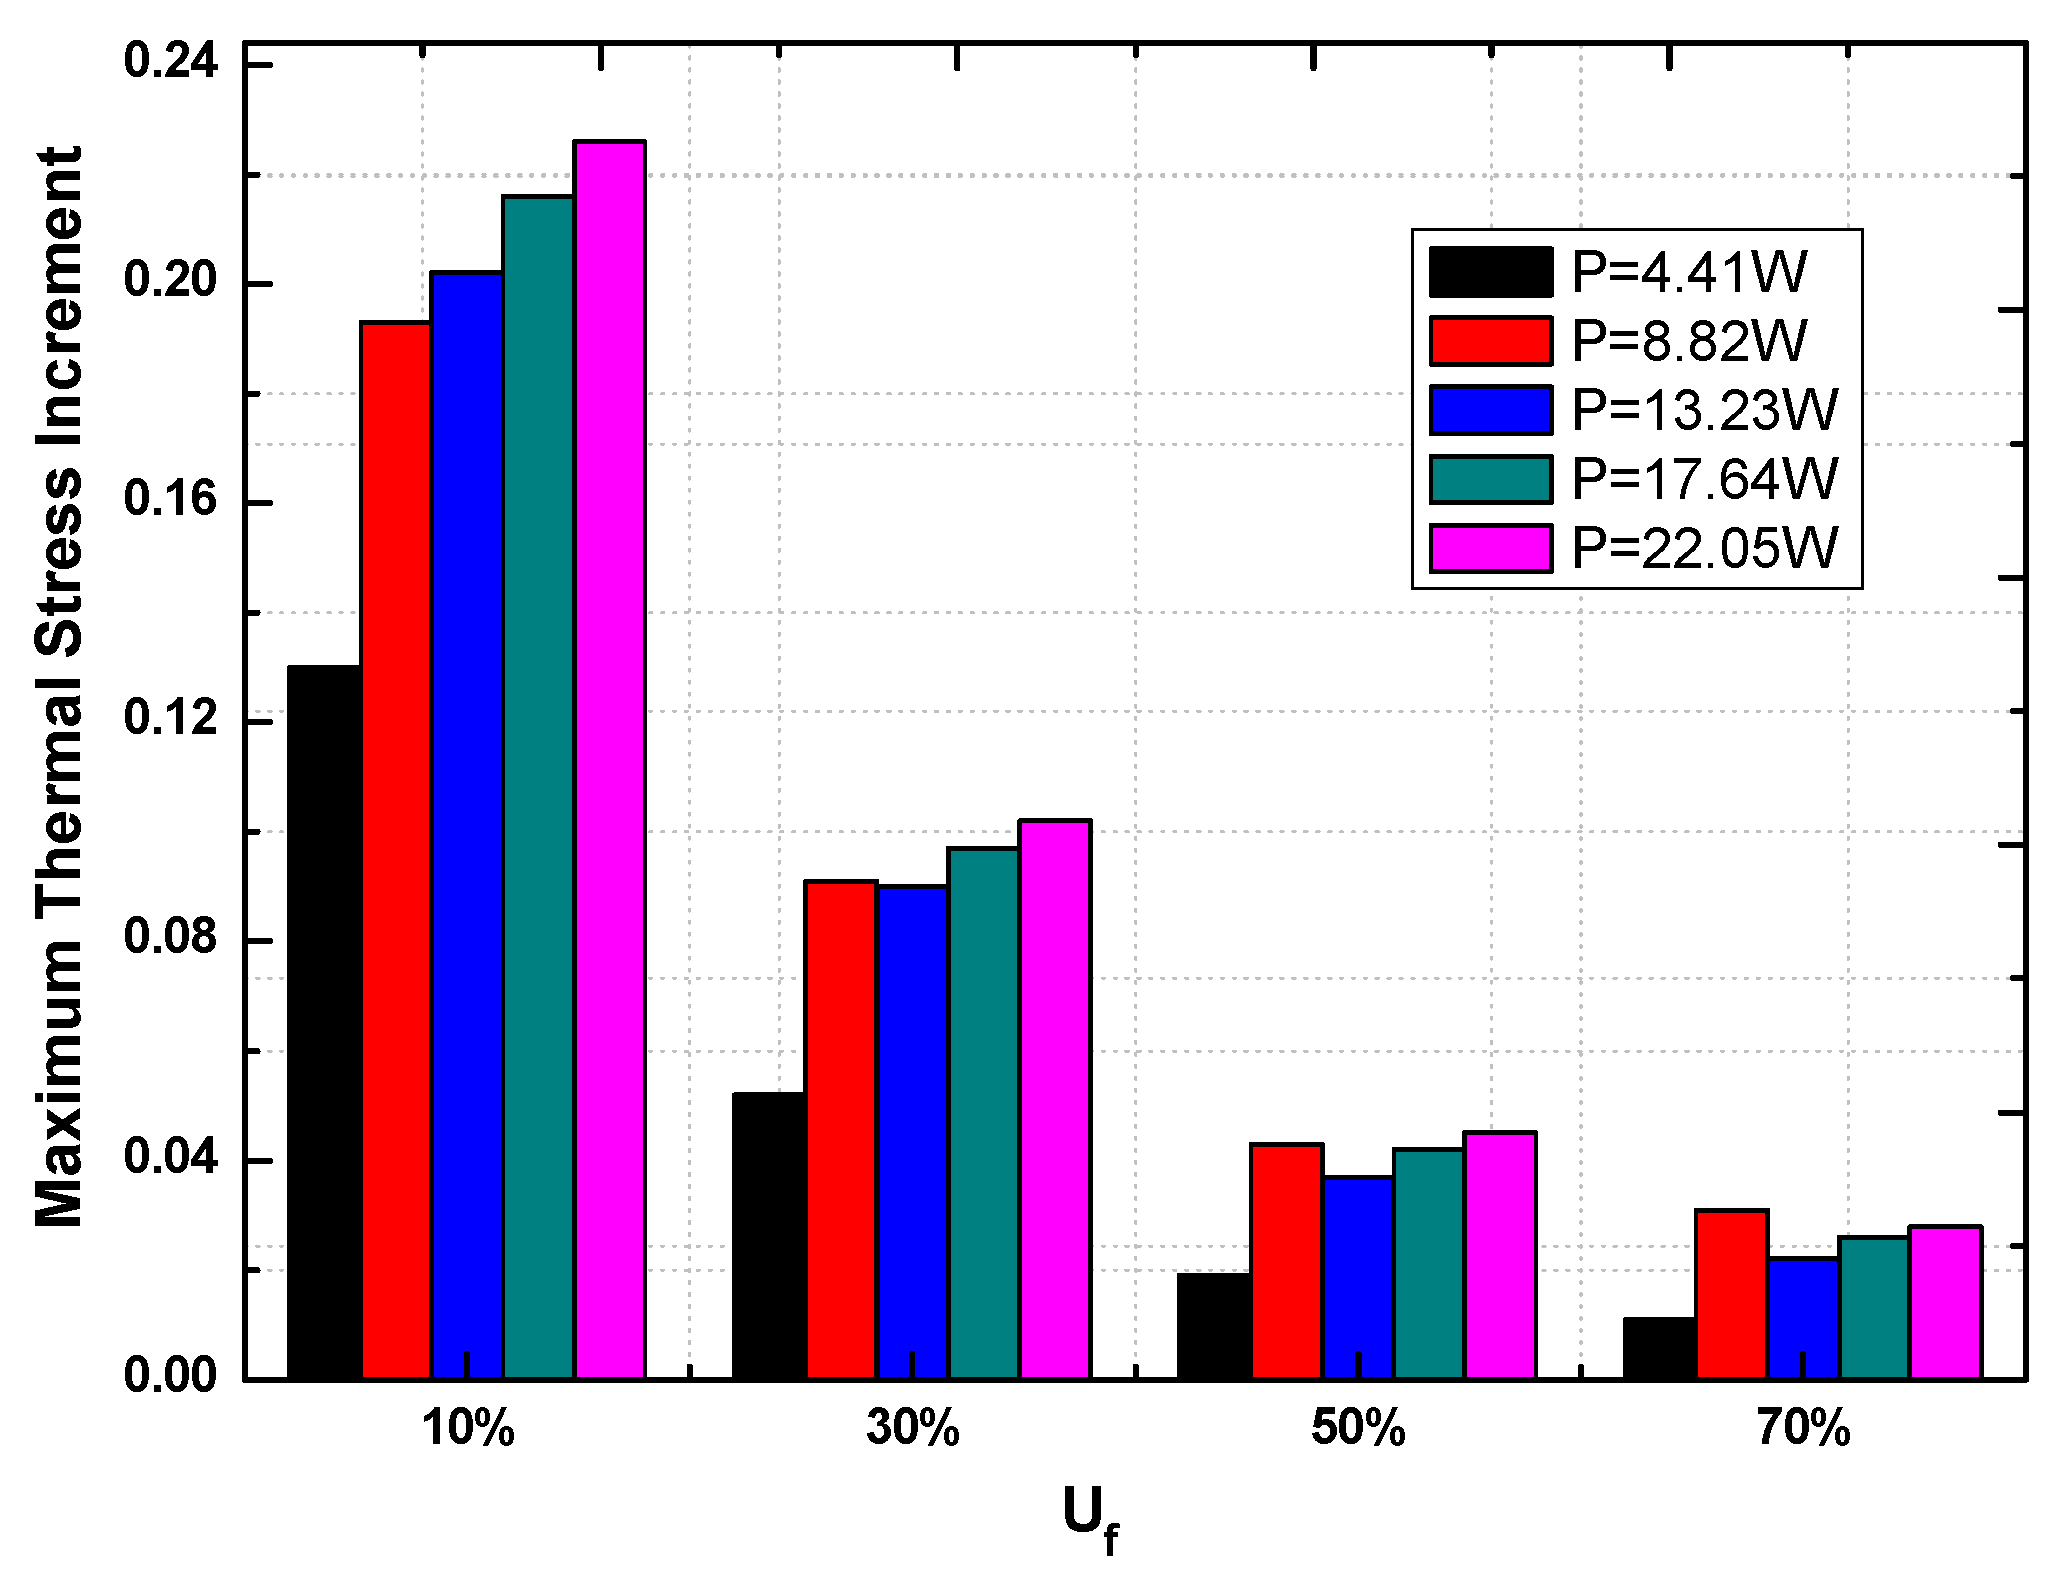
3.5. The Effect of Heating Uniformity on Temperature and Thermal Stress

From Figure 11 and Figure 12, we can see that as heating uniformity decreases from 100% to 10%, the highest temperature increases from 59 °C to 76 °C when the heating power is 4.41 W; the corresponding maximum stress increases from 418 MPa to 472 MPa; the highest temperature and the absolute value of the slope of the maximum stress curve increases as the heating uniformity decreases. When the Uf is smaller than 50%, there is a dramatic change in the absolute value of the curve slope, indicating a significant change in the highest temperature and maximum stress. When the Uf is larger than 50%, however, the absolute values of the curves change more slightly. The same trend is found for maximum thermal stress. Lower uniformity leads to higher heat flux density in parts of the model; as a result, the temperature gradient is further increased in some local regions. The thermo-pins are connected in series—a local damage will lead to the failure of the whole device. Since the heat non-uniformity brings higher thermal stresses while bringing few benefits to the system, the non-uniform heat flux distribution should try to be avoided in future designs. There is still something to be keep in mind, however, that the maximum temperature and thermal stress in the model changes are quite small when Uf > 50%, a higher energy efficiency may be achieved without significantly reducing the reliability of the device.
Figure 11. The effect of heating uniformity on the maximum temperature of TEG.
Energies 08 12332 g011
Figure 12. The effect of heating uniformity on the maximum thermal stress of TEG.
Energies 08 12332 g012
Figure 13 and Figure 14 show the maximum increments of the highest temperature and maximum stress in varying conditions of heating uniformity. When the Uf is 70%, 50%, 30%, and 10%, the increment of the highest temperature is 6%, 9%, 20%, and 45%, respectively, and the increment of maximum stress is 3%, 5%, 10%, and 22%, respectively. In practice, when the heating uniformity is larger than 70%, it does not have a strong effect on the highest temperature and maximum stress (<6%), and the increment will not significantly influence the life-cycle of the device. It is important to keep the heat flux uniform in the hot end, but the requirement is not strict. Thus, the requirements for the design of the solar energy concentration device is not so rigorous.
Figure 13. The effect of heating uniformity on maximum temperature of TEG.
Energies 08 12332 g013
Figure 14. The effect of heating uniformity on the maximum thermal stress of TEG.
Energies 08 12332 g014

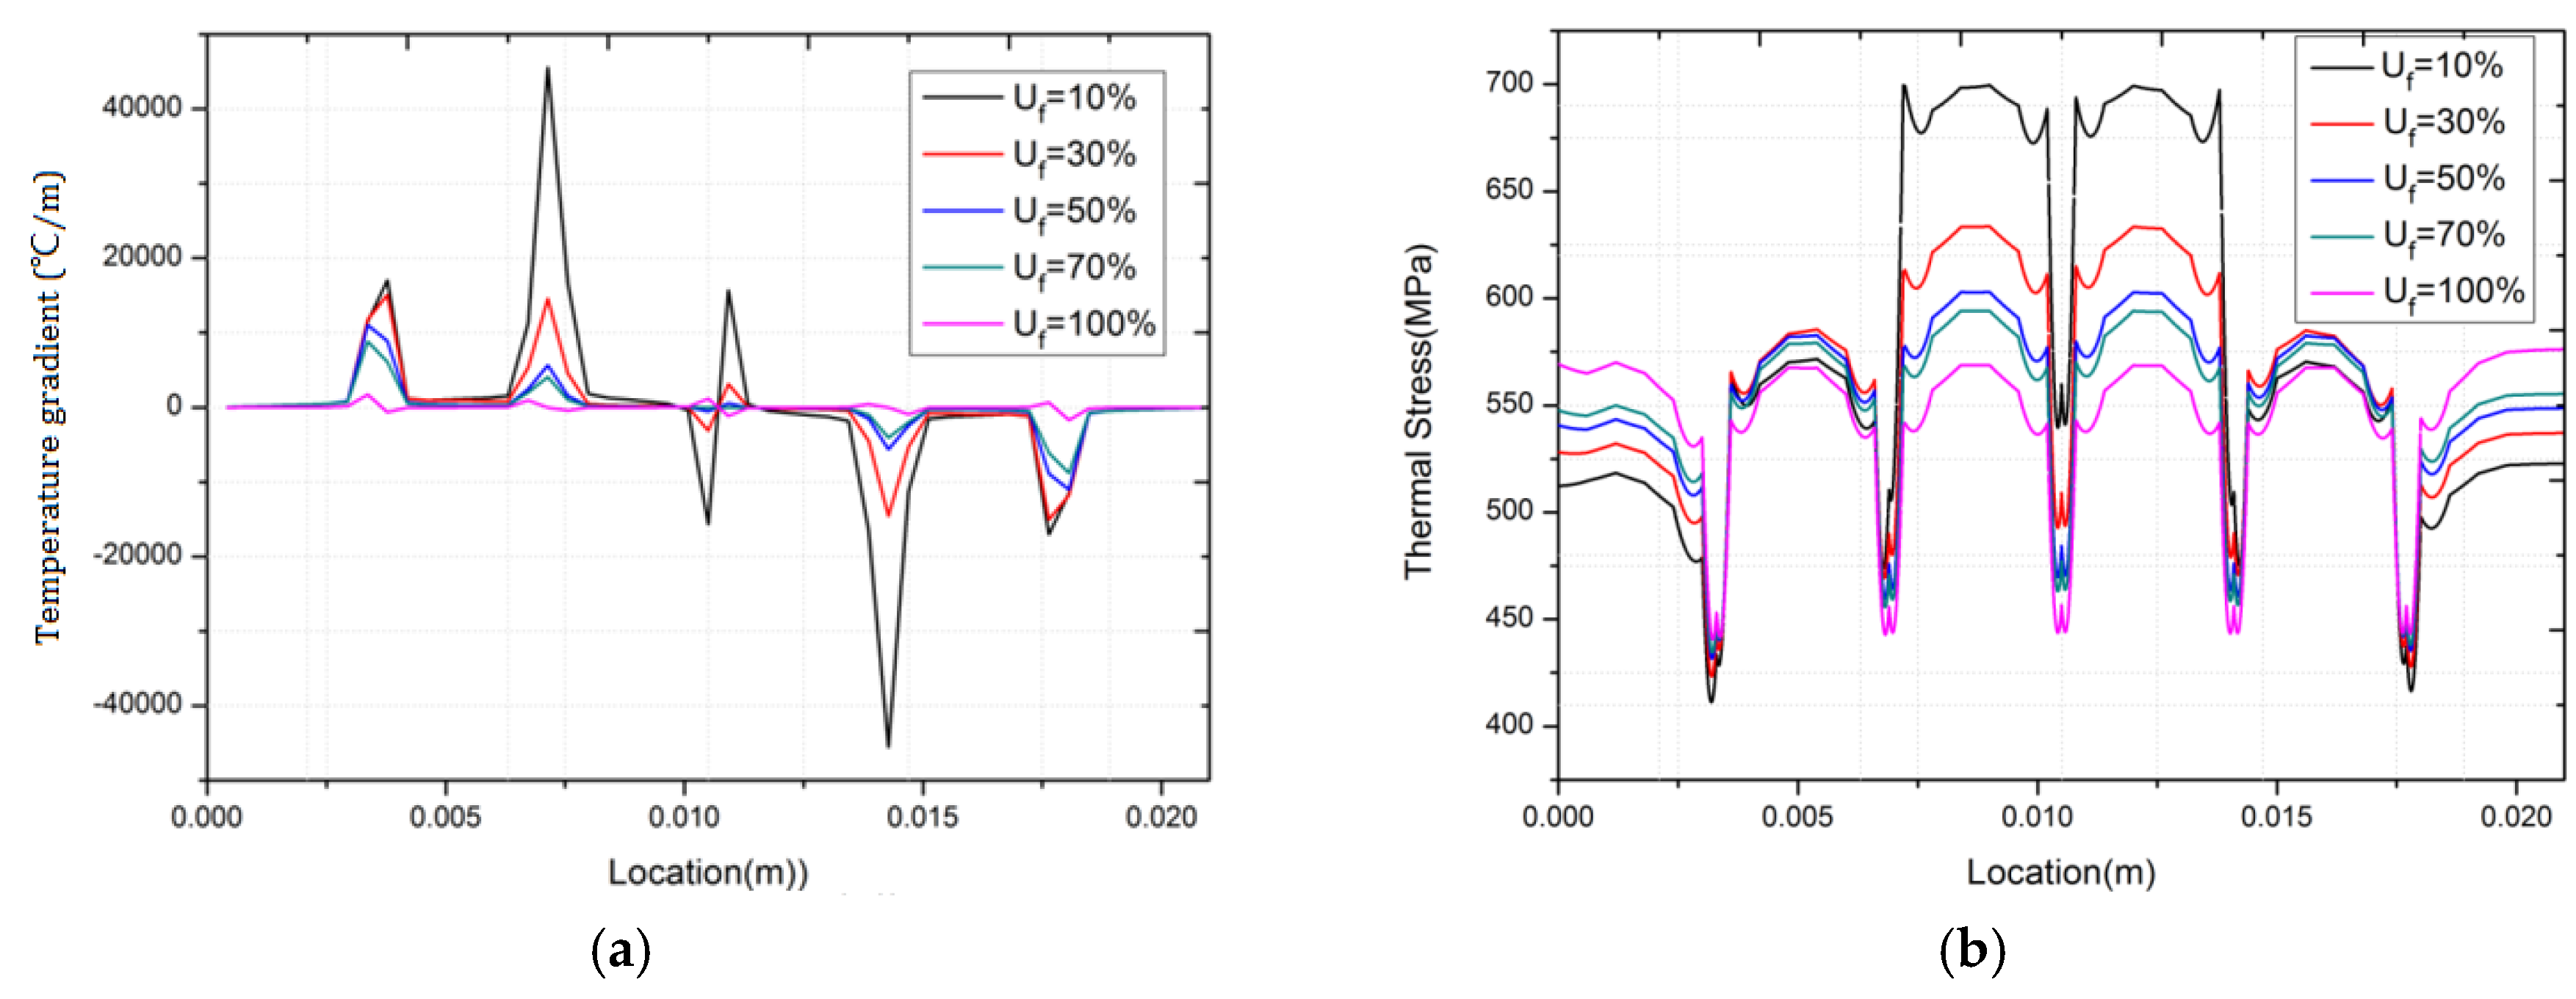
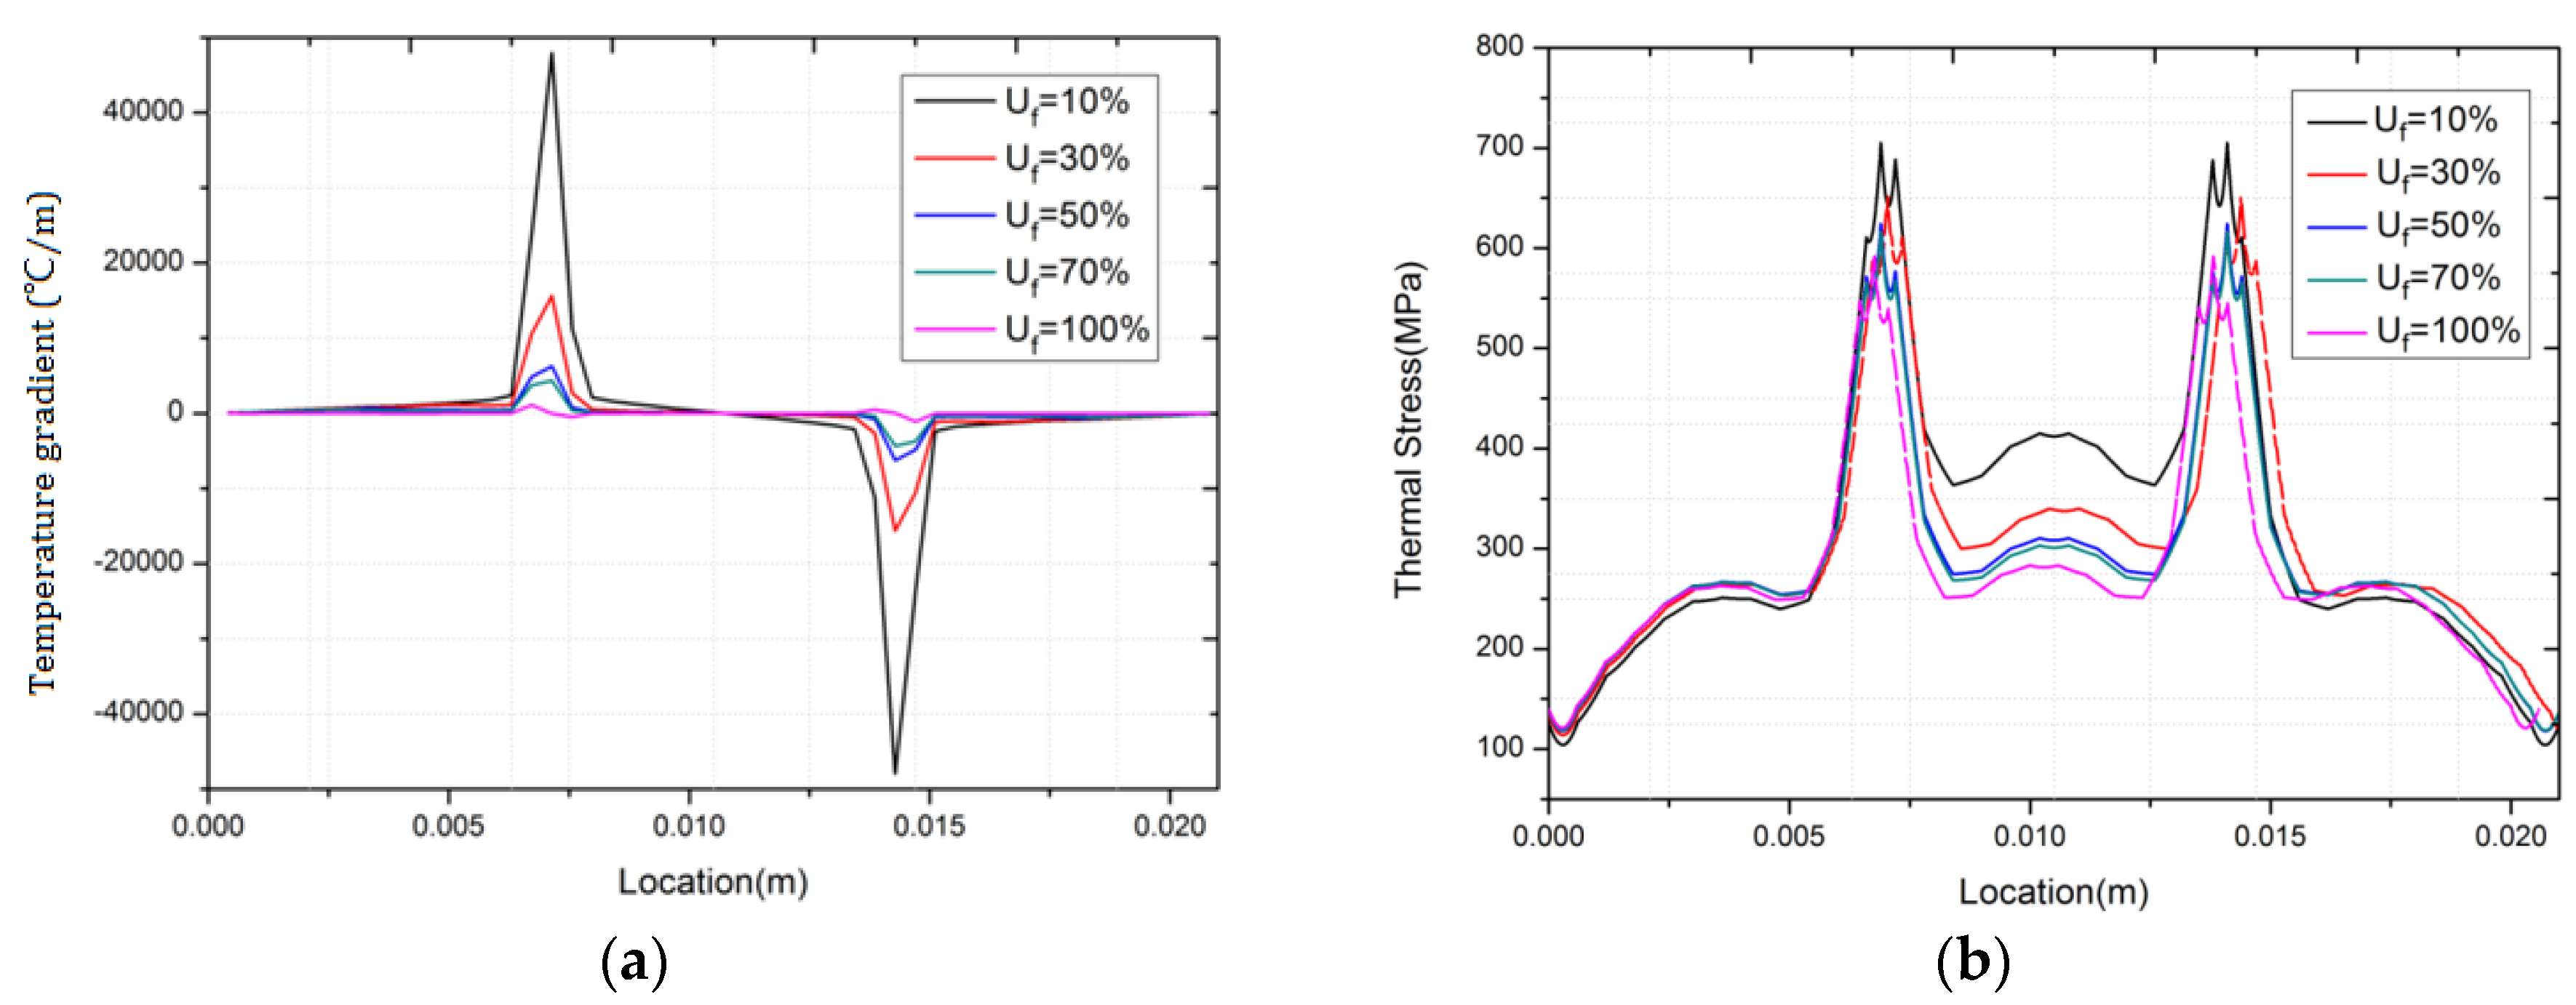
3.6. Temperature Gradient and Thermal Stress Distribution on Line 1 and Line 2

The distributions of temperature gradient and thermal stress along Line 1 are shown in Figure 15. As expected, the higher is the thermal gradient, the larger the thermal stress in the model. Both of these two parameters had their peak value between x = 0.0066 and 0.0072 m, 0.0138 and 0.0144 m. The absolute temperature gradient varies from 145 to 4.50 × 10⁴ K/m and the thermal stress from 250 MPa to 720 MPa. This phenomenon can be explained by two factors: Firstly, the locations are close to the center of the heat flux imposed at the hot end; Secondly, the large thermal conductivity differences among the copper, ceramic, and thermoeletric materials stimulate large temperature gradients in the local regions. Further, severe deformation mismatch is aroused by the large expansion coefficients among these materials.
Figure 15. Temperature gradient and thermal stress distributions along Line 1 (P = 13.23 W): (a) temperature gradient distribution; (b) thermal stress distribution.
Energies 08 12332 g015
As can be seen from Figure 16, when the heating uniformity is 10%, thermal stress achieves peak values of 700 MPa and 580 MPa between z = 0.0108 and 0.0138 m and z = 0.0144 and 0.0174 m, respectively, from the center to the edges along Line 2, and it decreases to430 MPa between z = 0.0138 and 0.0144 m. The positions where thermal stress reaches its peak values are the edges of the interface between the copper strips and ceramic plates, where the large thermal expansion coefficient difference between the two materials leads to stress concentration there. Points between z = 0.0138 and 0.0144 m are places where ceramic disconnected with the copper strips, thus allowing the ceramic plate to expand freely without restriction. This is the very reason why thermal stress is relatively small there. Meanwhile, we could see that the thermal stress between z = 0.0108 to 0.0138 m in the center area increases from 550 MPa to 700 MPa with the uniformity decreasing from 100% to 10%. In the edge regions (z = 0 to 0.003 m), however, the trend is reversed such that the thermal stress decreases from 580 MPa to 51 MPa with increasing concentration ratio. This phenomenon is reasonable. As seen in Figure 3, because of the increasing spreading thermal resistance, the temperature in these regions decrease with concentration rate. Lower thermal expansion is sure to reduce thermal stress in these regions.
Figure 16. Temperature gradient and thermal stress distributions along Line 2 (P = 13.23 W). (a) Temperature gradient distribution; (b) Thermal stress distribution.
Energies 08 12332 g016

4. Conclusions

A TEG model with 18 thermo-pin couples is established and analyzed by a finite element analysis method in this paper. We examined the temperature and thermal stress distributions in the TEG model and obtained the most likely crack zone of the model for different heat flux concentration rates. Numerical simulation results indicate that:
(1)
The un-uniformity of heat flux imposed upon the hot end has a significant effect on the thermal stress of TEG and life expectancy of the device. When the heating uniformity exceed 70%, however, un-uniformity of heat flux have little influence on the maximum thermal stress in the model. Uniform heat flux is favorable for solar energy concentration device design, but it is not a strict requirement.
(2)
The maximum temperature and thermal stress of the TEG model will increase with the total heat flow. Higher efficiency of the model is at the cost of the life expectancy of the device.
(3)
The interfaces between the copper strips, ceramic plates, and the thermo-pins are the place that is most likely to be damaged. When designing the TEG modules, in order to prolong the life cycle of device, we should strengthen these positions.

Acknowledgments

This research was supported in part by the Scientific Research Project of Wuhan Metro Group Co., Ltd. (No. WHRT-KY-201016), in part by Scientific Research Foundation of Wuhan University of Technology (No. 40120237), and in part by the National Natural Science Foundation of China (No. 51106060).

Author Contributions

Tingzhen Ming, Qiankun Wang, and Zhe Cai discussed and aroused the idea; Keyuan Peng, Wei Yang, Yongjia Wu, and Tingrui Gong performed the simulation and drafted the manuscript; Tingzhen Ming, Qiankun Wang, and Zhe Cai finalized the manuscript.

Conflicts of Interest

The authors declare no conflict of interest.

Nomenclature

E
Voltage potential (V)
T
temperature (K)
Z (z)
thermoelectric figure-of-merit of materials (K1)
q
thermal heat flux density (W/m2 )
I
load current (A)
J
current density (A/m2)
k
thermal conductivity (W/(m.K))
ρ
electric resistivity (Ω·m)
α
Seebeck coefficient (v/K)
A
heating area of hot end (m2)
S
total area of the hot end (m2)
Uf
heating uniformity (-)
P
total heat flow (W)
HF
heat flux (W/m2)
u ¯ ,   v ¯ ,   w ¯
displacement
εx, εy, εz
strain
σij
stress
τ
shear stress
σx, σy, σz
normal stress

References

  1. Li, Y.; Shi, X.; Ren, D.; Chen, J.; Chen, L. Investigation of the Anisotropic Thermoelectric Properties of Oriented Polycrystalline SnSe. Energies 2015, 8, 6275–6285. [Google Scholar] [CrossRef]
  2. Scott, C.A.; Sugg, Z.P. Global Energy Development and Climate-Induced Water Scarcity—Physical Limits, Sectoral Constraints, and Policy Imperatives. Energies 2015, 8, 8211–8225. [Google Scholar] [CrossRef]
  3. Goldsmid, H.J.; Sharp, J. Extrapolation of Transport Properties and Figure of Merit of a Thermoelectric Material. Energies 2015, 8, 6451–6467. [Google Scholar] [CrossRef]
  4. Kim, J.; Shim, K.; Jeon, J. Thermoelectric Power Generation in a Vacuum Cell of Decomposing Liquid Potassium-Ammonia Solutions. Energies 2013, 6, 5960–5972. [Google Scholar] [CrossRef]
  5. Zhao, M.Z.; Zhang, H.C.; Hu, Z.Y.; Zhang, Z.F.; Zhang, J.J. Performance characteristics of a direct carbon fuel cell/thermoelectric generator hybrid system. Energy Convers. Manag. 2015, 89, 683–689. [Google Scholar] [CrossRef]
  6. Zhang, Z.; Li, W.B.; Kan, J.M. Behavior of a thermoelectric power generation device based on solar irradiation and the earth’s surface-air temperature difference. Energy Convers. Manag. 2015, 97, 178–187. [Google Scholar] [CrossRef]
  7. Zhang, Y.C.; Huang, C.K.; Wang, J.Y.; Lin, G.X.; Chen, J.C. Optimum energy conversion strategies of a nano-scaled three-terminal quantum dot thermoelectric device. Energy 2015, 85, 200–207. [Google Scholar] [CrossRef]
  8. Yilbas, B.S.; Ali, H. Thermoelectric generator performance analysis: Influence of pin tapering on the first and second law efficiencies. Energy Convers. Manag. 2015, 100, 138–146. [Google Scholar] [CrossRef]
  9. Wu, Y.Y.; Wu, S.Y.; Xiao, L. Performance analysis of photovoltaic-thermoelectric hybrid system with and without glass cover. Energy Convers. Manag. 2015, 93, 151–159. [Google Scholar] [CrossRef]
  10. Wijesekara, W.; Rezania, A.; Rosendahl, L. Simple engineering design for complex thermoelectric generators based on reduced current approach. Energy 2015, 86, 455–466. [Google Scholar] [CrossRef]
  11. Wang, J.; Zhao, X.J.; Cai, Y.X.; Zhang, C.; Bao, W.W. Experimental study on the thermal management of high-power LED headlight cooling device integrated with thermoelectric cooler package. Energy Convers. Manag. 2015, 101, 532–540. [Google Scholar] [CrossRef]
  12. Tian, H.; Sun, X.X.; Jia, Q.; Liang, X.Y.; Shu, G.Q.; Wang, X. Comparison and parameter optimization of a segmented thermoelectric generator by using the high temperature exhaust of a diesel engine. Energy 2015, 84, 121–130. [Google Scholar] [CrossRef]
  13. Sahin, A.Z.; Yilbas, B.S. The thermoelement as thermoelectric power generator: Effect of leg geometry on the efficiency and power generation. Energy Convers. Manag. 2013, 65, 26–32. [Google Scholar] [CrossRef]
  14. Khattab, N.M.; EI Shenawy, E.T. Optimal operation of thermoelectric cooler driven by solar thermoelectric generator. Energy Convers. Manag. 2006, 47, 407–426. [Google Scholar] [CrossRef]
  15. Rodriguez, A.; Vian, J.G.; Astrain, D.; Martinez, A. Study of thermoelectric systems applied to electric power generation. Energy Convers. Manag. 2009, 50, 1236–1243. [Google Scholar] [CrossRef]
  16. O'Brien, R.C.; Ambrosi, R.M.; Bannister, N.P.; Howe, S.D.; Atkinson, H.V. Safe radioisotope thermoelectric generators and heat sources for space applications. J. Nucl. Mater. 2008, 377, 506–521. [Google Scholar] [CrossRef]
  17. Yilbas, B.S.; Sahin, A.Z. Thermoelectric device and optimum external load parameter and slenderness ratio. Energy 2010, 35, 5380–5384. [Google Scholar] [CrossRef]
  18. Omer, S.A.; Infield, D.G. Design and thermal analysis of a two stage solar concentrator for combined heat and thermoelectric power generation. Energy Convers. Manag. 2000, 41, 737–756. [Google Scholar] [CrossRef]
  19. Maneewan, S.; Chindaruksa, S. Thermoelectric Power Generation System Using Waste Heat from Biomass Drying. J. Electron. Mater. 2009, 38, 974–980. [Google Scholar] [CrossRef]
  20. Maneewan, S.; Hirunlabh, J.; Khedari, J.; Zeghmati, B.; Teekasap, S. Heat gain reduction by means of thermoelectric roof solar collector. Sol. Energy 2005, 78, 495–503. [Google Scholar] [CrossRef]
  21. Zhou, S.Y.; Sammakia, B.G.; White, B.; Borgesen, P. Multiscale modeling of thermoelectric generators for the optimized conversion performance. Int. J. Heat Mass. Transf. 2013, 62, 435–444. [Google Scholar] [CrossRef]
  22. Xiao, J.S.; Yang, T.Q.; Li, P.; Zhai, P.C.; Zhang, Q.J. Thermal design and management for performance optimization of solar thermoelectric generator. Appl. Energy 2012, 93, 33–38. [Google Scholar] [CrossRef]
  23. Nguyen, N.Q.; Pochiraju, K.V. Behavior of thermoelectric generators exposed to transient heat sources. Appl. Therm. Eng. 2013, 51, 1–9. [Google Scholar] [CrossRef]
  24. Rezania, A.; Yazawa, K.; Rosendahl, L.A.; Shakouri, A. Co-optimized design of microchannel heat exchangers and thermoelectric generators. Int. J. Therm. Sci. 2013, 72, 73–81. [Google Scholar] [CrossRef]
  25. Zhang, Q.; Agbossou, A.; Feng, Z.H.; Cosnier, M. Solar micro-energy harvesting based on thermoelectric and latent heat effects. Part II: Experimental analysis. Sens. Actuat. A-Phys. 2010, 163, 284–290. [Google Scholar] [CrossRef]
  26. Chen, W.H.; Liao, C.Y.; Wang, C.C.; Hung, C.I. Evaluation of power generation from thermoelectric cooler at normal and low-temperature cooling conditions. Energy Sustain. Dev. 2015, 25, 8–16. [Google Scholar] [CrossRef]
  27. Chen, W.H.; Wang, C.C.; Hung, C.I.; Yang, C.C.; Juang, R.C. Modeling and simulation for the design of thermal-concentrated solar thermoelectric generator. Energy 2014, 64, 287–297. [Google Scholar] [CrossRef]
  28. Chen, W.H.; Wang, C.C.; Hung, C.I. Geometric effect on cooling power and performance of an integrated thermoelectric generation-cooling system. Energy Convers. Manag. 2014, 87, 566–575. [Google Scholar] [CrossRef]
  29. Chen, W.H.; Liao, C.Y.; Hung, C.I. A numerical study on the performance of miniature thermoelectric cooler affected by Thomson effect. Appl. Energy 2012, 89, 464–473. [Google Scholar] [CrossRef]
  30. Chen, W.H.; Liao, C.Y.; Hung, C.I.; Huang, W.L. Experimental study on thermoelectric modules for power generation at various operating conditions. Energy 2012, 45, 874–881. [Google Scholar] [CrossRef]
  31. Wang, C.C.; Hung, C.I.; Chen, W.H. Design of heat sink for improving the performance of thermoelectric generator using two-stage optimization. Energy 2012, 39, 236–245. [Google Scholar] [CrossRef]
  32. Al-Merbati, A.S.; Yilbas, B.S.; Sahin, A.Z. Thermodynamics and thermal stress analysis of thermoelectric power generator: Influence of pin geometry on device performance. Appl. Therm. Eng. 2013, 50, 683–692. [Google Scholar] [CrossRef]
  33. Ziabari, A.; Suhir, E.; Shakouri, A. Minimizing thermally induced interfacial shearing stress in a thermoelectric module with low fractional area coverage. Microelectron. J. 2014, 45, 547–553. [Google Scholar] [CrossRef]
  34. Wu, Y.J.; Ming, T.Z.; Li, X.H.; Pan, T.; Peng, K.Y.; Luo, X.B. Numerical simulations on the temperature gradient and thermal stress of a thermoelectric power generator. Energy Convers. Manag. 2014, 88, 915–927. [Google Scholar] [CrossRef]
  35. Ming, T.; Wu, Y.; Peng, C.; Tao, Y. Thermal analysis on a segmented thermoelectric generator. Energy 2015, 80, 388–399. [Google Scholar] [CrossRef]

