1. Introduction
Intense industrial activity and manufacturing processes require high energy consumption and thereby the generation of greenhouse gas (GHG) emissions, which have negative consequences for the preservation of resources and the environment, due to their contribution to global warming. These GHG emissions include carbon dioxide (CO
2), the main contaminant gas generated in the world, and other gases such as methane, nitrous oxide and chlorofluorocarbons which can be measured in units of CO
2 equivalents (CO
2-eq) [
1]. In the manufacturing field, designs that reduce energy use and emissions are the main issues considered by companies in their attempt to move toward greater sustainability [
2]. Energy efficiency is a current concern, and policies regarding it affect the environment because this efficiency can contribute to reducing emissions and favor decreasing the greenhouse effect [
3]. Some companies have their own policies and focus their production on clean manufacturing [
4] and models are being developed to minimize environmental impacts while maximizing resource efficiency in particular cases, such as gear manufacturing [
5]. In the industrial field, where innovation is continuous, the influence of many factors (e.g., equipment, materials and tools) must be considered. New materials and new processes or modifications of old processes appear constantly in the search for high performance due to global competition.
Although processes are often studied by considering their energy consumption [
6], it is convenient to investigate the GHG emissions generated by particular industrial activities. Problems attributed to CO
2 emissions have been exposed in some products [
7] due to their contribution to climate change. Recently, criticism has arisen regarding the suitability of GHG emission reductions due to their weak economic impacts [
8], but some researchers have demonstrated that emissions reductions can be compatible with costs savings in a manufacturing plant through environmental innovation [
9] and that the environmental commitment can improve the industrial plant’s productivity [
10]. These items are also inherent in mechanical manufacturing processes, in which machining is commonly used due to its versatility. Thus, in these processes, features such as machines, fixtures, tools and cutting fluids, including lubricants and coolants, should be studied because these affect the results of the operations performed. The equipment used in these processes, namely, machine tools, must be designed in a more efficient manner to survive in the market [
11], but the current focus is on the process. For these reasons, machining processes that require material to be removed from an initial part must be thoroughly analyzed. These processes require greater power and higher energy causing high CO
2-eq emissions, particularly for harder materials, where higher cutting speed is required. High performance also requires a high feed rate and high cutting depth because these allow faster material removal. For these reasons, some energy consumption models have been proposed [
12], and different strategies for the design of tool paths have been studied [
13] with the objective of consuming less energy in the process. Many efforts have been devoted to the study of cutting fluids and processes in dry [
14] or cryogenic [
15,
16] conditions, and these have yielded better results compared with wet machining. The tool is an important element because it is responsible for material removal; thus, tool design, including the geometry and the materials used, has been a priority in this field [
17]. Consequently, tool design has evolved in recent decades but continues to focus on achieving higher performance without considering the sustainability of the process.
The titanium alloy Ti6Al4V is commonly used in the aeronautical and biomedical industries, among others, due to its good mechanical proprieties and its biocompatibility in medical uses. In the machining process, turning operations are utilized to obtain the final geometry of many components. The difficulty of machining is a common topic in the literature [
18,
19]. This alloy is very hard, and it is susceptible to temperature increments during machining, which can induce a phase change. Moreover, the thermal conductivity of this alloy is low compared to that of other materials, such as steel, which causes an increase in temperature in the machining zone. In general, titanium consumes more energy and produces more emissions than other structural materials, such as stainless steel; thus, its convenience of use must take into account the product lifespan [
20]. This titanium alloy has been selected for this study due to its widespread use and the difficulties associated with its machining. In particular, for roughing operation, it is important from a sustainable perspective to determine the insert and the cutting conditions that would result in low energy consumption and CO
2-eq emissions.
Dry machining is considered a more sustainable process than machining with cutting fluids due to the absence of lubricants and coolants, which results in a reduced use of resources [
14,
21]. Moreover, in the dry turning of titanium alloy, the cutting forces required are lower than those required using cutting fluids [
18], and a better surface quality is achieved [
19] than in wet machining. In this sense, the selection of a dry process could result in a reduction of energy consumption. However, dry machining results in higher wear of the cutting inserts [
19], which can be counterweighted with the use of coating inserts to increase tool life [
22].
Some strategies and models have been developed mainly to minimize the energy consumption in machining. Rajemi
et al. [
23] proposed a model that looks for the selection of the optimal turning conditions based on minimum energy considerations. Balogun and Mativenga [
24] then improved the model to introduce direct energy requirements, and Peng
et al. [
25] developed an energy model implementation for future CNC machining systems based on function blocks. Iqbal
et al. [
26] established a set of rules utilizing fuzzy logic and found that a long tool life is associated with more energy consumption and low productivity. In addition, Schultheiss
et al. [
27] showed that it is possible to increase tool life through the use of worn tools in secondary operations. Mativenga and Rajemi [
28] showed that the selection of cutting conditions based on a minimum energy footprint criterion can lead to an important decrease in the energy footprint of the machining process compared with that obtained the cutting conditions recommended by tool manufactures; Fang
et al. [
29] applied a model of general multi-objective mixed-integer linear programming to machining in an attempt to reduce power consumption and the carbon footprint. Finally, Yingjie [
30] concluded that it is necessary to research energy efficiency techniques in machining processes through the optimization of mechanical configurations and cutting parameters, whereas that Peng and Xu [
31] affirmed that a future comprehensive data analysis in terms of energy consumption should include materials, machine tools, cutting tools and energy. Despite these advances, it is necessary to know which cutting conditions are significant in terms of their effects on energy or CO
2-eq emissions. Moreover, conditions can be easily comparable if both the energy and emissions are related to the material removed ratio (MRR).
Although many problems are related to policies, particularly those linked to the type of energy generated, it can be made decisions on industrial processes to mitigate the effects. The objectives of this paper are:(i) to evaluate the influence of the cutting conditions and insert characteristics on the energy required and the CO2-eq emissions per MRR during the dry machining of Ti6Al4V alloy, with the aim of defining parameters that contribute to reducing the influence of this process on greenhouse gas emissions, and (ii) to determine the contribution of cutting tools to CO2-eq emissions.
3. Results and Discussion
The factors and levels presented in
Table 4 are displayed in greater detail in
Table 5 to allow a clear identification of the values associated with each factor at each level. The following results show the value of the total energy per MRR, including the energy achieved by the cutting, back and feed forces.
Table 5.
Values of the factors at each level.
Table 5.
Values of the factors at each level.
| No. Test | Factors and Levels | Values of Factors at Each Level |
|---|
| Tool Characteristics | Cutting Parameters | Tool Characteristics | Cutting Parameters |
|---|
| Coating | Tool Cutting Length, le | Feed Rate, f | Cutting Speed, vc | Cutting Depth, d | Coating | Tool Cutting Length, le (mm) | Feed Rate, f (mm/rev) | Cutting Speed, vc (m/min) | Cutting Depth, d (mm) |
|---|
| 1 | 1 | 1 | 1 | 1 | 1 | Uncoated | 9.525 | 0.1 | 50 | 1 |
| 2 | 1 | 1 | 1 | 1 | 2 | Uncoated | 9.525 | 0.1 | 50 | 2 |
| 3 | 1 | 1 | 1 | 1 | 3 | Uncoated | 9.525 | 0.1 | 50 | 3 |
| 4 | 1 | 2 | 2 | 1 | 1 | Uncoated | 12.7 | 0.2 | 50 | 1 |
| 5 | 1 | 2 | 2 | 1 | 2 | Uncoated | 12.7 | 0.2 | 50 | 2 |
| 6 | 1 | 2 | 2 | 1 | 3 | Uncoated | 12.7 | 0.2 | 50 | 3 |
| 7 | 2 | 1 | 2 | 1 | 1 | PVD | 9.525 | 0.2 | 50 | 1 |
| 8 | 2 | 1 | 2 | 1 | 2 | PVD | 9.525 | 0.2 | 50 | 2 |
| 9 | 2 | 1 | 2 | 1 | 3 | PVD | 9.525 | 0.2 | 50 | 3 |
| 10 | 2 | 2 | 1 | 1 | 1 | PVD | 12.7 | 0.1 | 50 | 1 |
| 11 | 2 | 2 | 1 | 1 | 2 | PVD | 12.7 | 0.1 | 50 | 2 |
| 12 | 2 | 2 | 1 | 1 | 3 | PVD | 12.7 | 0.1 | 50 | 3 |
| 13 | 1 | 1 | 1 | 2 | 1 | Uncoated | 9.525 | 0.1 | 100 | 1 |
| 14 | 1 | 1 | 1 | 2 | 2 | Uncoated | 9.525 | 0.1 | 100 | 2 |
| 15 | 1 | 1 | 1 | 2 | 3 | Uncoated | 9.525 | 0.1 | 100 | 3 |
| 16 | 1 | 2 | 2 | 2 | 1 | Uncoated | 12.7 | 0.2 | 100 | 1 |
| 17 | 1 | 2 | 2 | 2 | 2 | Uncoated | 12.7 | 0.2 | 100 | 2 |
| 18 | 1 | 2 | 2 | 2 | 3 | Uncoated | 12.7 | 0.2 | 100 | 3 |
| 19 | 2 | 1 | 2 | 2 | 1 | PVD | 9.525 | 0.2 | 100 | 1 |
| 20 | 2 | 1 | 2 | 2 | 2 | PVD | 9.525 | 0.2 | 100 | 2 |
| 21 | 2 | 1 | 2 | 2 | 3 | PVD | 9.525 | 0.2 | 100 | 3 |
| 22 | 2 | 2 | 1 | 2 | 1 | PVD | 12.7 | 0.1 | 100 | 1 |
| 23 | 2 | 2 | 1 | 2 | 2 | PVD | 12.7 | 0.1 | 100 | 2 |
| 24 | 2 | 2 | 1 | 2 | 3 | PVD | 12.7 | 0.1 | 100 | 3 |
| 25 | 1 | 1 | 1 | 3 | 1 | Uncoated | 9.525 | 0.1 | 150 | 1 |
| 26 | 1 | 1 | 1 | 3 | 2 | Uncoated | 9.525 | 0.1 | 150 | 2 |
| 27 | 1 | 1 | 1 | 3 | 3 | Uncoated | 9.525 | 0.1 | 150 | 3 |
| 28 | 1 | 2 | 2 | 3 | 1 | Uncoated | 12.7 | 0.2 | 150 | 1 |
| 29 | 1 | 2 | 2 | 3 | 2 | Uncoated | 12.7 | 0.2 | 150 | 2 |
| 30 | 1 | 2 | 2 | 3 | 3 | Uncoated | 12.7 | 0.2 | 150 | 3 |
| 31 | 2 | 1 | 2 | 3 | 1 | PVD | 9.525 | 0.2 | 150 | 1 |
| 32 | 2 | 1 | 2 | 3 | 2 | PVD | 9.525 | 0.2 | 150 | 2 |
| 33 | 2 | 1 | 2 | 3 | 3 | PVD | 9.525 | 0.2 | 150 | 3 |
| 34 | 2 | 2 | 1 | 3 | 1 | PVD | 12.7 | 0.1 | 150 | 1 |
| 35 | 2 | 2 | 1 | 3 | 2 | PVD | 12.7 | 0.1 | 150 | 2 |
| 36 | 2 | 2 | 1 | 3 | 3 | PVD | 12.7 | 0.1 | 150 | 3 |
They are high (see
Table 6) compared with those obtained with other materials such as aluminum alloys [
49], but are calculated per cubic meter, and the density of Ti6Al4V is higher (see
Table 1) that that of aluminum based alloys. Therefore, the required high forces result in high energy consumption and CO
2-eq emissions. The S/N ratios are shown in
Table 6. The results show that completely different outcomes are obtained with different cutting conditions. In a first approach, better results for energy and emissions (see line 6 of
Table 6) are obtained with an uncoated insert, high cutting length, and the cutting conditions
f = 0.2 mm/rev,
vc = 50 m/min and
d = 3 mm. The worst results are achieved with a coated insert, low cutting length, and cutting conditions
f = 0.2 mm/rev,
vc = 150 m/min and
d = 2 mm (see line 32 of
Table 6).
Table 6.
Calculated energy/MRR, CO2-eq emissions and edge life.
Table 6.
Calculated energy/MRR, CO2-eq emissions and edge life.
| No. Test | Energy/MRR (GJ/m3)* | S/N (Energy/MRR) | CO2-eq Emissions/MRR (kgCO2/m3)* | S/N (CO2-eq Emissions/MRR) | Edge Life (min) |
|---|
| 1 | 1.90 | −5.593 | 869.32 | −58.785 | 14.41 |
| 2 | 1.84 | −5.315 | 831.75 | −58.400 | 10.84 |
| 3 | 1.51 | −3.595 | 683.23 | −56.691 | 8.50 |
| 4 | 1.74 | −4.796 | 803.02 | −58.094 | 19.90 |
| 5 | 0.98 | 0.127 | 454.89 | −53.158 | 15.72 |
| 6 | 0.71 | 2.912 | 331.79 | −50.419 | 12.80 |
| 7 | 2.35 | −7.421 | 1042.54 | −60.362 | 29.80 |
| 8 | 1.62 | −4.179 | 718.17 | −57.125 | 23.70 |
| 9 | 1.94 | −5.774 | 857.88 | −58.669 | 19.80 |
| 10 | 1.65 | −4.330 | 784.39 | −57.891 | 27.03 |
| 11 | 1.60 | −4.100 | 743.01 | −57.420 | 20.23 |
| 12 | 1.41 | −2.963 | 650.93 | −56.271 | 17.23 |
| 13 | 1.97 | −5.891 | 908.12 | −59.163 | 5.81 |
| 14 | 1.65 | −4.372 | 757.76 | −57.591 | 3.78 |
| 15 | 1.73 | −4.746 | 799.31 | −58.054 | 2.10 |
| 16 | 1.96 | −5.864 | 940.30 | −59.465 | 4.78 |
| 17 | 1.50 | −3.551 | 726.49 | −57.225 | 2.80 |
| 18 | 1.16 | −1.303 | 579.35 | −55.259 | 1.80 |
| 19 | 1.24 | −1.899 | 565.86 | −55.054 | 6.28 |
| 20 | 1.74 | −4.800 | 781.83 | −57.862 | 3.92 |
| 21 | 1.42 | −3.069 | 642.11 | −56.152 | 2.45 |
| 22 | 1.50 | −3.515 | 728.62 | −57.250 | 11.50 |
| 23 | 1.53 | −3.714 | 727.25 | −57.234 | 7.30 |
| 24 | 1.82 | −5.187 | 864.03 | −58.731 | 4.16 |
| 25 | 2.06 | −6.291 | 1001.11 | −60.010 | 1.69 |
| 26 | 1.45 | −3.212 | 681.03 | −56.663 | 1.86 |
| 27 | 1.71 | −4.685 | 816.68 | −58.241 | 0.83 |
| 28 | 1.67 | −4.434 | 863.42 | −58.724 | 1.93 |
| 29 | 1.48 | −3.416 | 737.39 | −57.354 | 1.44 |
| 30 | 1.10 | −0.797 | 587.43 | −55.379 | 0.80 |
| 31 | 1.92 | −5.680 | 883.00 | −58.919 | 2.22 |
| 32 | 2.33 | −7.342 | 1050.74 | −60.430 | 1.66 |
| 33 | 1.54 | −3.727 | 703.30 | −56.943 | 1.10 |
| 34 | 1.34 | −2.563 | 690.78 | −56.787 | 5.20 |
| 35 | 1.40 | −2.915 | 687.68 | −56.748 | 3.67 |
| 36 | 1.41 | −3.014 | 743.04 | −57.420 | 1.43 |
As observed in the same table, the edge life is 12.85 min in the best situation (CNMG tool) and 1.72 in the worst case (WNMG PVD tool). Because the edge life varies from 29.8 min (WNMG PVD tool) to 0.8 min (CNMG tool), the influence of tools is not clear. In addition to these conditions, it is important to determine the significant factors, which can provide information about the general behavior.
3.1. Energy/MRR
The results of the S/N ratio related to energy/MRR have been subjected to a multifactor ANOVA considering the main factors and their interactions. The outcomes are shown in
Table 7. The ANOVA table shows the sum of squares, degrees of freedom, mean square, F-ratio according to a Fisher-Snedecor test and P-value of the main factors (coating,
le,
f,
vc and
d) and the interactions (coating-
d, and
le-
vc). Only the significant interactions are given in this table; therefore, the interactions coating-
vc, coating-
f, coating-
le,
le-
f,
le-
d,
f-
d,
f-
vc and
vc-
d are not significant. The ANOVA shows two significant factors,
le and
d, as their P-values are less than 0.05 (see
Table 7).
Table 7.
ANOVA for the S/N ratio (Energy/MRR).
Table 7.
ANOVA for the S/N ratio (Energy/MRR).
| Source | Sum of Squares | Degrees of Freedom | Mean Square | F-Ratio | p-value |
|---|
| Coating | 3.589 | 1 | 3.589 | 2.40 | 0.1470 |
| Le | 32.431 | 1 | 32.431 | 21.72 | 0.0006 |
| f | 3.353 | 1 | 3.353 | 2.25 | 0.1598 |
| Vc | 0.490 | 2 | 0.245 | 0.16 | 0.8505 |
| d | 20.780 | 2 | 10.390 | 6.96 | 0.0099 |
| coating-d | 16.560 | 2 | 8.280 | 5.55 | 0.0197 |
| le-vc | 12.886 | 2 | 6.443 | 4.32 | 0.0387 |
| Residual | 17.917 | 12 | 1.493 | | |
| Total (corrected) | 143.98 | 35 | | | |
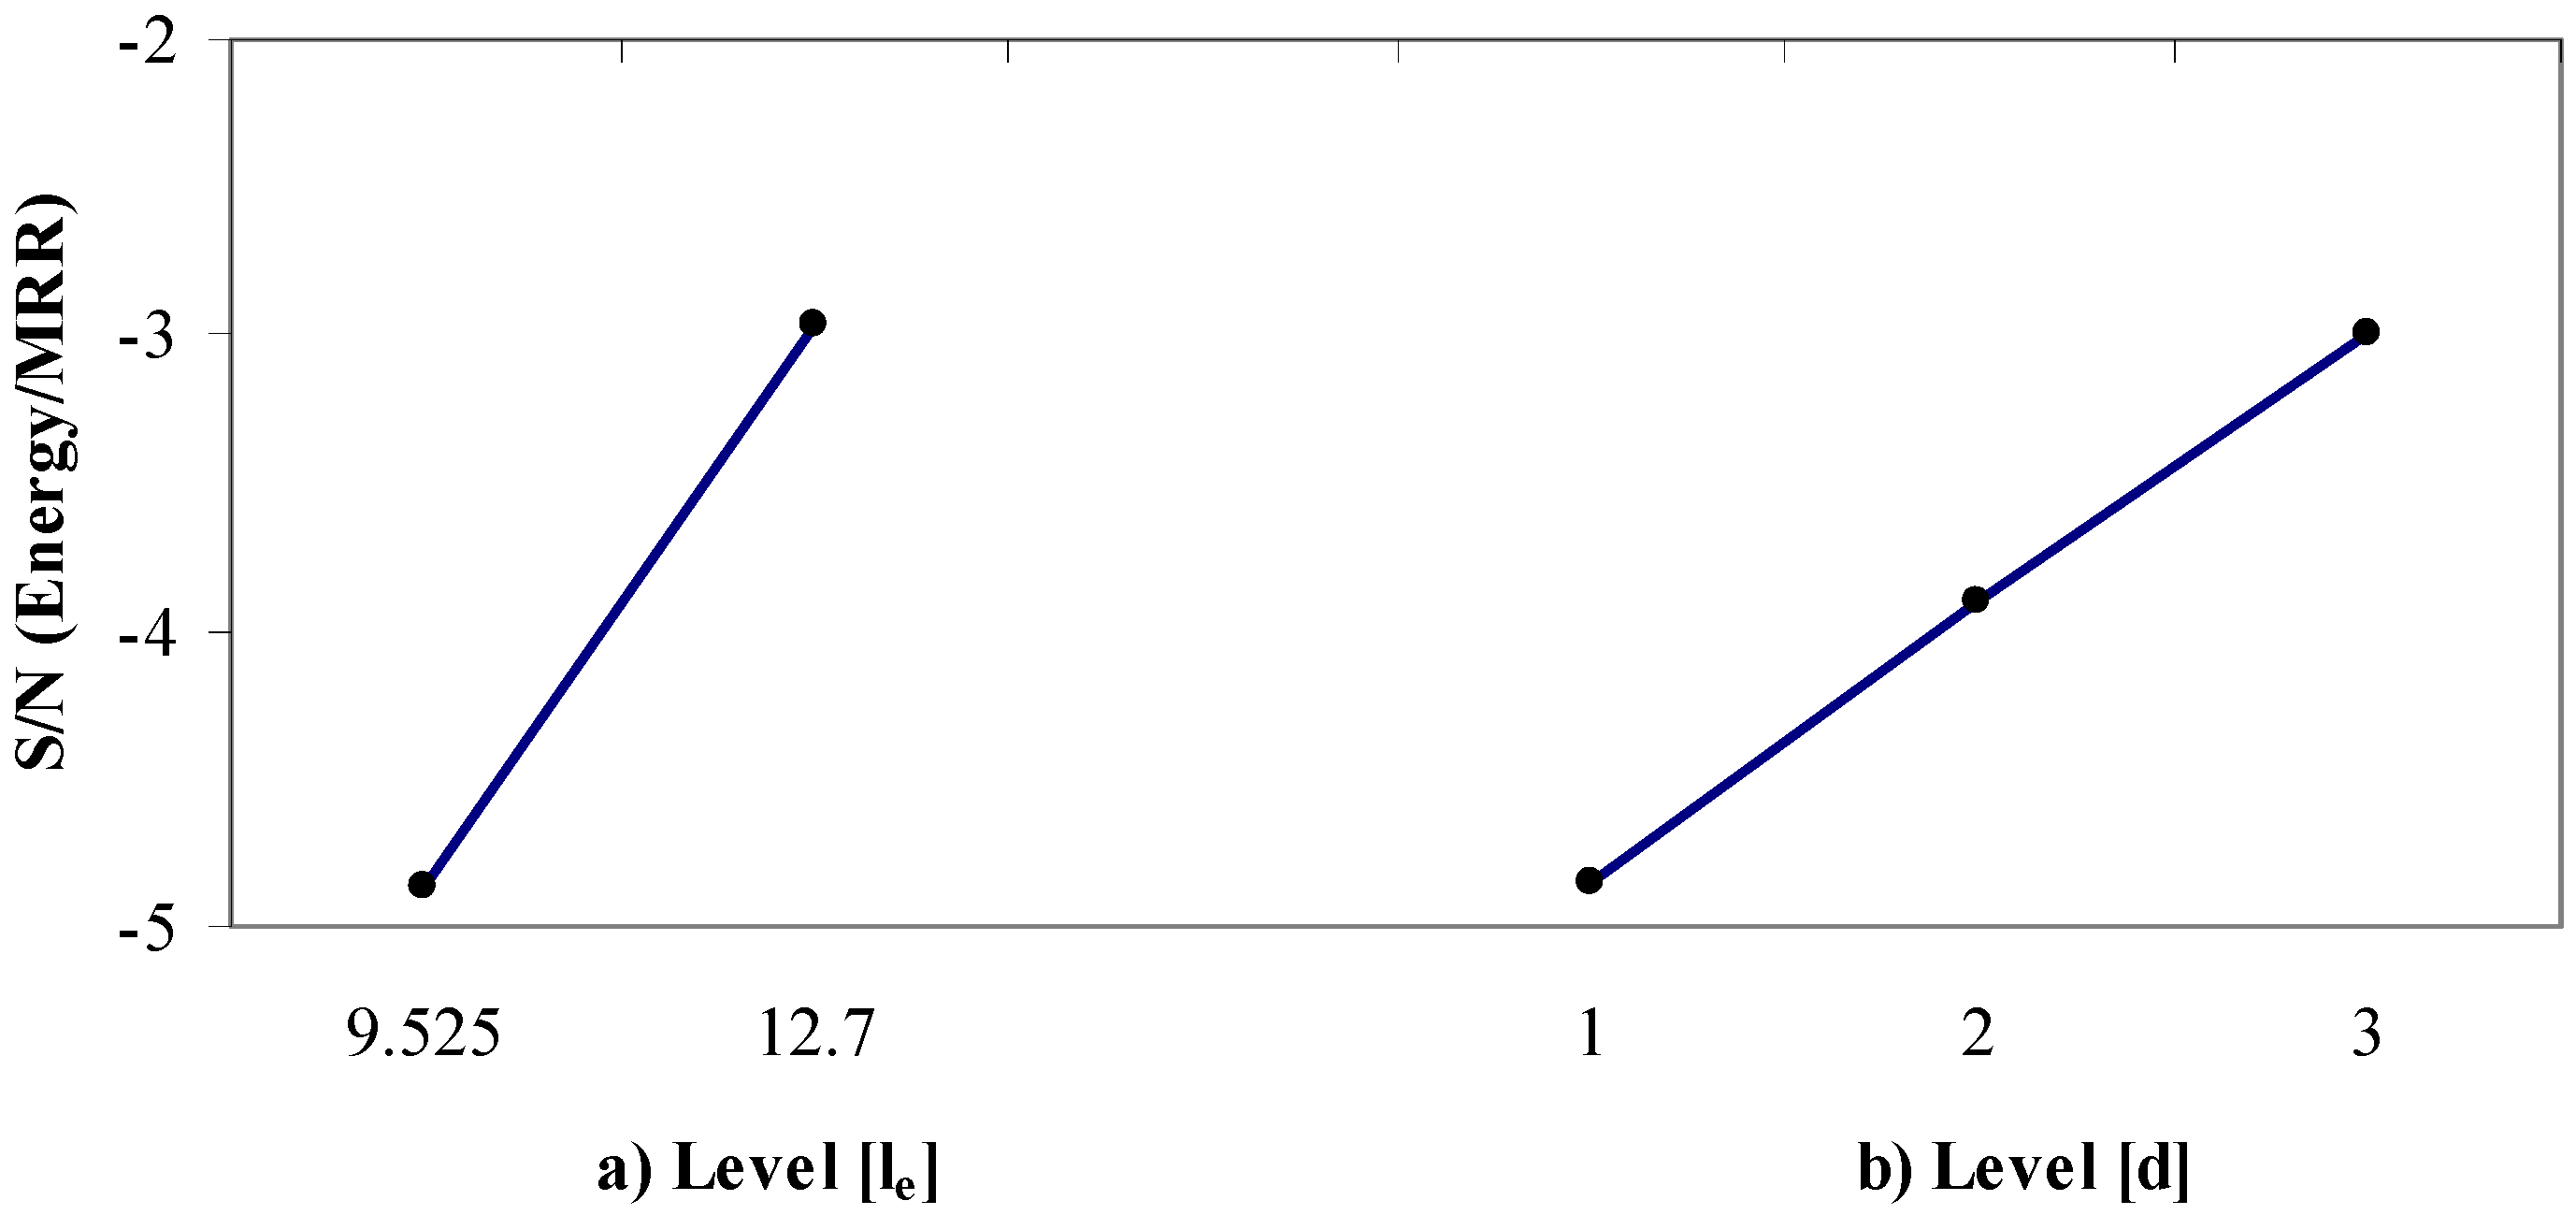
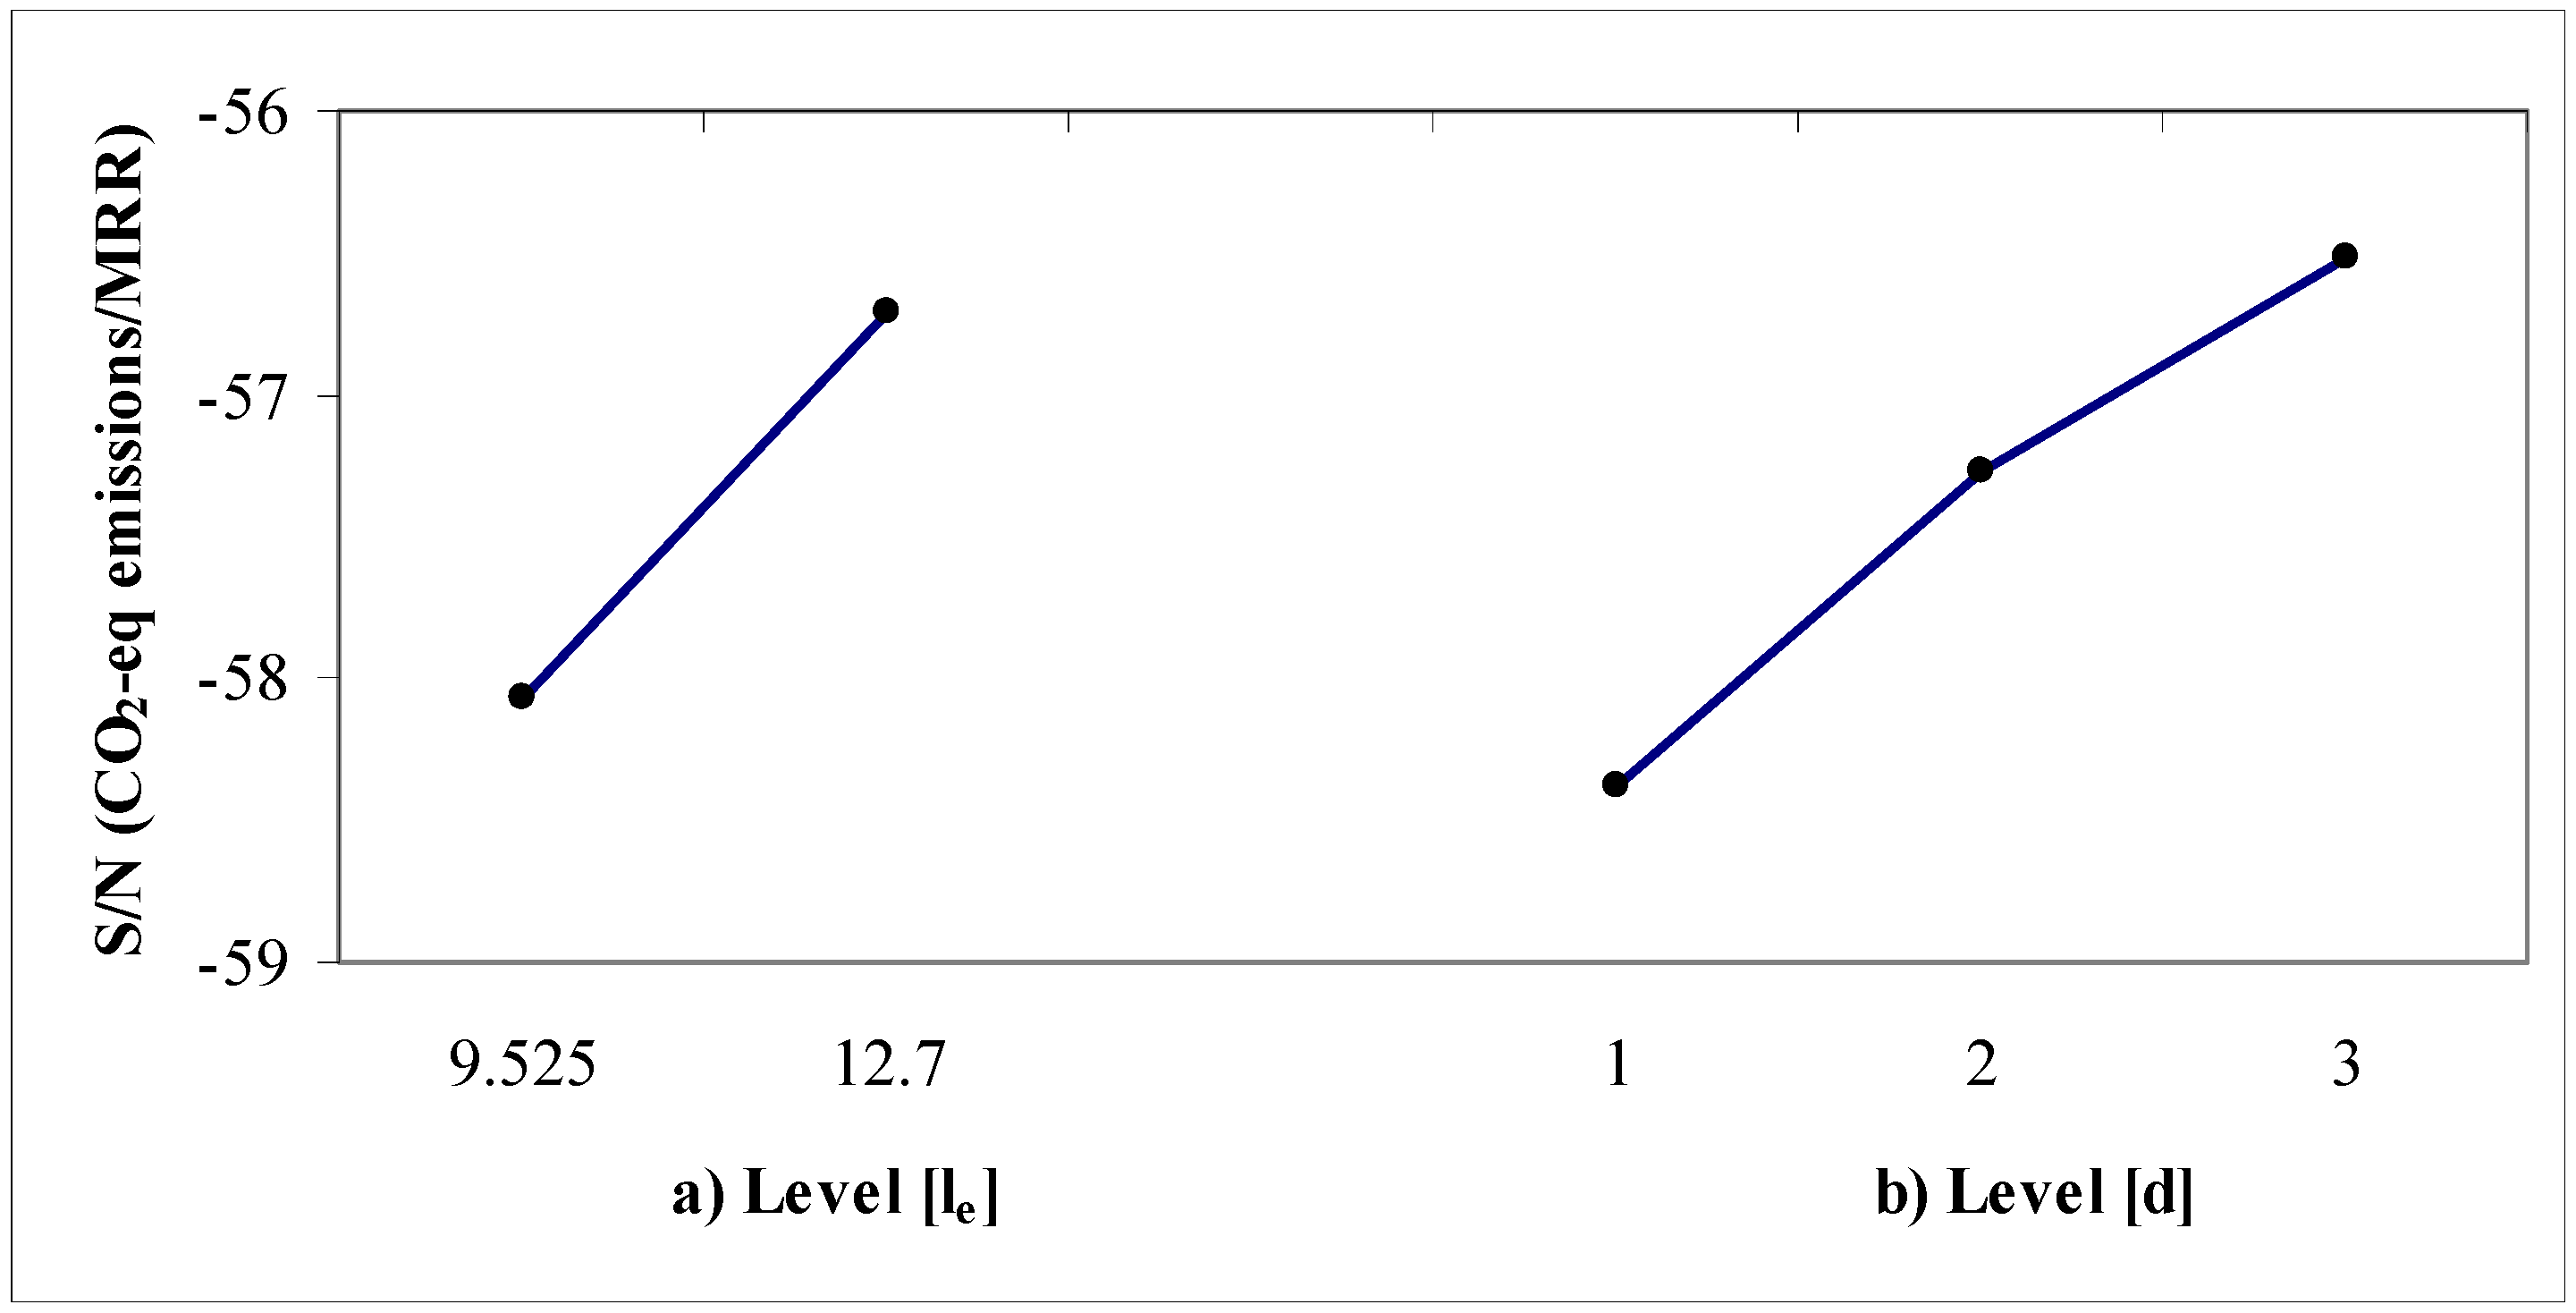
The percentage of influence is 22.52%
le and 14.43%
d, obtained by the ratio between the sum of squares of a factor and the total (
Table 7). The result for
le is interesting because it can influence tool design.
Figure 2 shows that an increase in
le is recommended. Thus, an increase in
le results in an increase in the S/N ratio (Energy/MRR). A possible cause is that the shape of the insert makes chip evacuation difficult and can therefore influence deformed chips and removed chips. Thus, from the energy perspective, CNMG inserts have better results than WNMG inserts. The outcomes of
d are also of interest because an increase in
d results in a higher S/N ratio. This finding is consistent with the effect of
d on the life of the tool, as noted in
Table 6; increasing
d also increases the tool life. A greater
d, 3 mm in the range used, results in more material removed per unit of time; therefore, the high performance is more sustainable.
Figure 2.
Values of the S/N ratios of significant main factors for energy/MRR.
Figure 2.
Values of the S/N ratios of significant main factors for energy/MRR.
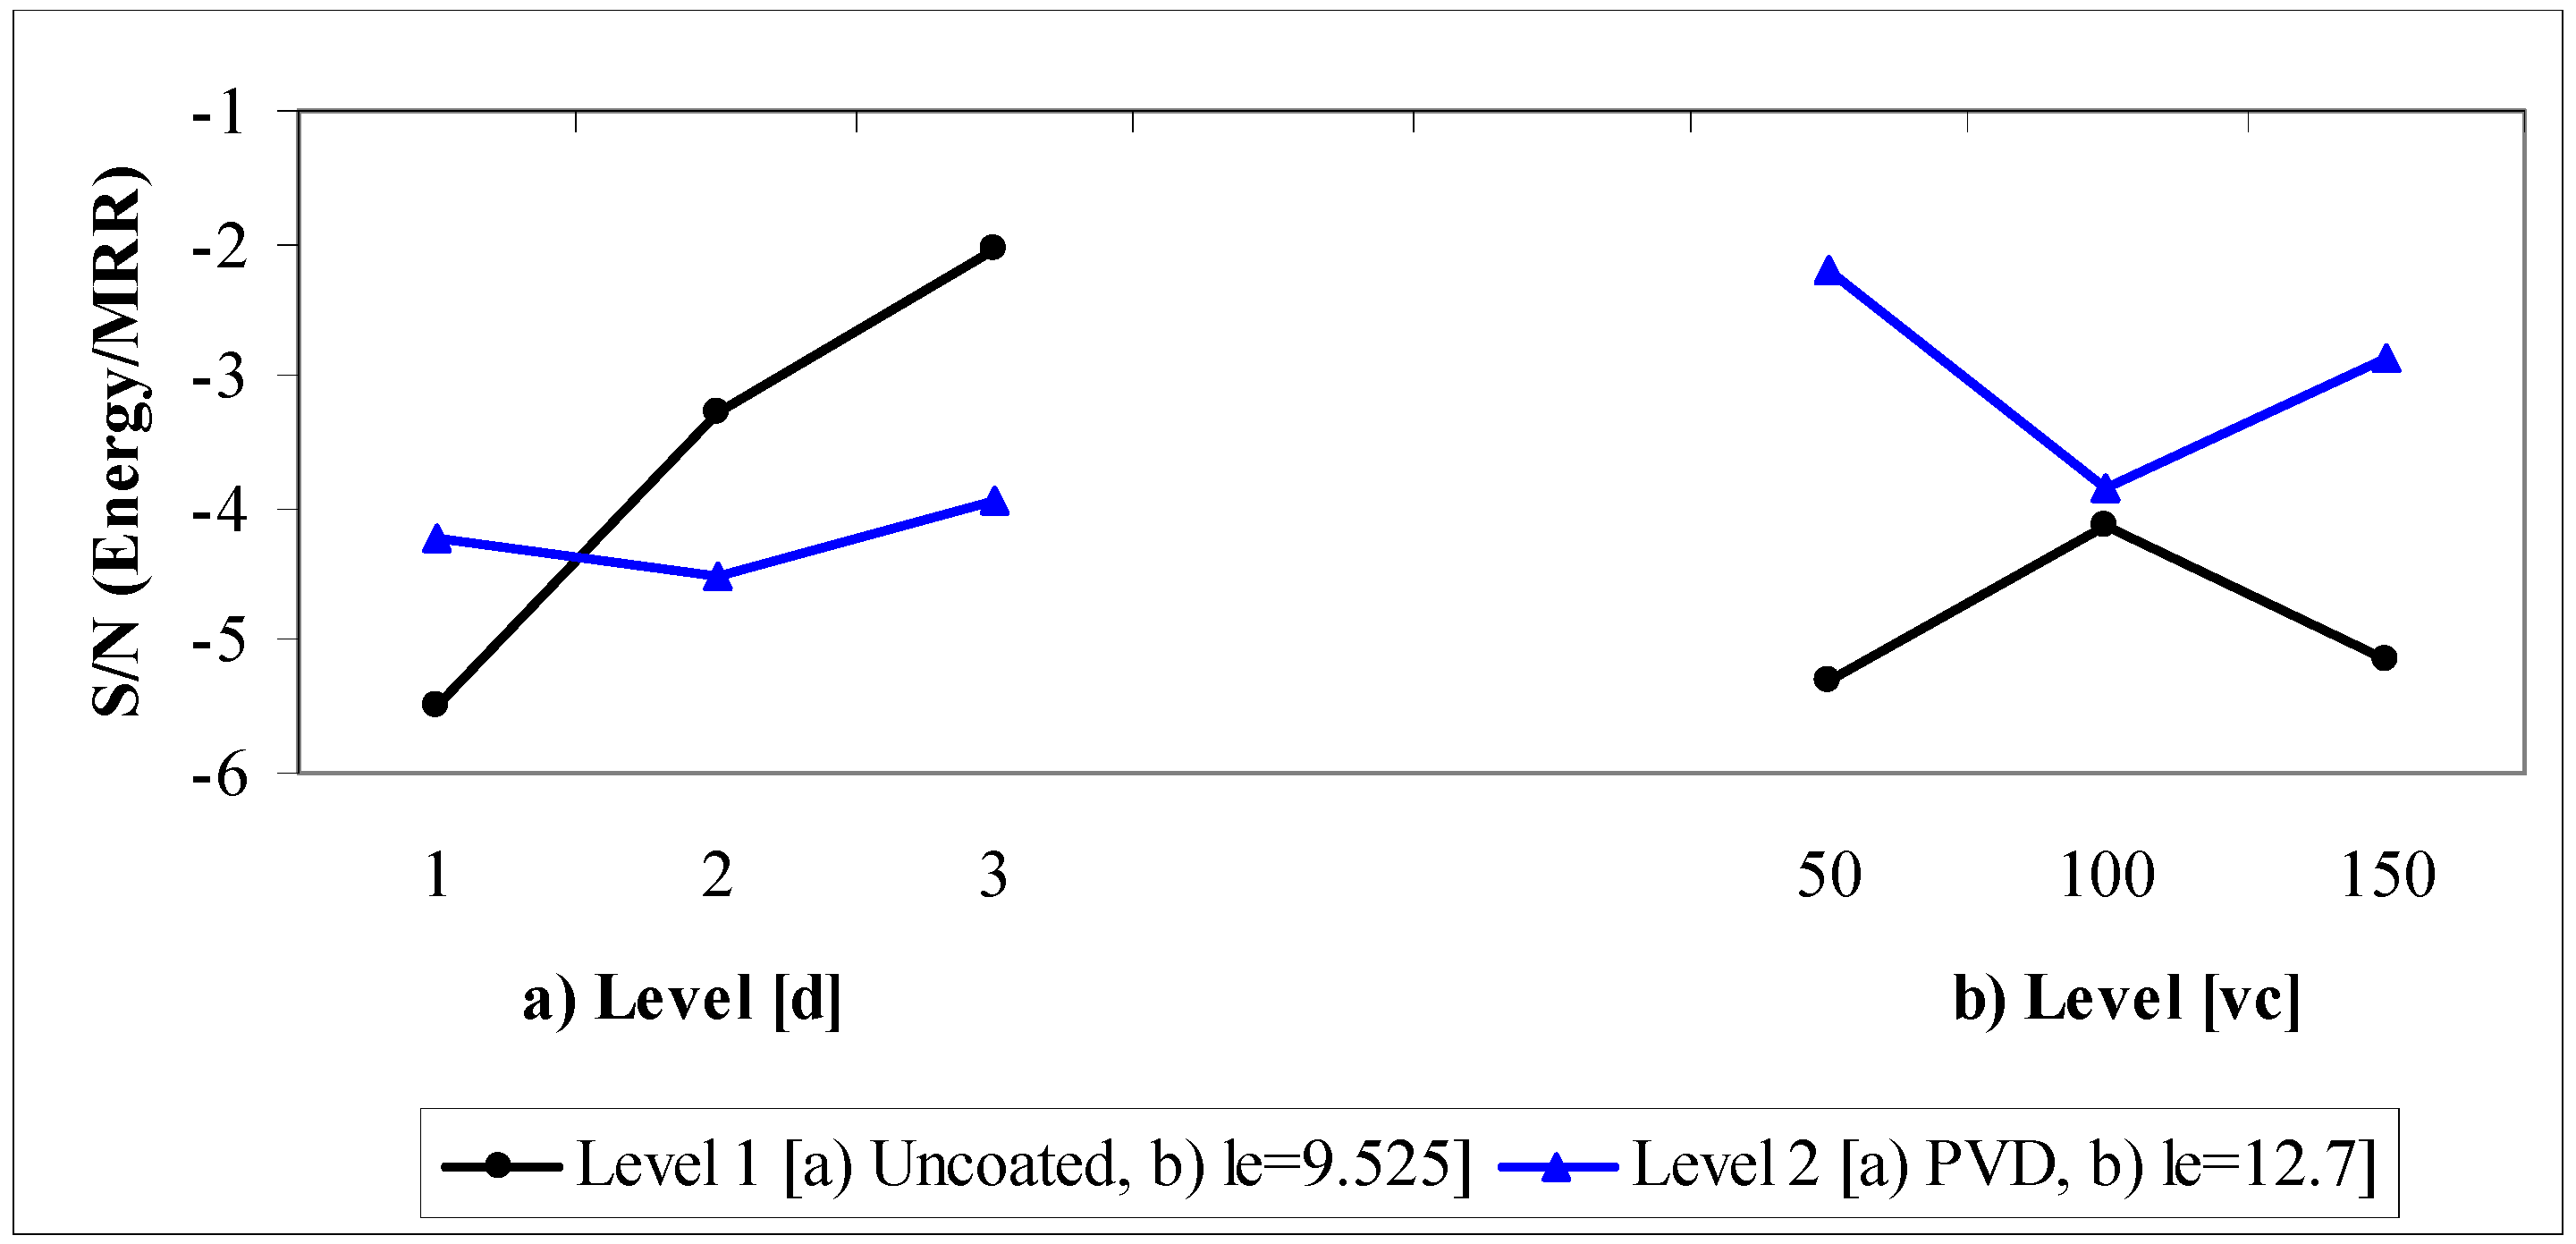
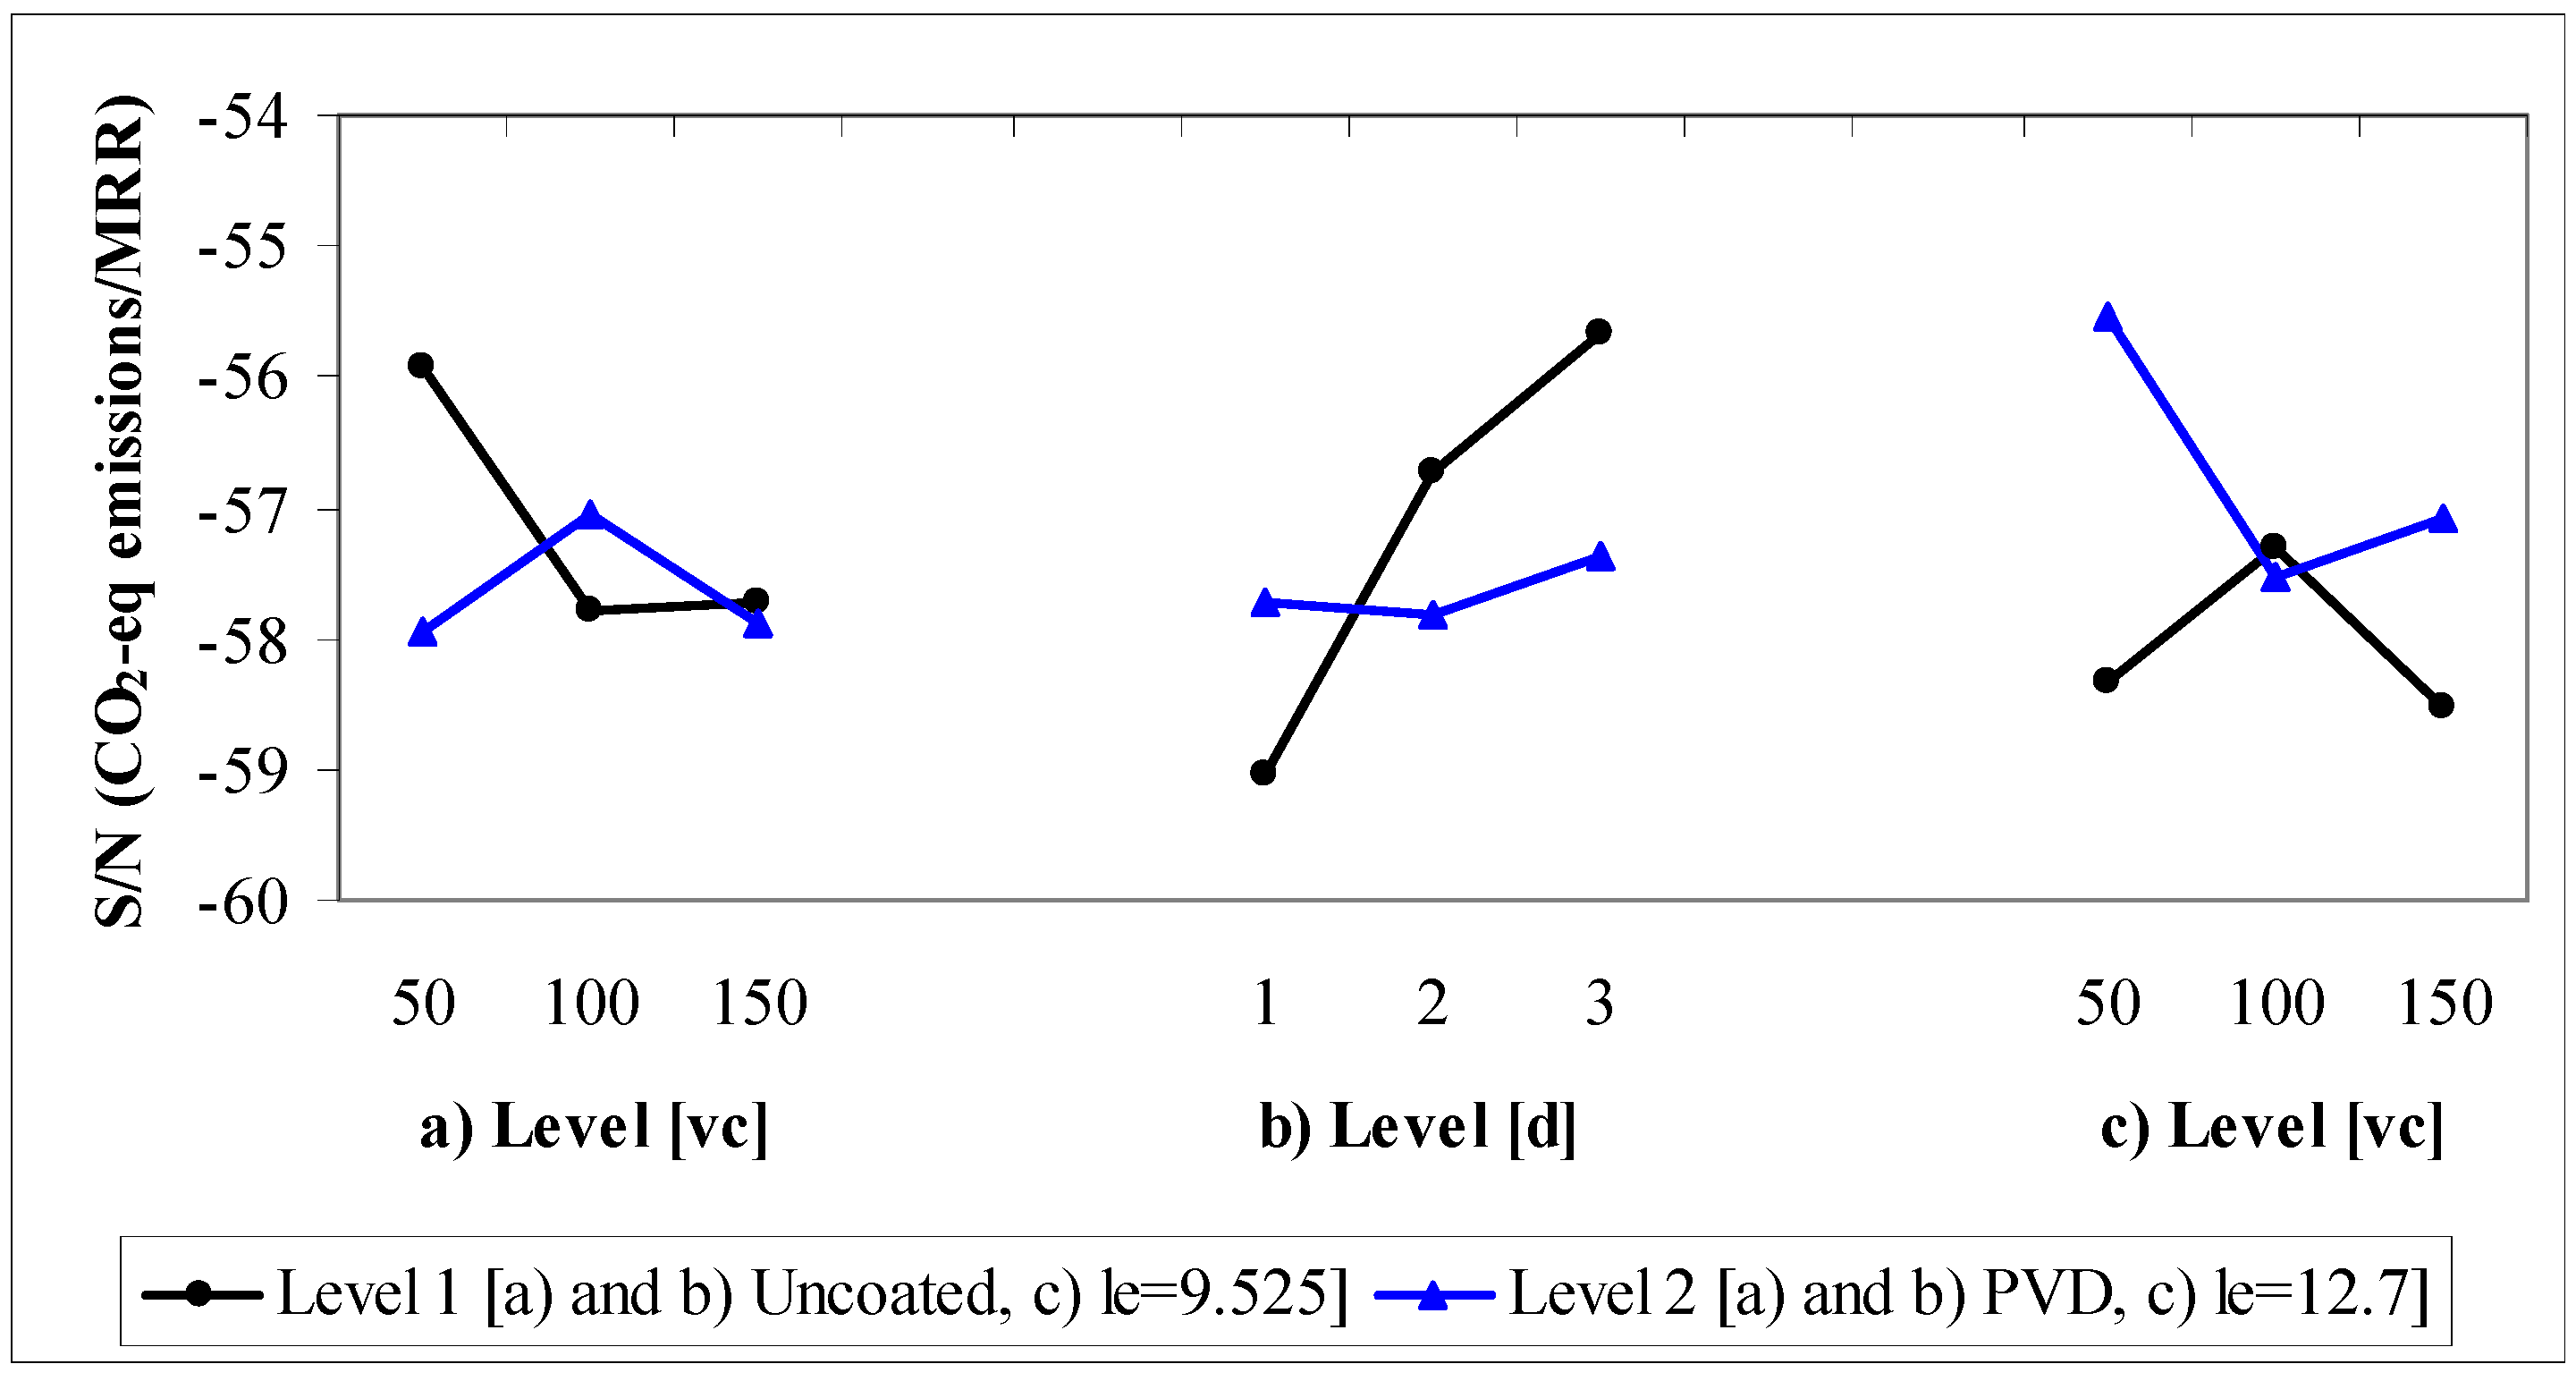
With respect to significant interactions (see
Table 7), only coating-
d appears and has a positive effect compared to the uncoated insert and a
d of 3 mm (see
Figure 3). This finding is consistent with the results shown in
Figure 3; the coating does not positively influence the energy because of the increase in friction.
Figure 3.
Values of the S/N ratio of the significant interactions for energy/MRR.
Figure 3.
Values of the S/N ratio of the significant interactions for energy/MRR.
The results for the interaction
le-vc are different from the results for
le. An increase in
le is recommended over a lower
vc. The outcomes are consistent with the results in
Figure 2. Additionally, a lower
vc (50 mm/min) results in a lower energy consumption.
3.2. CO2-eq Emissions/MRR
Table 8 shows the ANOVA; the factors
le and
d are statistically significant, as in the S/N ratio (energy/MRR) and with the same effect (see
Figure 4). The significant interactions are coating-
d and
le-vc, as for the S/N ratio (energy/MRR), but in this case, coating-
vc also has a P-value less than 0.05. In this case, the percentage of influence is 16.03%
d and 12.55%
le. The influence of
le is considerably lower than in the study of energy, possibly due to the influence of the coating-
vc interaction, which is absent in the significant interactions of the S/N ratio (energy/MRR). Thus, although there is a strong relationship between energy and CO
2-eq emissions, in the last case, the influence of tool life can be considered. In fact, the emissions are increased with the number of tools manufactured. The effect of significant interactions is shown in
Figure 5.
Table 8.
ANOVA of the S/N ratio (CO2-eq emissions/MRR).
Table 8.
ANOVA of the S/N ratio (CO2-eq emissions/MRR).
| Source | Sum of Squares | Degrees of Freedom | Mean Square | F-Ratio | p-value |
|---|
| Coating | 2.049 | 1 | 2.049 | 1.38 | 0.2624 |
| le | 16.382 | 1 | 16.382 | 11.05 | 0.0061 |
| f | 4.519 | 1 | 4.519 | 3.05 | 0.10635 |
| vc | 4.468 | 2 | 2.234 | 1.51 | 0.2606 |
| d | 20.934 | 2 | 10.467 | 7.06 | 0.0094 |
| coating-vc | 12.062 | 2 | 6.031 | 4.07 | 0.0448 |
| coating-d | 15.270 | 2 | 7.635 | 5.15 | 0.0243 |
| le-vc | 13.662 | 2 | 6.831 | 4.61 | 0.0327 |
| Residual | 17.784 | 12 | 1.482 | | |
| Total (corrected) | 130.553 | 35 | | | |
Figure 4.
Values of the S/N ratios of the significant main factors for CO2-eq emissions/MRR.
Figure 4.
Values of the S/N ratios of the significant main factors for CO2-eq emissions/MRR.
Figure 5.
Values of the S/N ratios of the significant interactions for CO2-eq emissions/MRR.
Figure 5.
Values of the S/N ratios of the significant interactions for CO2-eq emissions/MRR.
3.3. Contribution of Cutting Inserts to CO2-eq Emissions
In roughing operations, which are common in machining, coatings do not have a positive influence on energy. Of the inserts evaluated, the most interesting with respect to energy/MRR was CNMG. These last considerations involve sustainability and performance objectives, which balance is important in the industry. Therefore, a longer cutting length has a positive effect. Moreover, this insert has fewer edges than WNMG.
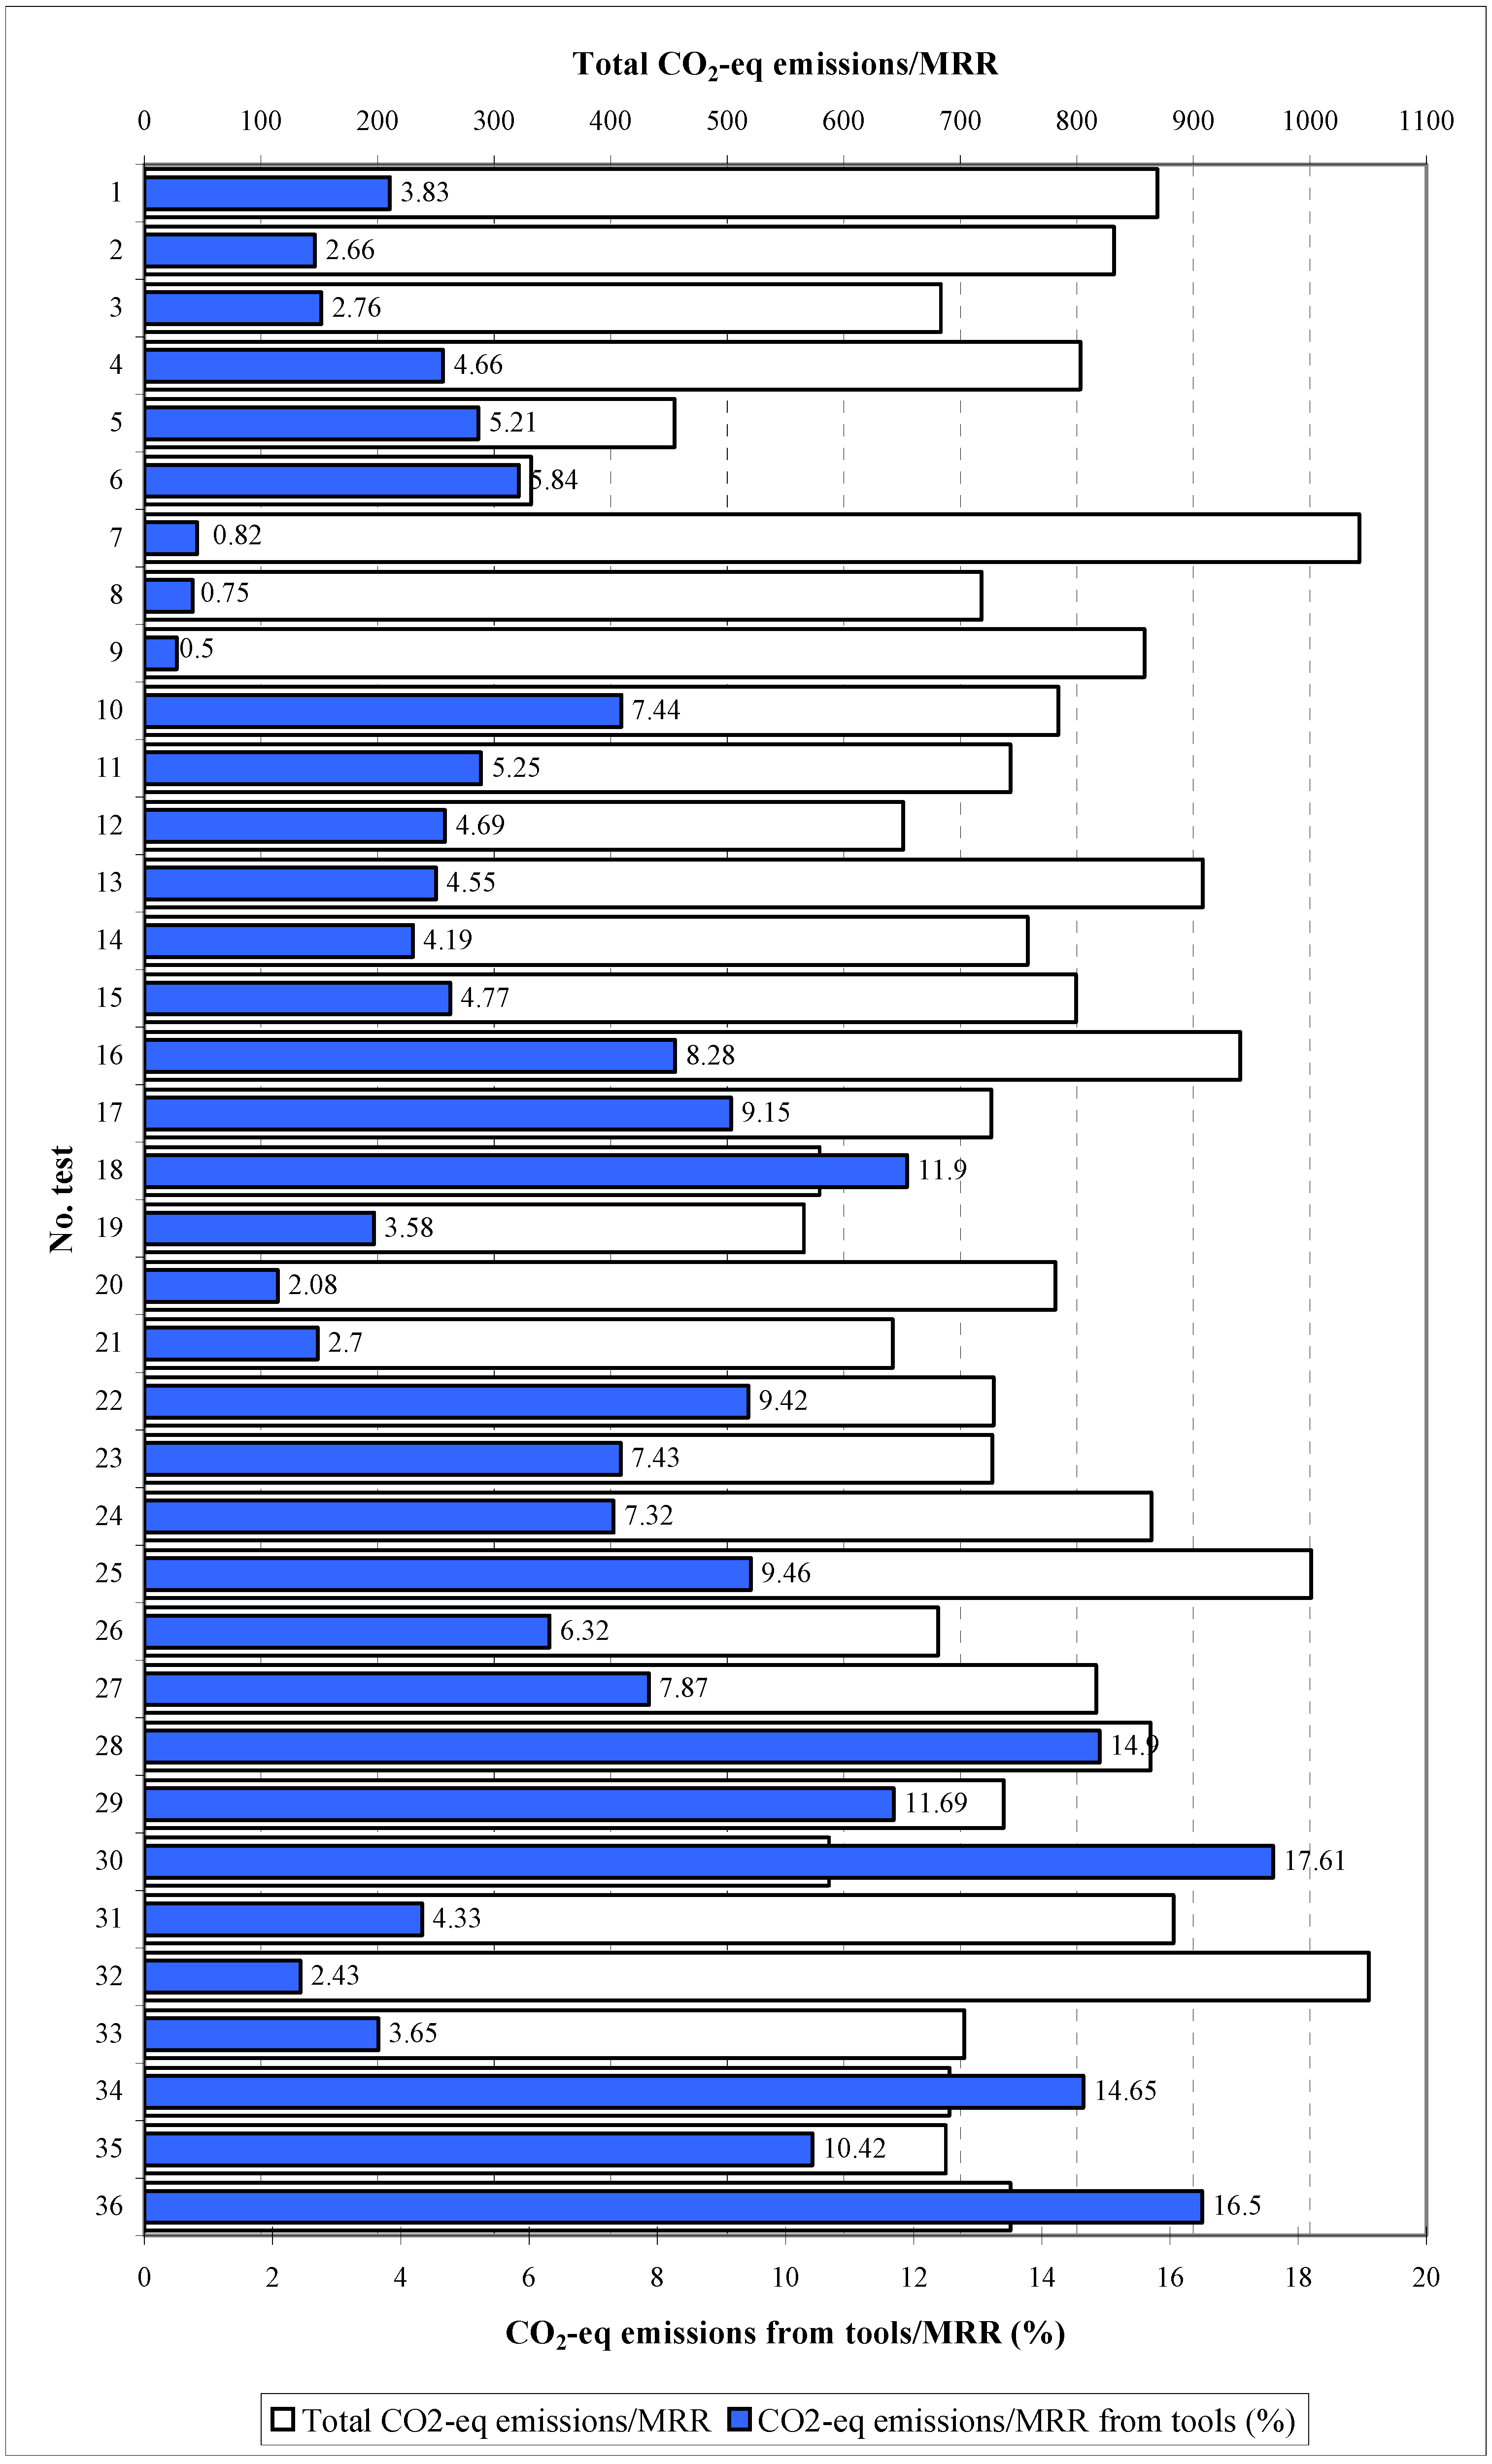
The emissions results for the optimal energy consumption for each insert and the percentages attributed to tools are shown in
Figure 6. In this figure, the number of tests is equivalent to the number of tests presented in
Table 5 and
Table 6 to allow identification of the tool characteristics and cutting parameters. The results show that energy is a more important factor in CO
2-eq emissions, as demonstrated by the finding that higher emissions result from higher energy and not from the emissions associated with tools. The ranking of the inserts from those that generate less emissions to those that generate higher emission is the following: CNMG, CNMG PVD, WNMG PVD and WNMG. These results are consistent with those obtained for energy consumption. As expected, the coating contribution is sufficiently small, and as a result, the percentage is conditioned by the total emissions and not by the coating.
Figure 6.
Contribution of tools to CO2-eq emissions/MRR as a percentage.
Figure 6.
Contribution of tools to CO2-eq emissions/MRR as a percentage.
As shown in
Figure 6, the percentages are between 17.61% and 0.5%. The uncoated insert type CNMG, with
f = 0.2 mm/rev,
vc = 150 m/min and
d = 3 mm, has the greatest contribution (see line 30 of
Table 6), followed by coated insert type CNMG, with
f = 0.1 mm/rev,
vc = 150 m/min and
d = 3 mm (line 36 of
Table 6) and the uncoated insert type CNMG, with
f = 0.2 mm/rev,
vc = 150 m/min and
d = 50 mm (line 28 of
Table 6). The lowest contributions of the tools are found for coated insert type WNMG, with
f = 0.2,
vc = 50 m/min and
d = 1, 2, and 3 mm (lines 7, 8 and 9 of
Table 6). The lower contribution obtained for the WNMG insert is a consequence of the material, even when these inserts consume more energy in machining tests.
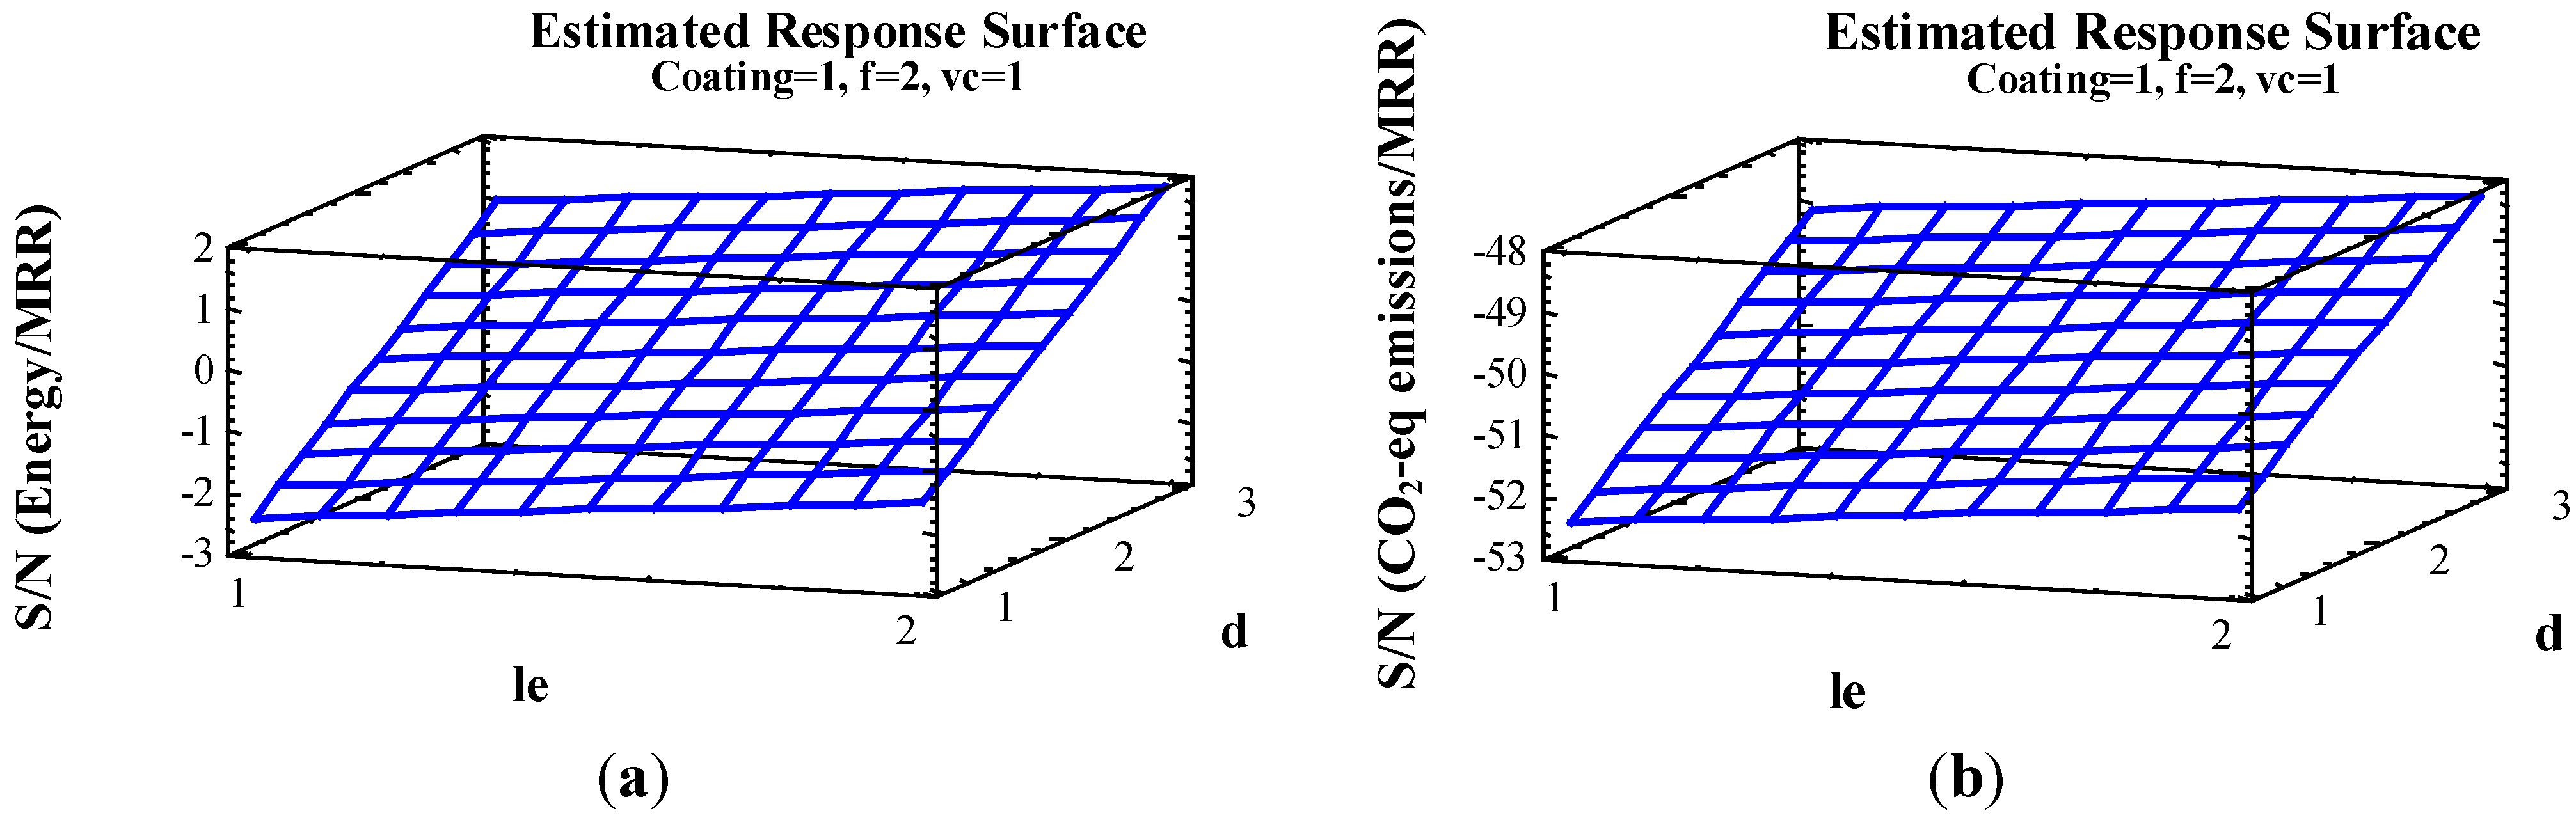
3.4. Evolution of Factors
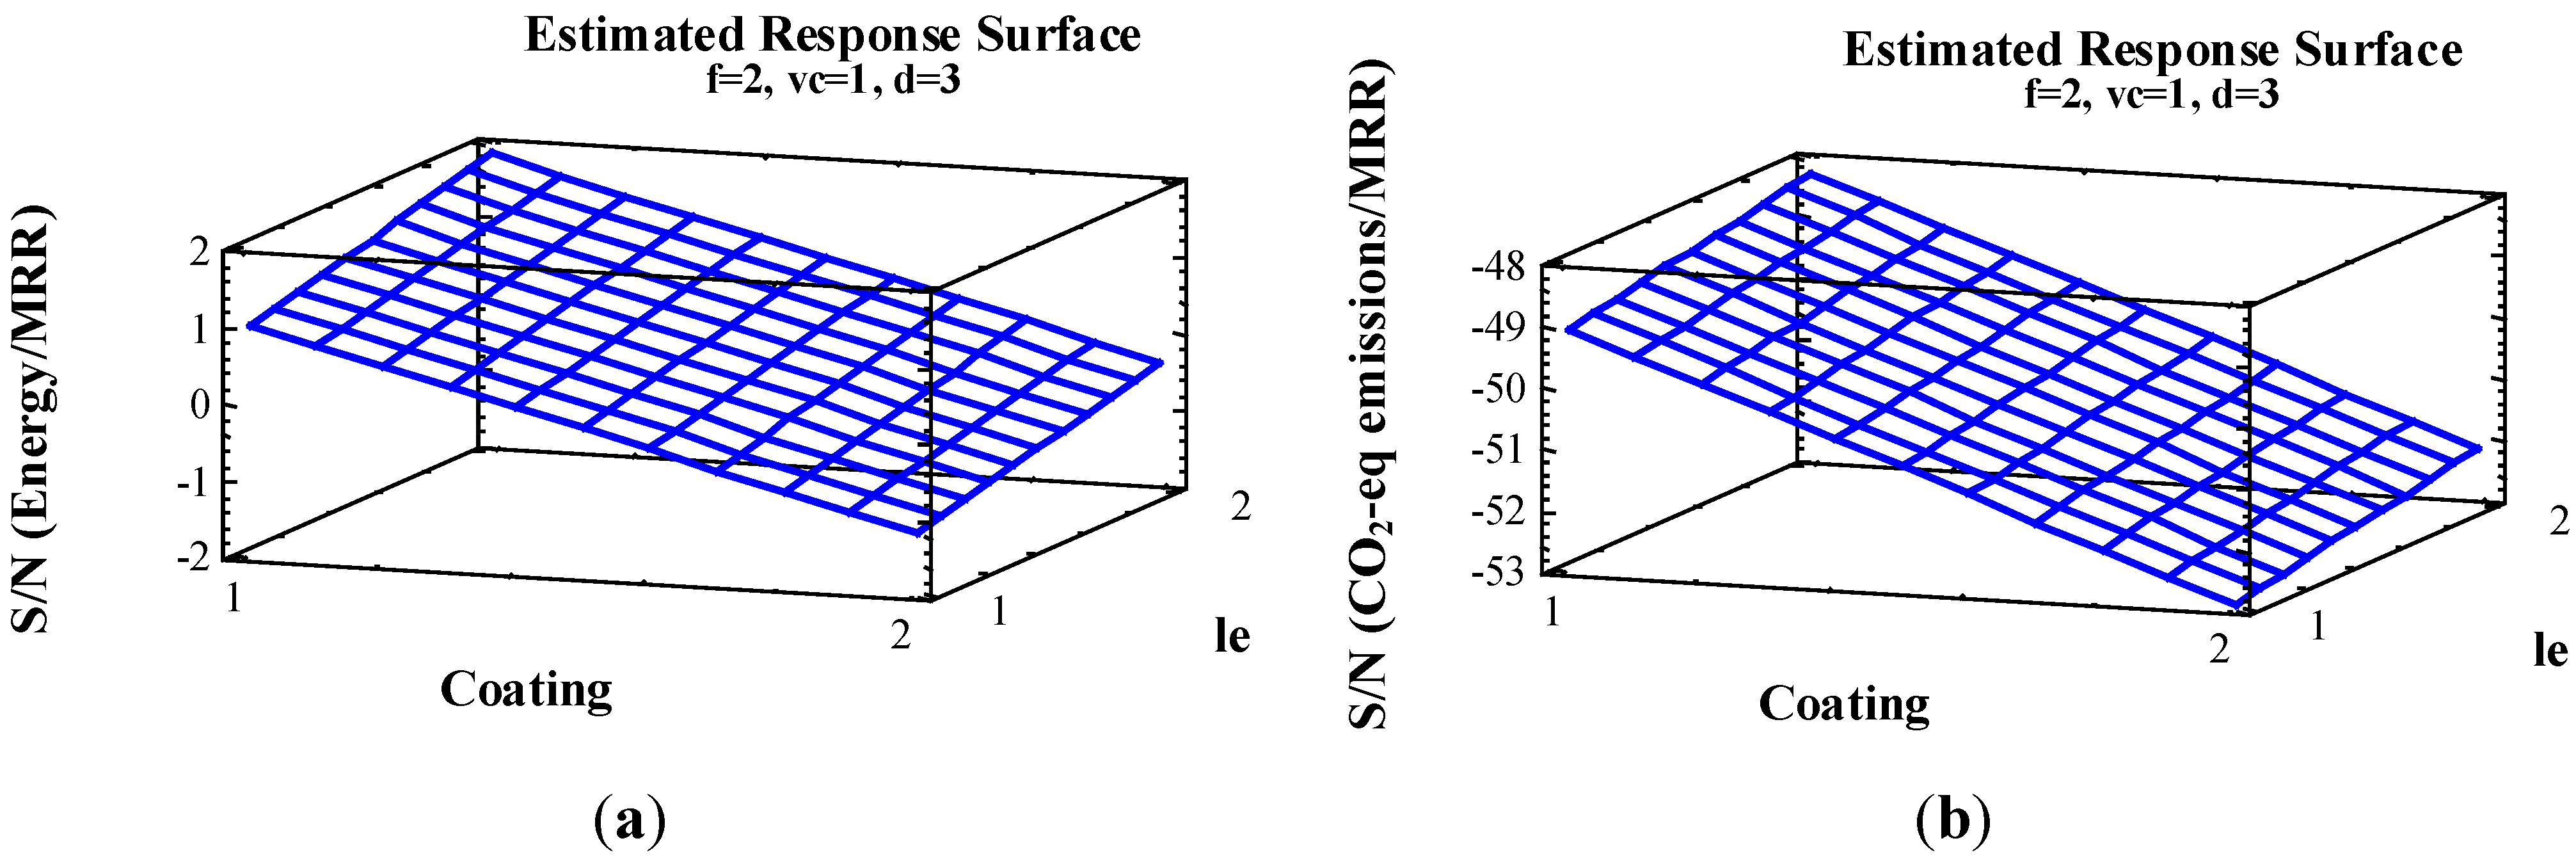
Figure 7 shows the variation of the S/N ratios as
d and
le are increased, and
Figure 8 shows the same variation as
coating and
le are modified under optimal conditions. Both ratios appear to show a similar evolution.
Figure 7.
(a) Values of the S/N ratio (Energy/MRR) with respect to le and d; (b) Values of the S/N ratio (CO2-eq emissions/MRR) with respect to le and d.
Figure 7.
(a) Values of the S/N ratio (Energy/MRR) with respect to le and d; (b) Values of the S/N ratio (CO2-eq emissions/MRR) with respect to le and d.
Figure 8.
(a) Values of the S/N ratio (Energy/MRR) with respect to coating and le; (b) Values of the S/N ratio (CO2-eq emissions/MRR) with respect to coating and le.
Figure 8.
(a) Values of the S/N ratio (Energy/MRR) with respect to coating and le; (b) Values of the S/N ratio (CO2-eq emissions/MRR) with respect to coating and le.
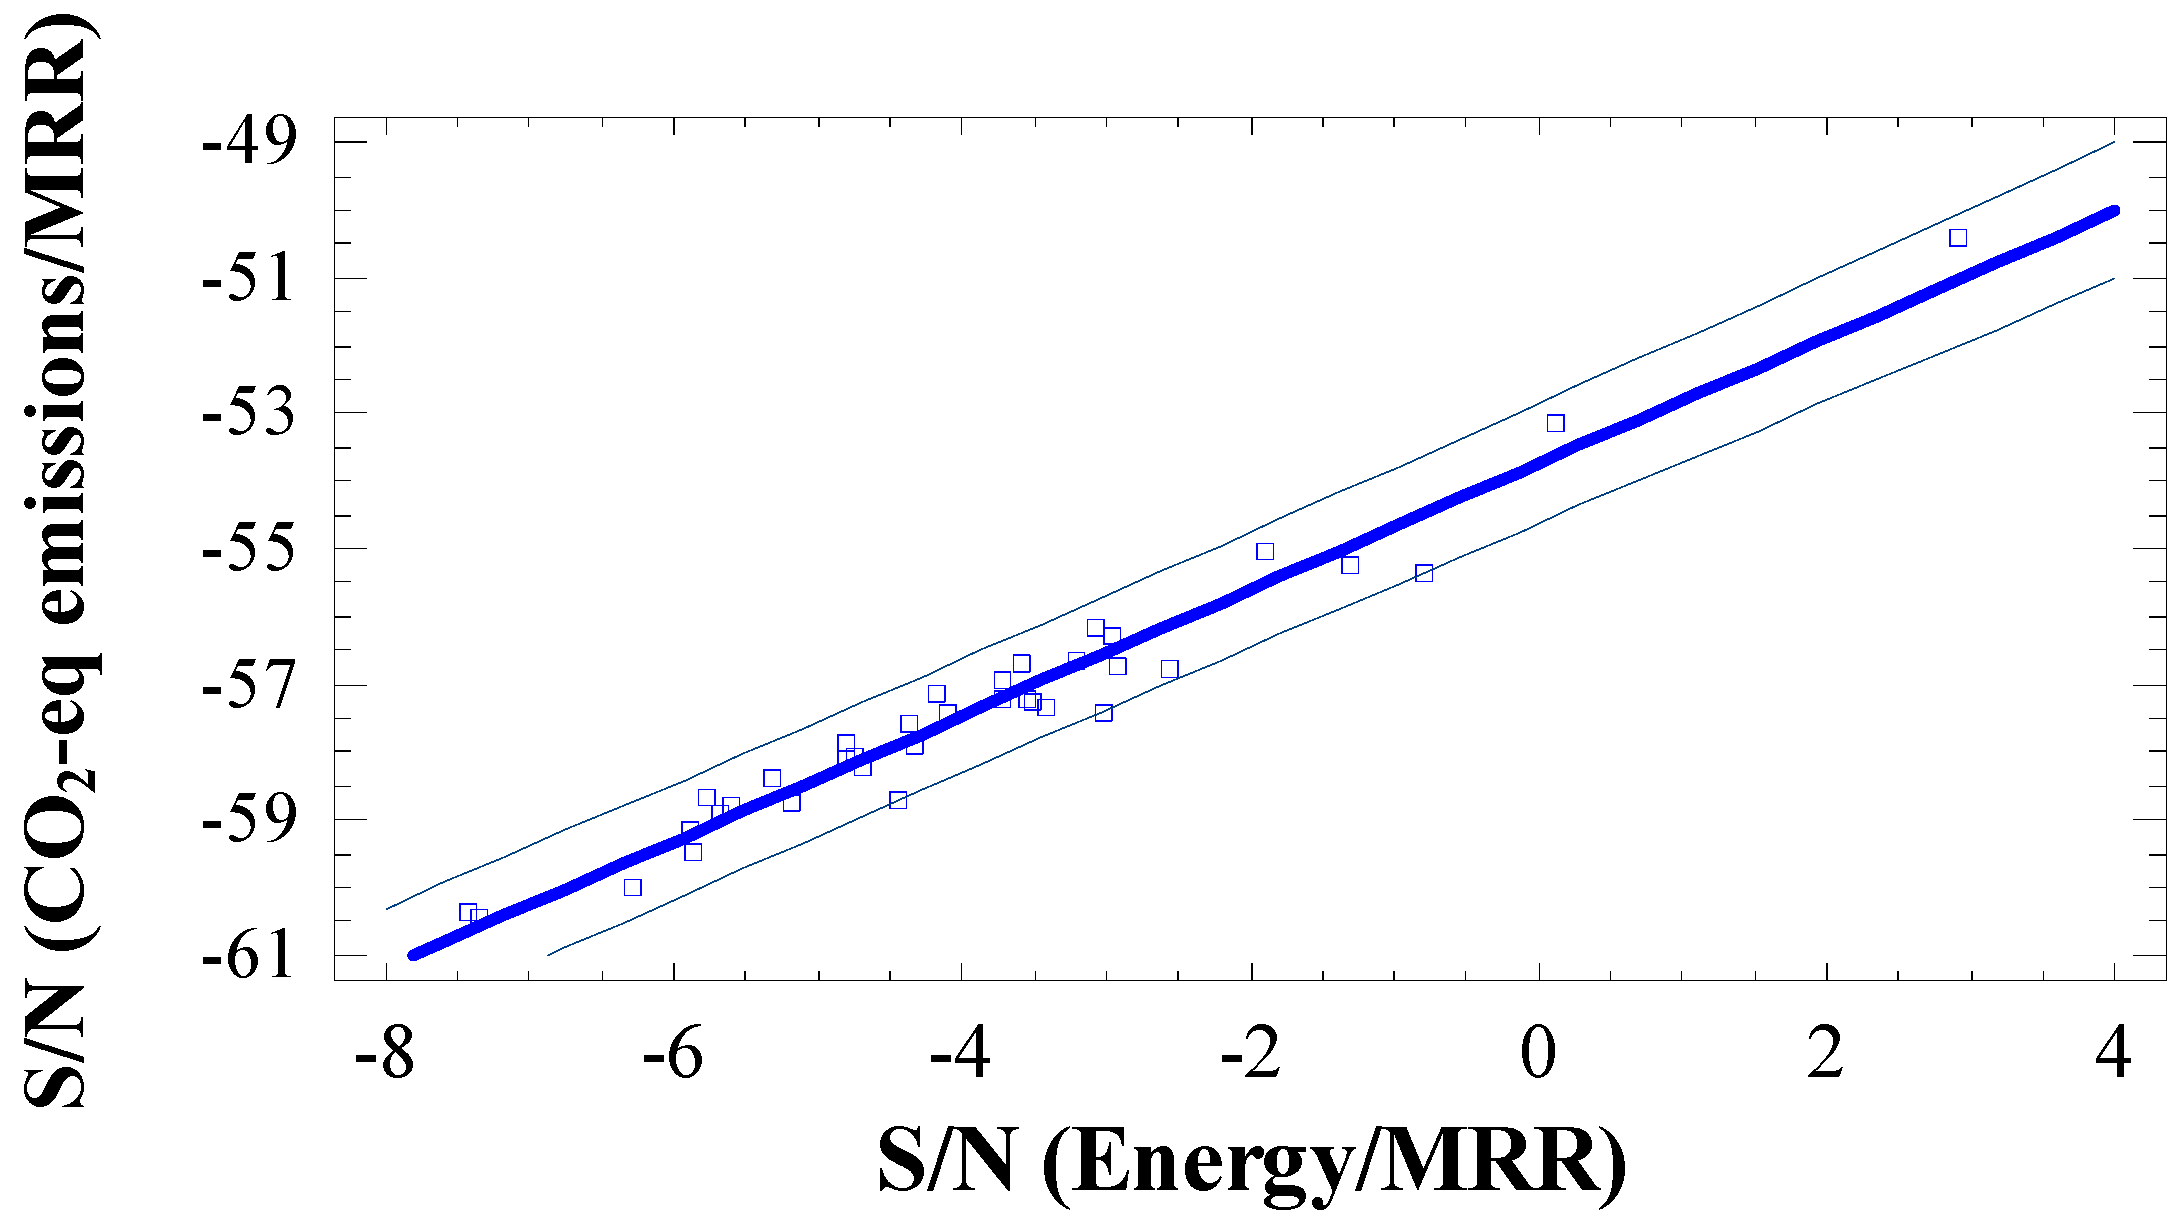
Therefore, linear regression can explain the relationship between S/N Energy/MRR) and S/N (CO
2-eq emissions/MRR). The output shows the results of fitting a linear model via Equation (2). The correlation is 0.9781, and
R2 is 95.66%.
Figure 9 shows the model of the fitted linear regression. The calculation of the energy can be used to determine CO
2-eq emissions without considering the contribution of tools:
Figure 9.
Fitted linear regression model.
Figure 9.
Fitted linear regression model.
4. Conclusions
We have presented a study centered on the selection of cutting inserts for environmentally efficient machining. This paper contributes to the understanding of this field by providing a quantitative evaluation of the main different technological and operational factors associated with modern machining using cutting inserts. Utilizing a widely used titanium alloy, the approach includes proper qualitative ratios of energy use and CO2 impact related to a main manufacturing activity metric (MRR). Comprehensive experimentation and a subsequent statistical analysis using the Taguchi and ANOVA techniques represent a systematic methodology for qualitative and quantitative assessment.
The methodology proposed can contribute to the conservation of resources through the identification of practices in manufacturing processes, particularly in the turning operations of Ti6Al4V alloy, that result in lower energy/MRR consumption and lower CO2-eq emissions/MRR. For both metrics, energy and emissions, the study outcomes show that a high tool cutting length and a high cutting depth were identified as significant factors. Thus, this alloy is sensitive to cutting conditions and also to tool geometry, rather than tool material.
The inserts were ranked from those that have minor effects on the energy/MRR and CO2-eq emissions/MRR to those that have major effects in these ratios: CNMG, CNMG PVD, WNMG PVD and WNMG. The coating has a low impact and an uncoated insert is a first choice for a high cutting depth and a high tool cutting length. This is a remarkable conclusion, because the use of coated inserts can be avoided in roughing operations, improving cost and performance.
This study demonstrates the need to consider cutting inserts as an element capable of reducing the machining contribution to climate change through the industrial activity. The carbon footprint is directly proportional to energy consumption. In this sense, forthcoming studies related to the sustainability and environmental impact of machining processes could focus more on the fundamental analysis of energy rather than the analysis of the downstream effect of emissions.


