
Industrial Photovoltaic Systems: An Economic Analysis in Non-Subsidized Electricity Markets


Abstract
:1. Introduction
2. Materials and Methods
2.1. The Italian Photovoltaic (PV) Sector Status
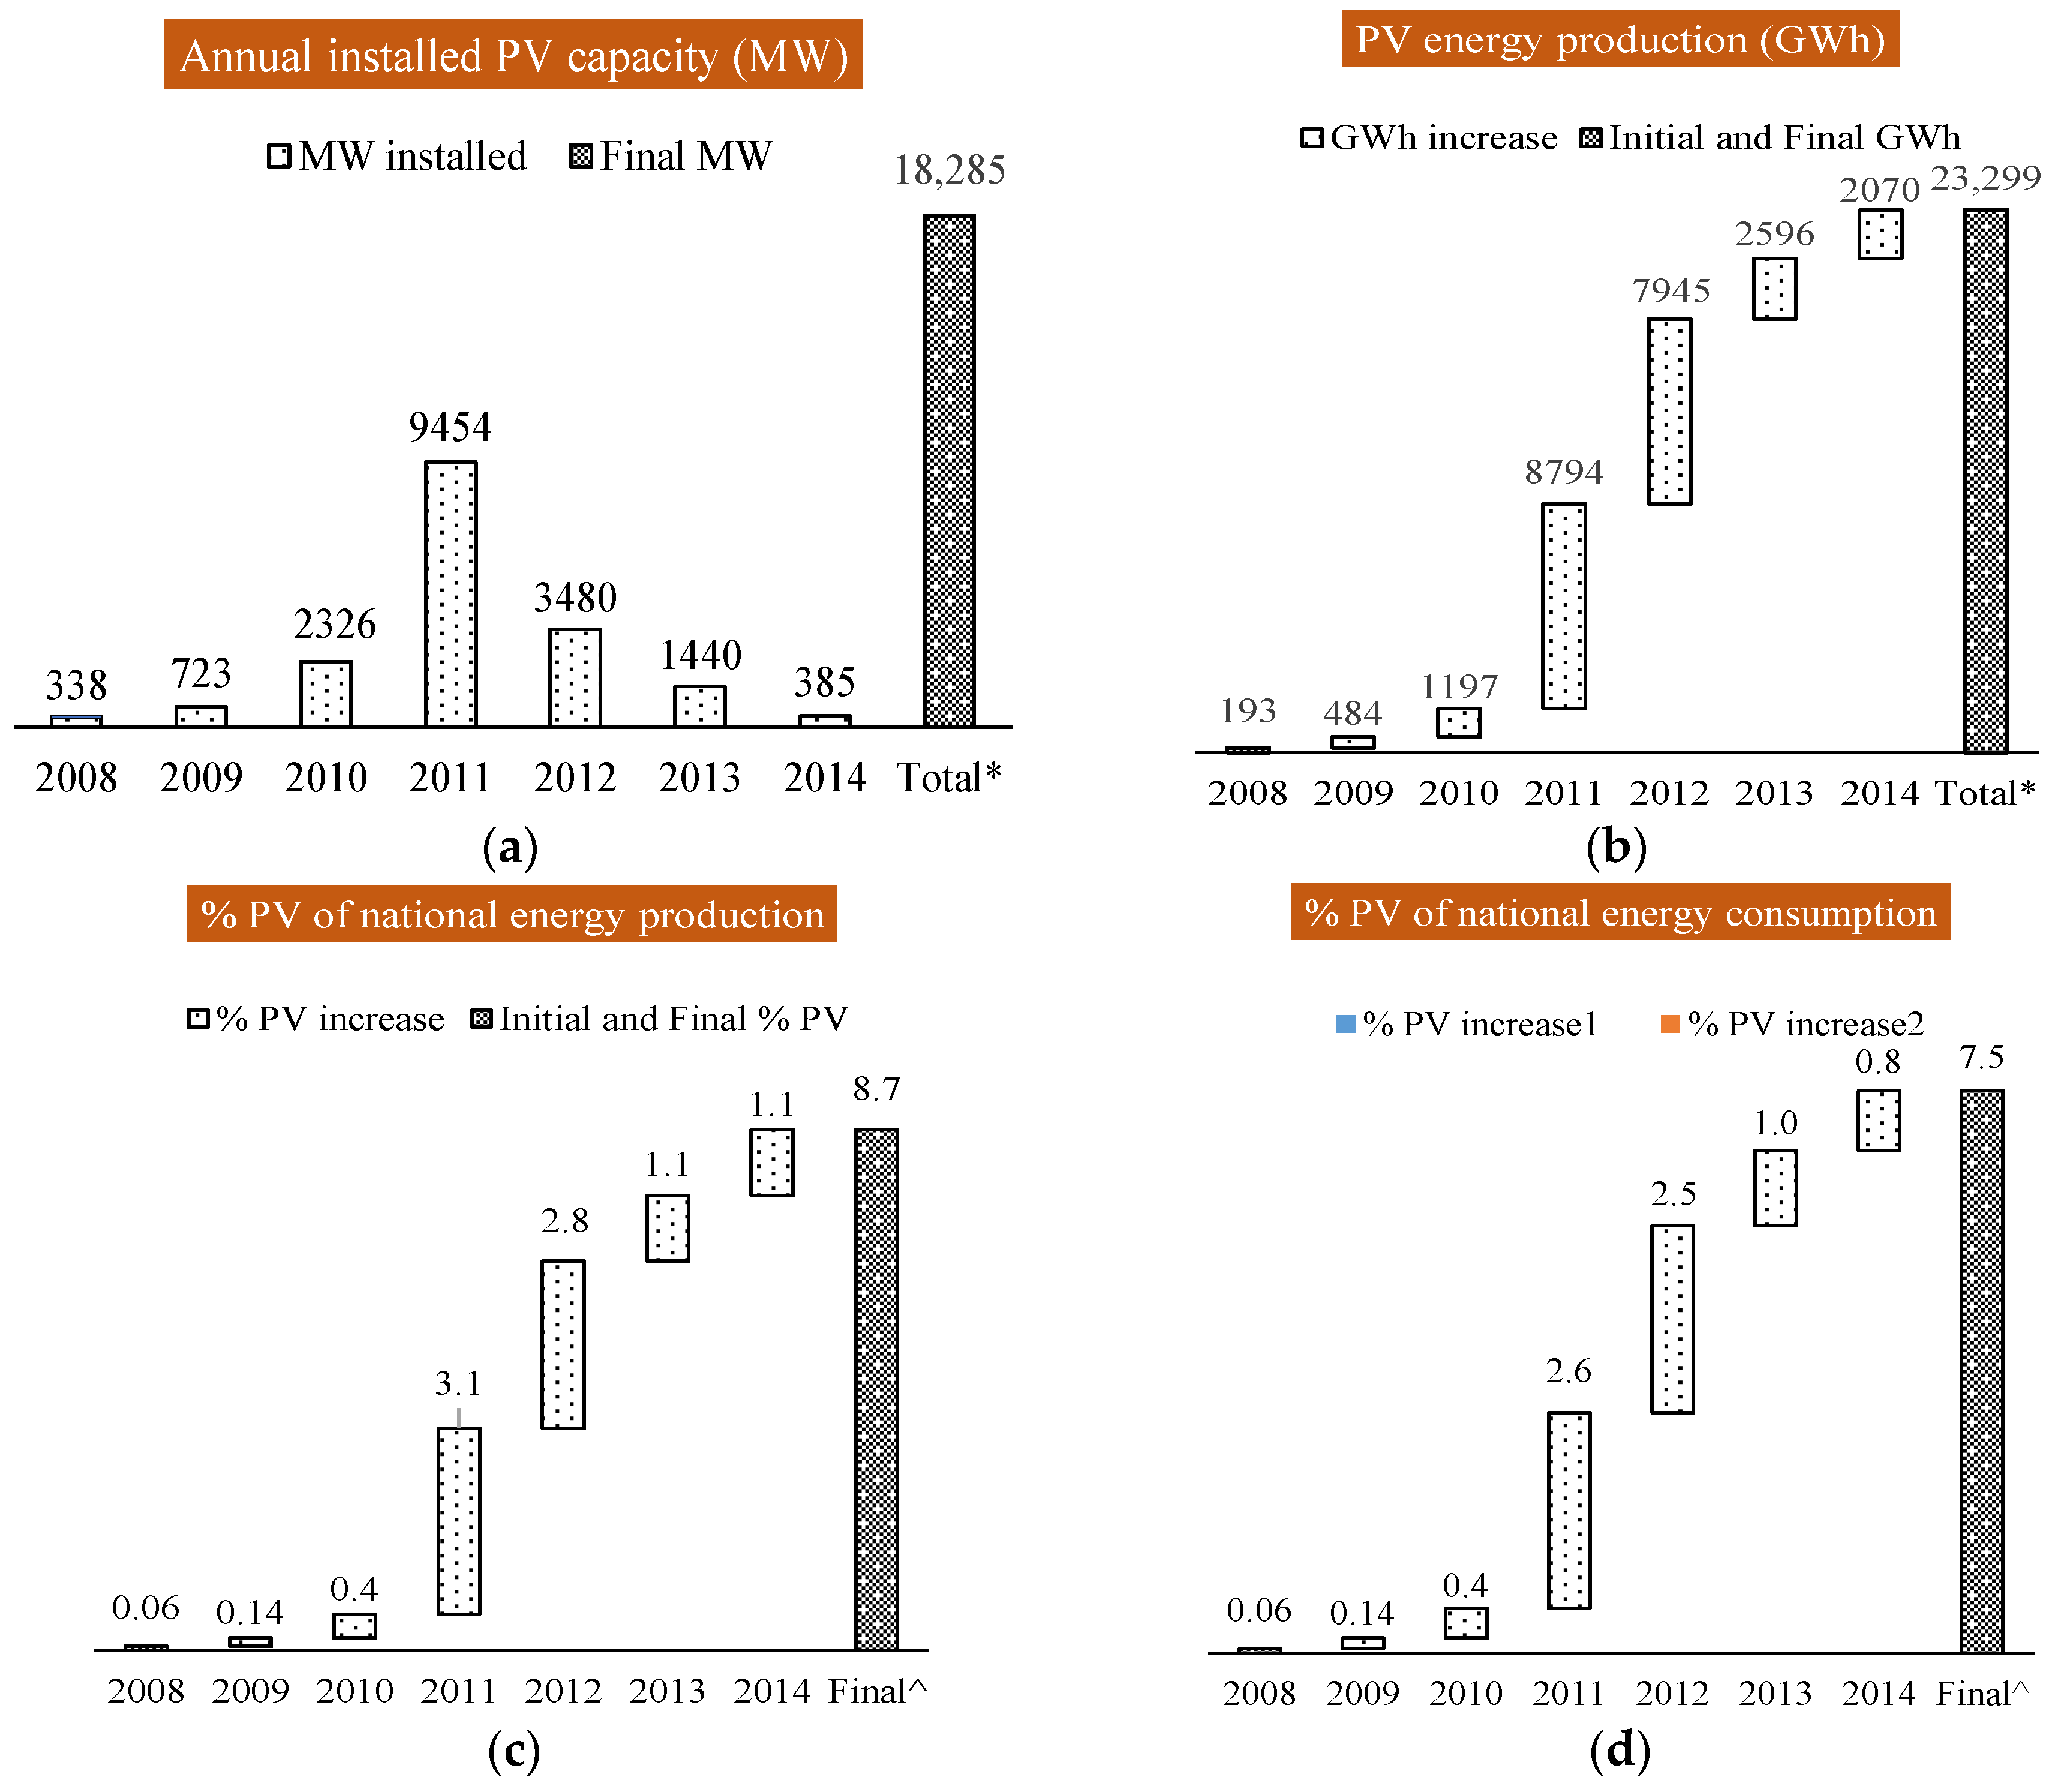
- The installed power increased from 477 MW to 18,285 MW in the 2008–2014 period, with 52% of installations in 2011;
- The electric generation grew from 193 GWh to 23,229 GWh in the 2008–2014 period, with a 2014 growth rate of 9% in comparison to 2013;
- The PV electric production is equal to 8.7% of the national production and to 7.5% of the national consumption. These values in 2008 were less than 0.1%;
- The 2014 installed power mainly referred to residential plants (about 59% of them has a power ≤20 kW). Big plants were hugely reduced (12% and 4% for 201–1000 kW and >1 MW power plants, respectively);
- The 2014 installed power was mainly located in the northern part of Italy, characterized by less favourable insolation rates (Lombardia 14.2%, Veneto 12.1%, Emilia Romagna 11.6%, Lazio 7.9%, Piemonte 7.7% and Toscana 7.4%).
2.2. Policy Aspects
2.3. Environmental Impact
2.4. Economic Assessment

| Size | Value (€/kW) | Reference | Size | Value (€/kW) | Reference |
|---|---|---|---|---|---|
| 200 kW | (−115)–180 1 | [22] | 1 MW | 400–550 1 | [22] |
| 200 kW | (−740)–560 2 | [22] | 1 MW | 90–740 2 | [22] |
| 400 kW | 160–310 1 | [22] | 1 MW | 800–1200 2 | [42] |
| 400 kW | (−150)–500 2 | [22] | 1 MW | 274–2638 2 | [44] |
| 1 MW | 1561 1 | [32] | 5 MW | (−510)–3200 2 | [45] |
| 1 MW | 576–2513 2 | [32] | 5 MW | 1225 1 | [32] |
| 1 MW | (−296)–3691 2 | [45] | 5 MW | 340–2128 2 | [32] |
2.5. Model Assumptions
| Variable | Value | Variable | Value |
|---|---|---|---|
| Acell | 7 m2/kWp | 13 cent€/kWh | |
| Cae | 12.5 1–15.6 2–25 3–70 4 k€ | 3.9 3,4–8.3 1,2 cent€/kWh | |
| Cinv,unit | 1280 1–1040 2–800 3–700 4 €/kW | 0.4% | |
| dEf | 0.7% | 15% | |
| Ebos | 85% | 1% | |
| Ef | 16% | 43.5% | |
| inf | 2% | f (size) | |
| infel | 1.5% | r | 5% |
| kf | 1.13 | rd | 3% |
| N | 20 y | tr | 1450 kWh/m2·y |
| Ndebt | 15 y | 50% | |
| f (size) | 50% |
3. Results
| Indicators | 200 kW | 400 kW | 1 MW | 5 MW |
|---|---|---|---|---|
| Energy output of PV system (MWh) | 5787 | 11,574 | 28,936 | 144,680 |
| Reduction in the emissions of carbon dioxide (tCO2eq) | 3993 | 7986 | 19,966 | 99,830 |
| Discounted payback time (DPBT) (y) | 16 | 5 | 4 | 2 |
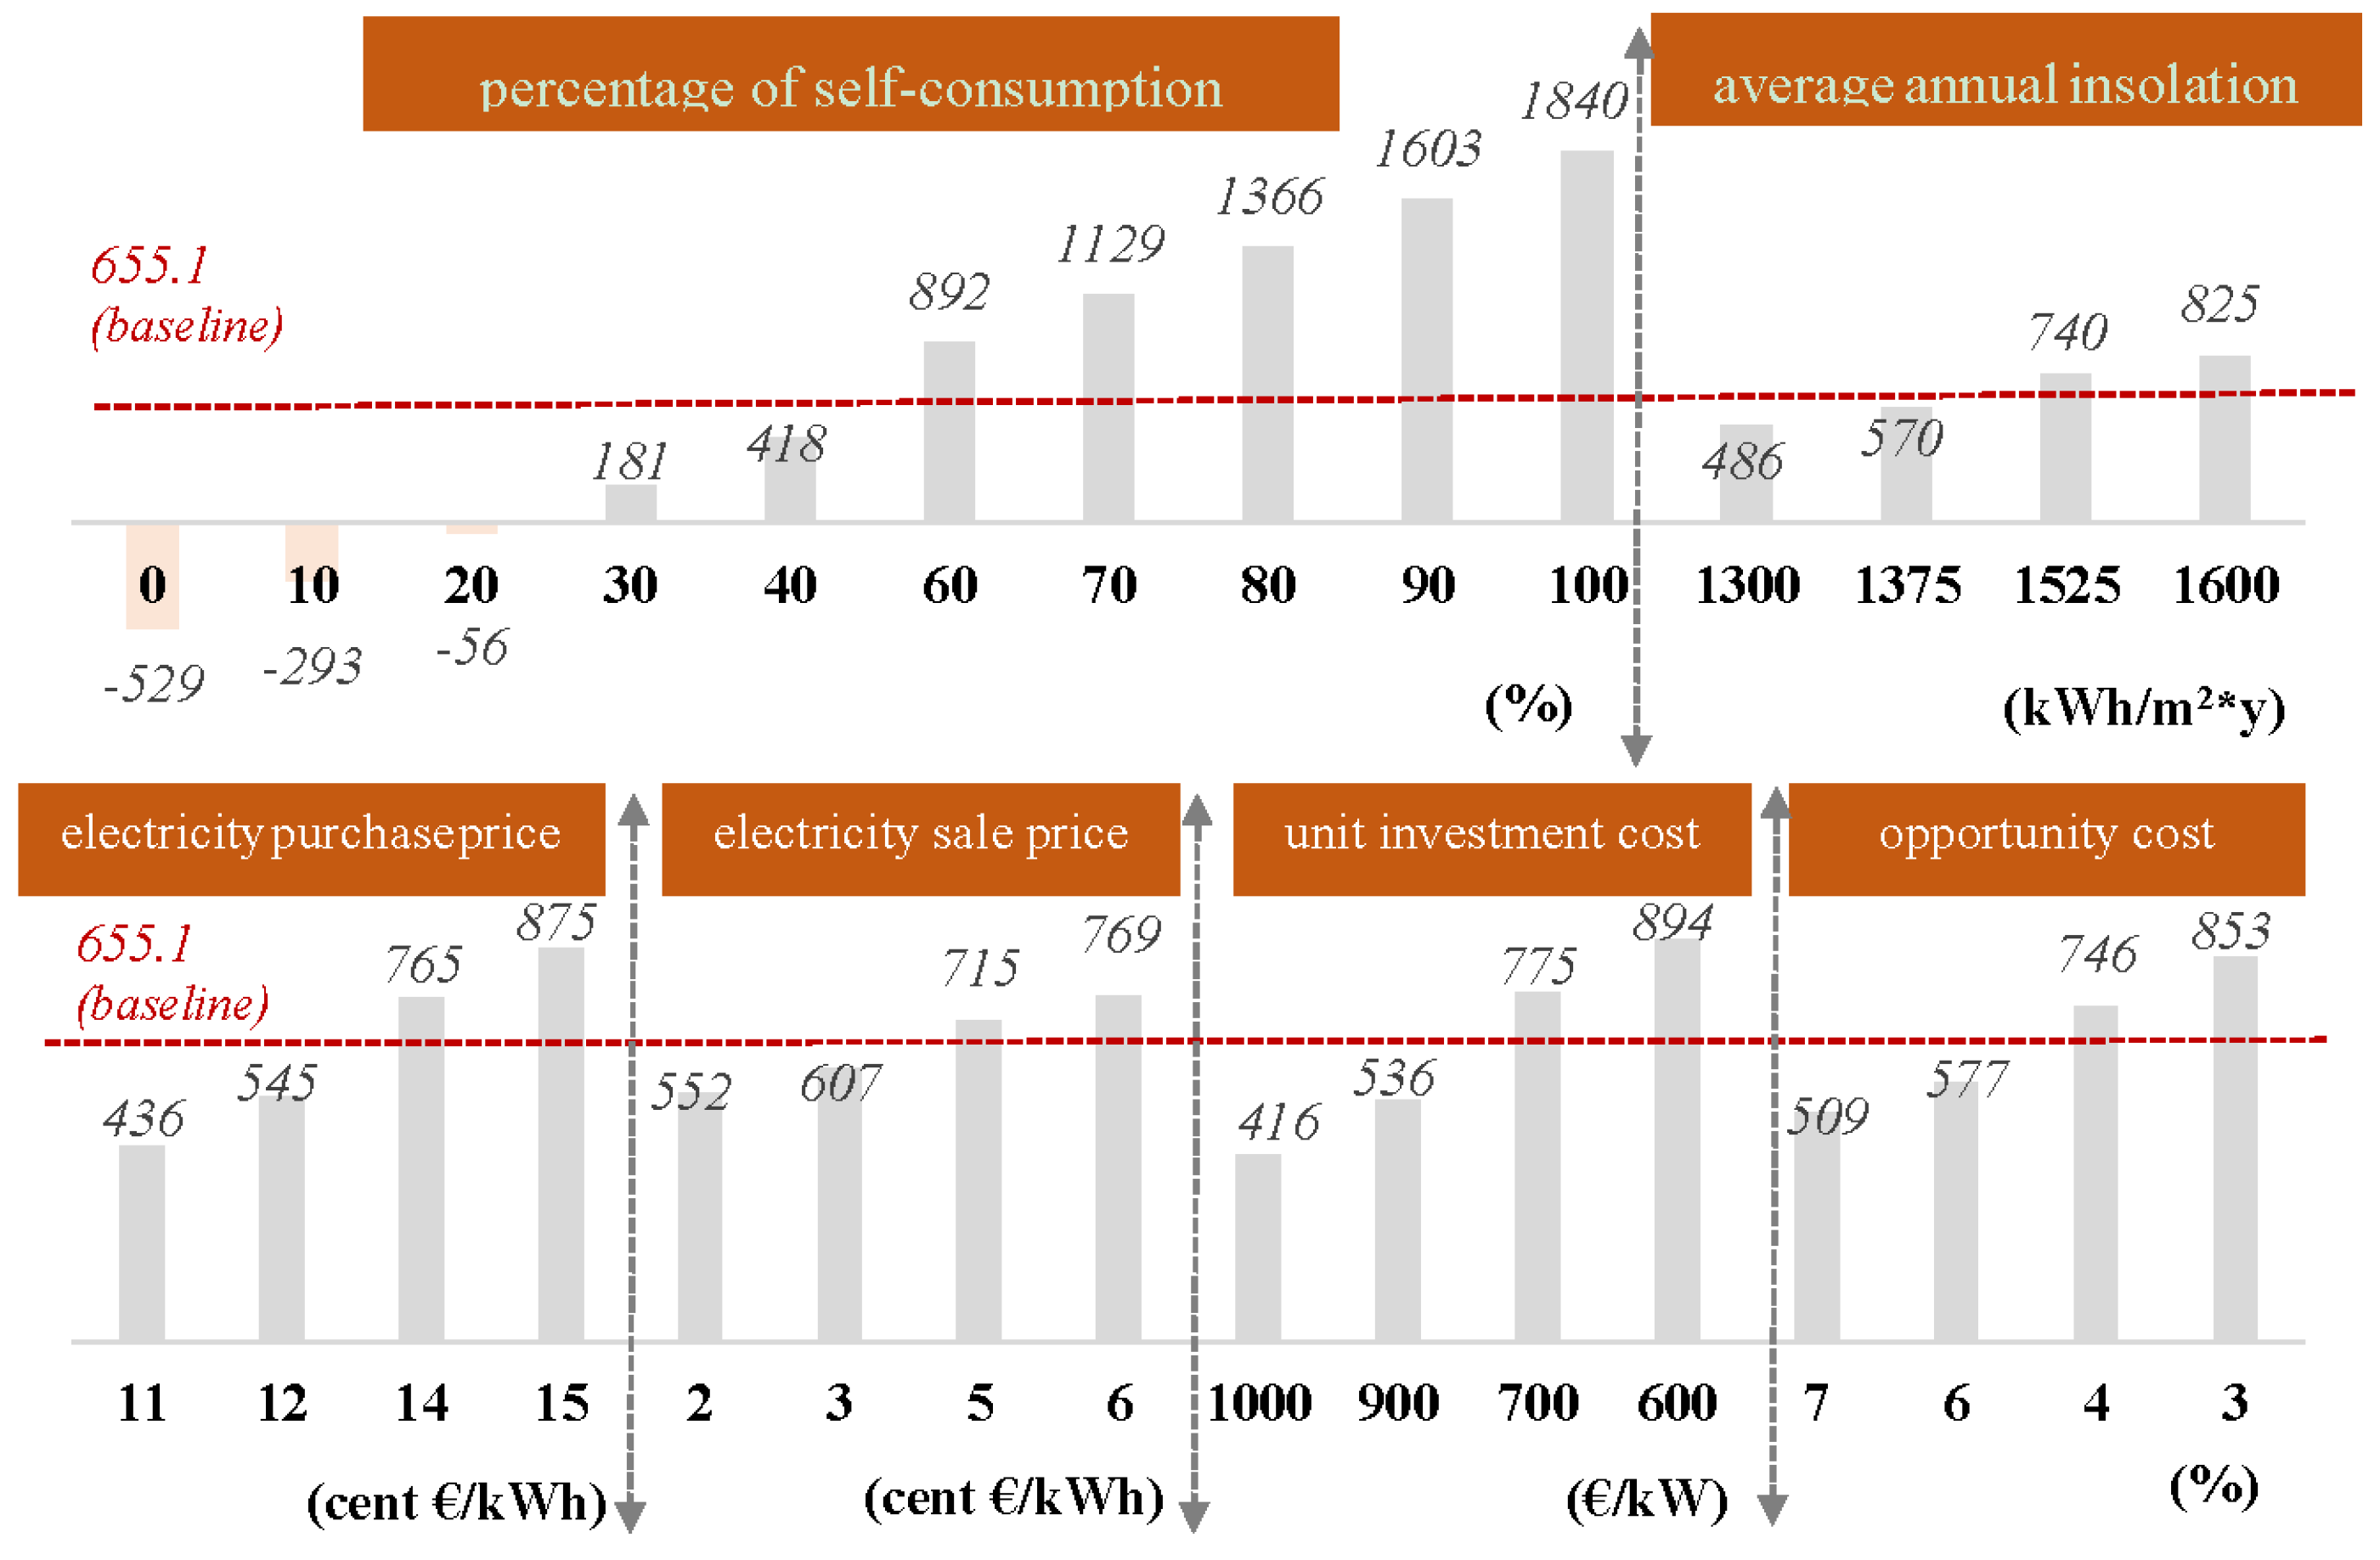
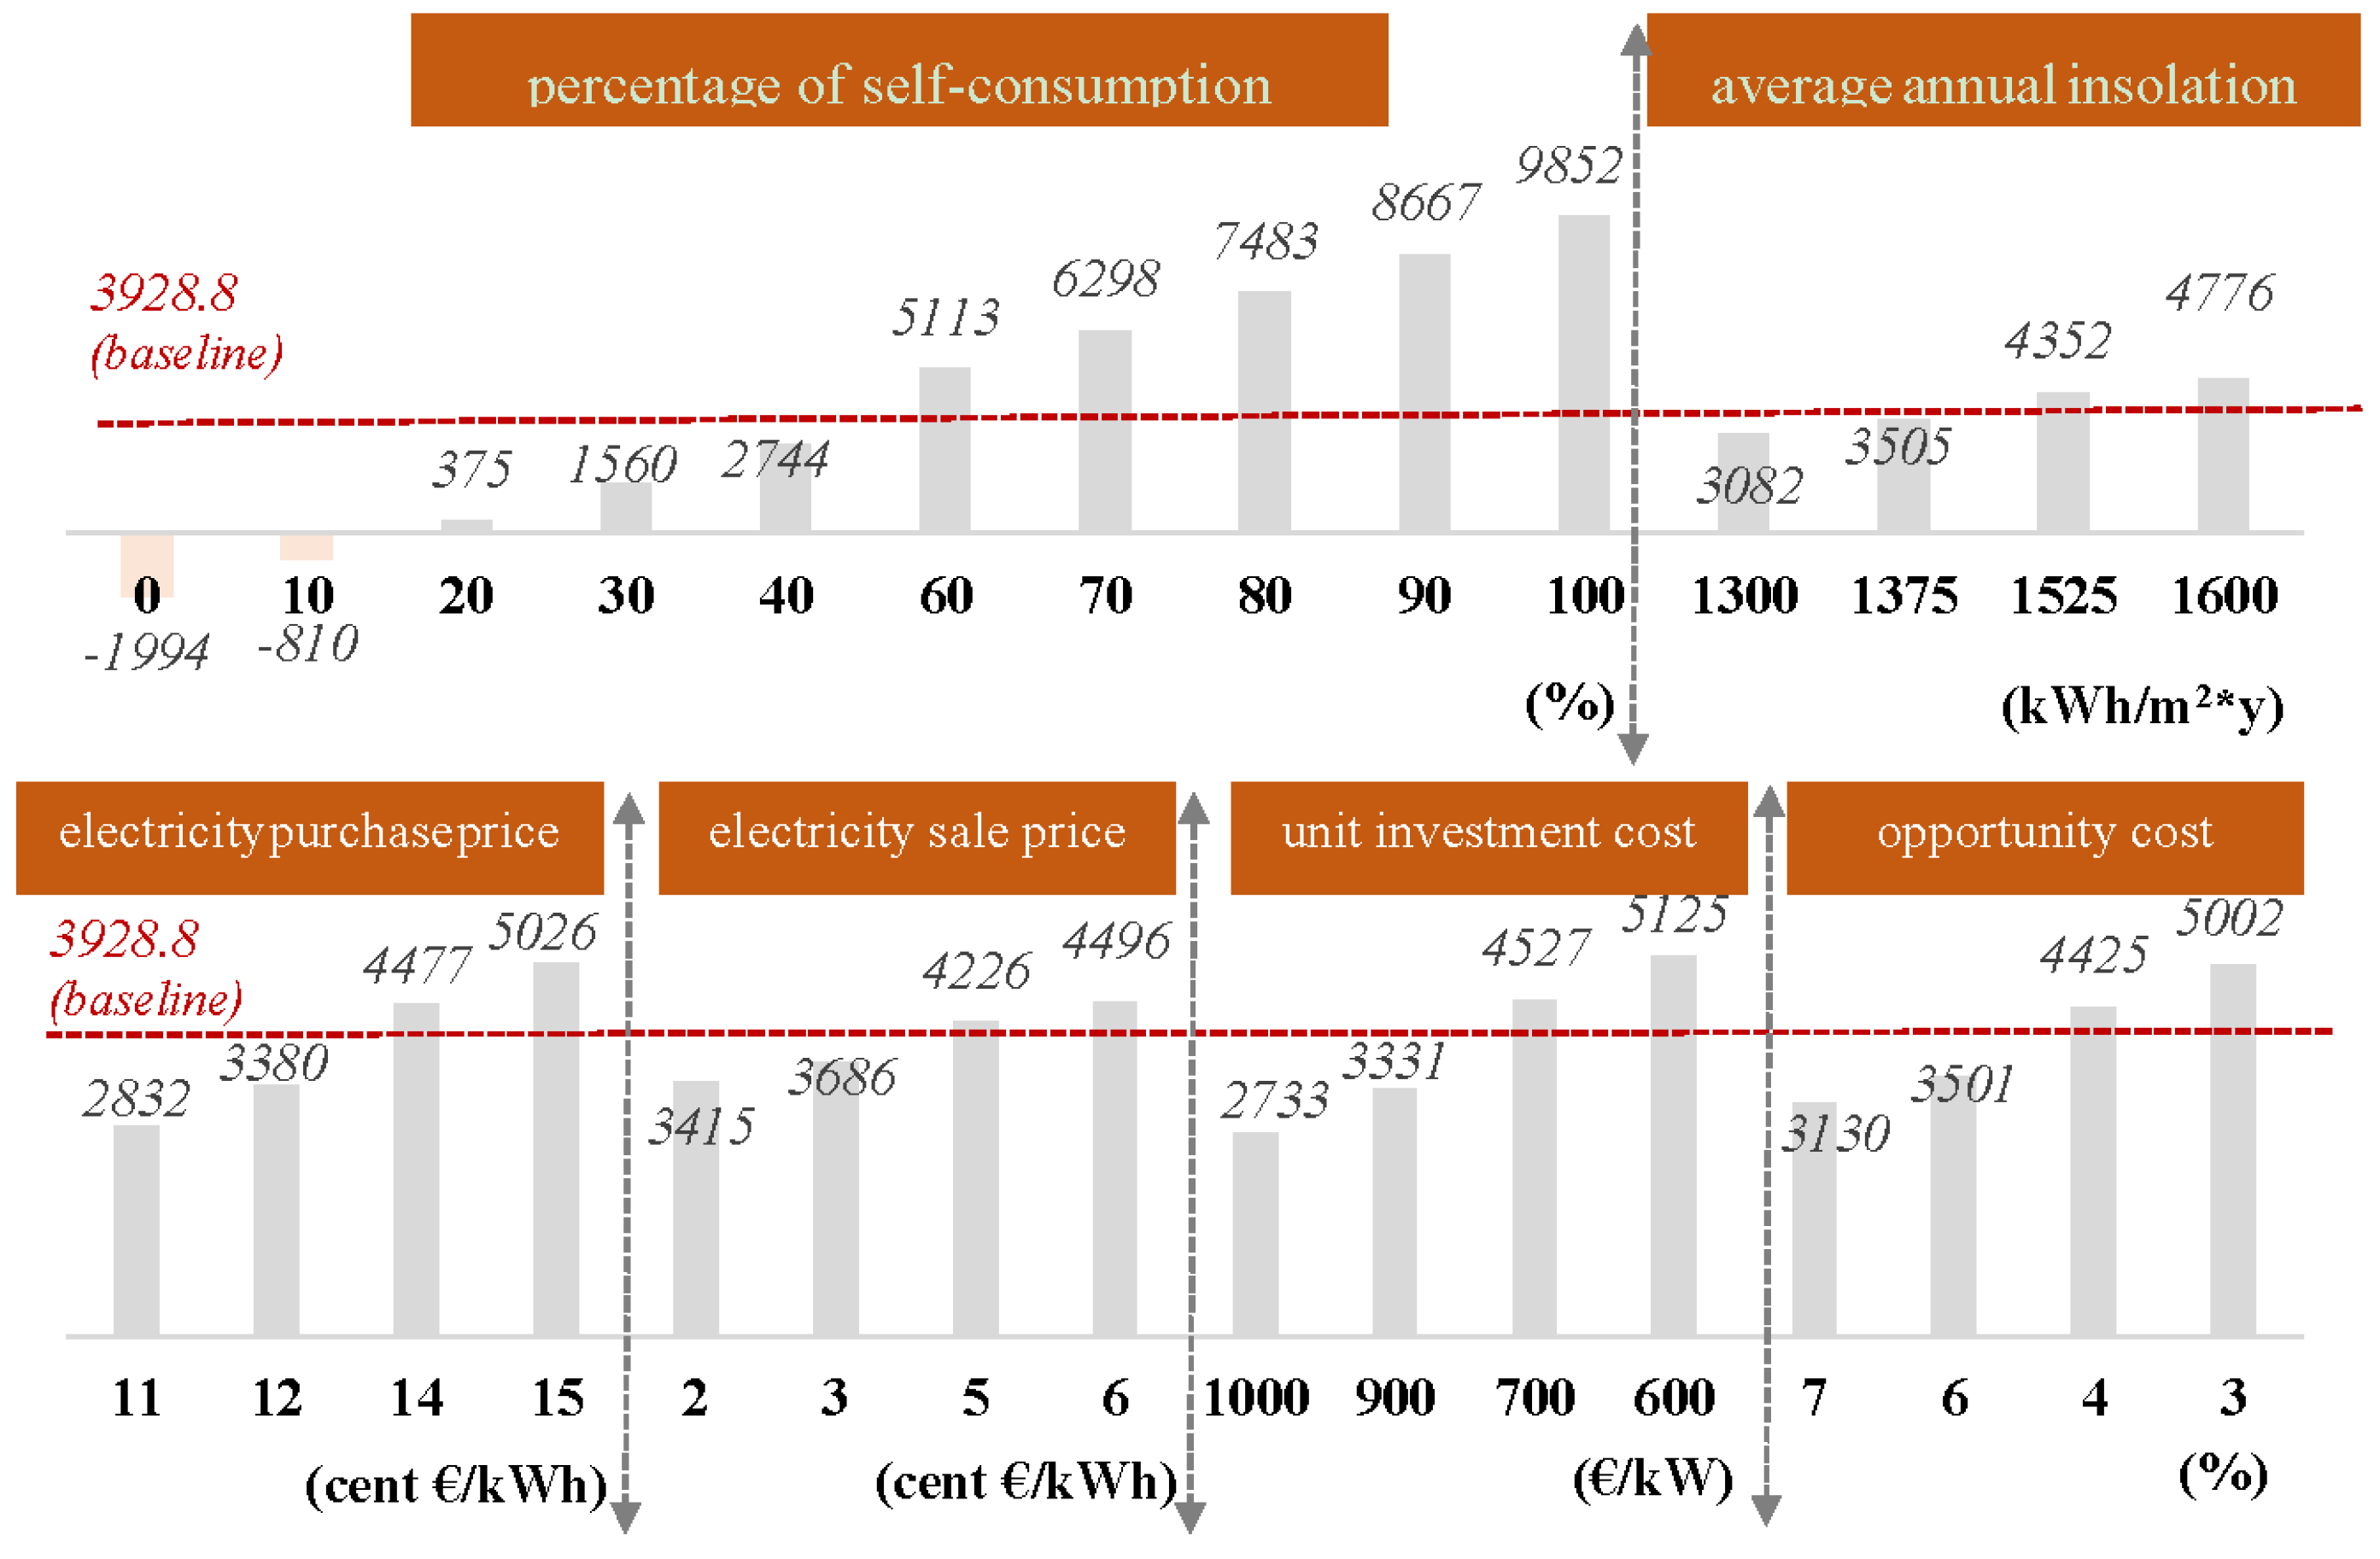
| Net present value (NPV) (k€) | 56.2 | 236.7 | 655.1 | 3928.9 |
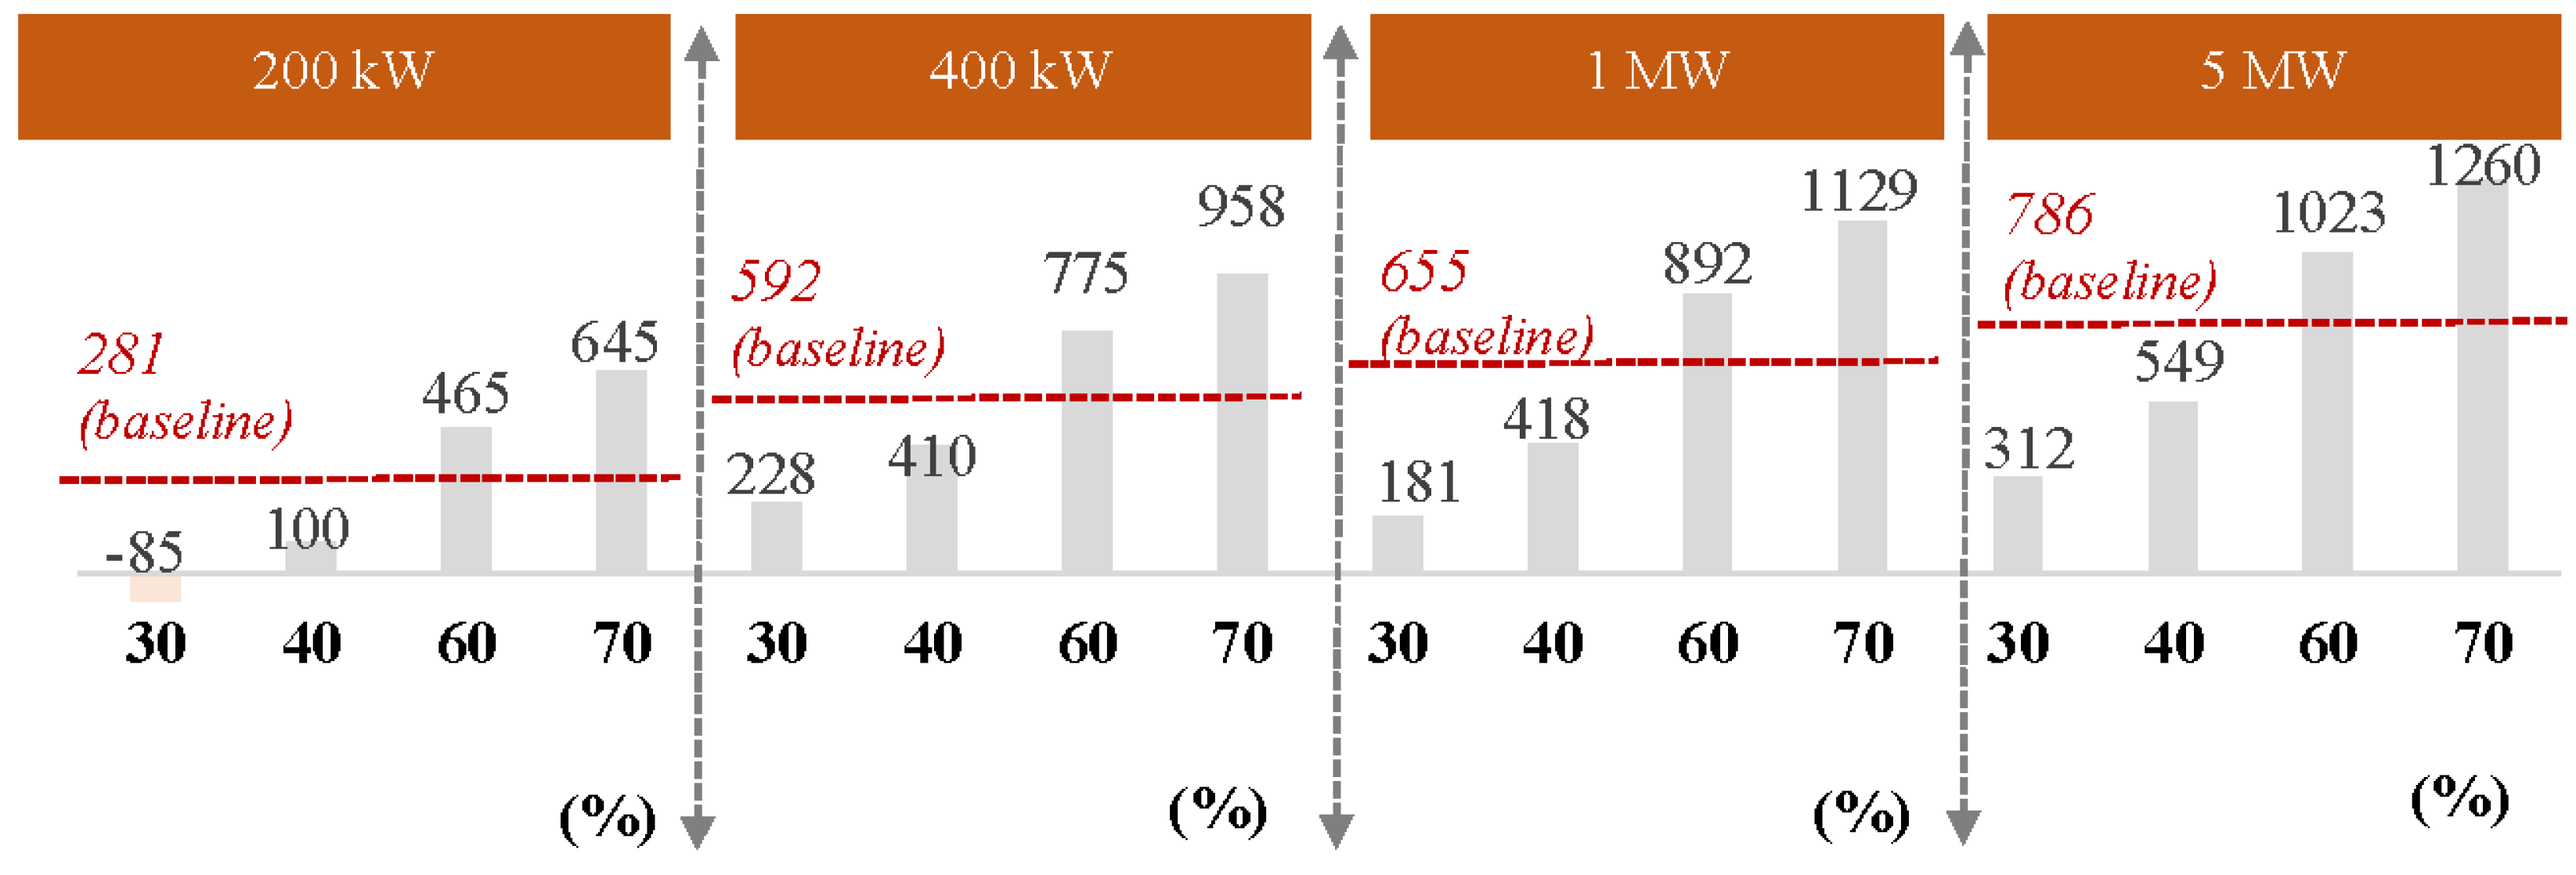
| NPV/power (€/kW) | 281 | 592 | 655 | 786 |
- The 400 kW plant results (if compared to 200 kW), and 5 MW plants results (if compared to 1 MW), are expected, given they have the same energy selling price and the same unitary investment cost reduction;
- 200 kW and 400 kW plants, while exploiting the net metering service, present less advantageous economic results. This means that cost reduction is more significant than revenue items.
4. Sensitivity Analysis
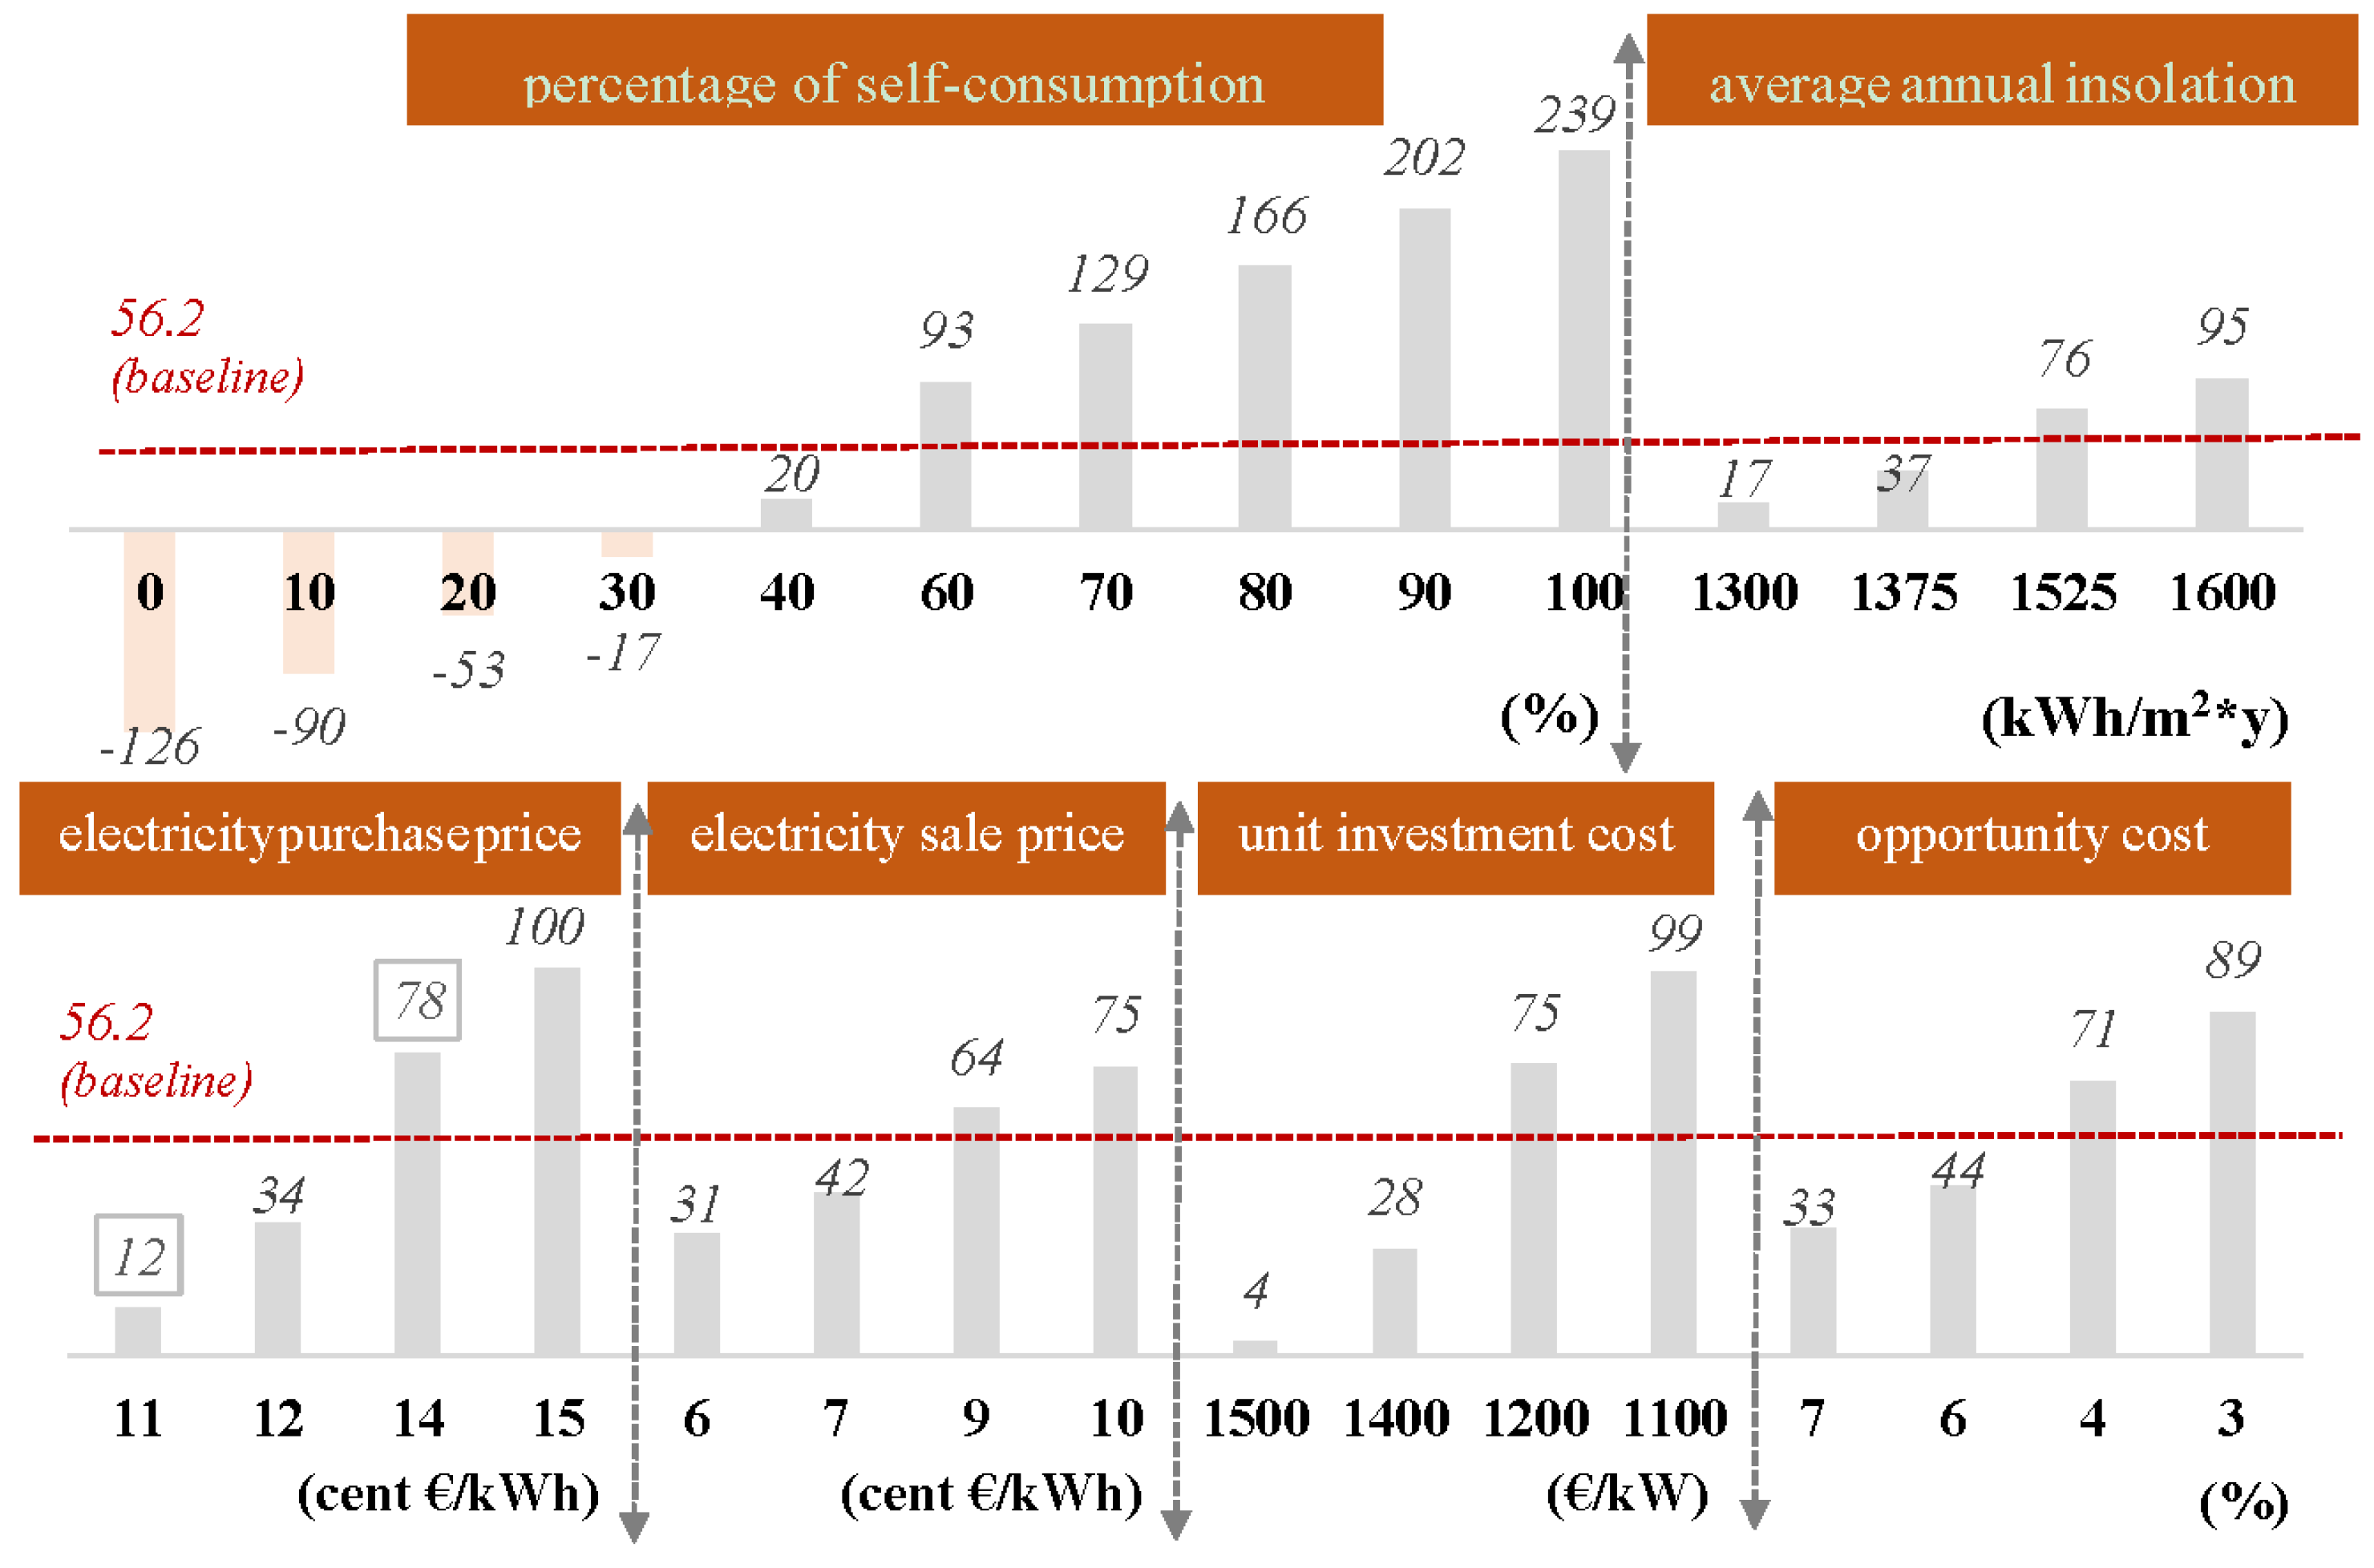
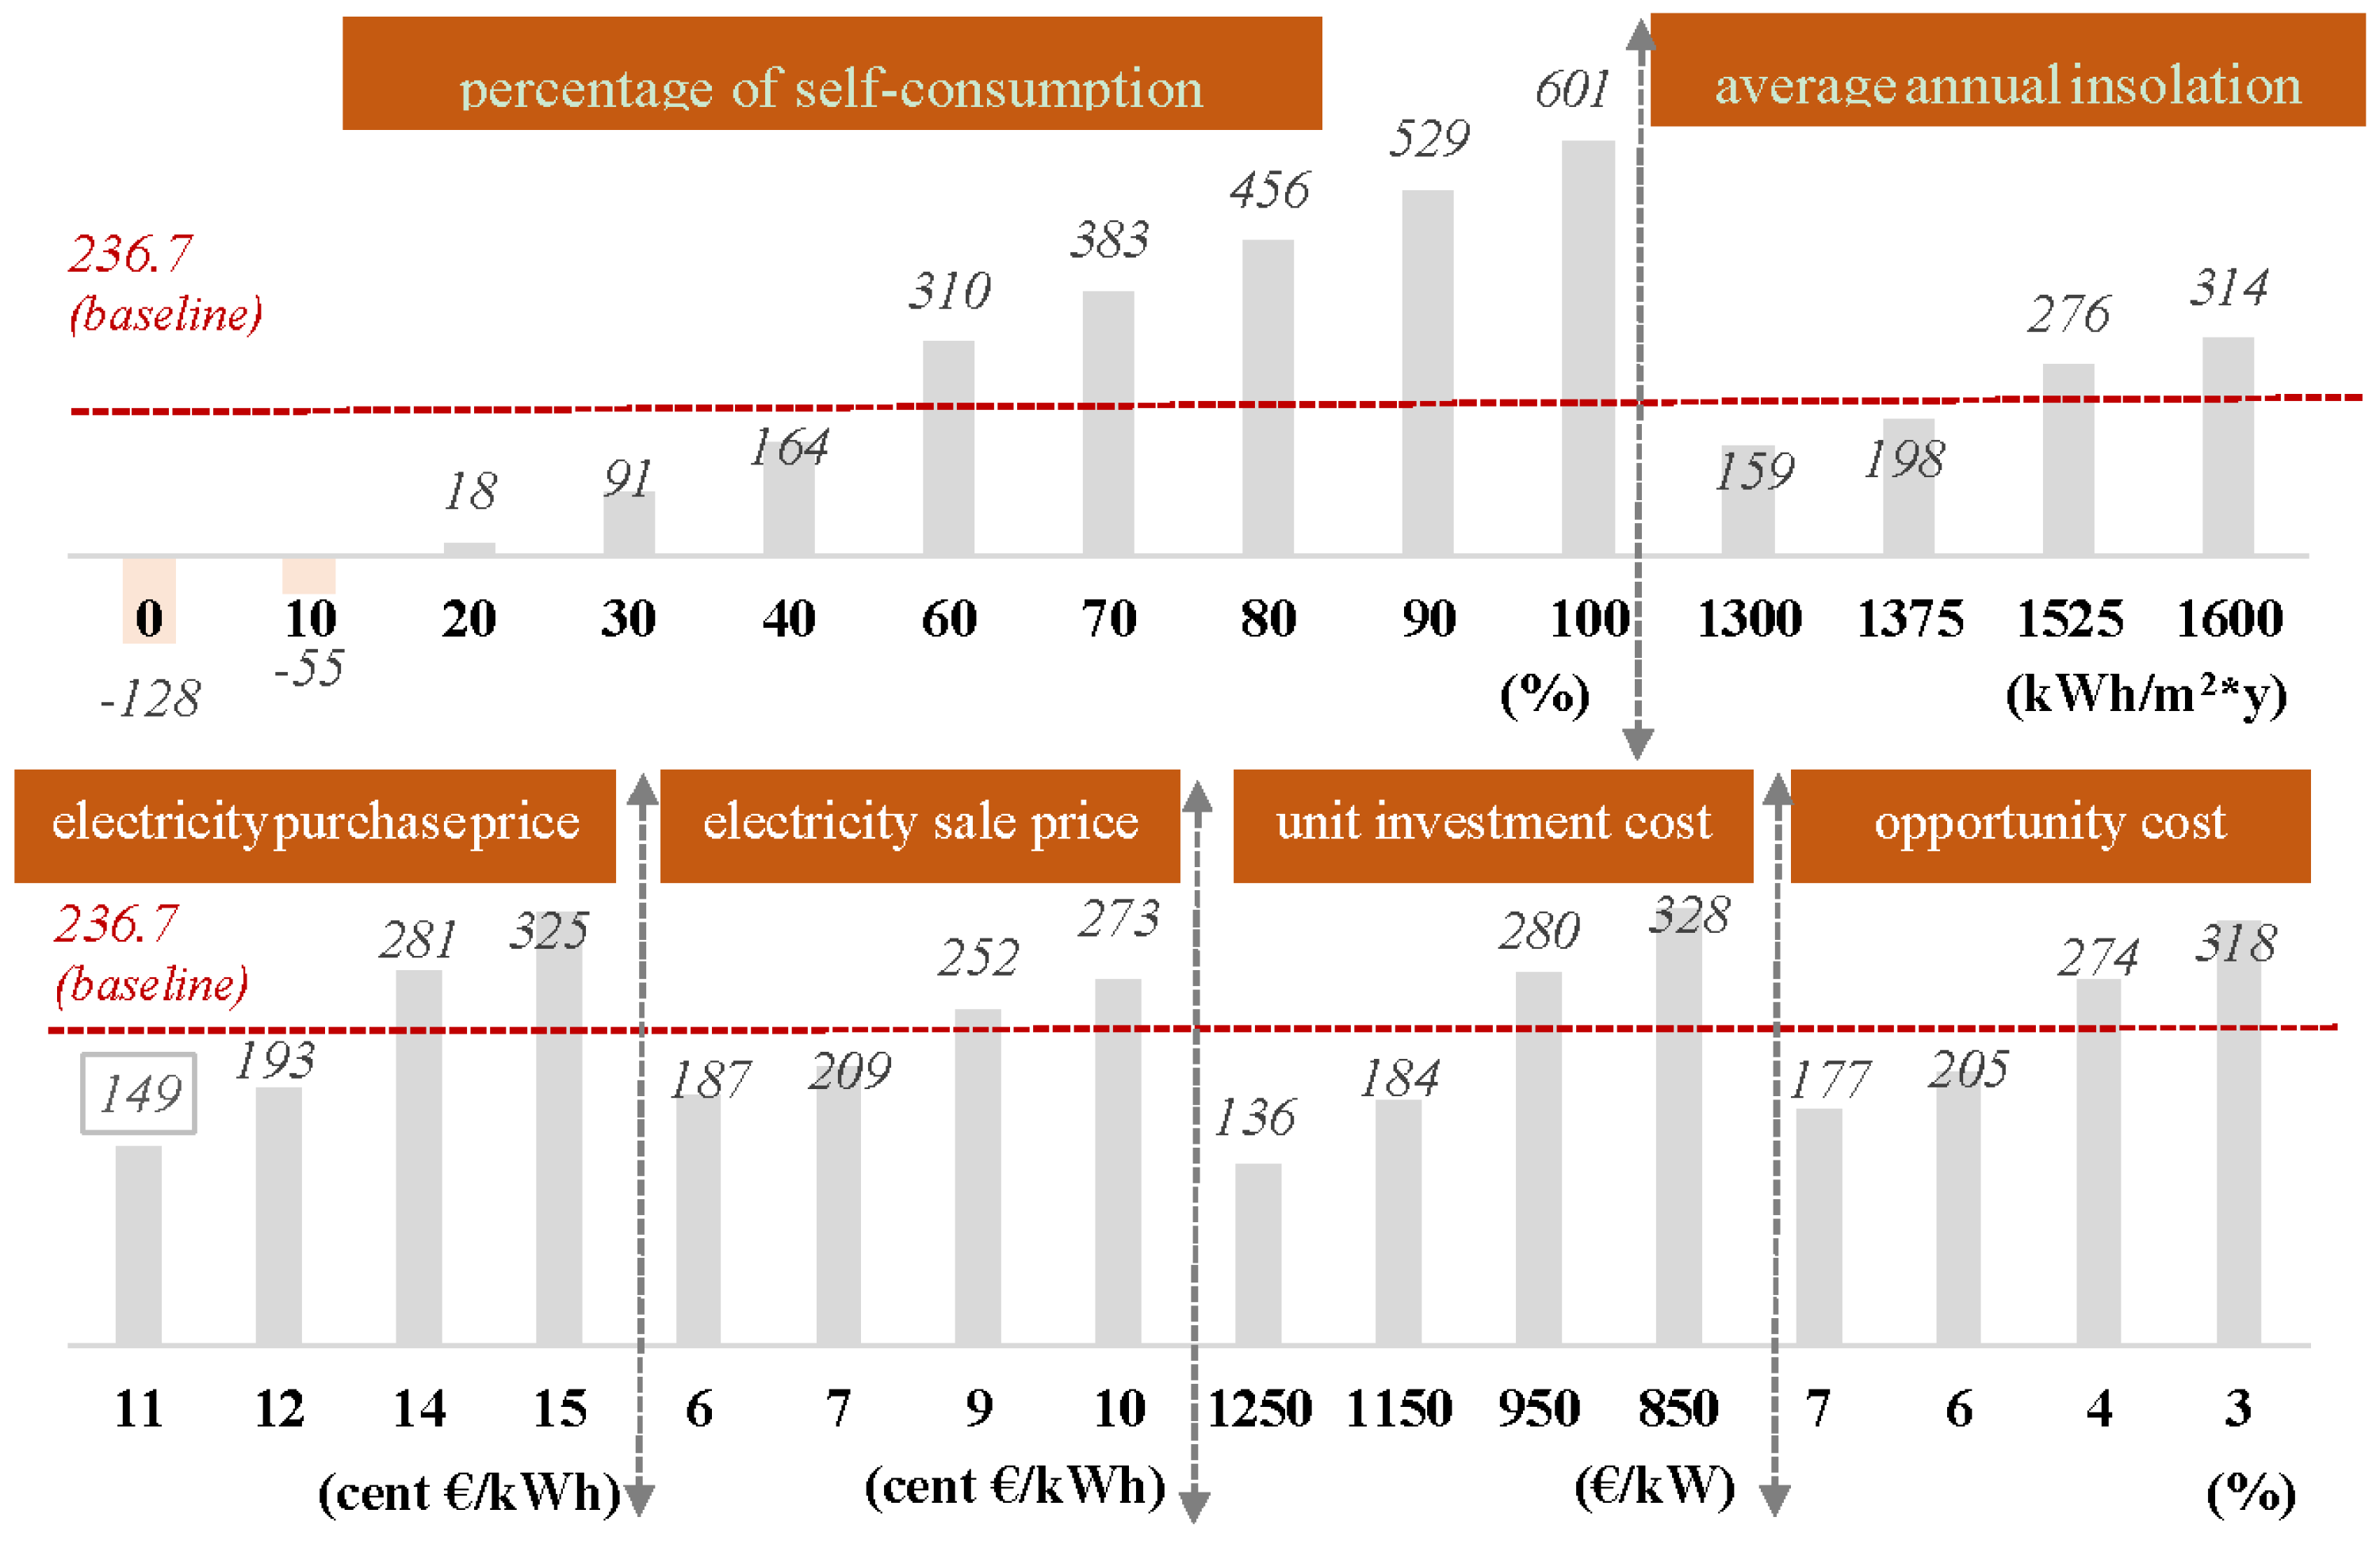
- Percentage of self-consumed energy (), assesses the level of harmonization between consumption and production of energy. This variable is relevant for the economic feasibility assessment. Based on both consumption behaviours and change adaptation of investors different scenarios are defined, with additional increments of about 10% (in extreme cases, ωself,c is equal to 0% if all the produced energy is sold, and equal to 100% if all the produced energy is consumed).
- Average annual insolation (tr), assesses the level of insolation of the plant. Italy, because its conformation, presents different insolation levels. Hence, respect to the base value of about 1450 kWh/m2 per year, four scenarios are considered, two pessimistic (1300 kWh/m2·y and 1375 kWh/m2·y), and two optimistic (1525 kWh/m2·y and 1600 kWh/m2·y) ones, where extreme values characterize the country’s northern and southern regions respectively.
- Annual electricity purchase price (pc), assesses the reduction of electrical energy costs reported in the energy bill. This is the main revenue item in non-incentivized contexts. An increment of pc is a positive scenario for PV investors. Variations are in the range of about 1–2 cent €/kWh, both in positive and negative terms. Given that, this variable can assume values going from 11 cent €/kWh up to 12 cent €/kWh (pessimistic scenarios), or 14 cent €/kWh up to 15 cent €/kWh (optimistic scenarios).
- Annual electricity sales price (ps), assesses incomes coming from the selling of extra energy. This is similar to the previous variable and, so, it has the same variation. For example, ps (that in the baseline scenario with a 5 MW plant can be equal to 3.9 cent €/kWh, can reach values going from 2 cent €/kWh and 3 cent €/kWh (pessimistic scenarios), or 5 cent €/kWh and 6 cent €/kWh (optimistic scenarios).
- Unitary investment cost (Cinv,unit), saw a drastic reduction during the last years. Hence, it is possible to hypothesize reductions from 100 up to 200 € if compared to basic scenarios. However, these optimistic scenarios are compared to pessimistic ones where a reduction of the same value (for example, Cinv,unit related to a 200 kW plant-equal to 1280 €/kW in the basic scenario–is considered equal to 1100 €/kW and 1200 €/kW in optimistic scenarios, or 1400 €/kW and 1500 €/kW in pessimistic scenarios).
- Opportunity cost (r), assesses a measure of the return coming from an alternative investment similar to the considered one in terms of risk level. If compared to the basic value (5%), some increases and decreases of about 1% and 2% are assessed.
- 35% for 200 kW plant;
- 18% for 400 kW plant;
- 24% for 1 MW plant;
- 17% for 5 MW plant.


5. Discussion and Policy Implications
- The incentivizing policy favoured the sector development and, together with efforts done by the actors involved in the whole supply chain, allowed it to achieve great results in terms of very advantageous investment costs proposed to their customers;
- The use of PV panels, together with heat pumps, can be economically feasible when the thermal energy purchase price is at least higher than the electricity selling price;
- The development of hybrid plants, typically coupled with biomass–characterised by a non-intermittent nature, could be adequate for an industrial context with high-energy consumptions in the evening hours. In that sense, an important role is played by ESS, even if they are currently characterised by high costs;
- SEUs can constitute an important opportunity, by focusing on the increase of self-consumption. In the current state, there are some regulation doubts, (it is applied only for mono-user plants), and debates about possible imbalances on distribution network burdens are still without an answer;
- PV investments may be undertaken as an increase of the overall sustainability of the firm and, hence, the improvement of the external brand image (also when PV plant’s profits to be not in line with company’s benchmarks);
- The net metering service can offer interesting opportunities and the increase from 200 kW to 500 kW defined by the government is a positive signal, but has to be related to both bureaucratic simplifications and reduction of uncertainty in regulations;
- Unitary tax deduction, set at 50%, is the legislative support for such investments; the basic rate is, in fact, 36%. This policy measure is defined as strategic for the residential sector.
- The profitability of PV systems is strictly linked to the self-consumption share in non-subsidized electricity markets, in which electricity purchase price (or savings on the energy bill) is greater than the electricity selling price;
- Sensitivity analysis, considering different ranges of several critical variables, provides a solid foundation to the obtained results. The profitability is verified in several scenarios;
- Revenues derived from an increase of self-consumption can be used in order to evaluate the relative costs of alternative solutions, such as: (i) integrated PV-battery systems and/or (ii) integrated PV-HP systems.
6. Conclusions
Author Contributions
Conflicts of Interest
Nomenclature
| Acell | Active surface |
| bos | Balance of system |
| C | Discounted cash flows |
| Cae | Administrative and electrical connection cost |
| Cass | Assurance cost |
| Cinv | Total investment cost |
| Cinv,unit | Unitary investment cost |
| Clcs | Loan capital share cost |
| Clis | Loan interest share cost |
| Cm | Maintenance cost |
| Cri | Replacement inverter cost |
| Ctax | Taxes |
| DCF | Discounted Cash Flow |
| dEf | Decrease efficiency of system |
| DPBT | Discounted payback time |
| DSM | Demand side management |
| Ef | Efficiency of system |
| Emissions released by a PV plant per unit of produced energy | |
| Emissions released by fossil fuels per unit of produced energy | |
| ERcd | Reduction of carbon dioxide emissions |
| EOut | Energy output of the system |
| EPIA | European Photovoltaic Industry Association |
| ESS | Energy storage system |
| FiT | Feed-in Tariff |
| GSE | Gestore Servizi Energetici |
| HP | Heat pump |
| I | Discounted cash inflows |
| inf | Rate of inflation |
| infel | Rate of energy inflation |
| Kf | Optimum angle of tilt |
| N | Lifetime PV system |
| Ndebt | Period of loan |
| NPV | Net present value |
| Ƞbos | Bos efficiency |
| ƞf | Number of PV modules to be installed |
| ƞm | Module efficiency |
| O | Discounted cash outflows |
| pc | Electricity purchase price |
| ps | Electricity sales price |
| PCass | Percentage of assurance cost |
| PCi | Percentage of inverter cost |
| PCm | Percentage of maintenance cost |
| PCtax | percentage of taxes |
| Pf | Nominal power of a PV module |
| PR | Performance Ratio |
| PV | Photovoltaic |
| r | Opportunity cost of capital |
| rd | Interest rate on loan |
| RES | Renewable energy system |
| SCel | Saving energy internal consumption |
| SCC | Social Cost of Carbon |
| SEU | Efficient Systems for Users |
| SPel | Sale of energy not for internal consumption |
| t | Single period |
| tr | Average annual insolation |
| xc | Amount of self-consumed electricity |
| xs | Amount of electricity sold to the grid |
| Percentage of energy self-consumption | |
| Percentage of the produced energy sold to the grid |
References
- Lacerda, J.S.; van den Bergh, J.C.J.M. International Diffusion of Renewable Energy Innovations: Lessons from the Lead Markets for Wind Power in China, Germany and USA. Energies 2014, 7, 8236–8263. [Google Scholar] [CrossRef]
- Cuellar, A.D.; Herzog, H. A Path Forward for Low Carbon Power from Biomass. Energies 2015, 8, 1701–1715. [Google Scholar] [CrossRef]
- Feldpausch-Parker, A.M.; Burnham, M.; Melnik, M.; Callaghan, M.L.; Selfa, T. News Media Analysis of Carbon Capture and Storage and Biomass: Perceptions and Possibilities. Energies 2015, 8, 3058–3074. [Google Scholar] [CrossRef]
- Re Rebaudengo, A. Ripensare il mercato elettrico: Evoluzione industriale e convergenza Europea. In Proceedings of the Convegno assoRinnovabili, Roma, Italy, 25 March 2015. (In Italian)
- European Photovoltaic Industry Association. Europe’s solar market falls over 30 percent in 2014 as global solar installations continue to grow. In Proceedings of the 10th Annual Market Workshop of the European Photovoltaic Industry Association, Brussels, Belgium, 26 March 2015.
- Tsai, H.-L. Design and Evaluation of a Photovoltaic/Thermal-Assisted Heat Pump Water Heating System. Energies 2014, 7, 3319–3338. [Google Scholar] [CrossRef]
- Renno, C.; de Giacomo, M. Dynamic Simulation of a CPV/T System Using the Finite Element Method. Energies 2014, 7, 7395–7414. [Google Scholar] [CrossRef]
- Marcos, J.; de la Parra, I.; García, M.; Marroyo, L. Control Strategies to Smooth Short-Term Power Fluctuations in Large Photovoltaic Plants Using Battery Storage Systems. Energies 2014, 7, 6593–6619. [Google Scholar] [CrossRef]
- Luthander, R.; Widén, J.; Nilsson, D.; Palm, J. Photovoltaic self-consumption in buildings: A review. Appl. Energy 2015, 142, 80–94. [Google Scholar] [CrossRef]
- Pascual, J.; Sanchis, P.; Marroyo, L. Implementation and Control of a Residential Electrothermal Microgrid Based on Renewable Energies, a Hybrid Storage System and Demand Side Management. Energies 2014, 7, 210–237. [Google Scholar] [CrossRef]
- Song, G.; Chen, H.; Guo, B. A Layered Fault Tree Model for Reliability Evaluation of Smart Grids. Energies 2014, 7, 4835–4857. [Google Scholar] [CrossRef]
- Rodríguez-Molina, J.; Martínez-Núñez, M.; Martínez, J.-F.; Pérez-Aguiar, W. Business Models in the Smart Grid: Challenges, Opportunities and Proposals for Prosumer Profitability. Energies 2014, 7, 6142–6171. [Google Scholar] [CrossRef]
- Xavier, G.; Filho, D.; Martins, J.; Monteiro, P.; Diniz, A. Simulation of Distributed Generation with Photovoltaic Microgrids—Case Study in Brazil. Energies 2015, 8, 4003–4023. [Google Scholar] [CrossRef]
- Sbordone, D.A.; Martirano, L.; Falvo, M.C.; Chiavaroli, L.; di Pietra, B.; Bertini, I.; Genovese, A. Reactive power control for an energy storage system: A real implementation in a Micro-Grid. J. Netw. Comput. Appl. 2015, in press. [Google Scholar] [CrossRef]
- Dolara, A.; Grimaccia, F.; Leva, S.; Mussetta, M.; Ogliari, E. A Physical Hybrid Artificial Neural Network for Short Term Forecasting of PV Plant Power Output. Energies 2015, 8, 1138–1153. [Google Scholar] [CrossRef] [Green Version]
- Rahmann, C.; Castillo, A. Fast frequency response capability of photovoltaic power plants: The necessity of new grid requirements and definitions. Energies 2014, 7, 6306–6322. [Google Scholar] [CrossRef]
- Cucchiella, F.; D’Adamo, I. Residential photovoltaic plant: Environmental and economical implications from renewable support policies. Clean Technol. Environ. Policy 2015, 17, 1929–1944. [Google Scholar] [CrossRef]
- Ghosh, S.; Nair, A.; Krishnan, S.S. Techno-economic review of rooftop photovoltaic systems: Case studies of industrial, residential and off-grid rooftops in Bangalore, Karnataka. Renew. Sustain. Energy Rev. 2015, 42, 1132–1142. [Google Scholar] [CrossRef]
- Gao, A.M.-Z.; Fan, C.-T.; Kai, J.-J.; Liao, C.-N. Sustainable photovoltaic technology development: Step-by-step guidance for countries facing PV proliferation turmoil under the feed-in tariff scheme. Renew. Sustain. Energy Rev. 2015, 43, 156–163. [Google Scholar] [CrossRef]
- Hasan, A.; McCormack, S.J.; Huang, M.J.; Norton, B. Energy and Cost Saving of a Photovoltaic-Phase Change Materials (PV-PCM) System through Temperature Regulation and Performance Enhancement of Photovoltaics. Energies 2014, 7, 1318–1331. [Google Scholar] [CrossRef]
- Mundo-Hernández, J.; de Celis Alonso, B.; Hernández-Álvarez, J.; de Celis-Carrillo, B. An overview of solar photovoltaic energy in Mexico and Germany. Renew. Sustain. Energy Rev. 2014, 31, 639–649. [Google Scholar] [CrossRef]
- Chiaroni, D.; Chiesa, V.; Colasanti, L.; Cucchiella, F.; D’Adamo, I.; Frattini, F. Evaluating solar energy profitability: A focus on the role of self-consumption. Energy Convers. Manag. 2014, 88, 317–331. [Google Scholar] [CrossRef]
- Pötzinger, C.; Preißinger, M.; Brüggemann, D. Influence of Hydrogen-Based Storage Systems on Self-Consumption and Self-Sufficiency of Residential Photovoltaic Systems. Energies 2015, 8, 8887–8907. [Google Scholar] [CrossRef]
- Squatrito, R.; Sgroi, F.; Tudisca, S.; Trapani, A.M.D.; Testa, R. Post feed-in scheme photovoltaic system feasibility evaluation in Italy: Sicilian case studies. Energies 2014, 7, 7147–7165. [Google Scholar] [CrossRef]
- Terna Statistical Prevision. Available online: http://www.terna.it/ (accessed on 3 June 2015).
- Purchase/Resale & Net Metering. Available online: http://www.gse.it/ (accessed on 3 June 2015).
- Machol, B.; Rizk, S. Economic value of U.S. fossil fuel electricity health impacts. Environ. Int. 2013, 52, 75–80. [Google Scholar] [CrossRef] [PubMed]
- Dale, A.T.; Pereira de Lucena, A.F.; Marriott, J.; Borba, B.S.M.C.; Schaeffer, R.; Bilec, M.M. Modeling future life-cycle greenhouse gas emissions and environmental impacts of electricity supplies in Brazil. Energies 2013, 6, 3182–3208. [Google Scholar] [CrossRef]
- Hardisty, P.E.; Clark, T.S.; Hynes, R.G. Life cycle greenhouse gas emissions from electricity generation: A comparative analysis of Australian energy sources. Energies 2012, 5, 872–897. [Google Scholar] [CrossRef]
- Cucchiella, F.; D’Adamo, I. Issue on supply chain of renewable energy. Energy Convers. Manag. 2013, 76, 774–780. [Google Scholar] [CrossRef]
- Cucchiella, F.; D’Adamo, I. Estimation of the energetic and environmental impacts of a roof-mounted building-integrated photovoltaic systems. Renew. Sustain. Energy Rev. 2012, 16, 5245–5259. [Google Scholar] [CrossRef]
- Cucchiella, F.; D’Adamo, I.; Gastaldi, M. Financial analysis for investment and policy decisions in the renewable energy sector. Clean Technol. Environ. Policy 2015, 17, 887–904. [Google Scholar] [CrossRef]
- Edenhofer, O.; Pichs-Madruga, R.; Sokona, Y.; Seyboth, K.; Kadner, S.; Zwickel, T.; Eickemeier, P.; Hansen, G.; Schlömer, S.; von Stechow, C.; et al. Renewable energy sources and climate change mitigation. In Special Report Prepared by Working Group III of the Intergovernmental Panel on Climate Change; Cambridge University Press: Cambridge, UK, 2012. [Google Scholar]
- Thiel, C.L.; Campion, N.; Landis, A.E.; Jones, A.K.; Schaefer, L.A.; Bilec, M.M. A materials life cycle assessment of a net-zero energy building. Energies 2013, 6, 1125–1141. [Google Scholar] [CrossRef]
- PV Cycle Annual Report 2012. Available online: http://www.pvcycle.org/ (accessed on 3 June 2015).
- Cucchiella, F.; D’Adamo, I.; Rosa, P. End-of-Life of used photovoltaic modules: A financial analysis. Renew. Sustain. Energy Rev. 2015, 47, 552–561. [Google Scholar] [CrossRef]
- Choi, J.-K.; Fthenakis, V. Crystalline silicon photovoltaic recycling planning: Macro and micro perspectives. J. Clean. Prod. 2014, 66, 443–449. [Google Scholar] [CrossRef]
- Cucchiella, F.; D’Adamo, I.; Lenny Koh, S.C.; Rosa, P. Recycling of WEEEs: An economic assessment of present and future e-waste streams. Renew. Sustain. Energy Rev. 2015, 51, 263–272. [Google Scholar] [CrossRef]
- Mandell, S. Carbon emission values in cost benefit analyses. Transp. Policy 2011, 18, 888–892. [Google Scholar] [CrossRef]
- Cucchiella, F.; D’Adamo, I.; Gastaldi, M.; Koh, L.S.C. Renewable energy options for buildings: Performance evaluations of integrated photovoltaic systems. Energy Build. 2012, 55, 208–217. [Google Scholar] [CrossRef]
- Cucchiella, F.; D’Adamo, I.; Gastaldi, M. Sustainable management of waste-to-energy facilities. Renew. Sustain. Energy Rev. 2014, 33, 719–728. [Google Scholar] [CrossRef]
- Bortolini, M.; Gamberi, M.; Graziani, A.; Mora, C.; Regattieri, A. Multi-parameter analysis for the technical and economic assessment of photovoltaic systems in the main European Union countries. Energy Convers. Manag. 2013, 74, 117–128. [Google Scholar] [CrossRef]
- Cucchiella, F.; D’Adamo, I. Feasibility study of developing photovoltaic power projects in Italy: An integrated approach. Renew. Sustain. Energy Rev. 2012, 16, 1562–1576. [Google Scholar] [CrossRef]
- Cucchiella, F.; D’Adamo, I.; Gastaldi, M. Modeling optimal investments with portfolio analysis in electricity markets. Energy Educ. Sci. Technol. Part A Energy Sci. Res. 2012, 30, 673–692. [Google Scholar]
- Cucchiella, F.; D’Adamo, I.; Gastaldi, M. Optimizing plant size in the planning of renewable energy portfolios. Lett. Spat. Resour. Sci. 2015. [Google Scholar] [CrossRef]
- Cucchiella, F.; D’Adamo, I. A Multicriteria Analysis of Photovoltaic Systems: Energetic, Environmental, and Economic Assessments. Int. J. Photoenergy 2015, 2015. [Google Scholar] [CrossRef]
- Sgroi, F.; Tudisca, S.; di Trapani, A.M.; Testa, R.; Squatrito, R. Efficacy and efficiency of Italian energy policy: The case of PV systems in greenhouse farms. Energies 2014, 7, 3985–4001. [Google Scholar] [CrossRef]
- Liu, Z.; Zhang, W.; Zhao, C.; Yuan, J. The Economics of Wind Power in China and Policy Implications. Energies 2015, 8, 1529–1546. [Google Scholar] [CrossRef]
- Wissem, Z.; Gueorgui, K.; Hédi, K. Modeling and technical–economic optimization of an autonomous photovoltaic system. Energy 2012, 37, 263–272. [Google Scholar] [CrossRef]
- Huld, T.; Amillo, A. Estimating PV Module Performance over Large Geographical Regions: The Role of Irradiance, Air Temperature, Wind Speed and Solar Spectrum. Energies 2015, 8, 5159–5181. [Google Scholar] [CrossRef] [Green Version]
- Reich, N.H.; Mueller, B.; Armbruster, A.; van Sark, W.G.J.H.M.; Kiefer, K.; Reise, C. Performance ratio revisited: Is PR > 90% realistic? Progress Photovolt. Res. Appl. 2012, 20, 717–726. [Google Scholar] [CrossRef]
- Cucchiella, F.; D’Adamo, I.; Koh, L.S.C. Environmental and economic analysis of building integrated photovoltaic systems in Italian regions. J. Clean. Prod. 2015, 98, 241–252. [Google Scholar] [CrossRef]
- Rosa, P.; Terzi, S. Proposal of a global product development strategy assessment tool and its application in the Italian industrial context. Int. J. Prod. Lifecycle Manag. 2014, 7, 266–291. [Google Scholar] [CrossRef]
- Copani, G.; Rosa, P. DEMAT: Sustainability assessment of new flexibility-oriented business models in the machine tools industry. Int. J. Comput. Integr. Manuf. 2014, 28, 408–417. [Google Scholar] [CrossRef]
- Chiaroni, D.; Chiesa, M.; Chiesa, V.; Cucchiella, F.; D’Adamo, I.; Frattini, F. An Analysis of Supply Chains in Renewable Energy Industries: A Survey in Italy. In Sustainable Future Energy Technology and Supply Chains; Springer: Cham, Switzerland, 2015; pp. 47–71. [Google Scholar]
- European Commission. Circular Economy Boosting Business, Reducing Waste. Available online: http://ec.europa.eu/environment/circular.ecnomy/index_en.htm (accessed on 25 June 2015).
© 2015 by the authors; licensee MDPI, Basel, Switzerland. This article is an open access article distributed under the terms and conditions of the Creative Commons by Attribution (CC-BY) license (http://creativecommons.org/licenses/by/4.0/).
Share and Cite
Cucchiella, F.; D’Adamo, I.; Rosa, P. Industrial Photovoltaic Systems: An Economic Analysis in Non-Subsidized Electricity Markets. Energies 2015, 8, 12865-12880. https://doi.org/10.3390/en81112350
Cucchiella F, D’Adamo I, Rosa P. Industrial Photovoltaic Systems: An Economic Analysis in Non-Subsidized Electricity Markets. Energies. 2015; 8(11):12865-12880. https://doi.org/10.3390/en81112350
Chicago/Turabian StyleCucchiella, Federica, Idiano D’Adamo, and Paolo Rosa. 2015. "Industrial Photovoltaic Systems: An Economic Analysis in Non-Subsidized Electricity Markets" Energies 8, no. 11: 12865-12880. https://doi.org/10.3390/en81112350