1. Introduction
The increasing interest in thermoelectric (TE) technology is leading to a need to develop a standardized method to characterize the performance of thermoelectric generator (TEG) modules, which is unavailable at the moment. However, there exist several measurement systems that can perform experimental parameter characterization of TEG modules [
1,
2,
3,
4,
5,
6]. Some of them are self-made, but there are also commercially available systems. Up to 2006, the majority of the commercially available modules were operating at a maximum temperature difference of 300 °C [
5,
6], and therefore the evaluation setups were built based on these temperature characteristics.
Along the way, the operating temperature gradient range of the modules increased and the measuring systems were upgraded to meet the new TEG specifications [
2,
3,
4]. More recently, electrical heaters with higher thermal power capabilities were integrated in the test rigs. Hejtmanek
et al. [
7] constructed a setup that contains a 650 W heater that can reach a 450 °C at the hot side of the TEG. They presented the setup capabilities of the test stand by characterizing a HZ-20 commercially TEG at a constant power of 500 W in the heater and variable temperature on the cold side. Monteccuco
et al. [
3] built a test rig that allows the hot temperature on the module to reach 800 °C. However, the functionality of the setup was shown on a Bi2Te3 40 × 40 mm
2 module (GM250-127-14-10) up to 200 °C.
The test stand described in this work has an integrated 1 kW electric heater that can reach up to 1000 °C. To fully explore the high temperature range, a commercial calcium-manganese oxide module was chosen for testing. To avoid damage to the TEG leads, the temperature in the heater was limited to 800 °C. The purpose of this paper is to study the transient behavior of the TEG electrical and thermal parameters. The outcome of this research is to show the temperature behavior through plots and provide data on the duration of the temperature transient for the oxide module. A standard system to characterize TEGs is not available yet, therefore the focus of the paper is limited to the commercial system called TEGeta (PANCO GmbH, Muelheim-Kaerlich, Germany) and other systems that are built with similar features.
2. Description of the Experimental Setup
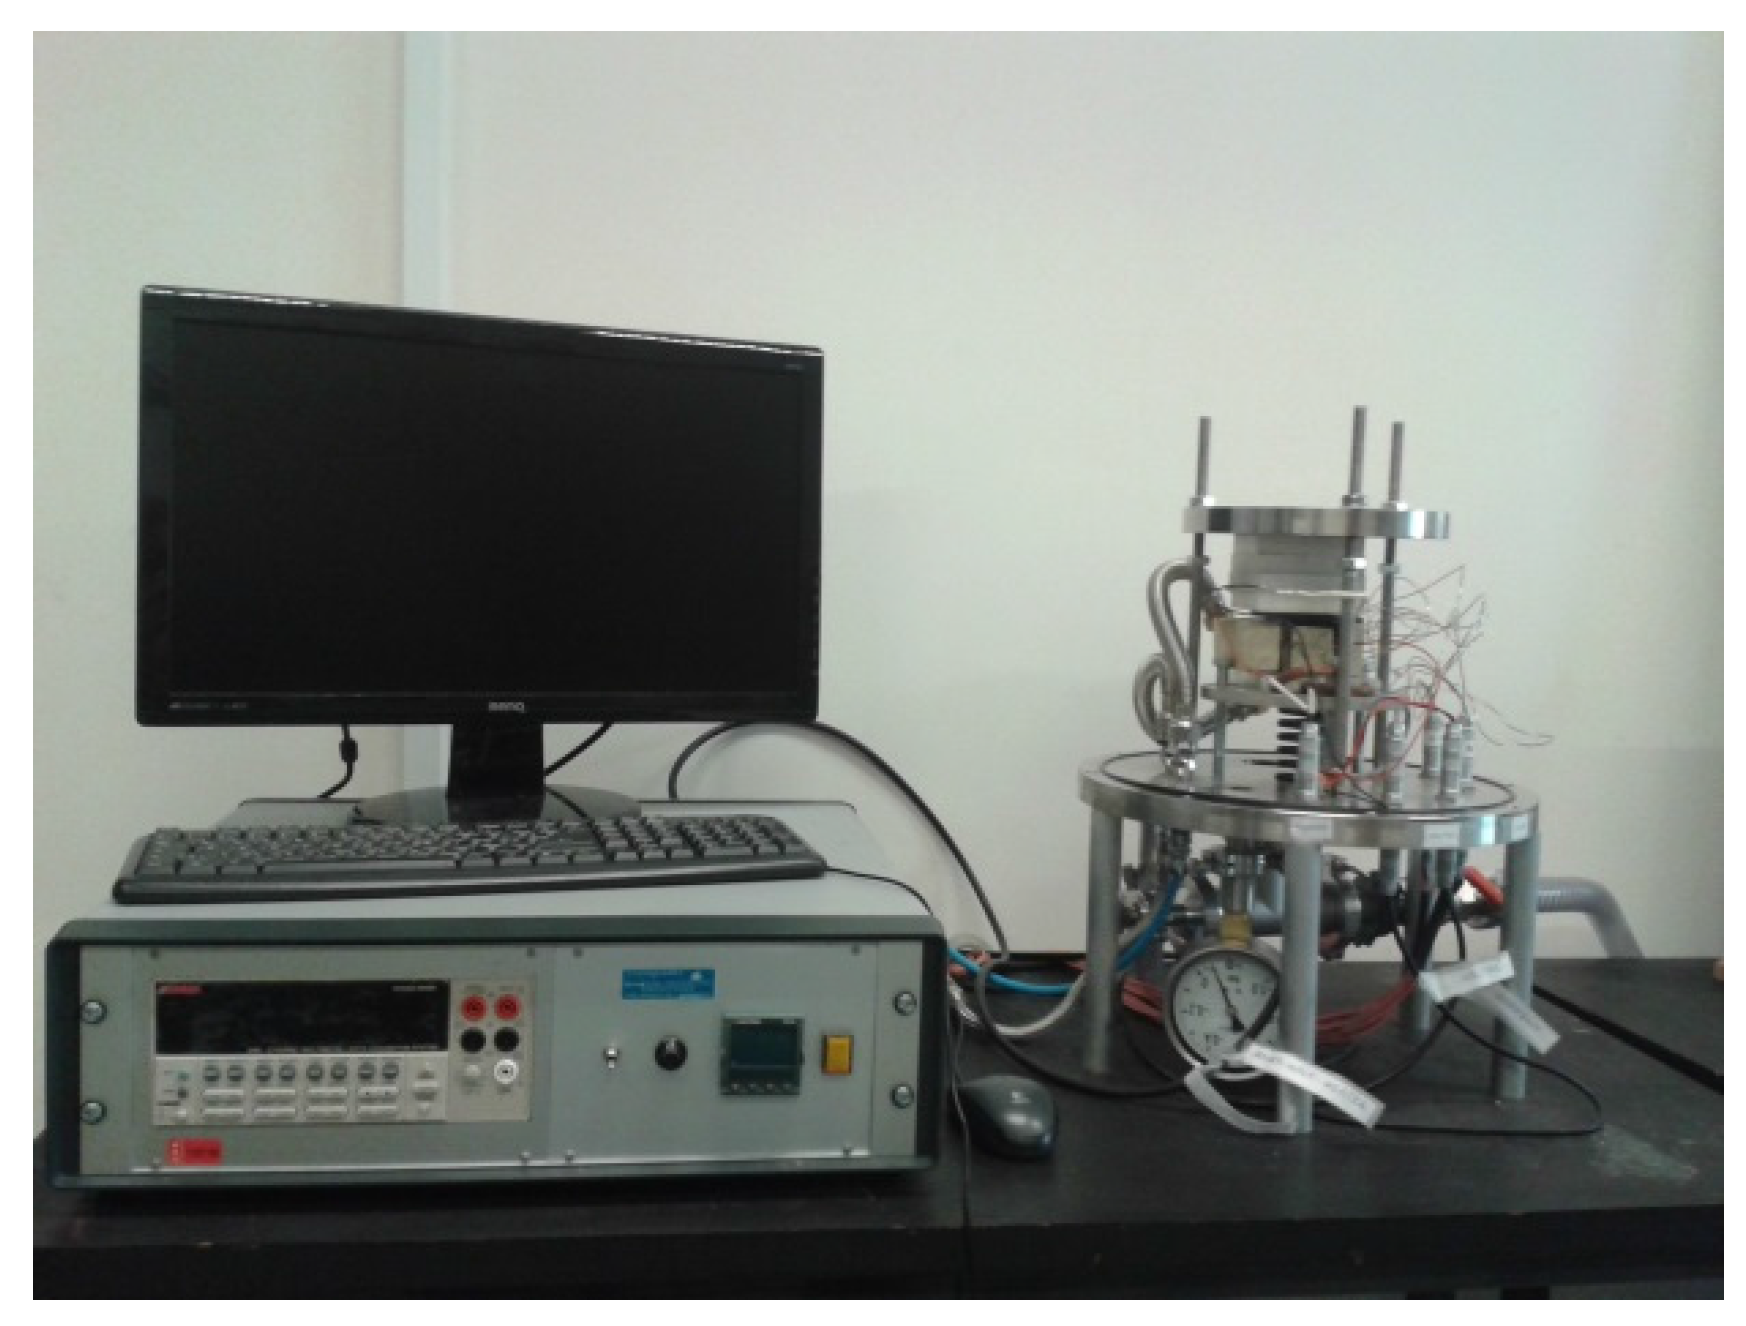
The test system used to analyze the module performance is called TEGeta and it is shown in
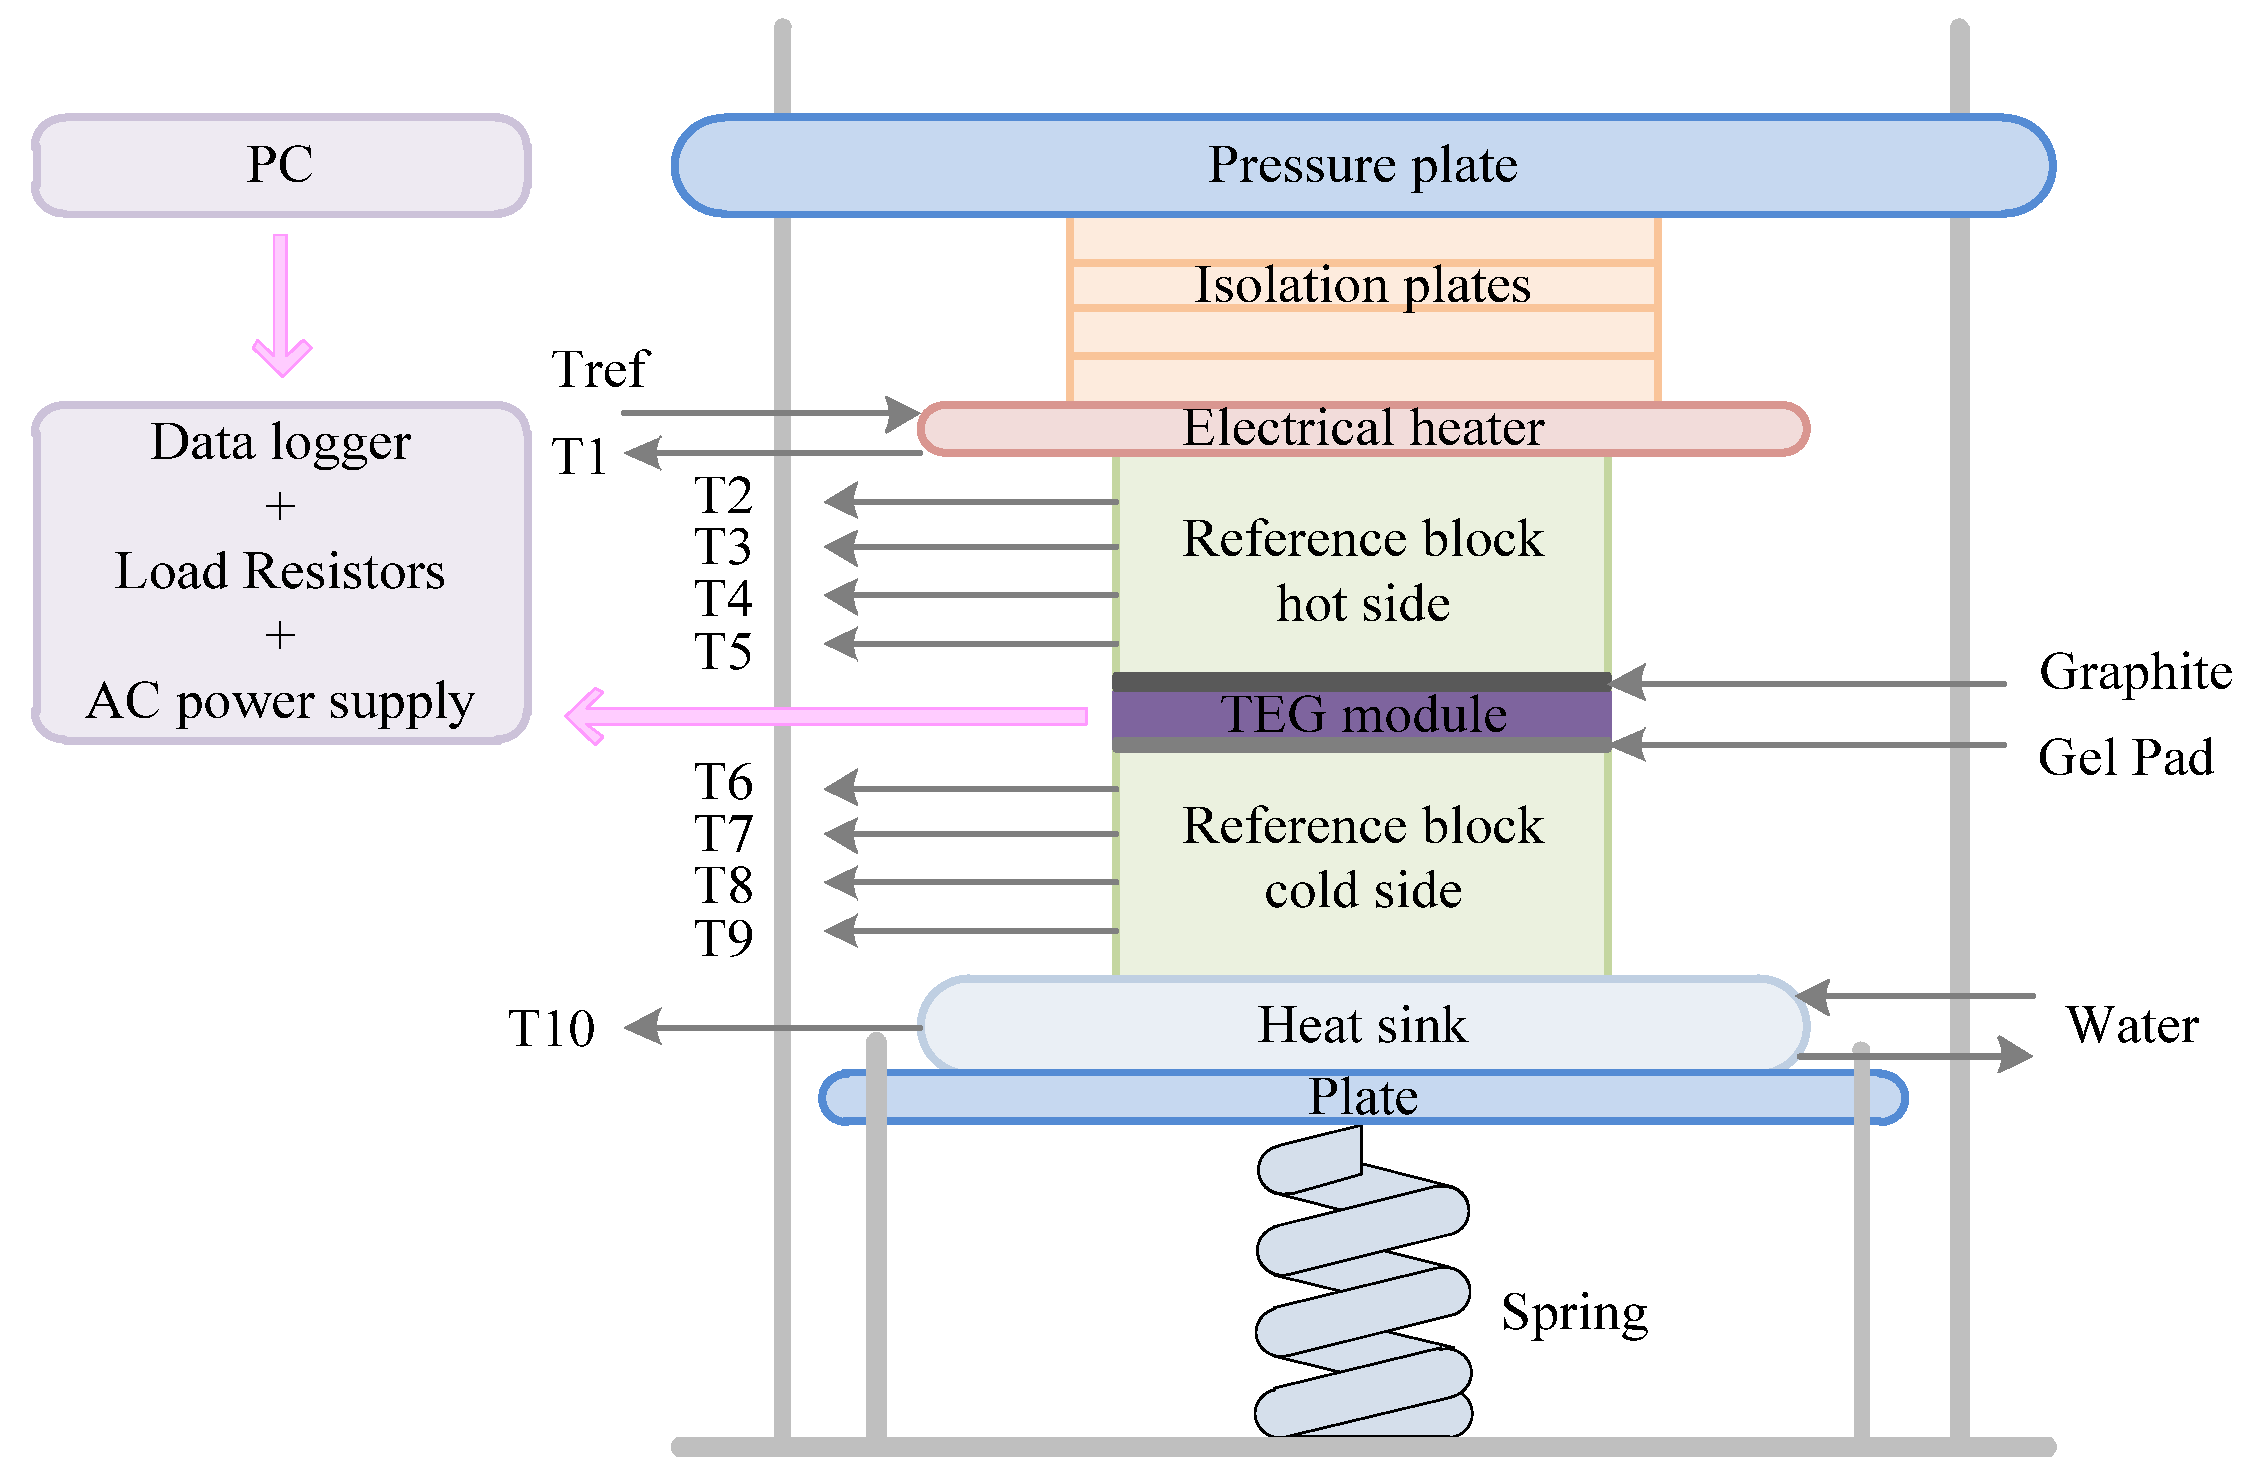
Figure 1. The system can only perform characterization on one TEG at a time. The block diagram for the experimental system in
Figure 2 is an aid to explain the structure of the system and how it operates.
Figure 1.
TEGeta experimental setup.
Figure 1.
TEGeta experimental setup.
Figure 2.
TEGeta block diagram.
Figure 2.
TEGeta block diagram.
Experimental tests were performed on a commercial 42 × 42 mm
2 calcium-manganese oxide module (CMO-25-42S, TECTEG (Aurora, ON, Canada) with 25 couples. One reference block (40 × 40 × 20 mm
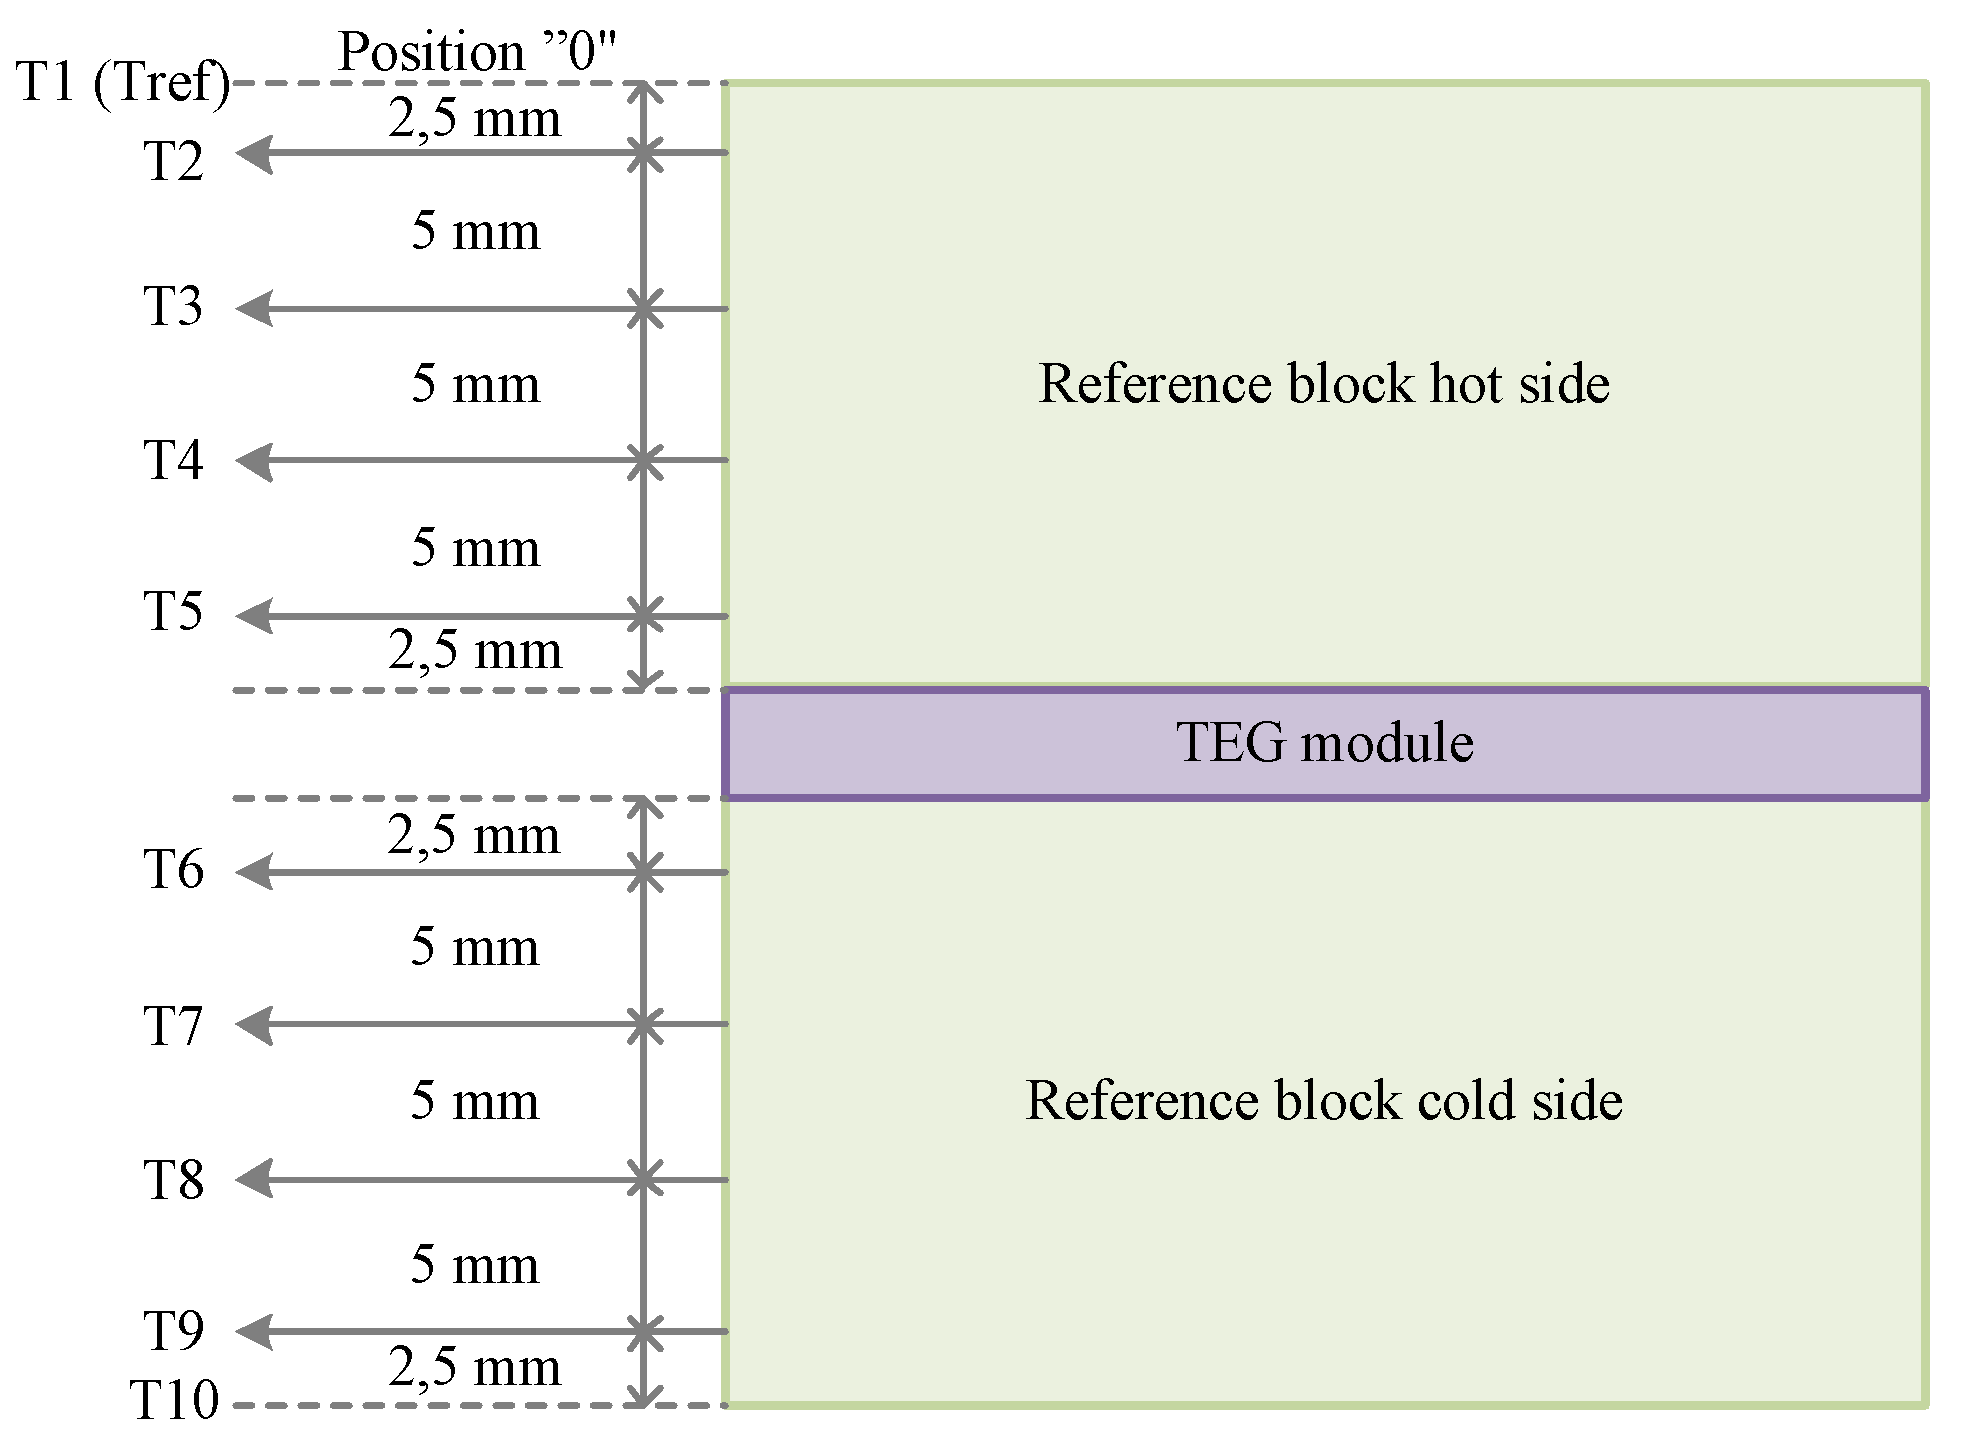
3) is placed on both sides of the TEG module. The material used for the reference blocks is the AN1/Alloy 800 (H/HT)/1.4876 from Valbruna Edel Inox GmbH (Dormagen, Germany). In each reference block, four thermocouples were inserted at a depth of 10 mm in holes of 1 mm in diameter at the distances presented in
Figure 3 (
T2 to
T5 for hot side and
T6 to
T9 for cold side). Thermocouple (
T1) provides the temperature measurements of the electrical heater which was placed on top of the hot side reference block and
T10 shows the readings in the heat sink placed below the cold side reference block (
Figure 2). The temperature of the heater (
Tref) can be manually set at a desired value up to 1000 °C. The control of the heater temperature was made using feedback readings from
T1. As shown in
Figure 3,
T1 was considered the reference and it was placed at “position 0”.
Figure 3.
Placement of the thermocouples (T2-T9) in the reference blocks.
Figure 3.
Placement of the thermocouples (T2-T9) in the reference blocks.
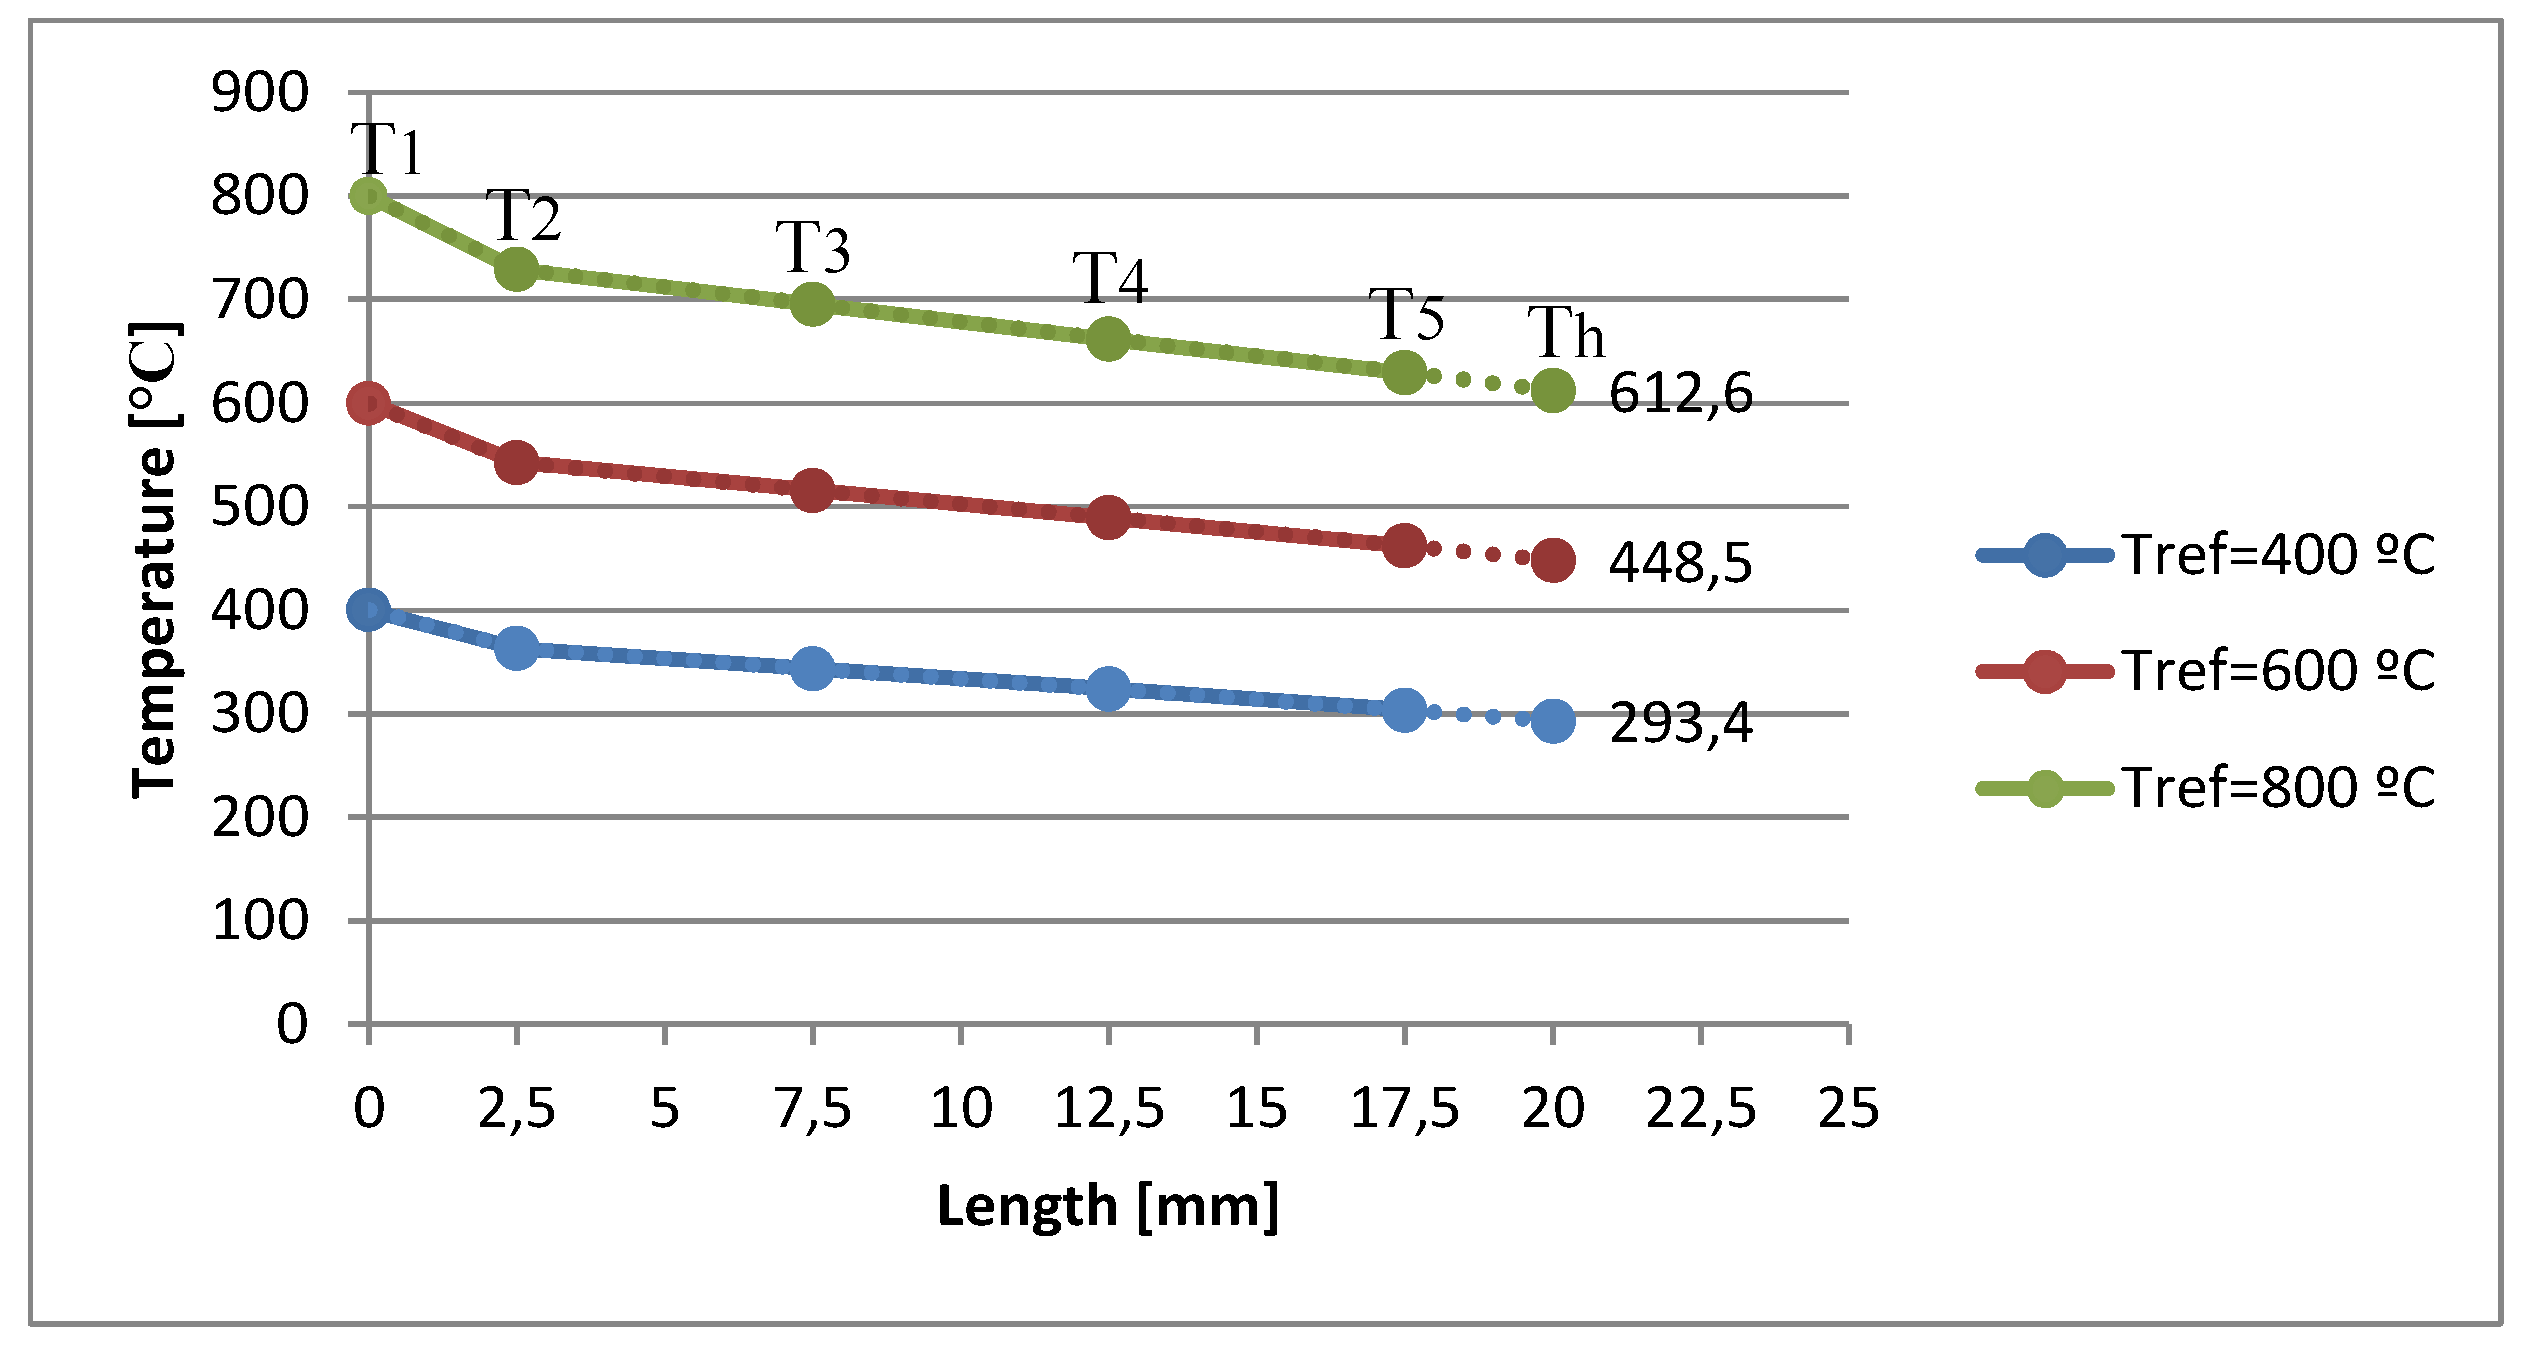
The hot and the cold temperatures at the surface of the module can be extrapolated from the slope of
T2 to
T5 and
T6 to
T9, respectively.
Figure 4 shows how the TEG hot side temperature (
Th) can be extrapolated in steady-state for three cases of the reference temperature (400 °C, 600 °C, and 800 °C).
Figure 4.
Temperature readings from thermocouple T1 to T5 and extrapolation of the CMO-25-42S hot surface (Th) for input temperature references of 400 °C, 600 °C and 800 °C.
Figure 4.
Temperature readings from thermocouple T1 to T5 and extrapolation of the CMO-25-42S hot surface (Th) for input temperature references of 400 °C, 600 °C and 800 °C.
All the described parts are sandwiched together between two plates at a desired pressure. Custom Thermoelectric recommends a pressure of 1.275 MPa per module for optimum power generation and thermal contact. Tests on the oxide module were performed at 1.3 MPa pressure. The upper temperature for the silver leads of the module is 900 °C. To avoid damaging the module, the maximum temperature limit in the heater was limited to 800 °C for all tests.
A 127 µm thick graphite sheet was used between the hot side of the TEG and the hot reference block. A gel pad with thermal conductivity of 8 W/mK provided by the CMO module manufacturer was placed between the cold surface of the TEG and the cold reference block. Both the graphite sheet and the gel pad were used to reduce the thermal contact resistance between the module and the two reference blocks. Vermiculite blocks were placed around the module and reference blocks to decrease the radiation heat loss.
The parameters that can be manually set and adjusted in the setup are:
The temperature reference for the heater (from ambient temperature up to 1000 °C)
The time between measurements (during this time, the setup performs no operation)
The time after target temperature is reached (during this time, the setup performs no operation)
Load values (limited to a combination between 0.22–8.13 Ω)
Number of measurements for each load value
TEGeta outputs the following measurement parameters: temperature readings for 10 thermocouples (T1 to T10), absolute time for each measurement performed, module/load voltage and current.
3. Experimental Results
Experimental tests are performed on a commercially available 42 × 42 mm
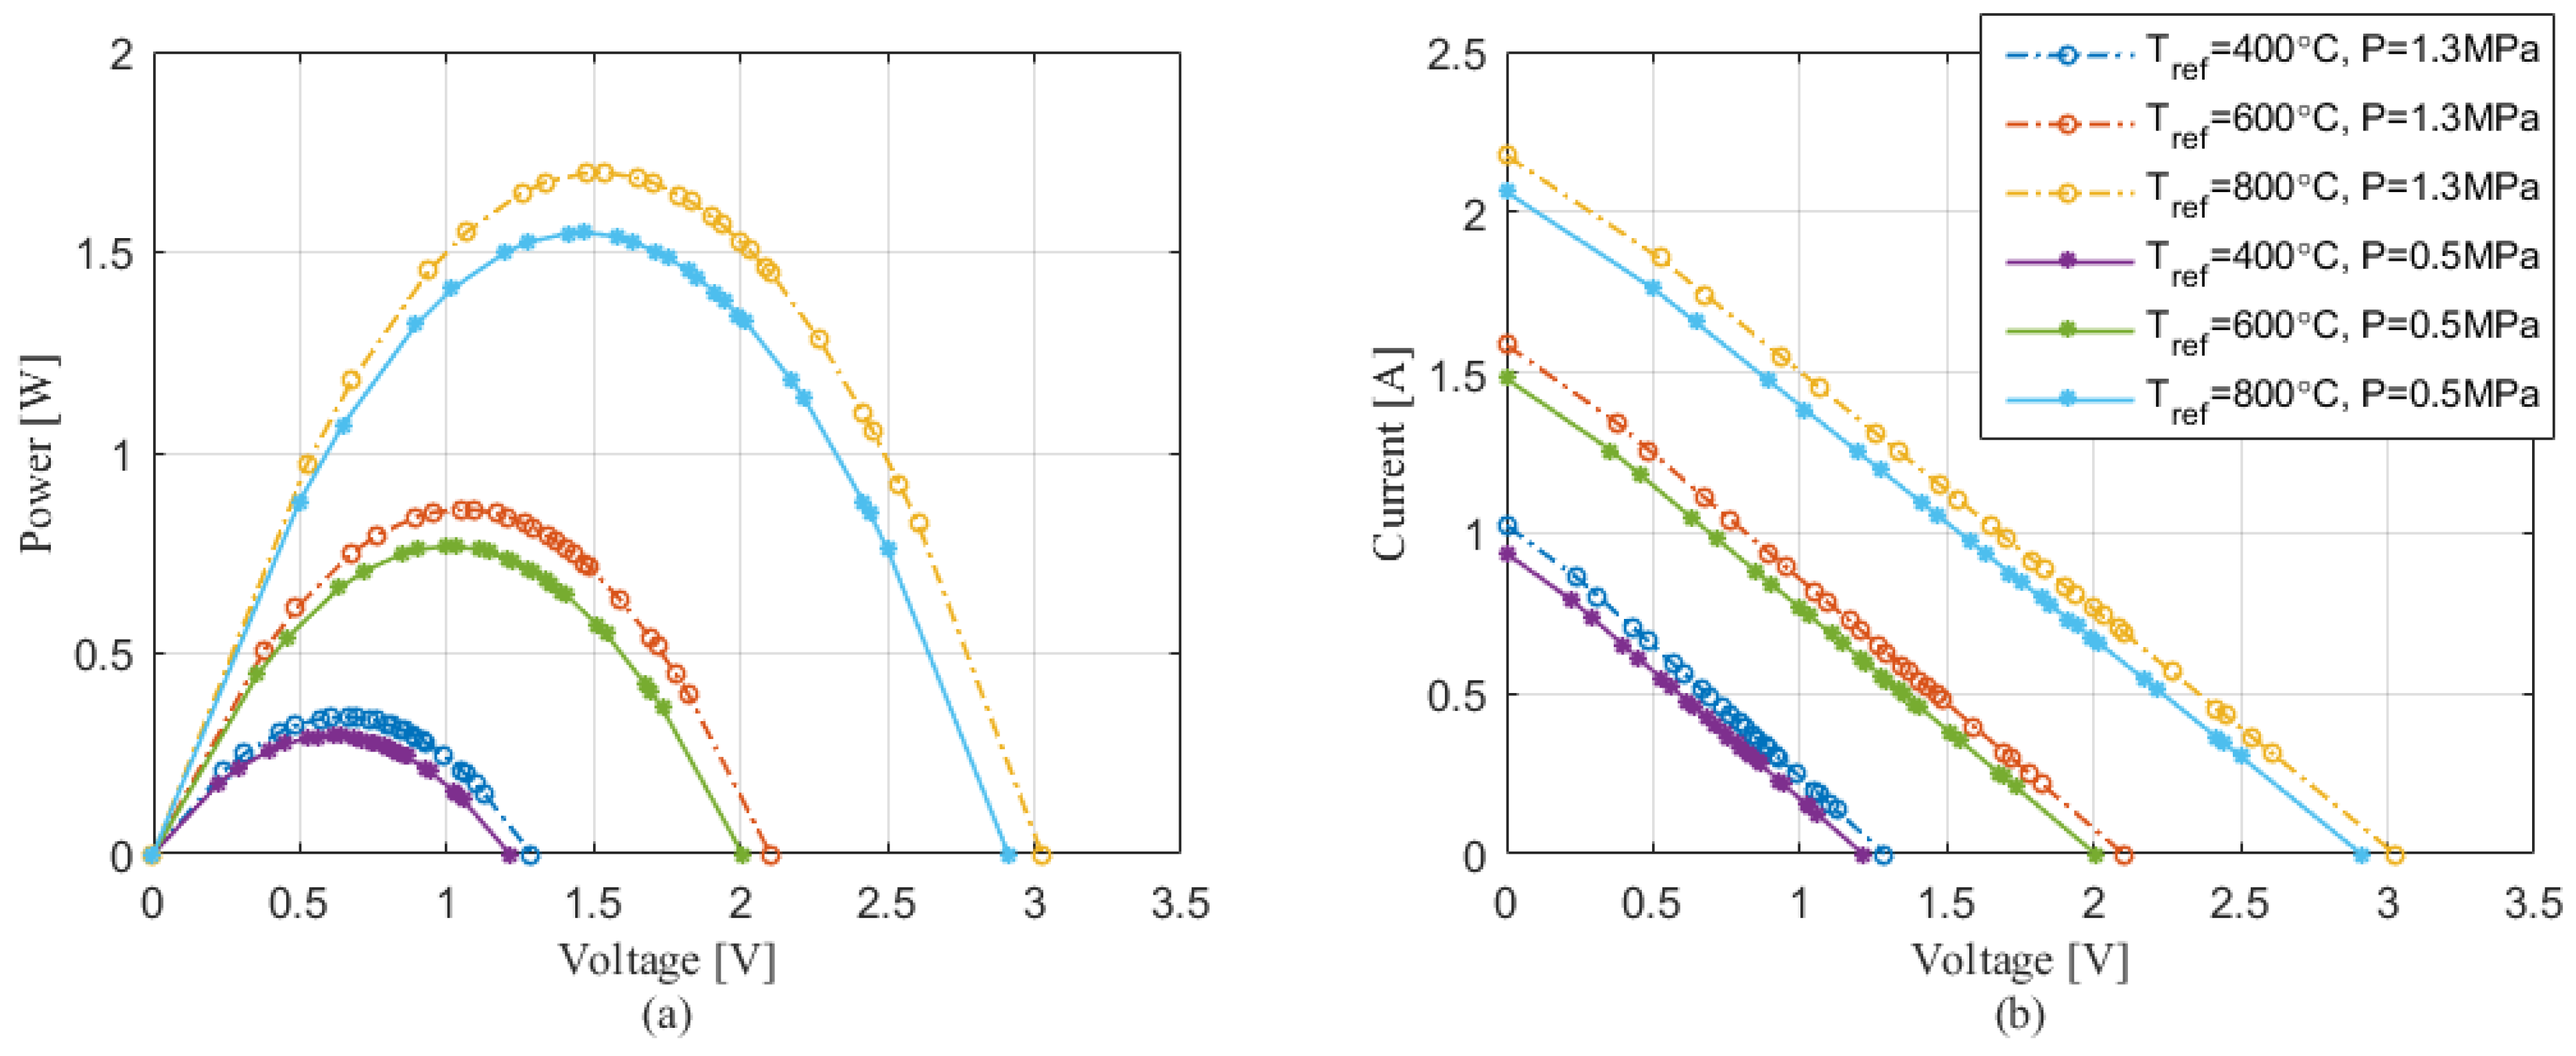
2 CMO-25-42S module. To investigate the influence of the contact pressure, tests were performed at three different temperature references for the heater (400 °C, 600 °C, 800 °C), at two different pressures (1.3 MPa and 0.5 MPa). The lower pressure value was recommended by the TEGeta supplier. The
I-V and
P-V steady-state characteristics of the module at both pressure values are depicted in
Figure 5 and the parameter values can be found in
Table 1.
Figure 5.
I-V and P-V characteristics for CMO-25-42S. The module was tested at heater temperatures Tref = 400 °C, 600 °C, and 800 °C, at two different pressure values, 0.5 MPa (solid line) and 1.3 MPa (dash-dot line).
Figure 5.
I-V and P-V characteristics for CMO-25-42S. The module was tested at heater temperatures Tref = 400 °C, 600 °C, and 800 °C, at two different pressure values, 0.5 MPa (solid line) and 1.3 MPa (dash-dot line).
Table 1.
Parameter characterization (VOC—open-circuit voltage, ISC—short-circuit current, RTEG—TEG resistance, Th—temperature at TEG hot surface, Tc—temperature at TEG hot surface) at different temperature references for the heater (400 °C, 500 °C, 600 °C, 700 °C and 800 °C), each for the two pressure values (0.5 MPa and 1.3 MPa).
| Tref (°C) | P (MPa) | VOC (V) | ISC (A) | RTEG (Ω) | Th (°C) | Tc (°C) |
|---|
| 400 | 0.5 | 1.2143 | 0.9371 | 1.2958 | 293 | 96.5 |
| 1.3 | 1.2885 | 1.0242 | 1.2580 | 304 | 98.5 |
| 500 | 0.5 | 1.5962 | 1.2052 | 1.3244 | 369 | 117 |
| 1.3 | 1.6822 | 1.3008 | 1.2932 | 381 | 119 |
| 600 | 0.5 | 2.0061 | 1.4810 | 1.3546 | 449 | 139 |
| 1.3 | 2.1013 | 1.5891 | 1.3223 | 460 | 141 |
| 700 | 0.5 | 2.4444 | 1.7667 | 1.3836 | 531 | 162 |
| 1.3 | 2.5483 | 1.8750 | 1.3591 | 541 | 162 |
| 800 | 0.5 | 2.9107 | 2.0624 | 1.4113 | 617 | 185 |
| 1.3 | 3.0255 | 2.1761 | 1.3903 | 626 | 186 |
The settings for the heater temperature (Tref) consists of a start-up value (Tref,start), end value (Tref,end), and the step in temperature (Tref,step) desired between the start and end values. For all the experimental results presented in this article, the start-up temperature value was 400 °C and the end temperature was 800 °C.
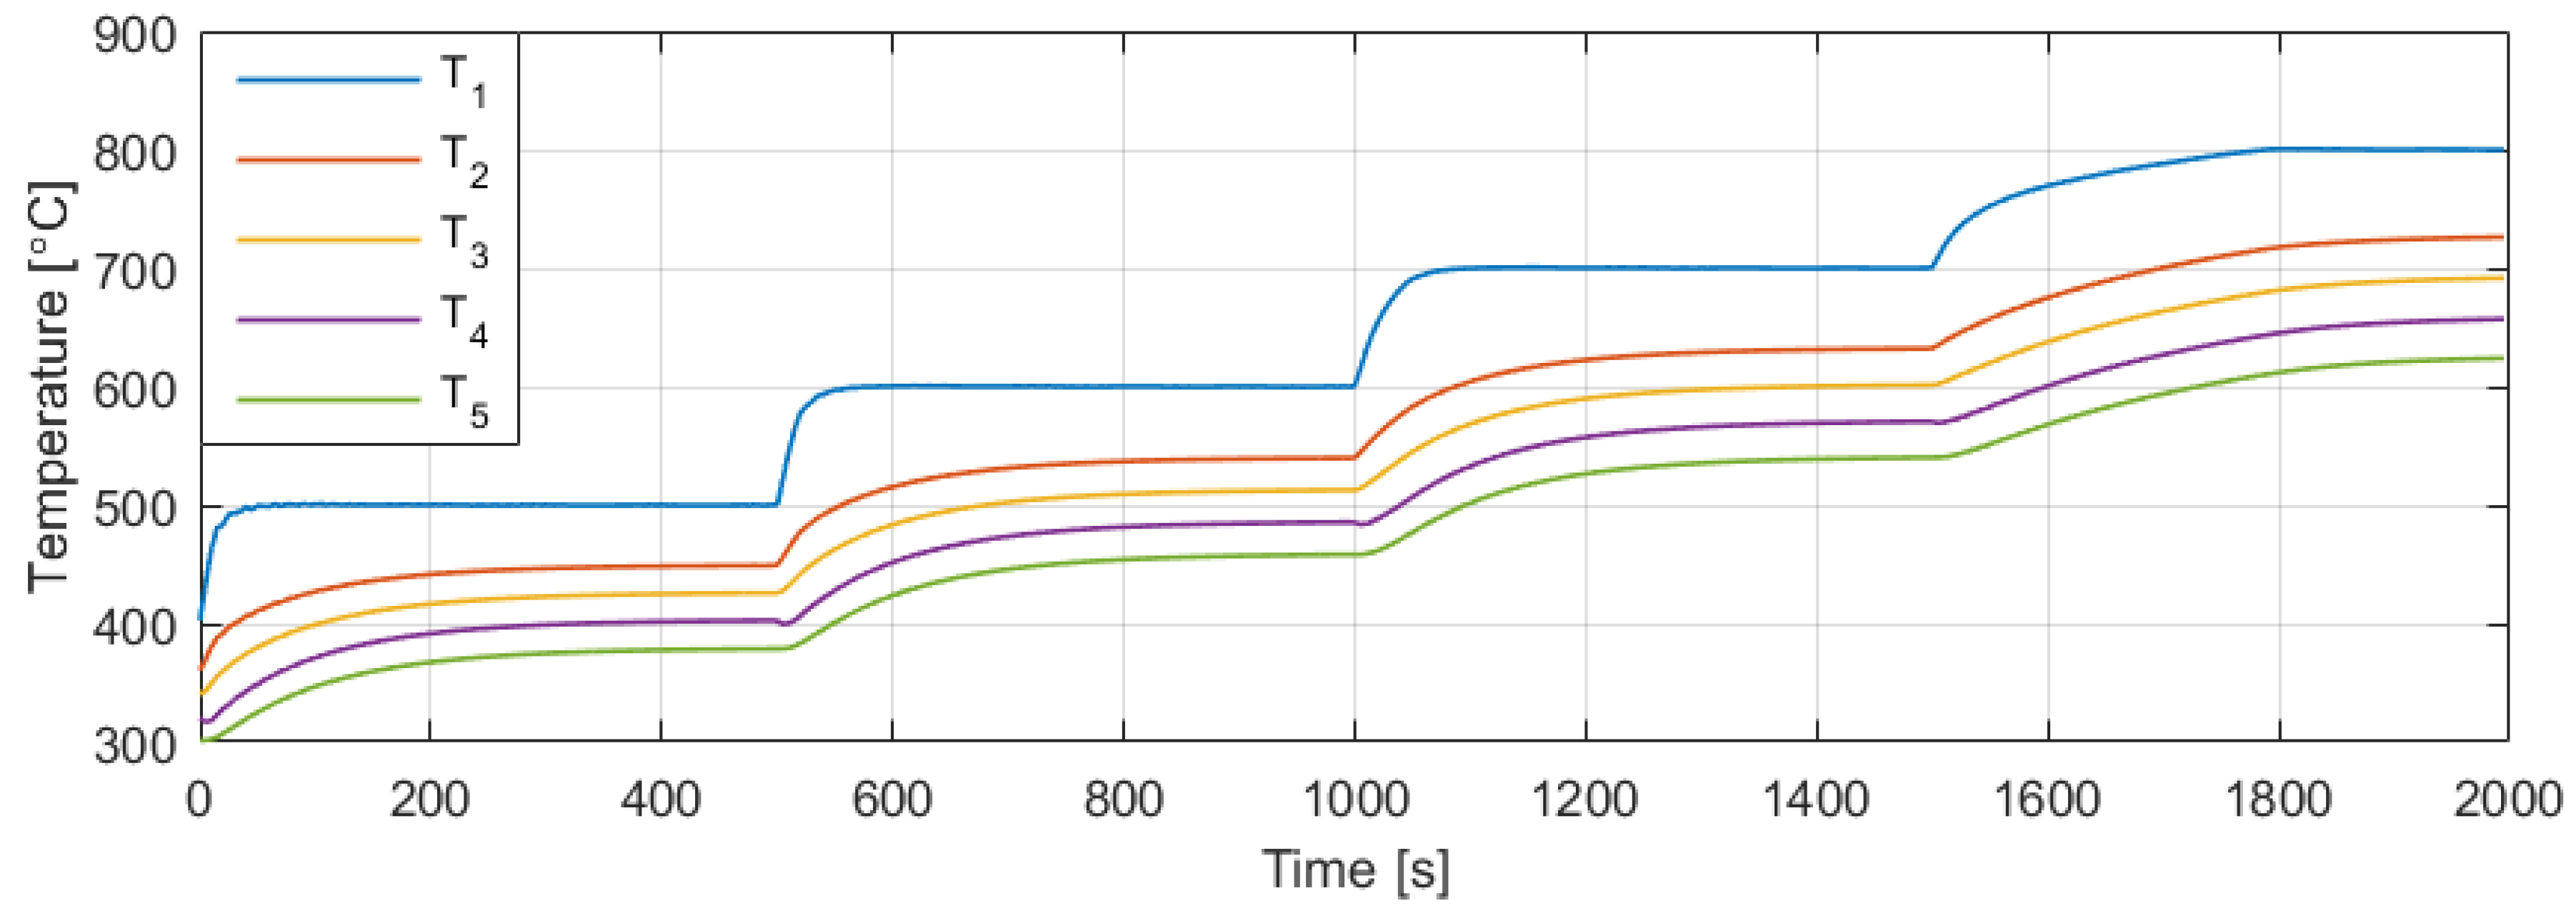
The TEGeta first performed all the measurements for the selected start-up temperature (400 °C), it increased the temperature in the heater, depending on the temperature step setting, and it performed all the measurements again until it reached 800 °C and stopped the process. An example is shown in
Figure 6, where the temperature readings from thermocouples
T1 to
T5 are plotted for a temperature step of
Tref,step = 100 °C. The temperature value changes from the heater to the hot side of the module due to the thermal properties of the material used for the reference block.
Figure 6.
Temperature readings in thermocouples T1-T5 for a start-up temperature (Tref,start) in the heater of 400°C, Tref,step = 100 °C step and end temperature (Tref,end) of 800 °C.
Figure 6.
Temperature readings in thermocouples T1-T5 for a start-up temperature (Tref,start) in the heater of 400°C, Tref,step = 100 °C step and end temperature (Tref,end) of 800 °C.
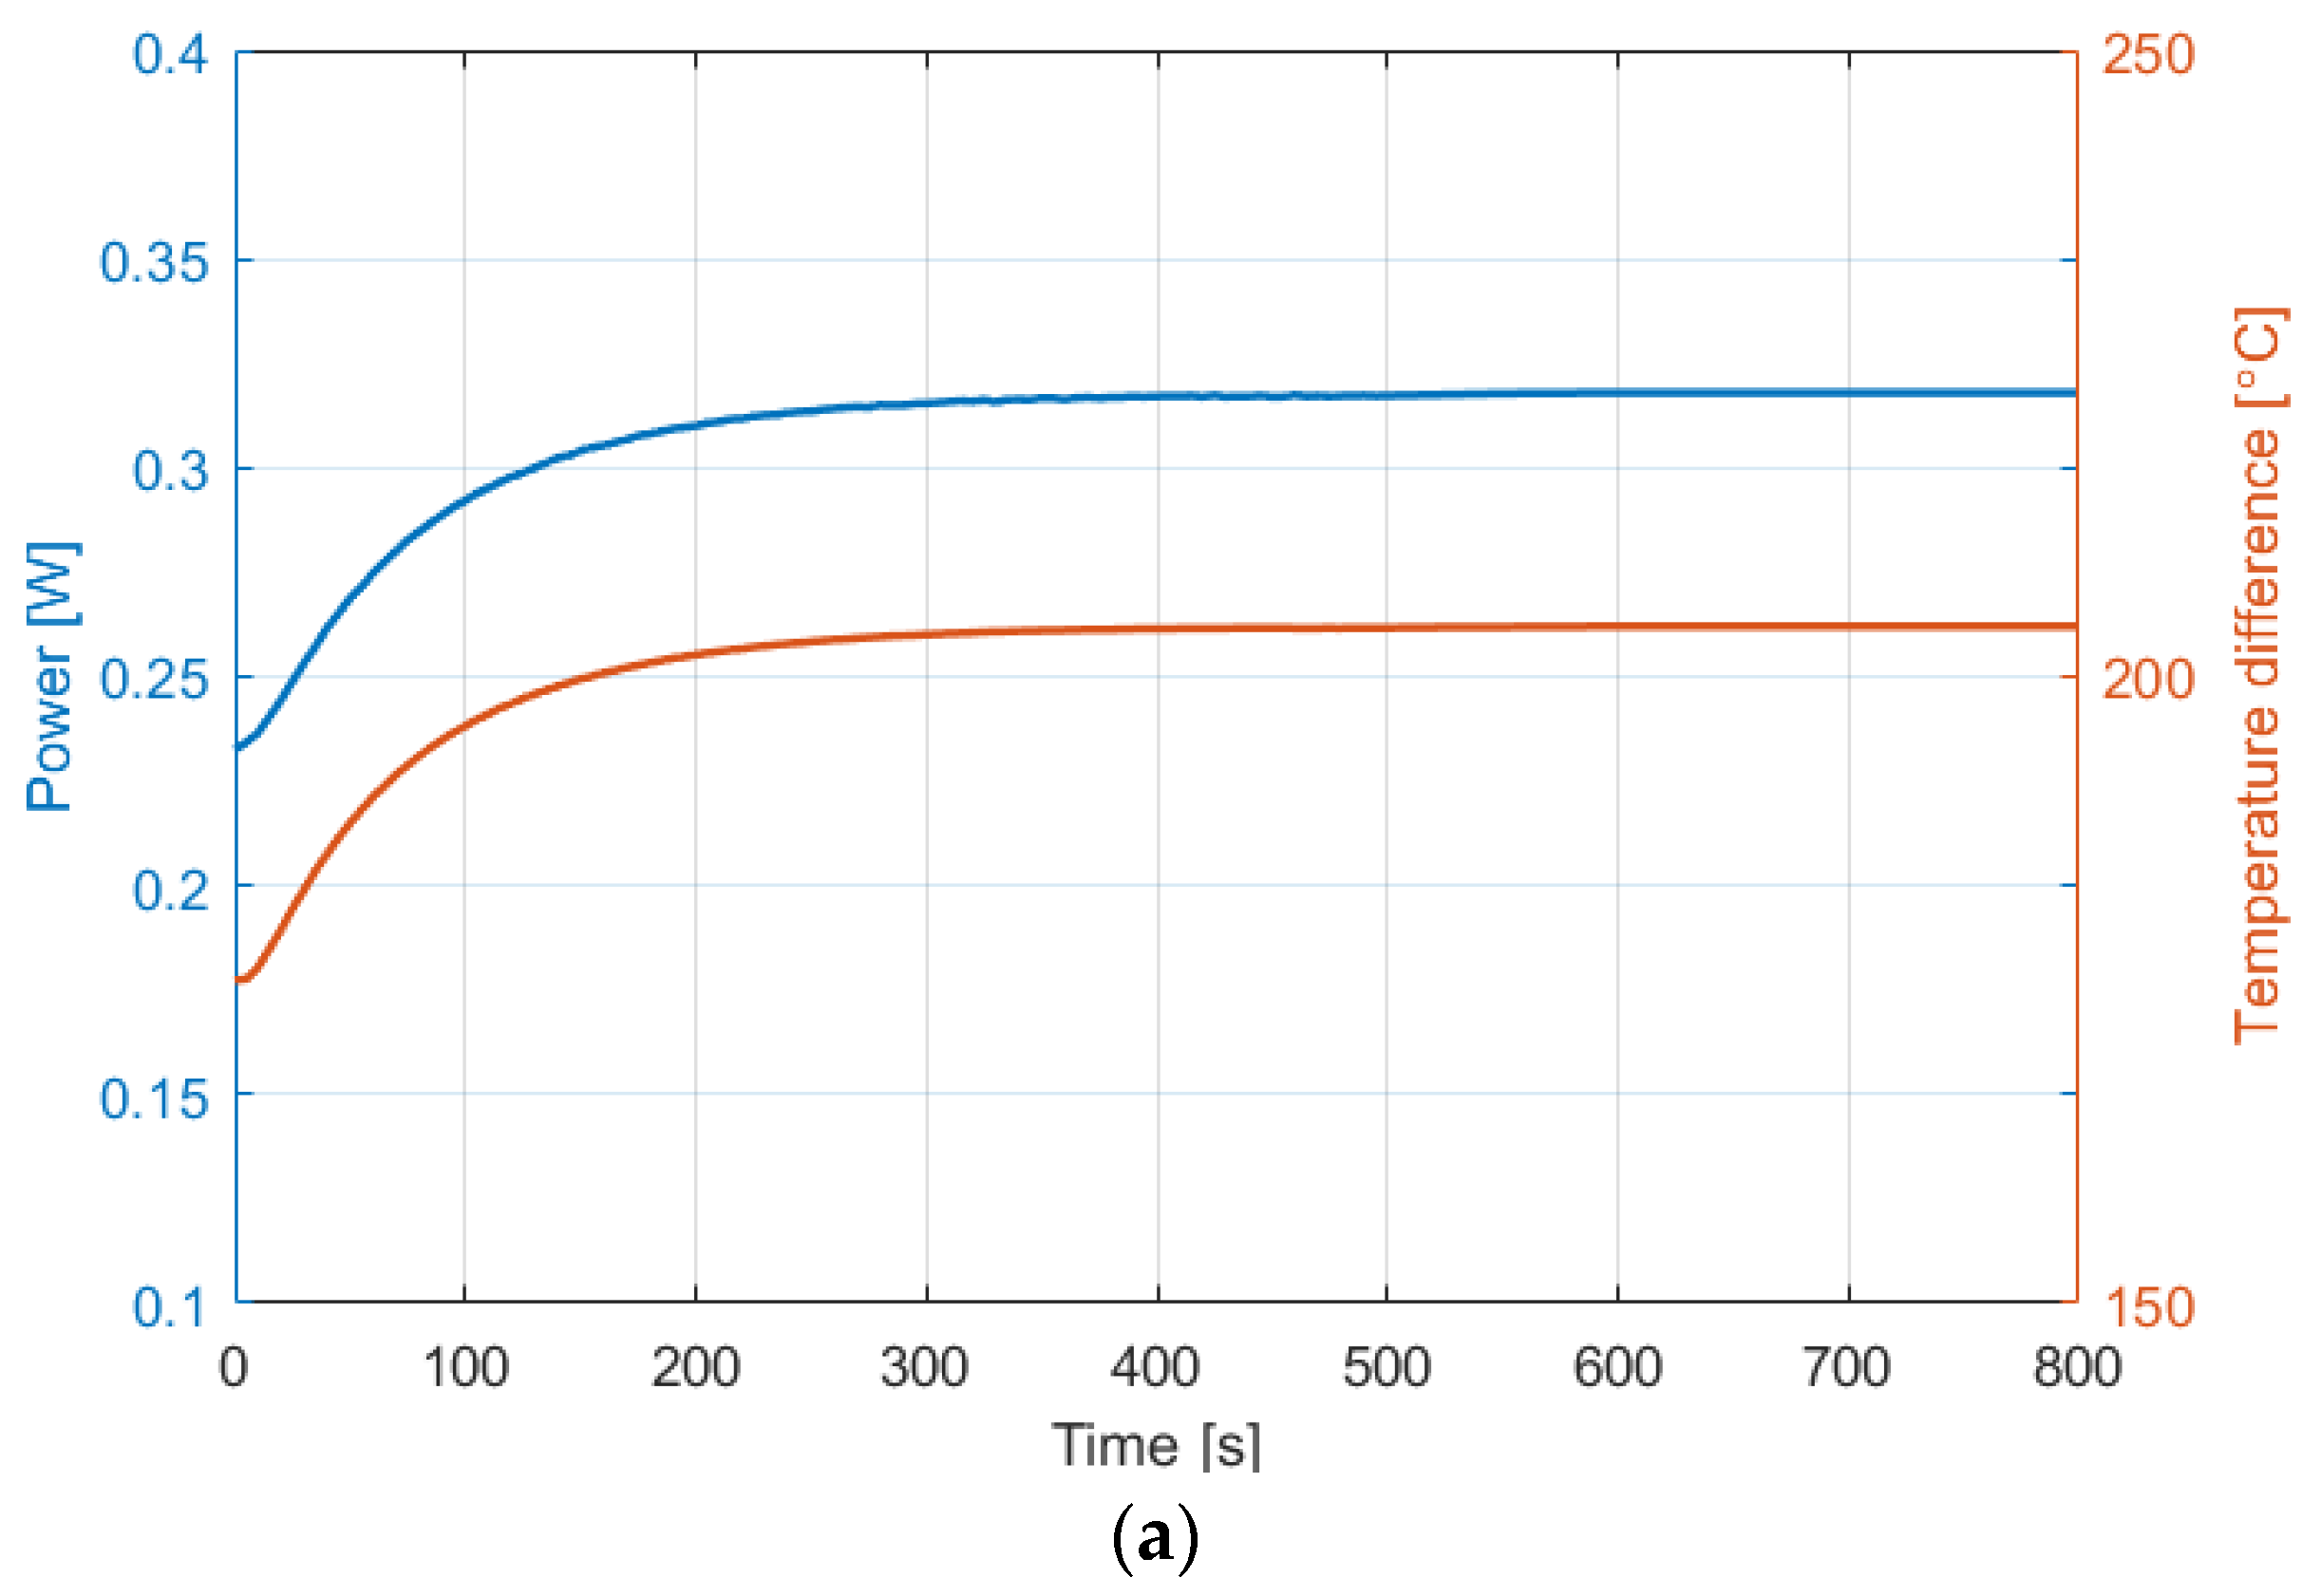
To acquire the transient parametric characterization of the module, a fixed load resistor of 1.33 Ω was used. All measurements were recorded every 5 s and the total time was set for 800 s per Tref setting.
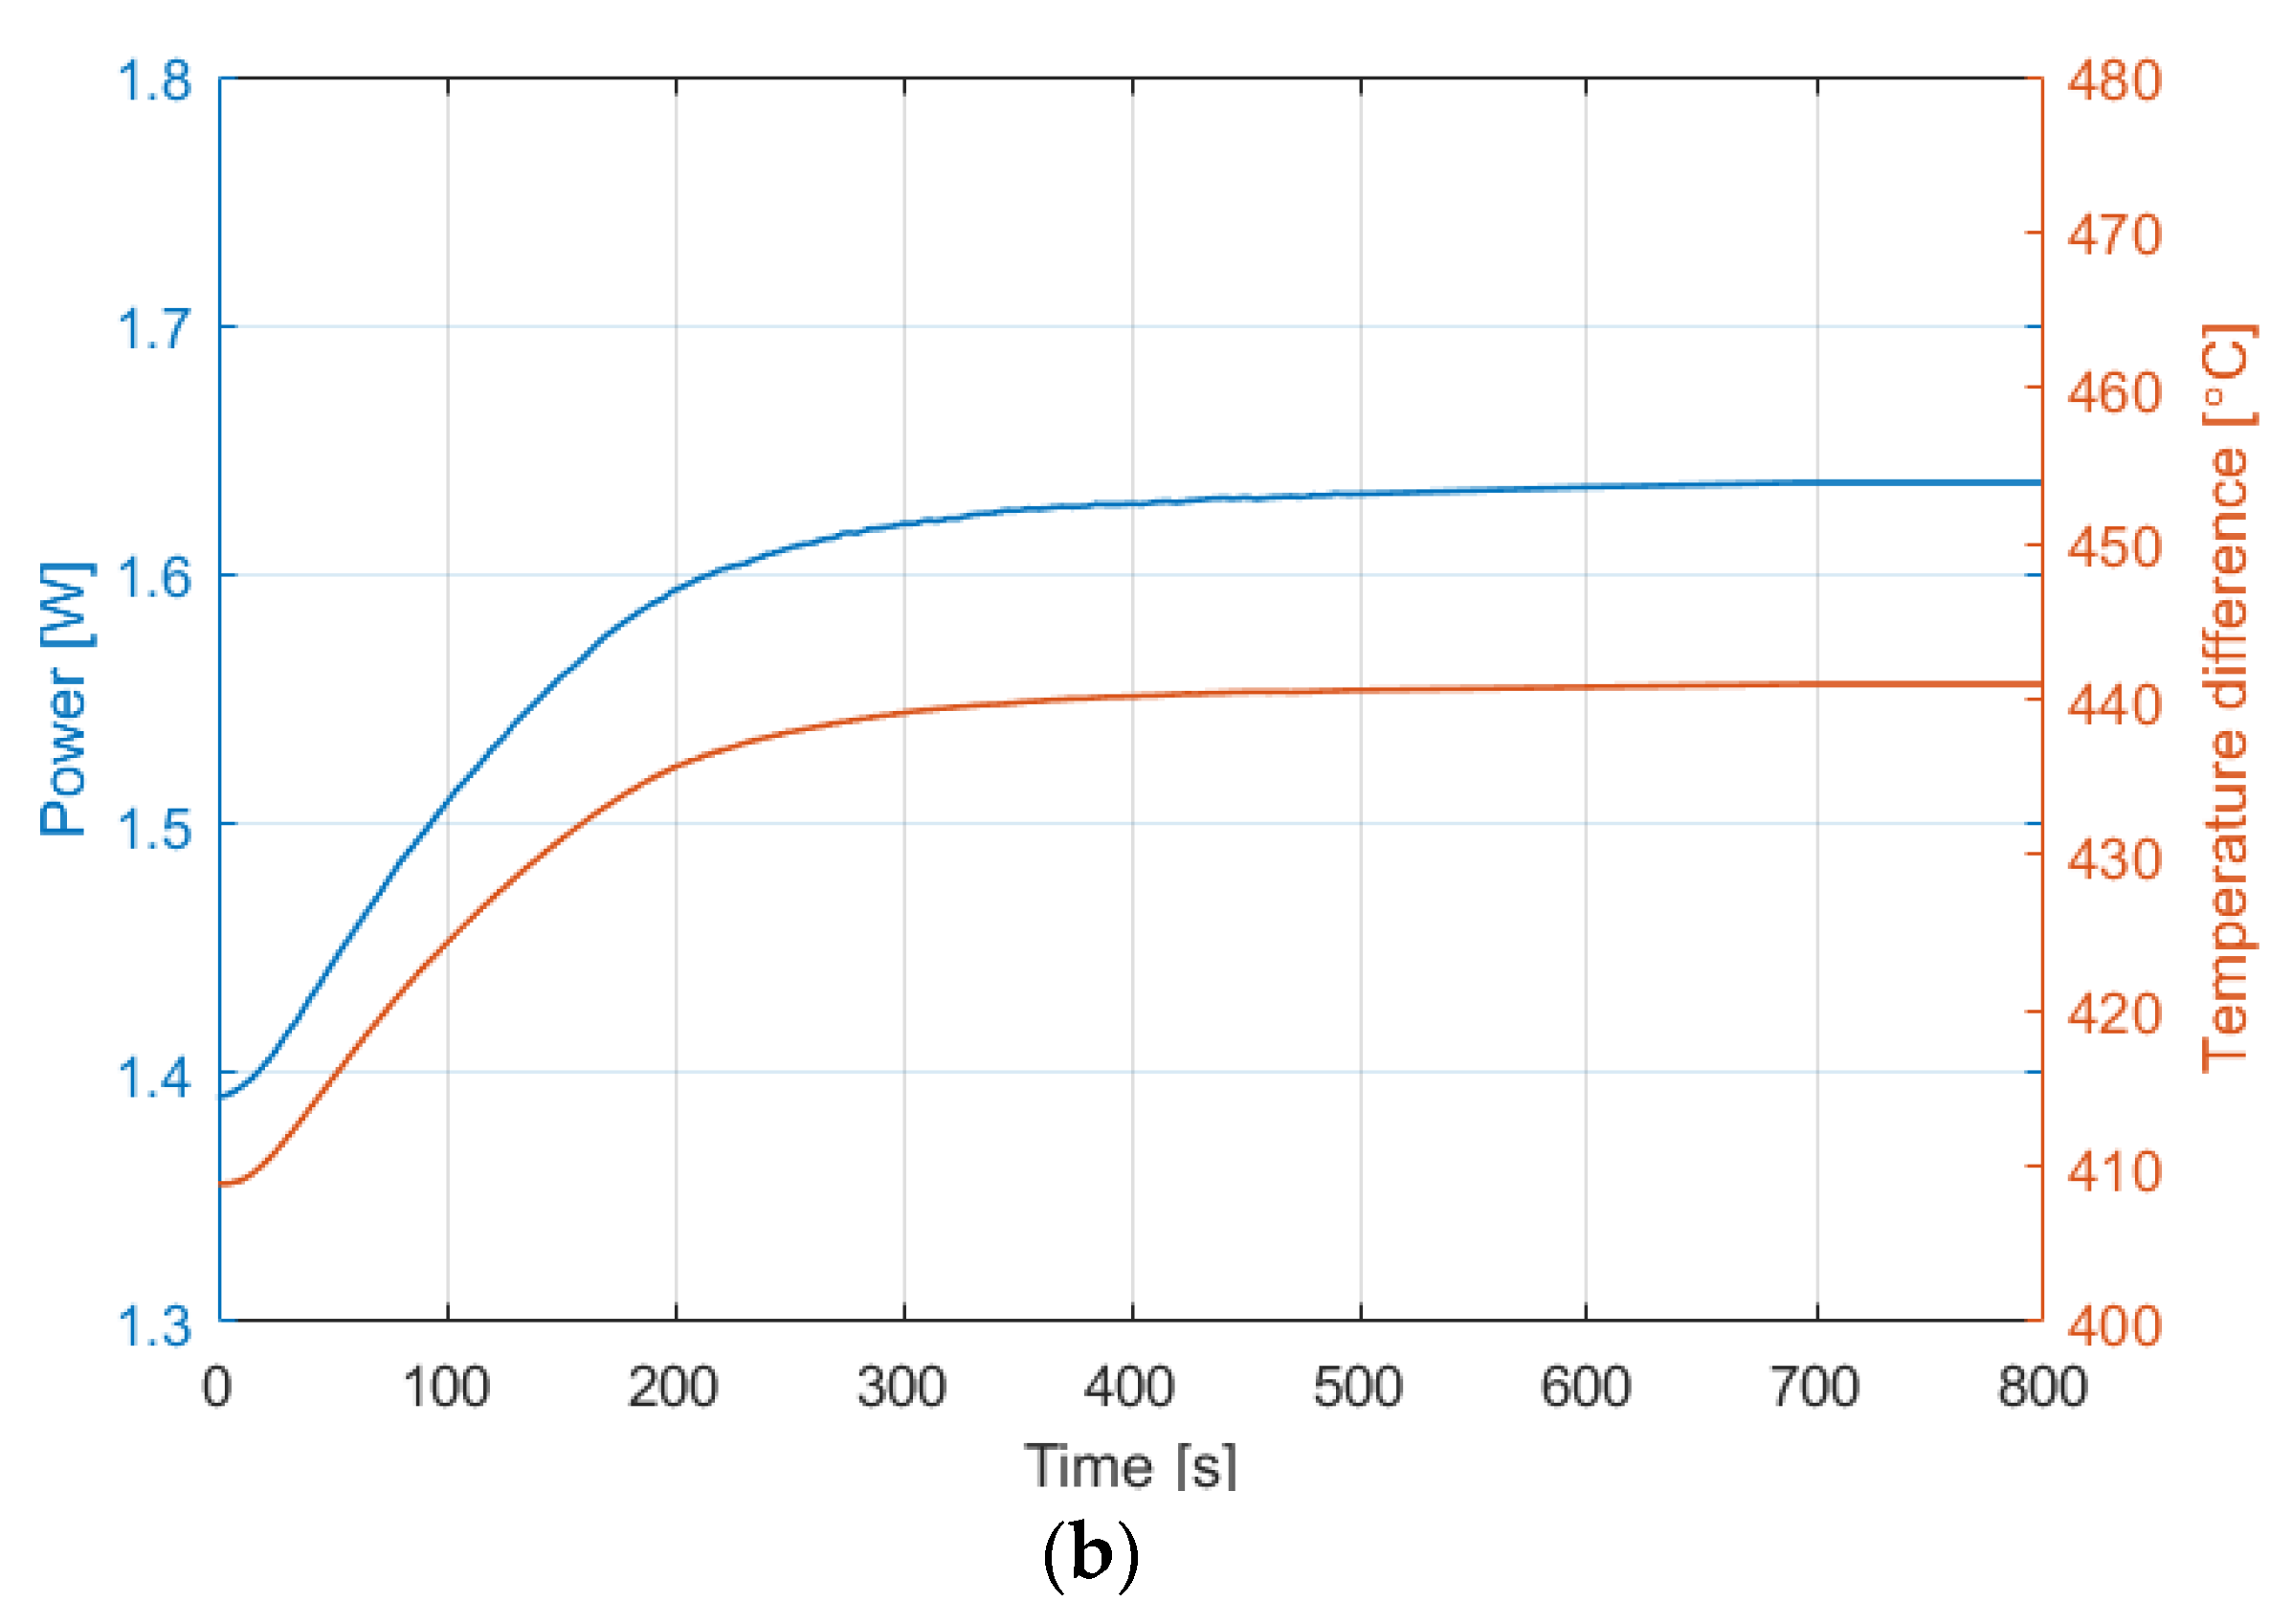
Using this setup, both surface temperatures as well as electrical parameter transients could be achieved. The rate of change of the hot side temperature is higher than the one on the cold side. However, as seen from
Figure 7a,b, the output power transient of the TEG is proportional to the rate of change of the temperature difference across the module. Therefore, the transitory period can be calculated using either the temperature gradient or power
versus time curves. To reach more accurate steady-state results, the temperature difference curves were considered as reference for calculations.
Figure 7.
Power and temperature difference transient response at with Tref,step = 50 °C at (a) Tref_end = 400 °C; and (b) Tref_end = 800 °C.
Figure 7.
Power and temperature difference transient response at with Tref,step = 50 °C at (a) Tref_end = 400 °C; and (b) Tref_end = 800 °C.
Taking into account the theory of first order system response at unit step, the steady-state was calculated accordingly [
8]. The steady-state value is reached when the signal reaches 98% of its final value. The transient time results for the heater reference temperatures (
Tref,end) of 400 °C, 500 °C, 600 °C, 700 °C, and 800 °C with steps (
Tref,step) of 50 °C and 100 °C can be found in
Table 2.
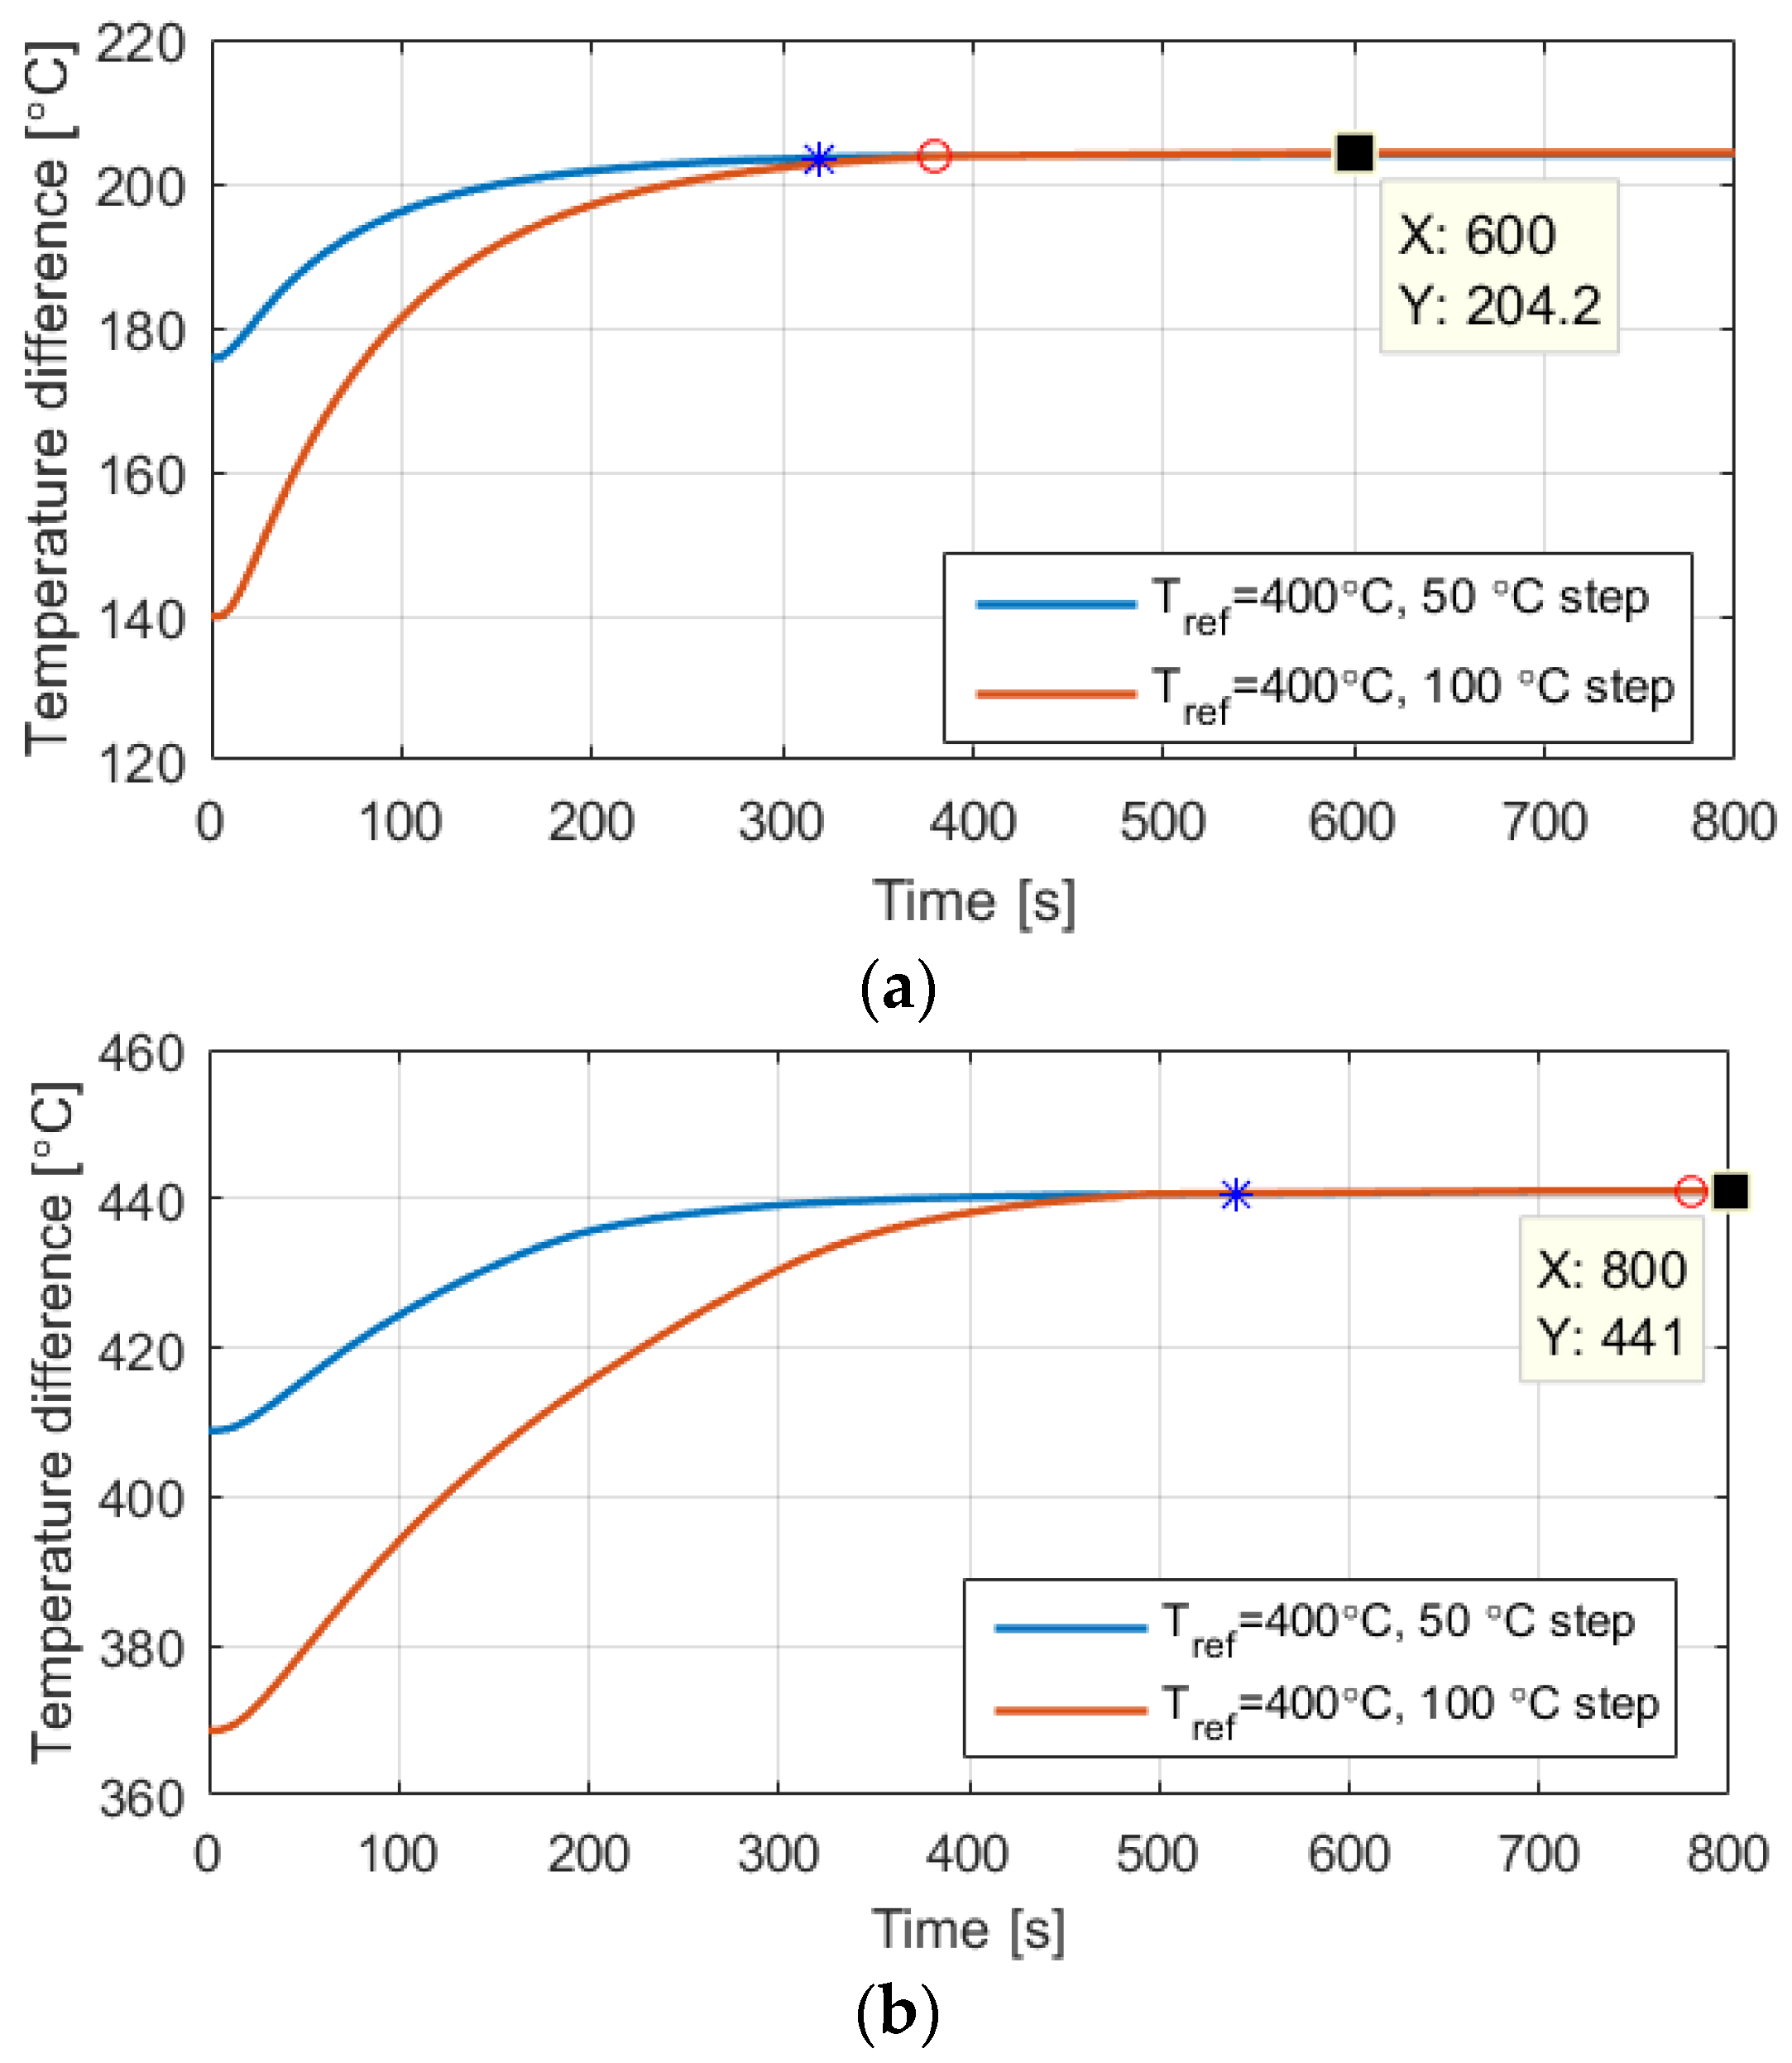
Figure 8a,b present the plots for
Tref,end of 400 °C and 800 °C as well as the point when the steady-state was reached for both
Tref,step cases.
Figure 8.
Hot-side temperature response (T5) of CMO-25-42S with Tref,step= 50 °C, and 100 °C, at (a) Tref_end = 400 °C; and (b) Tref_end = 800 °C.
Figure 8.
Hot-side temperature response (T5) of CMO-25-42S with Tref,step= 50 °C, and 100 °C, at (a) Tref_end = 400 °C; and (b) Tref_end = 800 °C.
Table 2.
Transient time values for CMO-25-42S at the reference temperatures (Tref_end) of 400 °C, 500 °C, 600 °C, 700 °C, and 800 °C with steps (Tref,step) of 50 °C and 100 °C.
Table 2.
Transient time values for CMO-25-42S at the reference temperatures (Tref_end) of 400 °C, 500 °C, 600 °C, 700 °C, and 800 °C with steps (Tref,step) of 50 °C and 100 °C.
| | Transitory Time(s) |
|---|
| Tstep = 50 °C | Tstep = 100 °C |
|---|
| Tref_end = 400 °C | 320 | 380 |
| Tref_end = 500 °C | 340 | 400 |
| Tref_end = 600 °C | 360 | 420 |
| Tref_end = 700 °C | 380 | 440 |
| Tref_end = 800 °C | 540 | 780 |
From
Figure 8 and
Table 2 it can be seen that the transitory time becomes longer for higher reference step temperatures and as the temperature reference is increasing. Also, it can be noticed a tendency for the waiting time to increase proportionally with the
Tref_end value. For this particular study it takes less than 440 s to reach 98% of the steady state value up to a heater temperature of 800 °C. One of the reasons that the transient at
Tref_end = 800 °C is significantly higher than the rest of the results is because the heater started to malfunction due to the high convection and irradiation losses. A solution could be to perform further testing above 800 °C under vacuum to significantly reduce the heat losses. On the other hand, measurements performed under vacuum are not equivalent to real TEG application values and therefore vacuum testing was not considered in this paper.
The TEGeta supplier recommends a rough approximation range for the waiting time between “60–120 s for reasonable results”. Taking into consideration that the test setup requires 5 s per measurement to print the result, the recommended waiting times translate into 300–600 s. The paper offers more accurate waiting times for steady-state to be reached by both the thermal and electrical parameters of the module under test. In this way, the total time required to perform TEG characterization can be improved.
4. Conclusions
This paper investigates the transient and steady-state behavior of both the electrical and thermal parameters of the CMO-25-42S high temperature module. The TEG was experimentally characterized using a commercially available measuring system named TEGeta. The setup can only perform parameter characterization on one module at a time.
First, the module was investigated in steady-state at two different pressure values: one recommended by the test setup supplier and the other by Custom Thermoelectric. As expected, the results confirm that the higher pressure lead to an increased power output by the TEG.
Afterwards, the transient response of the oxide TEG was measured at different heater temperatures in the range of 400–800 °C to explore the high temperature capabilities of the test rig. The data show that when the temperature in the heater increases, there is a temperature transient regime with an approximate duration of 320 s up to 780 s, depending on the reference temperature step size. These values should be taken into consideration when measurements are performed, otherwise errors or mismatches can occur. In addition, by knowing the transitory time, the total characterization time of a TEG module can also be reduced.
Additionally, the paper reveals that the test system encounters difficulties to maintain the input temperature above 700 °C because of the high heat losses though convection and radiation. It is known that convection losses can be significantly reduced if tests are carried under vacuum conditions. The TEGeta can also accommodate these conditions; however the authors did not consider this case because measurements would not be compatible with the ones from real TEG applications.


 ,
, 


