Article

Prediction of State-of-Health for Nickel-Metal Hydride Batteries by a Curve Model Based on Charge-Discharge Tests

1
School of Chemistry and Chemical Engineering, Huazhong University of Science and Technology, Wuhan 430074, China
2
Key laboratory of Material Chemistry for Energy Conversion and Storage, Huazhong University of Science and Technology, Ministry of Education, Wuhan 430074, China
*
Author to whom correspondence should be addressed.
Energies 2015, 8(11), 12474-12487; https://doi.org/10.3390/en81112322
Submission received: 24 June 2015 / Revised: 13 October 2015 / Accepted: 27 October 2015 / Published: 4 November 2015

Abstract

:
Based on charge-discharge cycle tests for commercial nickel-metal hydride (Ni-MH) batteries, a nonlinear relationship is found between the discharging capacity (Cdischarge, Ah) and the voltage changes in 1 s occurring at the start of the charging process (ΔVcharge, mV). This nonlinear relationship between Cdischarge and ΔVcharge is described with a curve equation, which can be determined using a nonlinear least-squares method. Based on the curve equation, a curve model for the state-of-health (SOH) prediction is constructed without battery models and cycle numbers. The validity of the curve model is verified using (Cdischarge, ΔVcharge) data groups obtained from the charge-discharge cycle tests at different rates. The results indicate that the curve model can be effectively applied to predict the SOH of the Ni-MH batteries and the best prediction root-mean-square error (RMSE) can reach upto 1.2%. Further research is needed to confirm the application of this empirical curve model in practical fields.

Graphical Abstract

1. Introduction

Nickel-metal hydride (Ni-MH) batteries have been applied in portable electronics and electric or hybrid-electric vehicles (EVs and HEVs) owing to their relatively good storage and power, higher safety, and excellent environmental acceptability [1,2,3,4]. With regard to these applications, the failure of Ni-MH batteries, resulting from irreversible capacity degradation and loss of performance in cycle service [5,6], is a key issue that warrants close attention. The state-of-health (SOH) status of a battery, which defines the current battery performance relative to its unused condition, is a powerful indicator of battery performance [7] and is usually used to predict the end-of-life and aging of batteries [8,9]. However, the definition of battery SOH is still somewhat equivocal [10] because different battery parameters can be used as the indicators of battery performance. This ambiguity makes the determination of battery SOH a difficult task.
Generally, three definitions of battery SOH have been reported, including SOH values based on battery impedance [11,12], battery capacity [9], and comprehensive battery parameters such as impedance, capacity, open circuit potential (OCV), charging or discharging current, and temperature (T) [13,14,15,16,17]. Apparently, the SOH based on comprehensive battery parameters reflects the present battery performance more accurately, but it also makes the estimation more complicated. The SOH values based on battery impedance and capacity are considered to reflect the capability of the battery to provide a certain power and to store energy, respectively. Both of the SOH values are widely applied in EVs and HEVs. In this case, all the methods for the estimation of battery impedance and battery capacity can be used as a basis for the SOH estimation. However, the estimations of battery impedance and battery capacity are also not easy to do, especially online estimation [18,19].
The reported methods for the estimation of battery SOH can be generally divided into two categories: physics-based model estimations and non-physics-based model estimations. Physics-based model estimations are based on electrical or electrochemical cell models [20,21,22,23,24,25,26,27]. In order to improve the estimation accuracy, some algorithms, such as adaptive observers [28], extended Kalman filter (EKF) [29,30], and relevance vector machines (RVMs)—particle filters (PFs) [31], are usually employed. The main problem for this kind of estimation is that the battery electrical or electrochemical models may not be unique and it is difficult to verify their validity. If the used cell model is not appropriate, the estimation accuracy may be lower and difficult to improve. In addition, the used algorithms are relatively complicated, which make it difficult to use them for online estimation.
In the non-physics-based model estimations, some learning algorithms, such as neural networks [32,33,34], support vector machines (SVMs) [35,36], RVMs [37], and fuzzy logic [38,39], are applied, in which the measured impedance parameters [12,32] and other characteristic battery parameters (e.g., discharge current [33], temperature, and state-of-charge (SOC) [34]) are employed as input variables. These methods can learn the battery behavior based on monitored data and thus do not demand battery physics models, but they need lots of training data and depend on the availability of a historic data set. In this case, it is difficult to use them for online estimations. Another kind of non-physics-based model estimation uses various curve equations between the practicable capacity and aging cycles [40,41,42,43,44], in which the parameters of the equations can be obtained by data fitting algorithms, and further they can be adjusted online by using a particle filtering (PF) approach [43] or by combining sets of training data based on Dempster-Shafer theory (DST) and the Bayesian Monte Carlo (BMC) method [44]. This method also needs a lot of accelerated aging test data to determine the curve equations, but it does not need complicated mathematic computations. In addition, the number of aging cycles of a used battery may be unknown in practical applications.
The purpose of this work is to find a simple model for the SOH prediction of Ni-MH batteries to avoid the problems mentioned above, such as the uncertainty of battery physics models, complicated algorithms, comprehensive parameters, and unknown cycle numbers. Therefore we tried to construct a simple curve model without electrical or electrochemical battery models and cycle numbers.
In this work, the SOH is defined as Equation (1) due to the presence of charge-discharge efficiency:
SOH = Cdischarge/Crated
where Cdischarge (Ah) is the discharging capacity of fully charged Ni-MH batteries and Crated (Ah) is the rated capacity. As the Crated for one type of Ni-MH battery is a constant value, the SOH prediction is reduced to the prediction of Cdischarge. Based on the analysis of a lot of charge-discharge cycle test data for commercial Ni-MH batteries, the voltage change in 1 s occurring at the start of the charging process (ΔVcharge, mV) was selected as the characteristic parameter, and a curve equation between Cdischarge and ΔVcharge was determined to construct a curve model for the Cdischarge prediction. Then the prediction precision of this curve model was verified by using some typical charge and discharge data for the Ni-MH batteries.

2. Experimental

Commercial AA-type Ni-MH cells (Pisen®, Sichuan, China, Crated = 1.8 Ah and rated voltage = 1.2 V) were used in this study. All charge-discharge tests were conducted using a computer-controlled charge-discharge instrument (BTS-3008-5V3A, Xinwei, Guangzhou, China) at room temperature (20 ± 5 °C). The charge-discharge data, including current (I), potential (V), time (t), and cycle number (n), were recorded automatically with the sampling frequency of 1 Hz. The charge-discharge rates have significant influence on battery performance, so three different charge-discharge rates (0.5C, 1.0C, and 1.6C) were selected to simulate low, medium, and high charge-discharge rate conditions. The charge-discharge test program is described as follows:
The Ni-MH cells with initial SOC at 0% were fully charged at a constant current (Icharge: 0.5C, 1.0C, and 1.6C), then after an interval of 600 s, they were discharged at the same constant current (Idischarge: 0.5C, 1.0C, and 1.6C) to the cutoff voltage (0.9 V). After an interval of 1800 s, the next cycle of charge-discharge test was started. When the Cdischarge of the test cells fell to 80% of the initial capacity, the charge-discharge tests were terminated [45]. The failure capacity is still defined as 0.8Crated in this paper for convenient applications.

3. Results and Discussion

3.1. Curve Modeling for Cdischarge

Figure 1 gives the typical I-t and V-t curves of two cycles for a Ni-MH battery in the charge-discharge test at 1.0C. In each cycle there are four abrupt voltage changes (ΔV) occurring at the start/end of the charging and discharging processes, respectively. According to the equivalent circuit of the test cell [8,46], these four ΔV values in each cycle generally reflect the internal resistance (Rinternal) of the test cell in different states, and there is little difference among their values. However, the measurement of ΔV is much easier than the test of Rinternal, so it is selected as studied parameter. Before the start of the charging process, the completely discharged test cell was in a relatively stable state after the recovery of 1800 s, so in this paper we select the ΔV in 1 s at the start of the charging process (ΔVcharge, mV) as the characteristic parameter to verify its relationship with the aging state of the test cell, as shown in Figure 1.
Figure 1. Typical I-t and V-t curves in the charge-discharge test at 1.0C for Ni-MH batteries (AA-type, 1.8 Ah, 1.2 V).
Energies 08 12322 g001
Through the analysis of the I-t and V-t data for each test battery, we obtained Cdischarge and ΔVcharge in each cycle. In order to observe the relationship of these three parameters, we made a three-dimensional (3D) diagram of (CdischargeVcharge-n) for all the test Ni-MH batteries. Figure 2a shows a typical 3D diagram for a Ni-MH battery in the charge-discharge test at 1.0C and its two-dimensional (2D) projection diagrams (Cdischarge-n, ΔVcharge-n, CdischargeVcharge).
From Figure 2a it can be seen that (Cdischarge; ΔVcharge; n) data points form a curve in the 3D space without obvious discrete point; suggesting that there would be nonlinear relationships between these three parameters. From the different 2D diagrams in Figure 2b–d; it can be seen more clearly that Cdischarge-n; ΔVcharge-n and CdischargeVcharge curves all display good nonlinear relationships. The results in Figure 2b,c can be explained appropriately [41] and the nonlinear relationships between Cdischarge-n and ΔVcharge-n can be used to predict the state of Ni-MH batteries. However; sometimes the number of cycles for a Ni-MH battery is unknown. In this case; the nonlinear relationship between Cdischarge and ΔVcharge; as shown in Figure 2d; is important for a curve model without cycle numbers. If we can obtain the relationship between Cdischarge and ΔVcharge for a Ni-MH battery; we can obtain its Cdischarge through the measurement of its ΔVcharge and then estimate its SOH with Equation (1).
Finally, we identified that Equation (2) can be used to describe the nonlinear relationship between ΔVcharge (mV) and Cdischarge (Ah):
C discharge = a 1 + exp [ k × ( Δ V charge c ) ]
where a (Ah), k (mV−1) and c (mV) are constants related to test batteries. We found that k was negative with a small absolute value (|k|) and related to the charge-discharge rate. In the initial cycles, ΔVcharge << c and therefore, if |k| is not very small, there is, exp [−k × (ΔVchargec)] → 0 and aCdischarge. So a can be considered as a parameter related to the initial Cdischarge of the test battery when |k| is not very small, which may be near its rated capacity. When ΔVcharge = c, Cdischarge = 0.5a. Thus, c can be considered as a parameter related to the ΔVcharge when Cdischarge is at its 50% initial value.
Figure 2. 3D diagram for a Ni-MH battery in the charge-discharge test at 1.0C (AA-type, 1.8 Ah, 1.2 V): (a) 3D diagram and (b), (c) and (d) projection of the 3D diagram.
Energies 08 12322 g002
The raw data in Figure 2d was fitted with Equation (2) by a nonlinear least-squares method, and the fitted curve indicates that it fits the raw data well. In order to verify the validity of Equation (2), different (Cdischarge, ΔVcharge) raw data obtained from different Ni-MH batteries with different charge-discharge rates were fitted with Equation (2) by the nonlinear least-squares method. Figure 3 shows some typical (Cdischarge, ΔVcharge) raw data at different charge-discharge rates and their fitted curves with Equation (2). Table 1 lists the fitting parameters of a, c, and k for different Ni-MH cells at different rates, in which R2 is a correlation coefficient and Prange is the selection range of initial values for each fitting parameter when using the nonlinear least-squares method to solve their values.
The results in Figure 3 and Table 1 prove that Equation (2) can well describe the relationship between Cdischarge and ΔVcharge. From Table 1, it can be seen that at 0.5C and 1.0C the parameter a is approximate to the rated capacity of the test Ni-MH batteries (1.8 Ah), while at 1.6C it becomes larger than the rated capacity because of the too small |k| value. It should be noted that at 1.6C the too small |k| value makes |−k × (ΔVchargec)| << 1 and then, there is exp [−k × (ΔVchargec)] ≈ 1 − [k × (ΔVchargec)]. In this case, the nonlinear relationship between Cdischarge and ΔVcharge described with Equation (2) becomes an approximate linear relationship especially with an increase in ΔVcharge, as shown in Figure 3.
Figure 3. (Cdischarge, ΔVcharge) raw data at different rates and their fitting curves with Equation (2).
Energies 08 12322 g003
Table 1. Fitting parameters of a, c, and k for different Ni-MH cells at different rates.
Ratesa/Ahc/mVk/mV−1R2
0.5CPrange1.5–2.0200–400−0.02–0-
1.8131317.58−0.01460.9862
1.0CPrange1.5–2.0200–400−0.03–0-
1.7828320.26−0.01720.9882
1.7420310.20−0.01640.9851
1.7680223.30−0.01880.9796
1.7839286.11−0.01660.9800
1.9433313.77−0.00780.9865
1.7962381.17−0.00780.9869
1.6CPrange2.0–3.0200–400−0.015–0-
2.4479258.21−0.00570.9898
2.6365239.15−0.00480.9890
Apparently, the values of the a, c, and k change with the charge-discharge rate. Table 1 shows that when the charge-discharge rate increases from 0.5C to 1.0C, the change of these three parameters is small, while at 1.6C the change of a and k is obvious. It may be speculated that the values of the three parameters just fluctuate slightly when the charge-discharge rate is in a certain range, such as 0.5C–1.0C. If so, this curve model should also be used in practical fields that the charge-discharge rates are not constant during applications. Further research will be conducted to verify the application of this curve model in practical fields. In this paper we just focus on the curve model itself and its SOH prediction accuracy.

3.2. State-of-Health (SOH) Prediction of Ni-MH Batteries Based on the Curve Model for Cdischarge

When the relationship between Cdischarge and ΔVcharge of one battery is built as Equation (2), the Cdischarge can be predicted by measuring the ΔVcharge of the battery and then the SOH can be obtained with Equation (1). So we used the (Cdischarge, ΔVcharge) raw date in Table 1 to check whether the curve model for Cdischarge can be used for the SOH prediction.
Theoretically, only three groups of (Cdischarge, ΔVcharge) data are needed to solve the three parameters in Equation (2). However, the measured raw data usually have some discrete points, as shown in Figure 2 and Figure 3, so more groups of (Cdischarge, ΔVcharge) data are needed and the prediction error is inevitable. In order to evaluate the prediction error, the root-mean-square error (RMSE) is defined as Equation (3):
R M S E = 1 n [ C discharge , j C discharge , j test ] 2 / n ,   j = 1 ,   ,   n
where C discharge , j test is the test value for sample j; C discharge , j is the predicted value for sample j; and n is the total number of samples.
The prediction method is described as follows:
(1) A certain number of (Cdischarge, ΔVcharge) data groups in continuous charge-discharge test cycles were selected to fit the parameters in Equation (2) using a nonlinear least-squares method to obtain Equation (2) for the test Ni-MH battery;
(2) The predicted Cdischarge values were calculated with Equation (2) using the tested ΔVcharge values apart from those used in Step 1; and (3) the predicted RMSE was checked with Equation (3) using the predicted Cdischarge values and the corresponding tested Cdischarge values. Through the predicted RMSE we can judge how large the prediction error is and whether the prediction is valid.
Using different numbers of (Cdischarge, ΔVcharge) data groups in different parts of the CdischargeVcharge curve, as shown in Figure 4, may result in different prediction results. In this paper, the first cycle Cdischarge of a selected (Cdischarge, ΔVcharge) data group ( C discharge 0 ) is described with the SOH value of the test battery, and a relative capacity drop (RCd) is defined to describe the variation range of Cdischarge in the selected (Cdischarge, ΔVcharge) data group, as presented in Equation (4):
RCd = C discharge 0 C discharge n C discharge 0
where C discharge n is the last cycle Cdischarge of the selected (Cdischarge, ΔVcharge) data group. Apparently, the RCd value determines the last (Cdischarge, ΔVcharge) data of the selected data group. Because we used all the (Cdischarge, ΔVcharge) data in continuous test cycles, a larger RCd value means more data in the selected data group. In this case, the SOH and RCd values for a selected data group can determine its position on the Cdischarge–ΔVcharge curve and also indicate the corresponding battery states.
Firstly, the effect of the number of used (Cdischarge, ΔVcharge) data groups, which is described by RCd, on the prediction of Cdischarge is investigated. Figure 4 shows a 3D diagram of (CdischargeVcharge-n) for a Ni-MH battery in the charge-discharge test at 1.0C and the predicted results obtained with SOH = 97.38% and different RCds (0.5%, 1.0%, and 1.5%), in which the corresponding cycle numbers of the selected data range and the prediction RMSE values are also listed. In Figure 4, the three data groups are selected from 90–138 cycles (48 data), 90–166 cycles (77 data), and 90–184 cycles (95 data), respectively. The first cycle of the three date groups is the same, so they have the same SOH value (97.38%). Their RCd values are calculated with Equation (4) using the Cdischarge of the 90th cycle (i.e., C discharge 0 ) and C discharge 138 , C discharge 166 , and C discharge 184 , respectively. It is seen that the prediction RMSE value decreases with an increase in RCd, suggesting that using more (Cdischarge, ΔVcharge) data groups may decrease the prediction error.
Figure 4. 3D diagram of (CdischargeVcharge-n) for a Ni-MH battery in the charge-discharge test at 1.0C and the prediction curves obtained with SOH = 97.38% and different relative capacity drops (RCds) (0.5%, 1.0%, and 1.5%).
Energies 08 12322 g004
The SOH value of the selected data group, i.e., the position of the starting point of the selected data group, may also influence the prediction result. So we selected data groups at different SOH with various RCds (0.5%, 1.0%, 1.5%, and 2.0%) to fit the parameters in Equation (2) and calculated the corresponding prediction RMSE values, as shown in Figure 5.
In Figure 5, the average RMSE value at each SOH is presented and shown with a star symbol, while the general average RMSE value ( R M S E ¯ ) is also given and shown with a horizontal dashed line. The RMSE value obtained by using data groups at SOH = 94.89% with RCd = 0.5% deviates significantly from other RMSE values, which may be due to the fluctuation of the raw data groups, so it was eliminated from the calculation of the average RMSE values.
Figure 5. Prediction root-mean-square error (RMSE) for a Ni-MH battery in the charge-discharge test at 1.0C using (Cdischarge, ΔVcharge) data groups at different SOH with various RCds.
Energies 08 12322 g005
From Figure 5, it can be seen that when SOH = 97.82%, the prediction RMSE decreases obviously with an increase in RCd, which is consistent with the result in Figure 4. But when the SOH value decreases to 97.12%, 96.77%, 94.89%, and 94%, at each SOH the prediction RMSE does not decrease with an increase in RCd, suggesting that using more data groups does not necessarily help improve the prediction precision. In addition, the prediction RMSE does not show some regular change with a decrease in the SOH, but generally it seems that when the SOH is in an intermediate range (97.12% and 96.77%), the prediction RMSE is relatively lower.
Figure 6 shows the selected (Cdischarge, ΔVcharge) raw data in Figure 5 and the prediction data with the best RMSE (1.2%) and the RMSE (1.7%) near the R M S E ¯ in Figure 5 (1.75%).
From Figure 6, we can clearly see that the prediction data well accords with the raw data, especially when Cdischarge > 1.44 Ah, i.e., before the failure capacity (0.8Crated), indicating that the prediction accuracy of this curve model is satisfied. It should be noted that the initial part of the raw data in Figure 6 (SOH > 97.12%) has some volatility. So using this part of the raw data for the Cdischarge prediction may result in higher prediction error (i.e., large RMSE) and using more data groups (i.e., large RCd) may improve the prediction precision, as shown in Figure 5 at SOH = 97.82%. When the SOH decreases to 97.12%–96.77%, the fluctuation of the raw data decreases, as shown in Figure 6; this may result in lower prediction RMSE, as shown in Figure 5.
Considering the influence of different charge-discharge rates on the prediction results, we selected the (Cdischarge, ΔVcharge) raw data at 0.5C and 1.6C to check the curve model using the same method described above. Figure 7 shows the prediction RMSE for a Ni-MH battery in the charge-discharge test at 0.5C using (Cdischarge, ΔVcharge) data groups at different SOH with various RCds, in which the average prediction RMSE values are also given as described in Figure 5. The RMSE values at SOH = 98.97% are relative large, which may also result from the fluctuation in the initial data groups, so they are eliminated from the calculation of the R M S E ¯ in Figure 7.
Figure 6. (Cdischarge, ΔVcharge) raw data used in Figure 5 and the prediction data with the best RMSE (1.2%) and the RMSE (1.7%) near the R M S E ¯ in Figure 5 (1.75%).
Energies 08 12322 g006
Figure 7. Prediction RMSE for a Ni-MH battery in the charge-discharge test at 0.5C using (Cdischarge, ΔVcharge) data groups at different state-of-health (SOH) with different RCds.
Energies 08 12322 g007
From Figure 7, it can be seen that at SOH = 98.97% the prediction RMSE is higher and does not decrease with an increase in RCd, while at lower SOH values (98.02%–94.45%) the prediction RMSE decreases with an increase in RCd. In general, it seems that when the SOH is in an intermediate range (98.02% and 97.12%), the prediction RMSE is relatively lower, which is consistent with the results in Figure 5.
Figure 8 presents the (Cdischarge, ΔVcharge) raw data used in Figure 7 and the prediction data with the best RMSE (1.2%) and the RMSE (2.1%) near the R M S E ¯ in Figure 7 (2.23%). Similarly, there is fluctuation in the initial part of the (Cdischarge, ΔVcharge) raw data and the prediction data well accords with the raw data before the failure capacity.
Figure 8. (Cdischarge, ΔVcharge) raw data used in Figure 7 and the prediction data with the best RMSE (1.2%) and the RMSE (2.1%) near the R M S E ¯ in Figure 7 (2.23%).
Energies 08 12322 g008
Figure 9 shows the prediction RMSE for a Ni-MH battery in the charge-discharge test at 1.6C, in which the average prediction RMSE values are also given as described in Figure 5. Similarly, the RMSE values at SOH = 95% are eliminated from the calculation of the R M S E ¯ value in Figure 9.
Figure 10 presents the (Cdischarge, ΔVcharge) raw data used in Figure 9 and the prediction data with the best RMSE (1.2%) and the RMSE (1.6%) near the R M S E ¯ in Figure 9 (1.53%). It can be seen that there is an obvious increase in the Cdischarge value in the initial charge-discharge period, as shown in Figure 10, so these data groups cannot be used for the prediction. As shown in Figure 9, only when the SOH < 95%, the prediction RMSE decreases to a lower value and the prediction data also accords well with the raw data before the failure capacity, as shown in Figure 10.
The results in Figure 4, Figure 5, Figure 6, Figure 7, Figure 8, Figure 9 and Figure 10 indicate that the curve model based on Equation (2) can be effectively applied to predict the SOH of the Ni-MH batteries, and the best prediction RMSE is around 1.2%. The selected raw data groups for the prediction significantly influence the prediction RMSE. Generally, the data groups in the early period of the charge-discharge test, which depends on the charge-discharge rate, are not suitable for the SOH prediction because of data fluctuations. Increasing the RCd value, i.e., using more data groups for the SOH prediction, does not necessarily help improve the prediction precision, which may also be related to the data fluctuation. Generally, using data groups at the SOH in an intermediate range and with the RCd value in the range of 1.5%–2.0% may result in lower prediction RMSE.
Figure 9. Prediction RMSE for a Ni-MH battery in the charge-discharge test at 1.6C using (Cdischarge, ΔVcharge) data groups at different SOH with various RCds.
Energies 08 12322 g009
Figure 10. (Cdischarge, ΔVcharge) raw data used in Figure 9 and the prediction data with the best RMSE (1.2%) and the RMSE (1.6%) near the R M S E ¯ in Figure 9 (1.52%).
Energies 08 12322 g010
Apart from good prediction accuracy, this curve model is also simple and easy-to-use. These advantages are important for online applications. For any type of Ni-MH battery, we can use charge-discharge cycle tests to determine the three parameters (a, c, and k) in the curve model at different charge-discharge rates. Then, we can easily detect the SOH of the same type Ni-MH batteries without considering their aging history (e.g., cycle numbers). As shown in Table 1, the three parameters for different batteries change a little in a certain range of charge-discharge rates, such as 0.5–1.0C. In this case, it is possible to use their average values to construct a general model for the applications with fluctuated charge-discharge rates. Moreover, if more than three (Cdischarge, ΔVcharge) data can be obtained during applications, the new values of the three parameters (a, c, and k) can be calculated to modify the general curve model. Certainly, this application of the curve model is needed further verification.
One of limitations for this curve model is that it’s relatively higher prediction error in a higher SOH range especially at higher charge-discharge rates. In addition, it should be noted that in this work the (Cdischarge, ΔVcharge) data obtained from the charge-discharge cycle test were employed to construct the curve model and to verify its validity for the SOH prediction. In practical applications, batteries may undertake nonuniform charge-discharge processes, such as intermittent charge or discharge processes. Therefore, further research is needed to confirm whether this curve model can continue to be used for any Ni-MH battery in practical applications.

4. Conclusions

Based on charge-discharge cycle tests for commercial Ni-MH batteries (Pisen®, 1.2 V, 1.8 Ah), a curve model was constructed without battery models and cycle numbers for the SOH prediction and its prediction precision was verified. The main conclusions were drawn as follows:
(1)
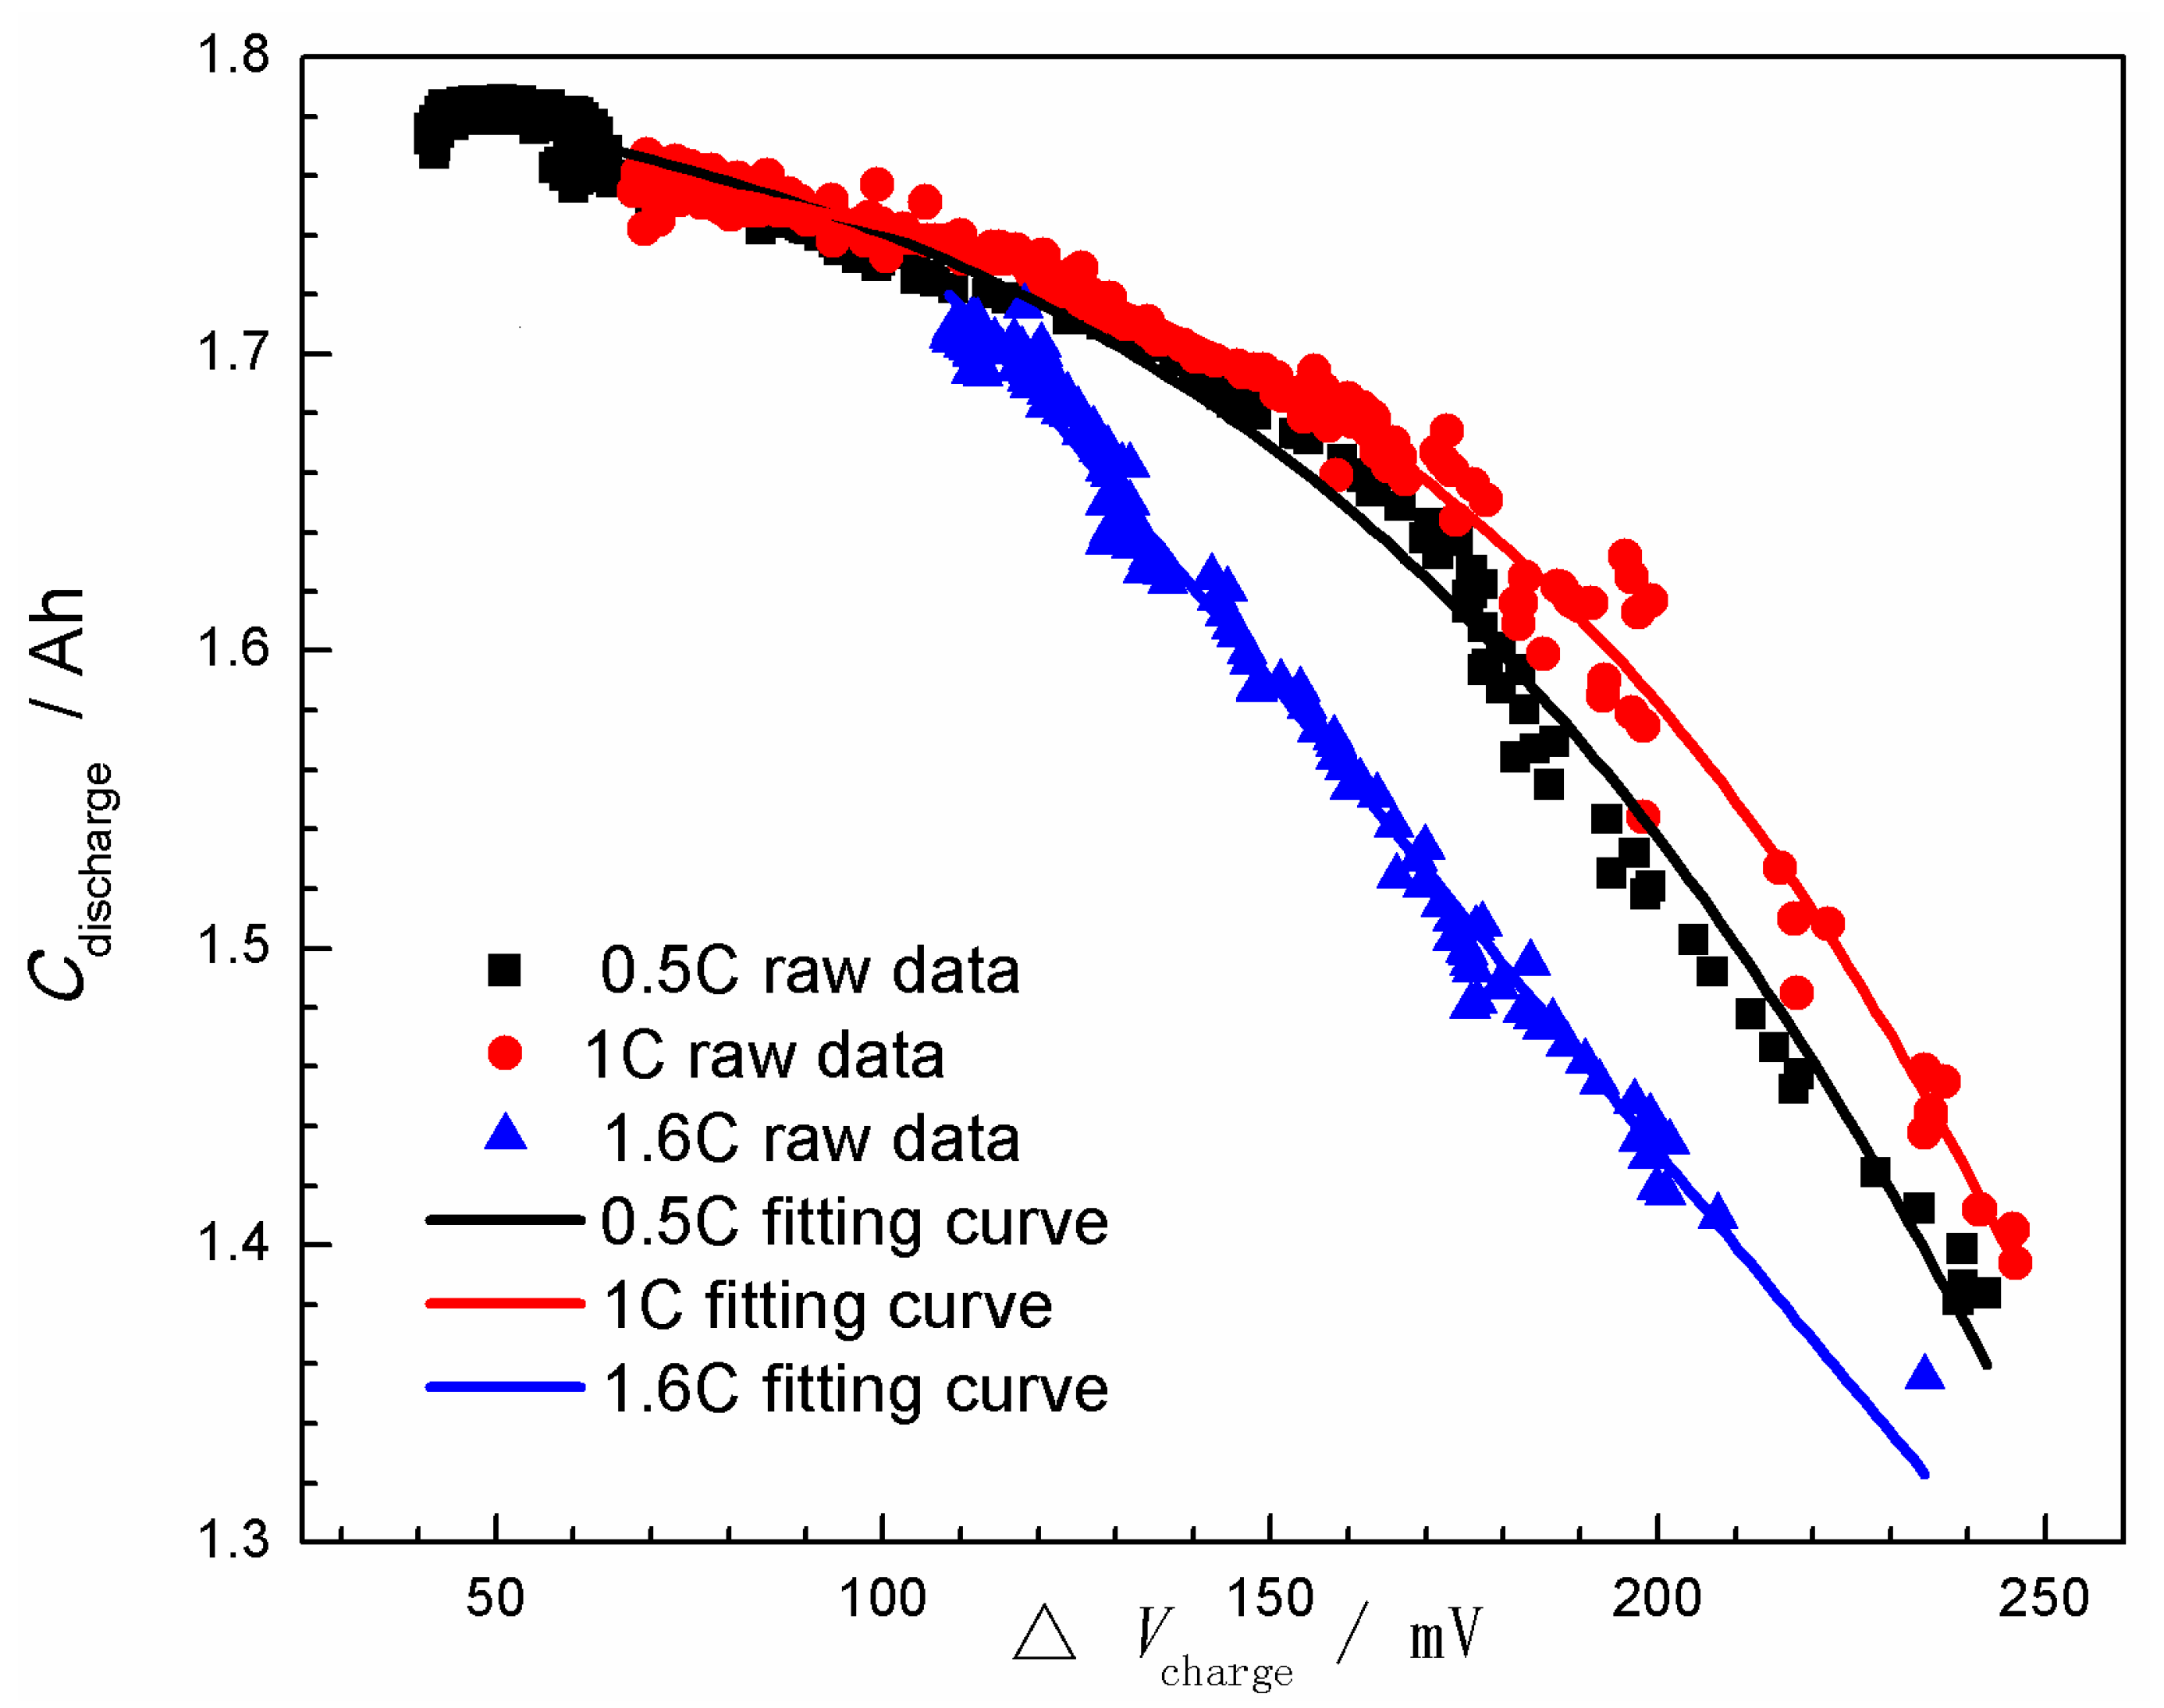
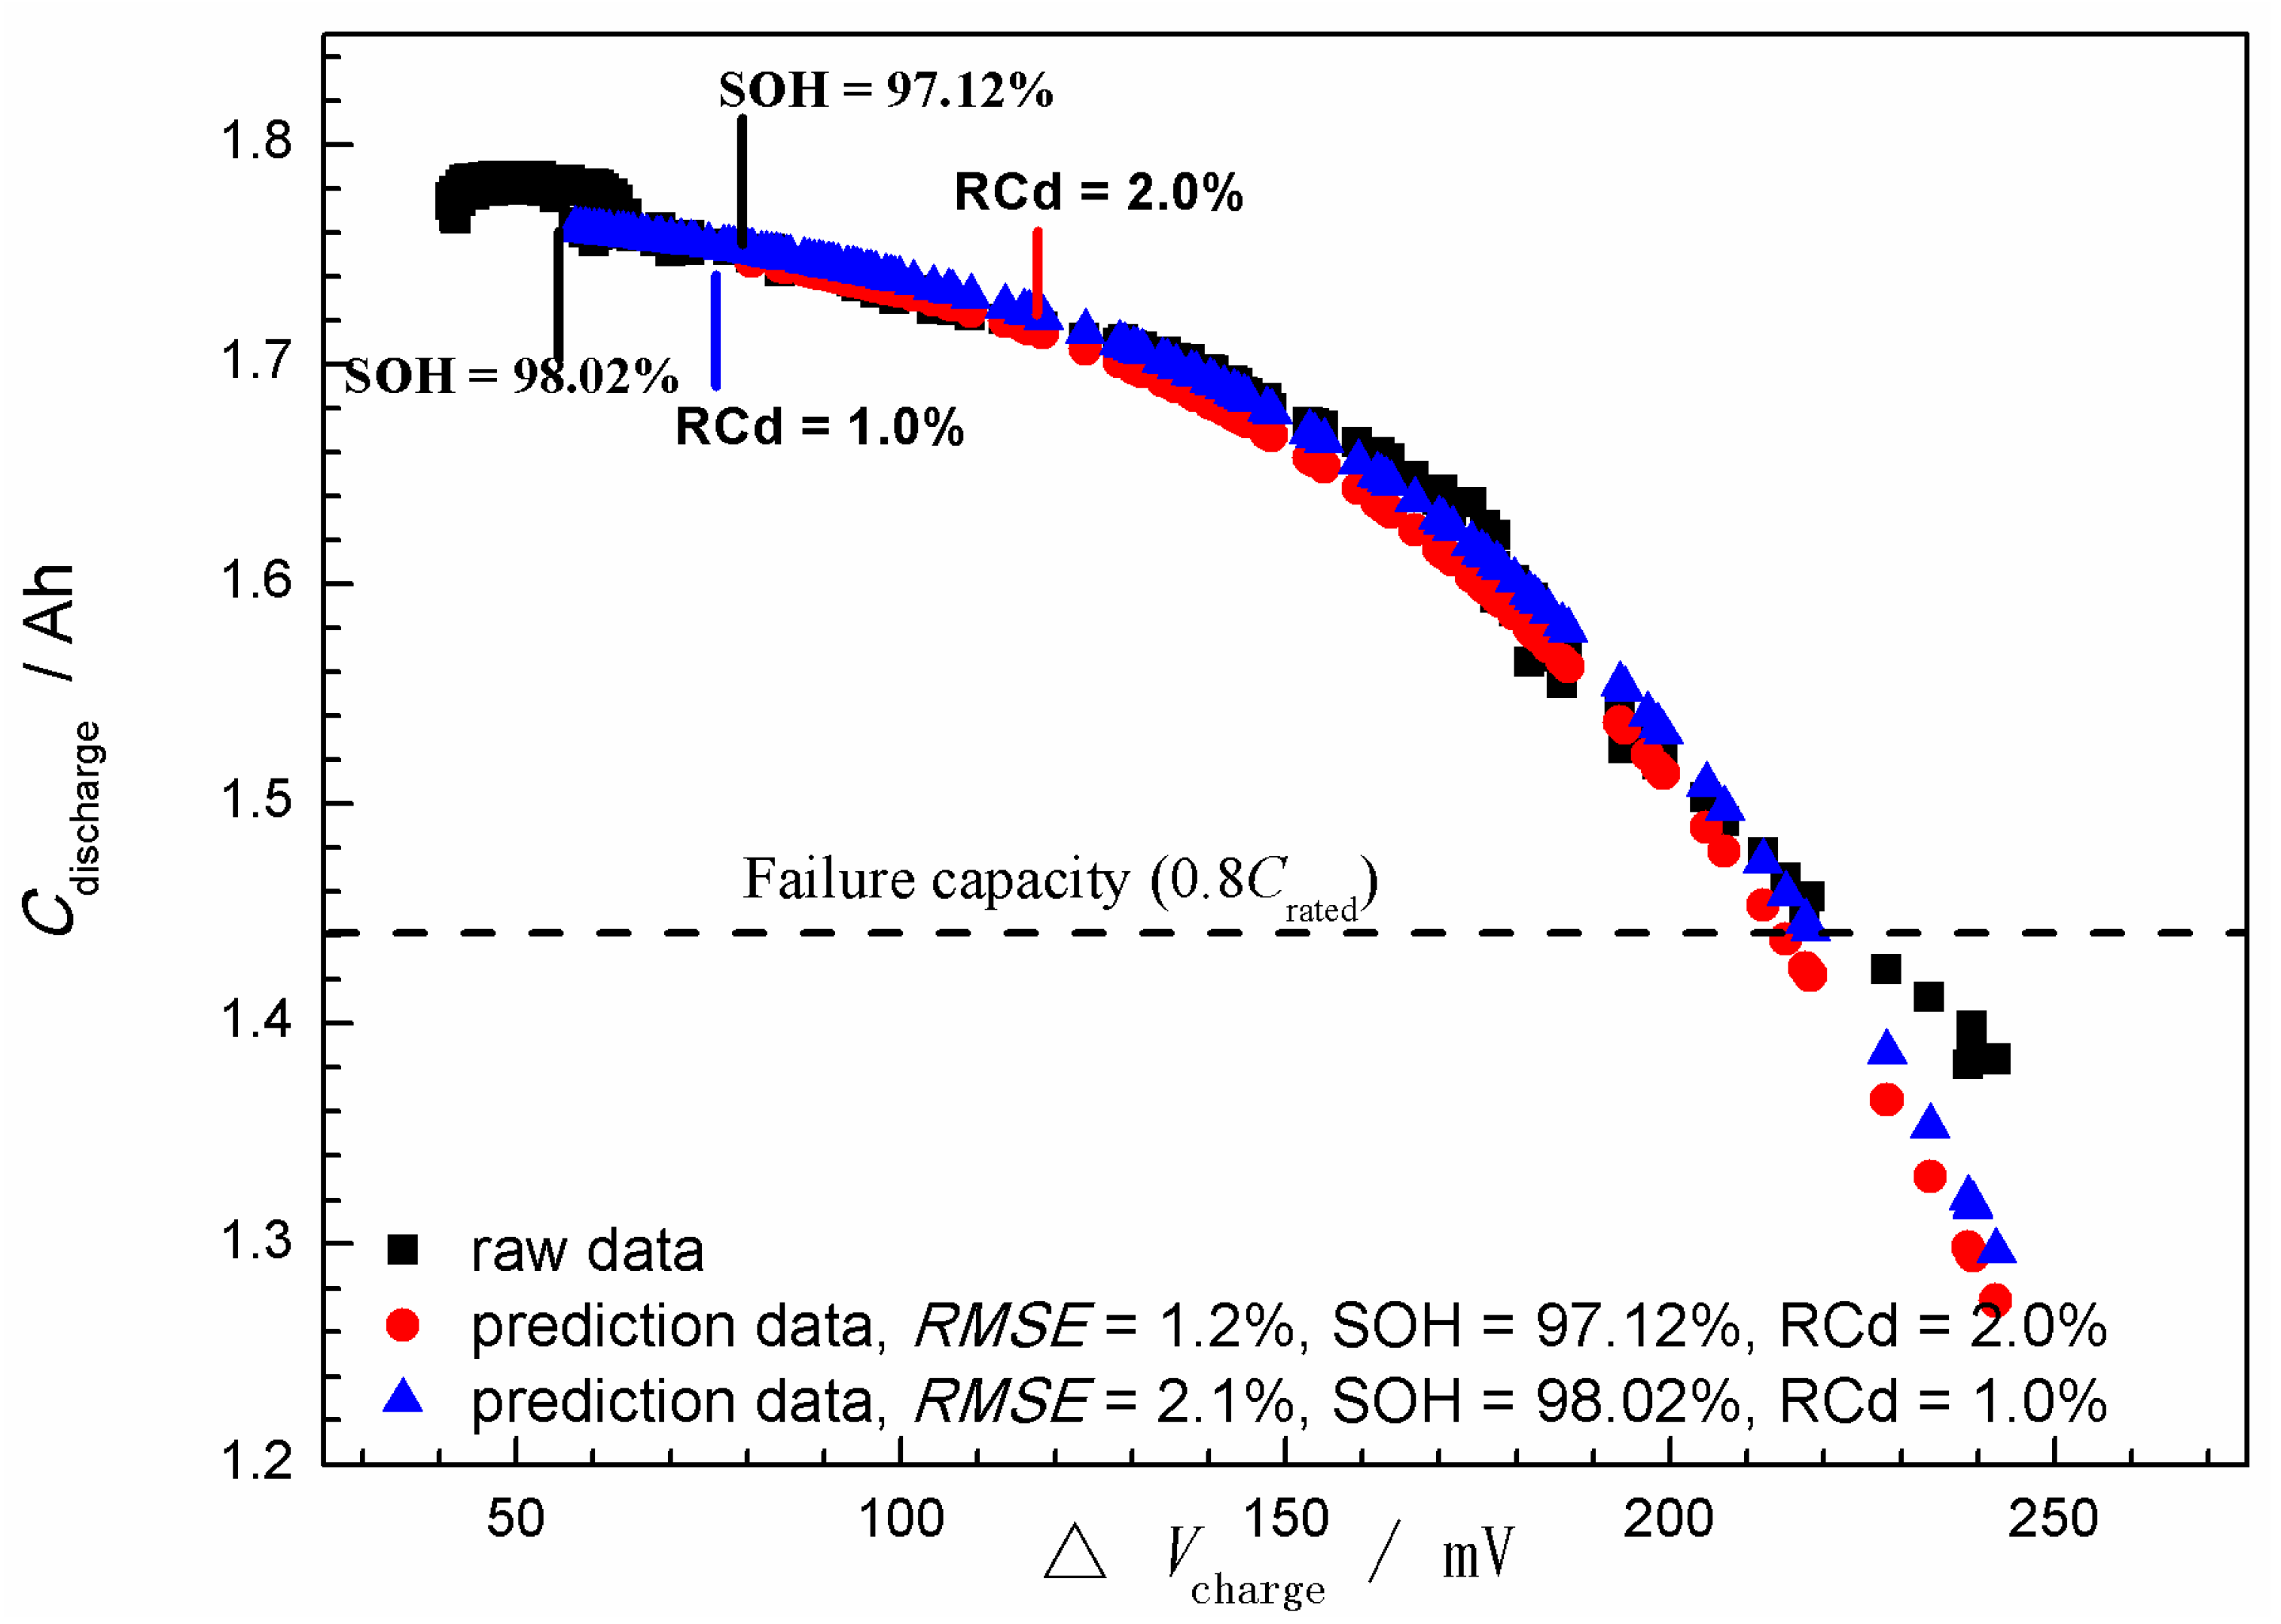
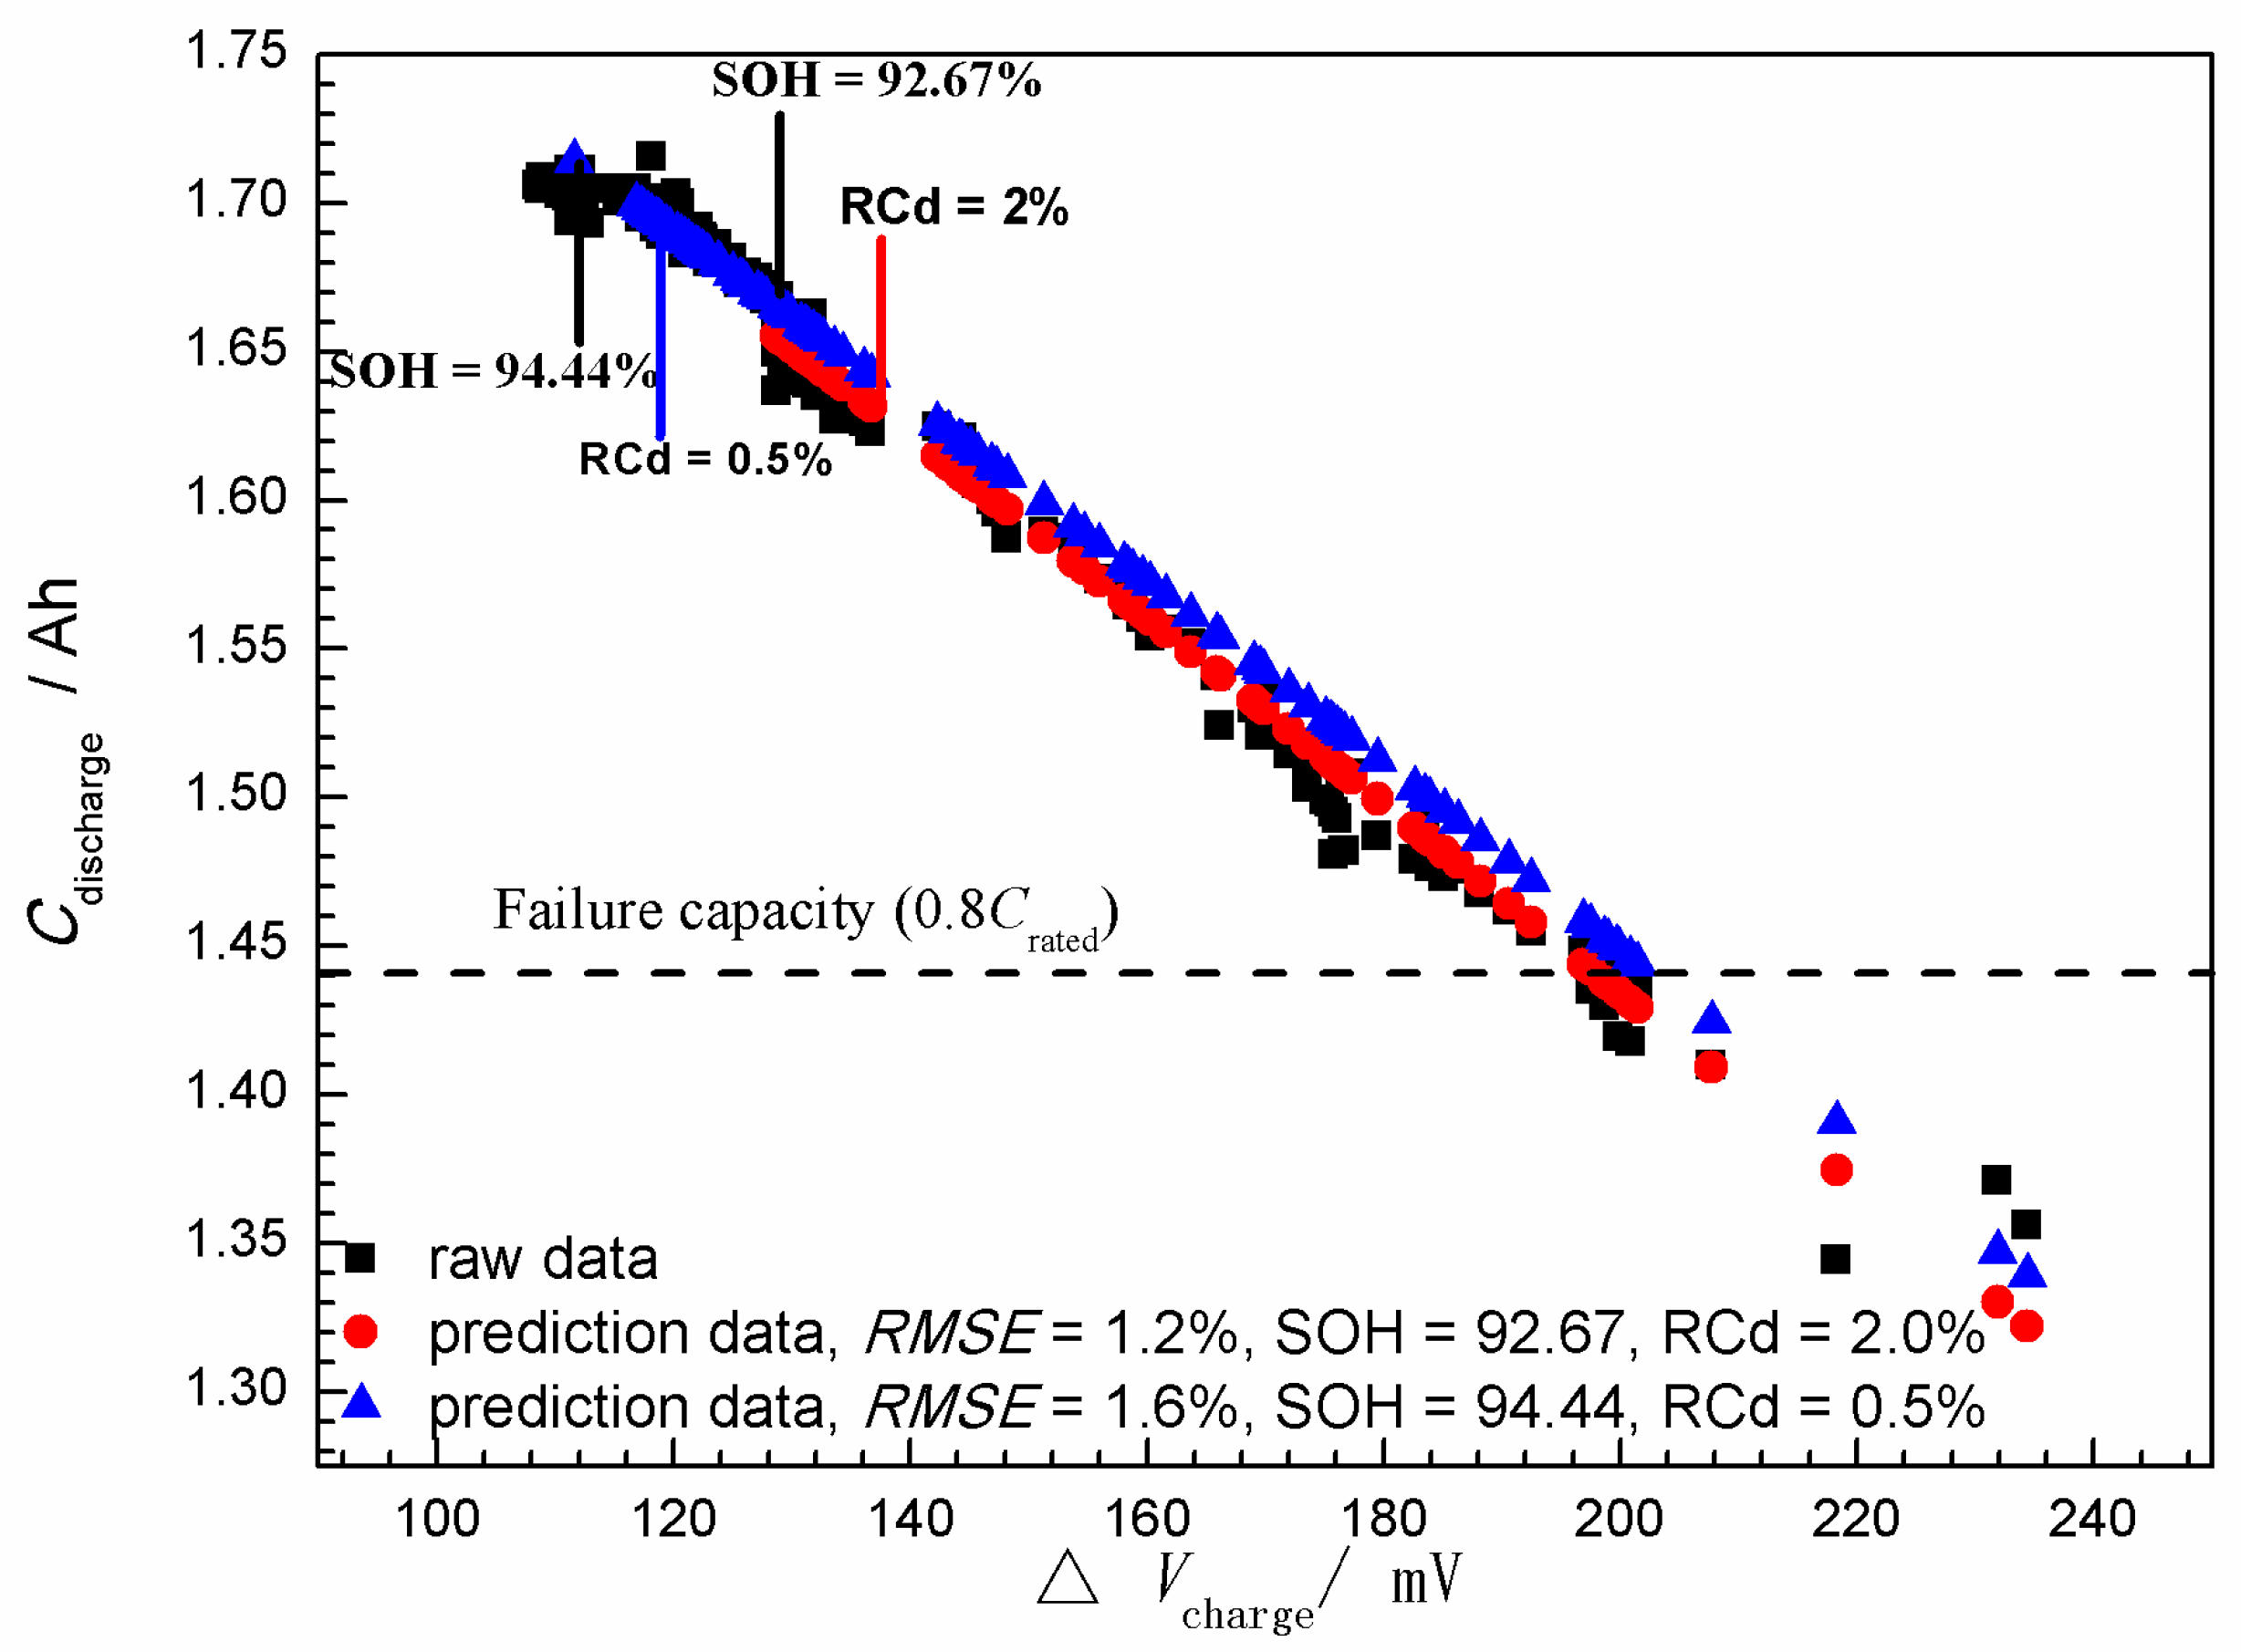
Based on the analysis of charge-discharge data for the Ni-MH batteries, a nonlinear relationship between the Cdischarge (Ah) and ΔVcharge (mV) was found and described as Cdischarge = a/[1+ exp[−k × (ΔVchargec)]], where a (Ah), k (mV−1) and c (mV) are constants related to charge-discharge rates. Based on this equation, the curve model for the SOH prediction of Ni-MH batteries was constructed.
(2)
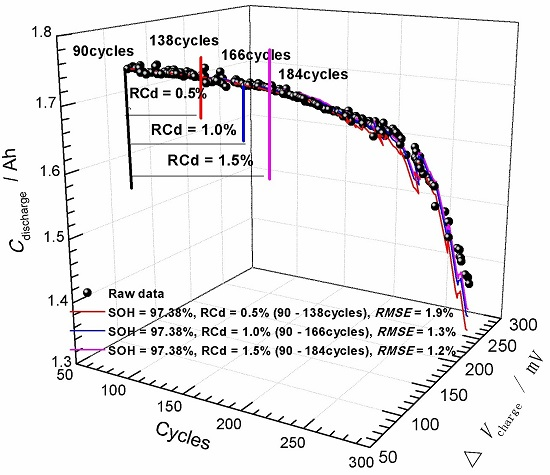
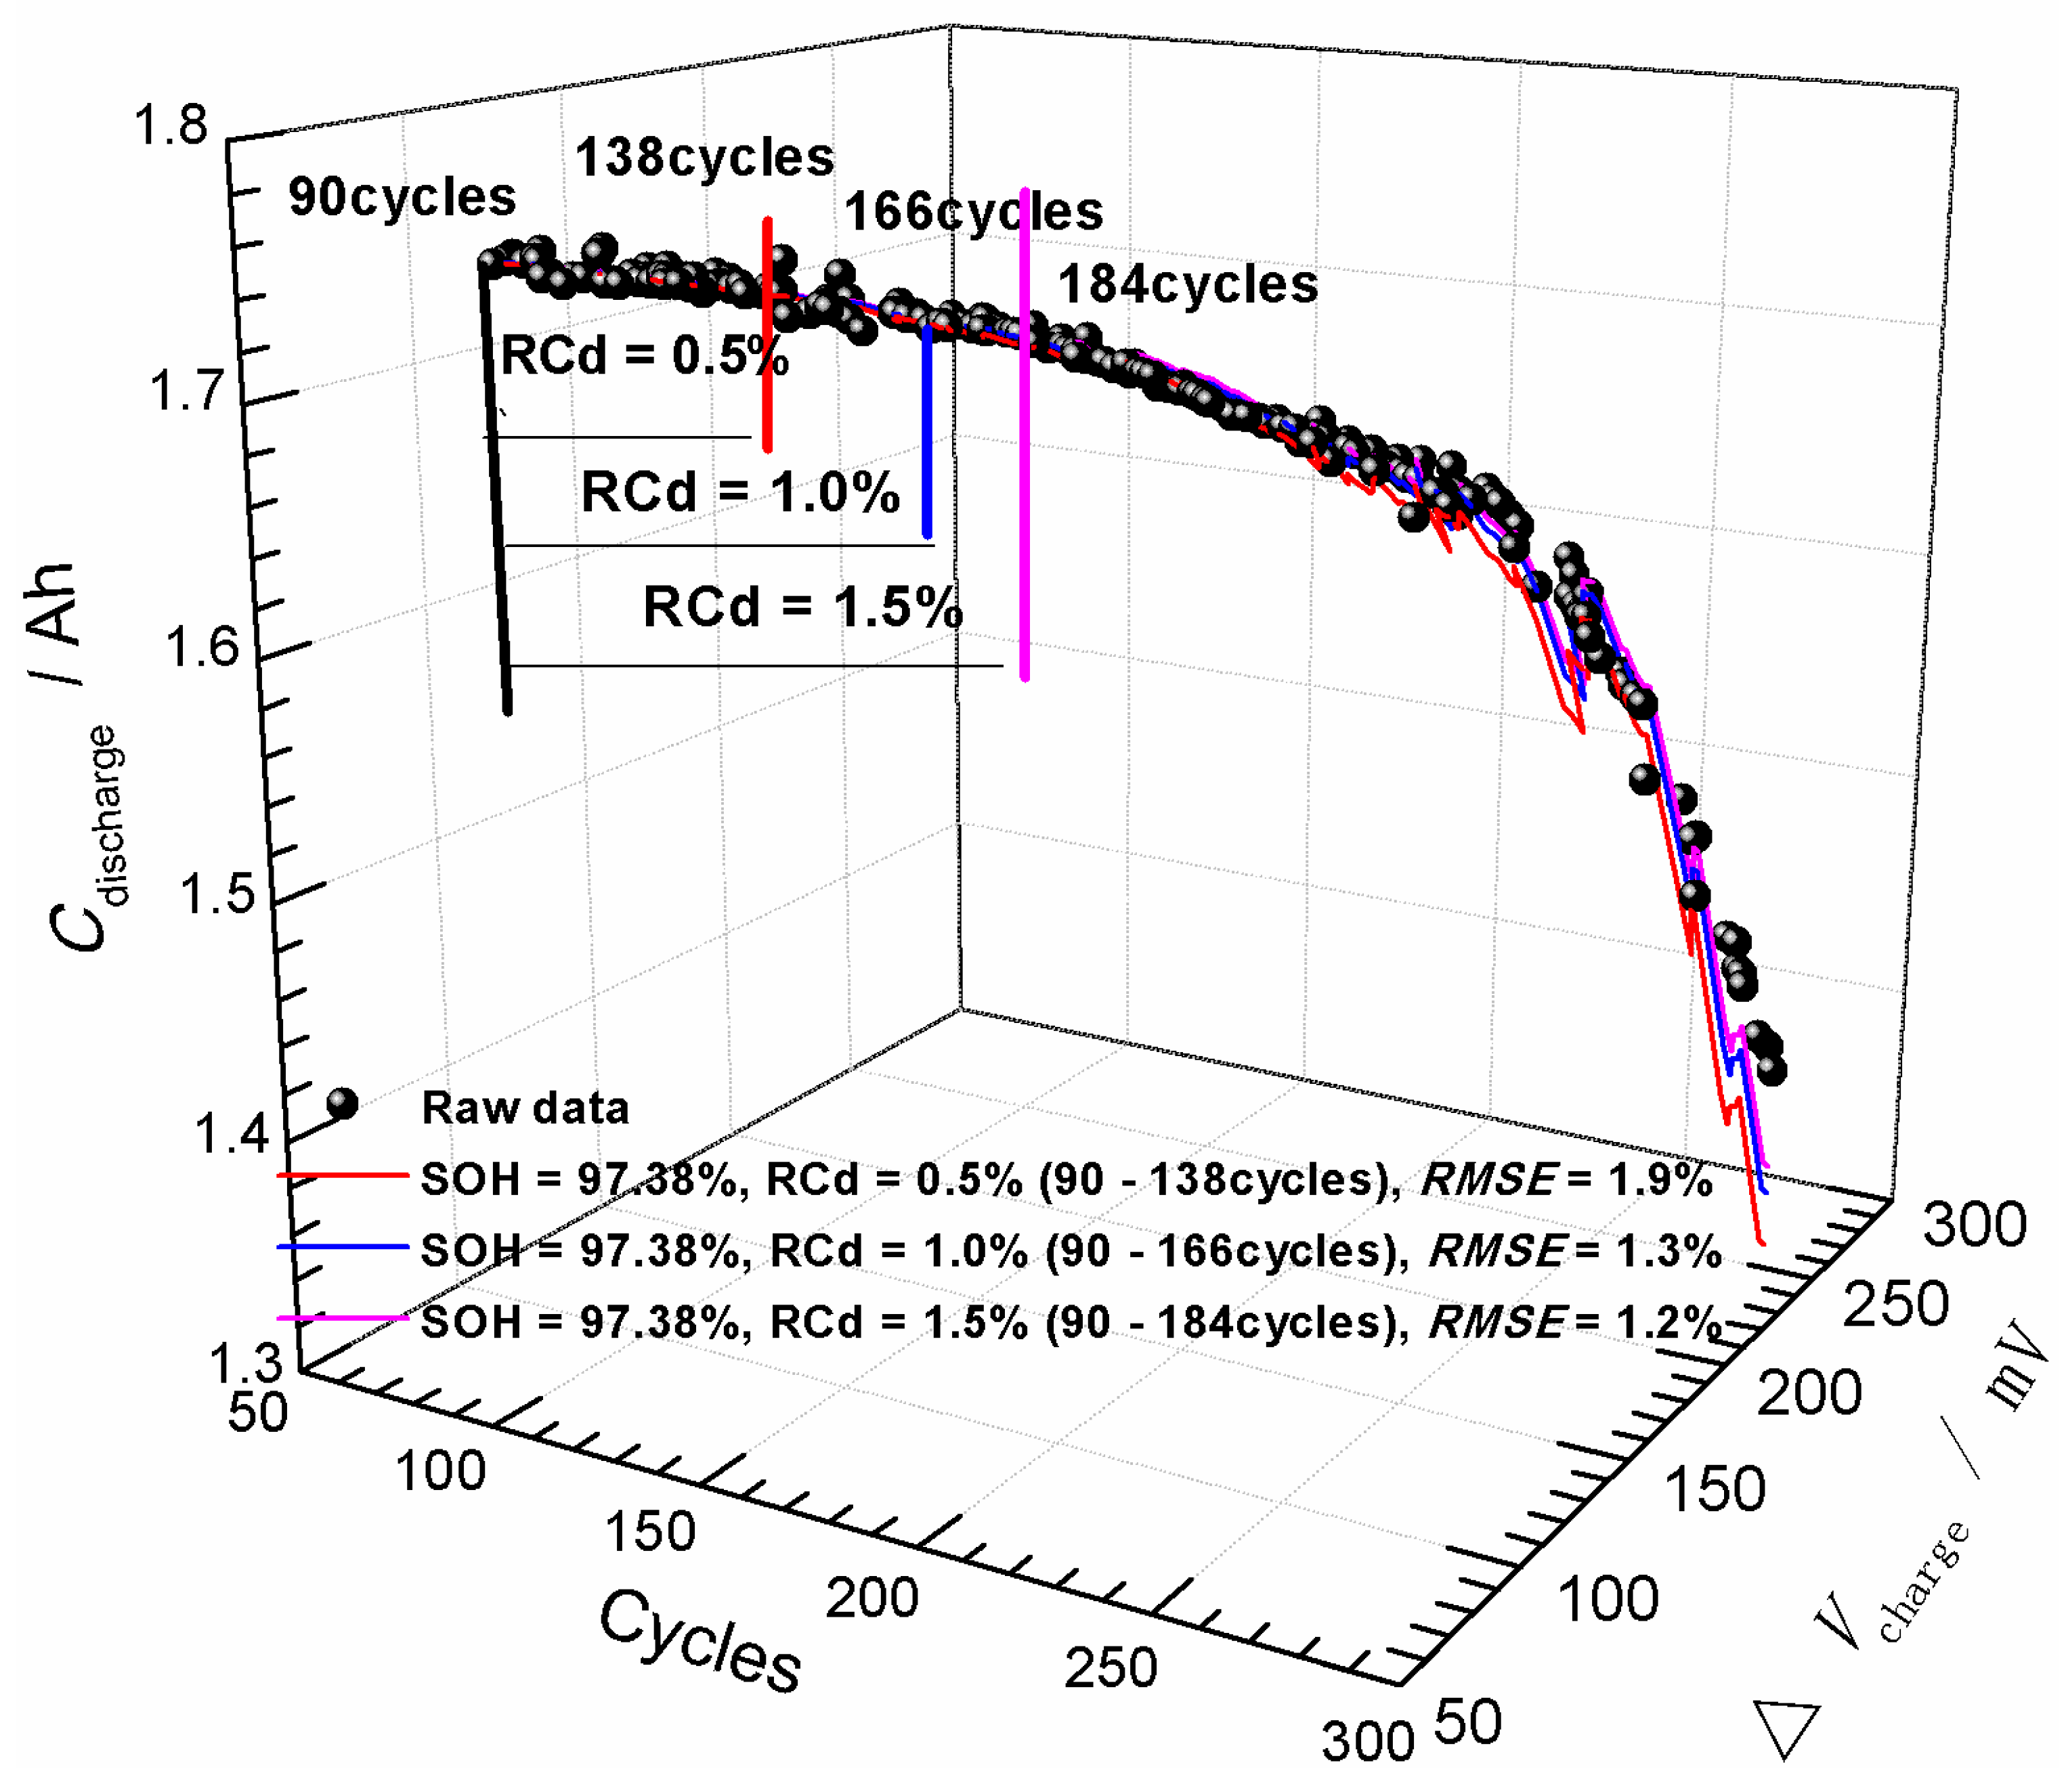
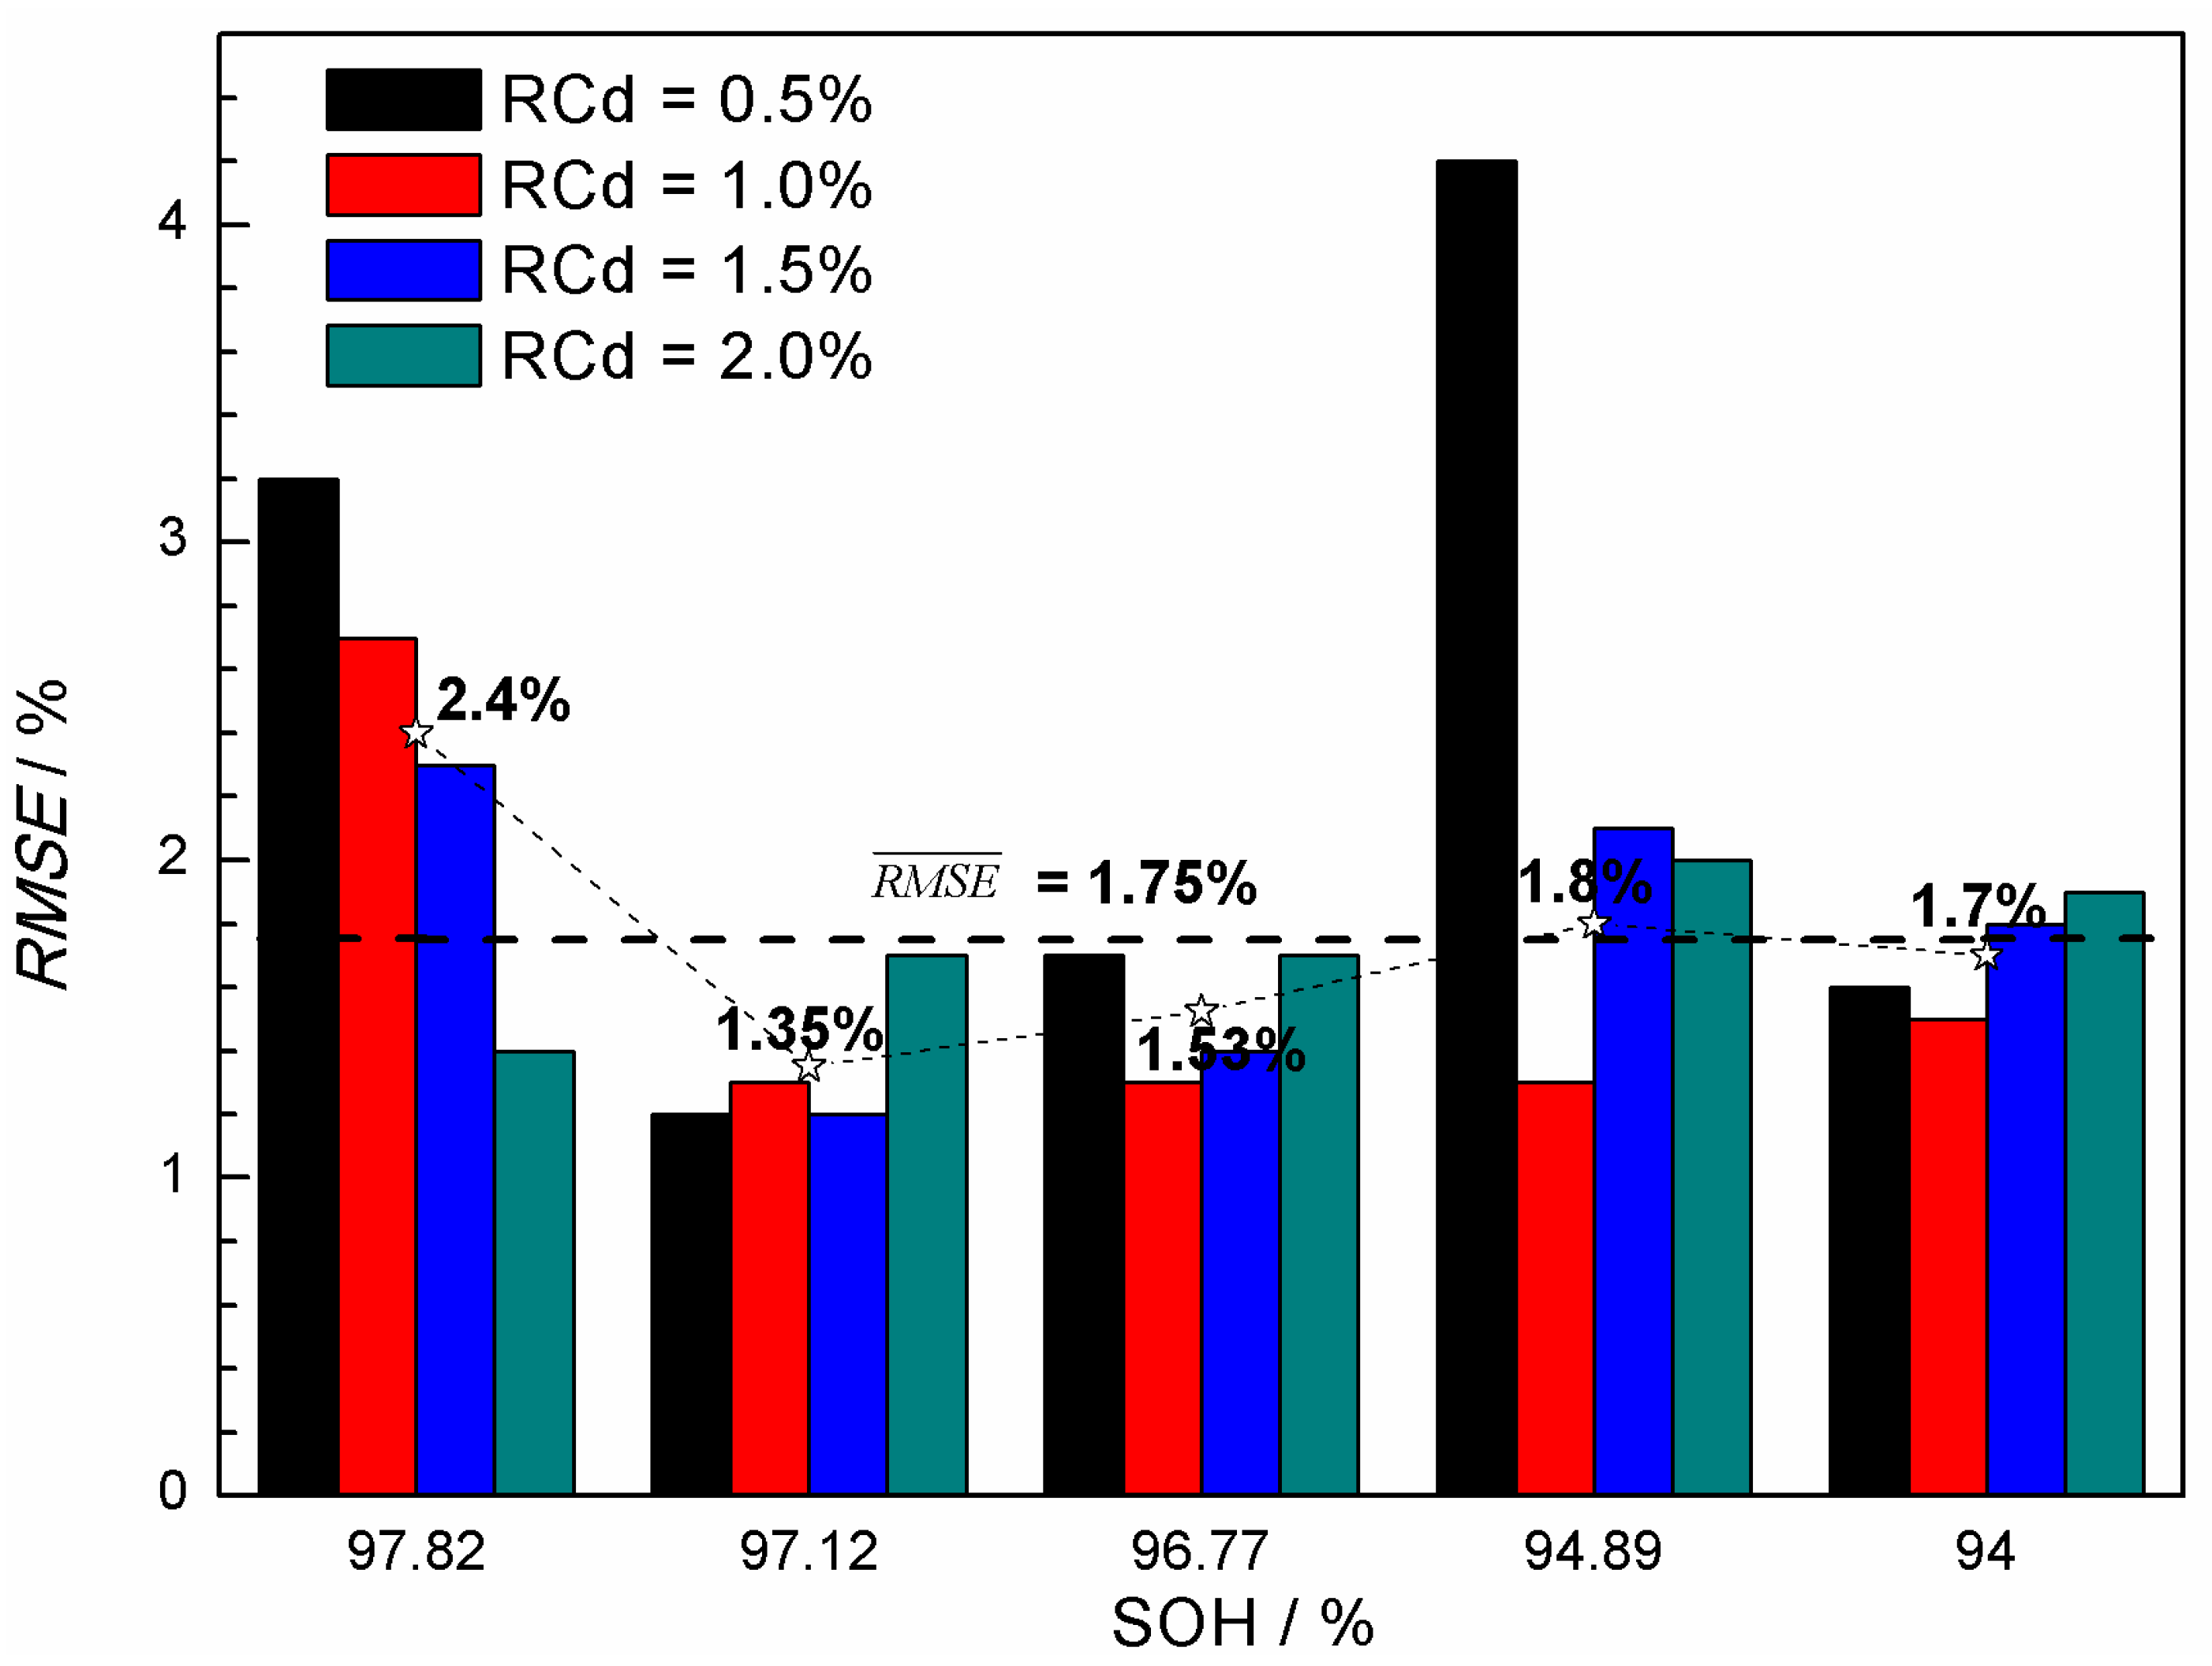
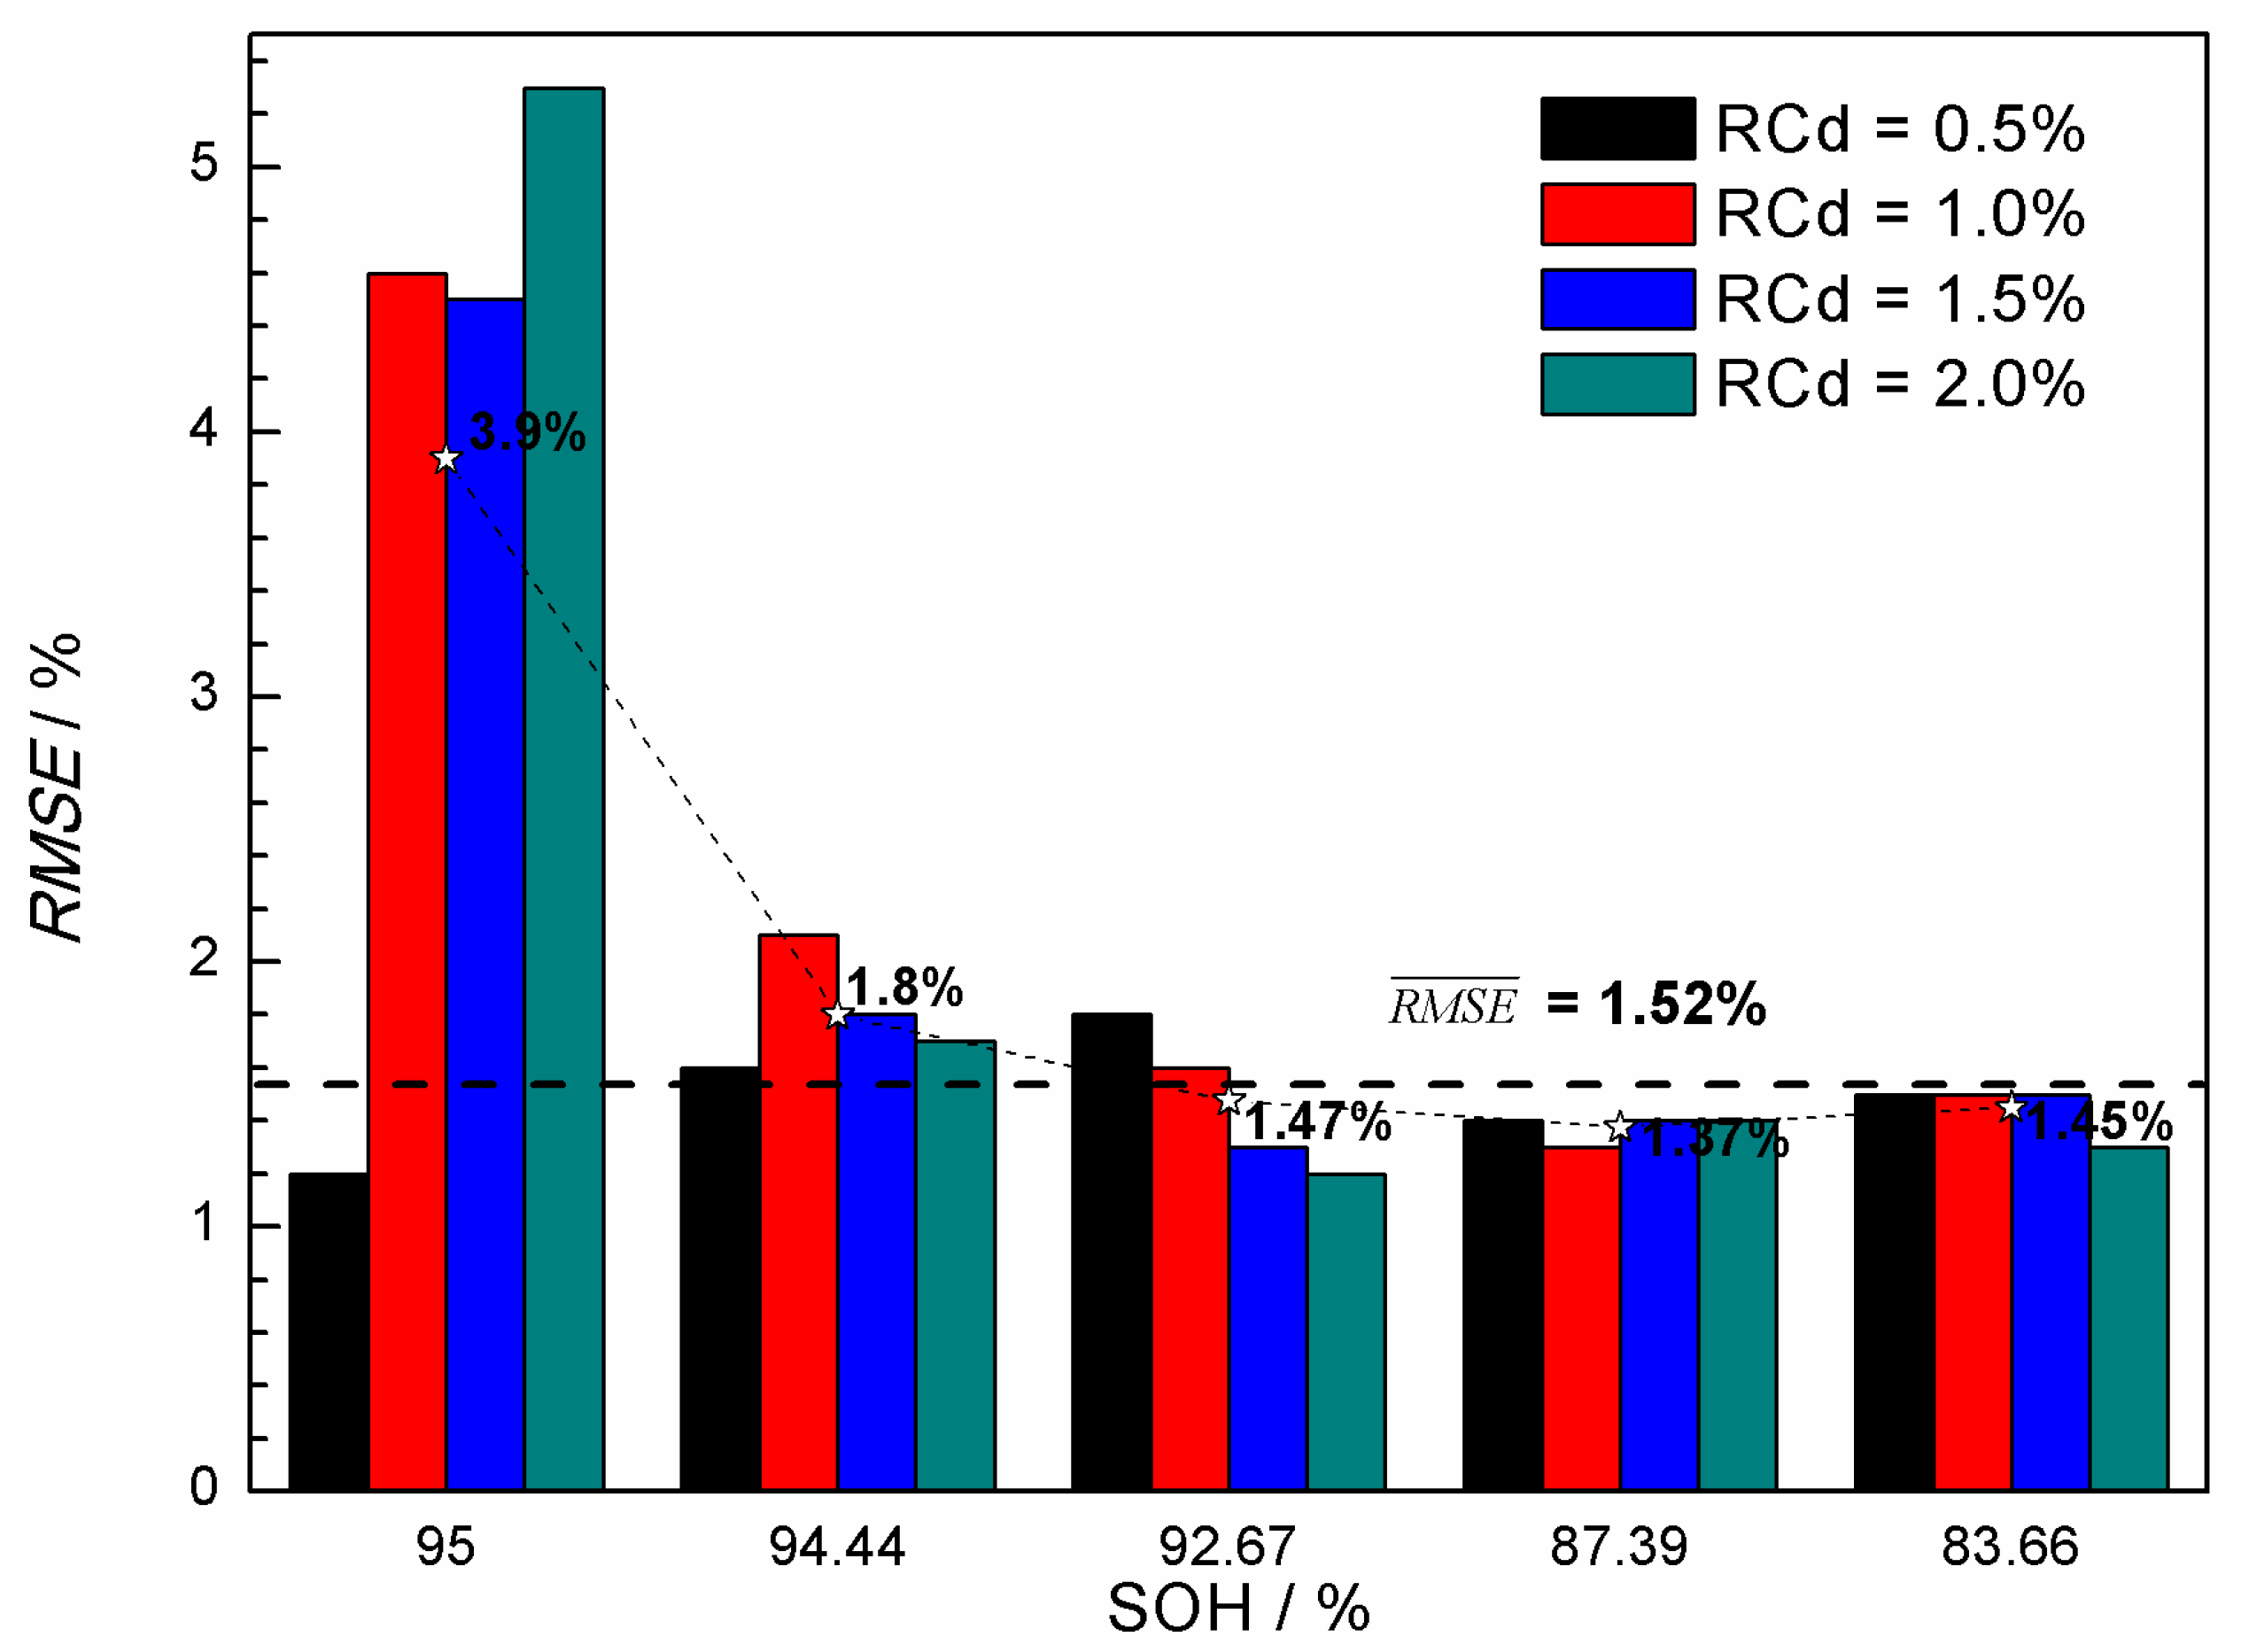
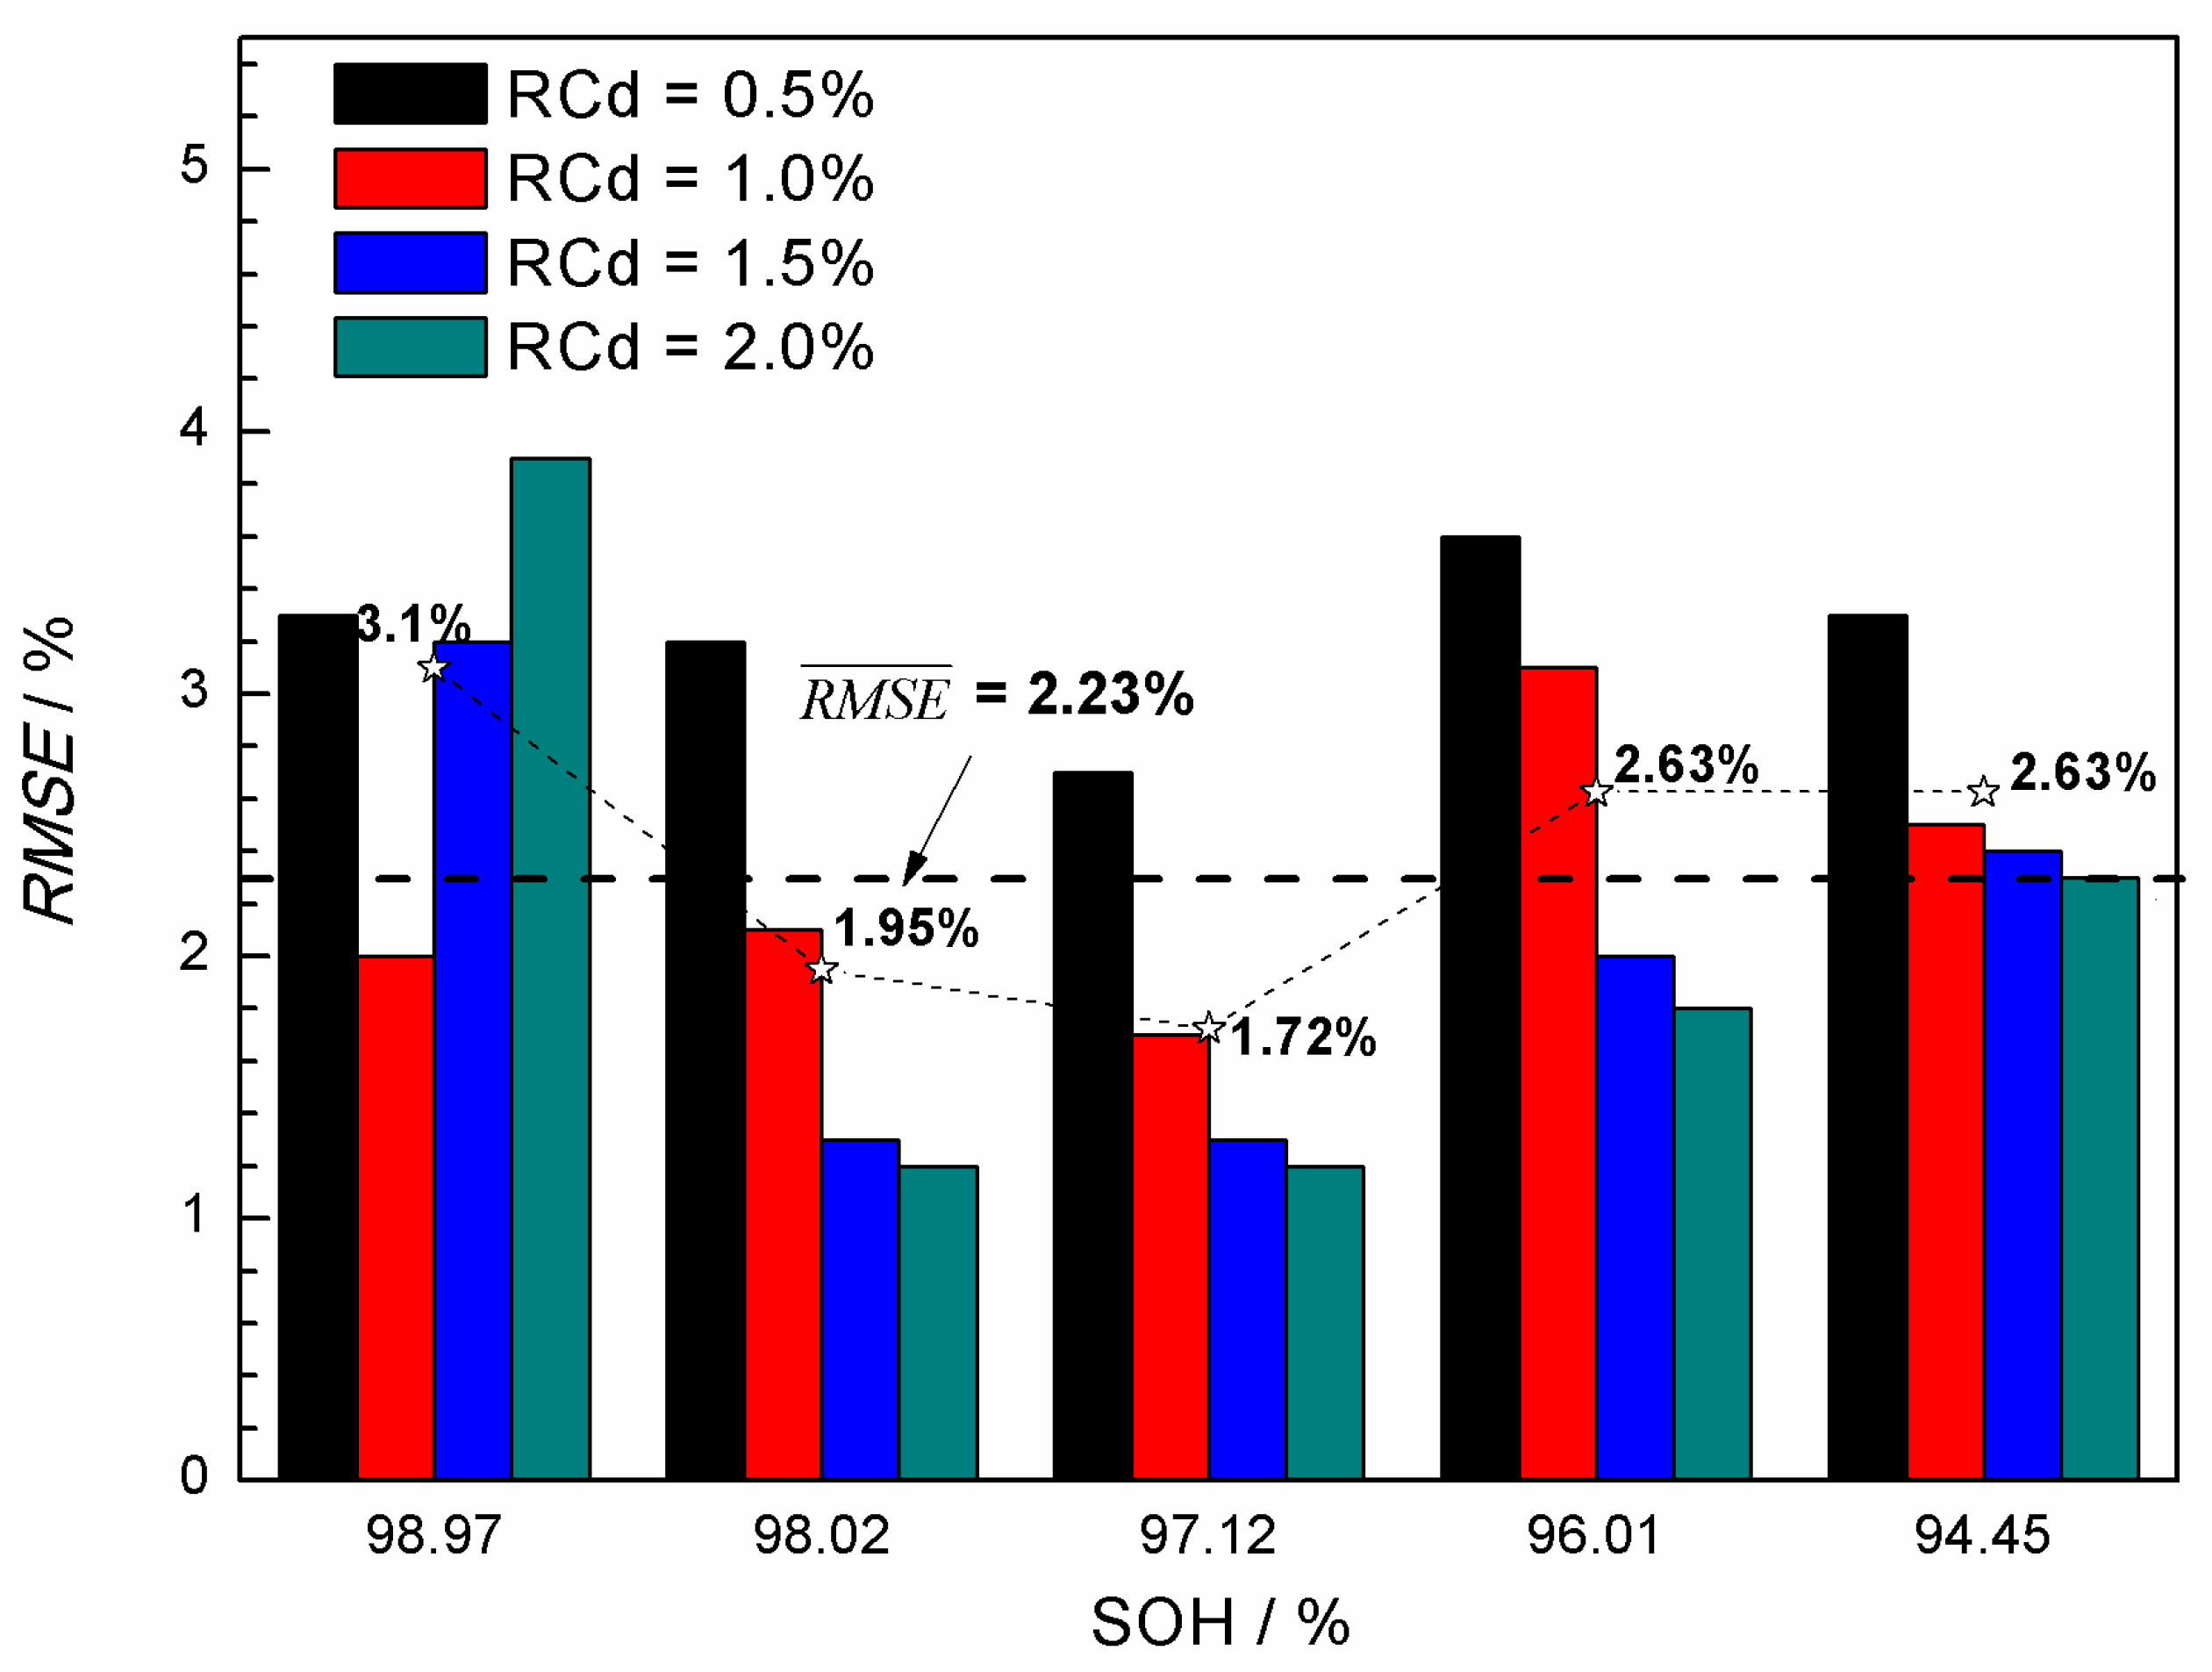
The (Cdischarge, ΔVcharge) data groups obtained from the charge-discharge cycle test at different rates (0.5C, 1.0C, and 1.6C) were employed to verify the validity of the curve model for the SOH prediction. It was found that the curve model based on the nonlinear relationship between the Cdischarge and ΔVcharge can be effectively applied to predict the SOH of the Ni-MH batteries. The data groups used for the SOH prediction have significantly influence on the prediction accuracy, and the best prediction RMSE can reach 1.2%.
(3)
Generally, using (Cdischarge, ΔVcharge) data groups with the SOH in an intermediate range and with the RCd value in the range of 1.5%–2.0% may result in lower prediction RMSE.

Acknowledgments

The authors thank the Special Funds for Basic Research of National Universities (No. 2015TS147) for the financial support of this work.

Conflicts of Interest

The authors declare no conflict of interest.

References

  1. Leblanc, P.; Blanchard, P.; Senyarich, S. Self-Discharge of Sealed Nickel-Metal Hydride Batteries Mechanisms and Improvements. J. Electrochem. Soc. 1998, 145, 844–847. [Google Scholar] [CrossRef]
  2. Yao, M.; Okuno, K.; Iwaki, T.; Tanase, S.; Harada, K.; Kato, M.; Emura, K.; Sakai, T. High-power nickel/metal-hydride battery using new micronetwork substrate: Discharge rate capability and cycle-life performance. J. Power Sources 2007, 171, 1033–1039. [Google Scholar] [CrossRef]
  3. Fetcenko, M.; Ovshinsky, S.; Reichman, B.; Young, K.; Fierro, C.; Koch, J.; Zallen, A.; Mays, W.; Ouchi, T. Recent advances in Ni-MH battery technology. J. Power Sources 2007, 165, 544–551. [Google Scholar] [CrossRef]
  4. Castro, E.; Cuscueta, D.; Milocco, R.; Ghilarducci, A.; Salva, H. An EIS based study of a Ni–MH battery prototype. Modeling and identification analysis. Int. J. Hydrog. Energy 2010, 35, 5991–5998. [Google Scholar] [CrossRef]
  5. Serrao, L.; Chehab, Z.; Guezennee, Y.; Rizzoni, G. An aging model of Ni-MH batteries for hybrid electric vehicles. In Proceedings of the 2005 IEEE Conference Vehicle Power and Propulsion, Chicago, IL, USA, 7–9 September 2005; pp. 78–85.
  6. Chehab, Z.; Serrao, L.; Guezennec, Y.G.; Rizzoni, G. Aging Characterization of Nickel: Metal Hydride Batteries Using Electrochemical Impedance Spectroscopy. In Proceedings of the International Mechanical Engineering Congress and Exposition, Chicago, IL, USA, 5–10 November 2006; pp. 343–349.
  7. Salkind, A.J.; Fennie, C.; Singh, P.; Atwater, T.; Reisner, D.E. Determination of state-of-charge and state-of-health of batteries by fuzzy logic methodology. J. Power Sources 1999, 80, 293–300. [Google Scholar] [CrossRef]
  8. Chiang, Y.H.; Sean, W.Y.; Ke, J.C. Online estimation of internal resistance and open-circuit voltage of lithium-ion batteries in electric vehicles. J. Power Sources 2011, 196, 3921–3932. [Google Scholar] [CrossRef]
  9. Ng, K.S.; Moo, C.S.; Chen, Y.P.; Hsieh, Y.C. Enhanced coulomb counting method for estimating state-of-charge and state-of-health of lithium-ion batteries. Appl. Energy 2009, 86, 1506–1511. [Google Scholar] [CrossRef]
  10. Waag, W.; Fleischer, C.; Sauer, D.U. Critical review of the methods for monitoring of lithium-ion batteries in electric and hybrid vehicles. J. Power Sources 2014, 258, 321–339. [Google Scholar] [CrossRef]
  11. Huet, F. A review of impedance measurements for determination of the state-of-charge or state-of-health of secondary batteries. J. Power Sources 1998, 70, 59–69. [Google Scholar] [CrossRef]
  12. Blanke, H.; Bohlen, O.; Buller, S.; de Doncker, R.W.; Fricke, B.; Hammouche, A.; Linzen, D.; Thele, M.; Sauer, D.U. Impedance measurements on lead-acid batteries for state-of-charge, state-of-health and cranking capability prognosis in electric and hybrid electric vehicles. J. Power Sources 2005, 144, 418–425. [Google Scholar] [CrossRef]
  13. Liu, G.; Ouyang, M.; Lu, L.; Li, J.; Han, X. Online estimation of lithium-ion battery remaining discharge capacity through differential voltage analysis. J. Power Sources 2015, 274, 971–989. [Google Scholar] [CrossRef]
  14. Sauer, D.U.; Wenzl, H. Comparison of different approaches for lifetime prediction of electrochemical systems—Using lead-acid batteries as example. J. Power Sources 2008, 176, 534–546. [Google Scholar] [CrossRef]
  15. Zhu, J.; Sun, Z.; Wei, X.; Dai, H. A new lithium-ion battery internal temperature on-line estimate method based on electrochemical impedance spectroscopy measurement. J. Power Sources 2015, 274, 990–1004. [Google Scholar] [CrossRef]
  16. Wenzl, H.; Baring-Gould, I.; Kaiser, R.; Liaw, B.Y.; Lundsager, P.; Manwell, J.; Ruddell, A.; Svoboda, V. Life prediction of batteries for selecting the technically most suitable and cost effective battery. J. Power Sources 2005, 144, 373–384. [Google Scholar] [CrossRef]
  17. Ramadass, P.; Haran, B.; White, R.; Popov, B.N. Capacity fade of Sony 18650 cells cycled at elevated temperatures: Part II. Capacity fade analysis. J. Power Sources 2002, 112, 614–620. [Google Scholar] [CrossRef]
  18. Bundy, K.; Karlsson, M.; Lindbergh, G.; Lundqvist, A. An electrochemical impedance spectroscopy method for prediction of the state of charge of a nickel-metal hydride battery at open circuit and during discharge. J. Power Sources 1998, 72, 118–125. [Google Scholar] [CrossRef]
  19. Meissner, E.; Richter, G. Battery monitoring and electrical energy management: Precondition for future vehicle electric power systems. J. Power Sources 2003, 116, 79–98. [Google Scholar] [CrossRef]
  20. Santhanagopalan, S.; Guo, Q.; Ramadass, P.; White, R.E. Review of models for predicting the cycling performance of lithium ion batteries. J. Power Sources 2006, 156, 620–628. [Google Scholar] [CrossRef]
  21. Gao, L.; Liu, S.; Dougal, R.A. Dynamic lithium-ion battery model for system simulation. IEEE Trans. Compon. Packag. Technol. 2002, 25, 495–505. [Google Scholar] [CrossRef]
  22. Rao, R.; Vrudhula, S.; Rakhmatov, D.N. Battery modeling for energy aware system design. Computer 2003, 36, 77–87. [Google Scholar] [CrossRef]
  23. González-Longatt, F.M. Circuit based battery models: A review. In Proceedings of the 2nd Congreso IberoAmericano De Estudiantes deIngeniería Eléctrica, Puerto la Cruz, Venezuela, 3–7 April 2006; pp. 1–5.
  24. Chen, M.; Rincon-Mora, G.A. Accurate electrical battery model capable of predicting runtime and IV performance. IEEE Trans. Energy Convers. 2006, 21, 504–511. [Google Scholar] [CrossRef]
  25. Zhu, W.H.; Zhu, Y.; Tatarchuk, B.J. A simplified equivalent circuit model for simulation of Pb-acid batteries at load for energy storage application. Energy Convers. Manag. 2011, 52, 2794–2799. [Google Scholar] [CrossRef]
  26. Pascoe, P.E.; Anbuky, A.H. A unified discharge voltage characteristic for VRLA battery capacity and reserve time estimation. Energy Convers. Manag. 2004, 45, 277–302. [Google Scholar] [CrossRef]
  27. Pascoe, P.E.; Anbuky, A.H. A VRLA battery simulation model. Energy Convers. Manag. 2004, 45, 1015–1041. [Google Scholar] [CrossRef]
  28. Chiang, Y.H.; Sean, W.Y. Dynamical estimation of state-of-health of batteries by using adaptive observer. In Proceedings of the 2nd International Conference on Power Electronics and Intelligent Transportation System, 19–20 December 2009; pp. 110–115.
  29. Hu, C.; Youn, B.D.; Chung, J. A multiscale framework with extended Kalman filter for lithium-ion battery SOC and capacity estimation. Appl. Energy 2012, 92, 694–704. [Google Scholar] [CrossRef]
  30. Sepasi, S.; Ghorbani, R.; Liaw, B.Y. A novel on-board state-of-charge estimation method for aged Li-ion batteries based on model adaptive extended Kalman filter. J. Power Sources 2014, 245, 337–344. [Google Scholar] [CrossRef]
  31. Saha, B.; Goebel, K.; Poll, S.; Christophersen, J. Prognostics methods for battery health monitoring using a Bayesian framework. IEEE Trans. Instrum. Meas. 2009, 58, 291–296. [Google Scholar] [CrossRef]
  32. Chang, W.Y. Estimation of the state of charge for a LFP battery using a hybrid method that combines a RBF neural network, an OLS algorithm and AGA. Int. J. Electr. Power Energy Syst. 2013, 53, 603–611. [Google Scholar] [CrossRef]
  33. Gorman, C.; Ingersoll, D.; Jungst, R.; Paez, T.L. Artificial neural network simulation of battery performance. In Proceedings of the Thirty-First Hawaii International Conference, Kohala Coast, HI, USA, 6–9 January 1998; pp. 115–121.
  34. Andre, D.; Nuhic, A.; Soczka-Guth, T.; Sauer, D. Comparative study of a structured neural network and an extended Kalman filter for state of health determination of lithium-ion batteries in hybrid electricvehicles. Eng. Appl. Artif. Intell. 2013, 26, 951–961. [Google Scholar] [CrossRef]
  35. Rufus, F.; Lee, S.; Thakker, A. Health monitoring algorithms for space application batteries. In Proceedings of the Prognostics and Health Management, Denver, CO, USA, 6–9 October 2008; pp. 1–8.
  36. Widodo, A.; Shim, M.C.; Caesarendra, W.; Yang, B.S. Intelligent prognostics for battery health monitoring based on sample entropy. Expert Syst. Appl. 2011, 38, 11763–11769. [Google Scholar] [CrossRef]
  37. Xing, Y.; Ma, E.W.; Tsui, K.L.; Pecht, M. Battery management systems in electric and hybrid vehicles. Energies 2011, 4, 1840–1857. [Google Scholar] [CrossRef]
  38. Singh, P.; Fennie, C.; Reisner, D. Fuzzy logic modelling of state-of-charge and available capacity of nickel/metal hydride batteries. J. Power Sources 2004, 136, 322–333. [Google Scholar] [CrossRef]
  39. Singh, P.; Kaneria, S.; Broadhead, J.; Wang, X.; Burdick, J. Fuzzy logic estimation of SOH of 125Ah VRLA batteries. In Proceedings of the International Telecommunications Energy Conference, Chicago, IL, USA, 19–23 September 2004; pp. 524–531.
  40. Micea, M.V.; Ungurean, L.; Carstoiu, G.N.; Groza, V. Online state-of-health assessment for battery management systems. IEEE Instrum. Meas. 2011, 60, 1997–2006. [Google Scholar] [CrossRef]
  41. Wang, F.; Fan, B.; Liu, S.; Qian, G.; Huang, X.; Han, S. Attenuation test and duplication of power battery’s cycle life. J. Automot. Saf. Energy 2012, 3, 71–76. [Google Scholar]
  42. Kang, L.; Zhao, X.; Ma, J. A new neural network model for the state-of-charge estimation in the battery degradation process. Appl. Energy 2014, 121, 20–27. [Google Scholar] [CrossRef]
  43. Xing, Y.; Ma, E.W.; Tsui, K.-L.; Pecht, M. An ensemble model for predicting the remaining useful performance of lithium-ion batteries. Microelectron. Reliab. 2013, 53, 811–820. [Google Scholar] [CrossRef]
  44. He, W.; Williard, N.; Osterman, M.; Pecht, M. Prognostics of lithium-ion batteries based on Dempster-Shafer theory and the Bayesian Monte Carlo method. J. Power Sources 2011, 196, 10314–10321. [Google Scholar] [CrossRef]
  45. Eom, S.W.; Kim, M.K.; Kim, I.J.; Moon, S.I.; Sun, Y.K.; Kim, H.S. Life prediction and reliability assessment of lithium secondary batteries. J. Power Sources 2007, 174, 954–958. [Google Scholar] [CrossRef]
  46. Remmlinger, J.; Buchholz, M.; Meiler, M.; Bernreuter, P.; Dietmayer, K. State-of-health monitoring of lithium-ion batteries in electric vehicles by on-board internal resistance estimation. J. Power Sources 2011, 196, 5357–5363. [Google Scholar] [CrossRef]

