1. Introduction
At national and global levels, the political strategies in energy are a priority, especially in the use of renewable energy sources for the generation of electricity, heat, or biofuels [
1]. Specifically, at the end of the 20th century, the photovoltaic systems were seen as an environmentally friendly option to generate electricity [
2], but the evolution during the first years of the 21th century was exponential: from 1.6 GW of global PV installed capacity in 2000 to 138.9 GW in 2013 [
3]. In Europe, PV covers 3% of the electricity demand and 6% of the peak electricity demand. The maximum installed capacity per year was reached in 2010 (22,250 MW/year), and decreased in 2012 (17,726 MW/year) and 2013 (10,975 MW/year), but according to the European Photovoltaic Industry Association forecasts, the annual installed capacity will increase in the following years, reaching in 2018 between 8290 MW/year (low scenario) and 17,185 MW/year (high scenario).
PV energy is one of the renewable energy resources widely used in the agriculture sector for various applications [
4,
5], such as water pumping systems for irrigation, or electricity generation for the agro-food sector [
6,
7], but it is not widely used for olive oil production.
Olive oil is a crucial industry in the agro-food sector in Europe since it provides approximately 73% of the world’s olive oil production [
8]. The industry is based in the Mediterranean Basin, specifically in Spain, Italy, Portugal, France, Cyprus, Slovenia, and Malta. According to data available from 2010, 50% of all olive fields are situated in Spain, 26% in Italy and 22% in Greece [
9]. Sixty six percent of European olive oil production is sold internationally. In 2011, 45% of production was sold in Europe, Spain being the main producer and Italy the main purchaser within the European Union. Between 2010 and 2011 exports to countries outside the euro zone reached 447,000 tonnes, of which Spain sold approximately 225,000 tonnes and Italy sold 160,000 t, while USA, Brazil, Japan, Australia, Russia and China were the countries that imported the most olive oil [
9]. As can be seen from these figures, this industry is generally very important for countries in Southern Europe and particularly for the main olive oil producer, Spain.
After several years of stagnant olive oil prices, the profitability of the sector depends on reducing production costs and energy consumption, which is one of the biggest expenses in this agro-food industry. Therefore, the optimization or minimization of energy consumption in olive mills has become a main concern of the people managing this industry.
In addition, there is a common interest related to the contracting of power for these types of facilities since most of the production is done only during a period of four or five months (normally from December to April). The facilities and electrical supply contracts have been designed to meet these consumption peaks and therefore the installations are “oversized” the rest of the year, entailing unnecessary costs.
Despite olive mills being simple facilities, leading us to think that there is little that can be done, this study will demonstrate that it is possible to reduce energy consumption from traditional sources (fuel, grid network, etc.) with the help of renewable sources, obtaining similar production levels at a lower cost.
As we will demonstrate, the use of renewable energy is the best solution to reduce energy costs and equivalent CO2 emissions, but not all renewable sources are adequate for this purpose. Based on the climatic conditions in Southern Europe, one type of system was analyzed, this being solar energy.
The research discussed in this article is based totally on the data obtained in a study carried out by the Andalusian Federation of Agricultural Cooperatives (FAECA) [
10]. In this study the real energy consumption and production of 87 oil mills was analyzed and then the mills were classified in three groups based on the amount of olive oil they produced, as seen in
Table 1.
Table 1.
Classification of olive mills based on total production. The average electrical consumption is indicated for each group [
10].
Table 1.
Classification of olive mills based on total production. The average electrical consumption is indicated for each group [10].
| Classification of Mills | Total Production (t) | Electrical Consumption (kW·h) |
|---|
| Small | <1000 | 92,000 |
| Medium | [1000, 5000] | 435,000 |
| Large | ˃5000 | 922,500 |
The main aim of this paper is to assess the feasibility of these systems, proving that the grid parity paradigm is possible and profitable, and to contribute to future studies in other countries, which is the tendency in European Union Policy. We will determine whether the required energy for small, medium and large size olive mills in Andalusia can be economically met by grid-connected PV systems. The study will also improve understanding of the usage of renewable energy in commercial activities such as the agro food industry. We will investigate the solar power potential of the region, and present a load model of the olive mills along with an analysis of solar radiation patterns of Andalusia, where climatic conditions are similar to those of the entire Mediterranean basin where there are other important olive oil producing regions.
2. Olive Mills Energy Consumption
The energy consumed by olive mills can be divided into two types: electrical and thermal, the first type being supplied by the electrical grid and consumed during the stages of cleaning the fruit (conveyors, bar screens, washing machines, engines, etc.) and grinding (grinders and centrifugal pumps). The second type is used to heat both the water for the centrifuges and the water that maintains the temperature of the dough mixer at around 30 °C and the room temperature of the cellar between 15 °C and 20 °C. Normally, the water is heated by a boiler that has traditionally used fossil fuels, such as diesel, while some of them currently use biomass as a source of energy.
In addition to the phases that directly affect the olive oil production process, there are other facilities that require electricity for operation such as offices, lighting and air conditioning.
The average power consumption of different mills according to their production output is shown in
Table 1.
Obviously, as seen in
Table 1, the energy consumption depends on the olive oil production, so by knowing the average annual production output and the electrical consumption of the oil mills studied [
10], we can show, in
Table 2, the electrical consumption per tonne of olive oil for each of the three previously defined groups of oil mills.
Table 2.
Classification of olive mills according to the electrical consumption
vs. total production ratio [
10] (years 2007–2009).
Table 2.
Classification of olive mills according to the electrical consumption vs. total production ratio [10] (years 2007–2009).
| Classification of Mills | Electrical Consumption/Total Production (kW·h/t) | Electrical Cost/Total Production (€/t) |
|---|
| Small | 177.11 | 26.75 |
| Medium | 194.55 | 21.26 |
| Large | 131.55 | 15.48 |
As expected, the oil mills classified as large are the most efficient since they have lower specific consumption values. Presumably, these types of oil mills, being mainly the result of expansions or being recently constructed, have more modern and efficient technology.
In contrast, the fact that the cost-production ratio is higher in the small size oil mills could be due to fixed operation costs similar to those of a medium size oil mill affecting a lower production output.
Using the data shown in the previous tables and available resources we can develop a model that will allow us to size the power system of olive mills with the contribution of renewable energy sources, with the aim of maximizing the sustainability of this agro-food industry sector.
The Influence of Temporariness on Energy Consumption
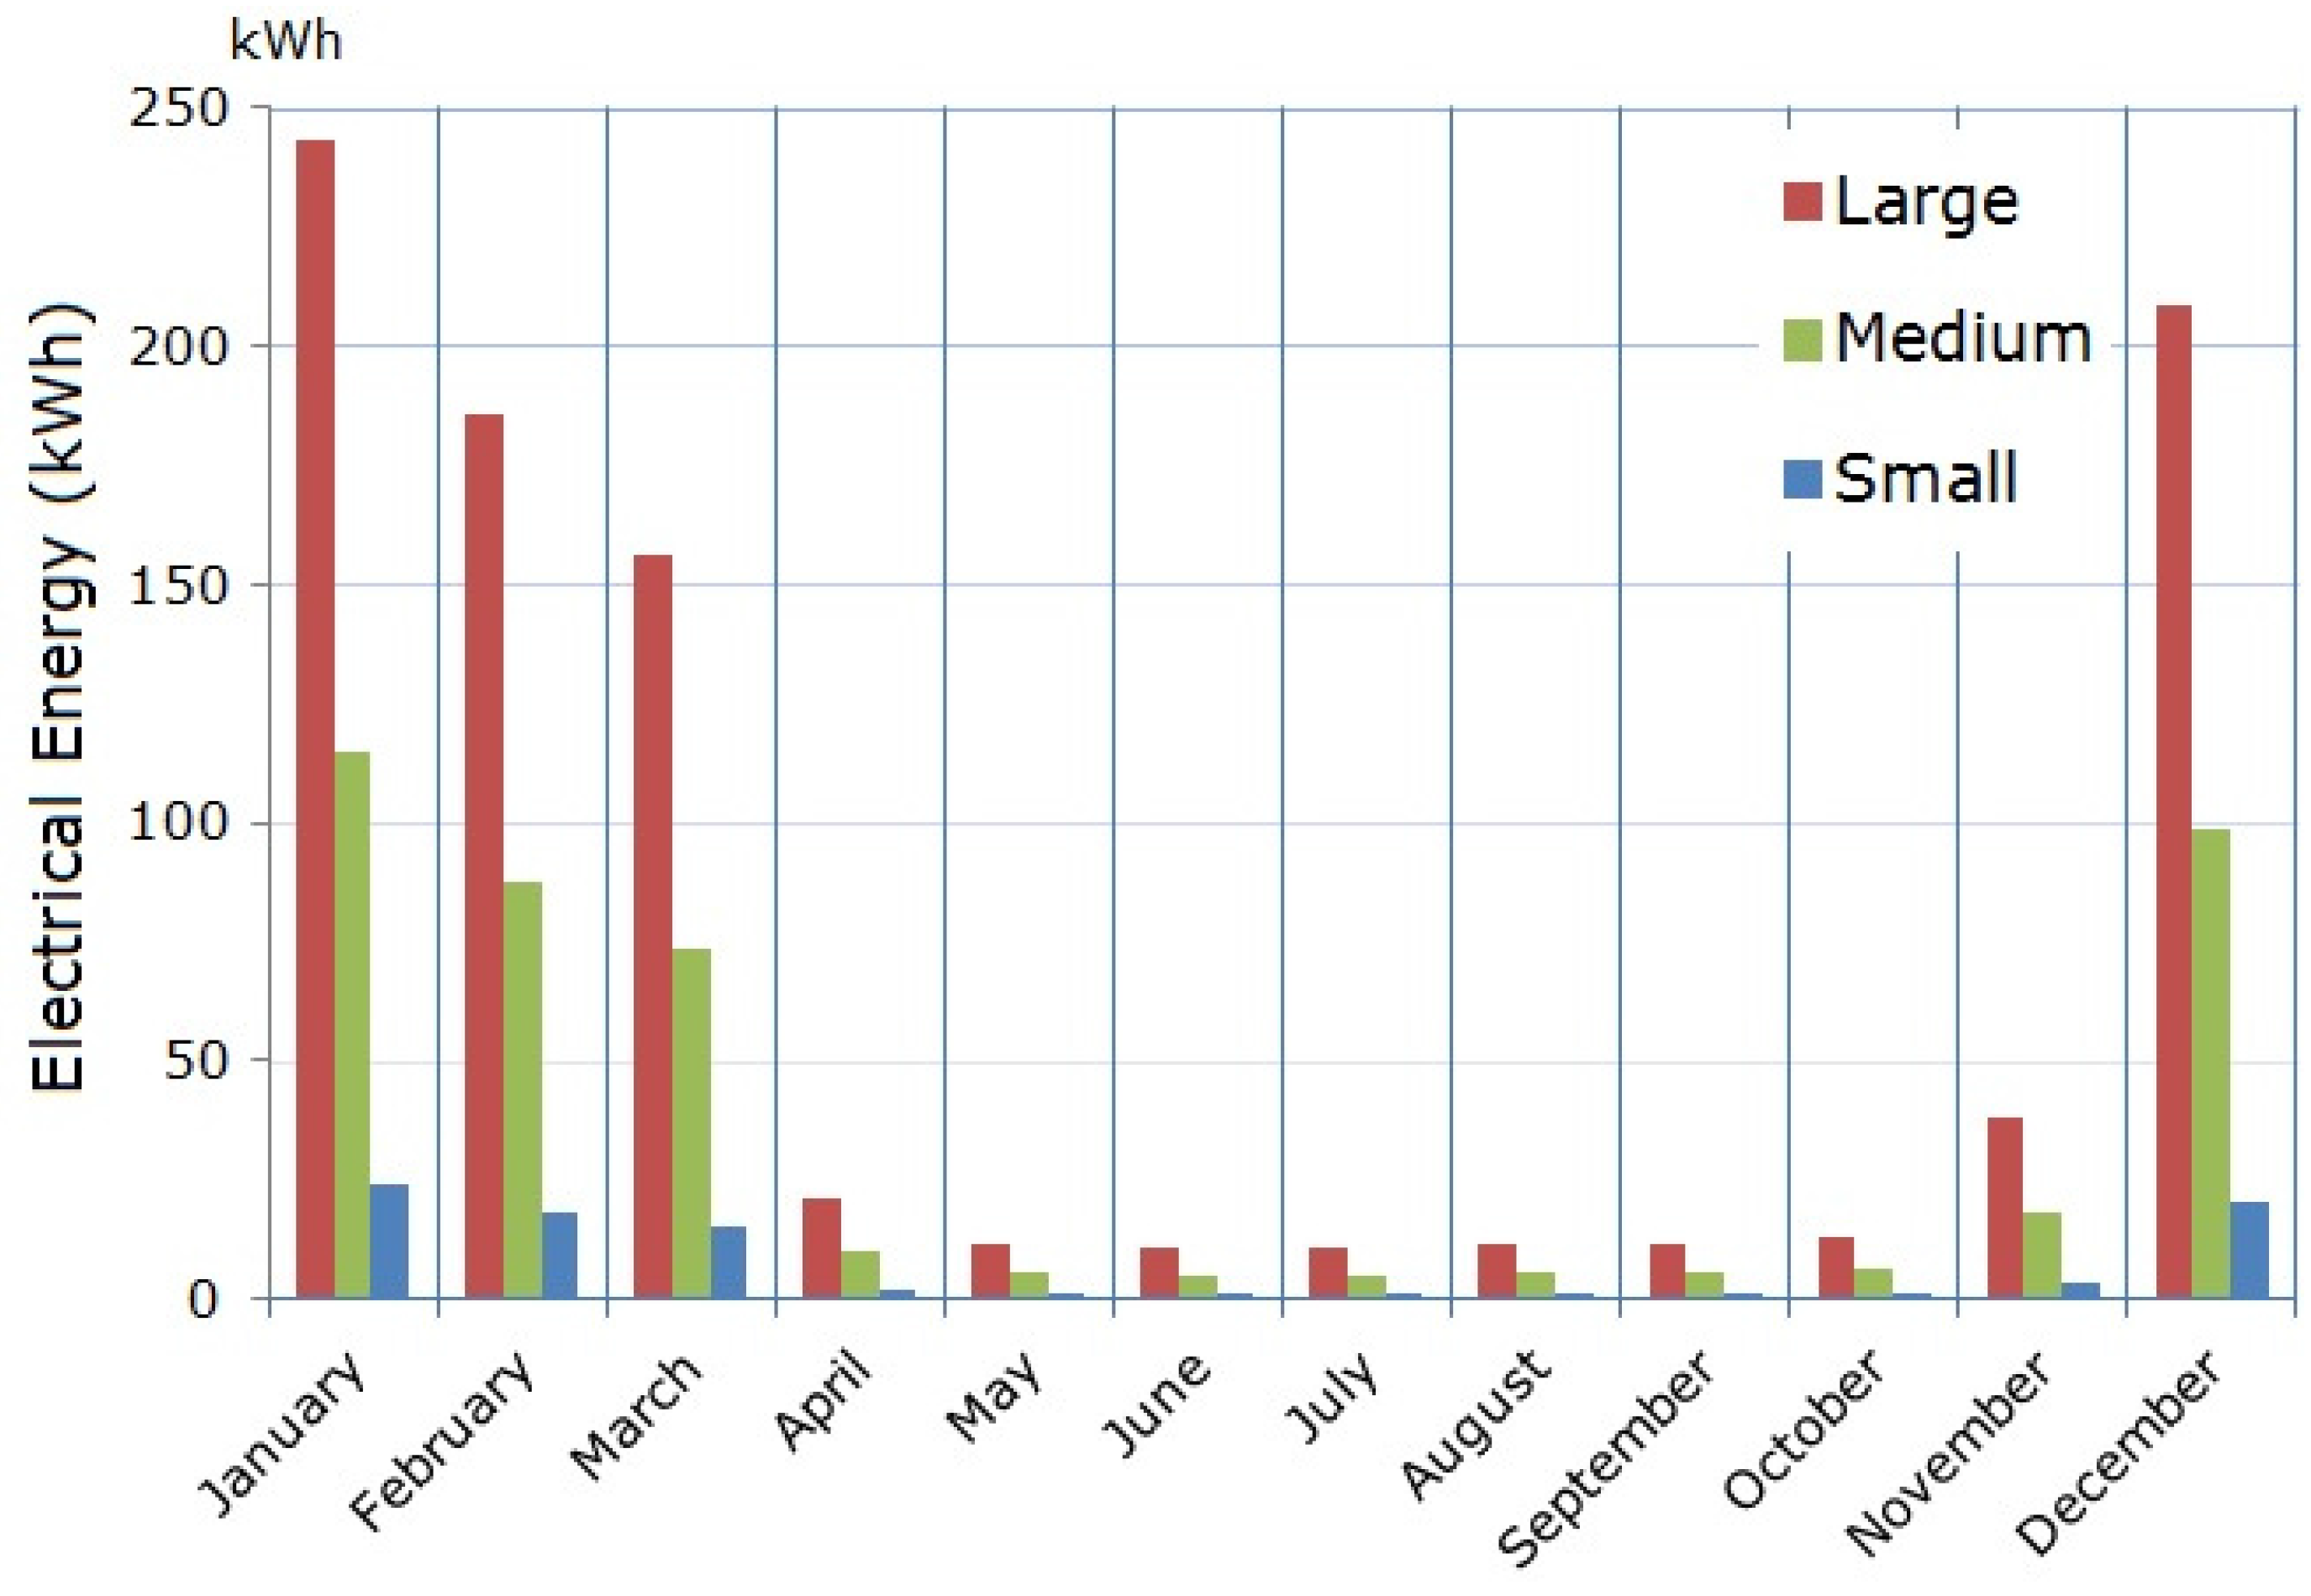
This ago-food sector is characterized by temporariness since it depends directly on the weather. As a consequence, electrical consumption levels throughout the year are not constant. The energy consumption of the oil mills audited by FAECA was obtained for the time period of one year. This data is shown in
Figure 1, where we can clearly see the temporariness of this consumption.
Figure 1.
Average electrical energy consumption of olive mills depending on their classification.
Figure 1.
Average electrical energy consumption of olive mills depending on their classification.
3. Renewable Energy Resources
Andalusia has an area of about 87,268 km
2 and it is located in the south of Spain, with longitudinal and latitudinal positions of 37.38 N and 5.98 W (see
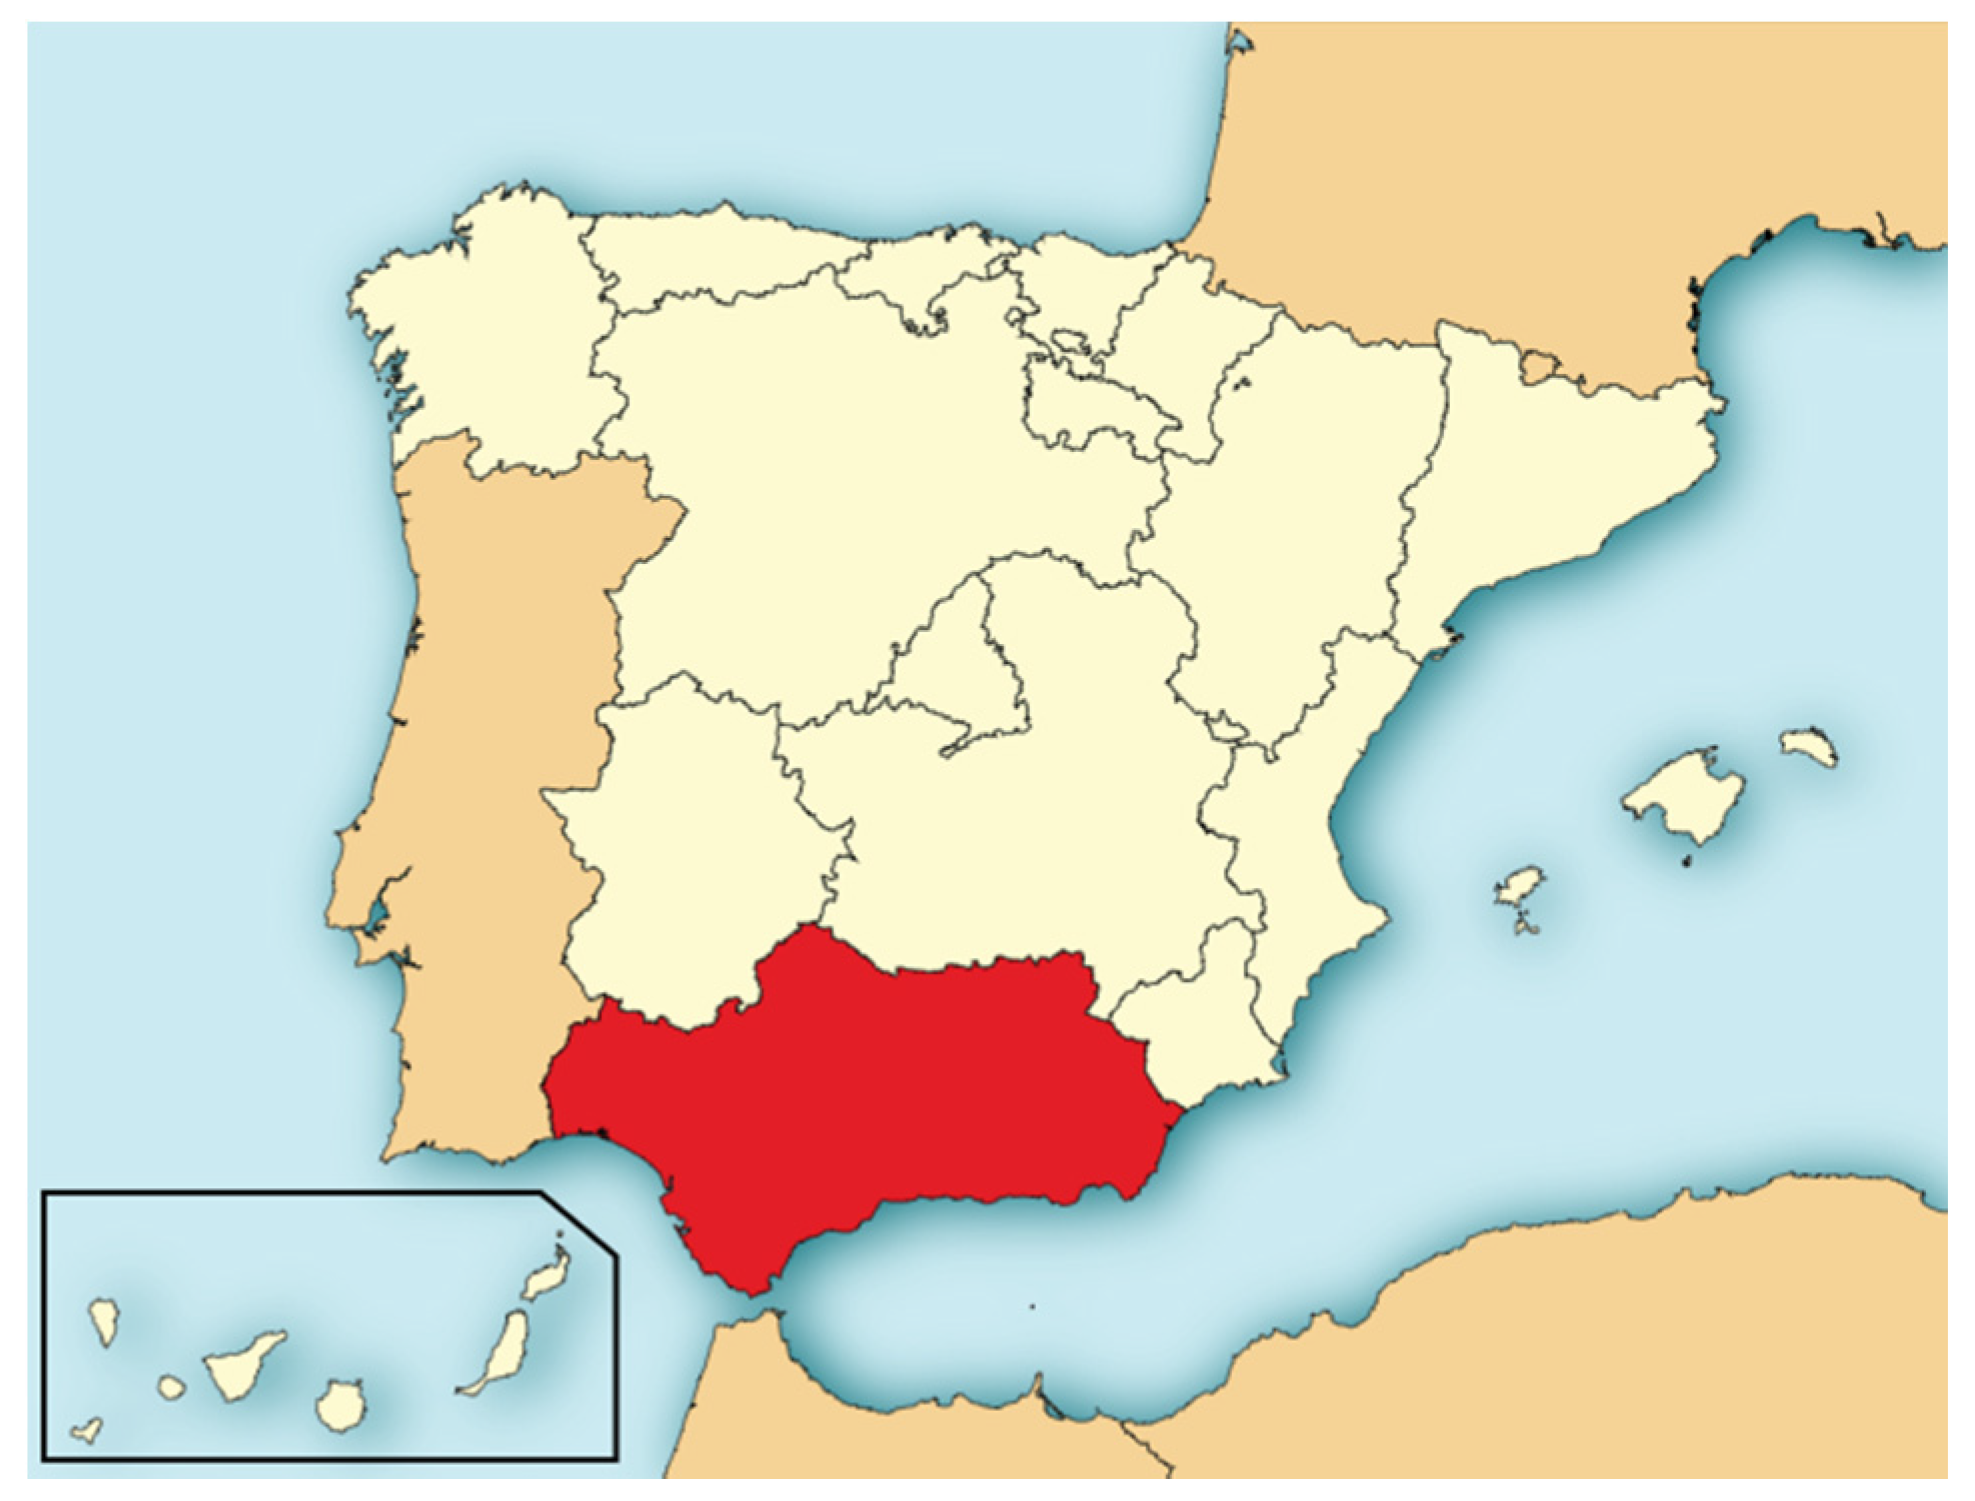
Figure 2), in the warm-temperate region.
Figure 2.
Location of Andalusia highlighted in Southern Spain [
11].
Figure 2.
Location of Andalusia highlighted in Southern Spain [
11].
In general, it has a Mediterranean climate with dry summers, although occasionally there are heavy rainfalls and torrid temperatures. In the winter, the tropical cyclones go southwards and they allow entering in the Andalusian territory the polar front. Still, within Andalusia there is considerable climatic variety between areas: annual rainfall in the rainiest area exceeds 750 mm·yr
−1 with no frost (mean annual temperature of 18–19 °C) and in the sub-desert area the annual rainfall is less than 300 mm·yr
−1 (mean annual temperature of 17–21 °C) [
12]. The average temperature in Andalusia throughout the year is over 16 °C, where the coldest month is January with an average temperature of 6.4 °C and the hottest months are July and August with an average temperature of 28.5 °C.
Solar Resources
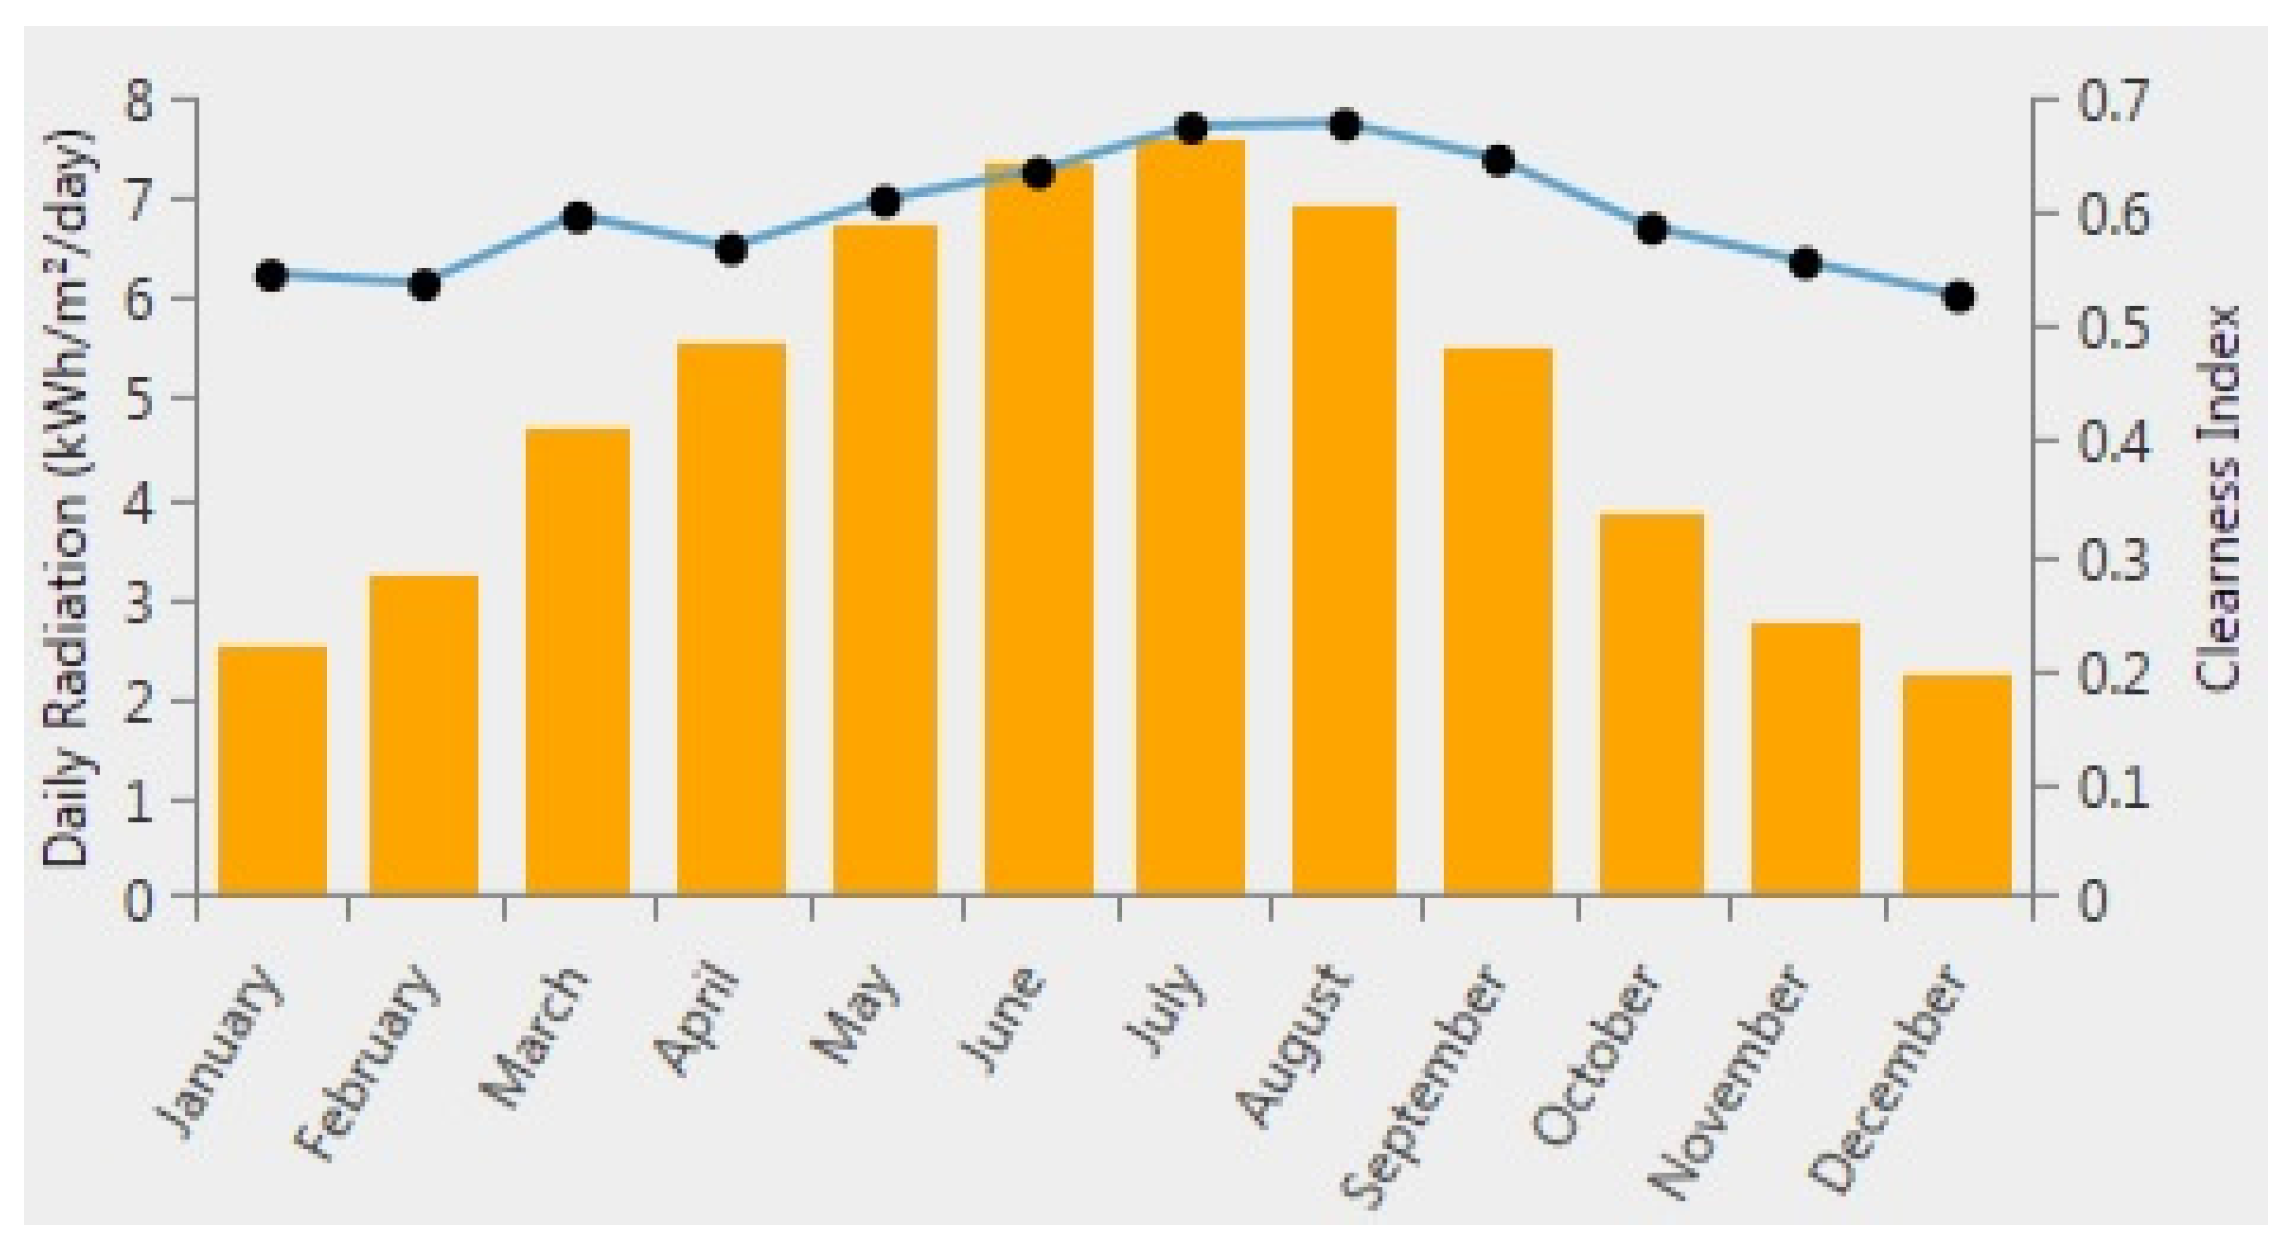
For this study, monthly solar radiation data was obtained from the National Renewable Energy Laboratory (NREL). The daily global horizontal radiation and clearness index over the year are shown in
Figure 3. The global horizontal solar radiation ranges from 2.2 kW·h/m
2/d to 7.6 kW·h/m
2/d, with a scaled annual average value of 4.9 kW·h/m
2/d. The solar irradiance is higher from April to September than from October to March. With the software application used in this study (HOMER, Hybrid Optimization of Multiple Energy Resources software, Boulder, CO, USA), the clearness index is automatically determined when the daily radiation data is used as input data [
13].
Figure 3.
Daily global horizontal solar radiation and clearness index in Andalusia implemented with Hybrid Optimization of Multiple Energy Resources (HOMER) software.
Figure 3.
Daily global horizontal solar radiation and clearness index in Andalusia implemented with Hybrid Optimization of Multiple Energy Resources (HOMER) software.
4. Materials and Methodology
The system was designed using HOMER (Hybrid Optimization of Multiple Energy Resources), model optimization modelling software developed and regularly improved by the U.S. National Renewable Energy Laboratory (NREL) to assist in the design of micro-power systems. It helps in the comparing and optimizing design of power generation technologies (PV, wind, hydro, biomass, etc.). HOMER models a renewable energy system’s behaviour, its life-cycle cost and allows selection of optimal design options based on technical, economical and environmental criteria.
To judge the feasibility of olive mills powered by grid connected PV systems, technical and economical evaluation criteria is applied. HOMER evaluates the technical feasibility of the system with several alternatives and shows all solutions, between them the optimum solution that can meet the load demand, and then economical parameters are calculated. The technical feasibility study relies on the area to place the solar PV modules and mainly of the electrical load and energy consumption. The calculation assesses all costs occurring within the project’s lifetime (initial set-up costs, component replacements, maintenance and operating costs and the purchasing power costs from the grid). The lifetime cycle cost of the system is represented by the net present cost (
NPC) and calculated according to the following equation [
14]:
where
TAC is the total annualized cost (€/year) and
CRF is the capital recovery factor given by:
where
N is the number of years and
i is the annual real interest rate (%). Another criterion that is widely used in any economic evaluation of a project, is the cost of the energy (
COE) produced by the system.
COE represents the unit cost of the energy produced by the system and can be calculated by dividing the total annualized cost by the annual produced energy
EPV:
4.1. System Model
The proposed system designed to ensure electrical and thermal consumptions is shown in
Figure 4. The systems used (based on renewable sources which provide power to the processes of the olive mill) will be a PV array and a biomass boiler, both independent. The PV system is dedicated to providing electrical energy and will be always connected to the grid by means of a bi-directional meter. The thermal consumptions correspond to satisfying hot water needs; to maintain the temperature of the dough in the beater at around 28 °C and the cellar temperature between 15 °C and 20 °C. The water is heated by the biomass boiler.
In this study, we will calculate the optimum solution for the three groups of olive mills (small, medium and large), with respect only to the electrical consumption shown in
Table 1. The monthly electricity load profile for the three groups of olive mills is shown in
Figure 1. As mentioned above, note that the months of highest activity range from November to April. In the rest of the months, there is minimum electrical consumption due only to the office facilities (lighting, air-conditioning,
etc.).
Figure 4.
Basic setting of loads and sources in HOMER.
Figure 4.
Basic setting of loads and sources in HOMER.
4.2. Economics
Taking an average project lifetime of 25 years, the real interest rate considered is 0.4%. The real interest rate is equal to the nominal interest rate minus the inflation rate. The appropriate values for these variables depend on the macroeconomic conditions of the region where the research is being carried out. For the Euro Zone in particular and according to the information provided by the Central European Bank, these conditions include a nominal interest rate of 0.2% and an inflation rate of −0.02% (for December 2014) [
15].
4.3. Photovoltaics (PV) Module
The PV output majorly depends on the available solar radiation. The PV system (modules and inverter) is designed in this study to produce AC. The power output of the PV system can be calculated using the following formula:
where
WPV is the peak power output of the PV module (kW),
fPV is the PV derating factor (%),
GT is the solar radiation incident on the PV module in the current hour (kW/m
2), and
GS is the incident radiation under standard test conditions (1 kW/m
2).
The PV module becomes less efficient as its temperature increases therefore the effect of temperature in the power output is taken into account in this study by means of the following equation:
where
kP is the temperature coefficient of power (% per °C),
TC is the PV module temperature in the current hour (°C), and
TSTC is the PV module temperature under standard test conditions (25 °C).
In this paper, a hundred PV array sizes (1–100 kW) are analyzed. Estimates of total installed costs and operation and maintenance costs have been obtained from NREL [
16].
Table 3 shows the cost and characteristics of the PV system that HOMER needs to make optimization.
Table 3.
PV system cost and characteristics.
Table 3.
PV system cost and characteristics.
| Description | Cost/Information | Units |
|---|
| Capital cost | 3552 | €/kWAC |
| Replacement cost | 2330 | €/kWAC |
| O&M | 17.7 | €/year |
| Life time | 25 | years |
| PV tracking | No tracking | |
| Derating factor | 80 | % |
| Slope | 37.17 | degrees |
| Ground reflectance | 20 | % |
Derating factor is a simply term to account for any divergence between the rated performance under ideal conditions and the final performance of the module due to high temperature, shading, and so on. The derating factor istypically considered 90%, and in regions with warm climates down to 80%. In our case, the shading effect [
16,
17,
18] is not very important because olive mills are usually located in rural areas without high buildings and the PV panels are usually installed on the roof, therefore we decided to use a derating factor of 80%.
Replacement cost has been estimated according to the photovoltaic system pricing trends in 25 years [
19].
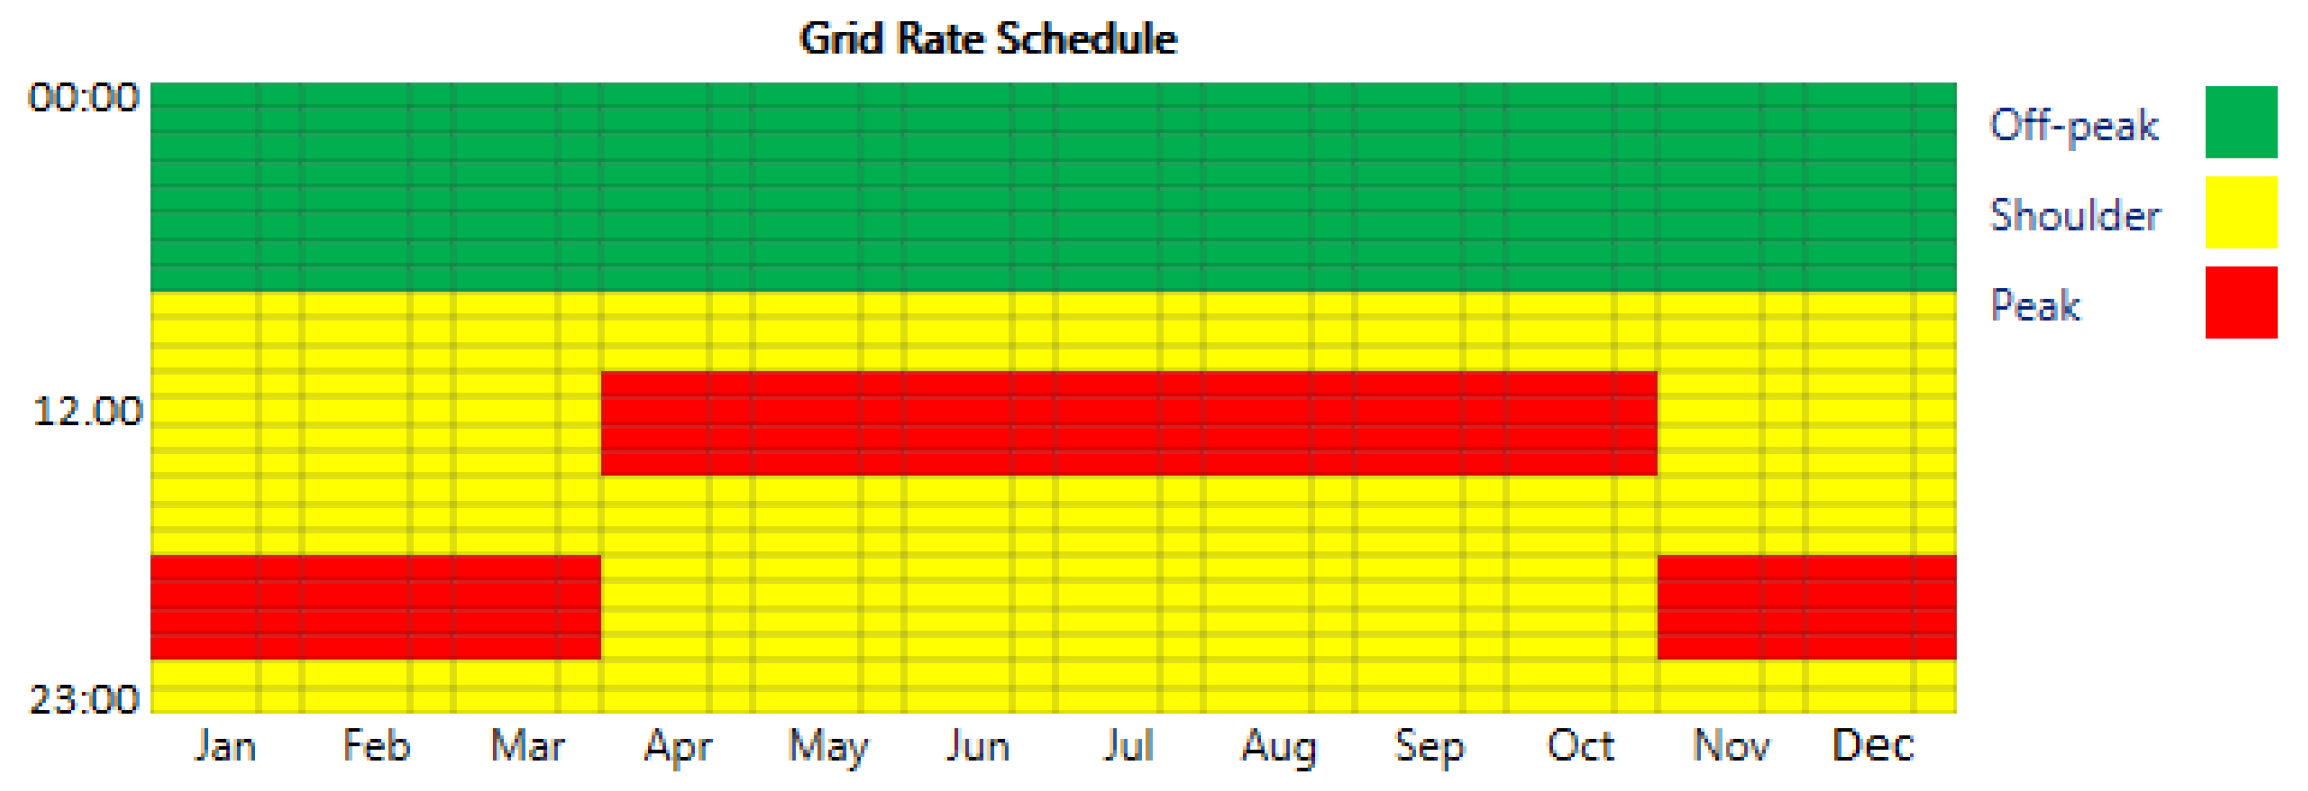
4.4. Grid Input
The electricity grid rates vary depending on the time at which consumption occurs, so oil mills can obtain discounts in energy prices. In our case, there are three time periods with different energy prices called Peak, Off-peak, and Shoulder.
Figure 5 shows how these time periods are distributed throughout the year.
Figure 5.
Rate schedule implemented in HOMER.
Figure 5.
Rate schedule implemented in HOMER.
In our study the power prices and the rates associated with the electrical power limit installed have been averaged for each time period and are different depending on the type of oil mill. Obviously, these differences occur because the electricity companies have different price agreements with the oil mills that depend on the latter’s total power consumption. In
Table 4 and
Table 5 we can see the prices for each oil mill type and time period in the year 2014.
Table 4.
Grid power price.
Table 4.
Grid power price.
| €/kW·h | Off-Peak Rate | Shoulder Rate | Peak Rate |
|---|
| Small | 0.0828 | 0.1248 | 0.1324 |
| Medium | 0.0590 | 0.0890 | 0.0945 |
| Large | 0.0697 | 0.1051 | 0.1115 |
Table 5.
Demand price.
| €/kW/Month | Off-Peak Rate | Shoulder Rate | Peak Rate |
|---|
| Small | 0.8067 | 3.6114 | 5.8562 |
| Medium | 0.5756 | 2.5763 | 4.1776 |
| Large | 0.6793 | 3.0409 | 4.9311 |
The energy produced by the PV system and that is fed to the grid is paid by the electricity company at a fixed price of 0.05 €/kW·h.
4.5. Equivalent CO2 Assessment
The electricity produced by a PV system is free of CO
2 emissions, but to manufacture the modules and other components (inverters, aluminium frames,
etc.) that make up a PV installation, non-renewable energy resources are consumed. The equivalent CO
2 emissions, associated with the production of electricity in Spain (Grid electricity) and the manufacture of all the components of a PV installation are respectively 330 g/kW∙h and 37 g/kW∙h [
20,
21], therefore using these data and the energy provided by the grid and the PV panels we can easily calculate the number of tonnes of equivalent CO
2 emitted into the atmosphere every year for the three types of oil mills.
5. Results and Discussion
HOMER simulates all the search space system configurations and outputs the feasible systems in increasing order according to their Net Present Cost (NPC). The optimization results for the olive mills powered by grid connected photovoltaic systems are shown in
Table 6, where the electrical power limit that must be contracted from the electricity company depending on the type of oil mill (small, medium or large) is indicated. In the other columns we can see the PV capacity installed that would permit the largest reduction in electricity, operation and maintenance costs.
Table 6.
Power.
| Unit: kW | Grid | PV Grid Connected |
|---|
| Self-Consumption | Monthly Net Metering | Annual Net Metering |
|---|
| Small | 139 | 7 | 9 | 36 |
| Medium | 657 | 10 | 15 | 15 |
| Large | 1393 | 33 | 49 | 100 |
The PV capacity to install that would reduce these costs depends on the billing and metering policy (self consumption and/or net metering) and on the billing period established with the electricity supply companies. Currently, the power installed (for consumption not production) from grid connected renewable sources is limited to 100 kW by Spanish regulations, as is the case in our study. For this reason, the optimum configuration for large oil mills is one where the installed power is the greatest possible in net metering with annual billing and metering. If this limit, imposed by Spanish regulations, did not exist the result of the optimization would be more installed PV power.
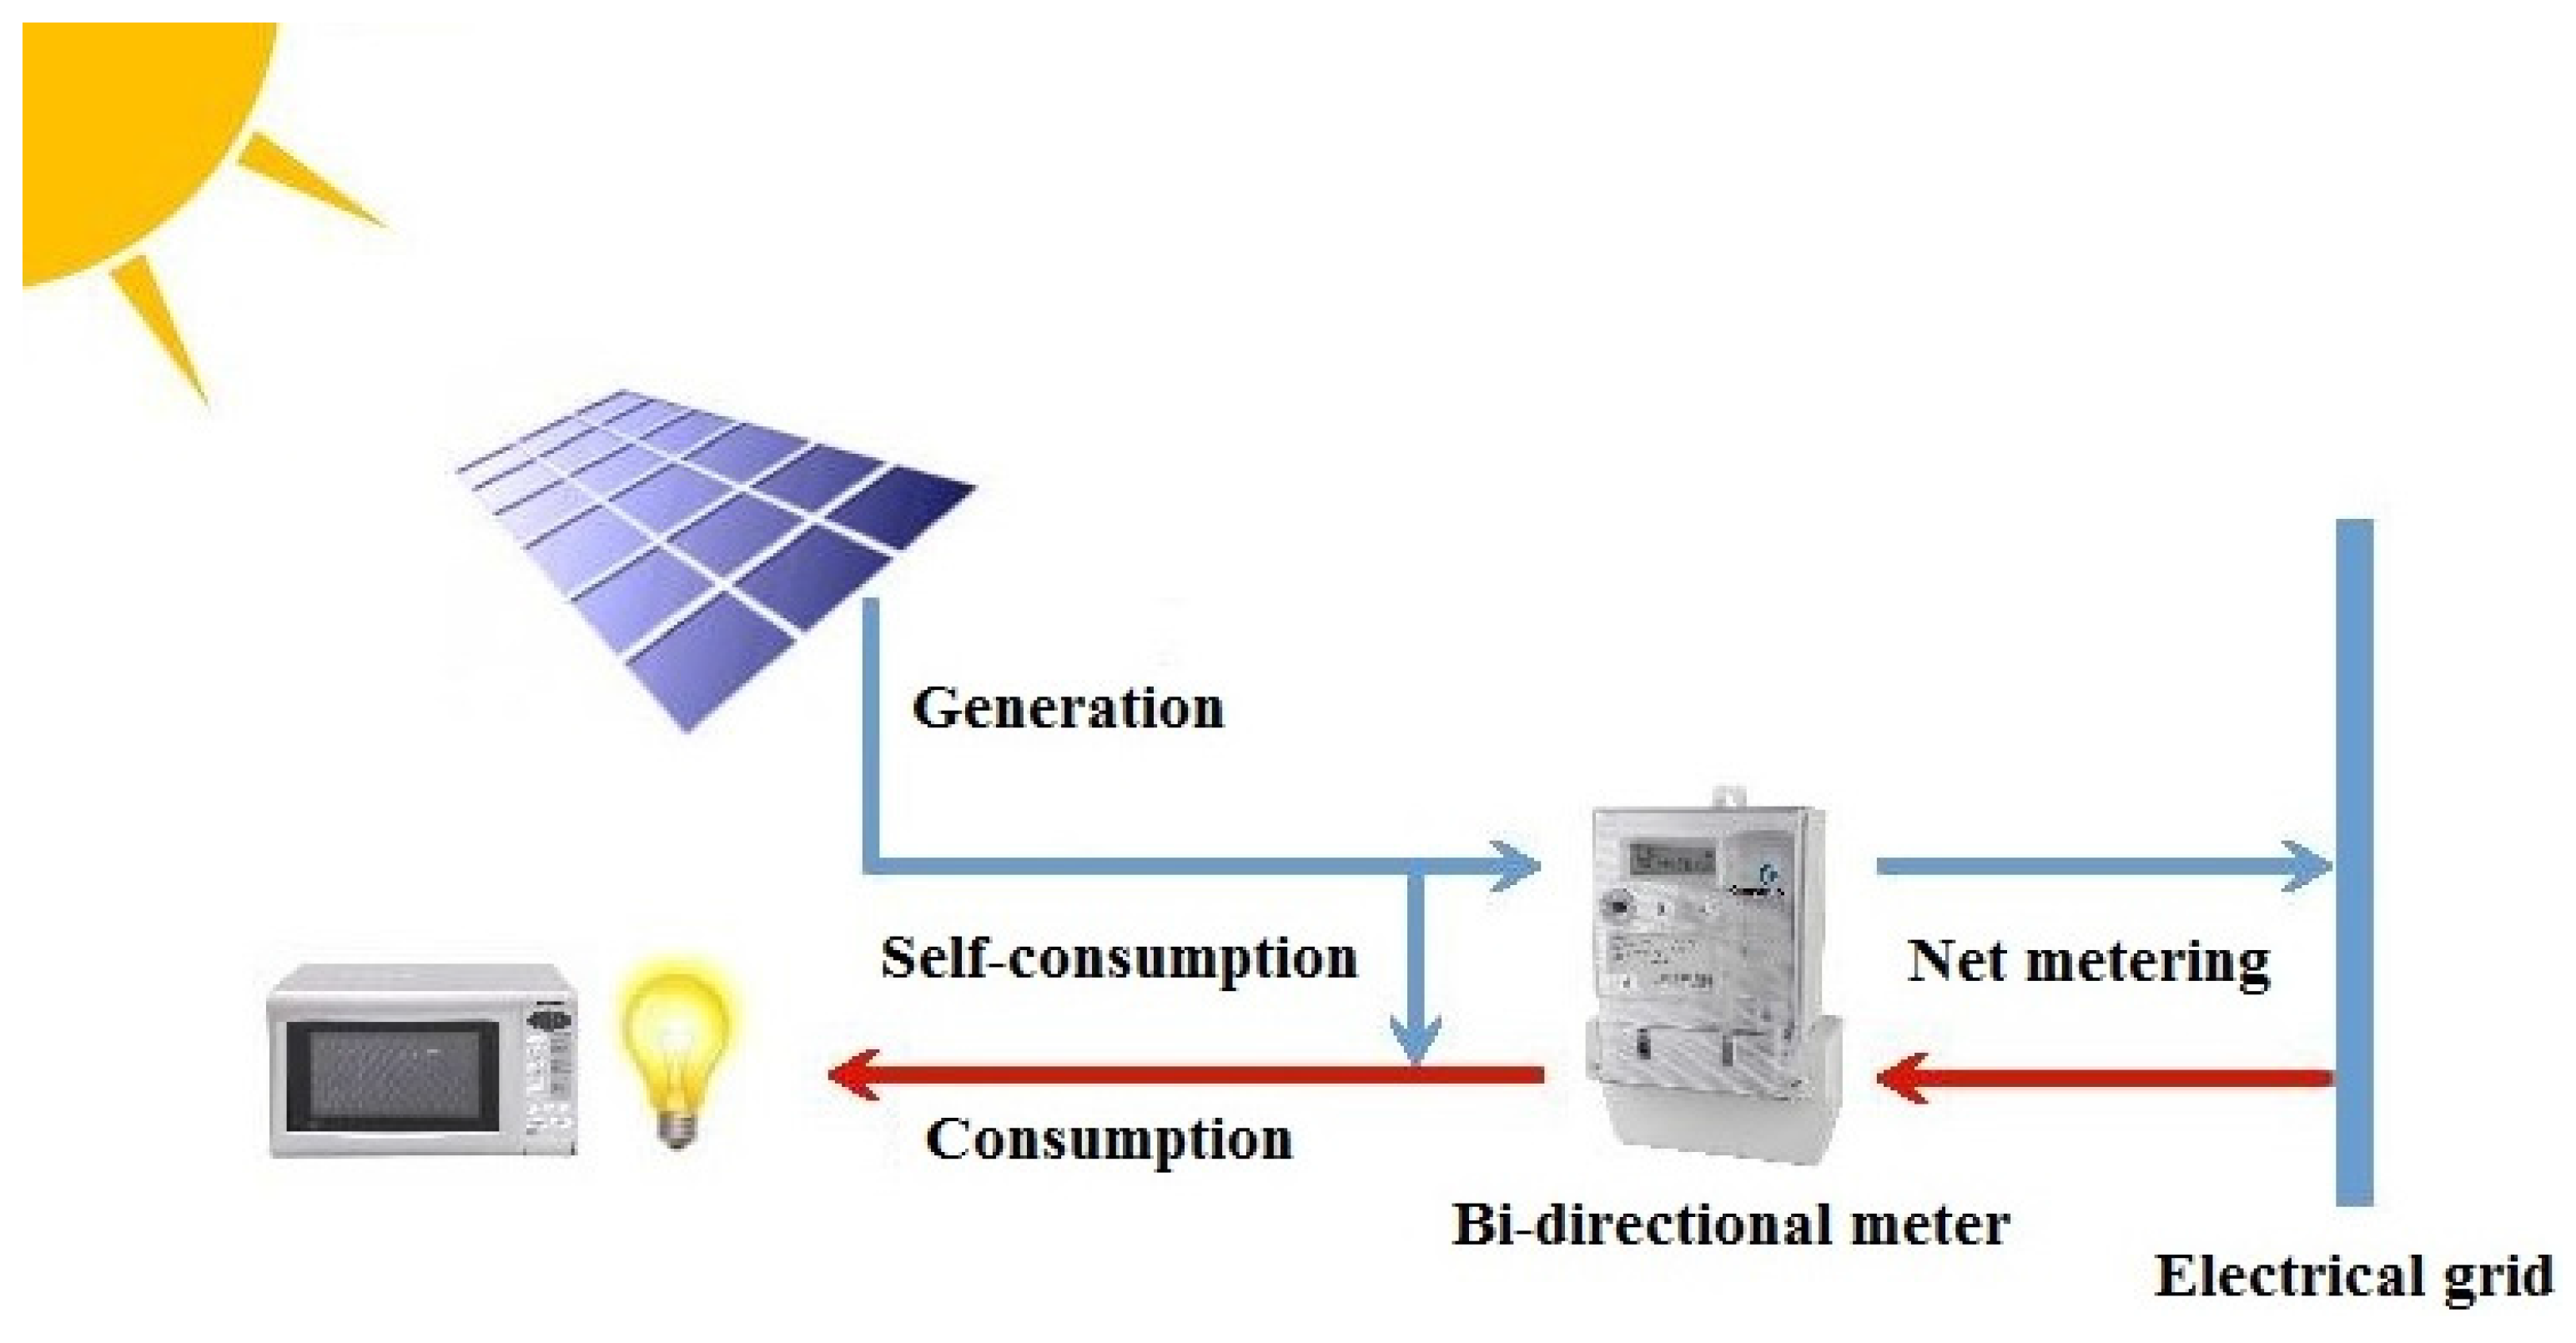
In self-consumption, the oil mill will firstly consume the energy produced by its PV system and the rest of the energy demand (not covered by solar panels) will be provided by the grid. By contrast, in the months when the energy demand is lower than the energy produced by the solar panels (May to October), any excess energy produced will be fed to the grid at the price stipulated by the electricity company and the oil mill (see
Figure 6). The following expression is used to calculate the net cost of energy in self-consumption mode during the billing period:
where
IESC (kW·h) is the electrical energy taken from the grid during the billing period,
CGrid (€·kW·h
−1) is the price the oil mill pays for the energy consumed from the grid,
EEsc (kW·h) is the excess electrical energy (produced by the PV system) that is fed to the grid during the billing period and
CPV (€·kW·h
−1) is the price that the electricity company pays for this energy from a renewable source.
According to the result of the optimization shown in
Table 6, in self-consumption it is more cost effective to have 7 kW, 10 kW and 33 kW of power installed in small, medium and large oil mills than to install a 100 kW PV system, this amount being the maximum power permitted by Spanish legislation for electricity consumers.
Figure 6.
Scheme of grid-connected PV system and differences between self-consumption and net metering [
22].
Figure 6.
Scheme of grid-connected PV system and differences between self-consumption and net metering [
22].
In net metering, the energy consumed by the oil mills is obtained directly from the electrical grid and all the energy produced by renewable sources is fed to the grid. In this study, the system has been optimized when the billing and metering are carried out monthly and annually. As seen in
Table 6, the results of the optimization are different depending on whether the bills have been settled monthly or annually. Currently in Spain, net metering is not regulated, but it is in other oil producing countries in the Mediterranean basin and the results of the optimization could be applied there.
To calculate energy costs in net metering, with monthly or annual billing periods, the following expression is used:
where
IENM (kW·h) is the total electrical energy consumed by the oil mill and therefore obtained from the grid during the billing period and
EENM (kW·h) is the total electrical energy produced by the PV system that is fed to the grid during the billing period.
In the following sections we will present the economic and environmental data that quantitatively demonstrates the results shown in
Table 6.
5.1. Economic Impact
The main measure used for evaluating the cost-effectiveness of a project, and therefore the optimization measure in HOMER software, is the Net Present Cost (NPC) during the useful life of the PV system installation, which in this study is considered to be 25 years due to manufacturers’ recommendations. The result of the NPC for the different types of oil mill and different billing and metering policies are shown in
Table 7. Here we can clearly see that traditional supply (Electrical Grid) is more expensive than supply from grid connected PV systems and that the cheapest billing and metering solution (within the next 25 years) is net metering with annual billing while the most expensive solution is self-consumption.
Table 7.
Net present value (NPC).
Table 7.
Net present value (NPC).
| Unit: ×103 € | Grid | PV Grid Connected |
|---|
| Self-Consumption | Monthly Net Metering | Annual Net Metering |
|---|
| Small | 378 | 374 | 368 | 341 |
| Medium | 1275 | 1277 | 1273 | 1273 |
| Large | 3192 | 3185 | 3156 | 3126 |
The second parameter is shown in
Table 8 where we can see the price of kilowatt-hour, with supply only from the electrical grid or with the grid connected PV system. Again, this demonstrates that the hybrid system is more cost-effective than the traditional one. If we compare the results of the different billing and metering policies, annual net metering continues to be the cheapest, while self-consumption is the most expensive.
Table 8.
Cost of energy (COE).
Table 8.
Cost of energy (COE).
| Unit: €/kW·h | Grid | PV Grid Connected |
|---|
| Self-Consumption | Monthly Net Metering | Annual Net Metering |
|---|
| Small | 0.183 | 0.173 | 0.167 | 0.115 |
| Medium | 0.130 | 0.129 | 0.128 | 0.128 |
| Large | 0.154 | 0.151 | 0.148 | 0.140 |
The results shown in
Table 8 come from calculations based on the rates detailed in
Section 4.4, which are the averages of all the rates available for each of the oil mill types.
5.2. Sustainability and Environmental Impact
In this section, we address energy sustainability and environmental impact of the most cost-effective solutions for each of the three types of oil mills. The first parameter, that can help us measure the degree of sustainability, is the percentage of energy consumption provided by renewable sources. The second parameter, related to environmental impact, refers to the direct and/or indirect CO2 emissions.
If we consider electrical consumption alone, we can see in
Table 9 the percentages of electrical energy supplied by the PV installations with respect to the total electrical energy demand of the oil mills.
For these calculations, the energy supplied by biomass boilers to the thermal loads has not been taken into account. Had this been considered, the percentage of energy (electrical + thermal) supplied by renewable sources with respect to the total energy demand would be considerably higher.
Table 9.
Renewable percentage.
Table 9.
Renewable percentage.
| Unit: % | Grid | PV Grid Connected |
|---|
| Self-Consumption | Monthly Net Metering | Annual Net Metering |
|---|
| Small | 0 | 6 | 8 | 26 |
| Medium | 0 | 2 | 3 | 3 |
| Large | 0 | 3 | 4 | 8 |
As a result, the percentage of use of renewables goes from 2% to 26% for the technically viable and most cost-effective solutions.
In
Table 10 the annual electrical consumption of the three types of oil mills have been calculated and specified according to the billing and metering policy, the energy provided by the grid, and the energy from renewable sources. Taking into account the equivalent CO
2 factors above mentioned for the grid and PV systems, the average emissions can be calculated for the three types of oil mills supplied solely by the grid (
Table 11), as well as the emissions from grid connected PV systems of the optimized solutions.
Table 10.
Annual electrical consumption.
Table 10.
Annual electrical consumption.
| Unit: kW·h/year | Self-Consumption | Monthly Net Metering | Annual Net Metering |
|---|
| Grid | PV | Grid | PV | Grid | PV |
|---|
| Small | 84,079 | 12,036 | 82,484 | 15,475 | 69,746 | 61,902 |
| Medium | 422,928 | 17,193 | 416,918 | 25,791 | 416,918 | 25,791 |
| Large | 882,735 | 56,738 | 864,175 | 84,248 | 820,142 | 171,935 |
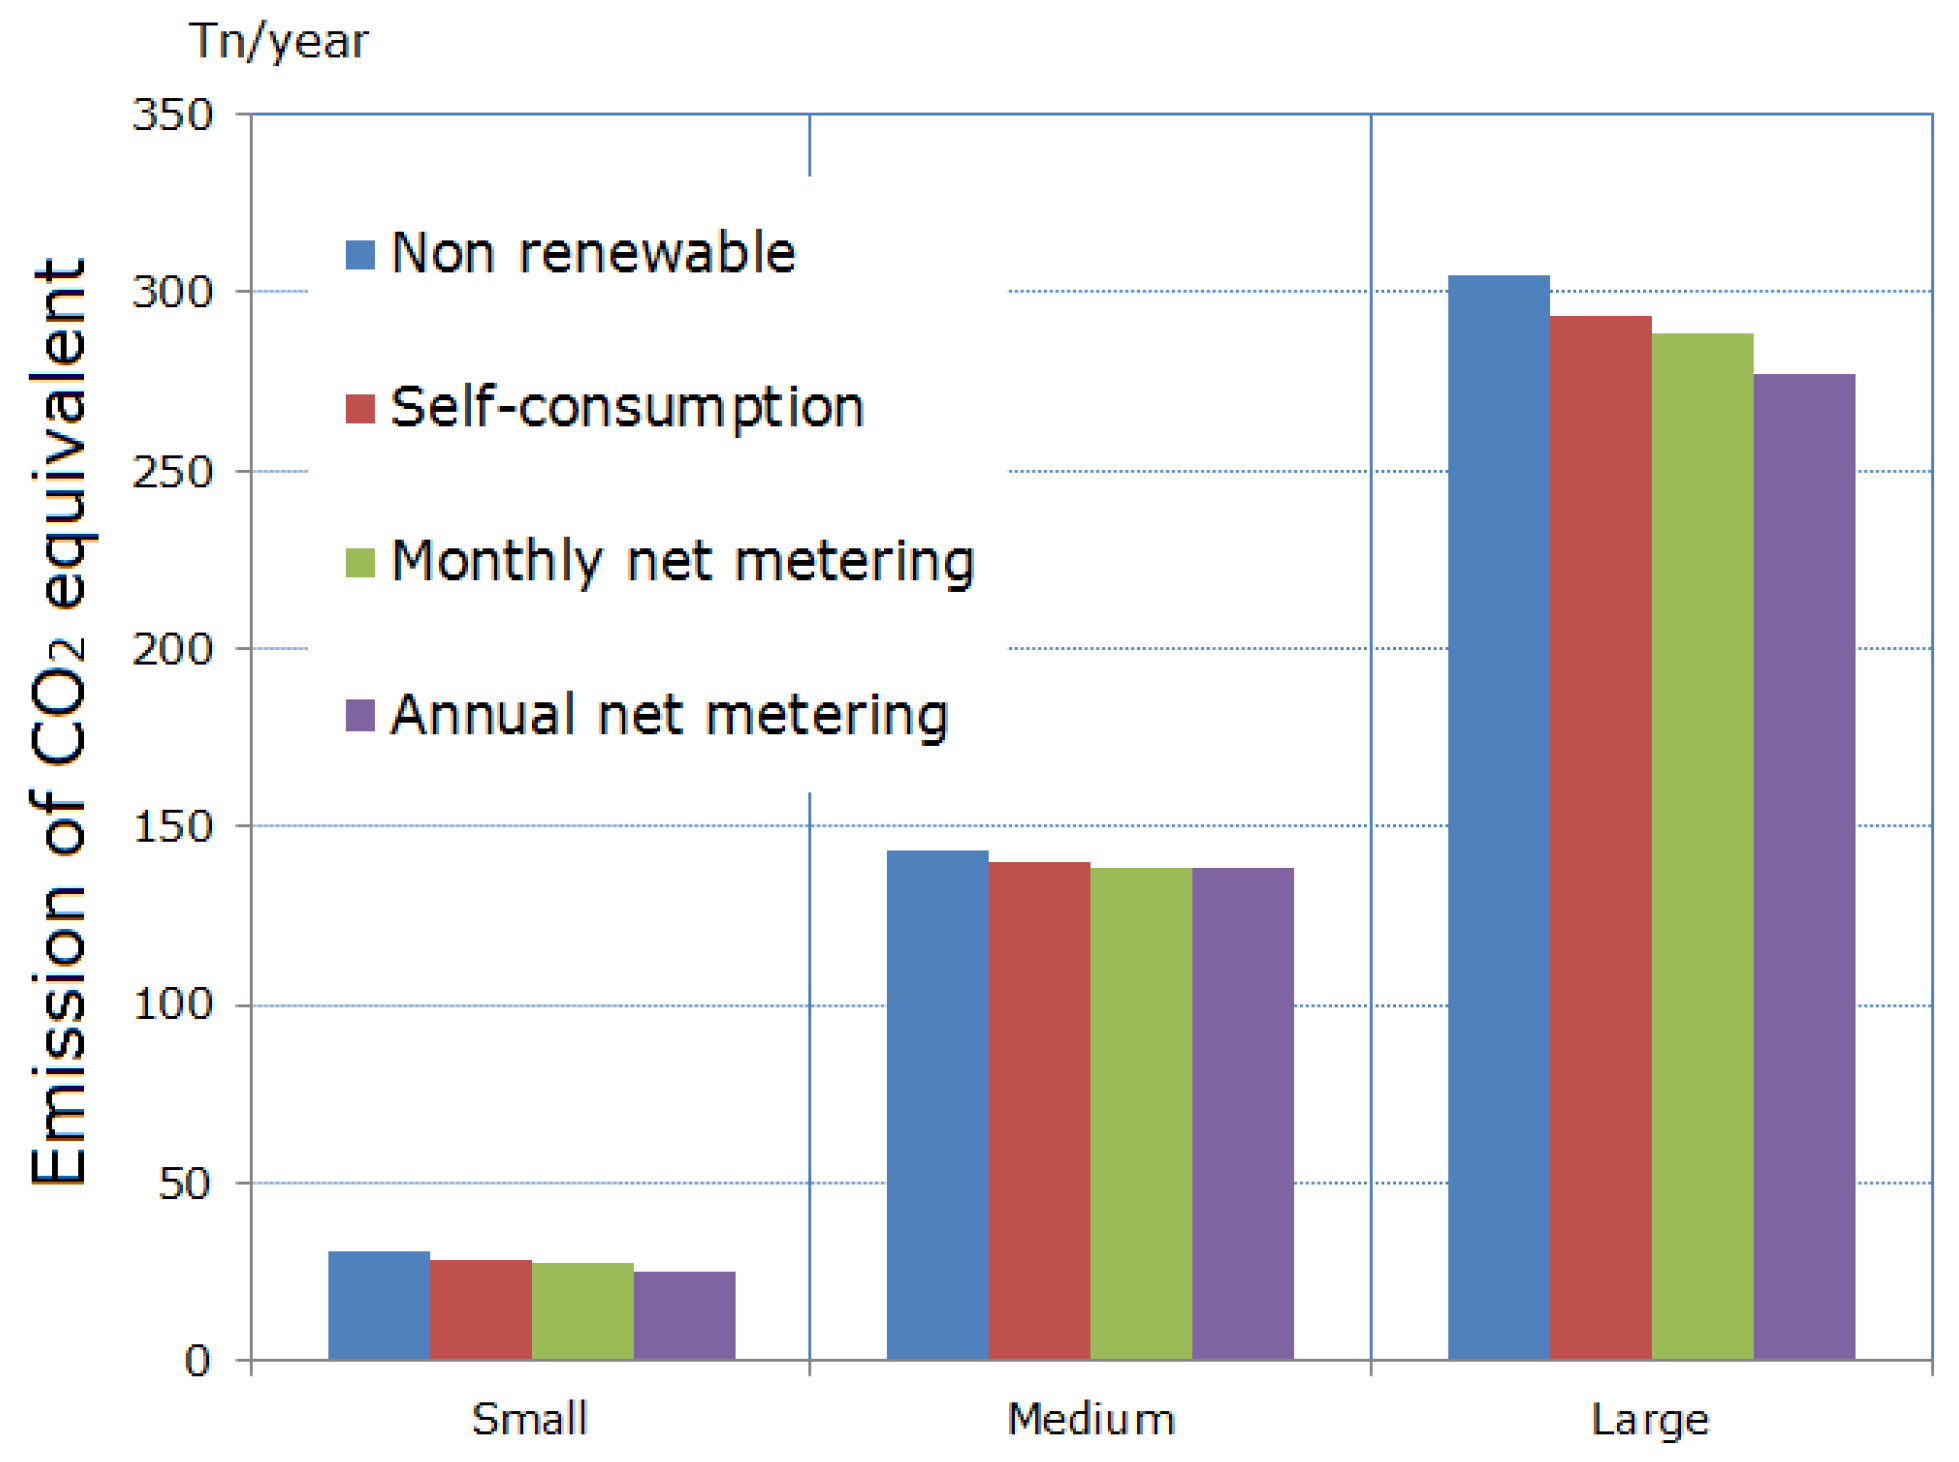
Seeing the results shown in
Table 11, the following reductions of equivalent CO
2 emissions can been achieved: up to 16.7% in small oil mills, 3.6% in medium oil mills and up to 9% in large oil mills. In
Figure 7 the emissions of the three types of oil mills are shown in a bar chart.
Table 11.
Equivalent CO2 for electrical power grid and grid-connected PV system.
Table 11.
Equivalent CO2 for electrical power grid and grid-connected PV system.
| Unit: t/year | Grid | Grid-Connected PV System |
|---|
| Self-Consumption | Monthly Net Metering | Annual Net Metering |
|---|
| Small | 30.4 | 28.2 | 27.8 | 25.3 |
| Medium | 143.6 | 140.2 | 138.5 | 138.5 |
| Large | 304.4 | 293.4 | 288.3 | 277 |
Figure 7.
Comparison between emissions of equivalent CO2 in olive mills powered with grid-connected PV and without renewable energies according to metering policy.
Figure 7.
Comparison between emissions of equivalent CO2 in olive mills powered with grid-connected PV and without renewable energies according to metering policy.
5.3. Impact on the Market
As we mentioned at the beginning of this article, the price of olive oil has peaked while its production costs have risen, mainly due to the increase in electricity prices. Therefore, another aim that we had in mind when tackling this study was to reduce the production costs of olive oil from an energy perspective.
As result, in
Table 12 is shown the real price in the year 2014 for the three types of oil mills, when they are solely grid connected and when they use grid connected PV systems, in comparison with the data shown in
Table 2, where we could see the averaged energy price per tonne of oil produced between the years 2007 and 2009 [
10].
Table 12.
Energy price per tonne of olive oil produced (year 2014).
Table 12.
Energy price per tonne of olive oil produced (year 2014).
| Unit: €/t | Grid | PV Grid Connected |
|---|
| Self-Consumption | Monthly Net Metering | Annual Net Metering |
|---|
| Small | 32.41 | 30.64 | 29.58 | 20.37 |
| Medium | 25.29 | 25.10 | 24.90 | 24.90 |
| Large | 20.26 | 19.86 | 19.47 | 18.42 |
As can be seen in
Table 2 and
Table 12, between 2009 and 2014 the price per tonne of olive oil increased by 21% for oil produced in small mills, 19% for oil produced in medium size mills and 31% for oil produced in large mills (based on Spanish energy prices).
After looking for the optimal configuration in grid connected PV systems, we obtain reductions in the price of energy per tonne of olive oil of up to 37% in small oil mills, 2% in medium oil mills and 9% in large oil mills, depending on the billing and metering policy.
The reason that we can obtain a 37% reduction in the price of energy per tonne of oil in small oil mills lies in the fact that most of these mills have insufficient, or in some cases obsolete, technology and therefore there is a lot of room to manoeuvre in order to reduce costs with appropriate renewable energy systems. In contrast, the price per kW·h that the medium size oil mills benefit from is the lowest of the three types of mill studied (28.7% less with respect to small mills and 15.3% less with respect to large mills) and therefore the margin for reduction is quite limited.
6. Conclusions
We have studied the technical and economic viability of using grid connected PV systems for the electric installations that feed the equipment of a large sample of Spanish oil mills classified in three groups based on their production capacity.
To carry out this work HOMER software was used, which, based on the different possible configurations, provided the most cost-effective solution from an economic perspective for all the technically viable configurations, considering both the installation costs of the renewable energy system and the maintenance and replacement costs at the end of its useful life.
Three billing and metering policies have been considered for the grid connected PV systems, whose results have been compared with the traditional electrical supply where the rise in electrical energy prices has been quantitatively confirmed. However, the results of the simulations have been satisfactory because they allow reductions in the energy costs paid in this agro-food industry, which is a very important industry for Spain and other countries in the Mediterranean basin. The final results in each of the aspects analyzed are as follows:
- (1)
Economic impact: the optimization criterion of HOMER is the NPC of an installation. In the 25 year period that is considered the useful life of a system, taking into account its installation, operation, maintenance and cost of consumption from the electrical grid, in small oil mills the saving is 9.8% while in large mills the saving is 2%. We must bear in mind that after that 25 year period there are parts of the system that do not need replacement (e.g., structural elements) and that the technology becomes cheaper and more efficient at a higher pace than the increase in electricity prices, so we can assume that these percentages could be higher. Regarding the price per kW·h paid by the oil mill, we can achieve reductions of up to 37.2% (from 0.183 €/kW·h without renewables to 0.115 €/kW·h with renewables) in small oil mills and up to 9% (from 0.152 €/kW·h without renewable to 0.140 €/kW·h with renewables) in large mills, depending on the billing and metering policy in place.
- (2)
Environmental impact: the use of renewable sources, which ranges from 2% to 26%, increases according to the type of oil mil and the billing and metering policy. An immediate consequence of this is a reduction of 3.6% to 16% in equivalent CO
2 emissions. We should keep in mind that these results are more restrictive since we have taken into account the non-renewable sources used in the construction of the whole PV system, while the use of biomass to supply the thermal demand of the other components of the oil mills has not been considered. If all the factors had been considered, the reductions in CO
2 emissions in oil mills as a whole would be much higher and we would be in line with the EU’s objective of reducing CO
2 emissions by 20% in different economic sectors [
23].
- (3)
Impact on the olive oil market: up to 37% reduction in the price of olive oil coming from small oil mills and up to 9% reduction in the price of oil from large mills.
As we have seen, the economic savings and CO
2 reductions in medium size oil producers are quite small because they pay lower prices for electricity. However, 38% of Spanish oil mills are medium size while 58% are small and 7% are large [
10]. This means that both the economic saving and the reduction in environmental impact would be quite significant.
Finally, we can conclude that the aims stated at the beginning of this article have been achieved.


 ,
, 