1. Introduction
In the Czech Republic (CR), in spite of an important increase in the installed solar photovoltaic (PV) system capacity, legislative measures have recently been adopted that have stopped this upward trend. Restrictions on connecting renewable energy sources in the CR are mainly in terms of power system operation.
Secondary objectives of the legislative measures have been to reduce government expenditure on this type of energy source, and to straighten relations between individual energy sources (establishment of competitive environment without preference for Renewable Energy Sources (RES)). Currently, it is possible to operate the following types of PV systems [
1,
2]:
Grid-on system
- ○
Traditional PV plants connected to the grid, which allows an overflow of the electricity produced, if it is not utilized in the place of consumption.
- ○
The traditional grid-on PV systems also include the micro PV systems, which usually consist of several PV panels located, for example, on the balcony. These systems are equipped with a micro-inverter directly on the panel. Even these miniature PV systems work in parallel operation with the Distribution System (DS) and therefore, in practice, overflow of electricity to the DS may occur and this may happen even a proper design of protective components. This type of PV plant requires connection to a functioning distribution system for its operation.
Hybrid system
- ○
Hybrid PV systems are equipped with battery, charge controller and hybrid inverter. Selected types of hybrid inverters can completely avoid supplying electricity to the distribution system. Hybrid inverters that do not allow this function allow the supply of electricity to the grid—this situation exists where the battery is fully charged and the consumption on site is ensured—this is similar to a grid-on system.
- ○
Utilization of equipment for optimizing consumption and minimizing the overflow of produced electricity (for example Wattrouter) is not an optimal solution to unauthorized supply to the DS [
3]. The reason is that uncontrolled supply to the network may cause voltage and frequency fluctuations, or may negatively affect the regulation of small community transformers [
4,
5].
Island system
- ○
Island PV systems (grid-off) are not connected to the electricity system. Their operation and connection do not require permission of the distribution system operator. Within the island system, frequency deviations can occur depending on the power generated, which can have negative effect on rotating machines. This also depends on the quality of the inverters used and their fast response time [
5,
6].
The development of PV power plants accelerated by such support exceeds the useful need and possibilities of power engineering in the CR and also the obligations towards the EU. In accordance with the Directive 2009/28/EC of the European Parliament and Council, the target values of the quota of renewable sources and the method of its calculation were defined. According to the Directive mentioned, the energy produced in CR from RES must by 2020 cover 13% of all energy consumption (heating and cooling energy, electricity, fuels for transport). In fact, the distribution of the fixed quota of RES in the various types of energy is the responsibility of each country within EU [
7].
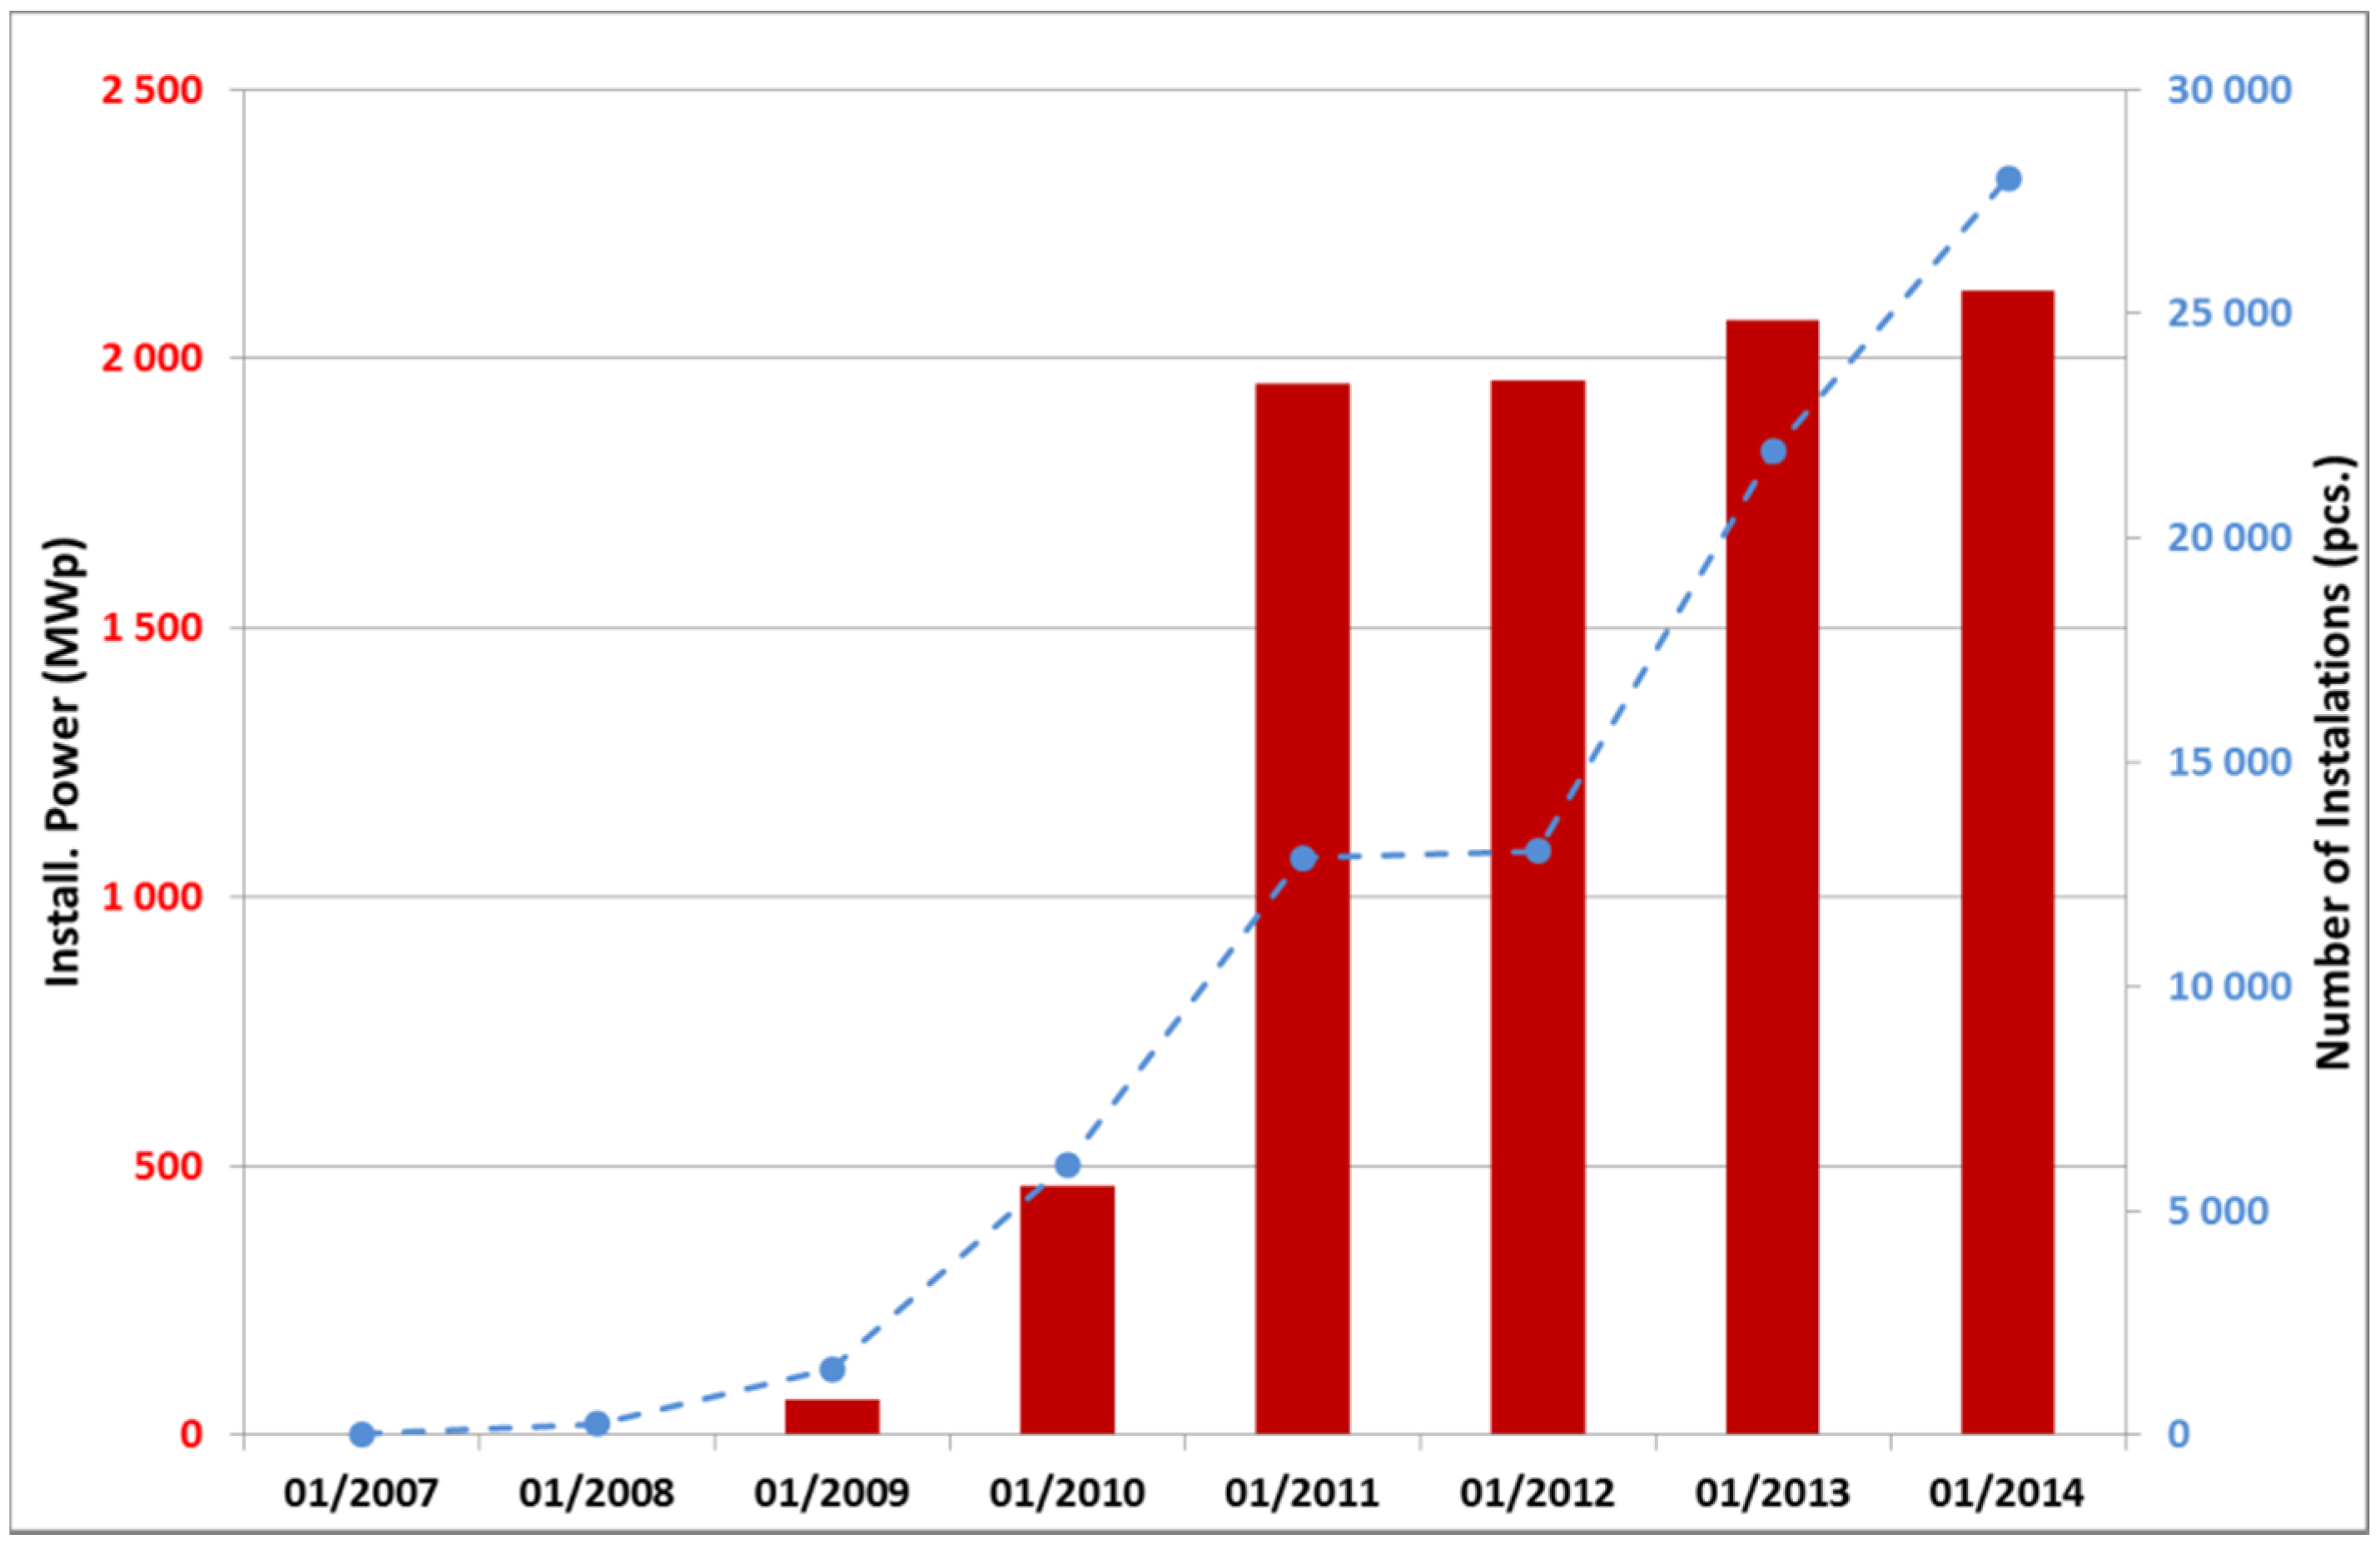
Figure 1 shows the progress of installed performance of PV systems in CR for the period from 2007 to 2014. It can be seen that between the years 2009 and 2011 the increase in installed power of PV systems was very dynamic. The reason was the high state support in the purchase prices of the electricity produced from this energy source.
Currently in the CR, no new installations of PV systems are supported—this is valid for installation as from 2014. If the plant is not operated for business purposes, the law does not require a license from the operator. Commercial electricity production involves any activity that supplies electricity to the grid. This also applies to a situation where green bonus, the purchase price or market price is collected for electricity generated.
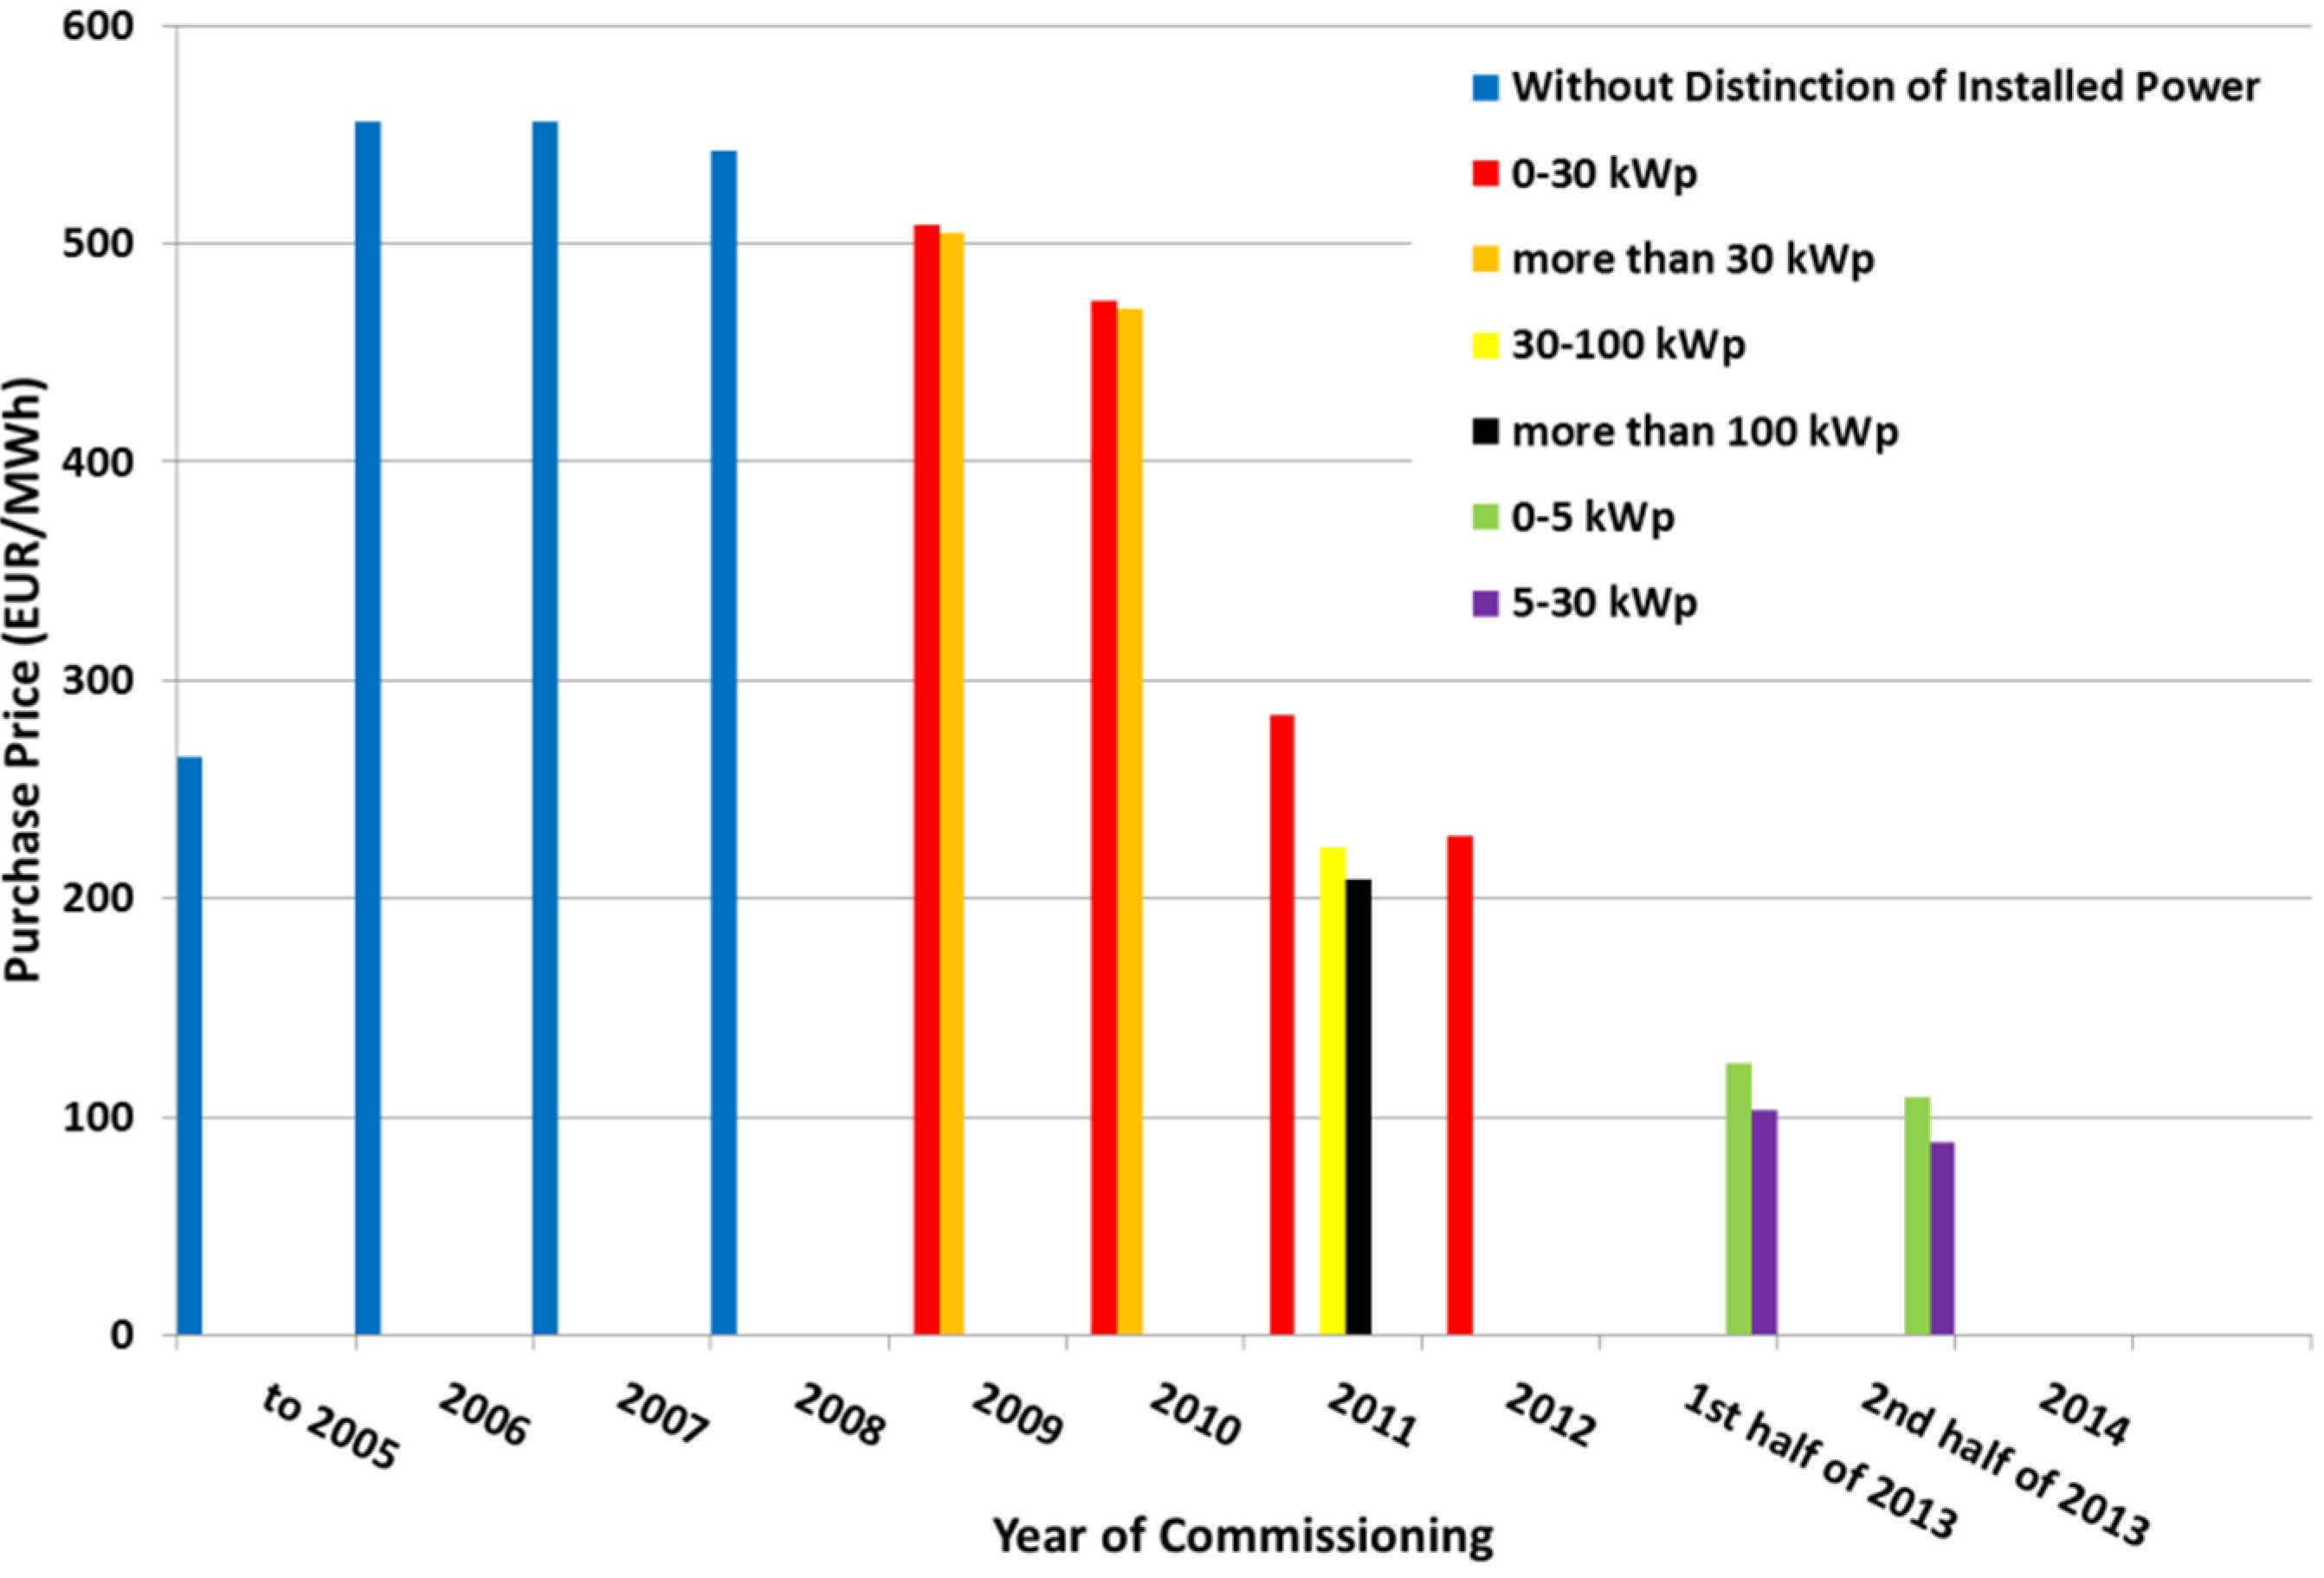
Mainly because of the high installed capacity of PV power plants and also with regard to investors’ decreasing efforts, new purchase prices of electricity produced from such sources were set. For illustration, the development of the purchase price between the years 2005 and 2014 is shown in
Figure 2.
Figure 1.
Development of photovoltaic (PV) installations in the Czech Republic (CR) (2007–2014) [
8].
Figure 1.
Development of photovoltaic (PV) installations in the Czech Republic (CR) (2007–2014) [
8].
In connection with the new measures, the requirements for technical and operational parameters of PV power plants have increased.
For most PV power plants, the supplier gives a 5-year warranty on the mechanical properties of panels and 25-year warranty on performance parameters. However, there are many possibilities when PV panels do not match the declared parameters, which have a negative impact on overall energy and economic efficiency of operated PV power plant [
5,
9].
Figure 2.
Development of purchase prices between the years 2005 and 2014 in CR [
8].
Figure 2.
Development of purchase prices between the years 2005 and 2014 in CR [
8].
The main causes of defects in PV panels can be divided into several categories [
10,
11]:
A different technological level of panel production by different producers.
Mechanical damage, for example during transportation.
Effect of adverse environmental impacts.
Improper installation of the PV system.
2. Detection Methods for Identification of Photovoltaic (PV) Panel Disorders
Determining the PV system’s operational performance (OP) is based on the following indicators that are part of the legislation relating to the operation of RES in the CR. The OP of PV power is defined by the following equation [
10]:
where:
- E
total amount of electricity produced by PV power plant (Wh),
- GE
total aggregated energy of solar radiation (Wh∙m−2),
- A
total area of all installed PV panels within the PV power plant (m2),
- Effm
efficiency of new solar panels (%),
- UO
total aggregated energy of solar radiation during relevant period falling within PV power plant location on the surface of solar panels that cannot be converted into electricity and supplied into the network (Wh·m−2).
The OP declared at the supplier of PV power is usually in the range of 80%–90% (in installations until the year 2011) and 85%–93% in installations with the current technology. The minimum value of operational performance is usually set at 82%. A lower operating production rate would have a negative impact on the overall economy of PV power plants.
To assess the quality of PV panels, there are four basic detection methods [
12], which can give an objective view of the technical condition of PV panels. For each detection method it is primarily required to quickly assess the evaluation of operational parameters and carry out a simple operational analysis.
2.1. Electroluminescence
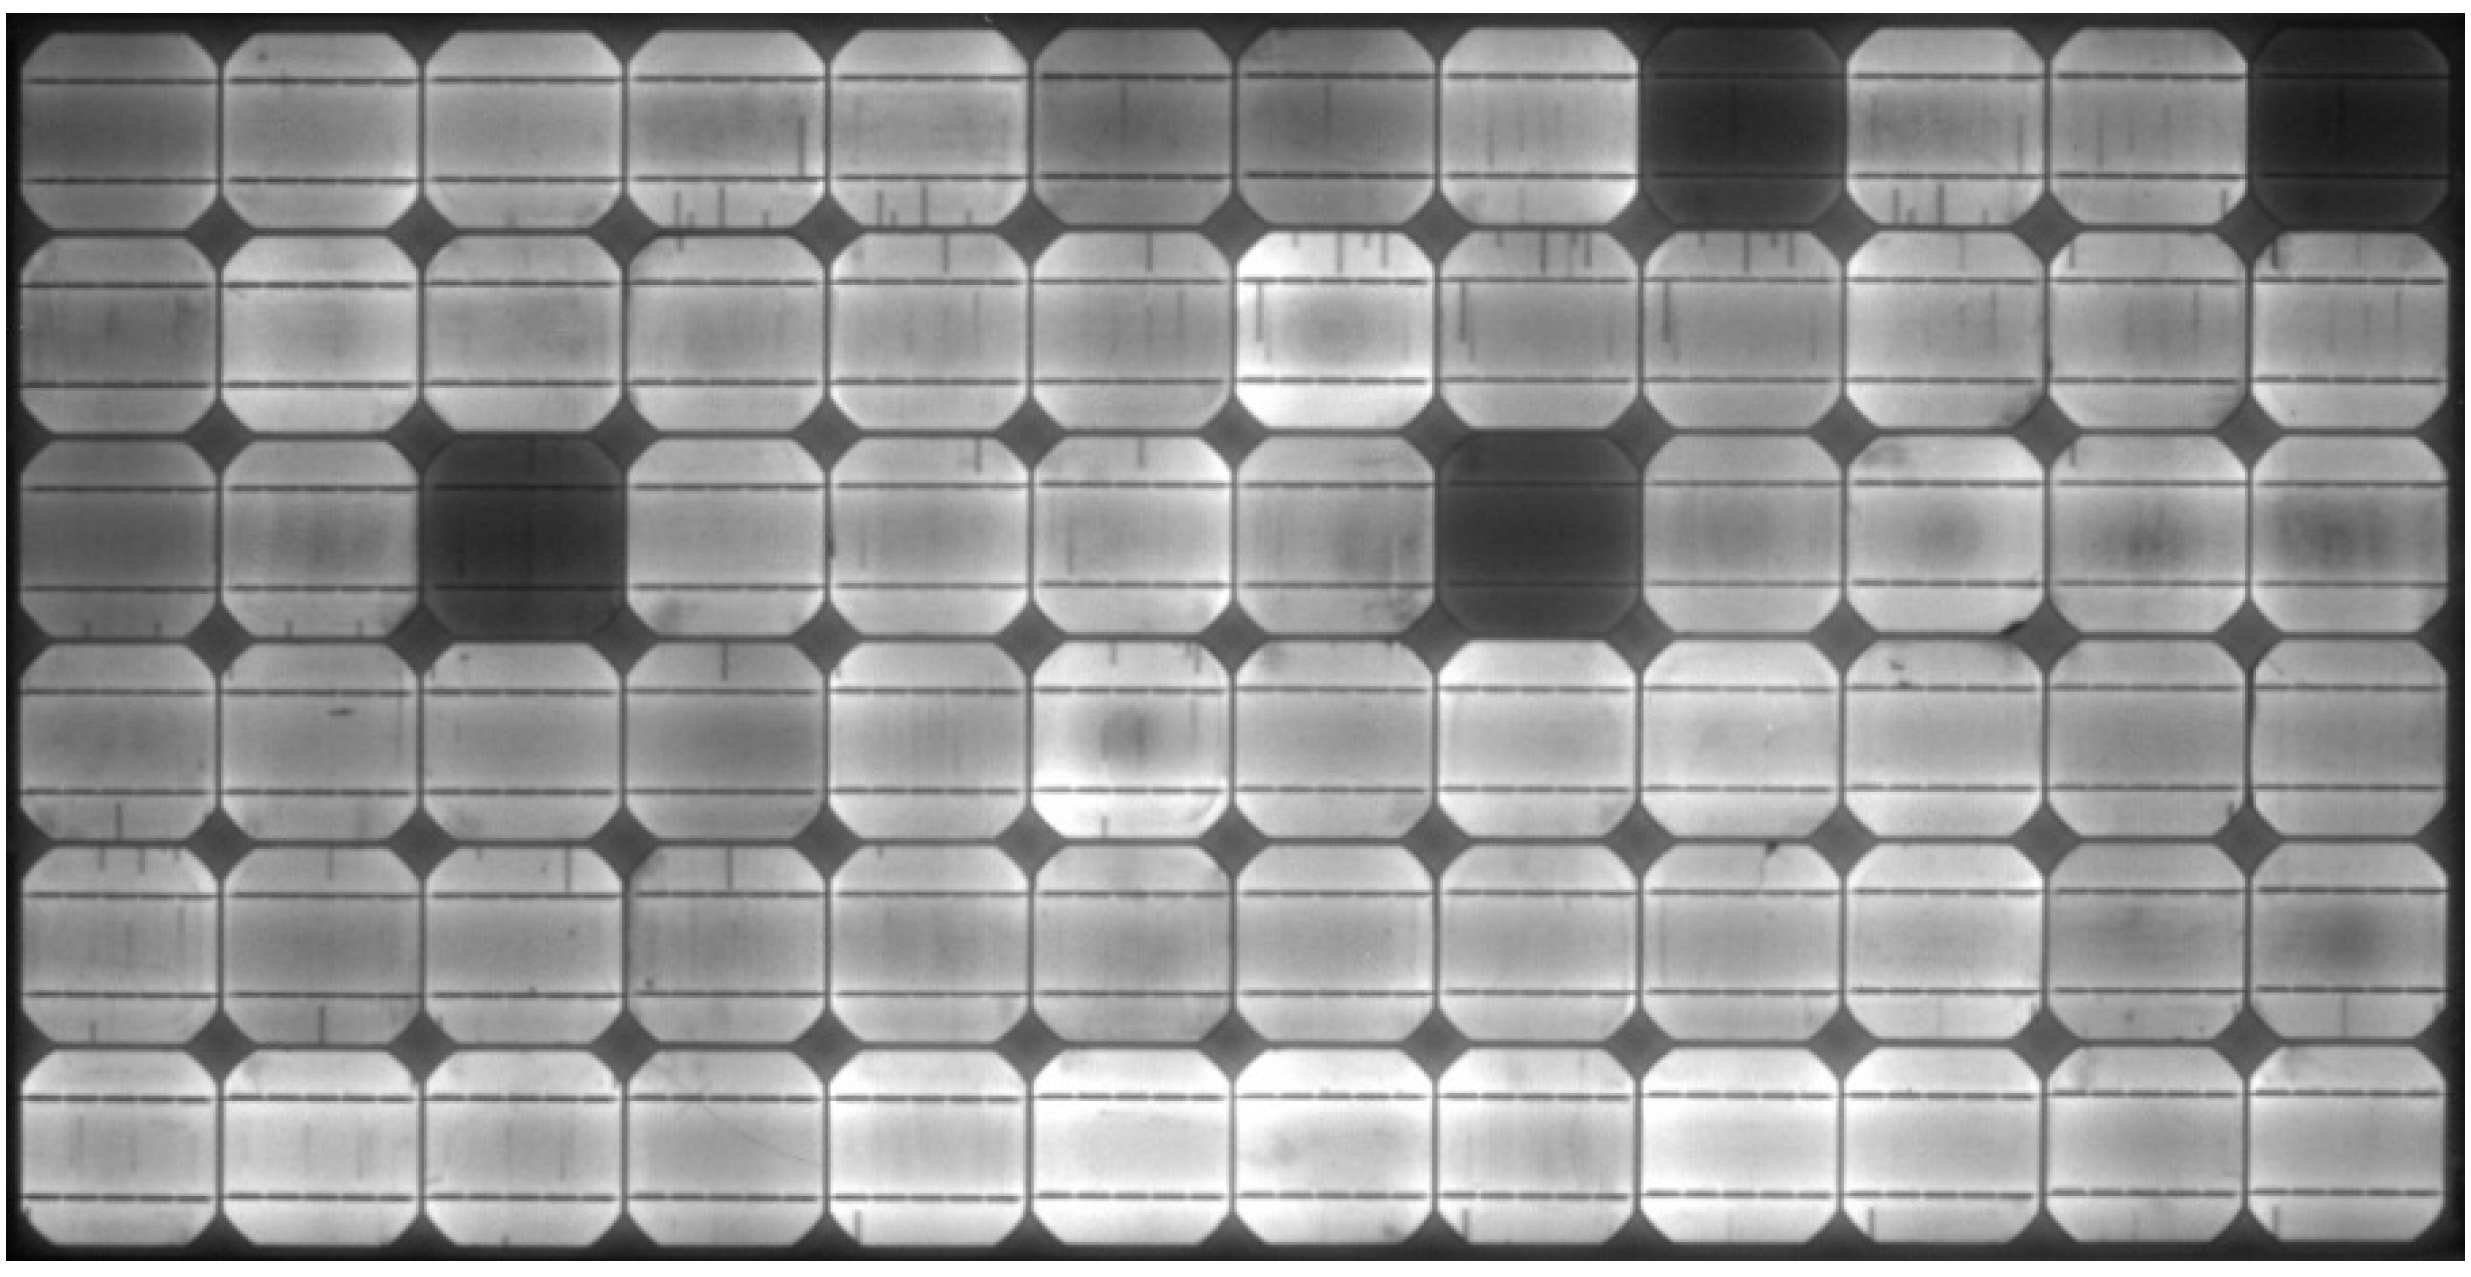
This method allows detecting material and production disorders of PV panels. Using electroluminescence, it is possible to both evaluate the quality of the PV panel production process and identify possible defects caused by further damage to panels, for example by their manipulation.
An advantage of this method in comparison with other methods is that it can reveal hidden defects which are undetectable by other methods. A certain disadvantage is the demanding testing in this case. For illustration,
Figure 3 gives the result of applying this method to a PV panel. In the picture, obvious defective segments of the PV panel can be seen.
Figure 3.
PV panel with visible defects of internal structure [
12].
Figure 3.
PV panel with visible defects of internal structure [
12].
2.2. Infrared Thermography (IRT)
Infrared thermography (IRT) is suitable for fast analysis of thermal field distribution on the surface of the object being measured. This method seems to be convenient when diagnosing PV panels. It allows a fast detection of defects on a PV panel as regards its physical characteristics.
Because of the serial connection of each cell, the same current flows through all the cells—damaged cells then operate with a higher current than their short-circuit current, which can lead to operation with “negative” OP, and the cells thus become burdens, which create “hot spots” on the panel. In addition to the decreased performance of the panel, the panel is locally overheated, which significantly reduces its lifetime and, at the same time in such a faulty panel the performance of all the other modules involved in the same branch is also negatively affected.
Infrared thermography may therefore reveal problematic spots in the PV module such as faults in bypass diodes, mechanically damaged cells, hot spots, faulty contact points, etc.
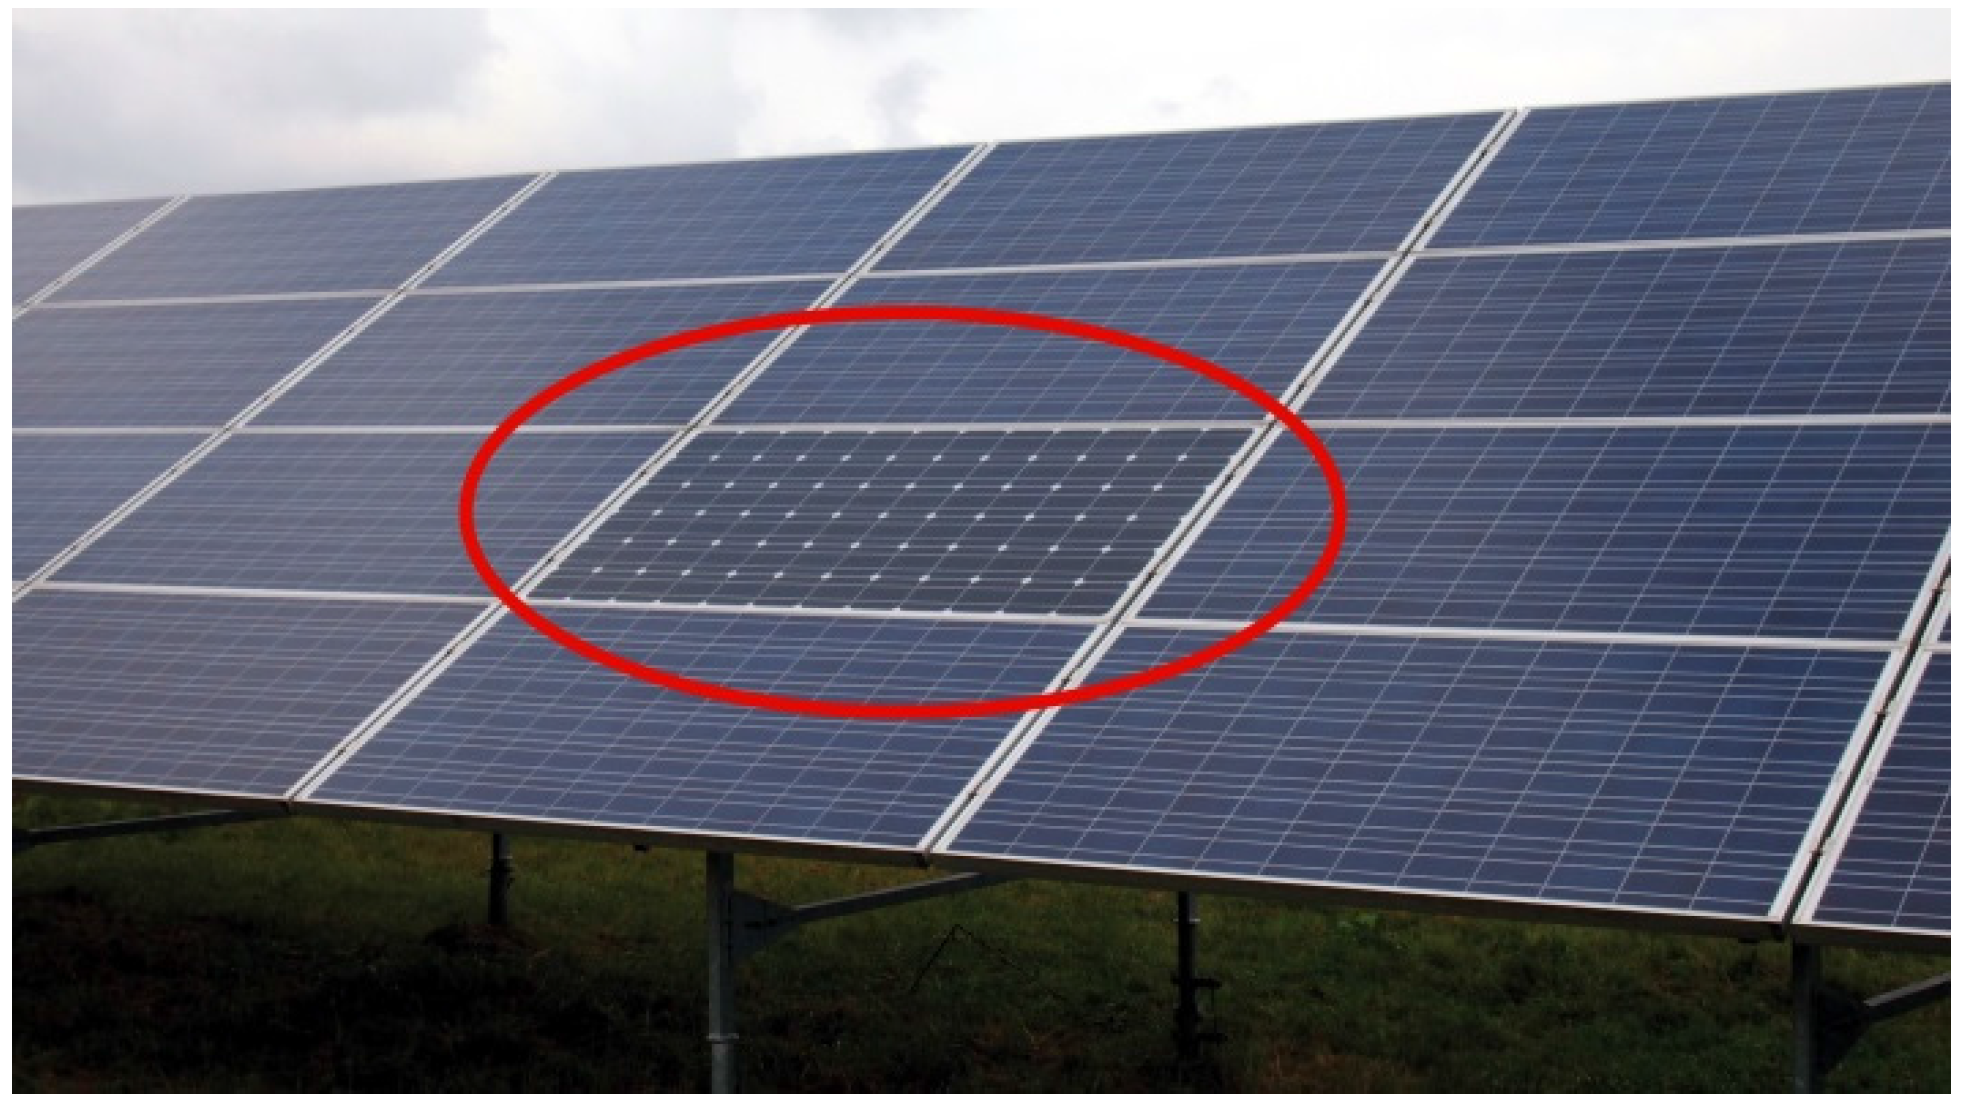
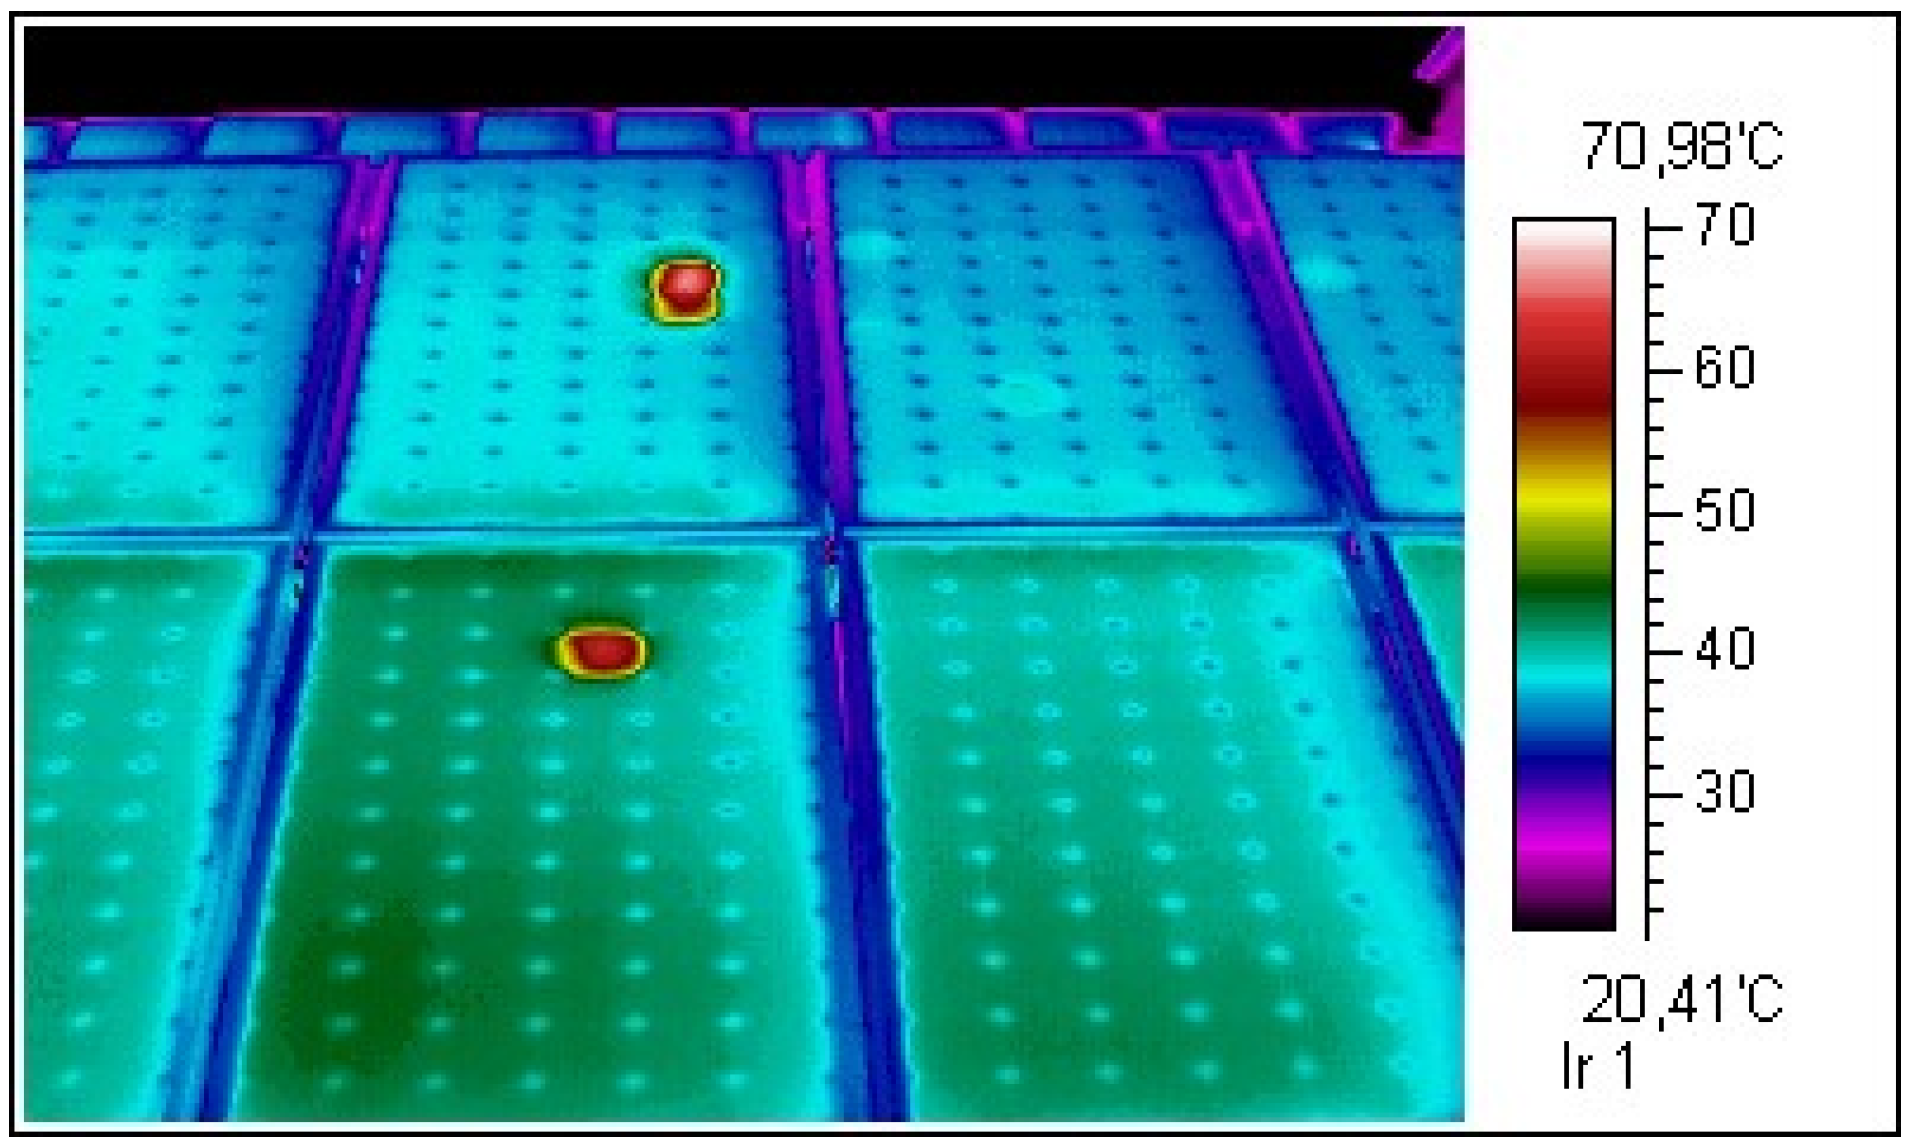
As an example of the utilization of IRT we present the results of measurements on a PV roof installation. The result of the performed operational IRT measurement is the detection of defective parts of each PV panel within the PV power plant. Out of the total amount of 83 pieces of PV panels, 13 defective panels were detected. In
Figure 4 and
Figure 5 there are visibly marked defect areas on selected PV panels. In
Figure 5 two panels are presented, which proved to be totally faulty and thus influenced the decrease of PV power plant performance the most.
Figure 4.
Defects of PV panels identified by infrared thermography (IRT) analysis [
13].
Figure 4.
Defects of PV panels identified by infrared thermography (IRT) analysis [
13].
Figure 5.
Defective panels identified by IRT analysis [
13].
Figure 5.
Defective panels identified by IRT analysis [
13].
This methodology provides easily interpreted information about the PV module and can simultaneously detect the occurrence of future risks.
2.3. Flash Test
Flash test is a fundamental method for measuring the performance characteristics of PV panels. The output of measuring is a set of data, which are determined by output peak power, open circuit voltage, short circuit current, operating voltage, current, or power and efficiency.
This method is however demanding as regards meeting the testing conditions, which results in that it is hardly usable for operation measuring. The panels are tested using this method in standard test conditions (STC), which are declared by IEC Standards—intensity of solar radiation I = 1000 W·m−2, air mass AM = 1.5, temperature T = 25 °C.
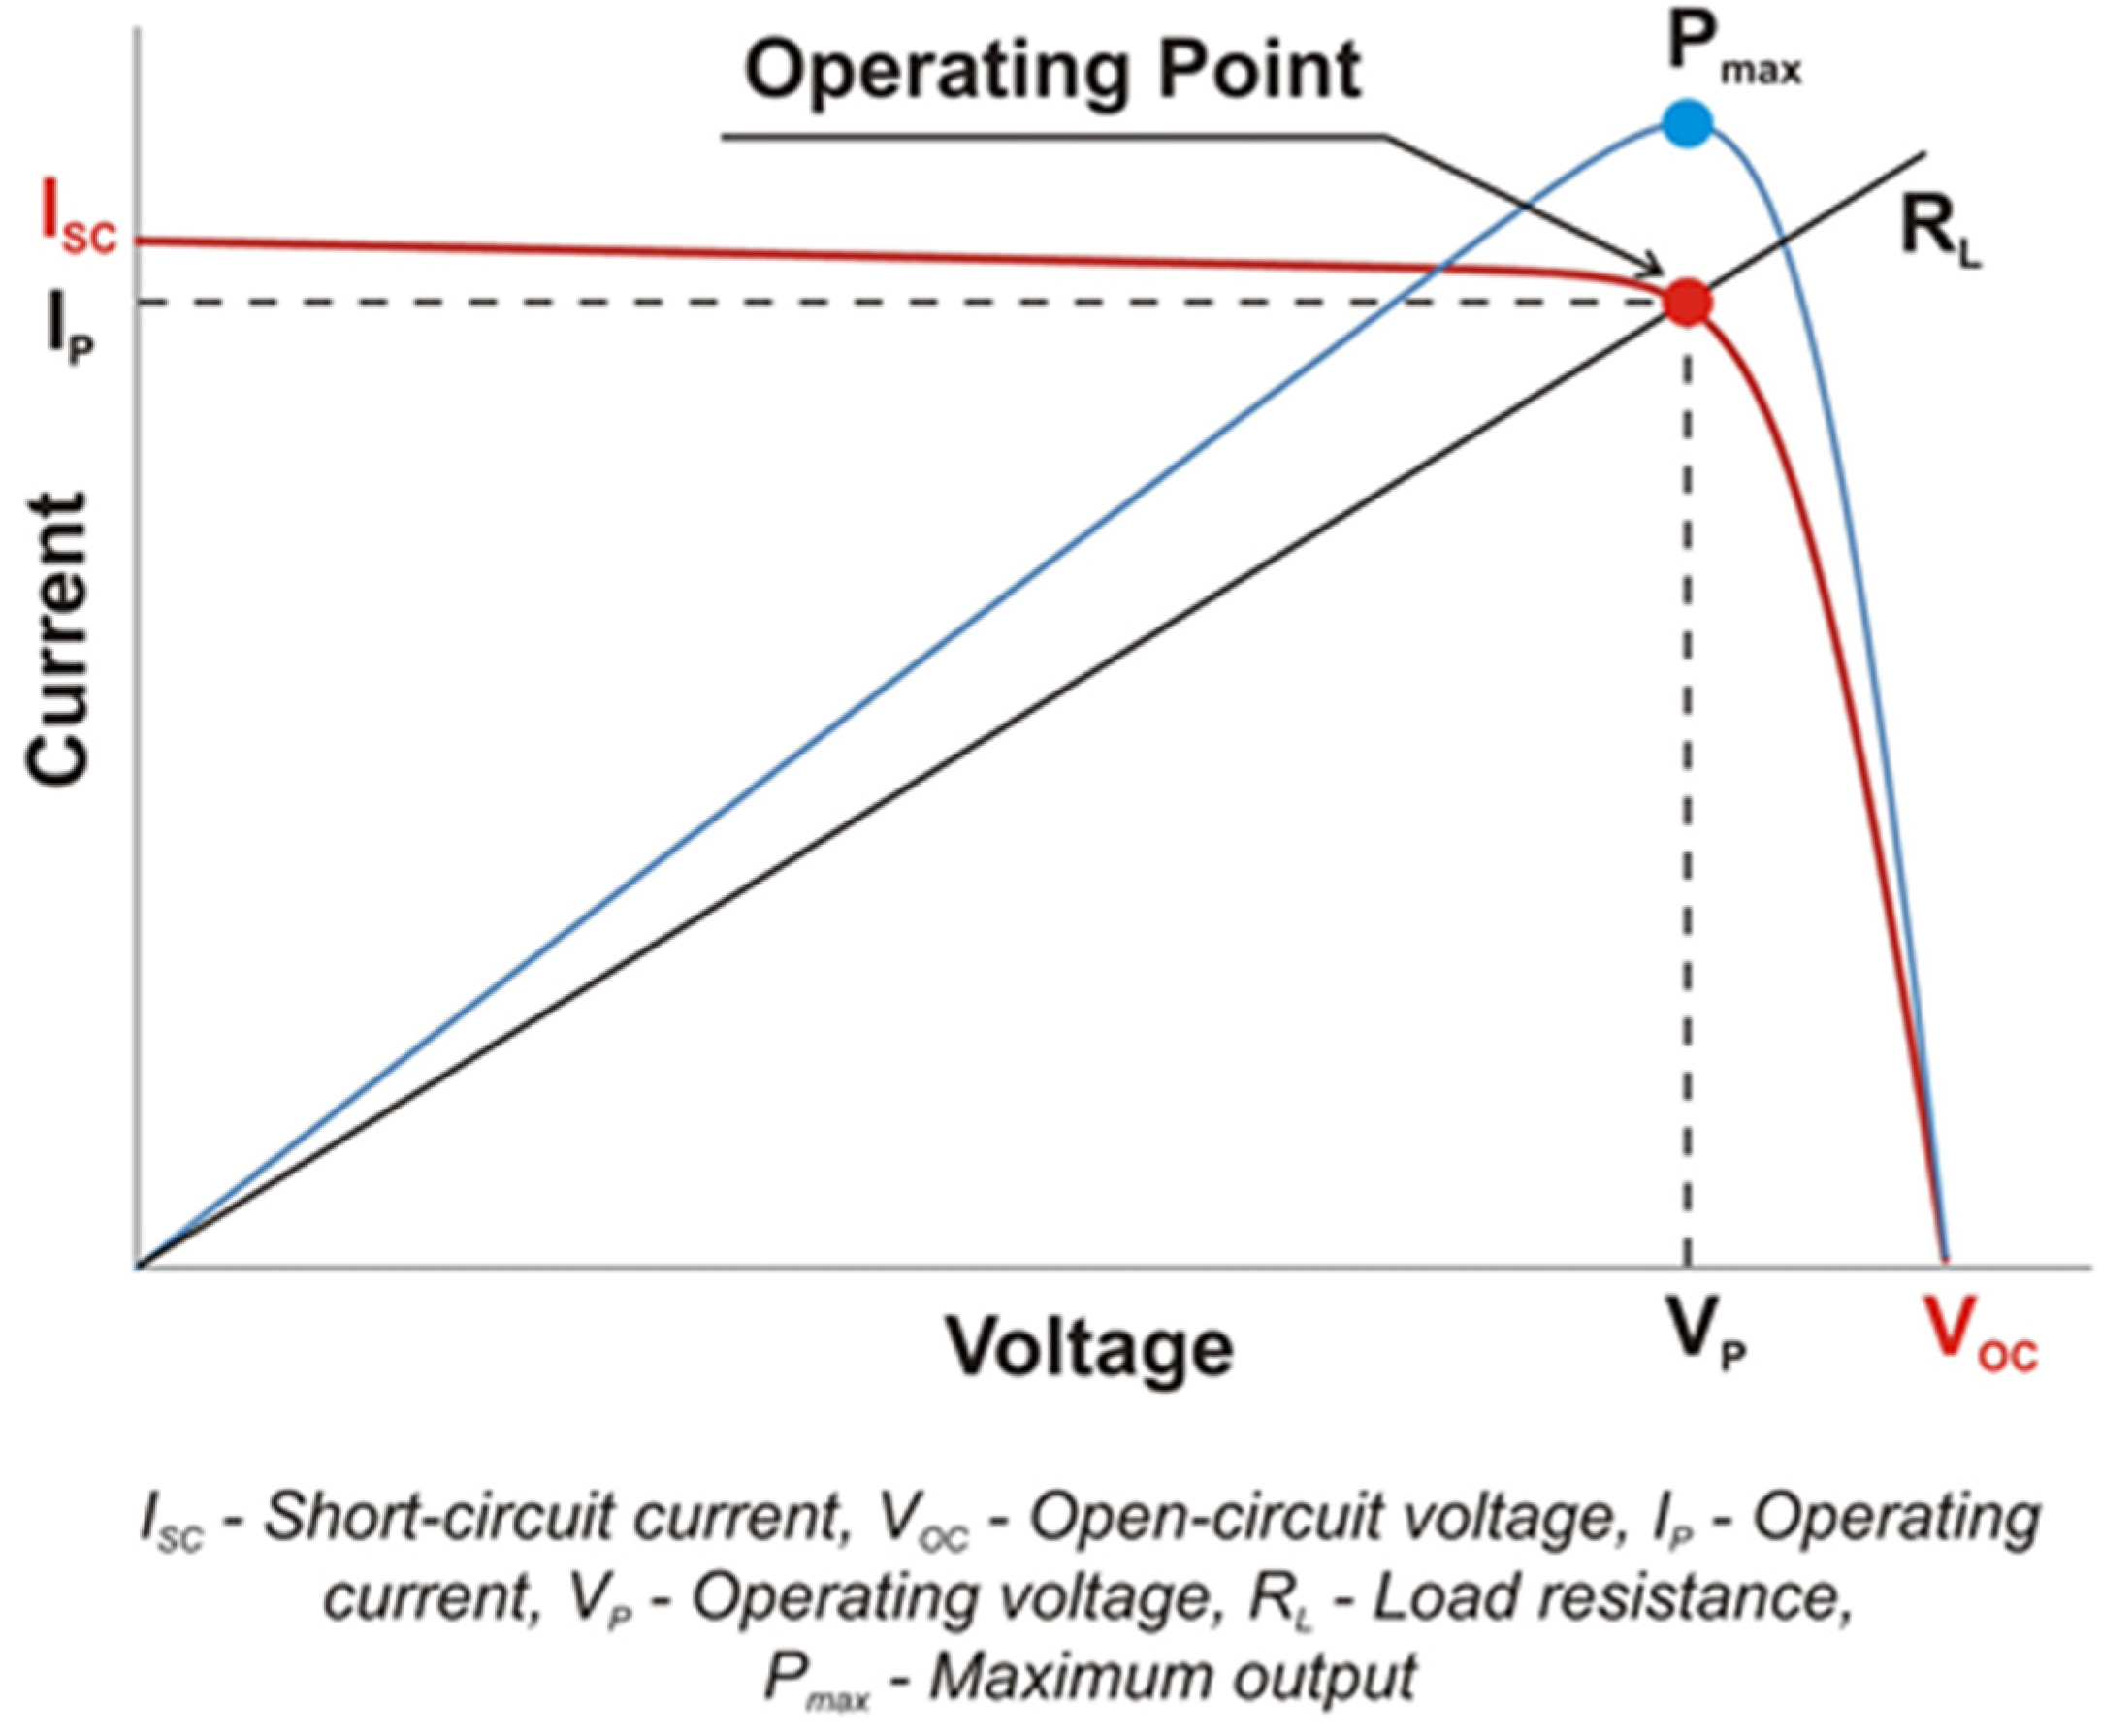
2.4. Current-Voltage (I-V) Characteristics Measuring
PV module can be described as a simple semiconductor diode, on which it is relatively easy to measure the current-voltage (
I-
V) characteristic (
Figure 6). It is a diagnostics method that quantifies the instantaneous measured performance parameters of PV panels. The result of this measurement is a graphical representation of the
I-V characteristics within the working conditions and the conversion according to STC.
Figure 6.
Basic current-voltage (
I-V) characteristic of PV panel [
10].
Figure 6.
Basic current-voltage (
I-V) characteristic of PV panel [
10].
3. Potential Induced Degradation (PID)
In connection with efforts to increase the efficiency of energy production from PV power plants in the CR a discussion began at the end of 2014 about the problem of performance degradation of PV modules as a consequence of the high voltage stress (potential induced degradation (PID)). PID is a phenomenon that has been in existence for several years. It is a problem occurring on many PV panels and resulting in downgraded performance of solar panels. PID was first recognized in the 1970s and from then on, a lot of studies have been geared towards assessing the causes of this occurrence. Based on studies carried out by several significant institutions (NREL—National Renewable Energy Laboratory, SolarEnergy, EERE, PI Berlin) the conditions and causes of PID have been defined [
14]:
Environmental factors.
- ○
Relative humidity.
- ○
Temperature.
System factors.
- ○
At the system level, the most significant impacts are the modules voltage potential and sign, which depend on both the module position in the array and the system grounding topology. There are numerous considerations affecting the system and inverter classification, but for the purposes of PID, the inverter can be classified based on the voltage occurring in the arrays. PID is most often associated with a negative voltage potential to ground.
Module factors.
- ○
The choice of glass, encapsulation, and diffusion barriers has all been found to have an impact on PID.
Cell factors.
The domain pathway to cause PID is the front sheet (between the glass and the frame of the panel). Higher leakage currents can be caused by water entering the solar module and causing the encapsulation material to become more conductive. So far the potential degradation mechanism has not been monitored by the typical PV tests listed in IEC 61215 [
15,
16,
17]. It is known that metal ions such as Na
+ formed from the oxides of the module glass can drift toward the cell if the cell is biased negatively [
18].
But there is also the standard IEC 61646. Both standards have a similar testing sequence and they differ only in the requirements for power degradation. In the IEC 61646 standard a further final investigation is included to evaluate the effect of power degradation due to light exposure (LID—Light Induced Degradation).
As the current progress of PID detection has become more desirable, simple in-field methods are tested which can adequately confirm the PID. Measuring the insulation resistivity by using high voltage can be one of the ways that can indicate PID [
19].
Another way is to use intelligent PV module analyzers (such as TIGO), where the actual power of each panel in the string is evaluated and the decrease in power production is automatically detected. A disadvantage of this solution is the additional investments in the installation.
Considered as a compromise, can be the on-site measurements of operational parameters, which, if properly done, can indicate multiple faults within the PV plant installation.
Based on the available information, there have been several operational measurements at various PV installations in the country. The results of these measurements and subsequent analyses indicate that the incidence of PID in our conditions is very low. Demonstration of the analytical process of measurement and discussion of the results are given in the next section of this paper.
4. Operational Measurements
In order to detect the faults and defect in the PV plant installations, a proper inspection and validation of the available documentation should be performed prior to the measurements.
The following methods are generally used for the diagnostics of PV panels:
Infrared camera—Suitable for detecting defects at the cell level of the PV panel.
Electroluminescence imaging—Used for detecting defects in the structure of the cell which are not detectable by visual inspection.
Flash tester—Allows I-V curve measurements under artificial and controlled conditions.
Operational I-V characteristics measurement—Uses special analyzers to determine the panel parameters.
4.1. Inspection according to the ČSN EN 62446 Standard
The ČSN EN 62446 Standard [
16,
20] sets the basic requirements and a description of the documentation. It describes the procedure for the inspection of DC wiring, surge protectors, AC system, recommendation regarding the setting and wiring of the inverter. Furthermore, there are requirements for safety, signs and labels. During the initial inspection, in the case of lost documentation or periodic inspection, a check of the string wiring and proper polarity, measurement of the voltage at open circuit and short circuit current should be performed. Correct settings of the protections should be verified.
Operational measurements to check the maximum power point tracker (MPPT) function [
21,
22,
23], measurement of the parameters at the maximum power point to compare string power with another string or with expected values can be used to analyze the real state of the power plant. The measurements must be performed under stable ambient conditions during the measurements. The standard IEC 61215 considers the condition stable, when the change in the irradiation is less than 5% during the measurement.
The output of the initial or periodic inspection is the protocol, with the measured values and completed checklist. The model protocol and checklist are appended to the ČSN EN 62446 standard. The infrared camera testing is recommended as an additional method for inspection.
4.2. Inspection Results of Selected Photovoltaic (PV) Plants
Multiple inspections were performed by the research team in the first half of 2015 in order to study the problematic of defects and degradation of PV power plants in the CR. Locations of selected PV plants, which are discussed below, can be seen in
Figure 7.
Figure 7.
Locations of the inspected PV plants.
Figure 7.
Locations of the inspected PV plants.
4.2.1. Description of the Inspection Performed on the 658 kWp Photovoltaic (PV) Plant
The inspection was performed due to lower revenues, which could have been caused by PID. The PV plant contained polycrystalline PV panels connected in strings of 17-18 panels. Neither of the DC poles was grounded. During the inspection the I-V curves of the individual strings were measured. In the case of suspicious strings with lower power, individual panels in the affected string were measured.
To measure the I-V curves the Metrel MI3108 Eurotest PV was used, which measured the I-V curves, temperature of the panel, and irradiation. The solar radiation intensity is measured using external sensors (calibrated PV cell in the panel plane and thermal contact sensor placed on the rear side of the panel), which form part of the Metrel MI3108 measuring instrument. For the evaluation of OP a Kipp&Zonen CMP21 externally calibrated pyranometer was used. The total aggregated energy of incident solar radiation was established on the basis of valid methodology for the determination of OP, namely in the case that several measuring points are used within one locality. The output value of energy from PV plant was obtained from a certified meter (electrometer) placed within the transfer site in each installation.
The results of measuring the parameters are shown in
Table 1. The measurement was performed at the installation site and, in agreement with the methodology according to the IEC 61215 standard, the values measured were converted to STC based on the thermal coefficients given in the panel datasheet. It can be seen that the panel parameters do not match the nominal values. The
Isc is higher than it is intended to be. Also, the maximum power is about 7% lower than its nominal value.
Table 1.
Nominal and measured parameters of the tested PV panel at standard test conditions (STC) [
24].
Table 1.
Nominal and measured parameters of the tested PV panel at standard test conditions (STC) [24].
| Nominal Parameters | Value | STC Parameters | Value |
|---|
| Isc,nom | 7.98 A | Isc,STC | 8.59 A |
| Uoc,nom | 43.8 V | Uoc,STC | 43.1 V |
| Impp,nom | 7.63 A | Impp,STC | 7.96 A |
| Umpp,nom | 36.7 V | Umpp,STC | 33.0 V |
| Pmpp,nom | 280 W | Pmpp,STC | 260 W |
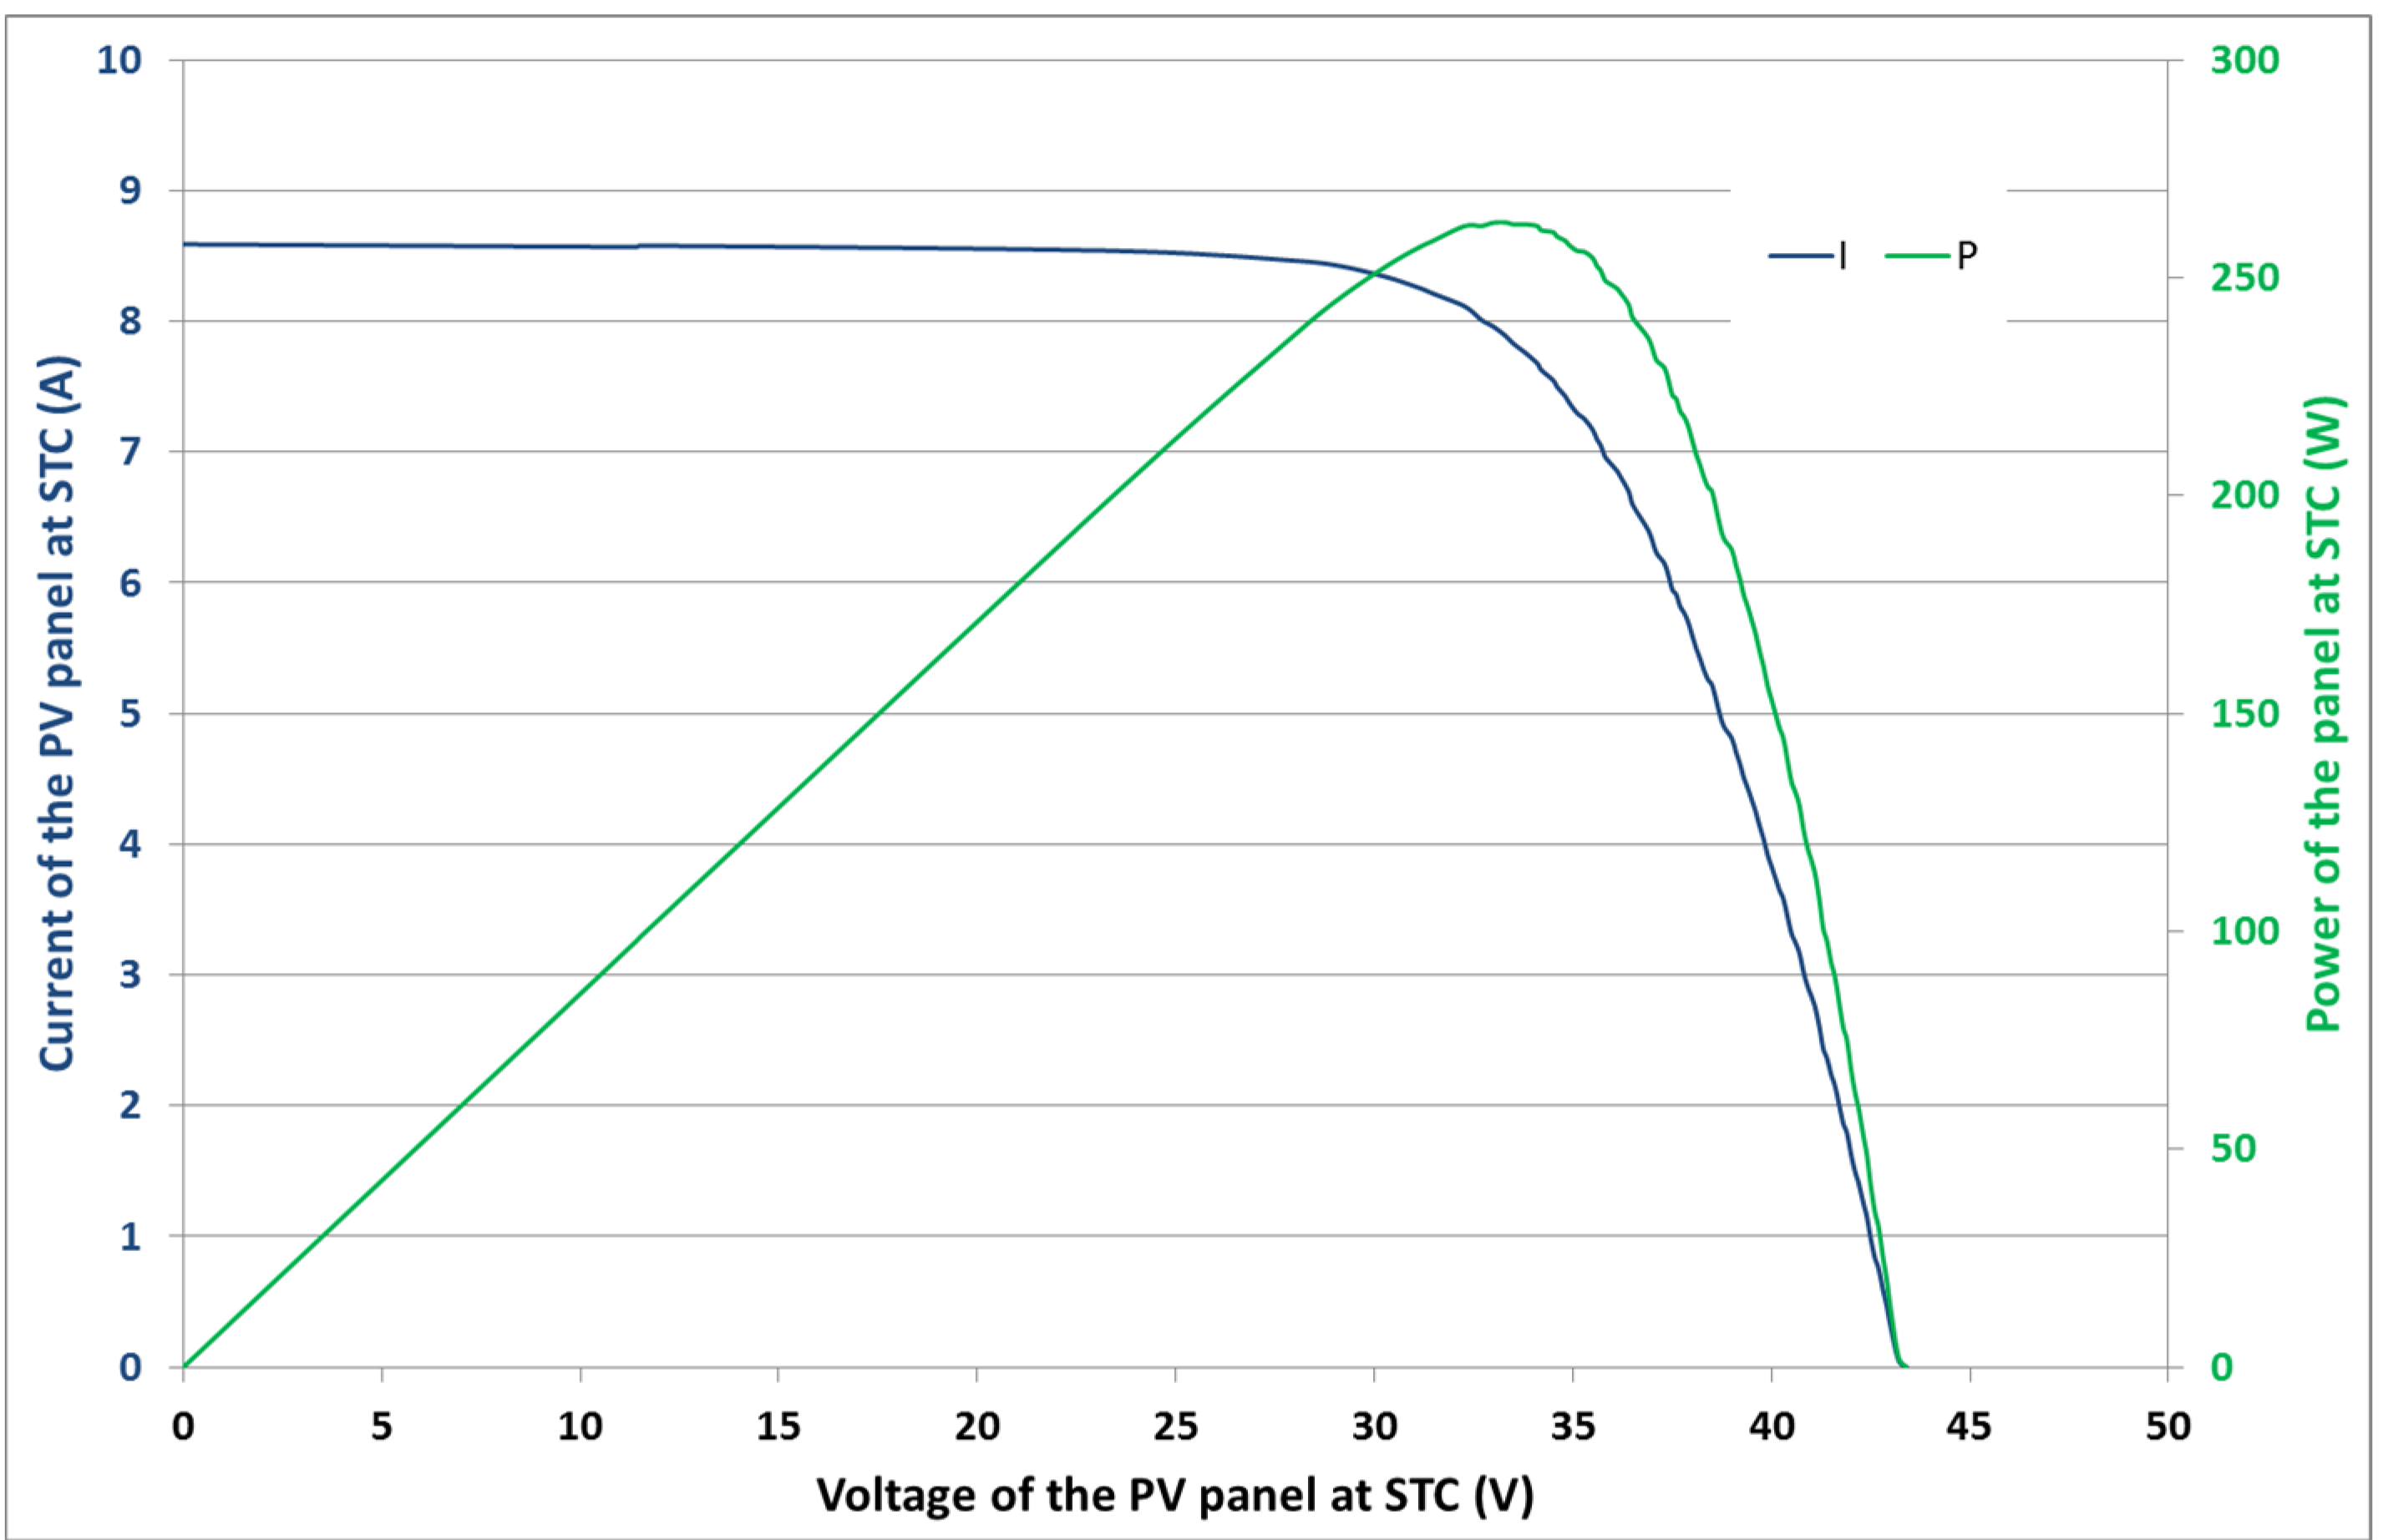
An example of the
I-V curve measured is shown in
Figure 8. There is no mismatch on the curve caused by the defects or shadowing of the panel.
Figure 8.
I-V curve of the tested PV panel [
24].
Figure 8.
I-V curve of the tested PV panel [
24].
The results of measuring power at the maximum power point (
Pmpp) recalculated according to ČSN EN 62446 to STC values and the percentage difference compared to the nominal value of the panel, which is 280 Wp, are shown in
Table 2.
The results for the 1st string indicate no problem in the string. The decrease in PSTC varies randomly and probably is caused by the differences during the manufacture.
The 2nd string indicated lower power in string measurements. When measuring the individual panels it was found that the string contained defective panel. The difference compared to its nominal value is 75%. The bypass diodes of the panel were working properly and therefore it was recommended to replace this defective panel.
Table 2.
Results of measuring the
PSTC of individual panels in selected strings in location 1 [
24].
Table 2.
Results of measuring the PSTC of individual panels in selected strings in location 1 [24].
| String 1 | String 2 | String 3 |
|---|
| PSTC (Wp) | Δ P (%) | | PSTC (Wp) | Δ P (%) | | PSTC (Wp) | Δ P (%) |
|---|
| Panel 1 | 269.3 | −3.82 | Panel 1 | 258.0 | −7.86 | Panel 1 | 254.3 | −9.18 |
| Panel 2 | 263.3 | −5.96 | Panel 2 | 262.0 | −6.43 | Panel 2 | 258.2 | −7.79 |
| Panel 3 | 258.7 | −7.61 | Panel 3 | 257.4 | −8.07 | Panel 3 | 259.6 | −7.29 |
| Panel 4 | 259.4 | −7.36 | Panel 4 | 262.0 | −6.43 | Panel 4 | 259.7 | −7.25 |
| Panel 5 | 262.2 | −6.36 | Panel 5 | 70.0 | −75.00 | Panel 5 | 257.6 | −8.00 |
| Panel 6 | 269.8 | −3.64 | Panel 6 | 259.8 | −7.21 | Panel 6 | 262.1 | −6.39 |
| Panel 7 | 274.8 | −1.86 | Panel 7 | 267.9 | −4.32 | Panel 7 | 259.1 | −7.46 |
| Panel 8 | 288.3 | 2.96 | Panel 8 | 267.0 | −4.64 | Panel 8 | 254.9 | −8.96 |
| Panel 9 | 291.6 | 4.14 | Panel 9 | 262.1 | −6.39 | Panel 9 | 255.1 | −8.89 |
| Panel 10 | 298.6 | 6.64 | Panel 10 | 272.2 | −2.79 | Panel 10 | 254.7 | −9.04 |
| Panel 11 | 281.9 | 0.68 | Panel 11 | 268.4 | −4.14 | Panel 11 | 262.2 | −6.36 |
| Panel 12 | 270.2 | −3.50 | Panel 12 | 271.0 | −3.21 | Panel 12 | 256.5 | −8.39 |
| Panel 13 | 275.1 | −1.75 | Panel 13 | 273.2 | −2.43 | Panel 13 | 260.2 | −7.07 |
| Panel 14 | 267.3 | −4.54 | Panel 14 | 271.3 | −3.11 | Panel 14 | 260.4 | −7.00 |
| Panel 15 | 269.3 | −3.82 | Panel 15 | 270.4 | −3.43 | Panel 15 | 263.9 | −5.75 |
| Panel 16 | 271.2 | −3.14 | Panel 16 | 268.0 | −4.29 | Panel 16 | 265.9 | −5.04 |
| Panel 17 | 271.2 | −3.14 | Panel 17 | 267.5 | −4.46 | Panel 17 | 261.1 | −6.75 |
| Σ | 4 642.2 | - | Σ | 4 328.2 | - | Σ | 4 405.5 | - |
| - | STC power decrease (%) | - |
| −10 | −5 | 0 | 5 | 10 |
The 3rd string exhibited a global decrease in the STC power. This could be caused by the degradation of the panels or dust. Also, a loose connector was detected, which did not provide adequate interconnection.
A random drop in the power of the panels in the string does not indicate the occurrence of PID and is probably due to another cause of technical/operational nature, as given below. What also speaks against the occurrence of PID is the absence of fundamental preconditions for the appearance of this type of degradation such as long-term high relative moisture, high voltage potential to ground, and the type of PV panels used.
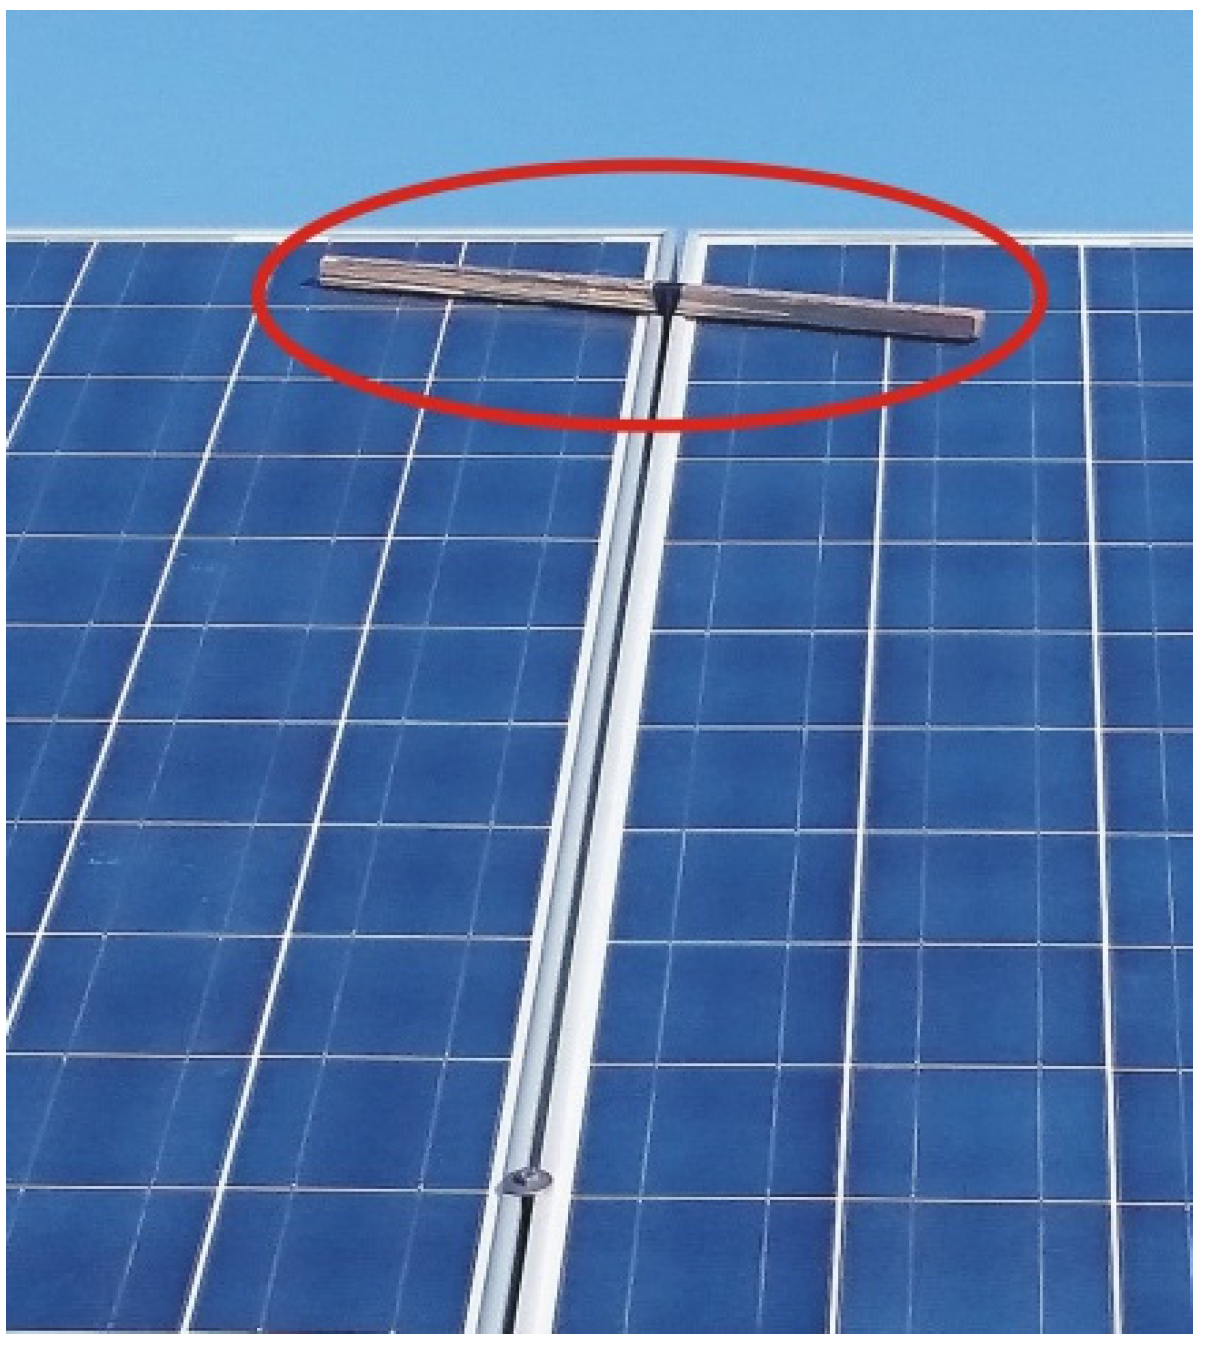
The inspection also confirmed that there are additional defects, maintenance and design errors on the panels. An example of defects and improper mounting can be seen in
Figure 9 and
Figure 10. The error of design is in the parallel interconnection of three strings on each inverter. During the inspection, parallel connections of strings with different numbers of panels in series were detected [
24].
This PV power plant consists of several locations, which together give one of the highest installed powers in the CR.
The performed inspection indicated problems caused by improper maintenance and low-quality design. The calculated performance ratio according to the measured values confirmed that the performance of each location differed and decreased with higher count of detected problems. The calculated OP (according to Equation (1)) is in the range of 83%–86.5%.
Figure 9.
Improper panel mounting [
24].
Figure 9.
Improper panel mounting [
24].
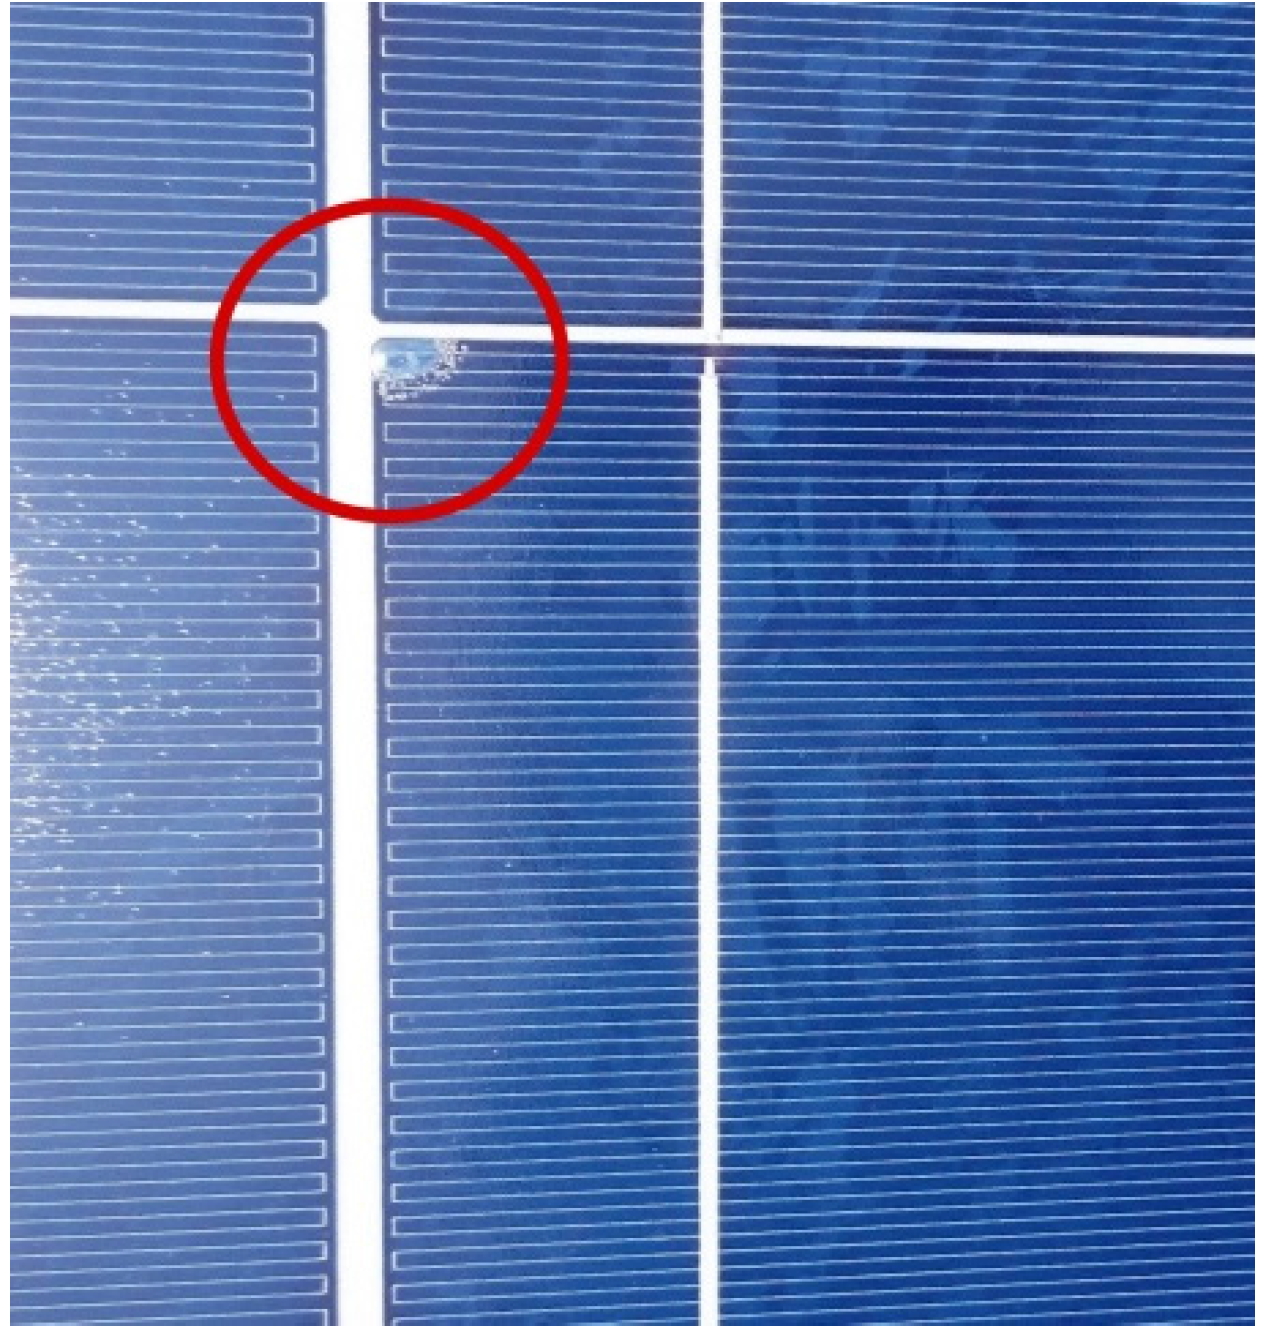
Figure 10.
Delamination in the structure of the panel [
24].
Figure 10.
Delamination in the structure of the panel [
24].
4.2.2. Results of the Inspection Performed on the 55,840 kWp Photovoltaic (PV) Plant
The main detected problems include the wrong interconnection of PV panels, where multi-crystalline and mono-crystalline types of PV panels in one string with significantly different parameters are combined (
Figure 11) [
25].
Figure 11.
Monocrystalline PV panel used in string with Multi-crystalline PV panels of different parameters [
25].
Figure 11.
Monocrystalline PV panel used in string with Multi-crystalline PV panels of different parameters [
25].
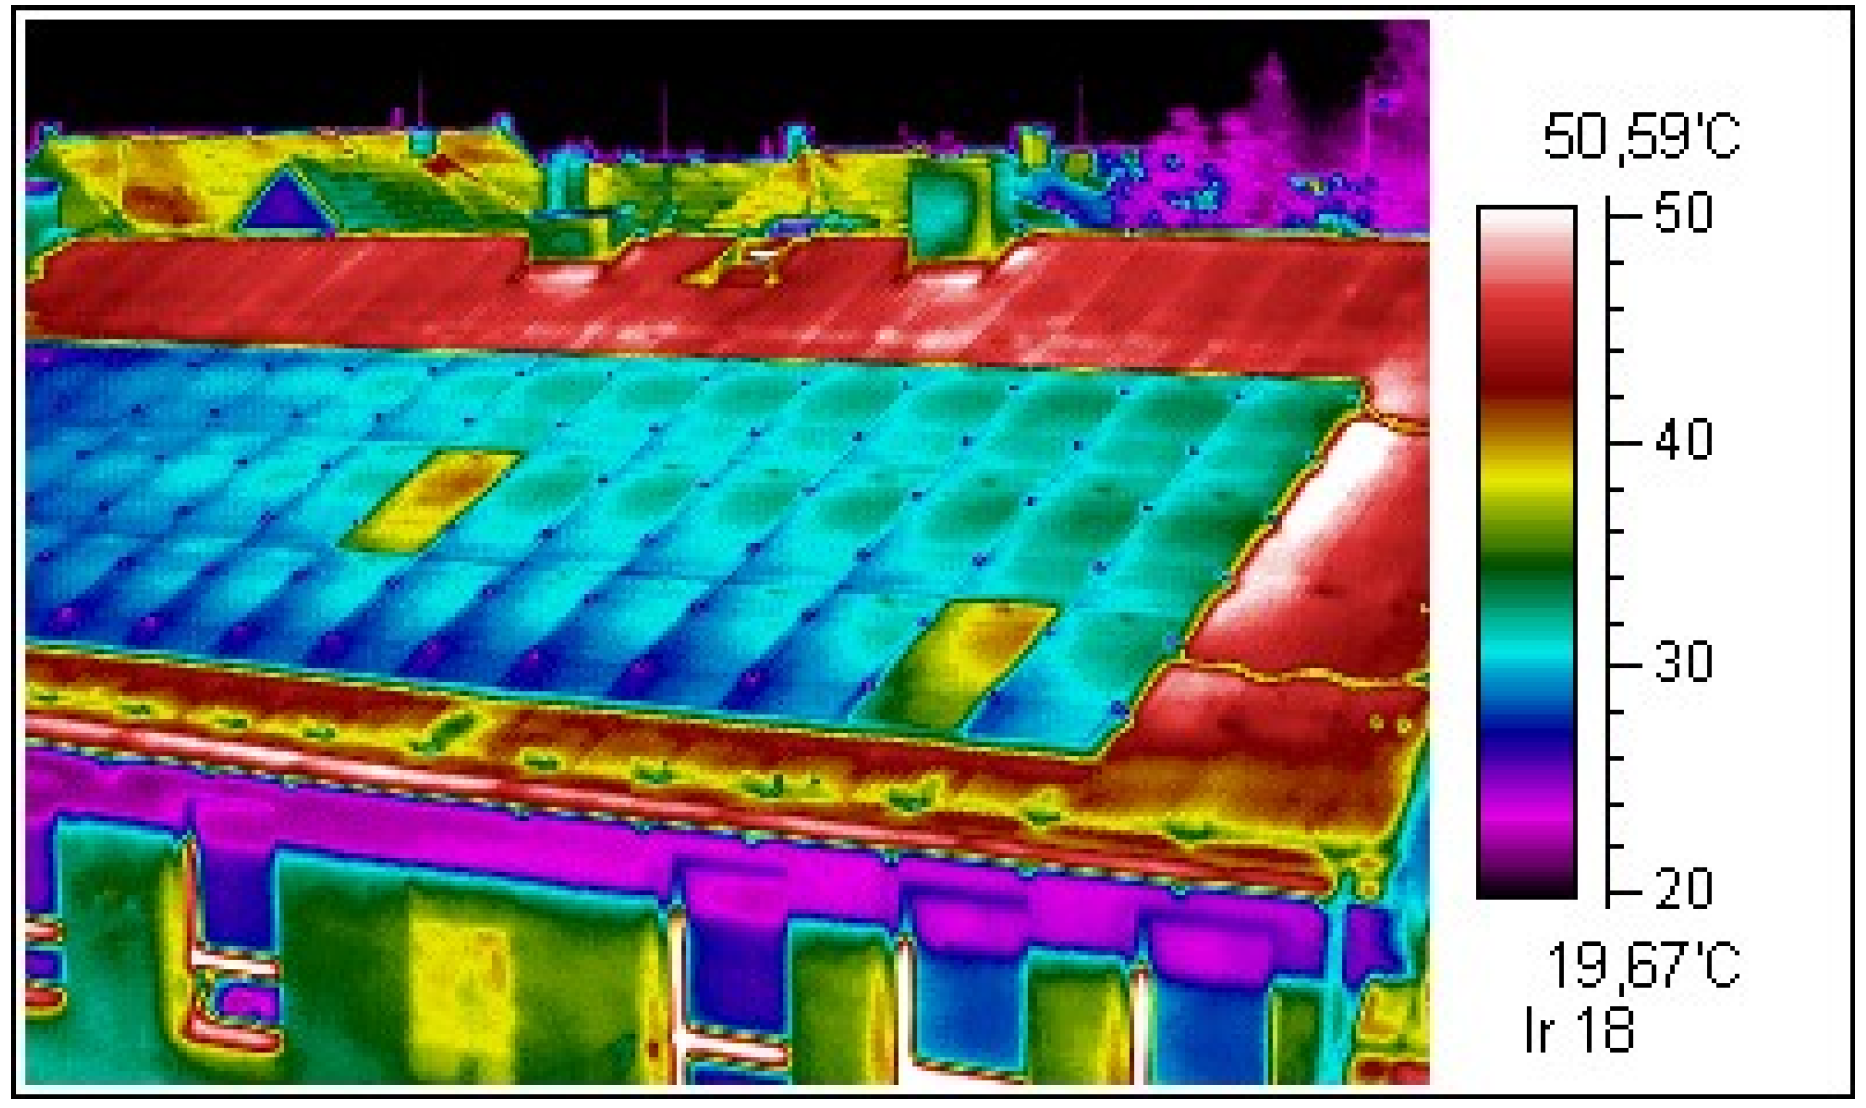
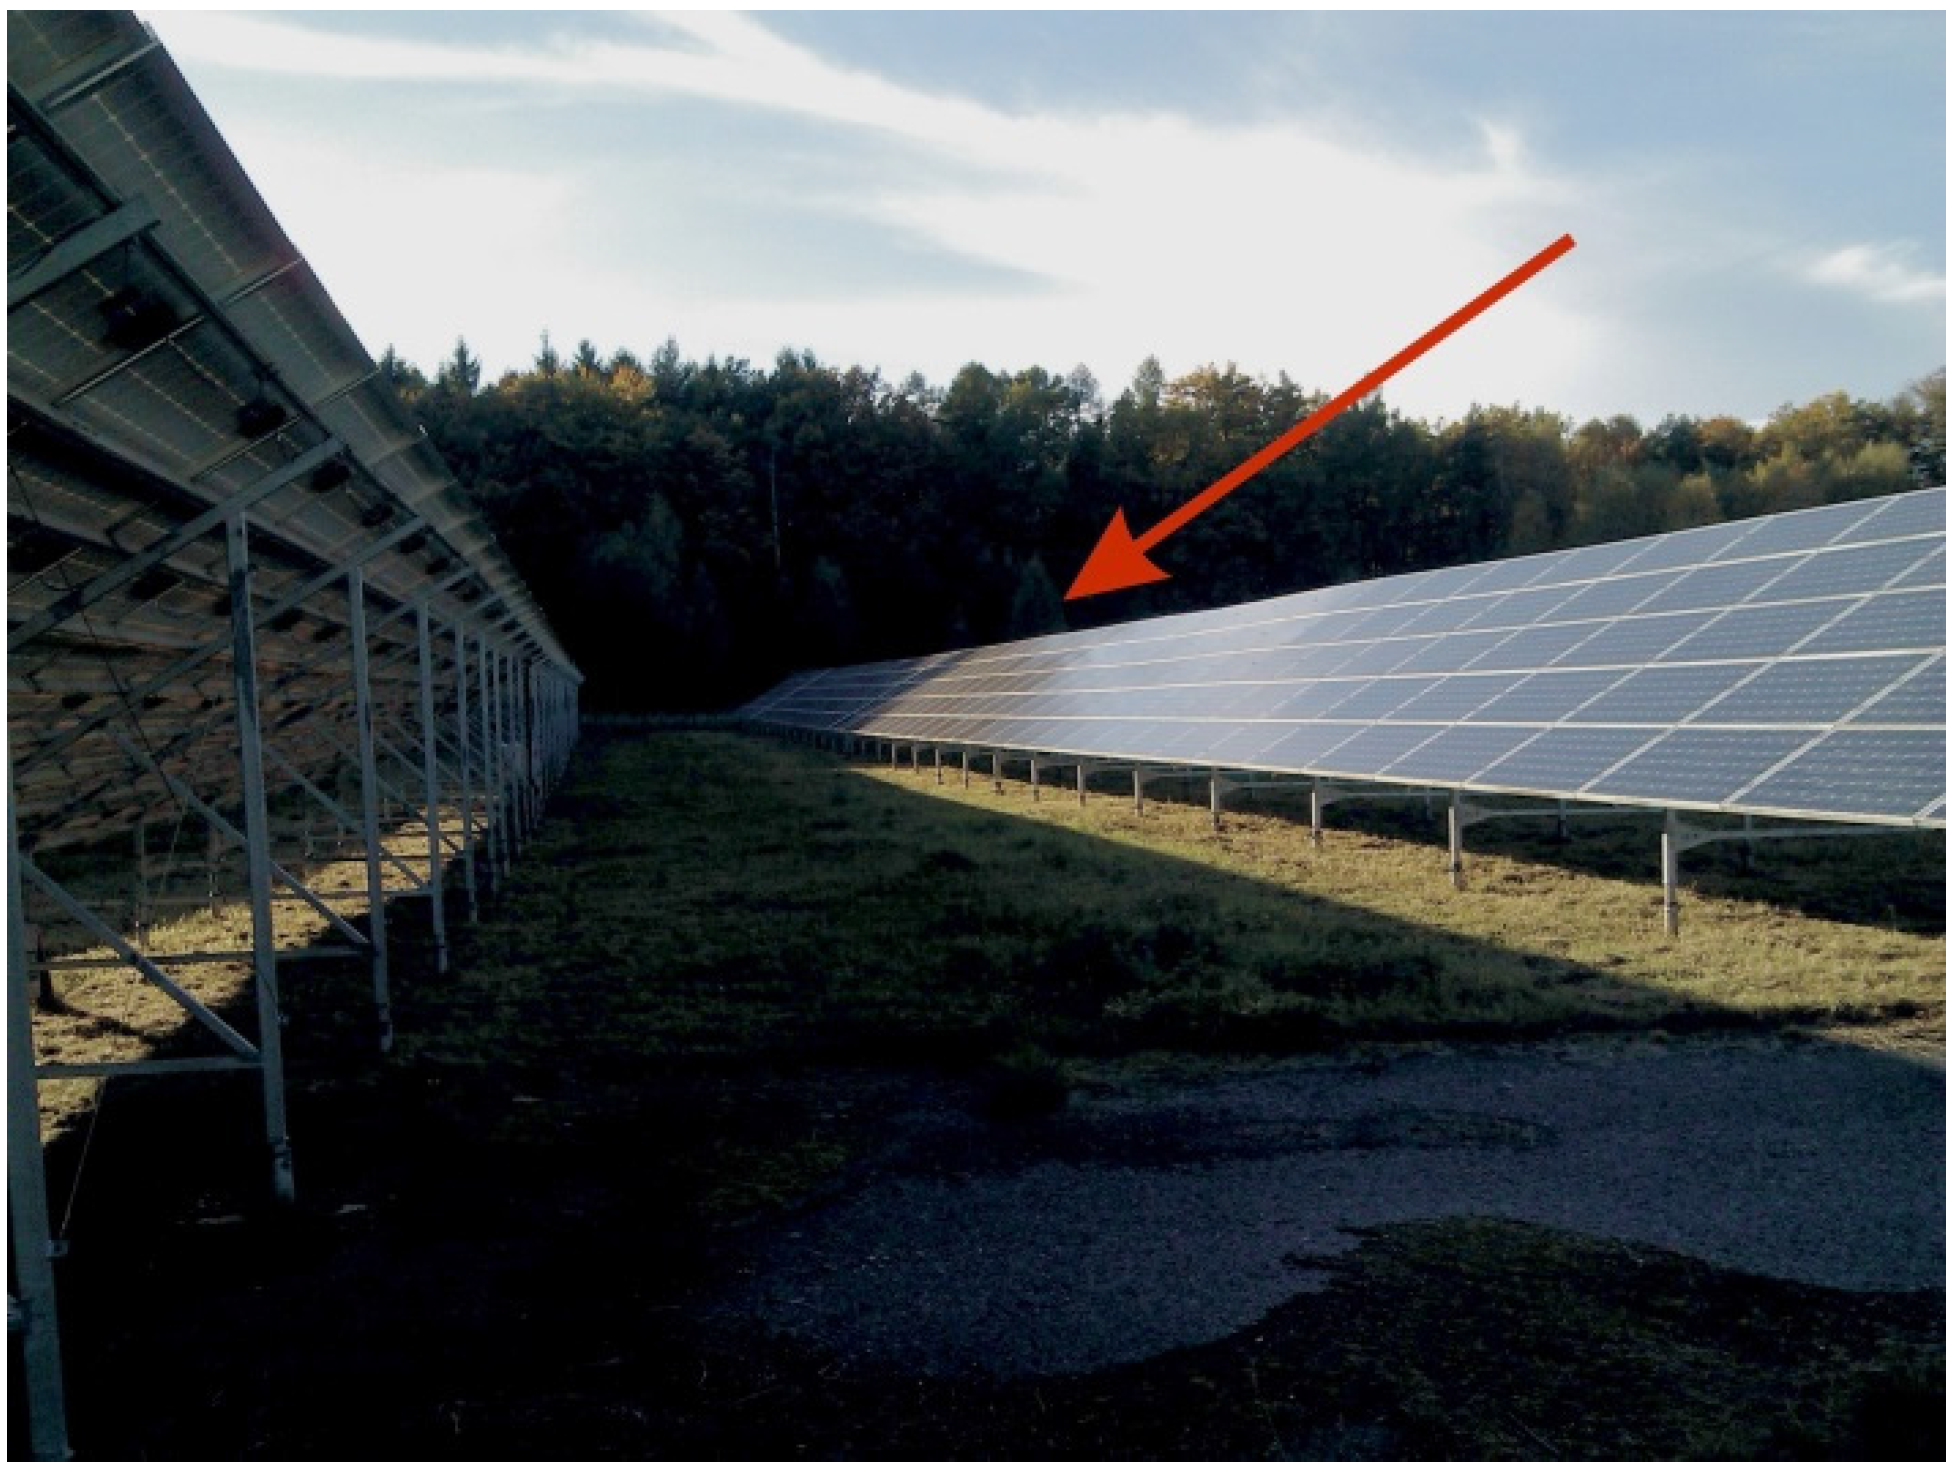
The overshadowing of entire sections of the PV plant by nearby trees is the result of poor design and has a serious impact on the OP (
Figure 12).
Figure 12.
Trees overshadowing the section of the PV plant [
25].
Figure 12.
Trees overshadowing the section of the PV plant [
25].
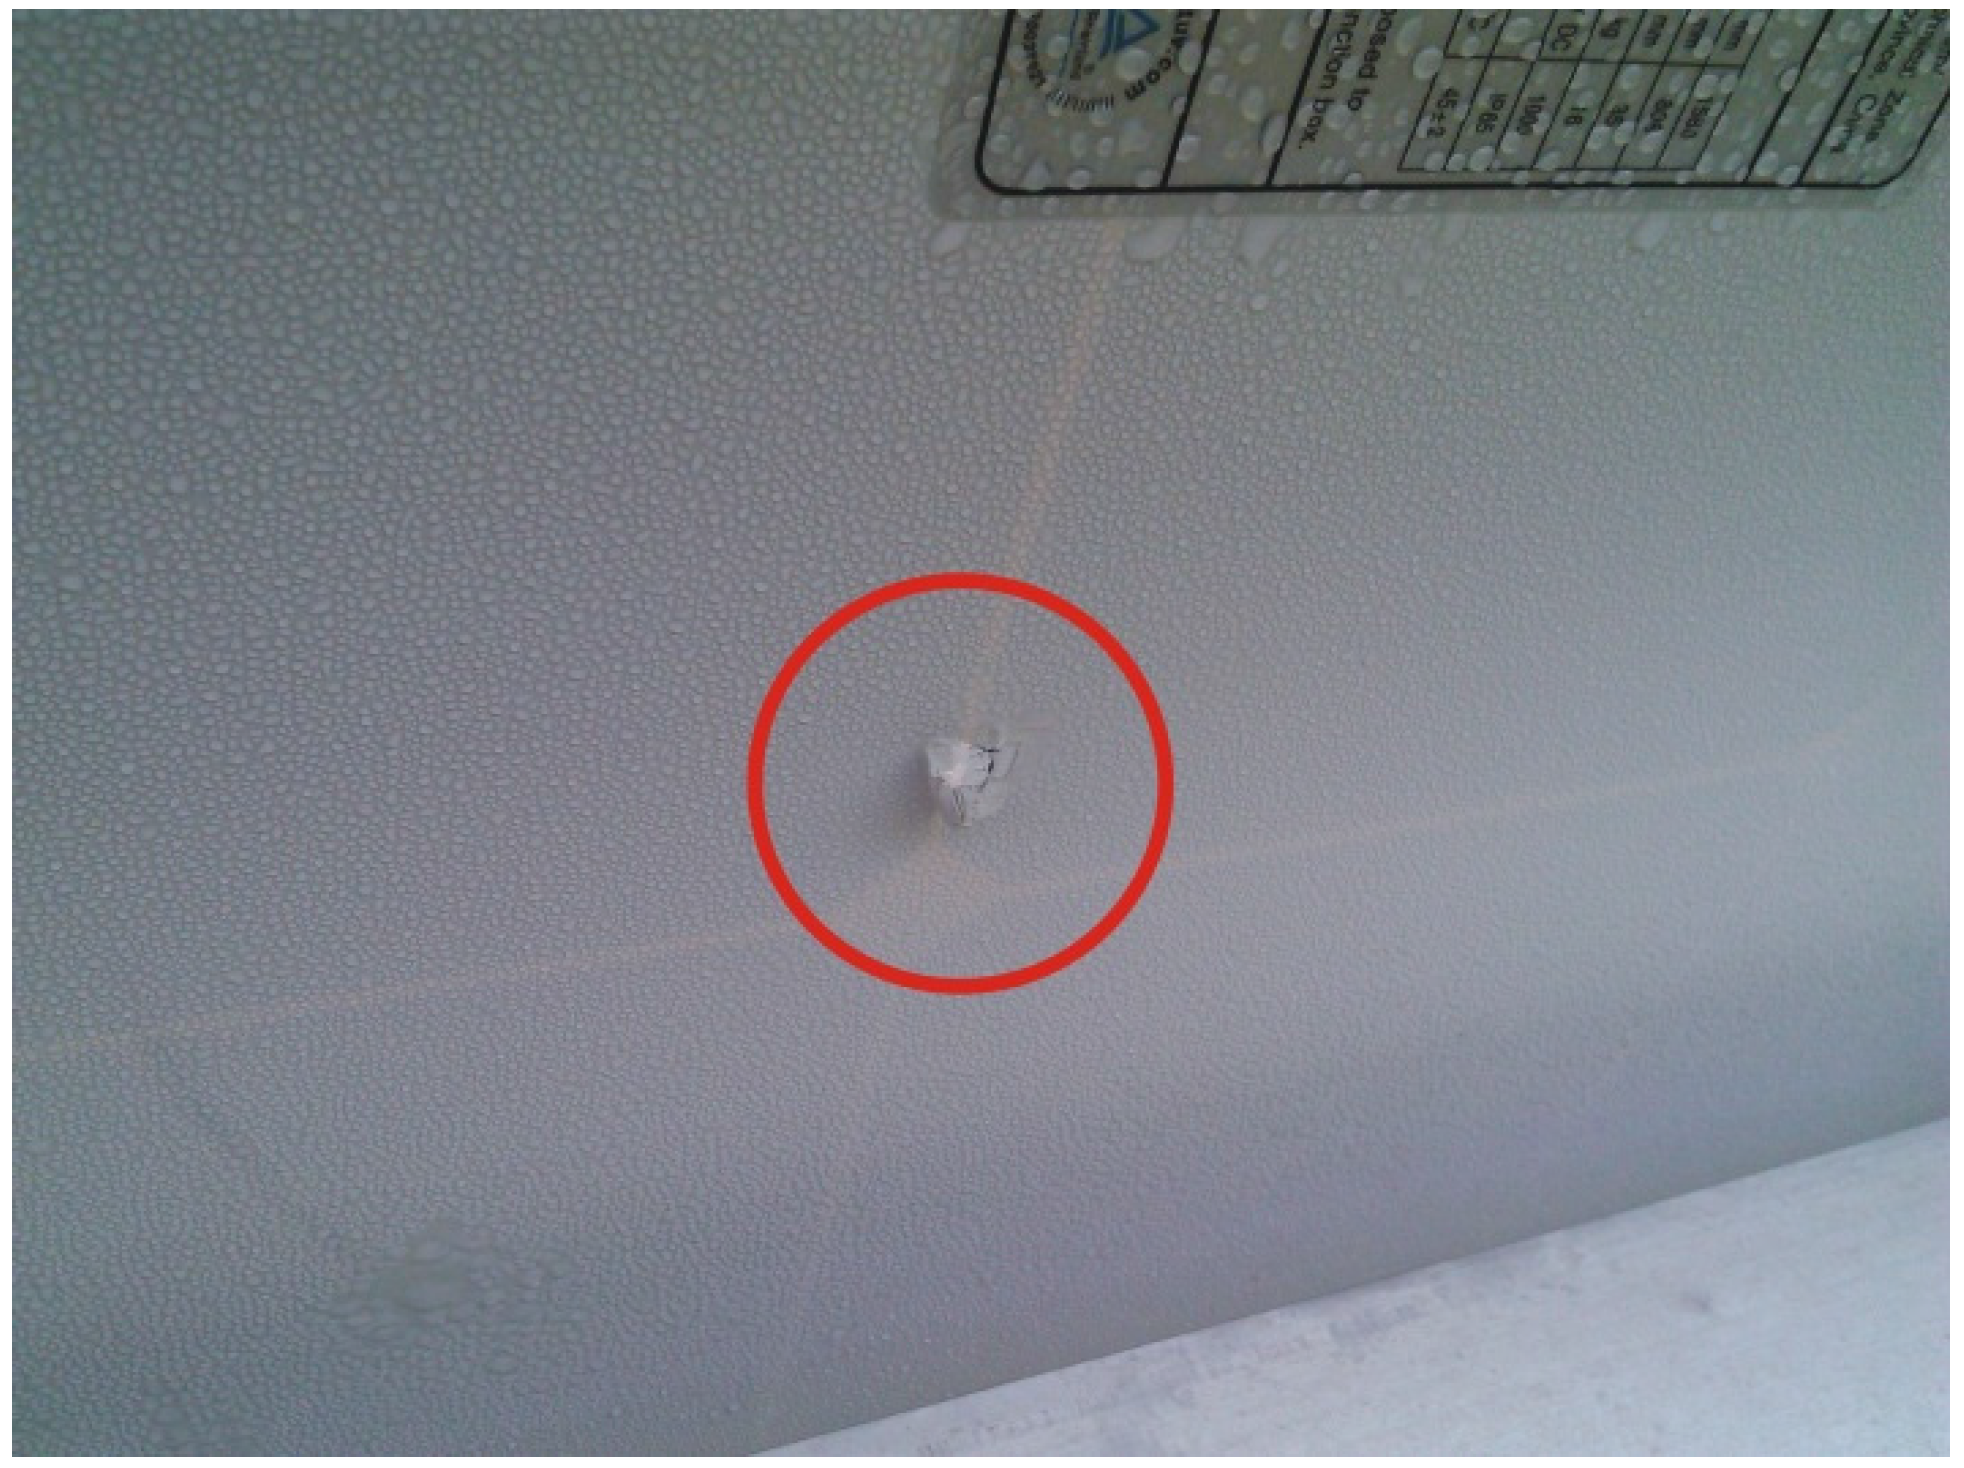
Mechanical damage to PV panels caused by the stones chucked while mowing grass has also been detected (
Figure 13) [
25].
Figure 13.
Mechanical damage to PV panel caused by chucked stone [
25].
Figure 13.
Mechanical damage to PV panel caused by chucked stone [
25].
4.2.3. Inspection of the 2000 kWp Photovoltaic (PV) Plant
Inspection of this PV plant consisted of visual check of the installation and maintenance. The loose DC connectors on the PV panels were tightened. In this power plant the measurement of OP was performed, reaching the value 82.25%. The minimum value set by the owner of the PV plant was 82%, and therefore no additional measurements were performed [
13].
4.2.4. Inspection Performed on the 45 kWp Photovoltaic (PV) Plant
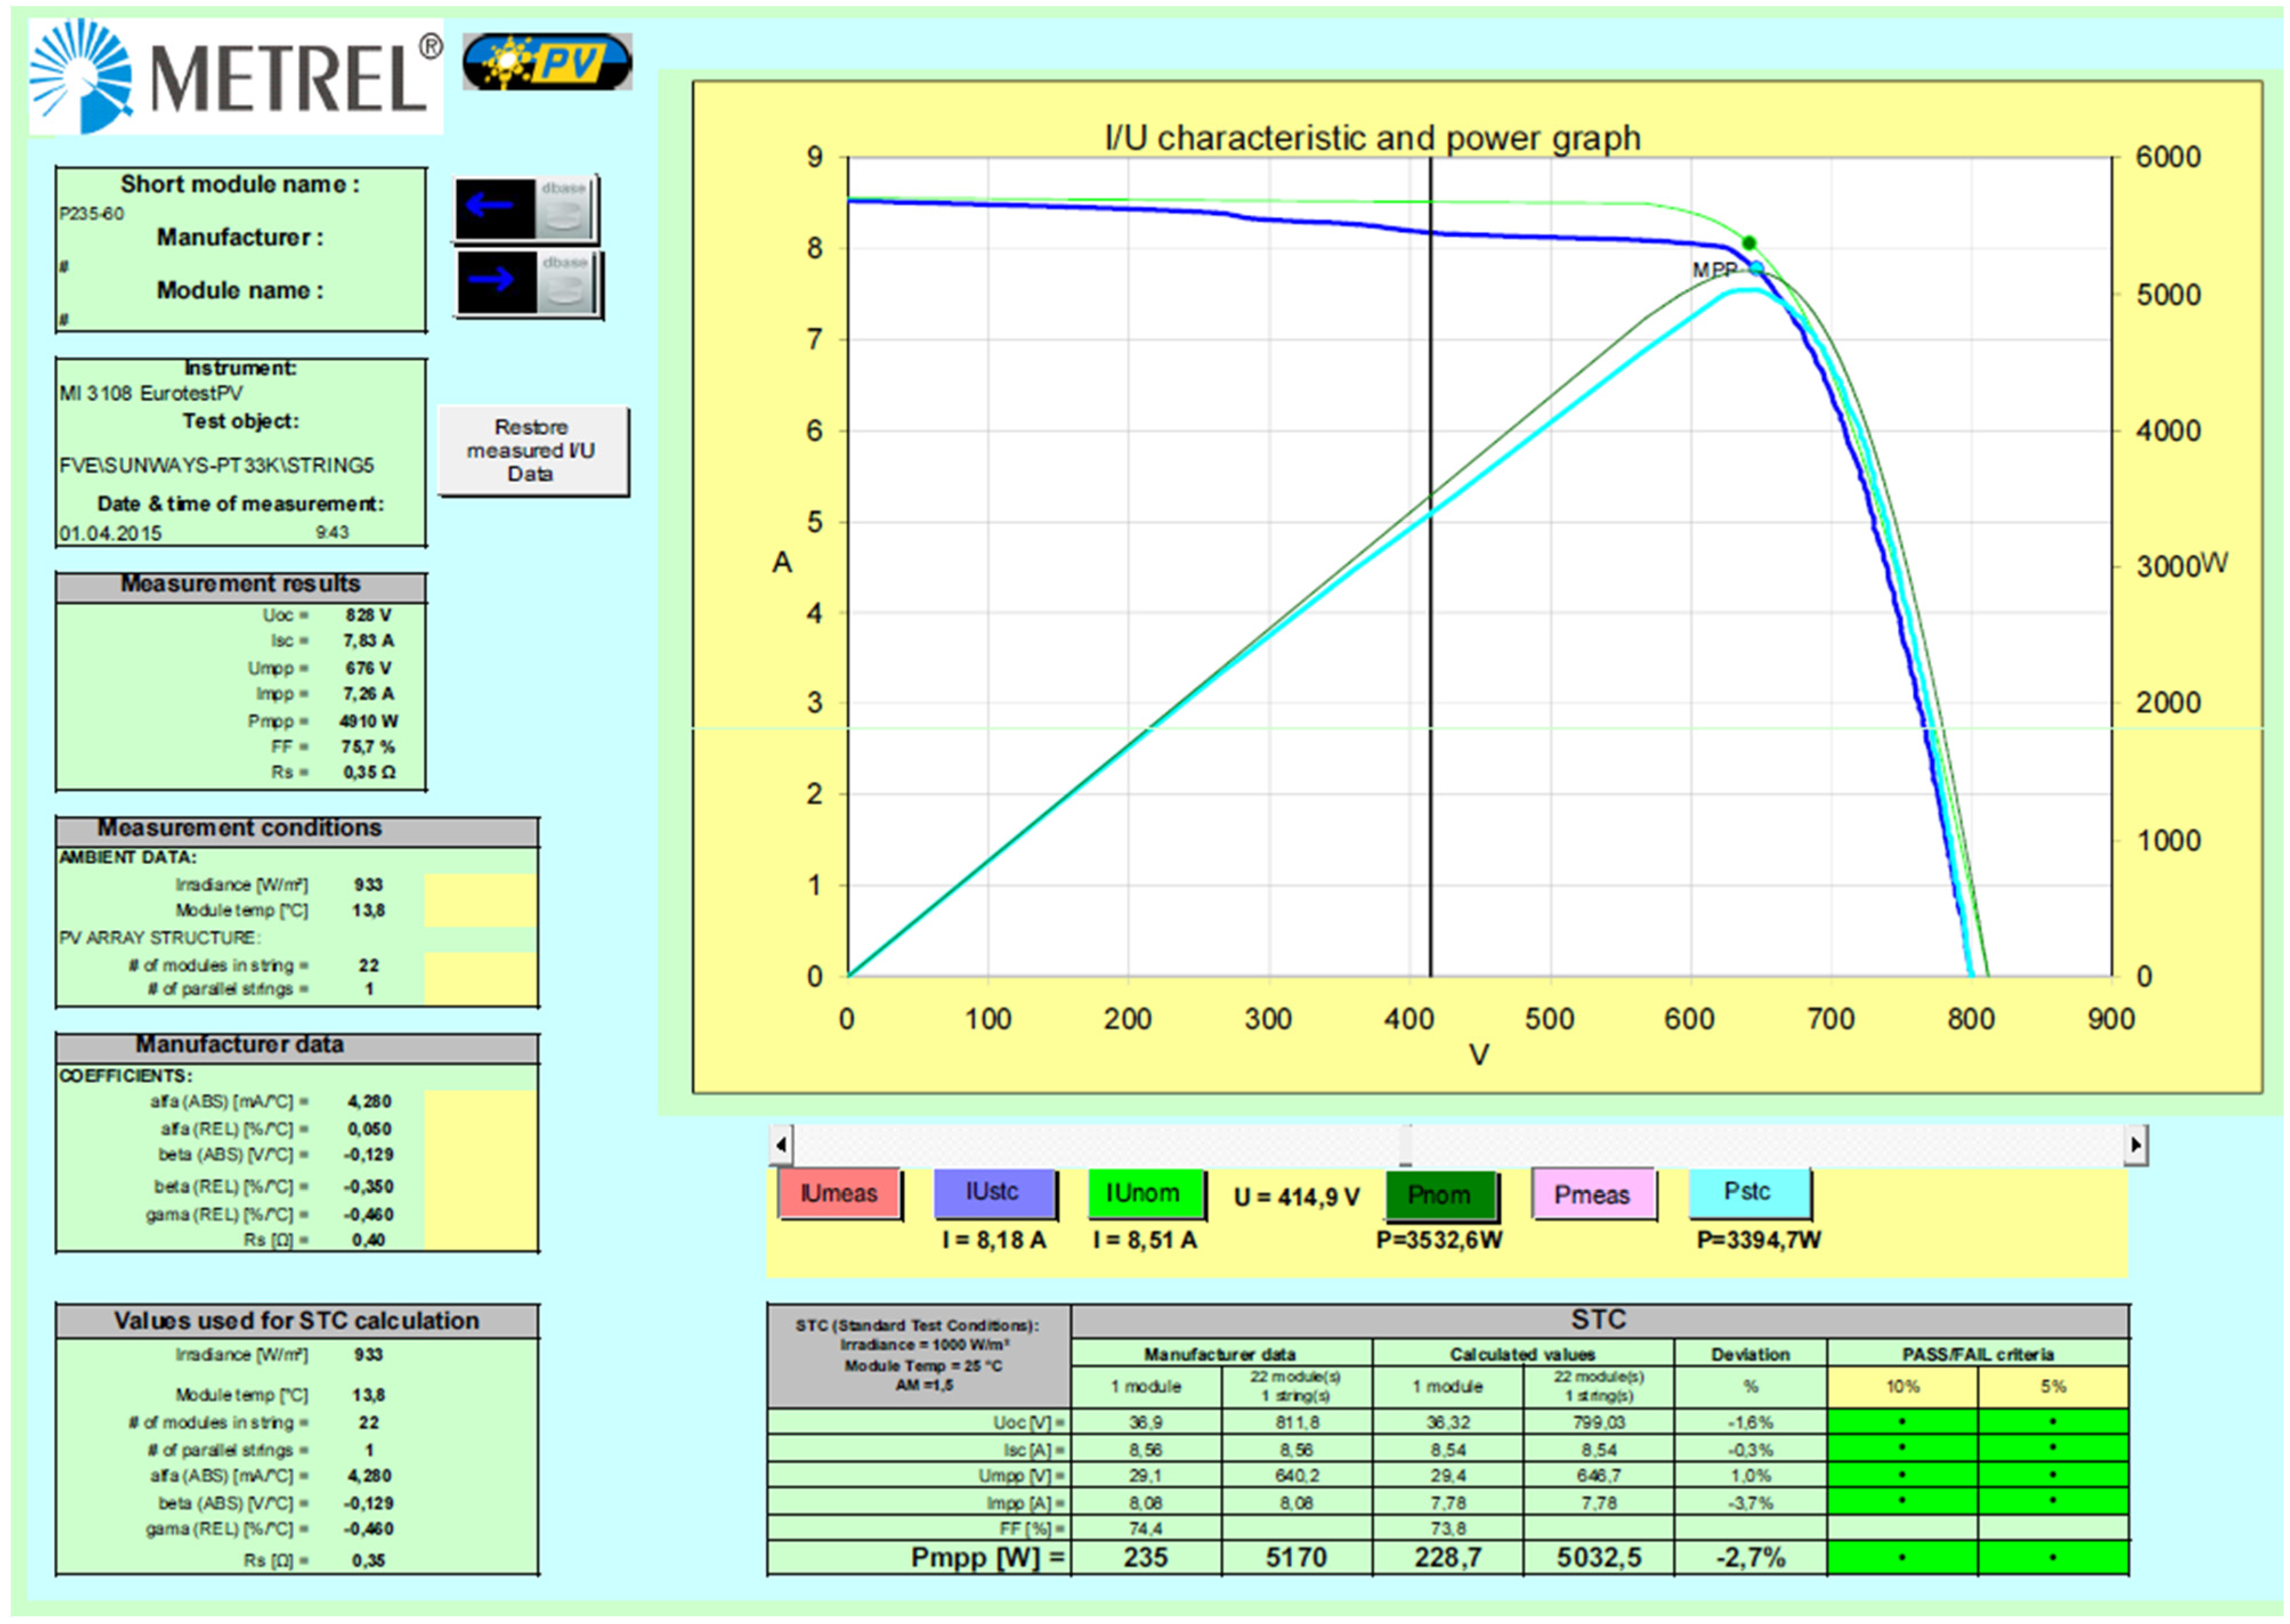
This PV plant is situated on the roof of an industrial object. The PV plant indicated no problems, only slightly dusted panels (visible as a current decrease on the
I-V curve). Proper functioning was verified by the measurement of
I-V curves (
Figure 14). The selected string indicates a power decrease of 2.7% compared to its nominal values after four years of operation [
26].
Figure 14.
I-V curve measurement of the entire string with no problem detected [
26].
Figure 14.
I-V curve measurement of the entire string with no problem detected [
26].
4.2.5. Description of the Inspection Performed on the 100 kWp Photovoltaic (PV) Plant
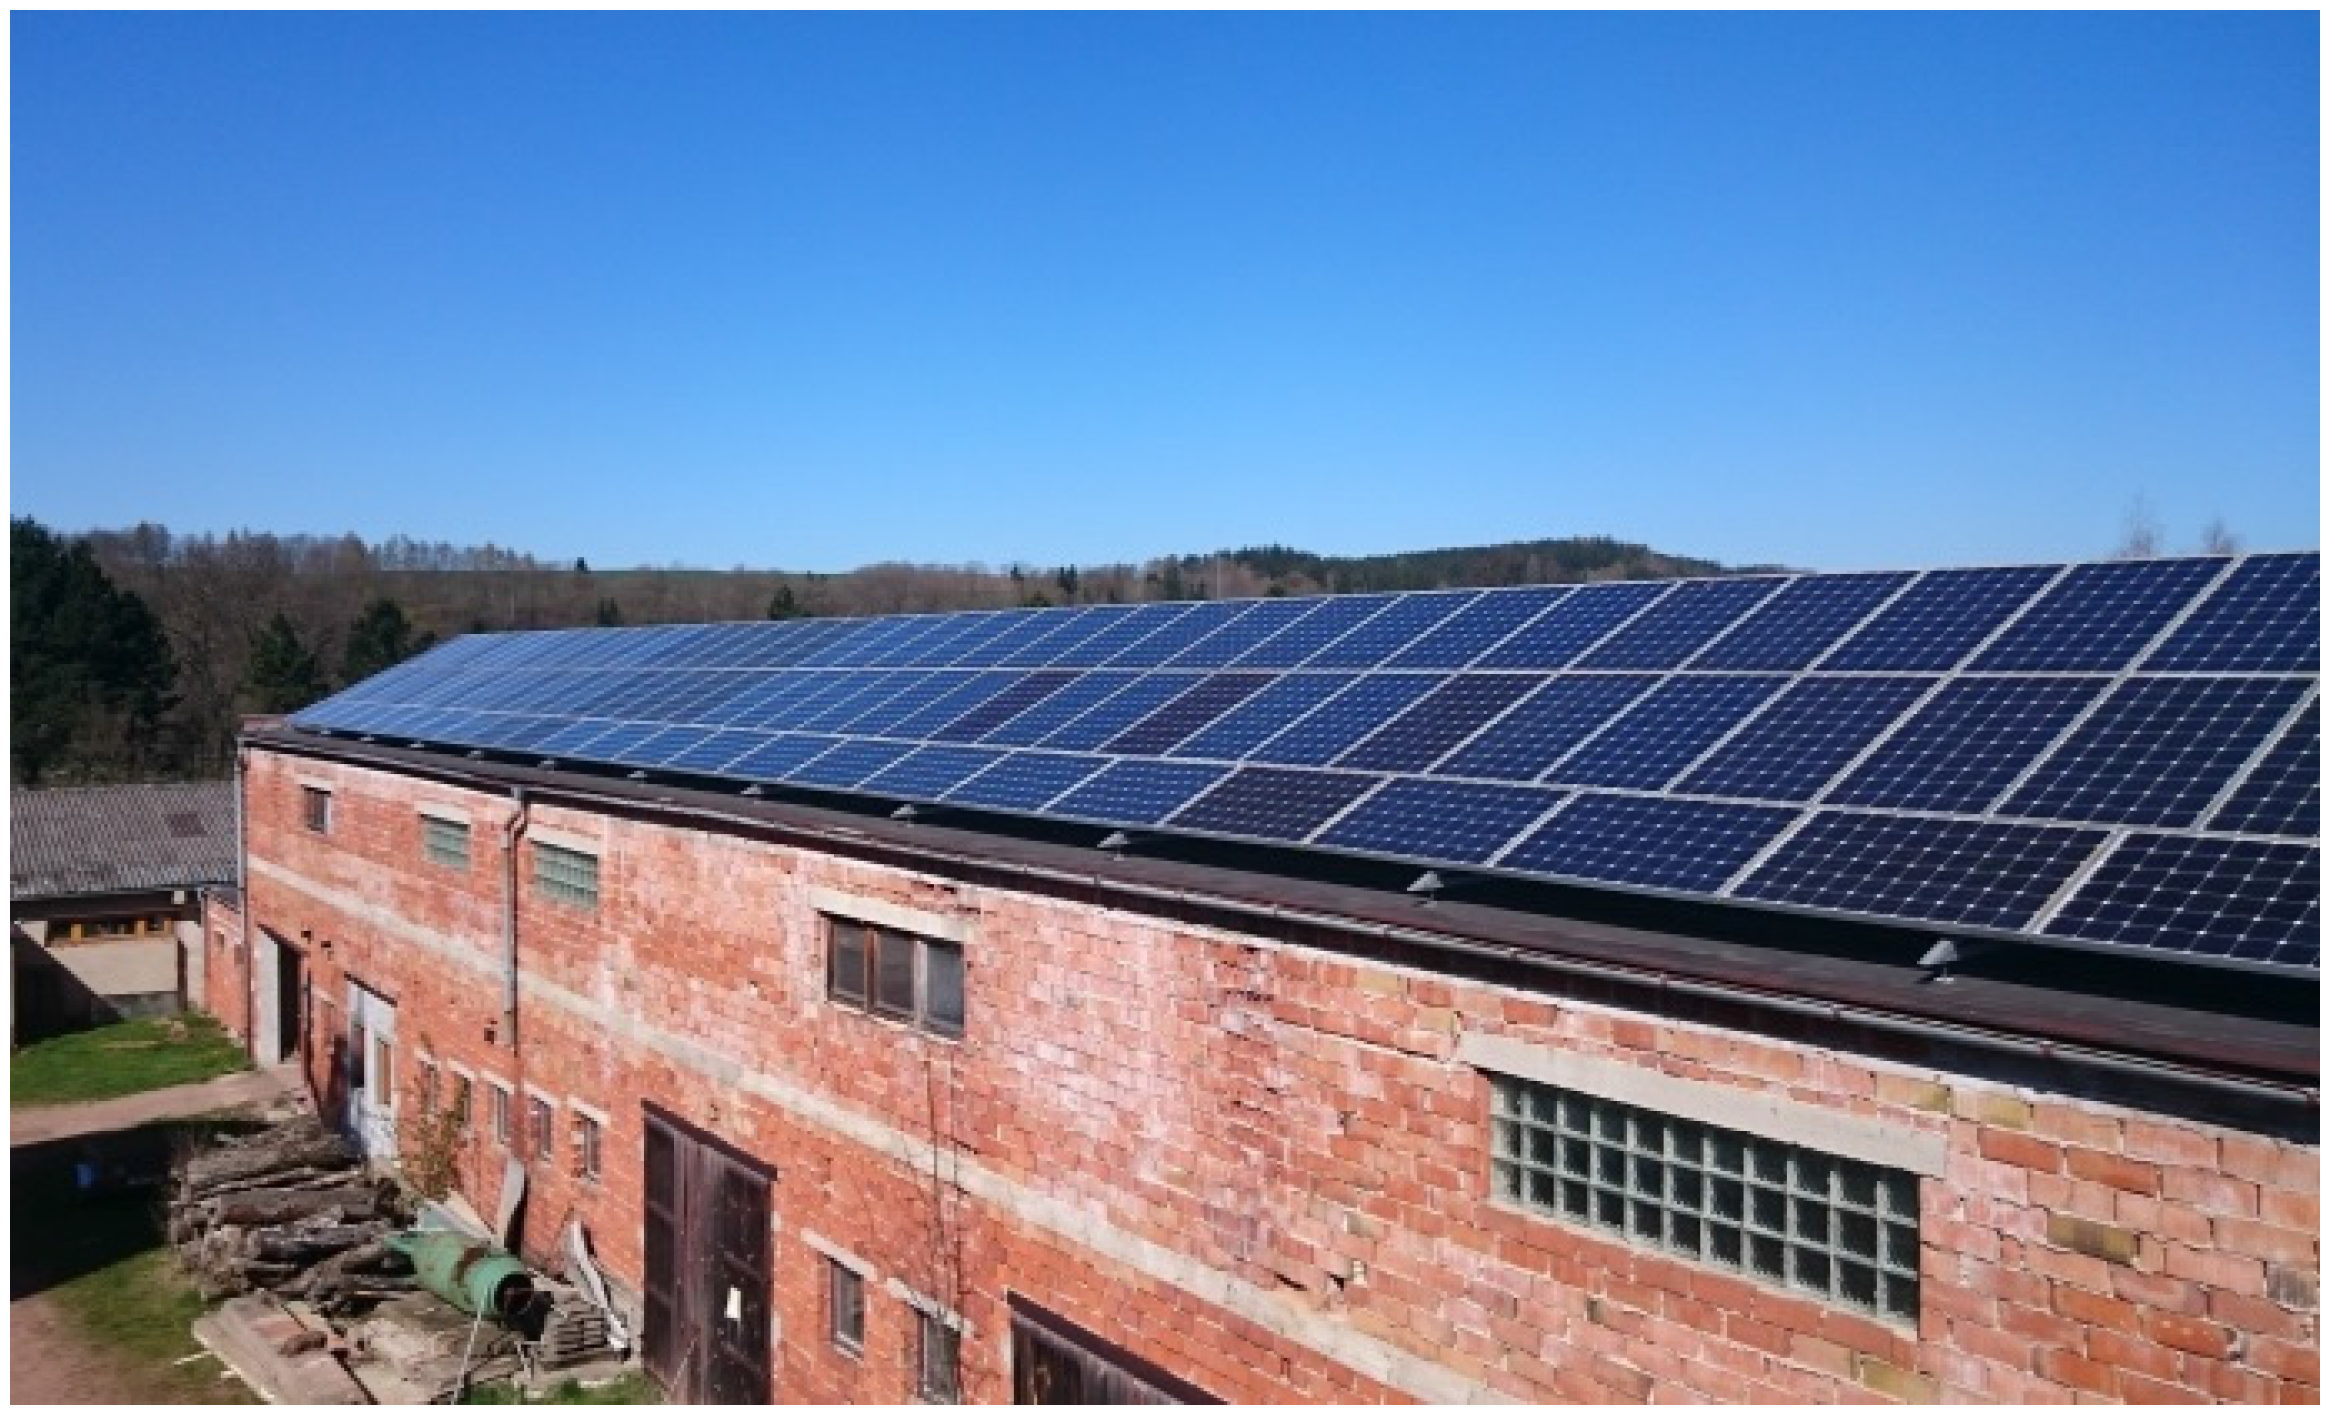
The PV plant is situated on the roof of agricultural buildings (
Figure 15). The results of the measurement of
I-V curves confirmed a significant but uniform power decrease of the PV panels. The panels are CEEG SST240-60M, with a nominal power of 240 Wp. The measurement was performed at the installation site and, in agreement with the valid IEC 61215 standard, the values measured were converted to STC using the thermal coefficients given in the datasheet of the respective panels.
The results for two different strings measured on a single panel are given in
Table 3. The average power decrease is between 9.7% and 12.2%. The PV panels are four years old, with visible color changes of the EVA foil. The measured strings show no PID presence indicated usually by a power decrease at one end of the string. Moreover, none of the main prerequisites was present at the inspected PV plant.
The open-circuit voltage of the string reaches the value 333 V, therefore the potential to the ground is low. Neither of the DC poles was grounded [
27].
Figure 15.
Selected part of the 100 kWp PV plant [
27].
Figure 15.
Selected part of the 100 kWp PV plant [
27].
Table 3.
Results of measuring the
PSTC of individual panels in selected strings in location 5 [
27].
Table 3.
Results of measuring the PSTC of individual panels in selected strings in location 5 [27].
| String A | PSTC (Wp) | Δ P (%) | String B | PSTC (Wp) | Δ P (%) |
|---|
| Panel 1 | 211.8 | −11.8 | Panel 1 | 214.4 | −10.7 |
| Panel 2 | 212.0 | −11.7 | Panel 2 | 213.3 | −11.1 |
| Panel 3 | 213.2 | −11.2 | Panel 3 | 210.8 | −12.2 |
| Panel 4 | 210.8 | −12.2 | Panel 4 | 214.9 | −10.5 |
| Panel 5 | 211.0 | −12.1 | Panel 5 | 213.9 | −10.9 |
| Panel 6 | 210.8 | −12.2 | Panel 6 | 216.8 | −9.7 |
| Panel 7 | 211.0 | −12.1 | Panel 7 | 214.6 | −10.6 |
| Panel 8 | 212.7 | −11.4 | Panel 8 | 216.5 | −9.8 |
| Panel 9 | 213.0 | −11.3 | Panel 9 | 216.6 | −9.8 |
| Σ | 1906.3 | - | Σ | 1931.8 | - |
| STC power decrease (%) |
| −15 | −10 | −5 | 0 | 5 | 10 |
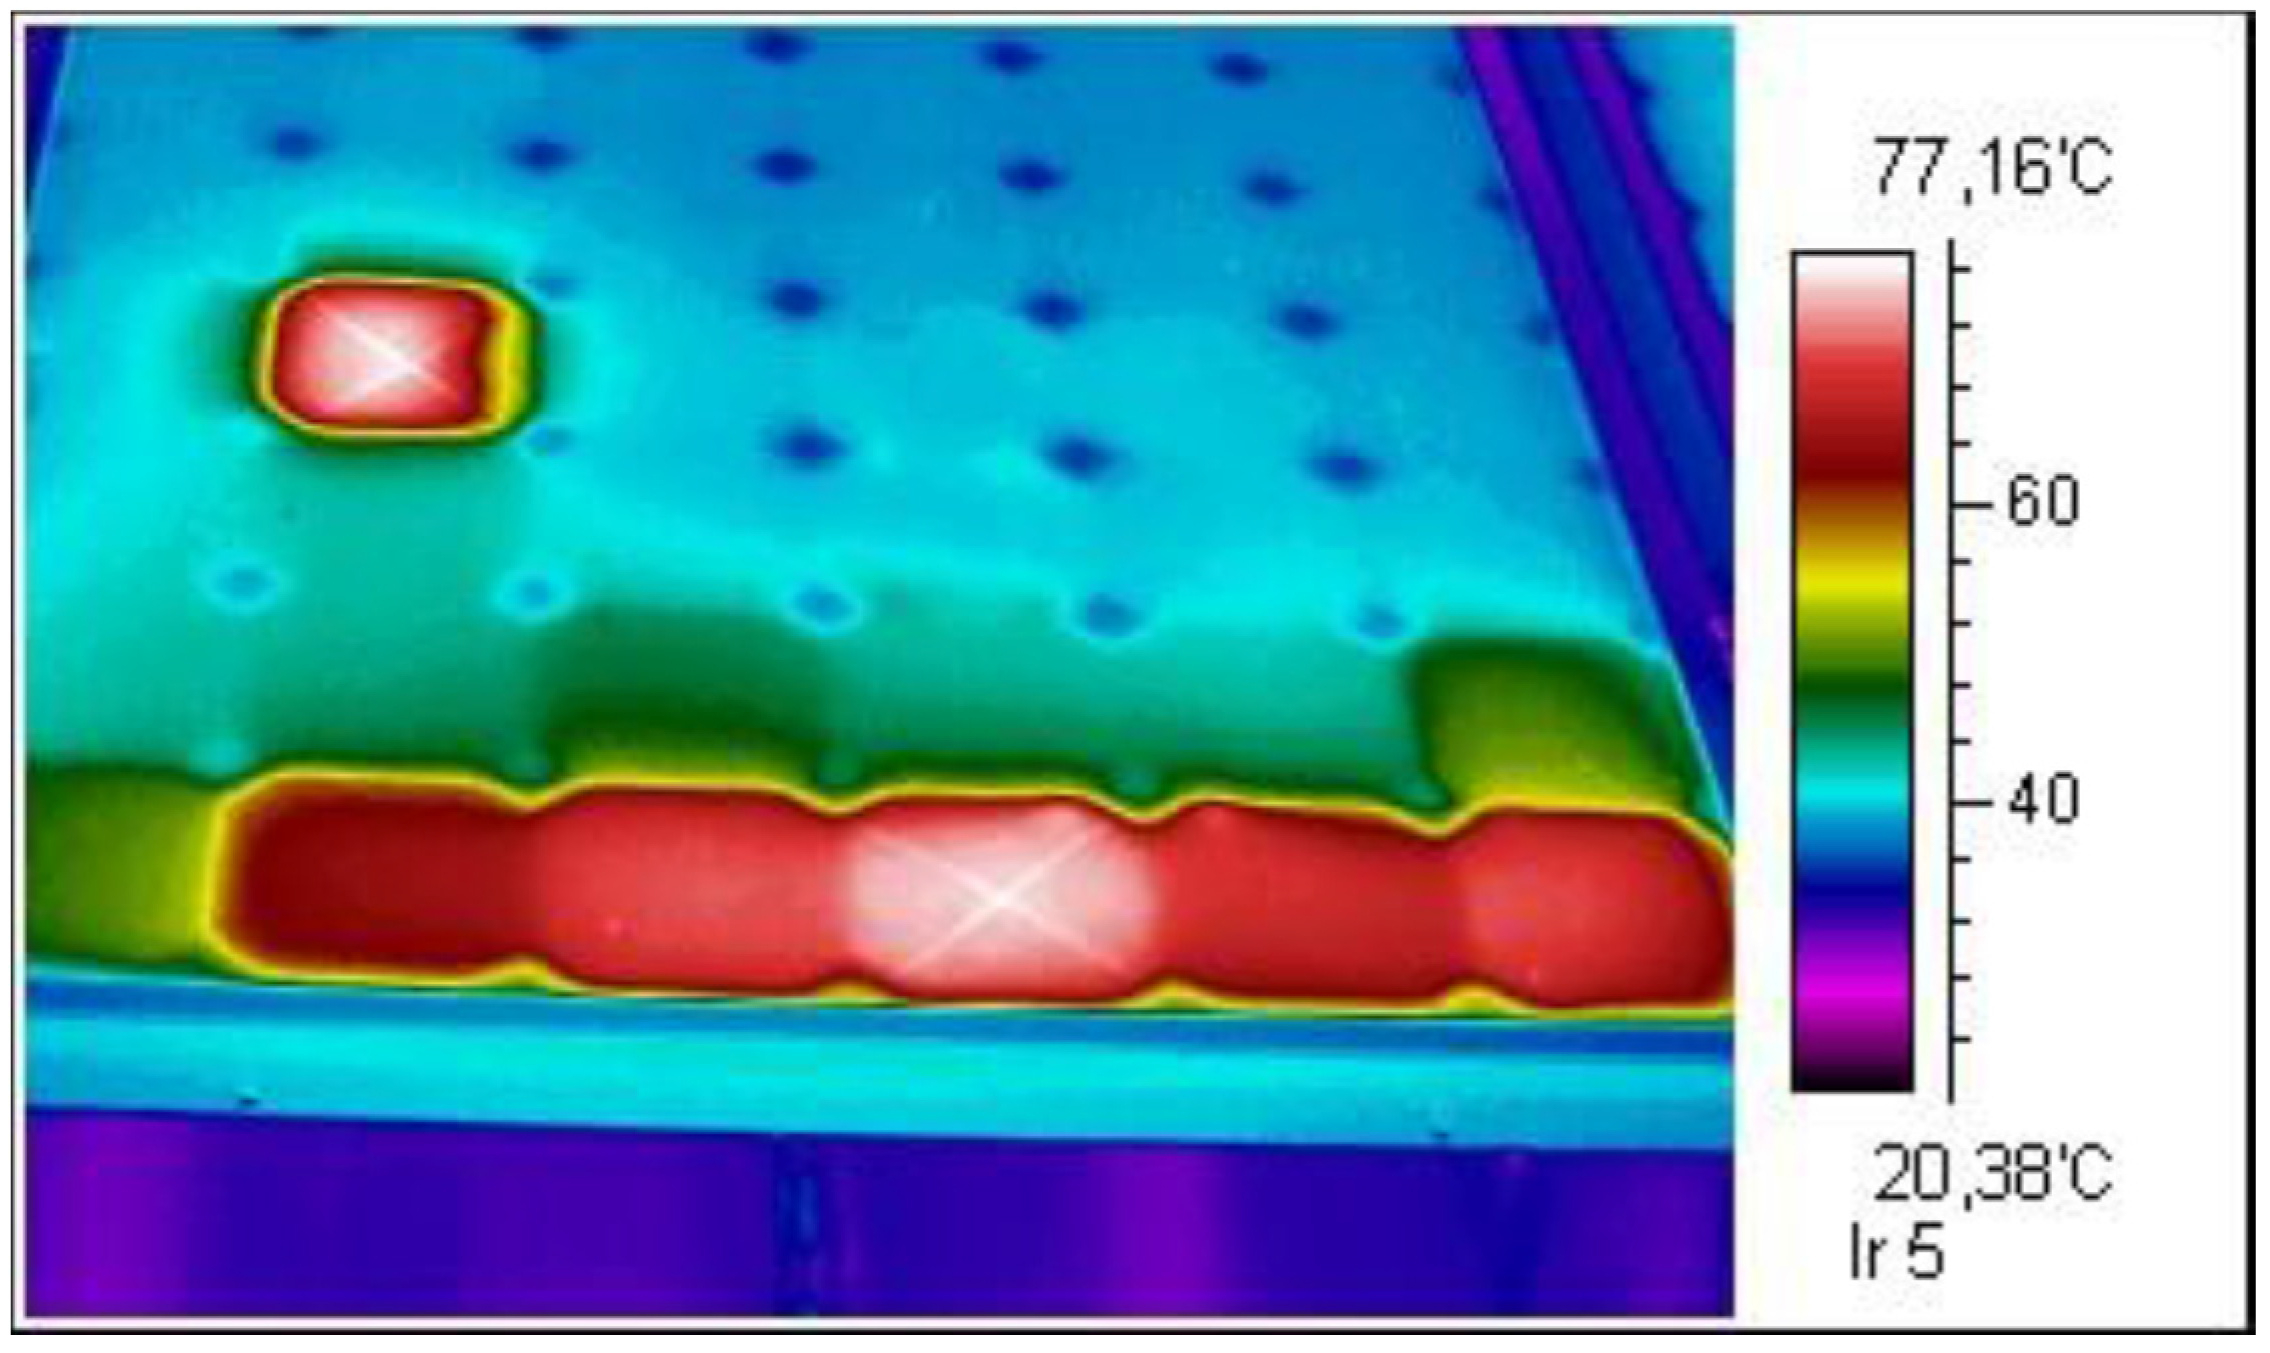
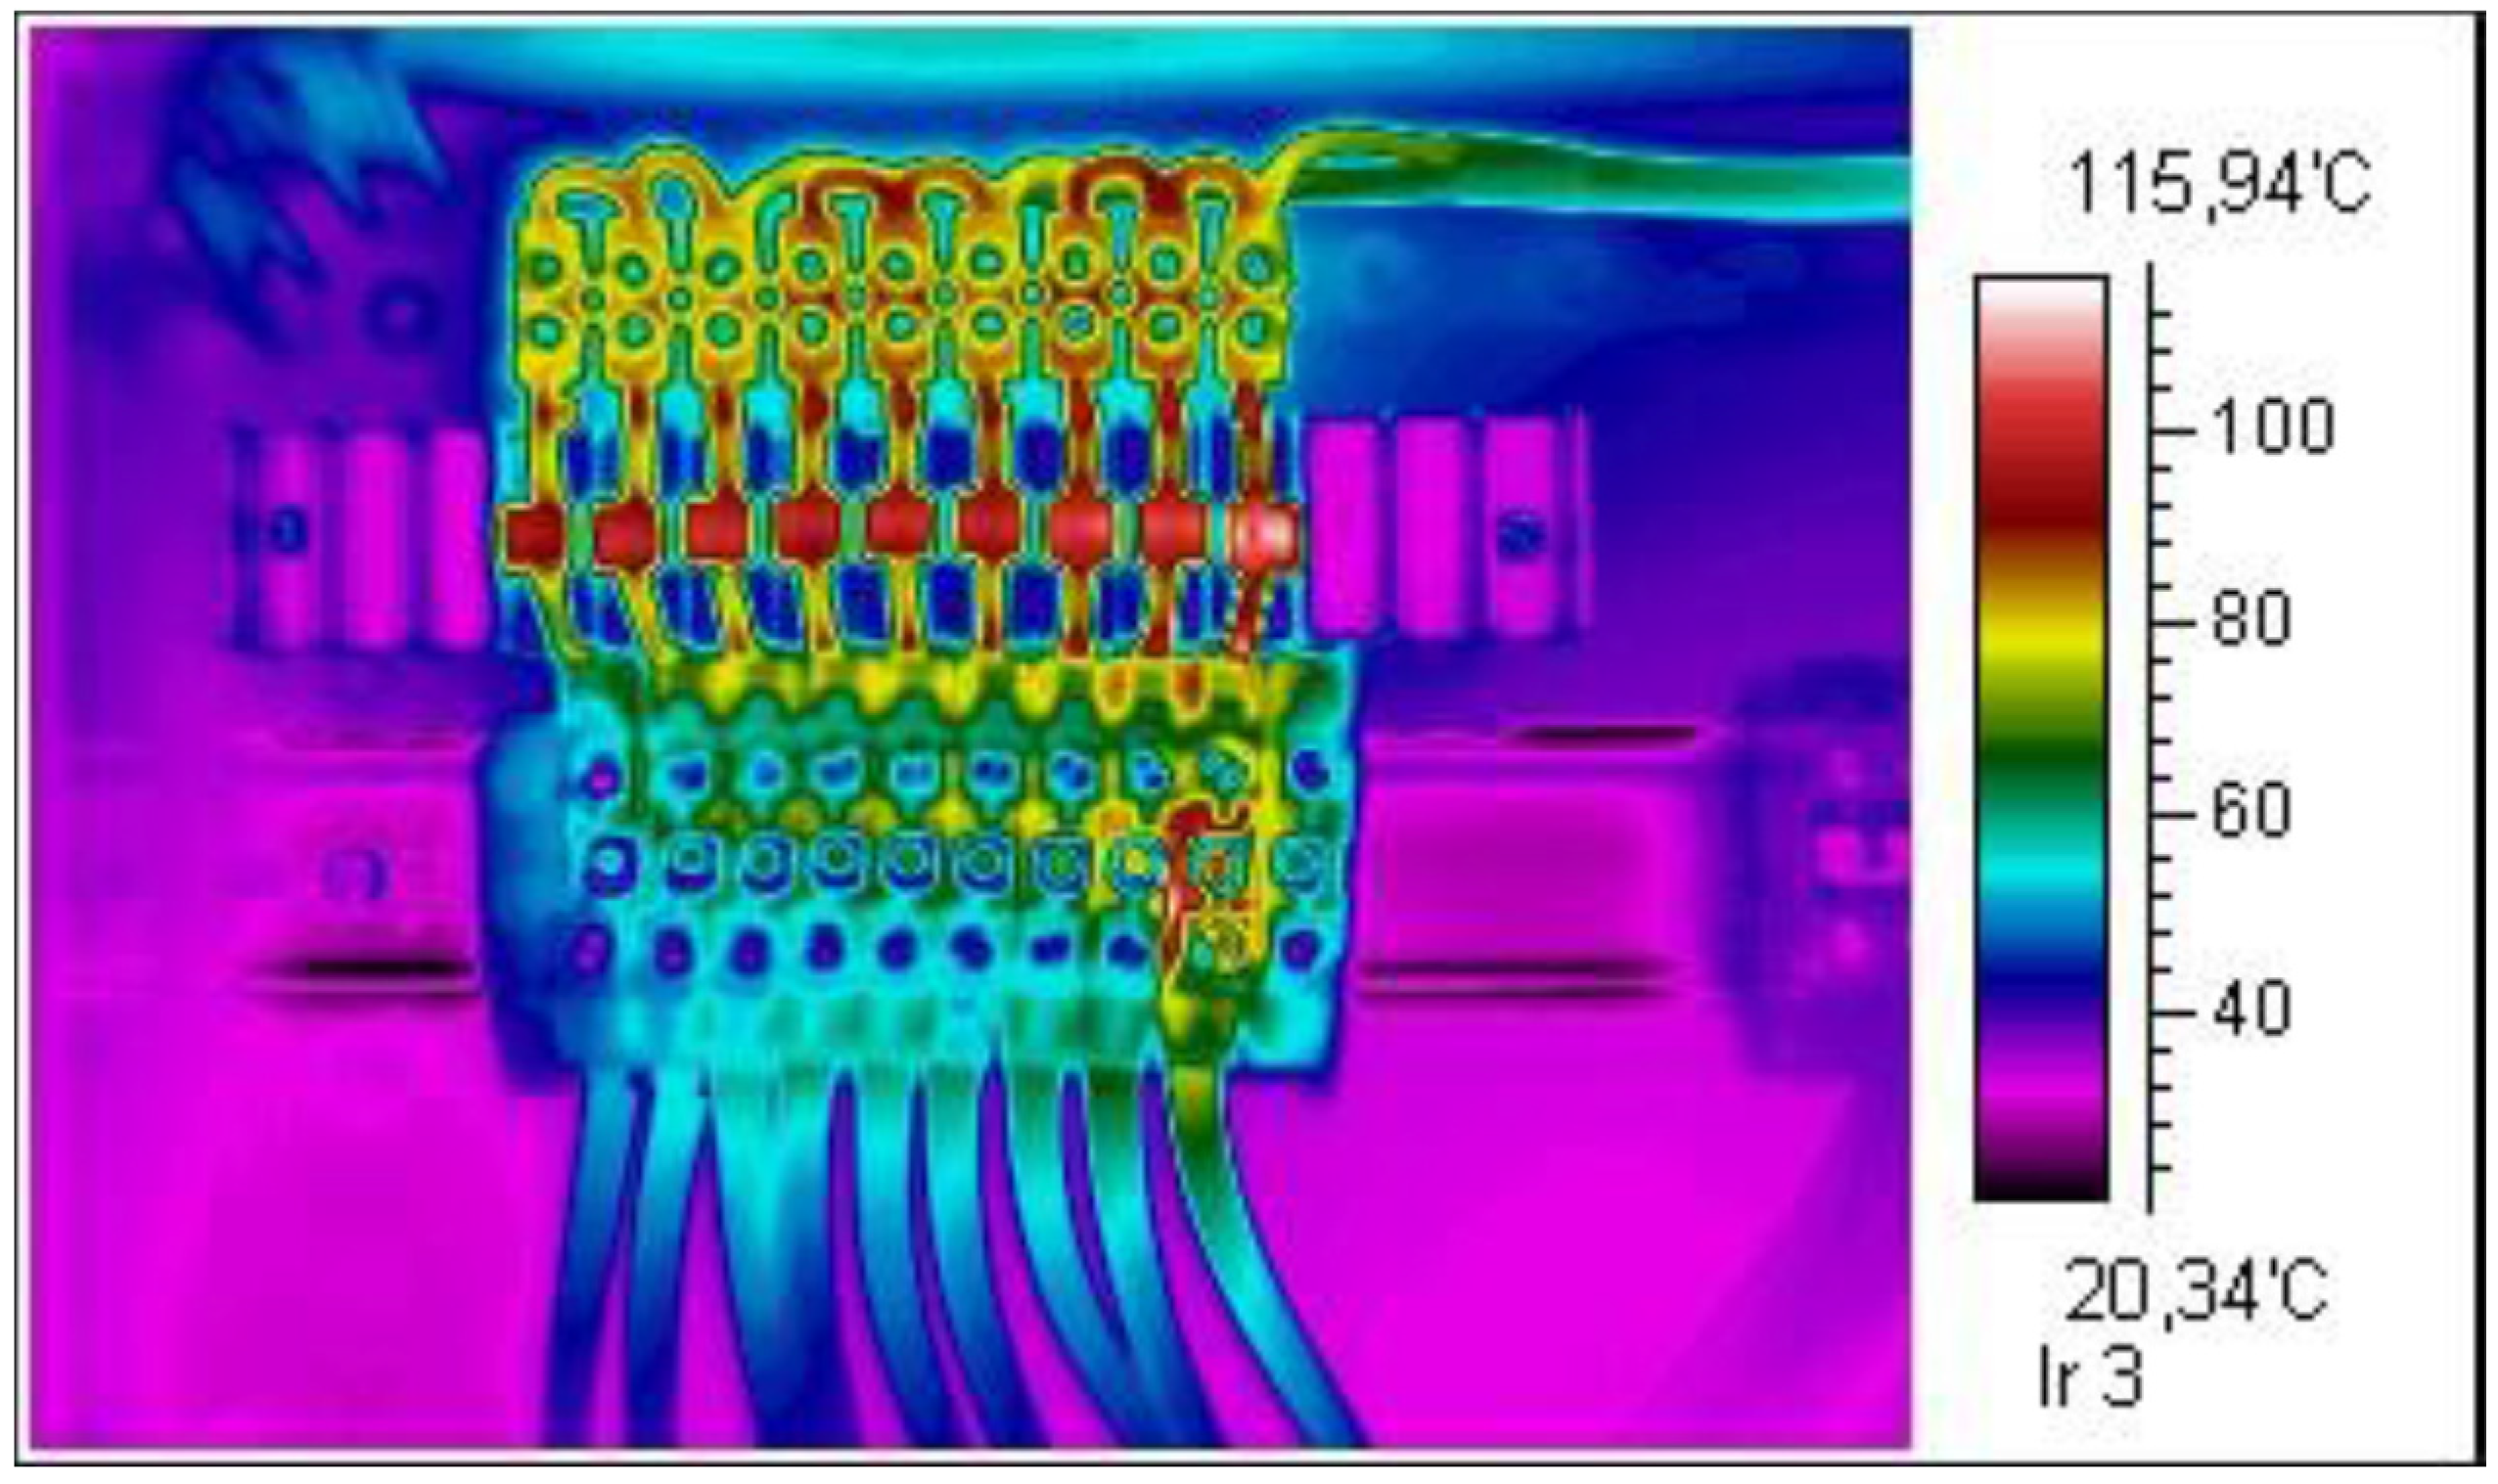
4.2.6. Inspection Performed on the 77 kWp Photovoltaic (PV) Plant
The selected PV plant indicated low OP, therefore measurement by IR camera was performed. As a result, panels containing defective cells (
Figure 16) and overheated DC wires (
Figure 17) were detected [
28].
Figure 16.
PV panels with hot spots [
28].
Figure 16.
PV panels with hot spots [
28].
Figure 17.
Overheated wires in DC string box [
28].
Figure 17.
Overheated wires in DC string box [
28].
4.3. Recapitulation of Findings Obtained in Individual Localities
In the following part, the technical (
Table 4) and operational parameters of individual PV installations are recapitulated.
Table 5 gives the basic drawbacks in the technical execution of individual installations and the consequences of inappropriate maintenance.
Table 4.
Basic parameters and the technology used in the localities tested.
Table 4.
Basic parameters and the technology used in the localities tested.
| No. of location | Install power (kWp) | Number of panels | PV panel technology | Grounded DC+ | Grounded DC− | Type of mounting | Installation date 2 |
|---|
| 1 | 658 | 2350 | Polycrystalline | No | No | Land installation | 2010.07 |
| 2 | 55,840 | 260,743 | Variable 1 | No | No | Land installation | 2010.12 |
| 3 | 2000 | 10,656 | Monocrystalline | No | No | Land installation | 2010.09 |
| 4 | 45 | 198 | Polycrystalline | No | No | Roof installation | 2010.12 |
| 5 | 100 | 427 | Monocrystalline | No | No | Roof installation | 2011.03 |
| 6 | 77 | 440 | Monocrystalline | No | No | Roof installation | 2009.04 |
Table 5.
Measurement results in individual localities.
Table 5.
Measurement results in individual localities.
| No. of location | PID present (Yes/No) | Operational performance (%) | Design errors | Maintenance errors |
|---|
| 1 | No | 83.1 | Parallel connection of strings of different numbers of panels, missing disconnecting DC switches. | Free connectors of DC connections, shading from assembly clamps, damaged glass covers of FV panels. |
| 2 | No | 83.0–86.5 | Different types of panel in the strings, shading of parts of strings by forest vegetation, absence of Light Protection System. | Damaged glass covers of FV panels, damage to rear covers of FV panels due to stones hurled during grass mowing, unconnected panels in the string, free connectors on the DC side. |
| 3 | No | 82.25 | Drop in operation performance caused by unsuitably chosen inverters. | No |
| 4 | No | 88.4 | No | No |
| 5 | No | 85.4% | Errors in the execution of DC distribution frames, shading by surrounding buildings in winter months. | No |
| 6 | No | 76.5% | Insufficiently dimensioned cables of the DC side, different numbers of panels in a string, shading by surrounding objects. | Faulty fuse in one phase of the AC side, damaged panels (degradation of individual cells). |
5. Conclusions
According to the current state of PV power plants in CR, where new installations are no longer being installed, the main goal is therefore to increase the operational efficiency of existing installations. The current research is focused on the degradation of the panels and on the validation of their parameters, to establish whether the PV plants can reach their designed values. The main part of the research is connected with on-site inspection instead of testing the PV panels in a specialized laboratory. Methods for detecting faults and evaluating PV plant parameters are presented in the paper. Based on the performed inspections of multiple PV plants it can be stated that the common problems caused by improper maintenance (loose connectors, broken fuses), low quality design (lack of overvoltage protections, overshadowing of PV plants) and components (badly sealed PV panels) can result in severe energy drops, which reduces the effectivity of the entire power plant. Additional research is connected with the detection of PID, its proper detection and evaluation of energy losses caused by defects and faults in the PV plant’s installation.
The current results of operating measurement for PV installations in the CR show a very low incidence of PID. We believe that this is mainly due to the specific operating conditions in the CR (environmental aspects) and also due to the fact that most PV systems are operated mainly at voltages of up to 1000 V DC with none of the DC poles grounded.
As shown in
Figure 2, the purchase prices for electricity produced from PV power plants has been declining since 2011, which has a major impact on the economy of the operation of these power plants. The return on investment in PV power plants has extended approximately by about 5 or 7 years—from 7 years to 12 or 14 years (depending on the size and design of the PV plant). The investment return time strongly depends on the state of the PV plant under operation. If maintenance is neglected (or if low-quality components were used in the installation) the operation performance (OP) is reduced, resulting in financial losses. If a production unit of 100 kWp output installed in 2010 is considered, which in CR conditions can produce an average of 100 MWh of electric power, then given the energy purchasing price (in 2010) 470 EUR/MWh, a gross profit of 47,000 EUR/year can be generated. This amount corresponds to an investment return time of 6 to10 years (depending on the amount of investments). In the case of reduced operation performance due to technical defects and neglected maintenance, the gross profit decreases in the order of tens of percent, which greatly prolongs the investment return time and, at the same time, increases maintenance costs. Reliable operation of PV plants is in terms of the operator (investor) one of the most important properties. It is therefore very important to perform regular inspections of the functionality of each component in PV power plants. The significance of these operational measurements within the environment of the CR increases with the reduction of the purchase prices of electricity generated by PV power plants. Defects on PV panels are of considerable influence not only on energy production but also on the economic efficiency of operation. Reducing the performance of PV power plants significantly extends the return on investment, which is very problematic for investors in and operators of PV plants.
In view of the fact that the operation performance of PV plants in current installations ranges between 85% and 93% (using modern technology; in older installations the recommended minimum operation performance was 82%), maintaining this operation performance requires regular operating maintenance and, in our opinion and according to the recommendation by and discussion with representatives of the installation companies and the Czech Photovoltaic Association, operating measurement once or twice a year to check the PV plants parameters.
Acknowledgments
The paper was prepared at the Centre for Research and Utilization of Renewable Energy (CRURE). The authors gratefully acknowledge financial support from the Ministry of Education, Youth and Sports of the CR under NPU I Programme (Project No. LO1210) and BUT Specific Research Programme (Project No. FEKT-S-14-2520).
Author Contributions
Petr Mastny and Jan Moravek conceived and designed the experiments, performed the measurements and analysis. Jiri Drapela consulted the results of the analysis. All of the authors have been involved in writing the manuscript.
Conflicts of Interest
The authors declare no conflict of interest.
References
- Mastny, P.; Machacek, J. System for Measuring and Collecting Data—Results of Measuring on Combined System. In Proceedings of the 10th WSEAS International Conference on Mathematical Methods and Computational Techniques in Electrical Engineering, Sofia, Bulgaria, 2–4 May 2008; pp. 192–197.
- Milea, L.; Otlu, O.; Teodorescu, C.; Muntean, V.; Stoian, M. Photovoltaic Energetic System—Design and Implementation. In Proceedings of the 12th WSEAS International Conference on Systems, Heraklion, Greece, 22–24 July 2008; pp. 372–375.
- Ivanovici, T.D.; Ionel, M. Technical Interactions between Distributed Photovoltaic Systems and Low-voltage Grids. Available online: http://www.wseas.org/multimedia/journals/power/2015/a285716-274.pdf (accessed on 13 July 2015).
- Janiga, P.; Liska, M.; Belan, A.; Volcko, V.; Ivanic, M. Power Quality Measurement of Small Solar Off-Grid System. WSEAS Trans. Environ. Dev. 2015, 11, 49–56. [Google Scholar]
- Mastny, P.; Moravek, J.; Vrana, M.; Pitron, J. Current Status of the Potential Induced Degradation in Czech Republic. In Advances in Environmental and Geological Science and Engineering. Energy, Environmental and Structural Engineering Series; WSEAS Press: Salerno, Italy, 2015; pp. 78–83. [Google Scholar]
- Peeters, E.; Van Bael, J. A Real Life Analysis of Small Scale Photovoltaic Installations. In Proceedings of the 2nd IASME/WSEAS International Conference on Energy & Environment, Portoroz, Slovenia, 15–17 May 2007; pp. 158–162.
- Ptacek, J.; Modlitba, P.; Spacek, T. Possibilities of electricity production from RES within conditions of CR regarding liabilities towards EU. In Proceedings of the Conference of Czech Commission CIRED 2010, Tabor, Czech Republic, 9–12 November 2010; pp. 1–9.
- Energy Regulatory Office of the Czech Republic. Available online: http://www.eru.cz (accessed on 22 May 2015).
- Rossi, C.; De Rosa, M.; Bianco, V.; Scarpa, F.; Tagliafico, L. Comparison between Different Photovoltaic Solar-Assisted Heat Pumps (PVT-SAHP) Configurations with Retrofitted Photovoltaic Panels. WSEAS Trans. Environ. Dev. 2014, 10, 329–340. [Google Scholar]
- Mastny, P.; Radil, L.; Mastna, Z. Possibilities of PV Panels Defects Identification and Determination of its Effect on the Economy of Photovoltaic Power Plants Operation. In Proceedings of the 2nd International Conference on Mathematical Models for Engineering Science, and Proceedings of the 2nd International Conference on Development, Energy, Environment, Economics, and Proceedings of the 2nd International Conference on Communication and Management in Technological Innovation and Academic Globalization, Puerto De La Cruz, Spain, 10–12 December 2011; pp. 233–238.
- Badea, G.; Naghiu, G.S.; Safirescu, C.; Muresan, D.; Badea, F.; Megyesi, E. Choosing the Optimal Multi-Junctions Photovoltaic Cells for Application in the Field of Concentrated Photovoltaic. Available online: http://www.wseas.us/e-library/conferences/2014/Malaysia/RESEN/RESEN-21.pdf (accessed on 8 May 2015).
- Operation of power PVPP—Diagnosis. Available online: http://www.solartec.eu/en/large-instalations/operation-of-power-pvpp/diagnosis (accessed on 12 July 2015).
- Mastny, P. Results from Operational Measurement of Photovoltaic Power Plant Semanin; Brno University of Technology: Brno, Czech Republic, 2014. [Google Scholar]
- Understanding Potential Induced Degradation. Available online: http://www.advanced-energy.com (accessed on 10 May 2015).
- Crystalline Silicon Terrestrial Photovoltaic Modules—Design Qualification and Type Approval; International Electrotechnical Commission: Geneva, Switzerland, 2005.
- Photovoltaic Devices—Procedures for Temperature and Irradiance Corrections to Measured I-V Characteristics; International Electrotechnical Commission: Geneva, Switzerland, 2009.
- Bastidas, R.; Petrone, J.D.; Paja, R.C.A.; Spagnuolo, G. Photovoltaic modules diagnostic: An overview. In Proceedings of the IECON 2013-39th Annual Conference of the IEEE Industrial Electronics Society, Vienna, Austria, 10–13 November 2013; pp. 96–101.
- Carlson, D.E.; Carlson, D.E.; Romero, R.; Willing, F.; Meakin, D.; Gonzalez, L.; Murphy, R.; Moutinho, H.R.; Al-Jassim, M. Corrosion Effects in Thin-Film Photovoltaic Modules. Prog. Photovolt. Res. Appl. 2003, 11, 377–386. [Google Scholar] [CrossRef]
- Saly, V.; Vary, M.; Packa, J.; Perny, M. Electrical Characterization of PV Modules after Three Years of Operation. In Proceedings of the 2015 16th International Scientific Conference on Electric Power Engineering, Ostrava, Czech Republic, 20–22 May 2015; pp. 484–487.
- Grid Connected Photovoltaic Systems—Minimum Requirements for System Documentation, Commissioning Tests and Inspection; International Electrotechnical Commission: Geneva, Switzerland, 2010.
- Oshaba, A.S.; Ali, E.S.; Abd Elazim, S.M. Artificial Bee Colony Algorithm Based Maximum Power Point Tracking in Photovoltaic System. WSEAS Trans. Power Syst. 2015, 10, 123–134. [Google Scholar]
- Quamruzzaman, M.; Rahman, K.M. A Modified Perturb and Observe Maximum Power Point Tracking Technique for Single-Stage Grid-Connected Photovoltaic Inverter. WSEAS Trans. Power Syst. 2014, 9, 111–118. [Google Scholar]
- Cortez, L.; Cortez, J.I.; Adorno, A.; Cortez, E.; Larios, M. Simulation of a photovoltaic solar module for the study of the effects of random changes of solar radiation. Available online: http://www.wseas.us/e-library/conferences/2010/Catania/ACMOS/ACMOS-43.pdf (accessed on 13 July 2015).
- Mastny, P.; Moravek, J.; Vrana, M. Results from Operational Measurement of Photovoltaic Power Plant Stanetice; Brno University of Technology: Brno, Czech Republic, 2015. [Google Scholar]
- Mastny, P.; Moravek, J.; Pitron, J. Results from Operational Measurement of Photovoltaic Power Plant Ralsko; Brno University of Technology: Brno, Czech Republic, 2014. [Google Scholar]
- Mastny, P.; Moravek, J. Results from Operational Measurement of Photovoltaic Power Plant Brno-Kralovopolska; Brno University of Technology: Brno, Czech Republic, 2015. [Google Scholar]
- Mastny, P.; Moravek, J.; Vrana, M. Results from Operational Measurement of Photovoltaic Power Plant Broumov; Brno University of Technology: Brno, Czech Republic, 2015. [Google Scholar]
- Mastny, P. Results from Operational Measurement of Photovoltaic Power Plant Brnenec; Brno University of Technology: Brno, Czech Republic, 2014. [Google Scholar]
© 2015 by the authors; licensee MDPI, Basel, Switzerland. This article is an open access article distributed under the terms and conditions of the Creative Commons Attribution license (http://creativecommons.org/licenses/by/4.0/).


