2. Wireless Charging Strategy
Topologies are very important for wireless charging systems, for they are the major power transfer carrier and affect the system transfer characteristics. LC series and LC parallel are the basic two topologies, and their combinations derive four topologies, including LC series-LC series, LC series-LC parallel, LC parallel-LC series and LC parallel-LC parallel [
23]. To ensure the reflected impedance of LC parallel topology is purely resistive, an additional inductor is employed to compensate the imaginary part, which derives the LCL-LCL topology [
11]. According to the Norton’s law, we can easily deduce that the LC parallel topology and LCL topology have the CC characteristic [
24]. Additionally, LC series-LC series topology also has a CC characteristic when the load is a strong voltage source, like the battery. So, we can use these topologies to charge the battery directly, which can remove the cascade DC/DC part in the receiver, and thus improve the efficiency. CC/CV strategy is widely used due to the requirements of many commercial power batteries [
25]. The battery is at first charged by a constant current. Once its terminal voltage arrives at a predesigned value, the CV stage begins. At this time, the charging instrument works as a voltage source to clamp the terminal voltage of the battery. Then, the internal resistance and OCV (open circuit voltage) of the battery increase continually until the charging current reduces to a threshold, which indicates that the charging process is over. Obviously, we can find that the CC stage is realized easily in wireless charging systems, but for the CV stage, it needs an additional control algorithm as well as some other sensors at high speed [
2]. Initially, CV stage is used to charge the lead-acid battery, which aims to avoid the electrolysis of the water at the end of the charge, and hence, to prevent excessive gaseous emissions [
26]. As we know, both the component material and electrochemical mechanism of the lithium-ion battery is apparently different from that of the lead-acid battery; thus, we are going to study whether the CV stage is necessary for the lithium-ion battery charging.
First, the contributions of CV stage to the battery are studied, then the CC/CV strategy is compared with the CC strategy, and three evaluation criterions, including the charging time, the charging capacity and the charging energy efficiency, are adopted in order to evaluate them. The specific parameters of the test battery are listed in
Table 1.
Table 1.
Specific parameters of test battery.
Table 1.
Specific parameters of test battery.
| Parameter | Value | Parameters | Materials | Thickness |
|---|
| Rated voltage | 3.2 V | Anode plate | aluminum | 19 μm |
| Voltage lower limit | 2.5 V | Anode material | LiFePO4 | 35 μm |
| Voltage upper limit | 3.8 V | Separator | PP/PE/PP | 40 μm |
| Nominal capacity | 8 AH | Cathode material | Graphite | 40 μm |
| Current limit (discharge) | 30 A | Cathode plate | Copper | 11 μm |
| Temperature (chagre) | 0~45 °C | Shell | Aluminum | 500 μm |
| Temperature (discharge) | −20~45 °C | | | |
| Resistance | 2.5 mΩ | | | |
| Weight | 900 g | | | |
| Dimension | 135 mm × 70 mm × 80 mm | | | |
| Layers | 63 | | | |
The charging current rates and temperatures often affect the battery characteristics, for they influence the electrochemical reaction speed; thus, we consider their effects on the three criteria in the following experiments. The charging and discharging equipment is MACCOR model 4300 (MACCOR, Tulsa, OK, USA), and the thermostatic equipment is Votsch C4-180 (Vötsch Industrietechnik, Stuttgart, Germany). The experimental procedures are elaborated as follows:
(1) Capacity and resistance calibration:
Six batteries in the same batch are selected, and their capacities and resistances are calibrated to make sure that their characteristics are almost the same. They, in turn, are numbered as No.1, No.2, No.3, No.4, No.5 and No.6, and each of them is discharged with 1 C (current rate) until it reaches minimum allowed voltage (2.5 V).
(2) Different charging current rate tests for CV stage
Set the temperature in the Votsch C4-180 to be 30 °C, and the CC/CV strategy is used to charge battery No.1. First, CC charging is applied at 0.5 current rate (4 A) until its voltage reaches the cut-off value (3.65 V). Then, the CV charging begins, the battery current decreases until it reaches below 0.01 current rate (0.08 A). The charging times and charging capacities of CV stage and the whole process can be shown by MACCOR model 4300. After recording the raw experimental data, the battery No.1 needs to be fully discharged with 1 current rate (8 A), then we repeat the experimental processes above, but only change the charging current in the CC stage to 1 current rate (8 A), 1.5 current rate (12 A), 2 current rate (16 A) as well as 2.5 current rate (20 A), respectively.
(3) Different temperature tests for CV stage
CC/CV strategy is used to charge battery No.2, but not in the same way outlined above in (2). The CC charging current is unchanged, which is set as 1 current rate (8 A). Instead, the charging tests under different temperatures (−10, 10, 30 and 50 °C) are considered, and the other test conditions are the same as those in (2).
(4) Different charging current rate tests for the charging time and charging capacity comparison between CC and CC/CV strategy
Set the temperature in the Votsch C4-180 to be 30 °C, CC strategy is used to charge battery No.3, and CC/CV strategy is used to charge battery No.4. In CC strategy, CC charging is applied at 0.5 current rate (4 A) until its voltage reaches the cut-off value (3.65 V), then the charging process is over. In CC/CV charging, battery No.4 is first charged with a constant current rate (0.5A) until its voltage reaches 3.65 V, then the CV stage begins, and the battery current decreases until it goes below 0.01 current rate (0.08 A). After recording the experimental data, the tests should be repeated under different charging current rates (1 current rate (8 A), 1.5 current rate (12 A), 2 current rate (16 A) as well as 2.5 current rate (20 A)).
(5) Different temperature tests for the charging time and charging capacity comparison between CC and CC/CV strategy
The test contents are similar to those in (4), but the charging current rate is fixed as 1 current rate (8 A), and the test temperatures are −10, 10, 30 and 50 °C, respectively.
(6) Different charging current rate and temperature tests for the charging energy efficiency comparison between CC and CC/CV strategy
Set the temperature in the Votsch C4-180 to be 30 °C, CC strategy is used to charge battery No.5, and CC/CV strategy is used to charge battery No.6, and the charging energy efficiencies of CC strategy and CC/CV strategy are recorded under different charging current rates (0.5 current rate (4 A), 1 current rate (8 A), 1.5 current rate (12 A), 2 current rate (16 A) as well as 2.5 current rate (20 A)). Then, the charging current rate is set to be unchanged, which is 1 current rate (8 A), and the charging energy efficiencies of CC strategy and CC/CV strategy are recorded under different test temperatures (−10, 10, 30 and 50 °C).
In
Figure 1 and
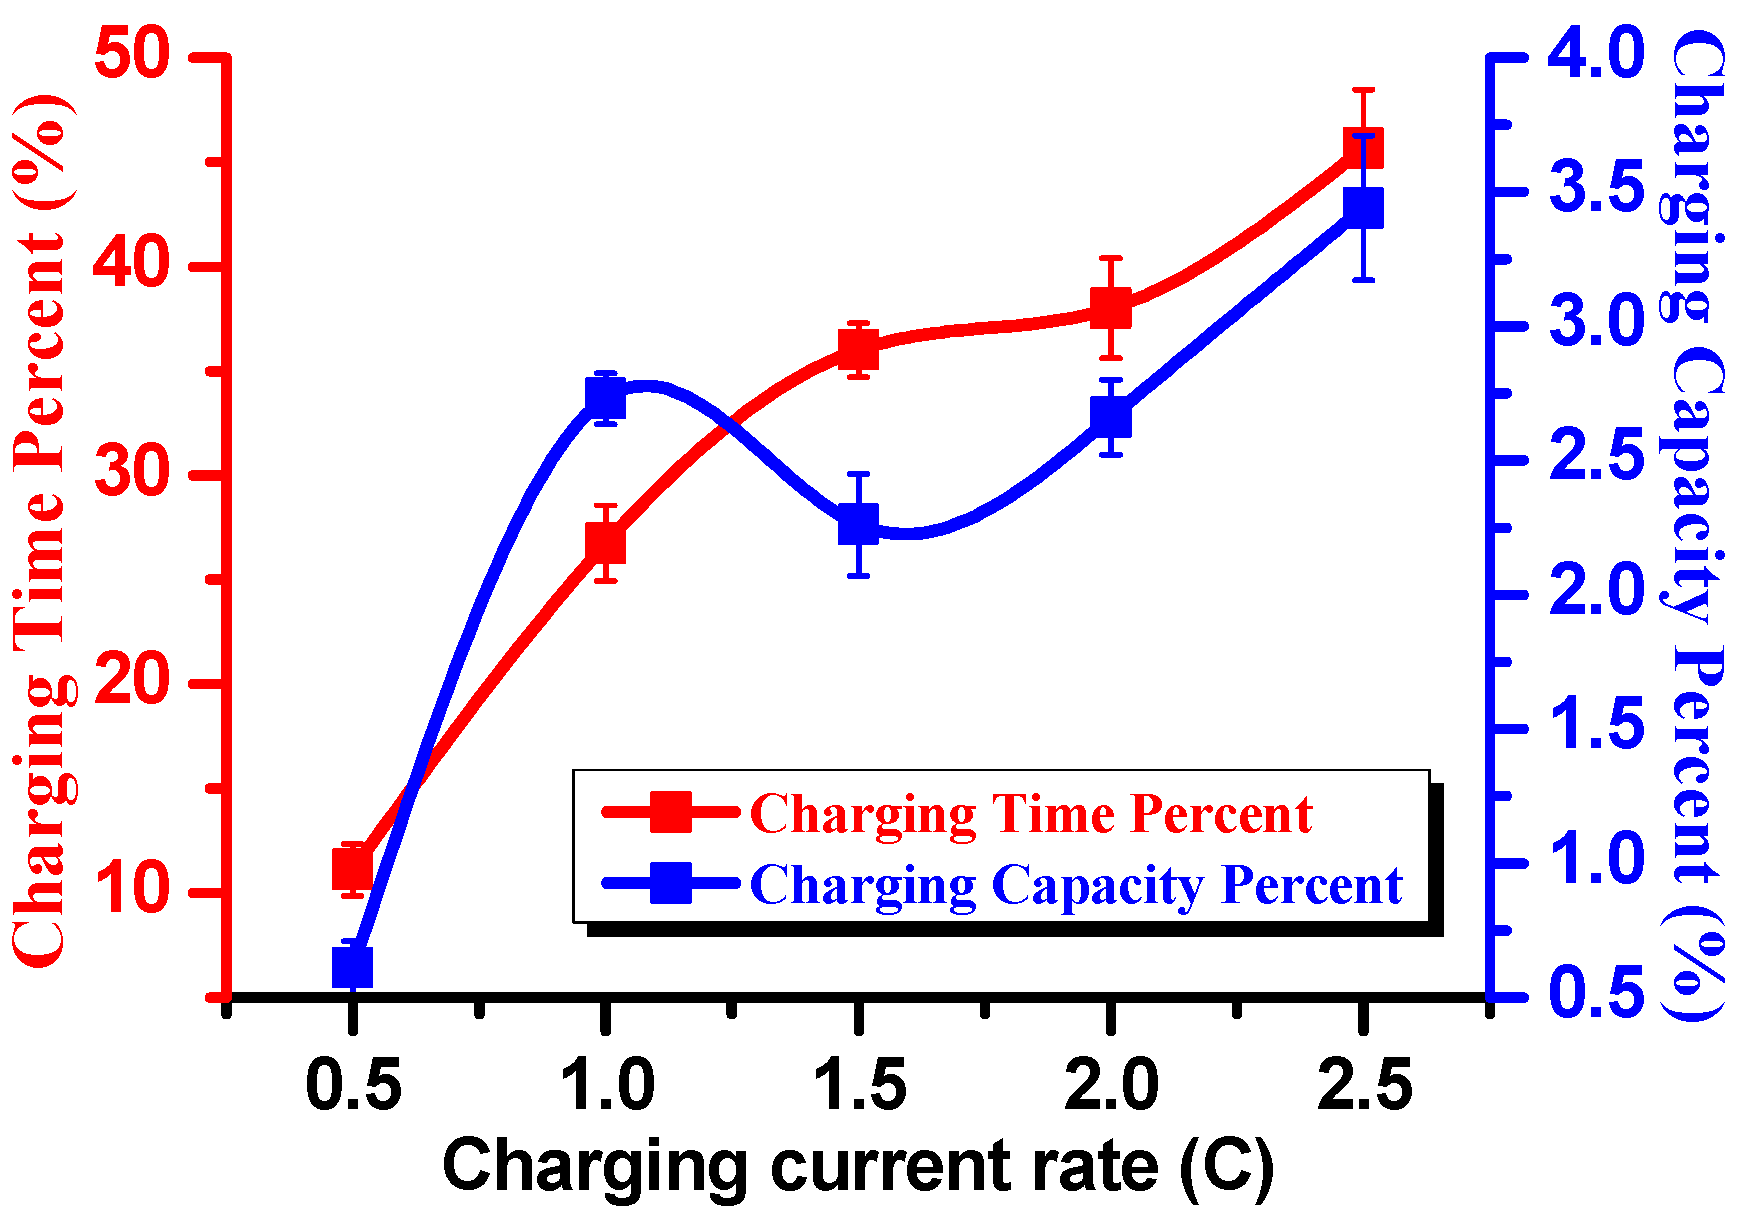
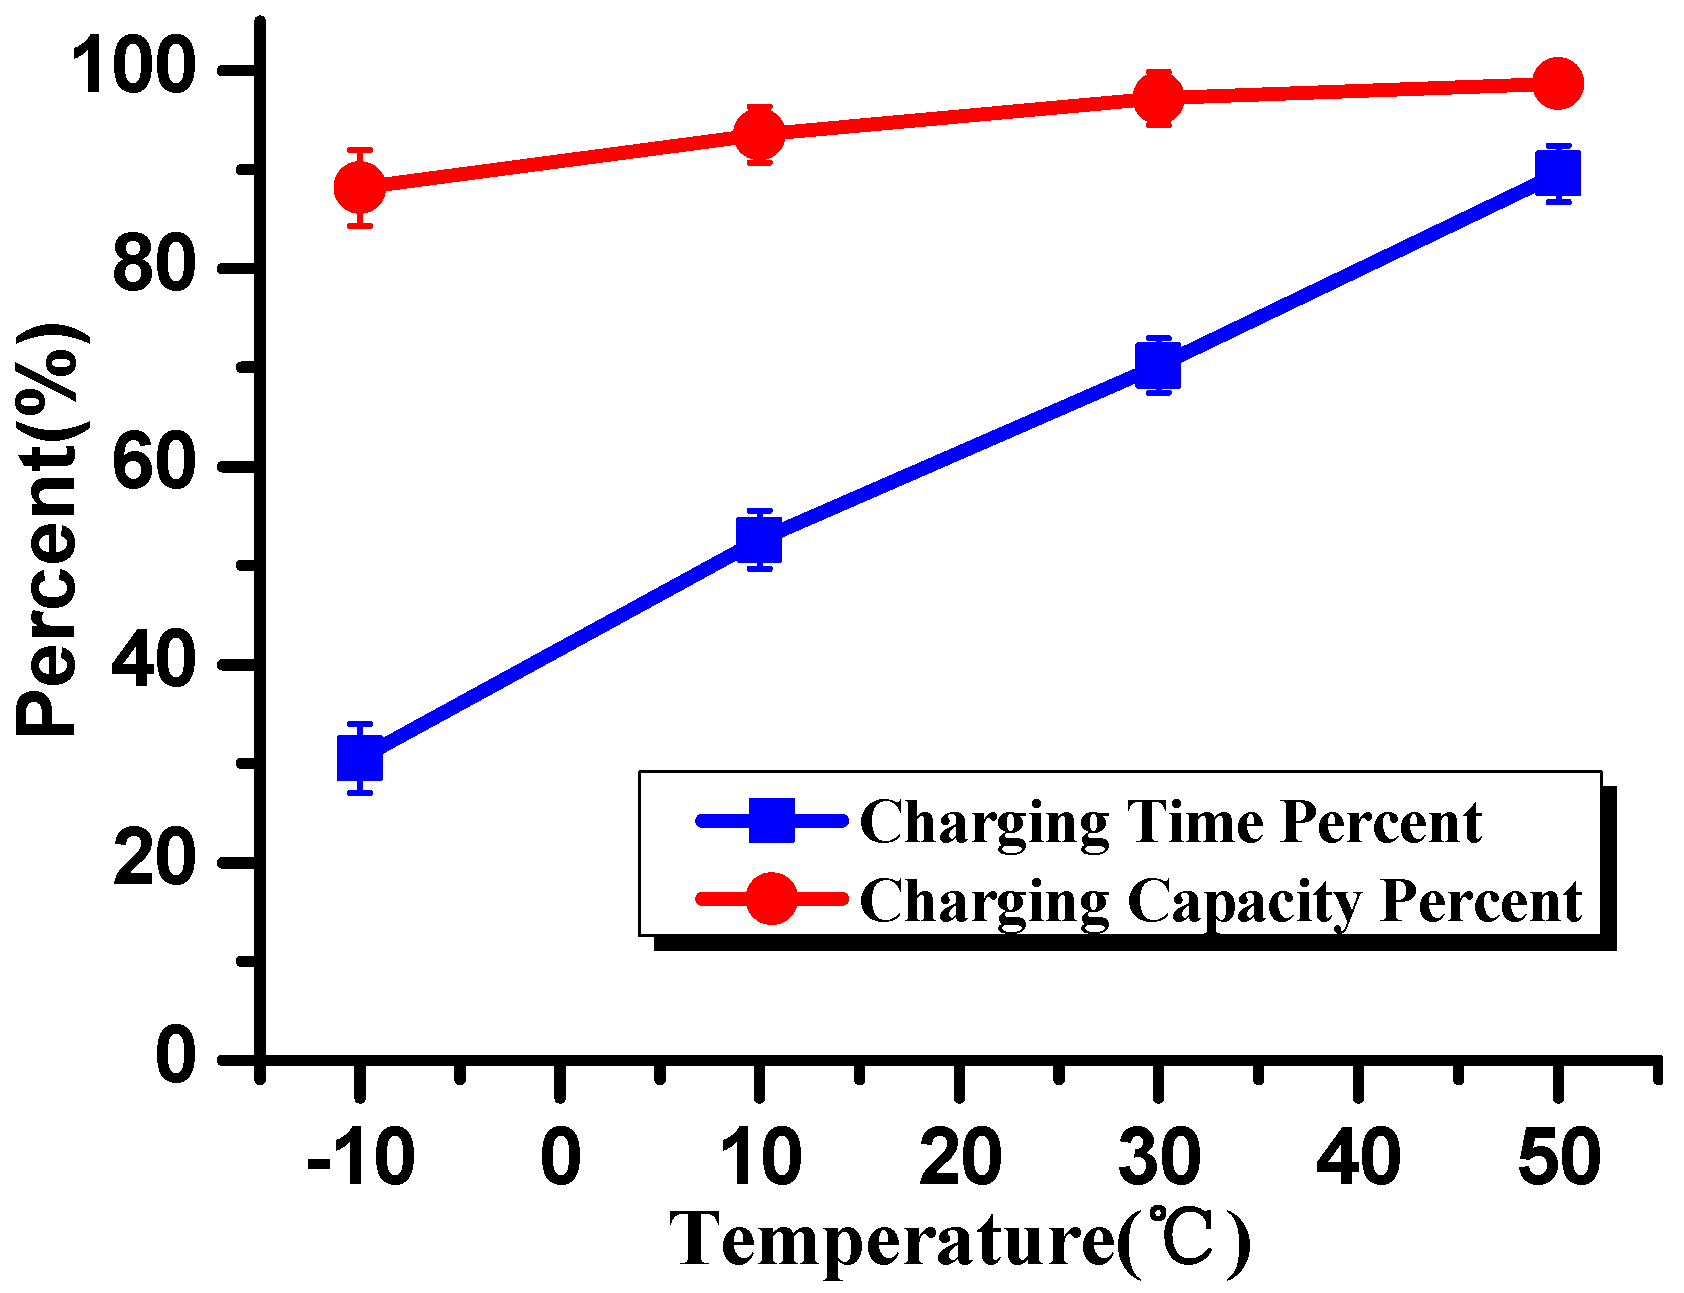
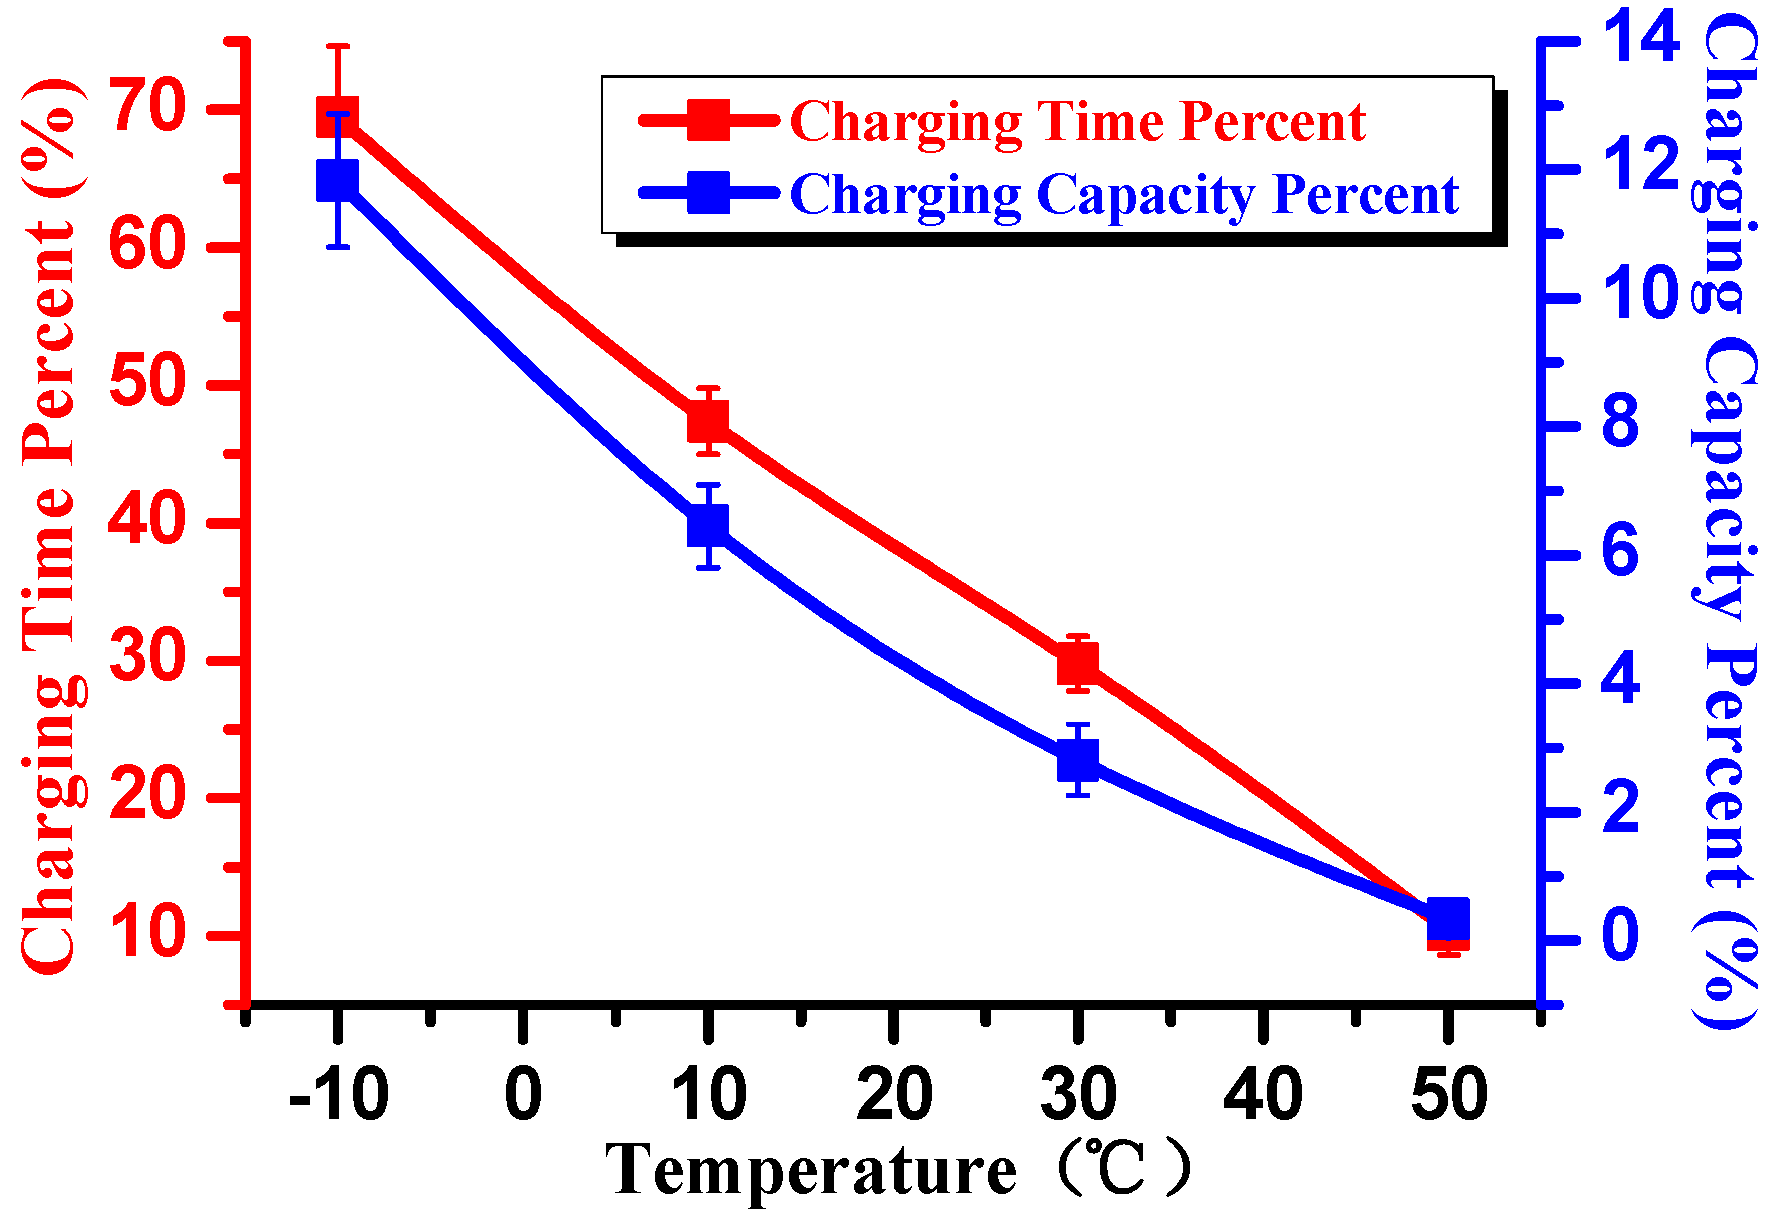
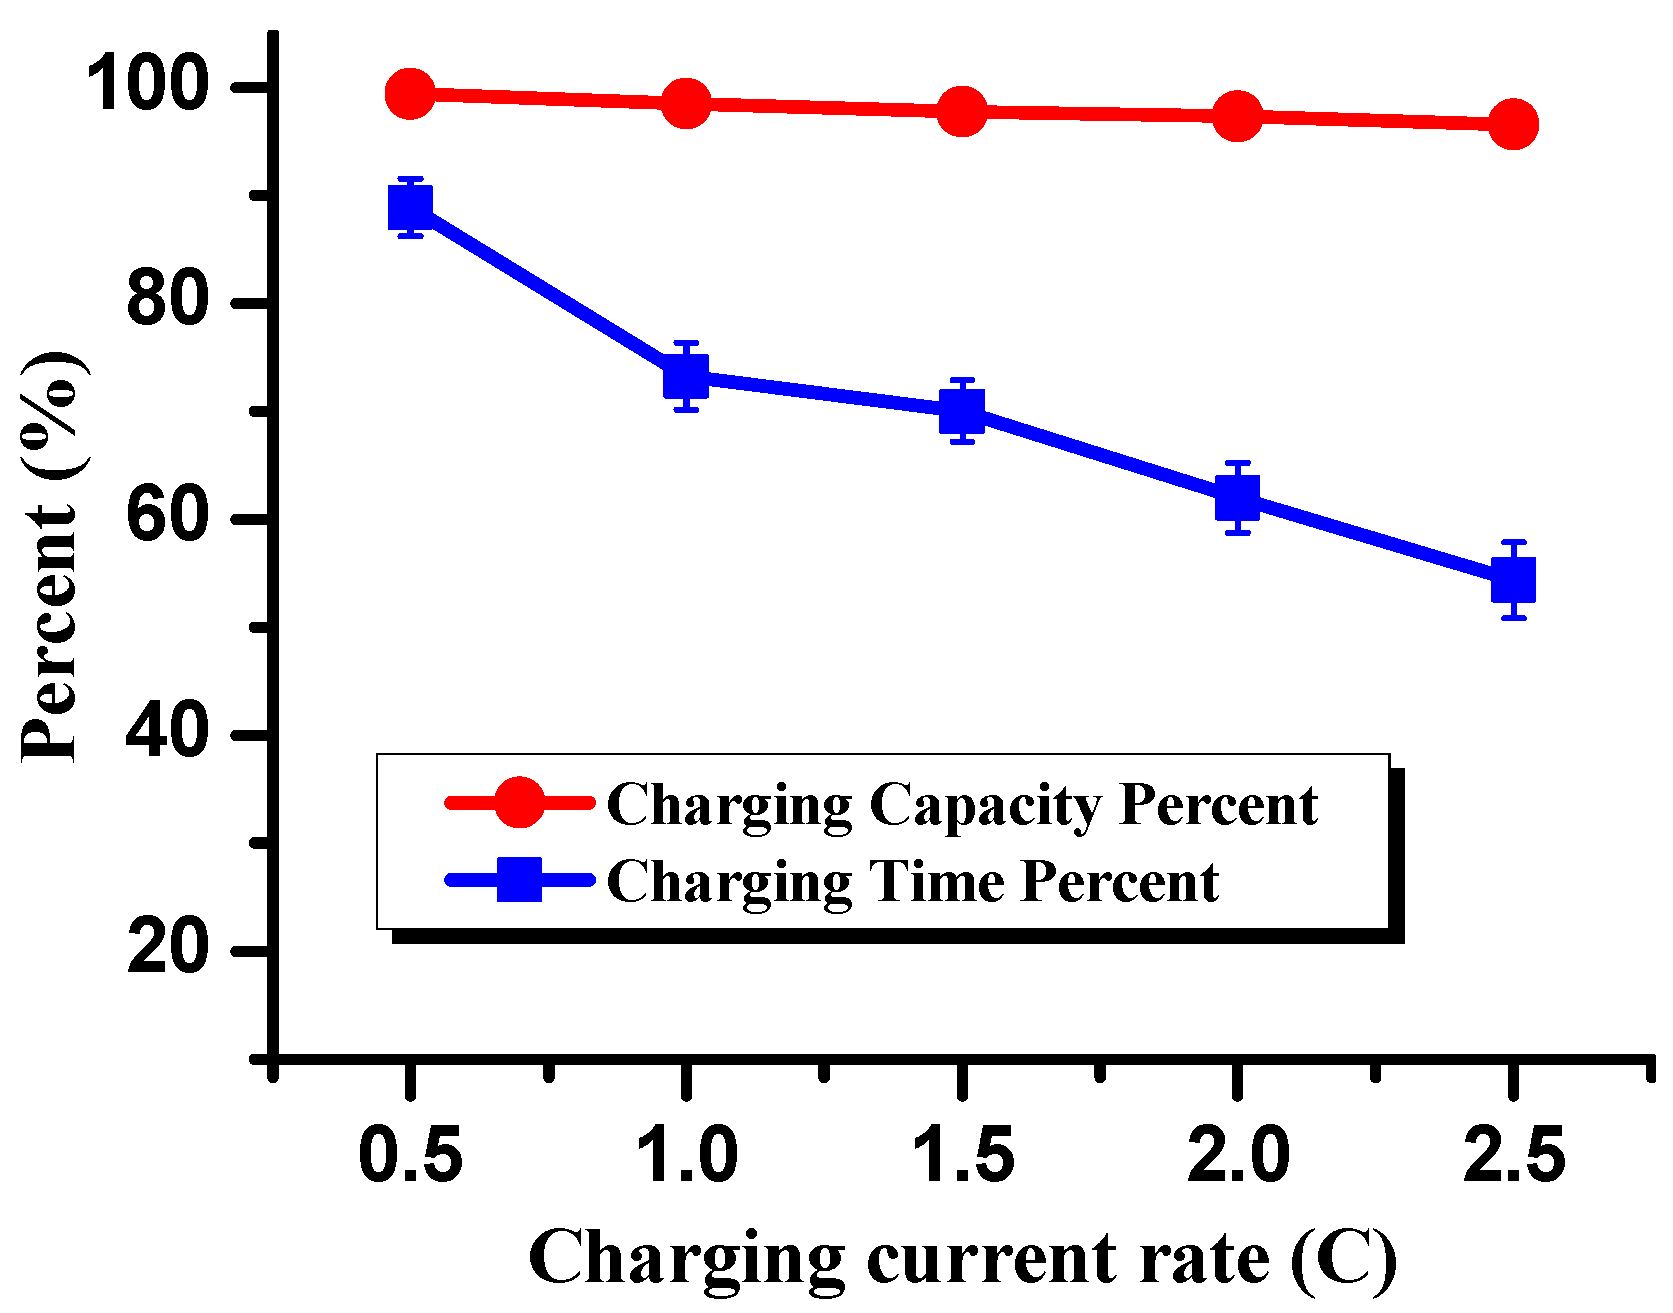
Figure 2, the blue coordinate represents the ratio between the capacity charged in the CV stage and that charged in the whole CC/CV process, and the red coordinate shows the time taken by the CV stage and that taken by the whole CC/CV process.
Figure 1 shows that the bigger the charging rate, the bigger the time percentage and capacity percentage in the CV stage, but the increments of time percentages are far greater than that of the capacity.
Figure 2 shows that the higher the temperature, the smaller the time percentage and capacity percentage in the CV stage, but the decrements of time percentages are far greater than that of the capacity. In summary, they indicate that the CV stage takes much charging time, but with less energy charging into the battery.
Then, we further compare the characteristics of CC strategy and CC/CV strategy based on the charging time, the charging capacity as well as the charging energy efficiency. It is worth mentioning that the cut-off voltage should be the same in the two charging strategies. In
Figure 3, the blue curve represents the ratio between the time taken by CC strategy and that taken by CC/CV strategy, and the red curve represents the ratio between the capacity charged in CC strategy and that charged in CC/CV strategy. It clearly shows that the total capacity charged in the CC strategy is almost identical to that charged in the CC/CV strategy, and the ratio between them is higher than 96% despite different charging rates. Additionally, the charging time taken by the CC strategy is much smaller than that taken by the CC/CV strategy, especially under high charging rate conditions.
Another two batteries in the same batch are used to test the same contents in
Figure 3, but with different temperatures, as shown in
Figure 4. It shows that the capacity charged in CC strategy is nearly the same as that charged in CC/CV strategy when at a high temperature range. At low temperatures, the charging capacity differences between CC strategy and CC/CV strategy become obvious due to the slower electrochemical reaction speed. Thus, the CV stage is necessary for the battery charging at low temperatures, but it takes an extremely long time. Fortunately, charging at low temperatures does not happen too often in practice.
Figure 1.
Charging capacity percentage and charging time percentage of CV stage in CC/CV (constant current/constant voltage) strategy at different charging current rates.
Figure 1.
Charging capacity percentage and charging time percentage of CV stage in CC/CV (constant current/constant voltage) strategy at different charging current rates.
Figure 2.
Charging capacity percentage and charging time percentage of CV stage in CC/CV strategy at different temperatures.
Figure 2.
Charging capacity percentage and charging time percentage of CV stage in CC/CV strategy at different temperatures.
Figure 3.
Charging time percentage and charging capacity percentage between CC strategy and CC/CV strategy at different charging current rates.
Figure 3.
Charging time percentage and charging capacity percentage between CC strategy and CC/CV strategy at different charging current rates.
Figure 4.
Charging time percentage and charging capacity percentage between CC strategy and CC/CV strategy at different temperatures.
Figure 4.
Charging time percentage and charging capacity percentage between CC strategy and CC/CV strategy at different temperatures.
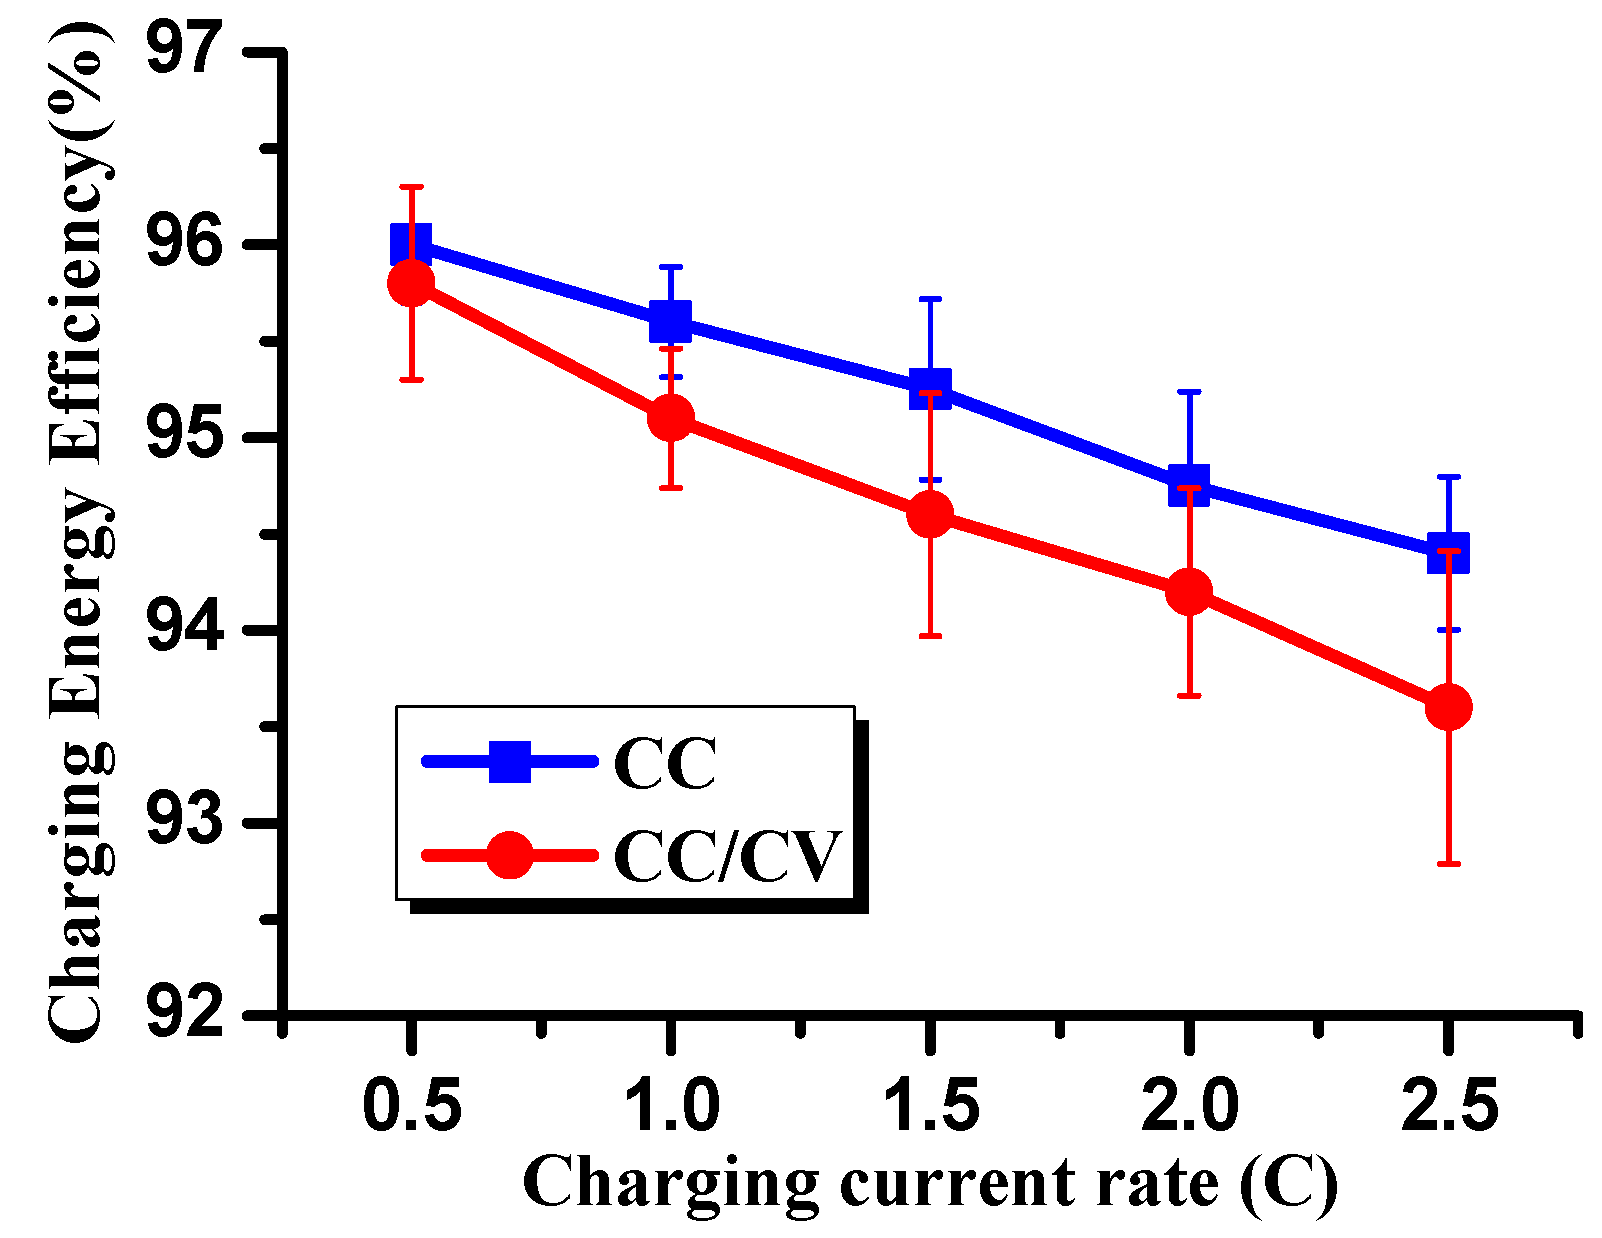
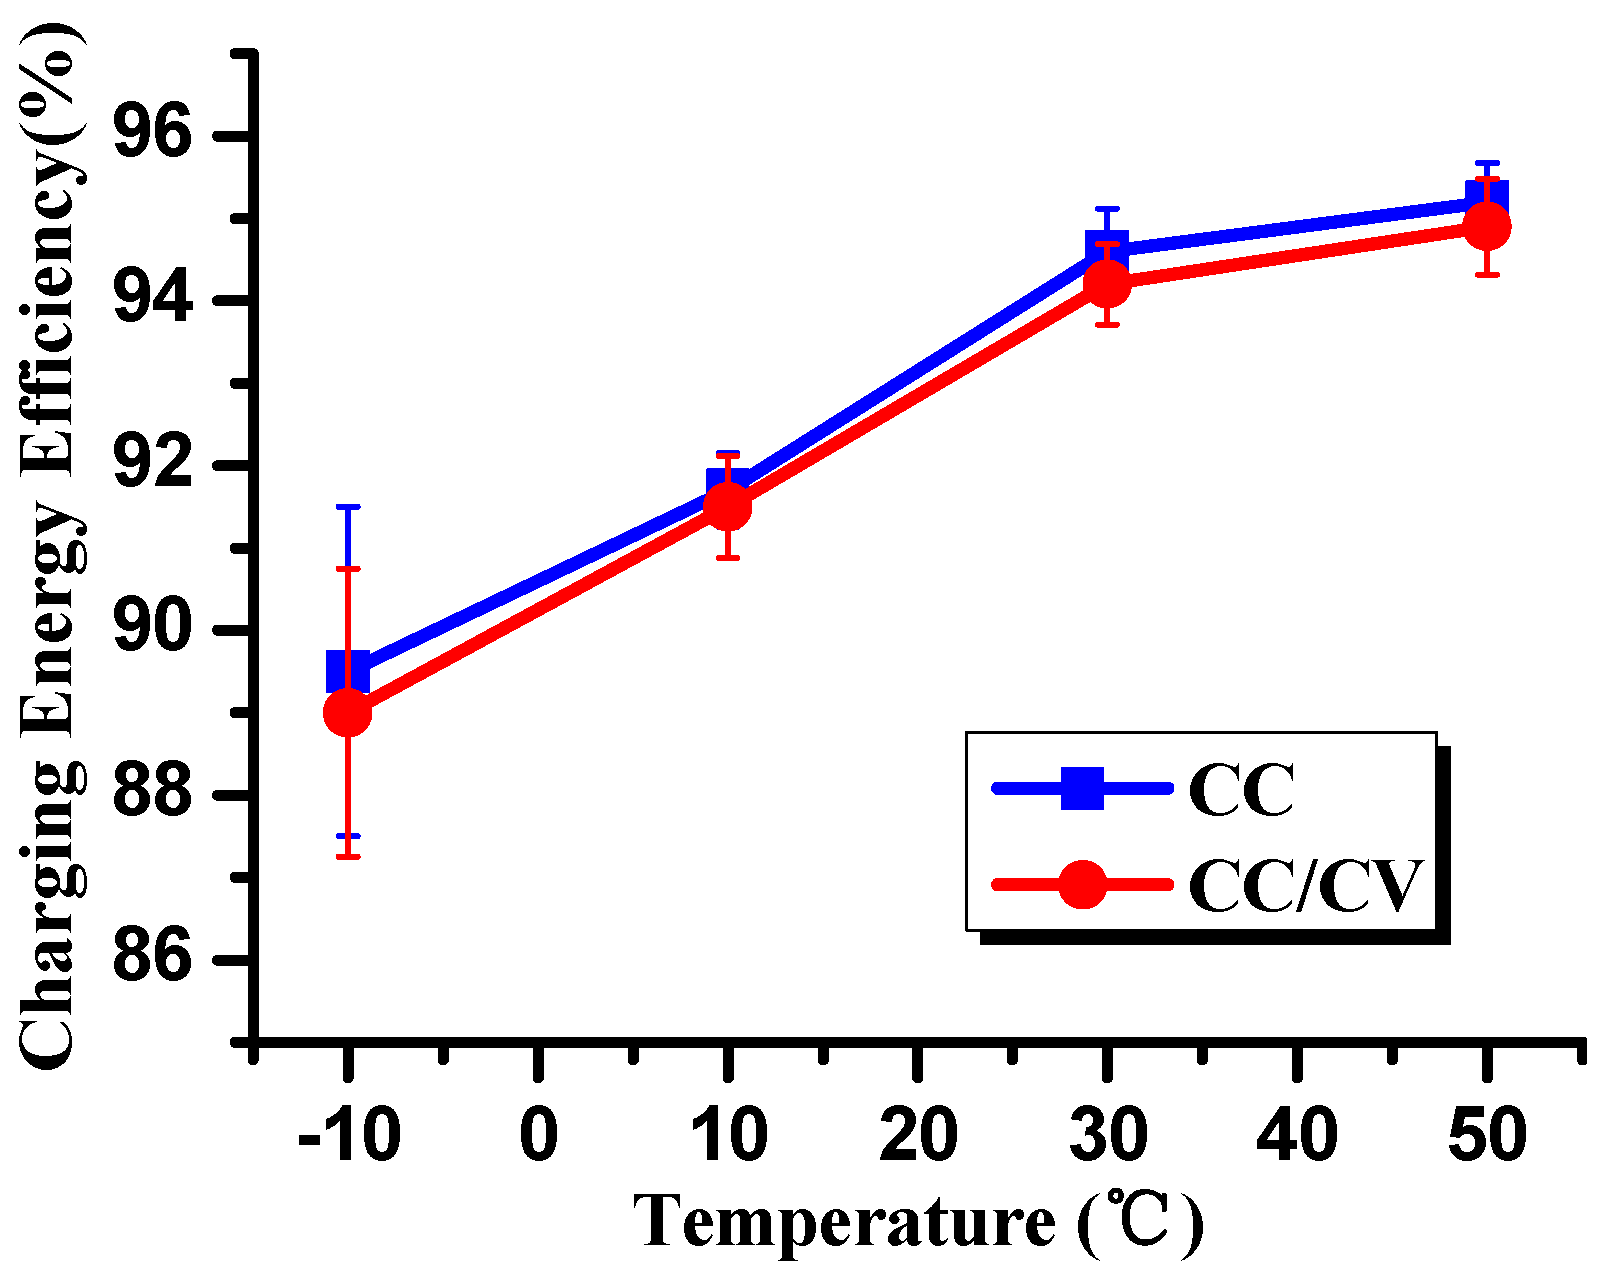
Subsequently, the charging energy efficiencies between CC strategy and CC/CV strategy are compared at different charging current rates and temperatures, and the results are shown in
Figure 5 and
Figure 6. Both indicate that the charging energy efficiency of CC strategy is always higher than that of CC/CV strategy despite different charging rates and temperatures. Additionally, CC strategy can slow down the capacity fading of the batteries compared to the CC/CV strategy [
27]. Thus, we can deduce that CC strategy is superior to CC/CV strategy, and thus is more suitable for battery wireless charging.
Figure 5.
Charging energy efficiencies of CC strategy and CC/CV strategy at different charging current rates.
Figure 5.
Charging energy efficiencies of CC strategy and CC/CV strategy at different charging current rates.
Figure 6.
Charging energy efficiencies of CC strategy and CC/CV strategy at different temperatures.
Figure 6.
Charging energy efficiencies of CC strategy and CC/CV strategy at different temperatures.
3. State Space Model of the Receiver
A typical wireless charging system, including the PFC (power factor correction), the H Bridge, the resonant topology, the rectifier, the DC/DC and the load, is shown in
Figure 7.
Figure 7.
Schematic of wireless charging system, AC represents the 220 V alternating current power grid, PFC (power factor correction) is normally a boost converter, LCL is a kind of resonant topology and DC/DC is used to regulate the transfer power.
Figure 7.
Schematic of wireless charging system, AC represents the 220 V alternating current power grid, PFC (power factor correction) is normally a boost converter, LCL is a kind of resonant topology and DC/DC is used to regulate the transfer power.
In this paper, a LCL-LCL topology is adopted. Because the LCL topology is a variant derived from LC parallel topology, it has a CC characteristic; thus, the transmitter can produce a sine current with a constant amplitude despite different magnetic coupling conditions, and the receiver can also produce an unchanged charging current for the battery. In this case, the DC/DC part is useless, for the CC charging function is substituted by the LCL topology, and the power regulation function is substituted by the H Bridge. Thus, we can remove the DC/DC part, and it is beneficial to improve the transfer efficiency, because the power MOSFETs in the DC/DC part will induce additional switching losses. Then, the schematic shown in
Figure 7 can be simplified as
Figure 8.
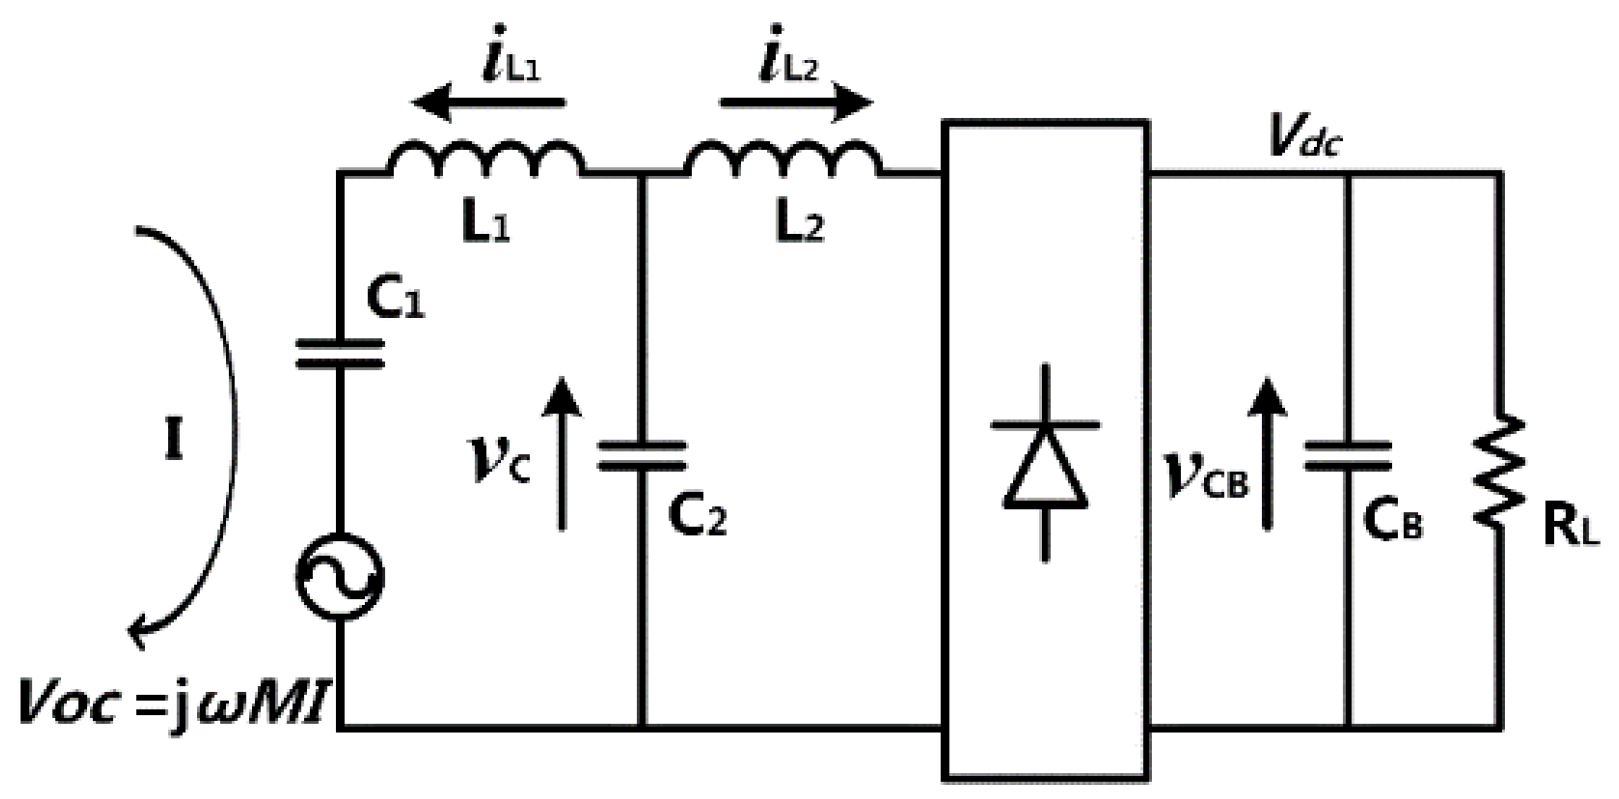
Figure 8.
Simplified equivalent circuit of the receiver.
Figure 8.
Simplified equivalent circuit of the receiver.
Where I represents the current produced by the transmitter, M represents the mutual inductance between the two magnetic coils of the transmitter and receiver, ω is the system operating frequency, and VOC is the transmitted voltage from the transmitter to the receiver. L1 is the magnetic coil that couples with transmitter through the magnetic field, C2 is the resonant capacitor, and L2 is the matching inductor of L1, which makes the reflected impedance from the receiver to the transmitter purely resistive. Because the receiver should be mounted on the vehicle chassis, the height of the magnetic coils L1 should be far smaller than the distance between the ground and chassis. Obviously, the helix coil is not appropriate, and thus the magnetic coil L1 is designed to be a spiral coil. As we know, the bigger the coupling coefficient, the higher the transfer efficiency, so the magnetic coil L1 is usually bulky to pursue a big coupling coefficient, and this leads to a bulky matching inductor L2, since their inductances must be identical. With the purpose of reducing the volume and weight of the matching inductor L2, we add an additional compensating capacitor C1, and the equivalent inductance of L1 and C1 should be the same as that of L2. Additionally, CB is a filter capacitor and RL is the load.
A state space model is introduced to analyze the system dynamic characteristics. First, we should select the appropriate state variables. Although the state variables are diverse, which include physical variables, phase variables, canonical variables and so on, the physical state variables are used in this paper, as they can directly describe the system characteristics. So, we have
where
vC(t),
,
and
vCB(
t) represent the voltage across the resonant capacitor
C2, the current flowing through the inductor
L1, the current flowing through the inductor
L2 and the voltage across the capacitor
CB, respectively. According to KVL, the differential equations can be written as
where the voltage
Vdc across the capacitor
CB is assumed to be constant, and the forward voltages of the four diode are neglected. Normally, the forward voltage of the power diode is around 0.7 V, and the voltage level of the battery pack for electric vehicles is around 300 V, which is far greater than 0.8 V. In the state space model, the equivalence simplification between the AC side and the DC side is very important. The sinusoidal current
in the AC side changes to a positive half-sine-wave current (
) after flowing through the rectifier. Additionally, the DC voltage
vCB(
t) in the DC side is equivalent to a quasi-square-wave voltage (±
vCB(
t)) in the AC side. Then, the state space model can be written as
For battery charging, the load
RL should be substituted by a voltage source
VB as well as its internal resistance
RB, and the differential equations should be rewritten as
where
IC is another state variable which represents the charging current for the battery.
Table 2 shows the specific parameters used in the state space model.
Table 2.
Specific parameters in the state space model.
Table 2.
Specific parameters in the state space model.
| Parameter | Value |
|---|
| Magnetic coil L1 | 164.5 μH |
| Mutual inductance M | 64 μH |
| Transfer distance D | 20 cm |
| Operating frequency f | 80 kHz |
| Matching inductor L2 | 40 μH |
| Compensating capacitor C1 | 31.82 nF |
| Resonant capacitor C2 | 99.05 nF |
| Filter capacitor CB | 160 μF |
| Battery pack voltage VB | 300 V |
| Internal resistance RB | 0.8 mΩ |
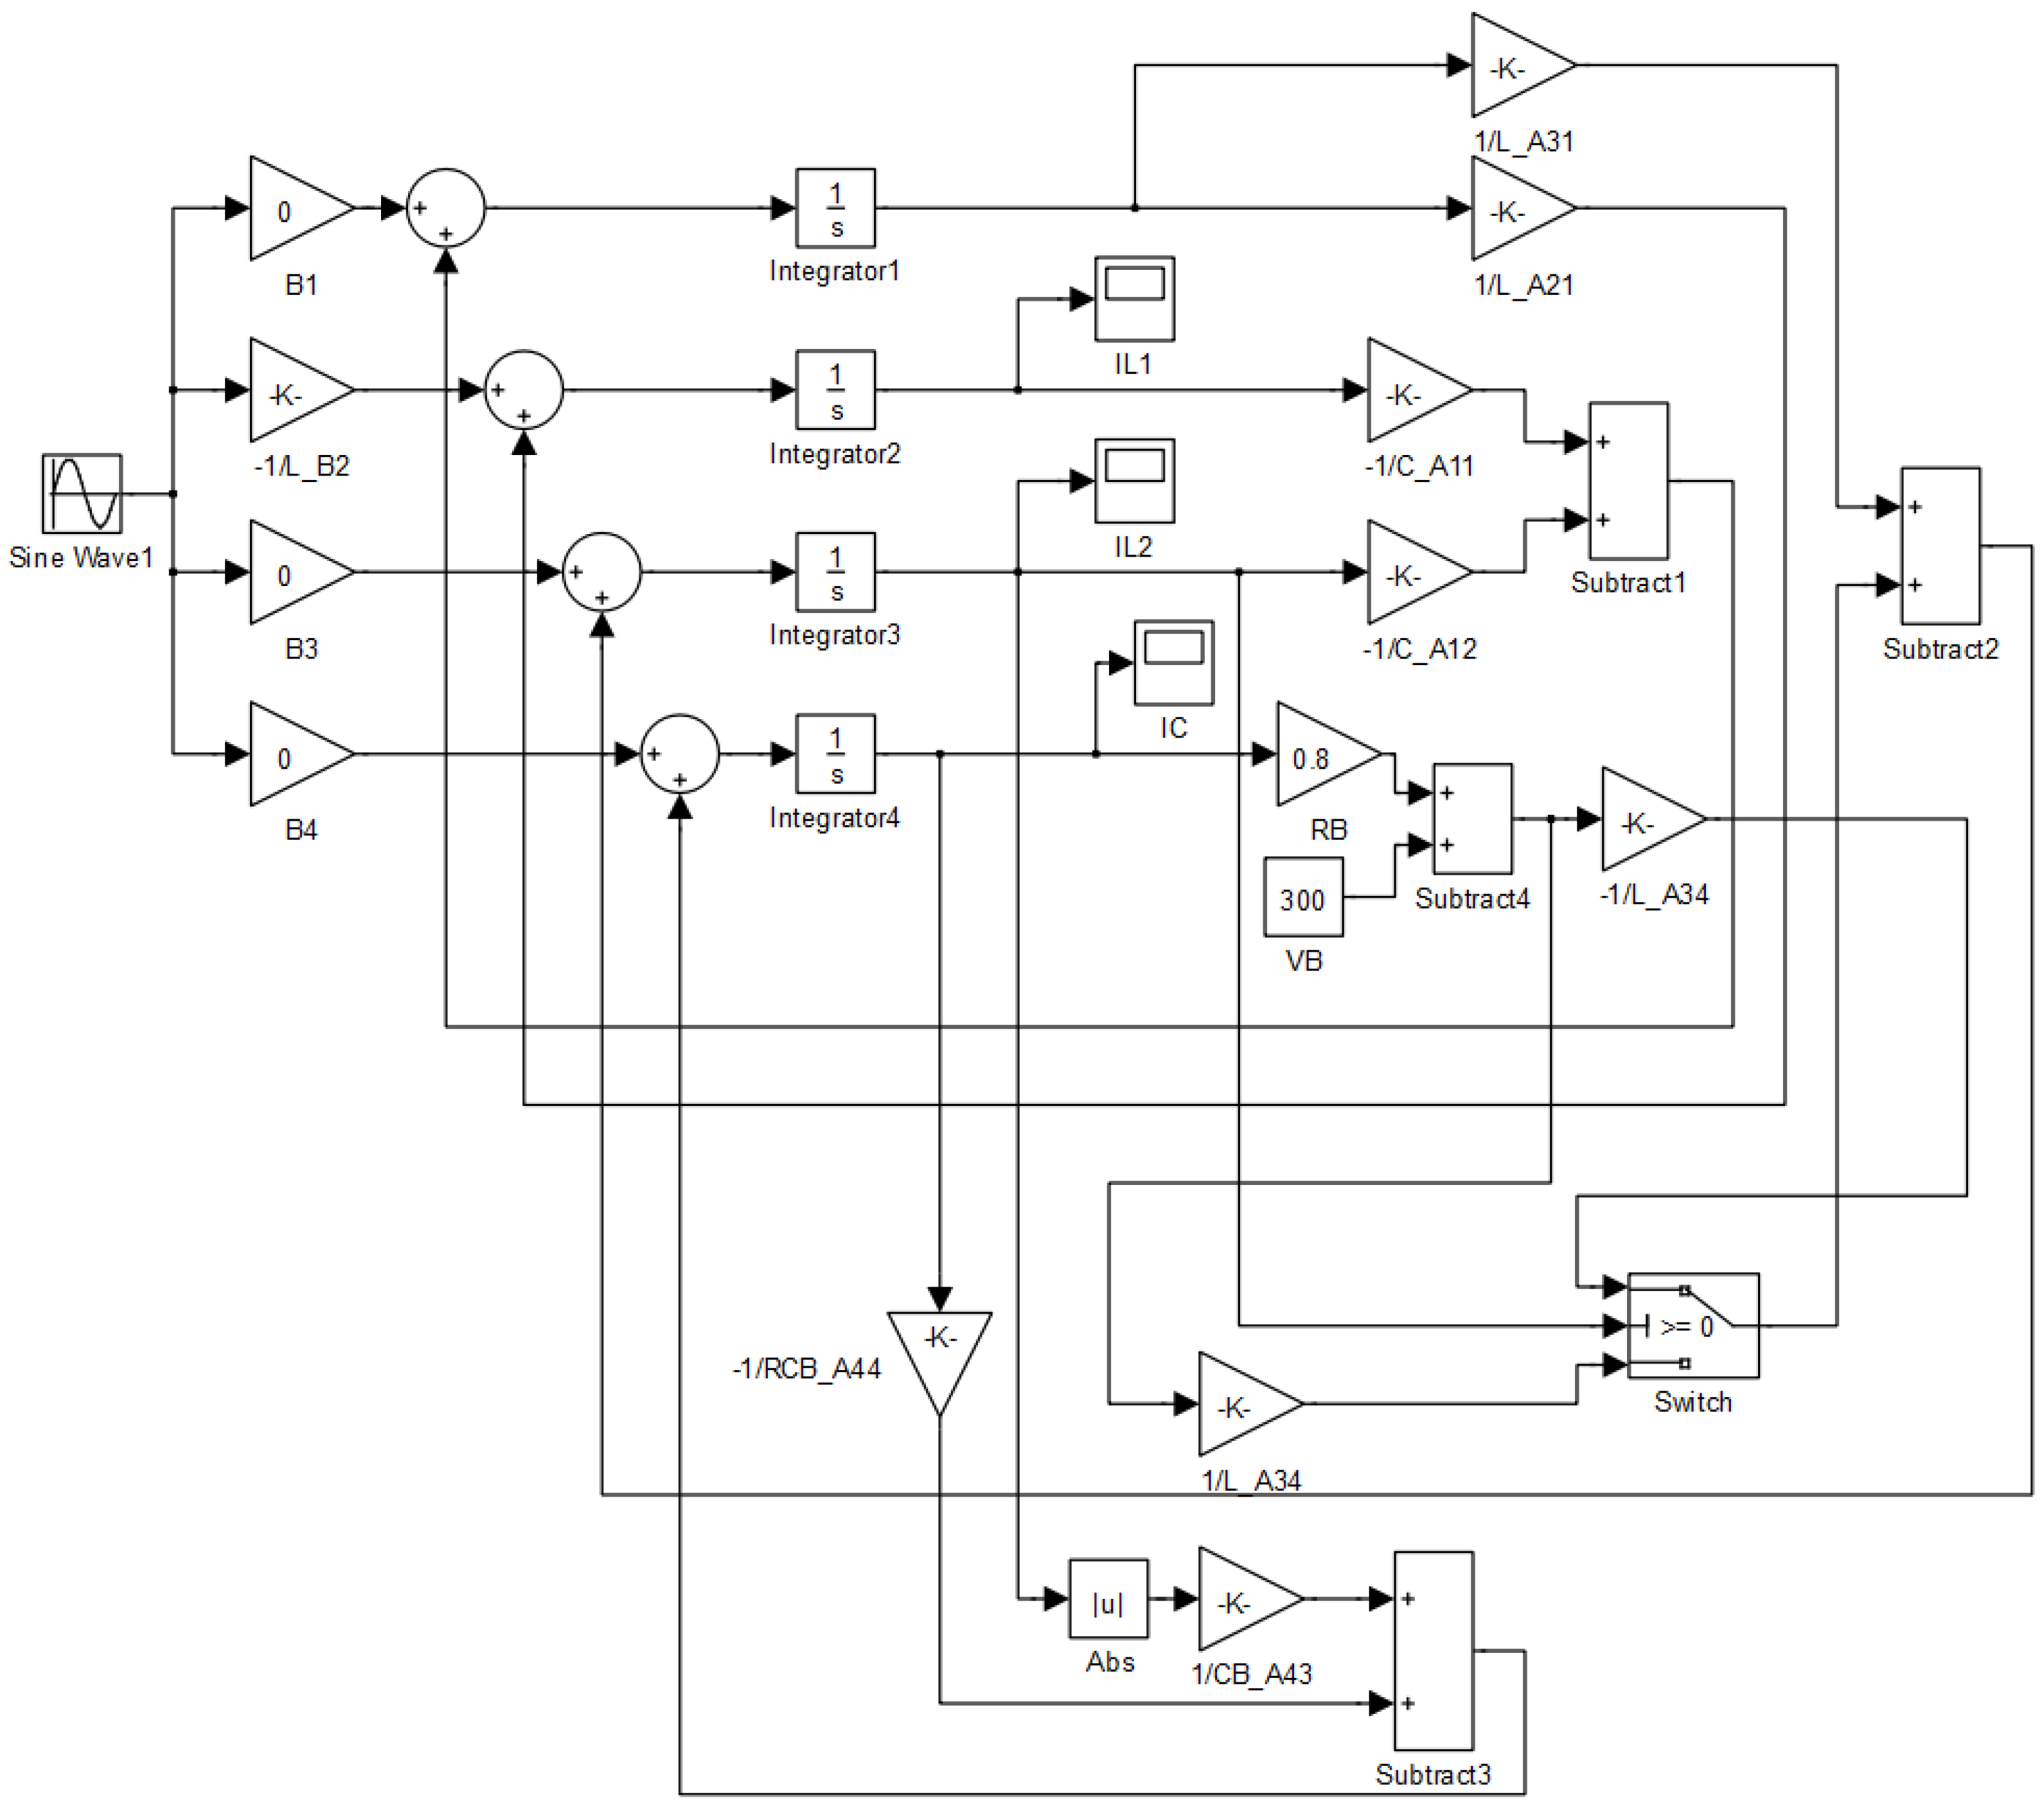
The current produced by the transmitter is around 10 A, which can be regulated by the phase shifting control of the H Bridge. Substitute these parameters into Equation (4), we can have the state space model as shown in
Figure 9.
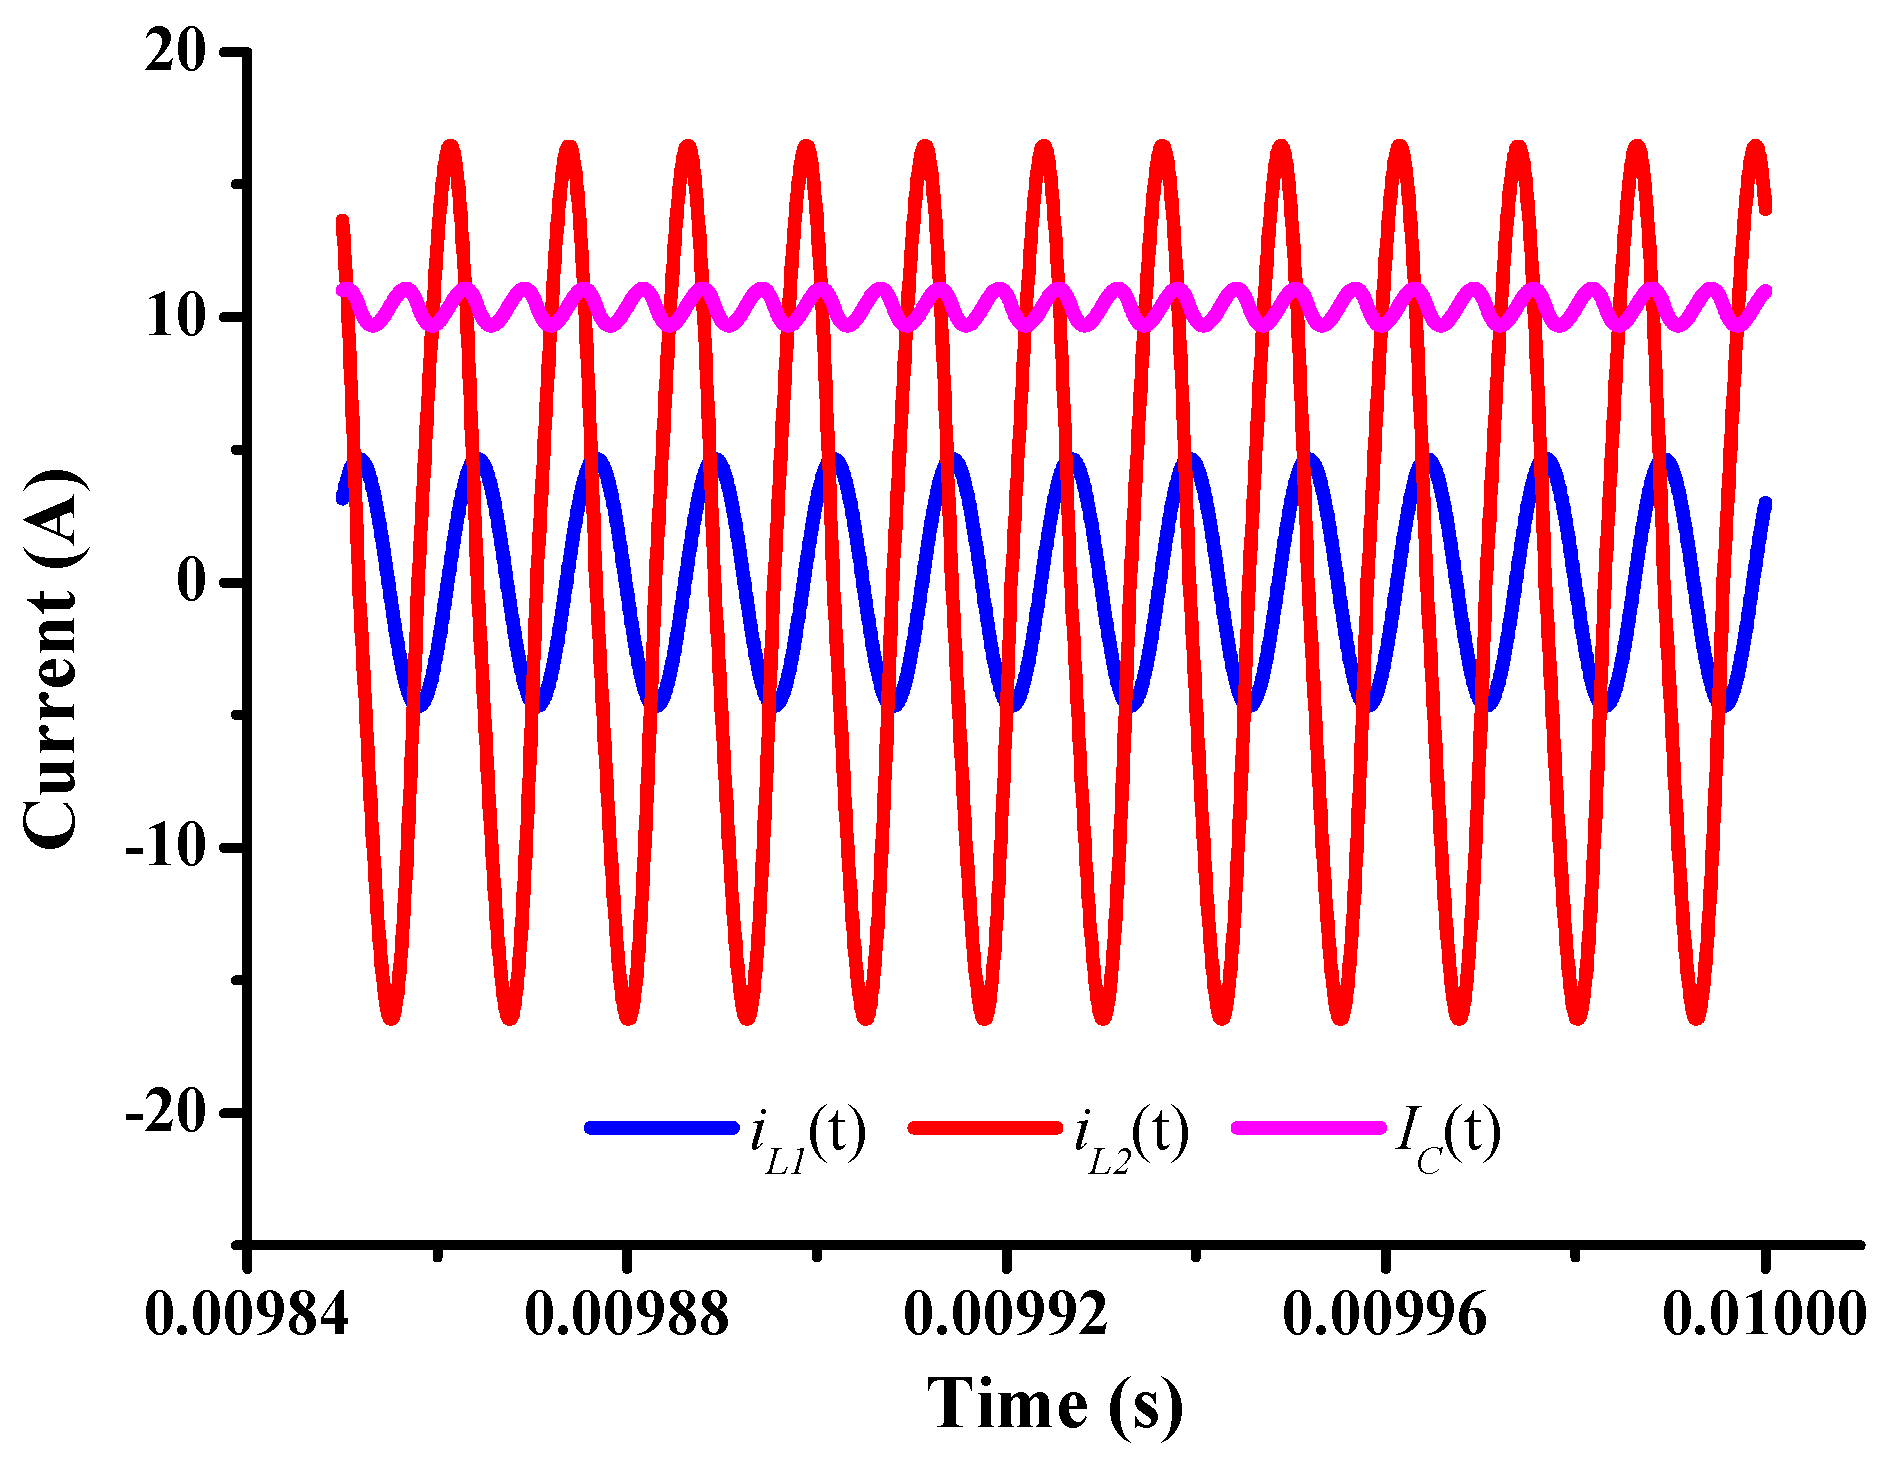
Based on the state space model, we can analyze the system dynamic characteristics as shown in
Figure 10. It clearly shows that
lags 90 degrees behind
, which shows a good agreement with the theoretical result [
28], and there are some superimposed ripples on the charging current
IC.
Figure 9.
State space model based on the equivalent circuit.
Figure 9.
State space model based on the equivalent circuit.
Figure 10.
Dynamic characteristics of the currents in the receiver.
Figure 10.
Dynamic characteristics of the currents in the receiver.
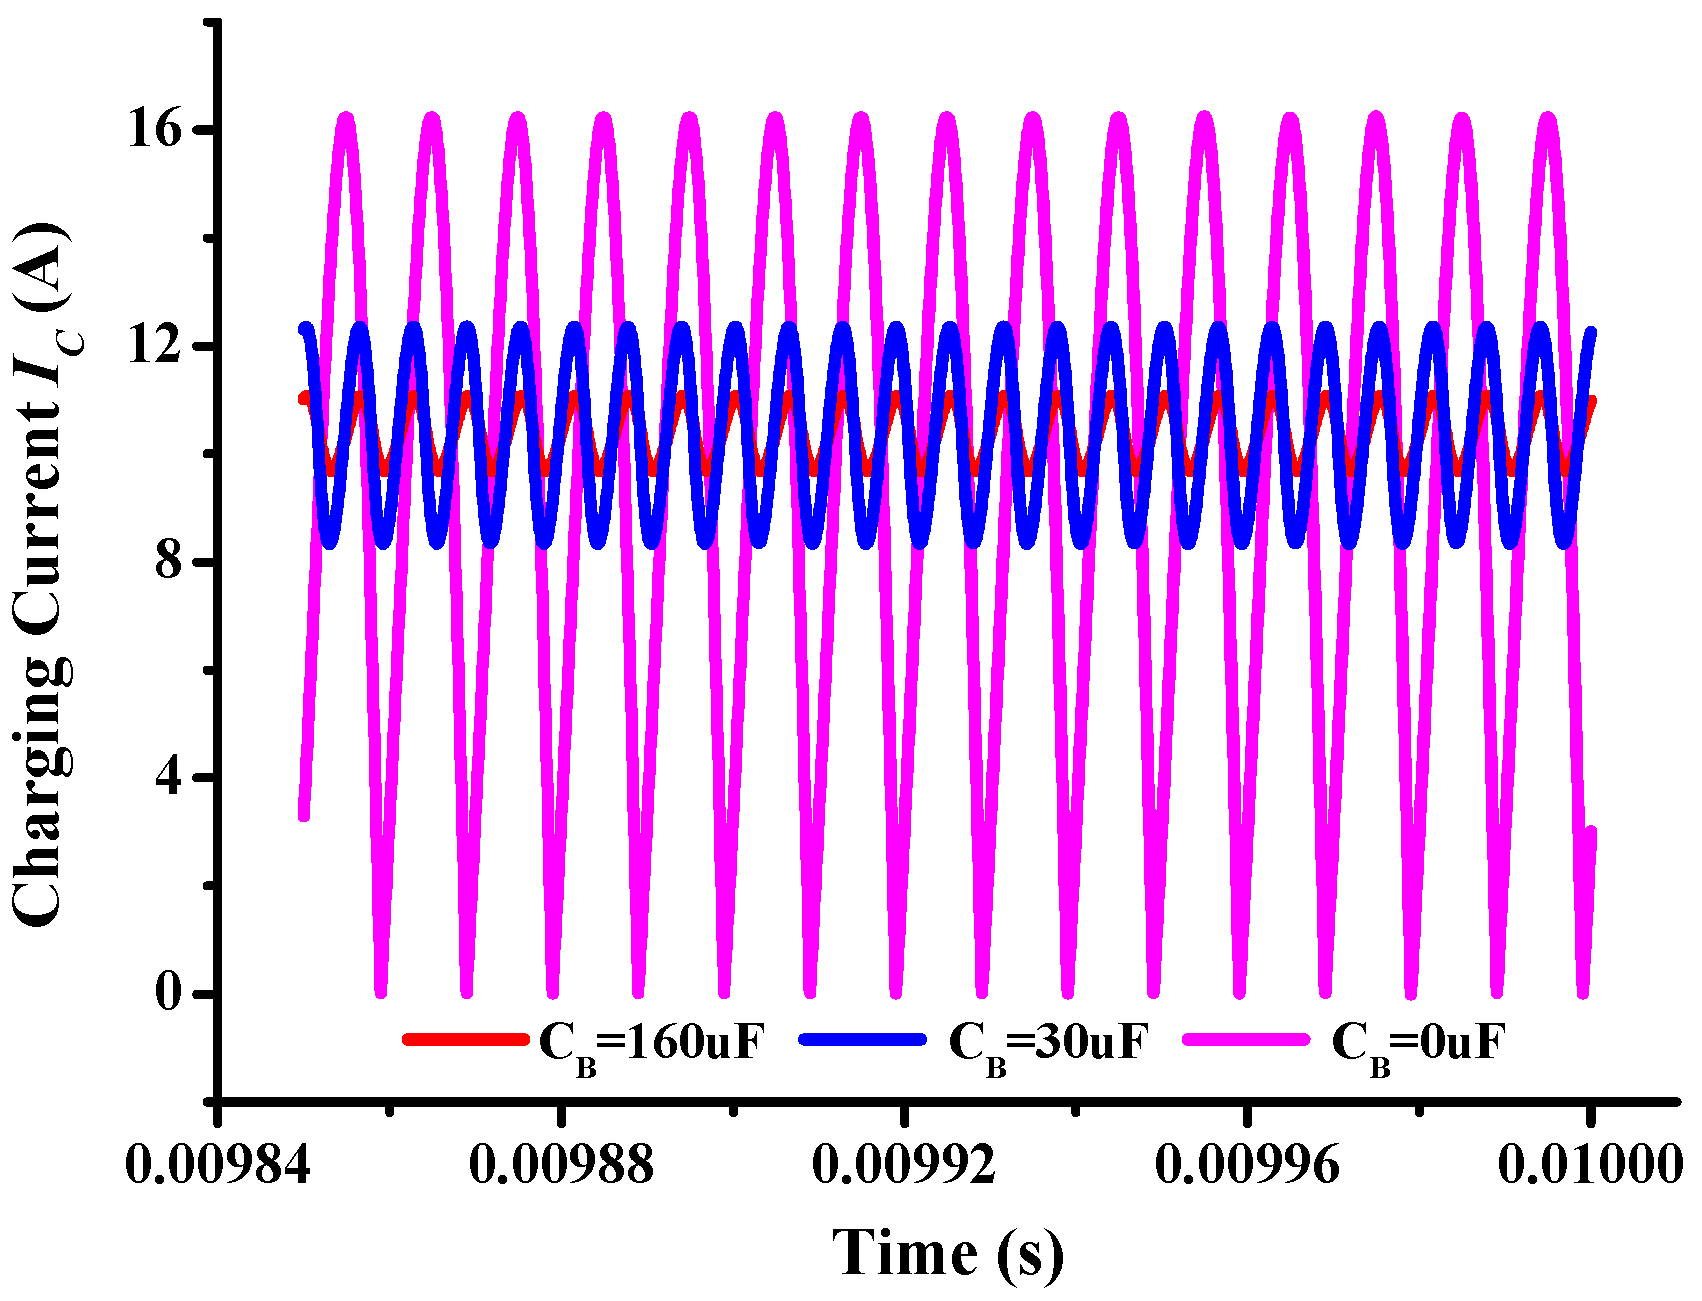
As we know, the filter capacitors are necessary for the traditional charger design, since the load requires a rated voltage to work, and the ripple currents or voltages must be limited under the pre-designed value. However, the design may be different for the battery wireless charging. As the power battery has a strong voltage source characteristic and the LCL-LCL topology has a CC charging characteristic, the filter capacitors can be reduced or even removed. These can reduce the volume and weight of the receiver, which are helpful to improve the system power density. By reducing or removing the filter capacitor
CB in Equation (4), we can have the state space models under different situations.
Figure 11 shows the charging currents for the battery when the filter capacitor takes different values. It clearly shows that the smaller the filter capacitor, the bigger the ripple current. When there is no filter capacitor, the charging current becomes a sinusoidal half-wave current.
Figure 11.
Charging currents with different filter capacitors.
Figure 11.
Charging currents with different filter capacitors.
4. Rationality Validation of Nonuse Filter Capacitor
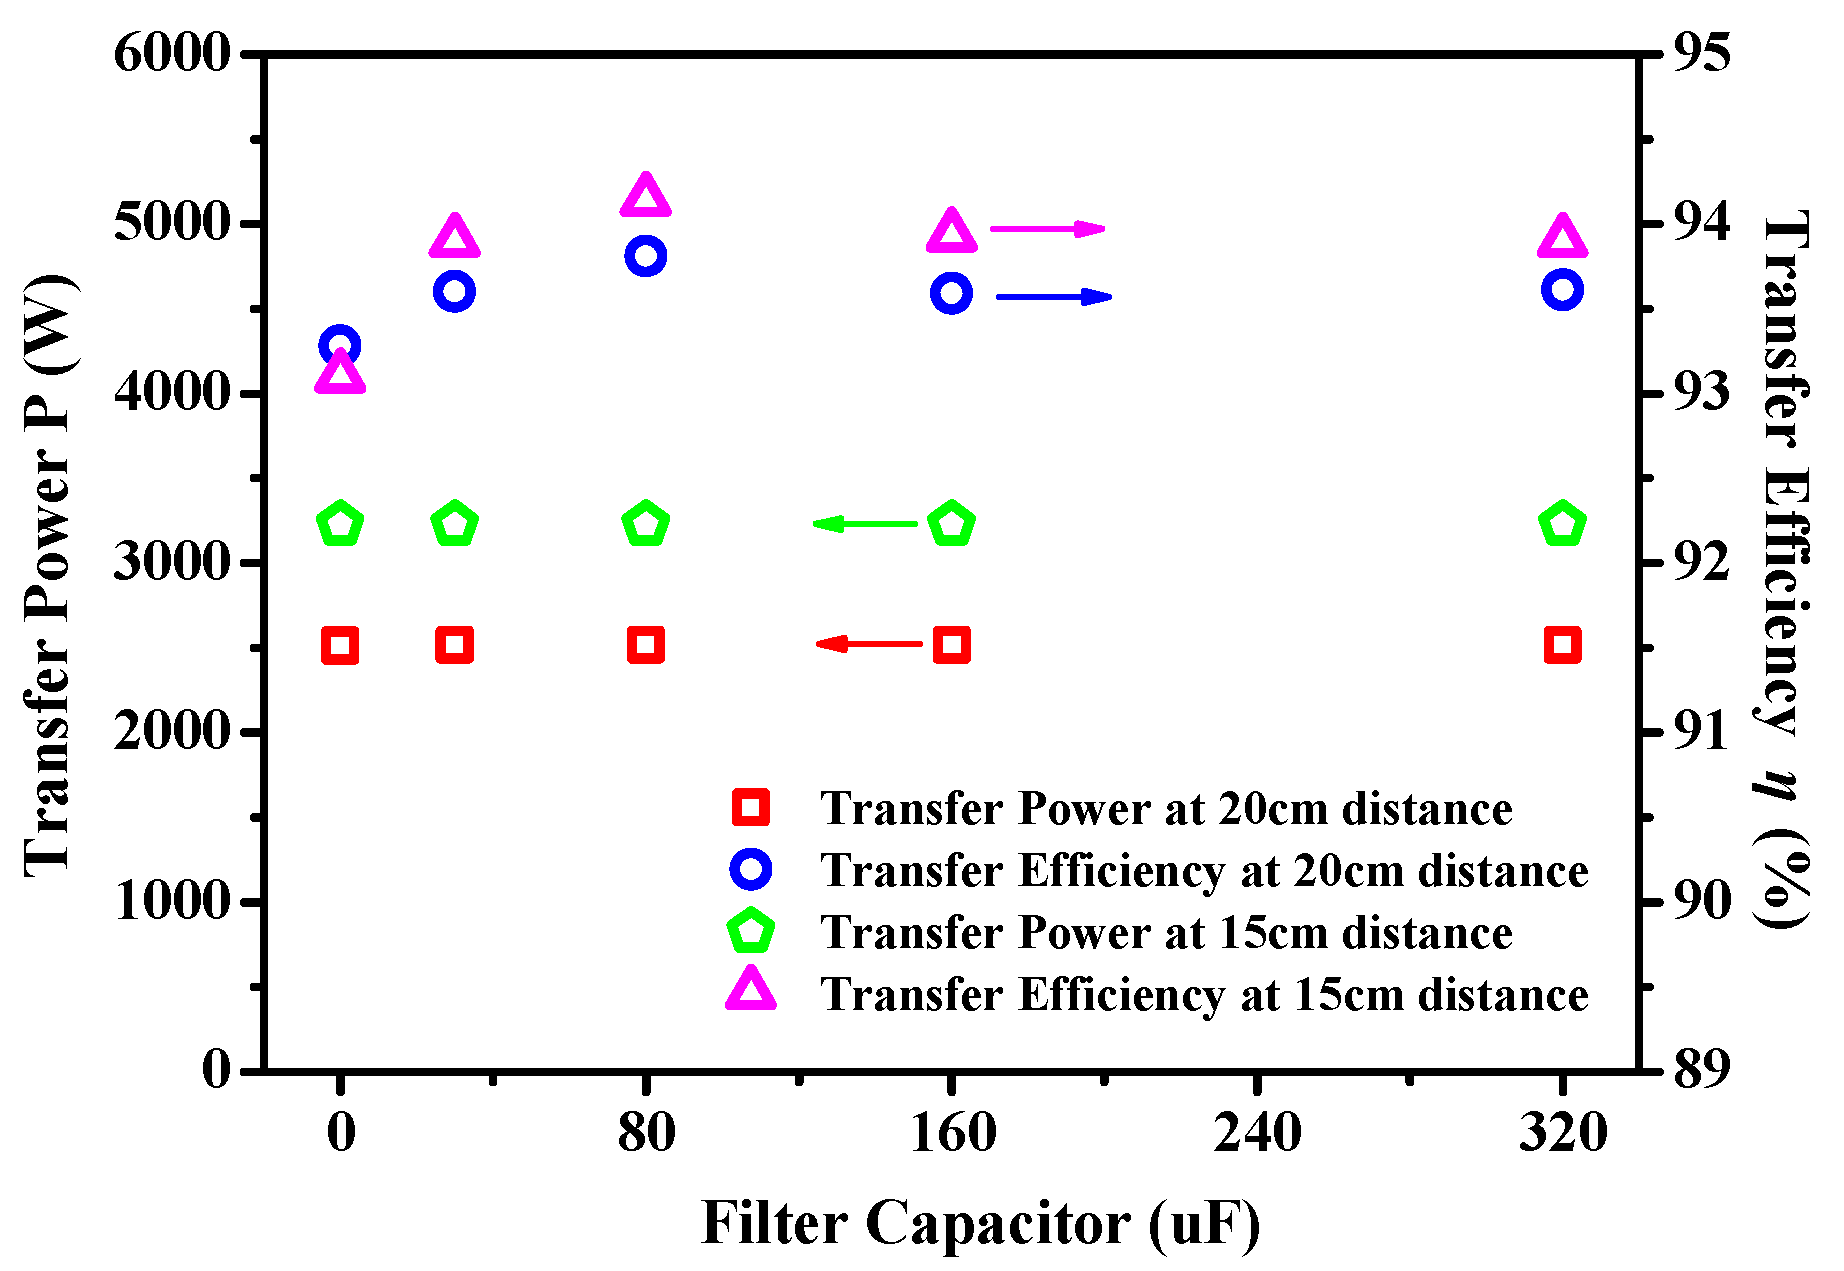
We should guarantee that the transfer characteristics are unchanged when the filter capacitors are reduced or removed.
Figure 12 shows the system transfer characteristics with different output filter capacitors, where the input voltage is 400 V, the battery voltage is set to 300 V. The coupling coefficients at 15 and 20 cm transfer distances are 0.4585 and 0.364, respectively. We can find that the transfer characteristics at two different transfer distances are almost unchanged although the filter capacitors are different, which indicates that the nonuse or reduction design of the output filter capacitors has no effects on system transfer characteristics, only increases the current ripples.
Figure 12.
System transfer characteristics with different output filter capacitors.
Figure 12.
System transfer characteristics with different output filter capacitors.
Although we have already validated that the nonuse of the filter capacitor has no effects on the system transfer characteristics, we still do not know whether the output filter capacitor has protective effects on the battery. Thus, an electrochemical analysis method named EIS is introduced, which is a frequency domain method to analyze electrochemical processes occurring at electrode/electrolyte interfaces. By analyzing the EIS curves of the battery, we can study the internal electrochemical mechanisms of the battery, and verify our assumption fundamentally.
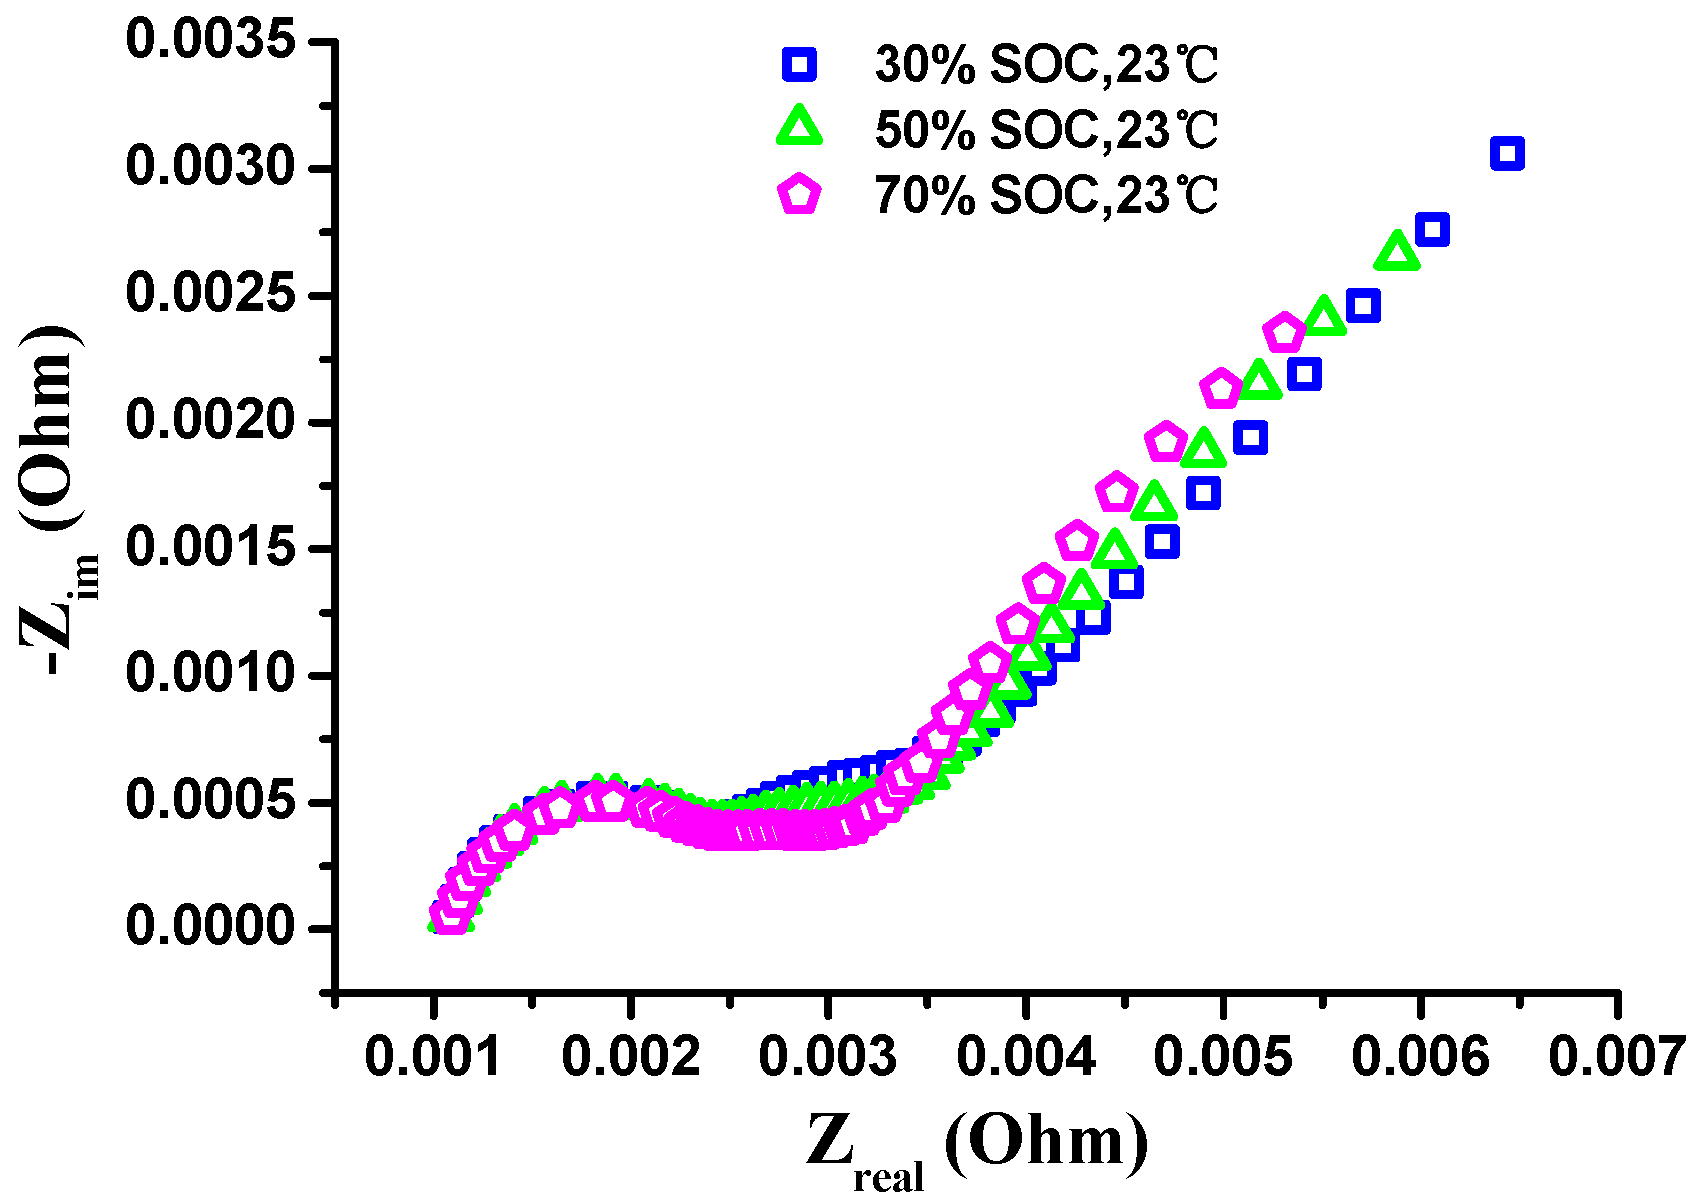
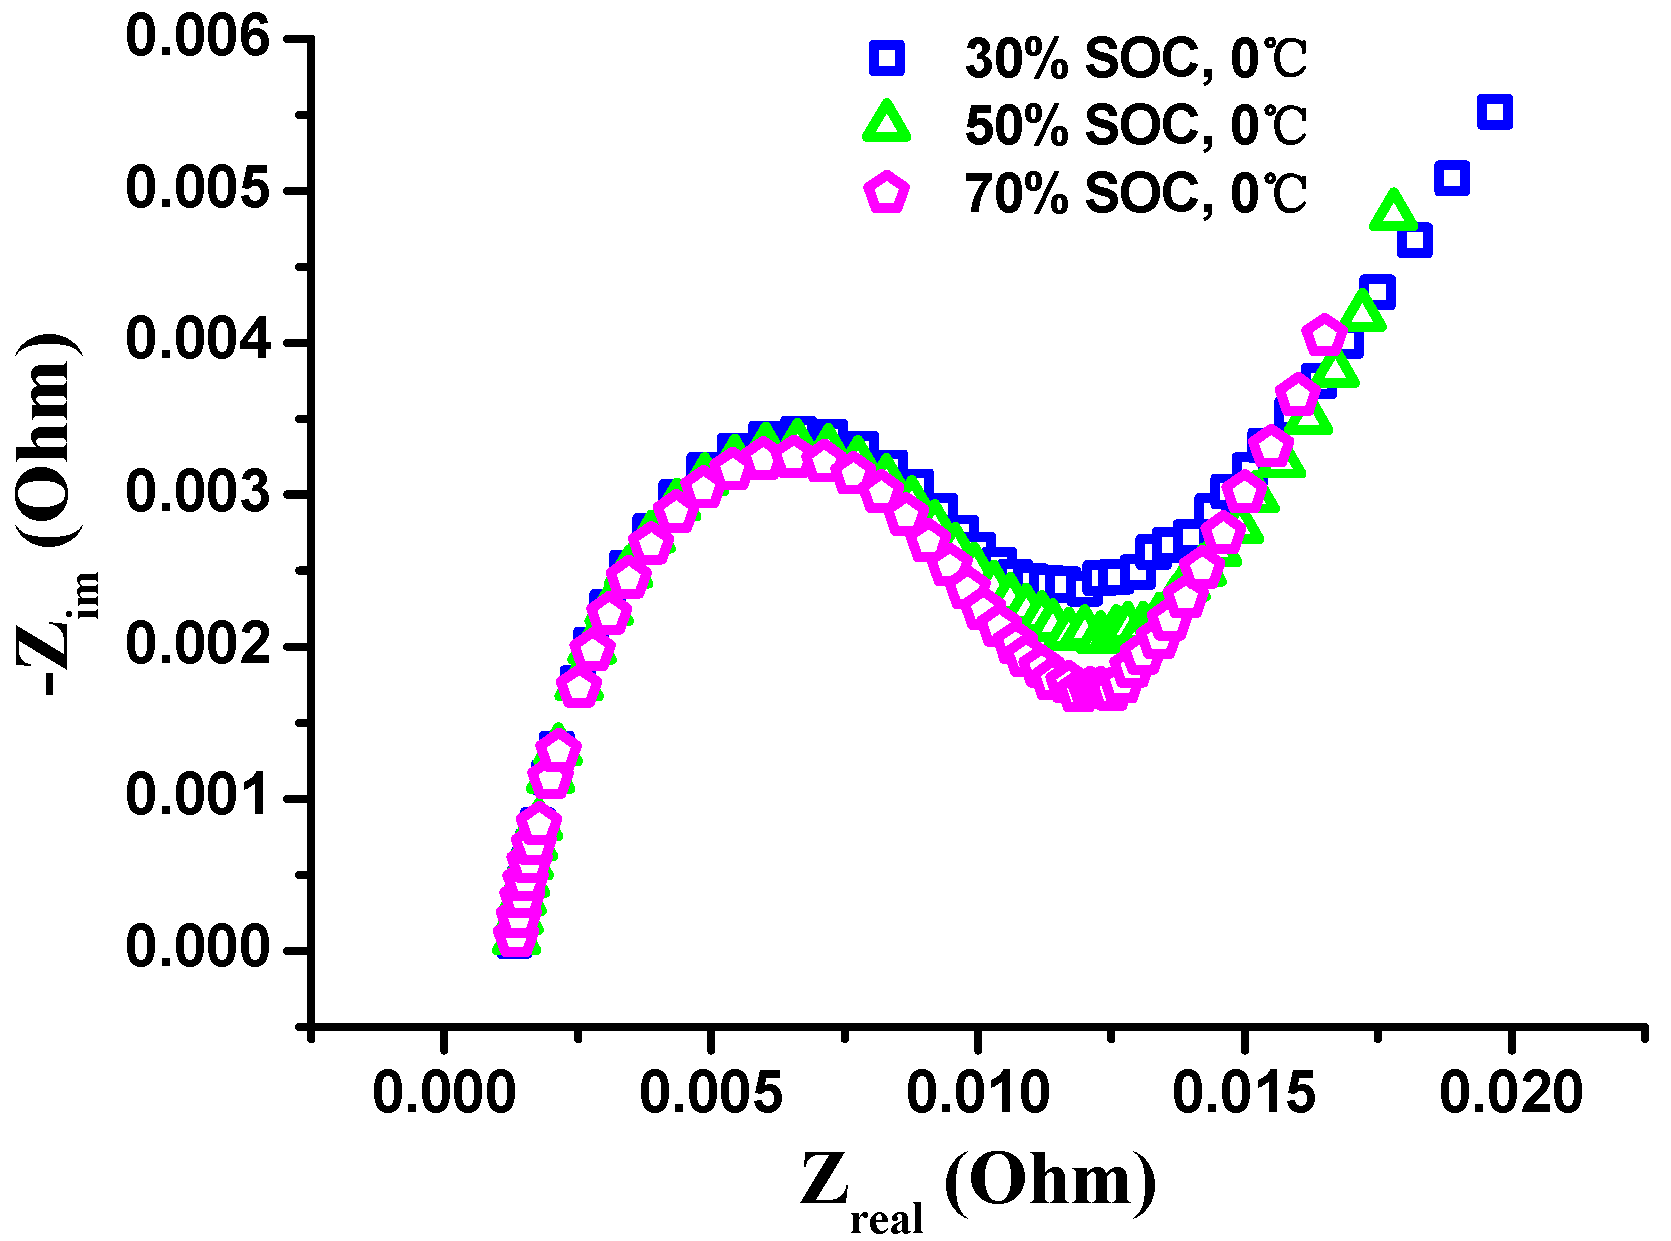
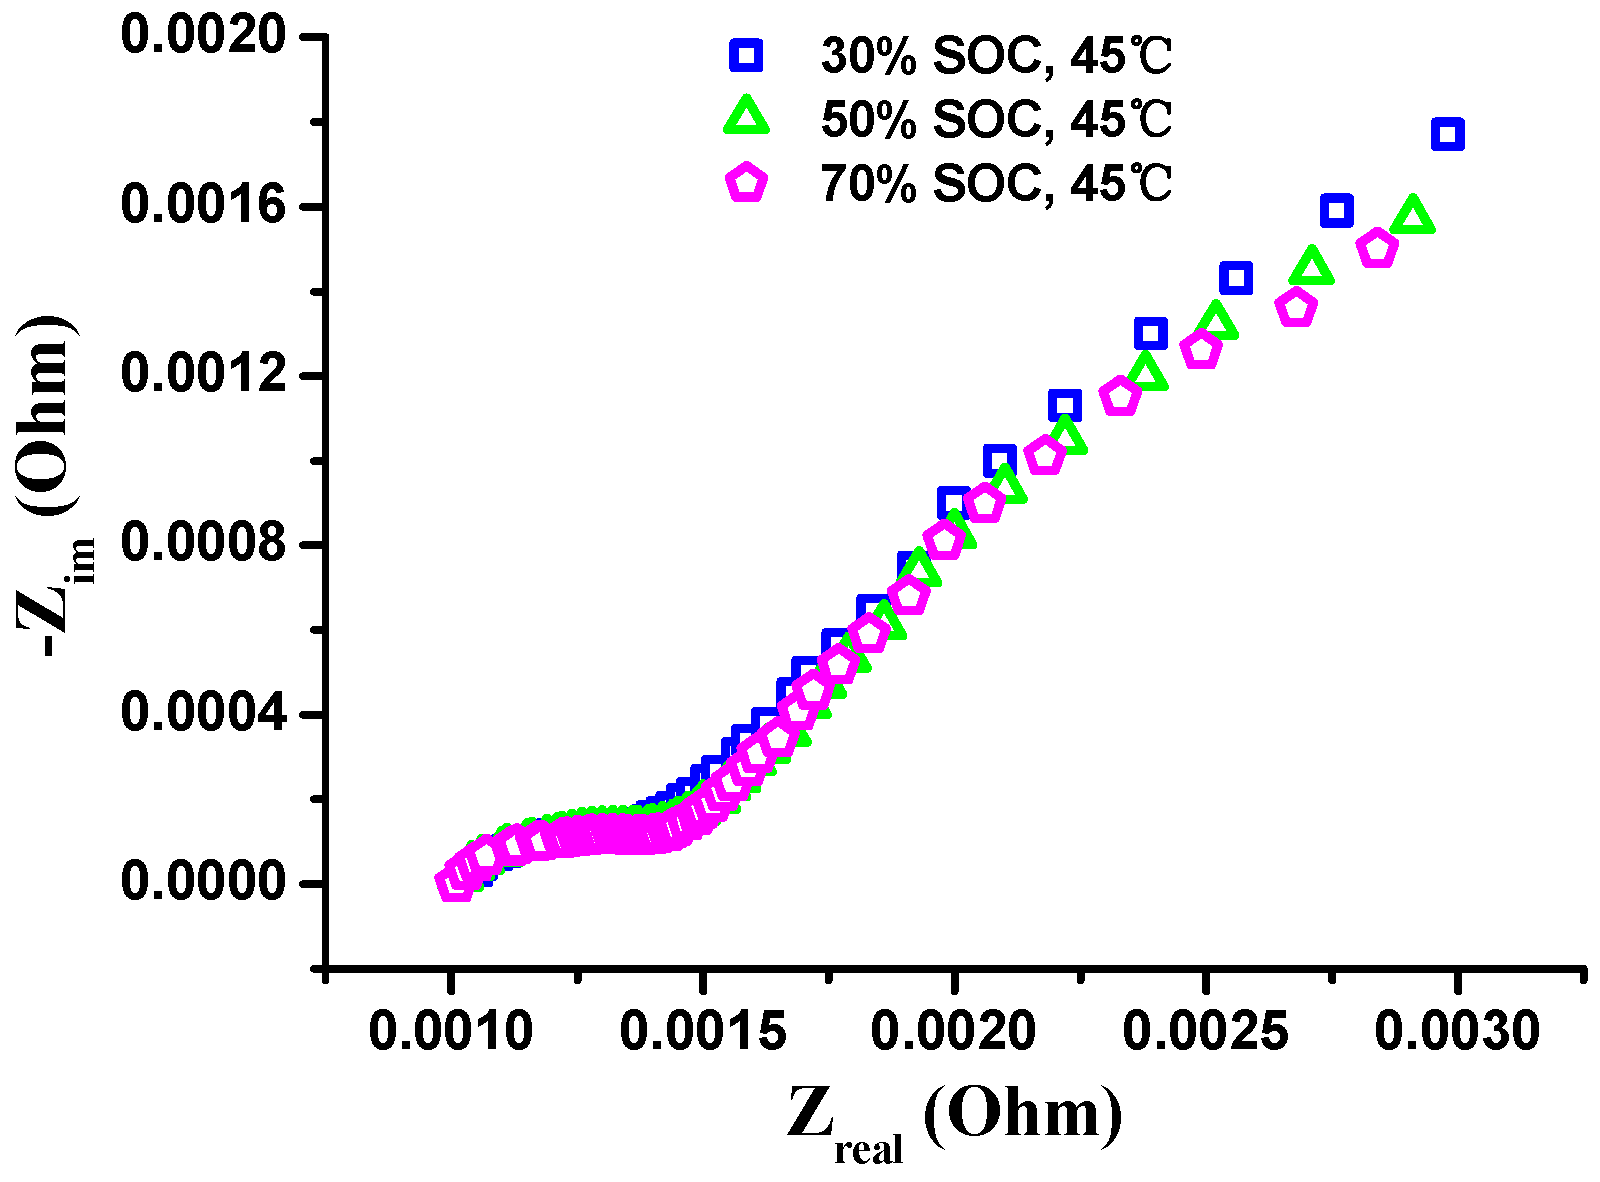
Generally, EIS curves are easily affected by temperatures or SOCs (state of charges),
Figure 13,
Figure 14 and
Figure 15 show the EIS curves at different SOCs when the temperatures are 0, 23 and 45 °C, and they clearly show that our test batteries are not sensitive to SOCs, thus this paper only considers the effects caused by different temperatures (0, 20 and 40 °C).
Figure 13.
Electrochemical impedance spectrum (EIS) curves at different state of charges (SOCs) when the test temperature is 0 °C.
Figure 13.
Electrochemical impedance spectrum (EIS) curves at different state of charges (SOCs) when the test temperature is 0 °C.
Figure 14.
EIS curves at different SOCs when the test temperature is 23 °C.
Figure 14.
EIS curves at different SOCs when the test temperature is 23 °C.
Figure 15.
EIS curves at different SOCs when the test temperature is 45 °C.
Figure 15.
EIS curves at different SOCs when the test temperature is 45 °C.
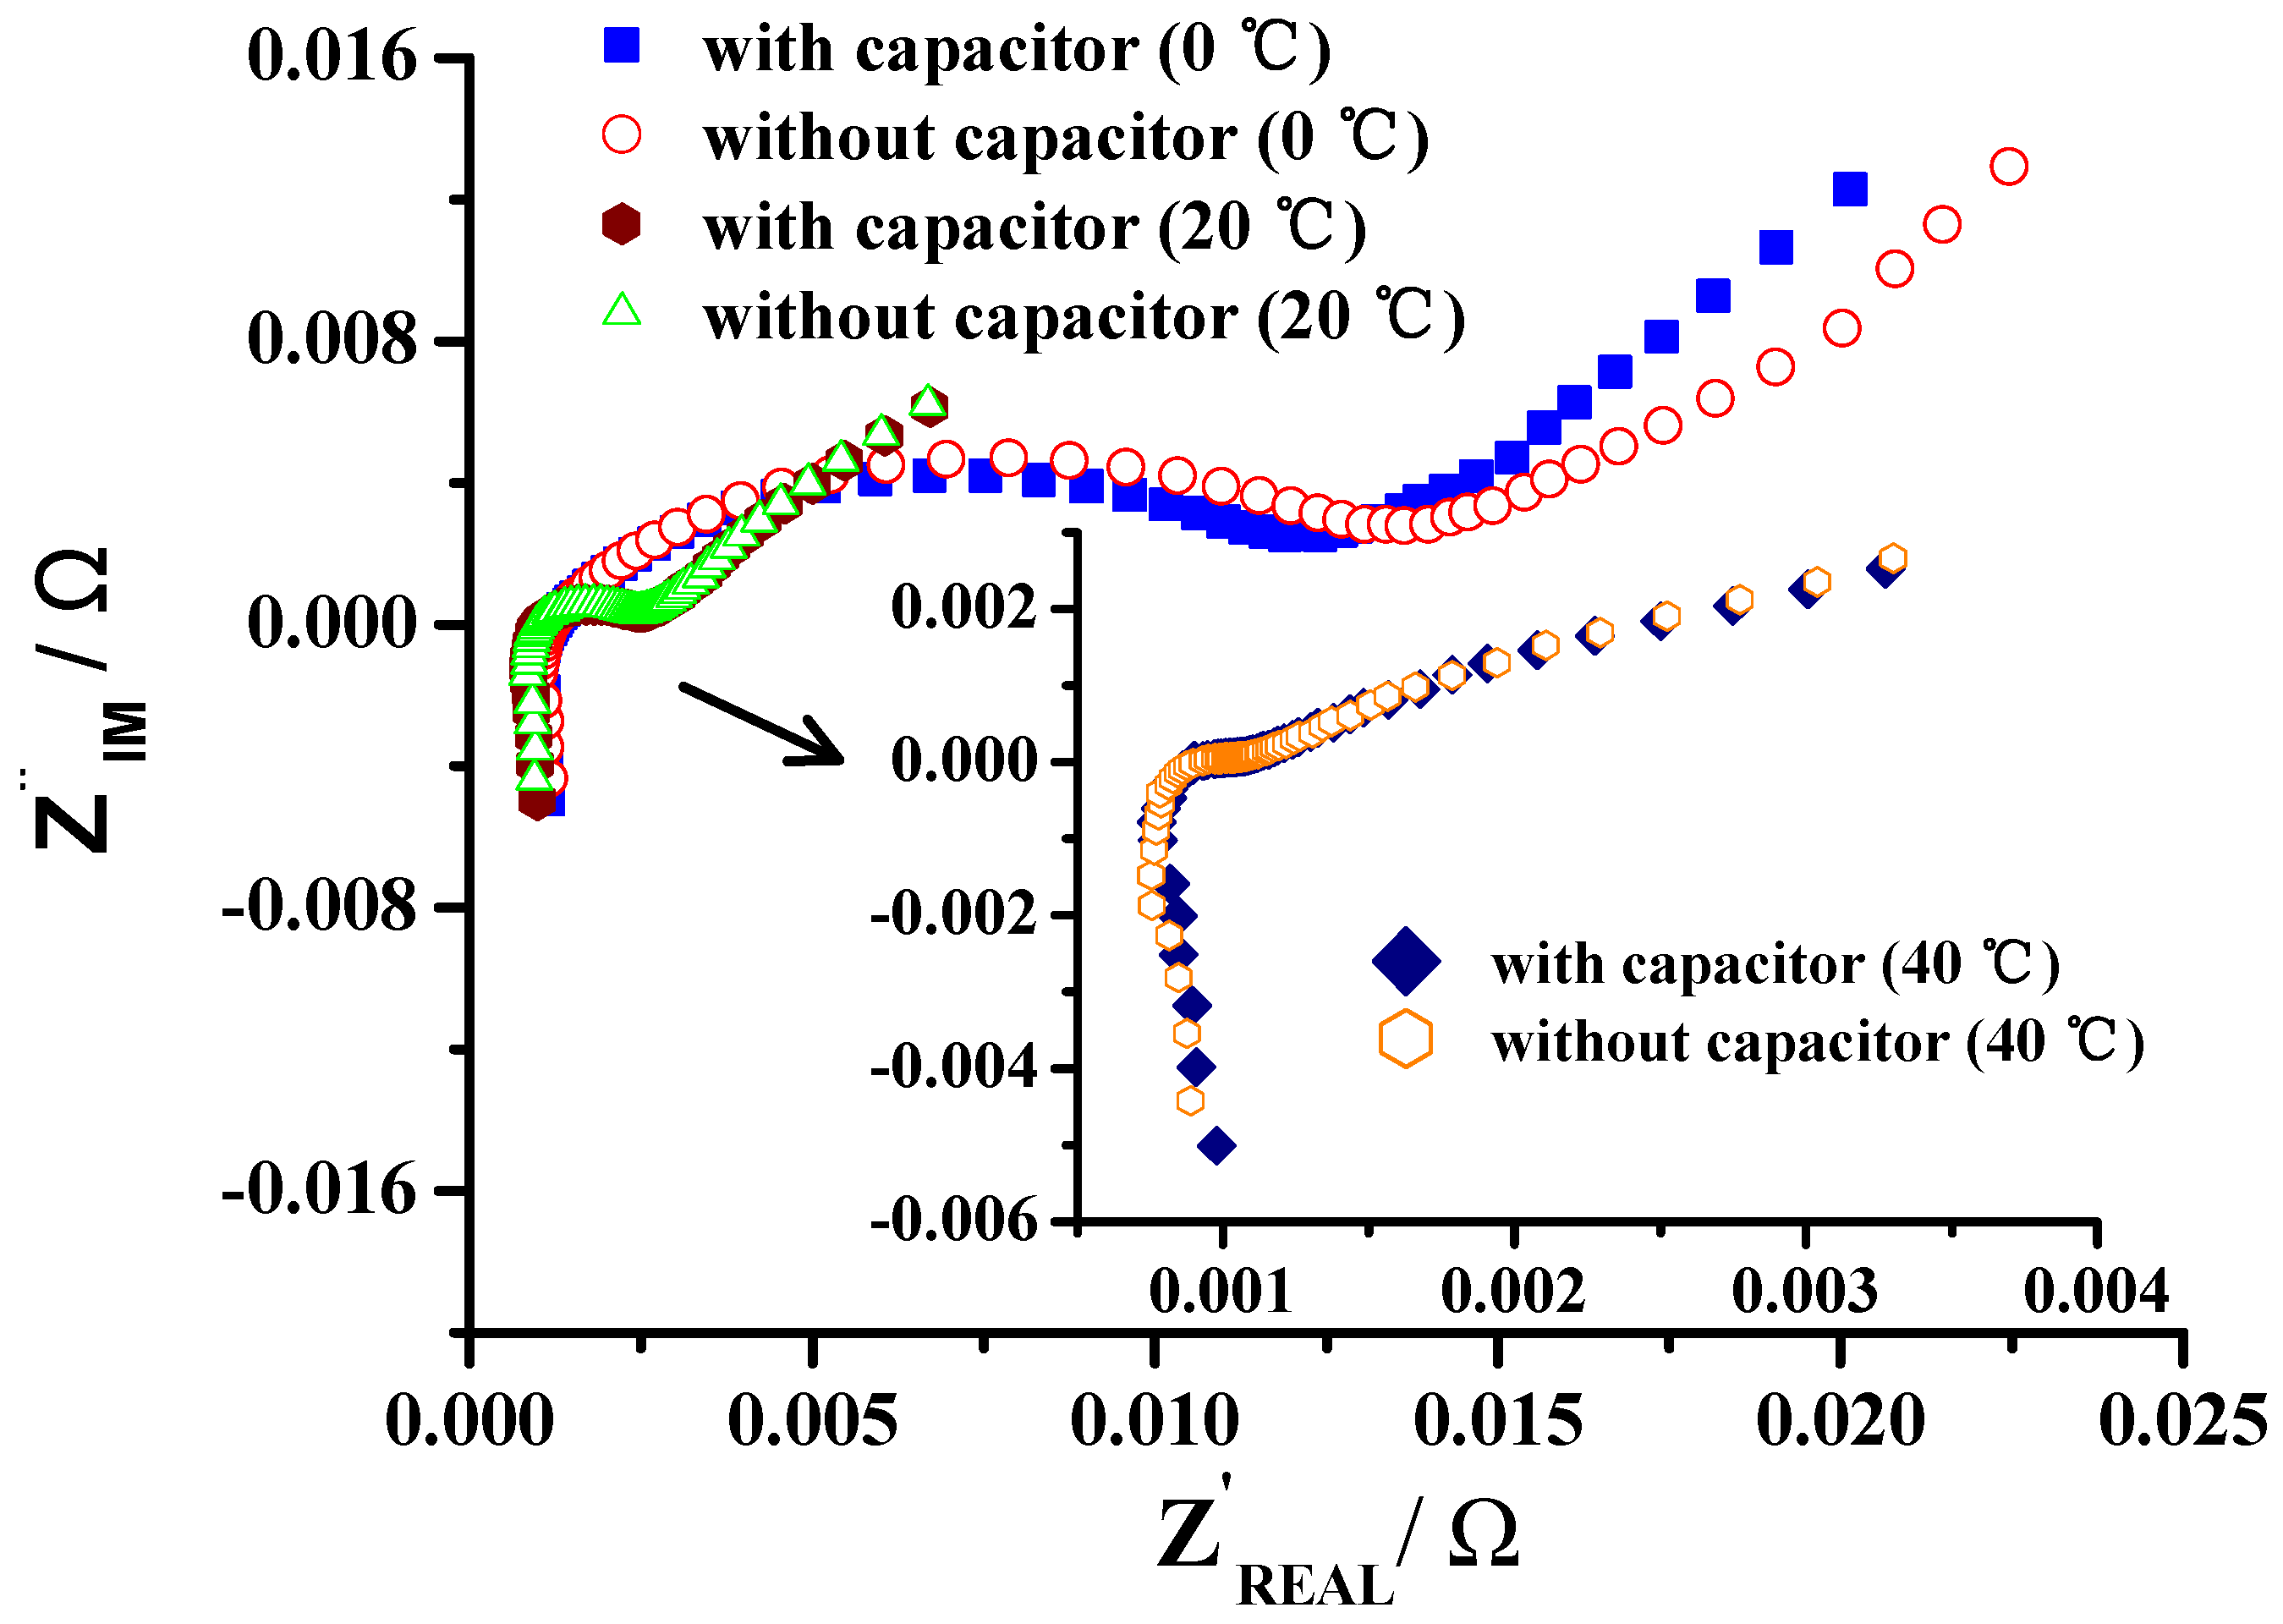
First; we select two batteries in the same batch; one is paralleled with nothing; and the other is paralleled with an aluminum electrolytic capacitor; the specific parameters of which are listed as 470 μF/450 V/−25~105 °C/Φ 35 × 45 mm. Then, we test the EIS curves of the battery and that with a parallel capacitor, respectively, where the EIS equipments are solartron SI 1287 Electrochemical interface, solartron 1255B frequency response analyzer and TOYO corporation (Akanehama, Japan) model PBi250-10 Power Booster. The test temperature is controlled by the thermostatic equipment Votsch C4-180, and the test results are shown in
Figure 16. EIS curve is actually a Nyquist plot, which shows the complex impedance in a single curve over the entire frequency range. As the battery characteristics are mainly capacitive, the sign of the imaginary axes is reversed to bring the curve into the upper part of the diagram. Apparently, we can find that the EIS curves of the battery and that with a parallel capacitor are almost the same when the test temperatures are 20 and 40 °C, which means that their electrochemical characteristics in these two situations are similar; hence, we deduce that the parallel capacitor may have no good effects on the battery characteristics. There are little differences in the high frequency part when the test temperature is 40 °C; they are caused by the lead wire inductance of the parallel capacitor; since the test frequencies in this part are higher than 1 kHz. When the test temperature reduces to 0 °C, the differences between them become more and more apparent as the battery impedance characteristics at low temperatures are really poor and very sensitive to temperatures. There are two possibilities: First, the difference is caused by the errors of test temperature because the temperature precision of the thermostatic equipment used is 1 °C. Second, indeed, the parallel capacitor plays a part in the electrochemical process. However, charging at 0 °C temperature does not happen too often in practice.
Figure 16.
EIS curves of the battery with and without capacitor at 0, 20 and 40 °C.
Figure 16.
EIS curves of the battery with and without capacitor at 0, 20 and 40 °C.
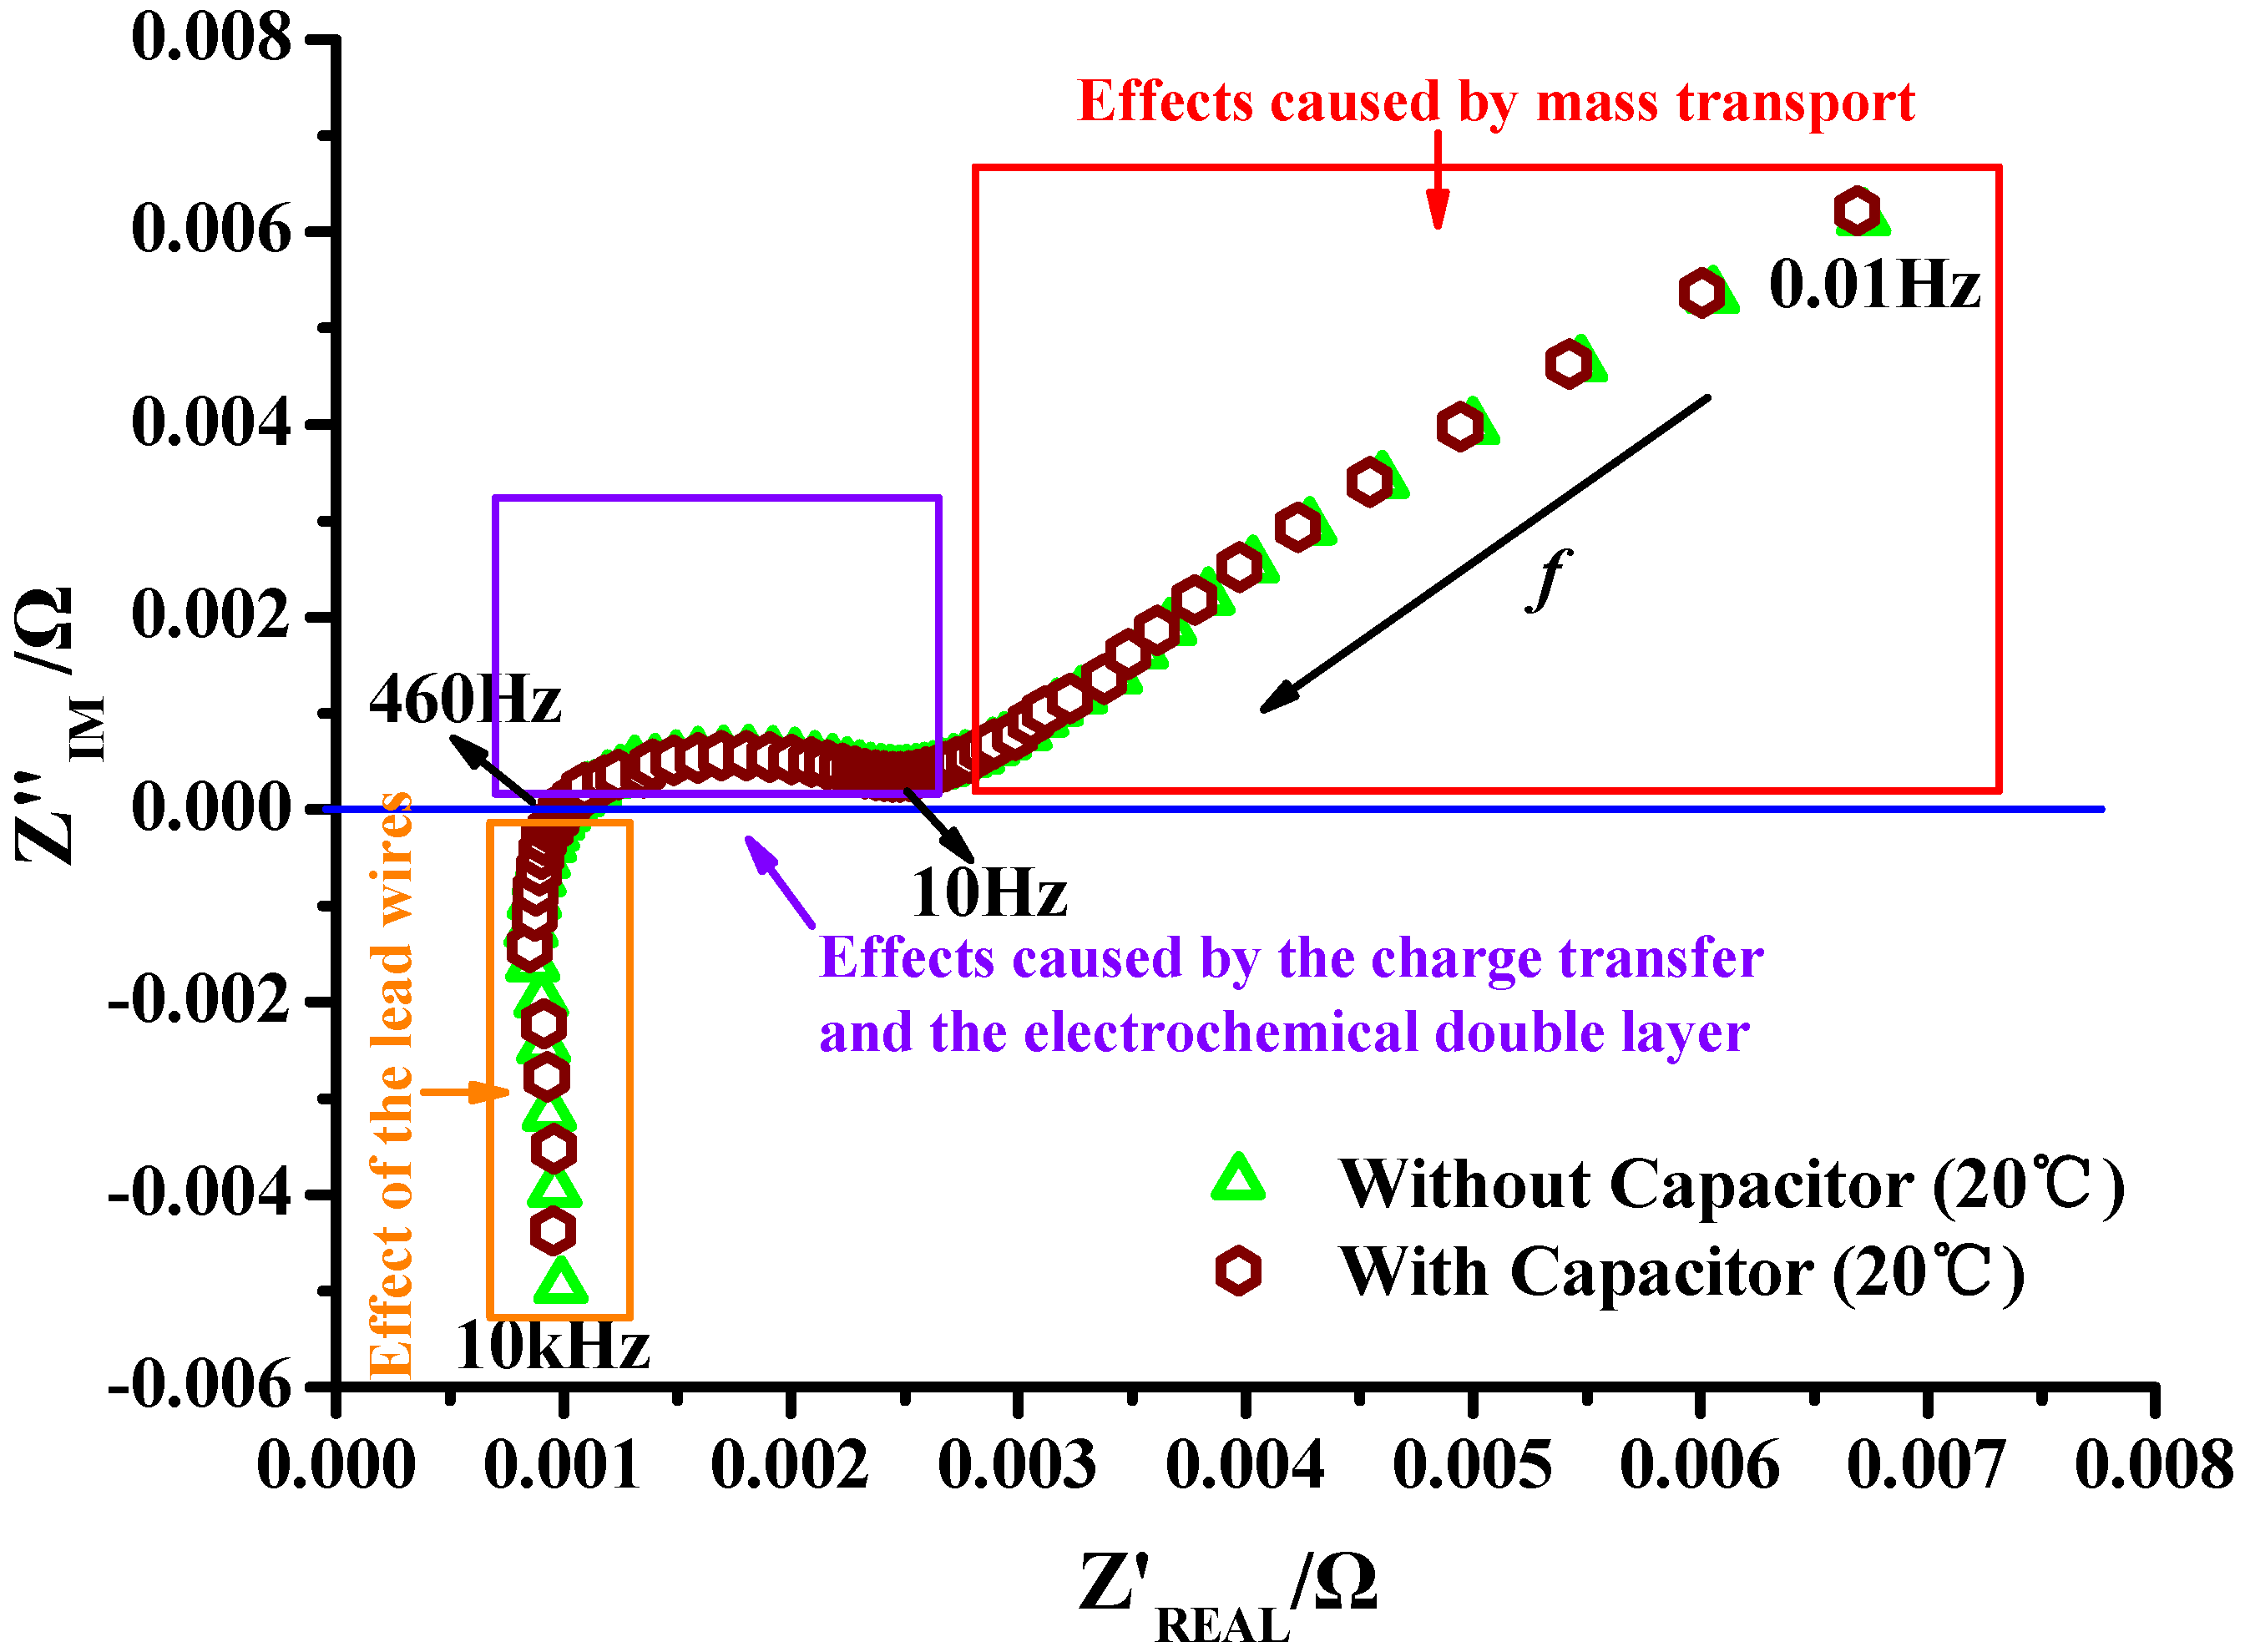
Then, the internal polarization process is described based on EIS curve, and the correspondences are shown in
Figure 17. EIS curves are comprised of the inductive tail at high frequencies, which is ascribed to the parasitic inductances of lead wires; the intersection on the real axis which represents the total ohmic resistance of the battery; the semicircle in mid-frequency range which is characteristic of the charge transfer at the electrode/electrolyte interface and the electrochemical double layer; the oblique (it can be called the mass-transfer area) at low frequencies which represents the solid-state Warburg diffusion of lithium ions [
29]. For the frequencies lower than 10 Hz, the solid-state Warburg diffusion phenomenon of lithium ions is dominant, since it has time to be established. However, for the frequencies from 10–460 Hz, the reactions of diffusion do not have time to be carried out, thus the phenomenon of charger-transfer becomes dominant [
26]. When the frequencies are higher than 460 Hz, the EIS curves cannot reflect the battery electrochemical characteristics, since the effects caused by the battery lead wires are dominant. Obviously, the mass transport part (lower than 10 Hz) and the charge transfer part (from 10–460 Hz) are the battery polarization process. When the frequencies are higher than 460 Hz, the polarization process does not happen, thus the power signals in this case have no effects on the battery characteristics. SAE J2954 (works in progress) suggests that the operating frequency of wireless charging system for electric vehicles should range from 80–90 kHz, thus 80 kHz is selected as the system operating frequency in this paper. In this situation, the first harmonic frequency of the charging current is 160 kHz, which is far greater than 460 Hz. It indicates that the sinusoidal half-wave charging currents caused by the nonuse output filter capacitors do not affect the battery polarization process, and hence, the battery characteristics only cause a little heat loss in the ohmic resistance of the battery.
Figure 17.
Correspondences between EIS curve and internal polarization process.
Figure 17.
Correspondences between EIS curve and internal polarization process.
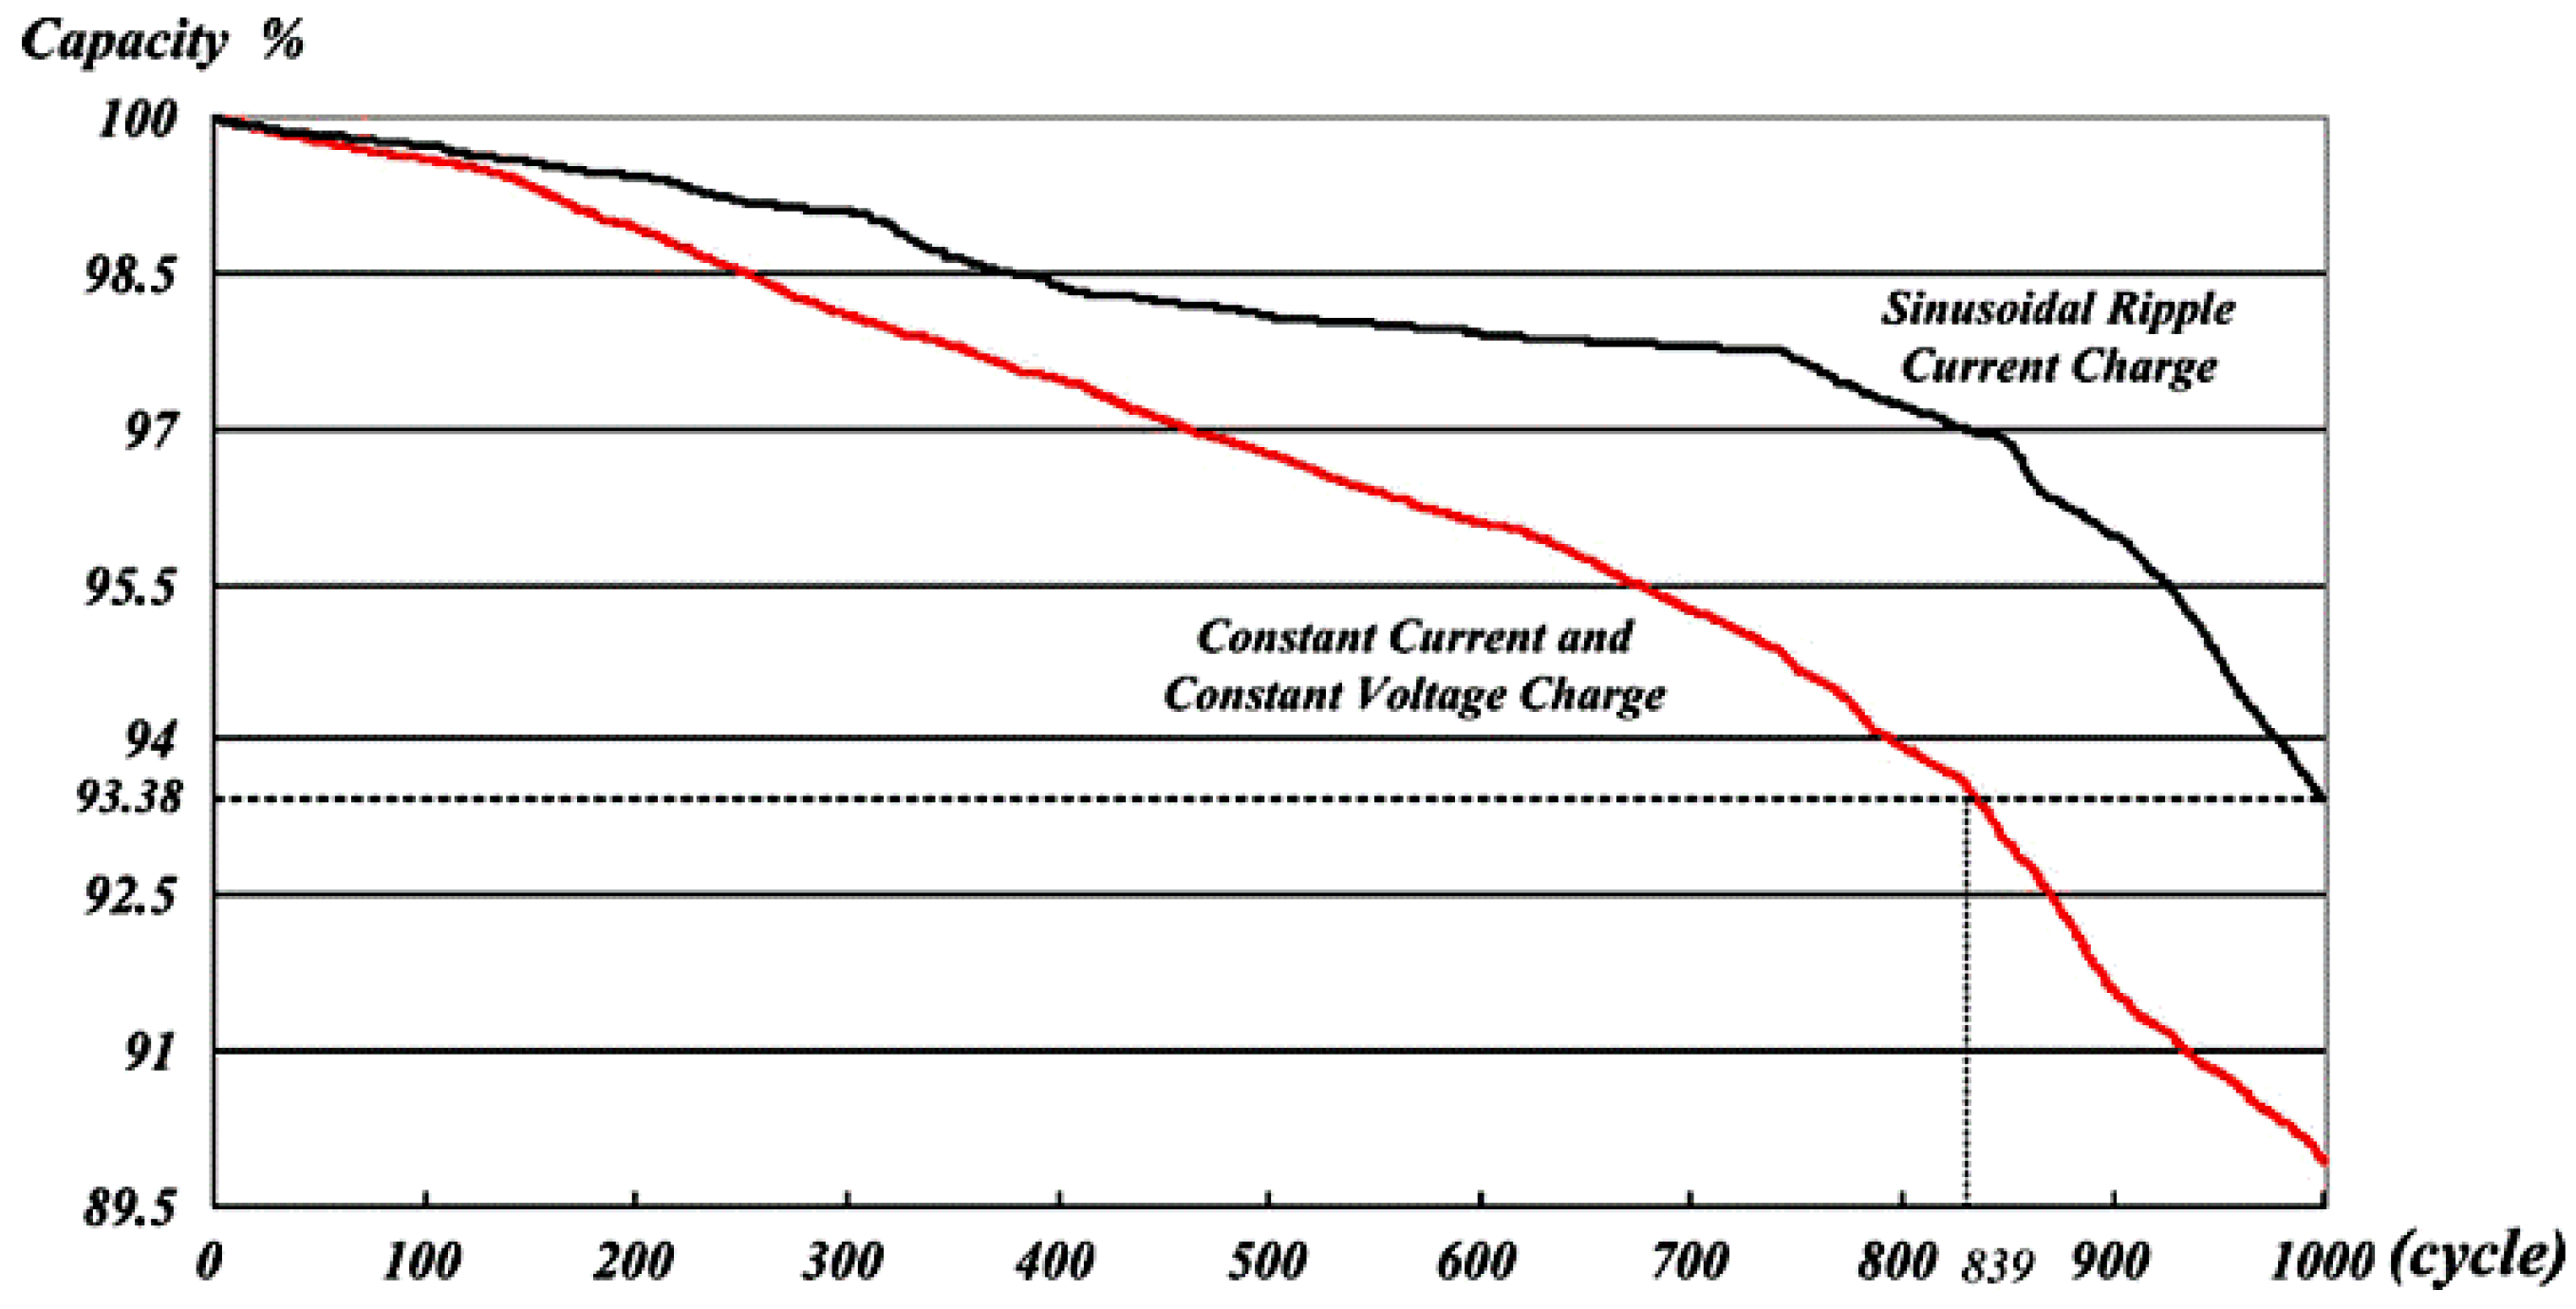
Figure 18 shows the deterioration curves of the battery charged by SRC (sinusoidal ripple current charge) and CC-CV [
30], and this phenomenon is helpful to validate our assumption although the harmonic components of the charging current with no filter capacitors are bigger than those used in SRC. It clearly shows that the Lithium-ion battery capacities charged by SRC and CC-CV deteriorate to 93.4% and 89.9% after 1000 cycles, respectively, which indicates that the battery lifetime is improved with SRC. It is interesting that the nonuse of the filter capacitor may be beneficial to extend the battery lifetime.
Figure 18.
Deterioration curves charged by sinusoidal-ripple-current charge (SRC) and CC-CV.
Figure 18.
Deterioration curves charged by sinusoidal-ripple-current charge (SRC) and CC-CV.
5. Experimental Section
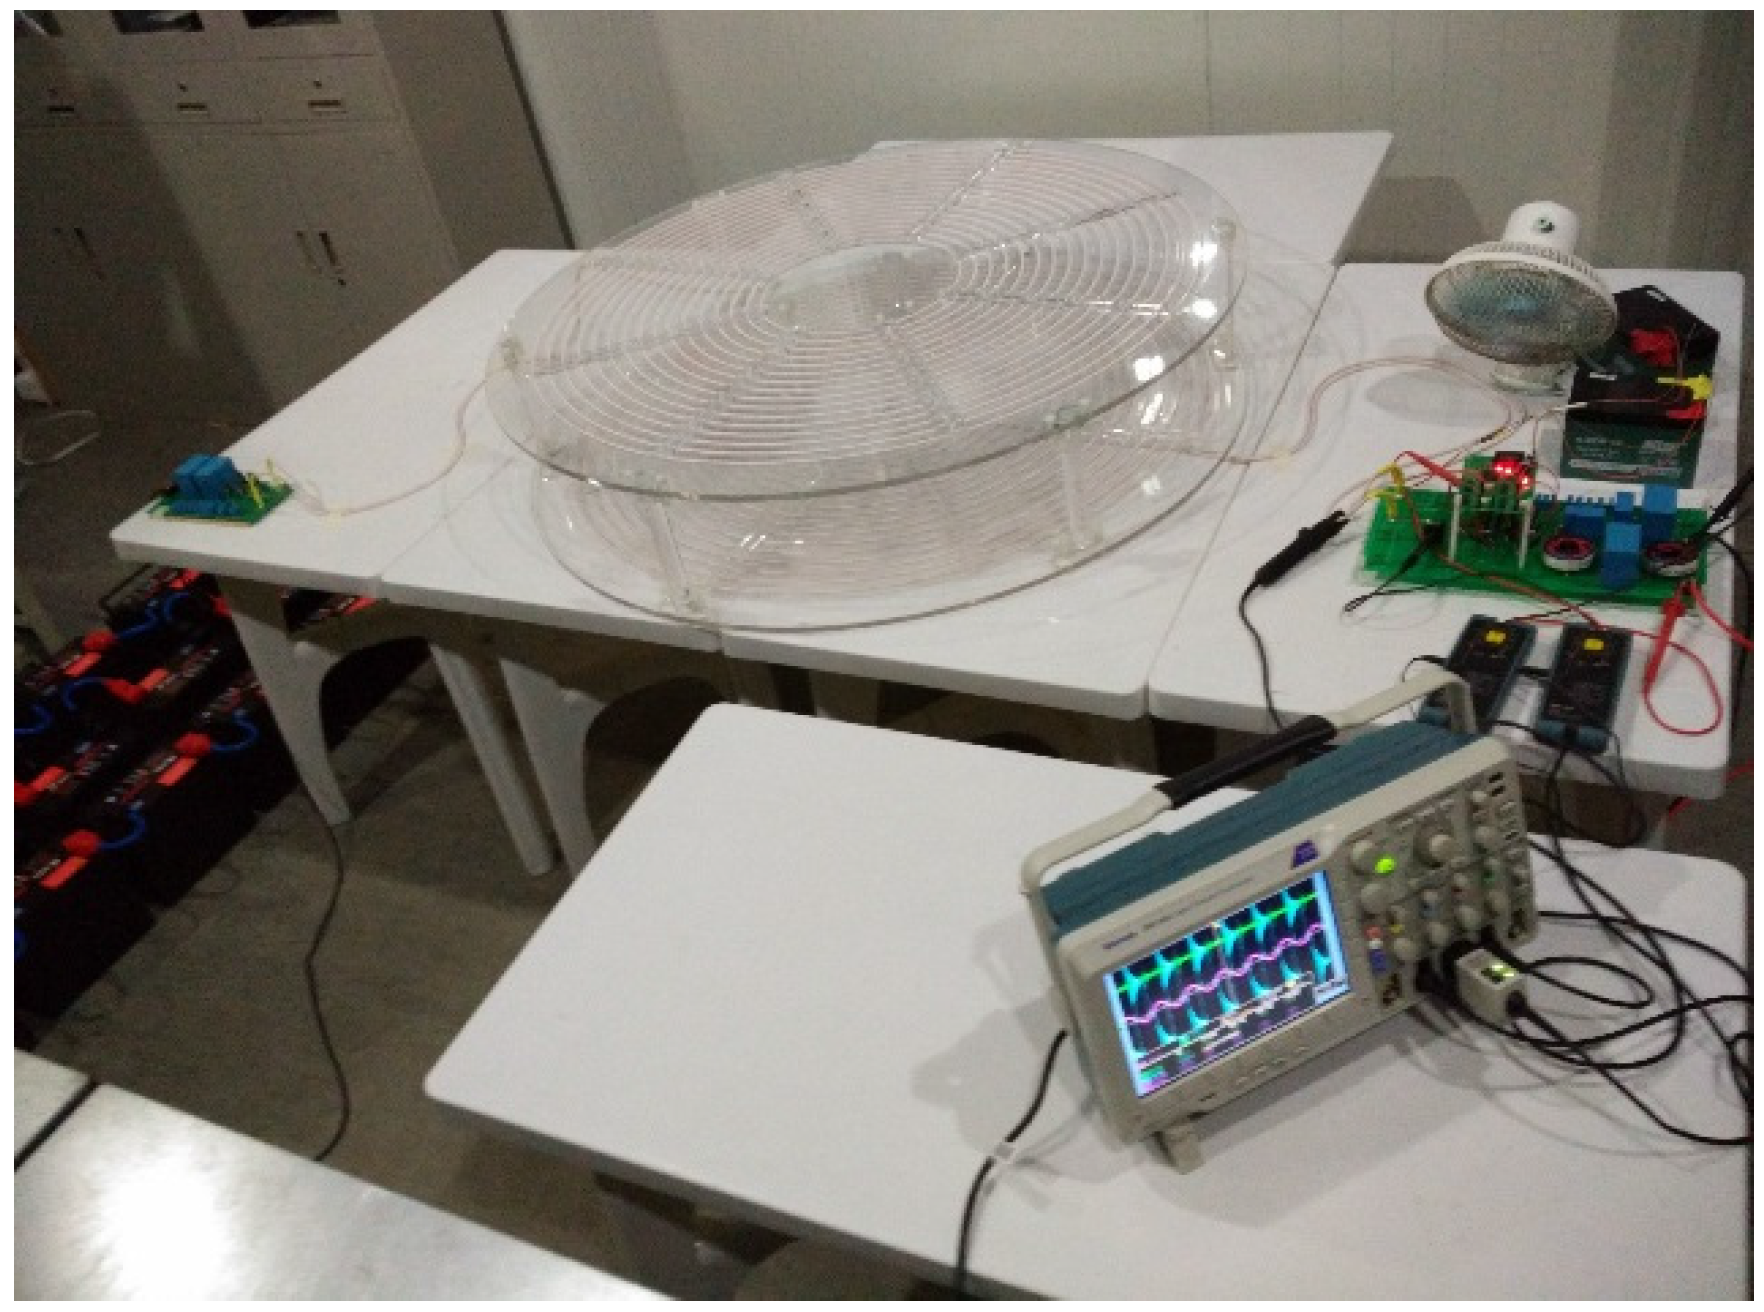
A prototype is fabricated to validate our research results as shown in
Figure 19, which includes the input power source, the H Bridge, two magnetic coils, the rectifier as well as the battery pack. The power source is Chroma 62100H-600 high-voltage DC power supply, and its operating range is 600 V/17 A/10 kW. The battery pack consists of 24 pieces of “sail” lead-acid battery instead of lithium-ion battery, since the lithium-ion battery may rupture, ignite or even exploded while overcharging [
31]. The comparison between CC strategy and CC/CV strategy as well as EIS tests have already been done based on single lithium-ion battery, thus the lead-acid battery pack is only employed to verify the charging characteristics when there are no filter capacitors. The magnetic coils are optimized based on the finite element software, but the optimization flow are not demonstrated due to the space limit.
Figure 19.
A prototype of a wireless charging system.
Figure 19.
A prototype of a wireless charging system.
The following results are measured by Tektronix DPO 3054 (Tektronix, Beaverton, OR, USA), the current probe is Tektronix TCP0020, and the high voltage probe is Tektronix P5201. The filter capacitors used in this paper are EPCOS B32776 and B32778 series.
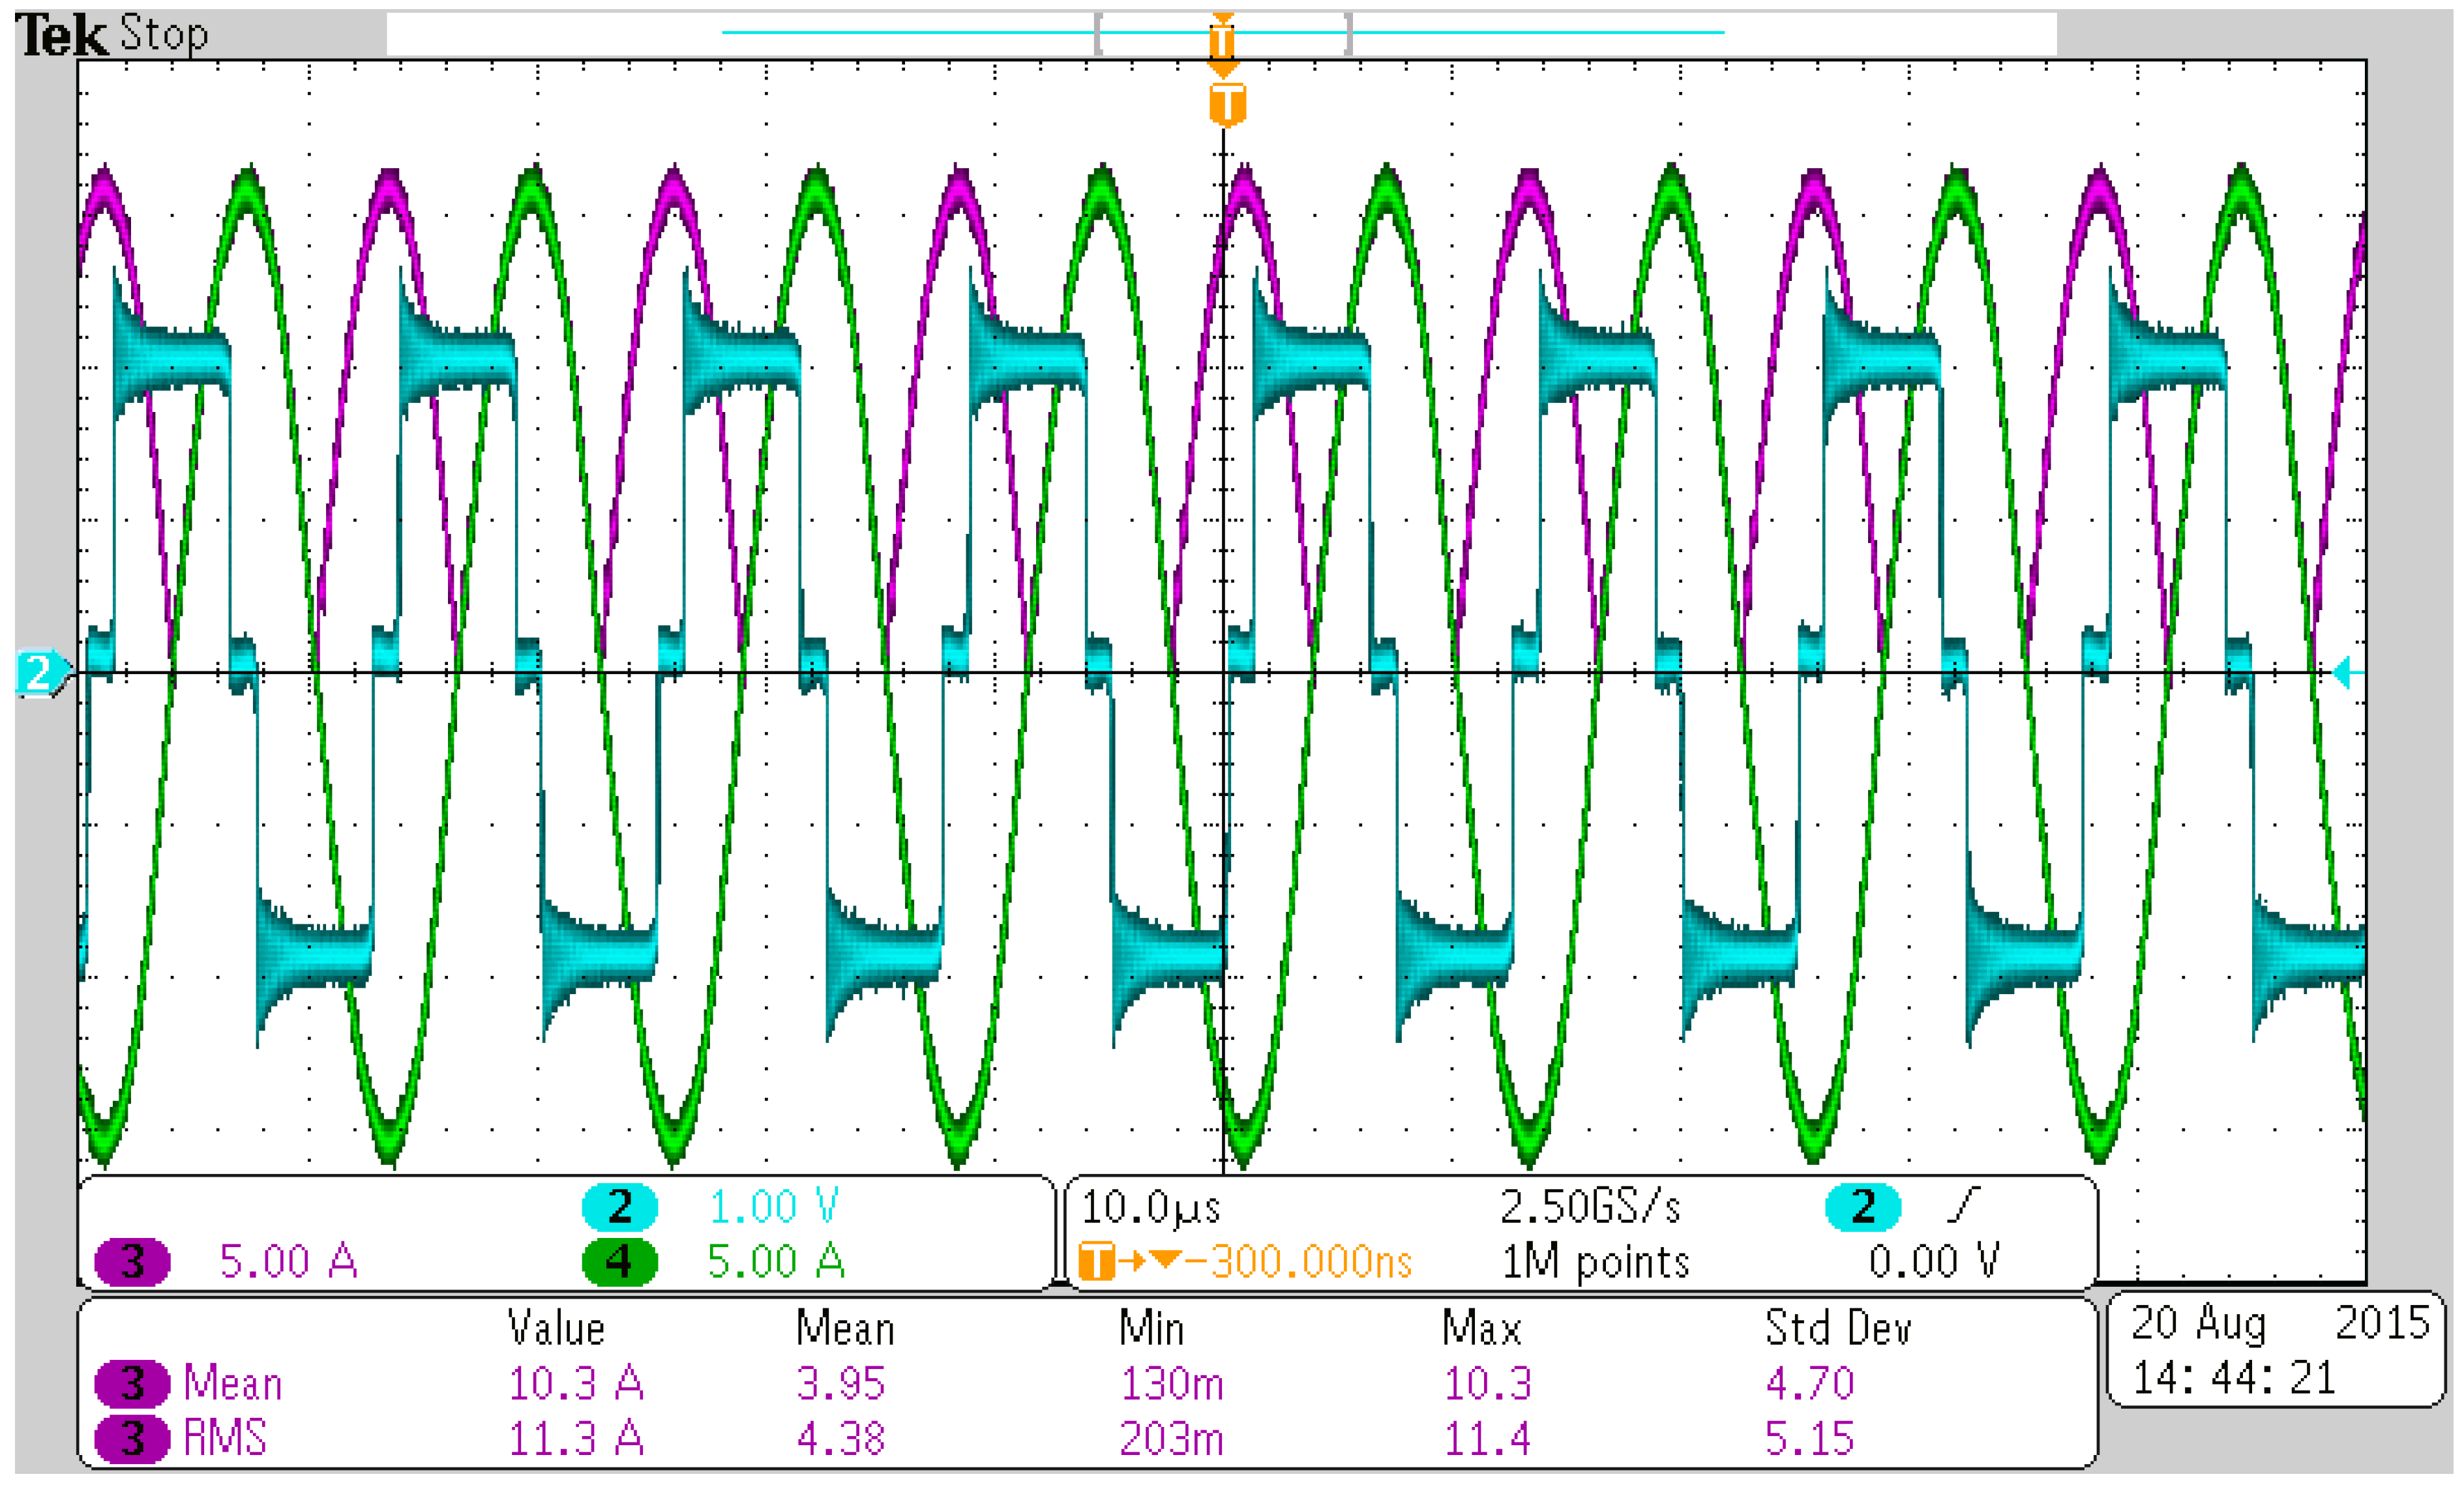
Figure 20 shows some critical waveforms of the prototype when there is no filter capacitor in the receiver. The cyan curve is the output voltage produced by H Bridge. Because the reduction scale of the high voltage probe is 200, the measured voltages need to be multiplied by 200. The green curve shows the dynamic current which flows through the inductor
L2 in
Figure 8. The purple curve is the charging current for the battery pack, which shows a good agreement with the theoretical results in
Figure 11, and it is a sinusoidal half-wave current since the filter capacitor is removed. If we keep its average value as 10.3 A, the charging power requirement can be still satisfied.
Figure 20.
Critical waveforms when there is no filter capacitor in the receiver.
Figure 20.
Critical waveforms when there is no filter capacitor in the receiver.
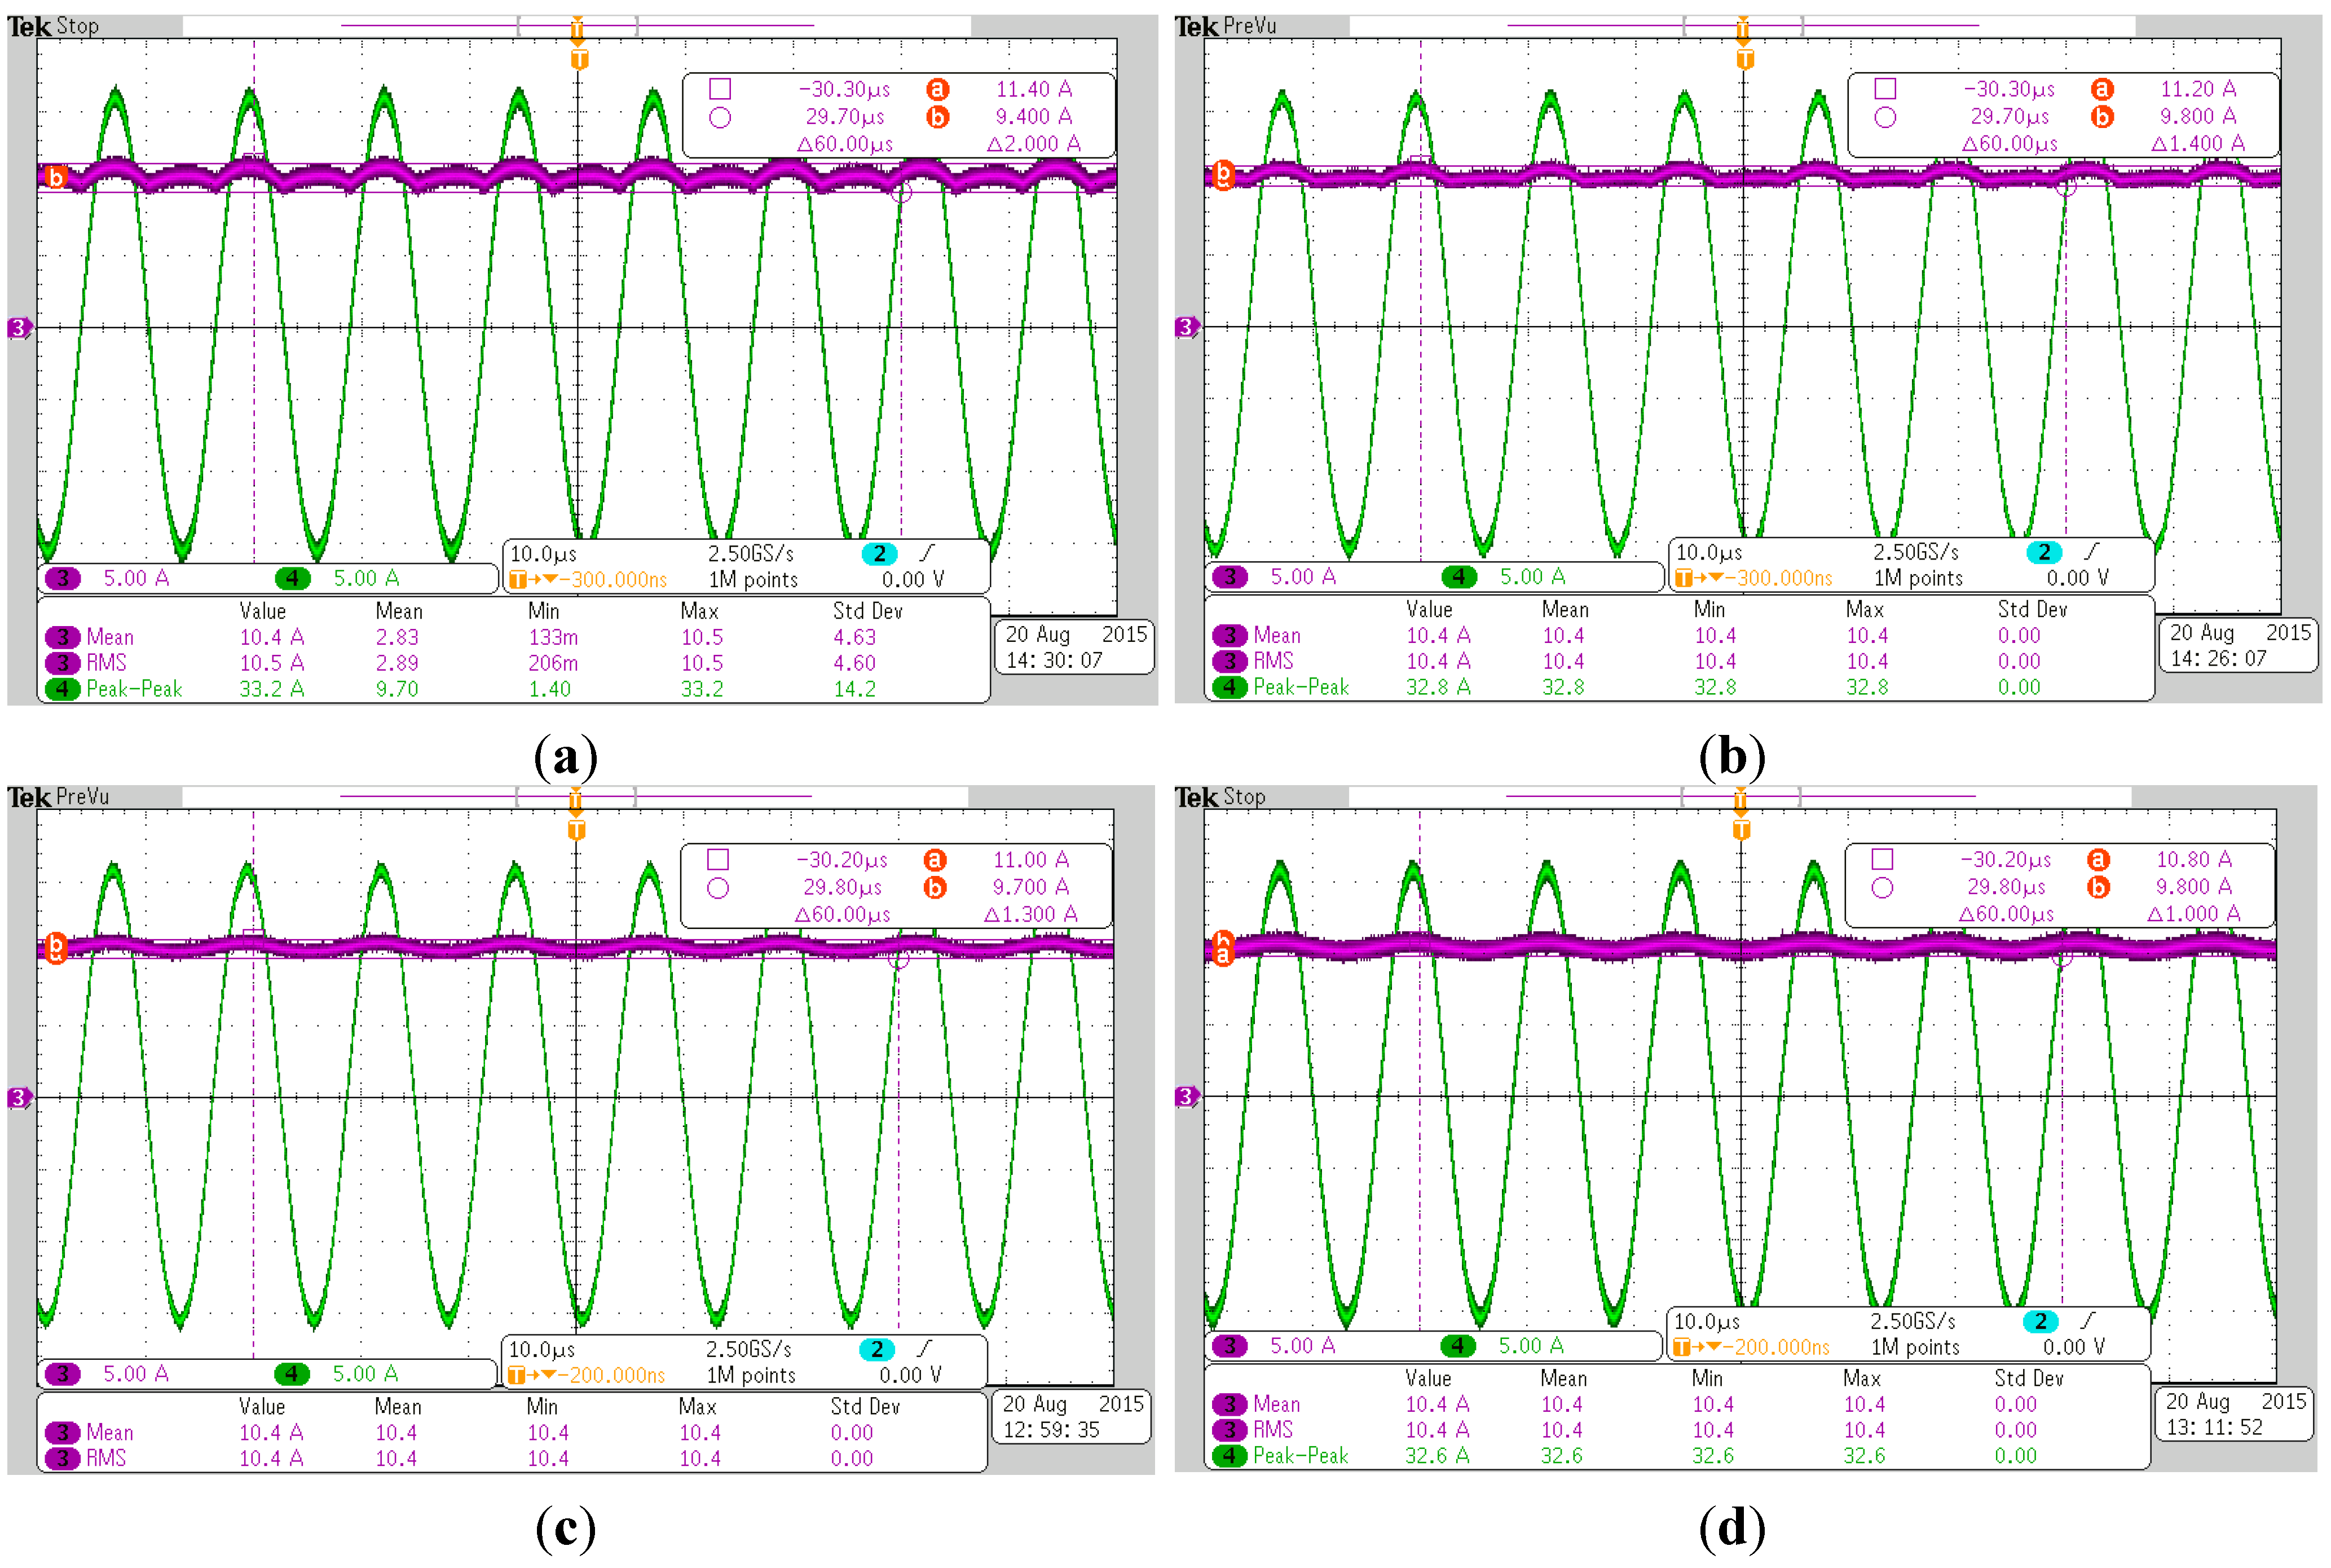
Figure 21 shows the dynamic charging currents as well as the currents flowing through the inductor
L2 in
Figure 8 when the filter capacitors are 30, 80, 160 and 320 μF, respectively. We can clearly find that the averages of the charging currents are the same when the filter capacitors are different, but the current ripples are different. The bigger the filter capacitor, the smaller the current ripples. As shown in
Figure 21a, when the filter capacitor is 30 μF, the charging current ripples are different from those shown in
Figure 11. This is mainly because an additional diode is inserted between the filter capacitor
CB and the battery
VB in practice, which is used to prevent the battery to charge the filter capacitor reversely. However, in the theoretical model, the current between the filter capacitor
CB and the battery
VB is bidirectional. Although the ripple currents shown in
Figure 21a are different from those shown in
Figure 11, their amplitudes are the same, which are all 2 A. With the increase of the filter capacitor, the charging current ripples become the sine waves basically, and the ripples are almost unchanged when the filter capacitor is bigger than 160 μF.
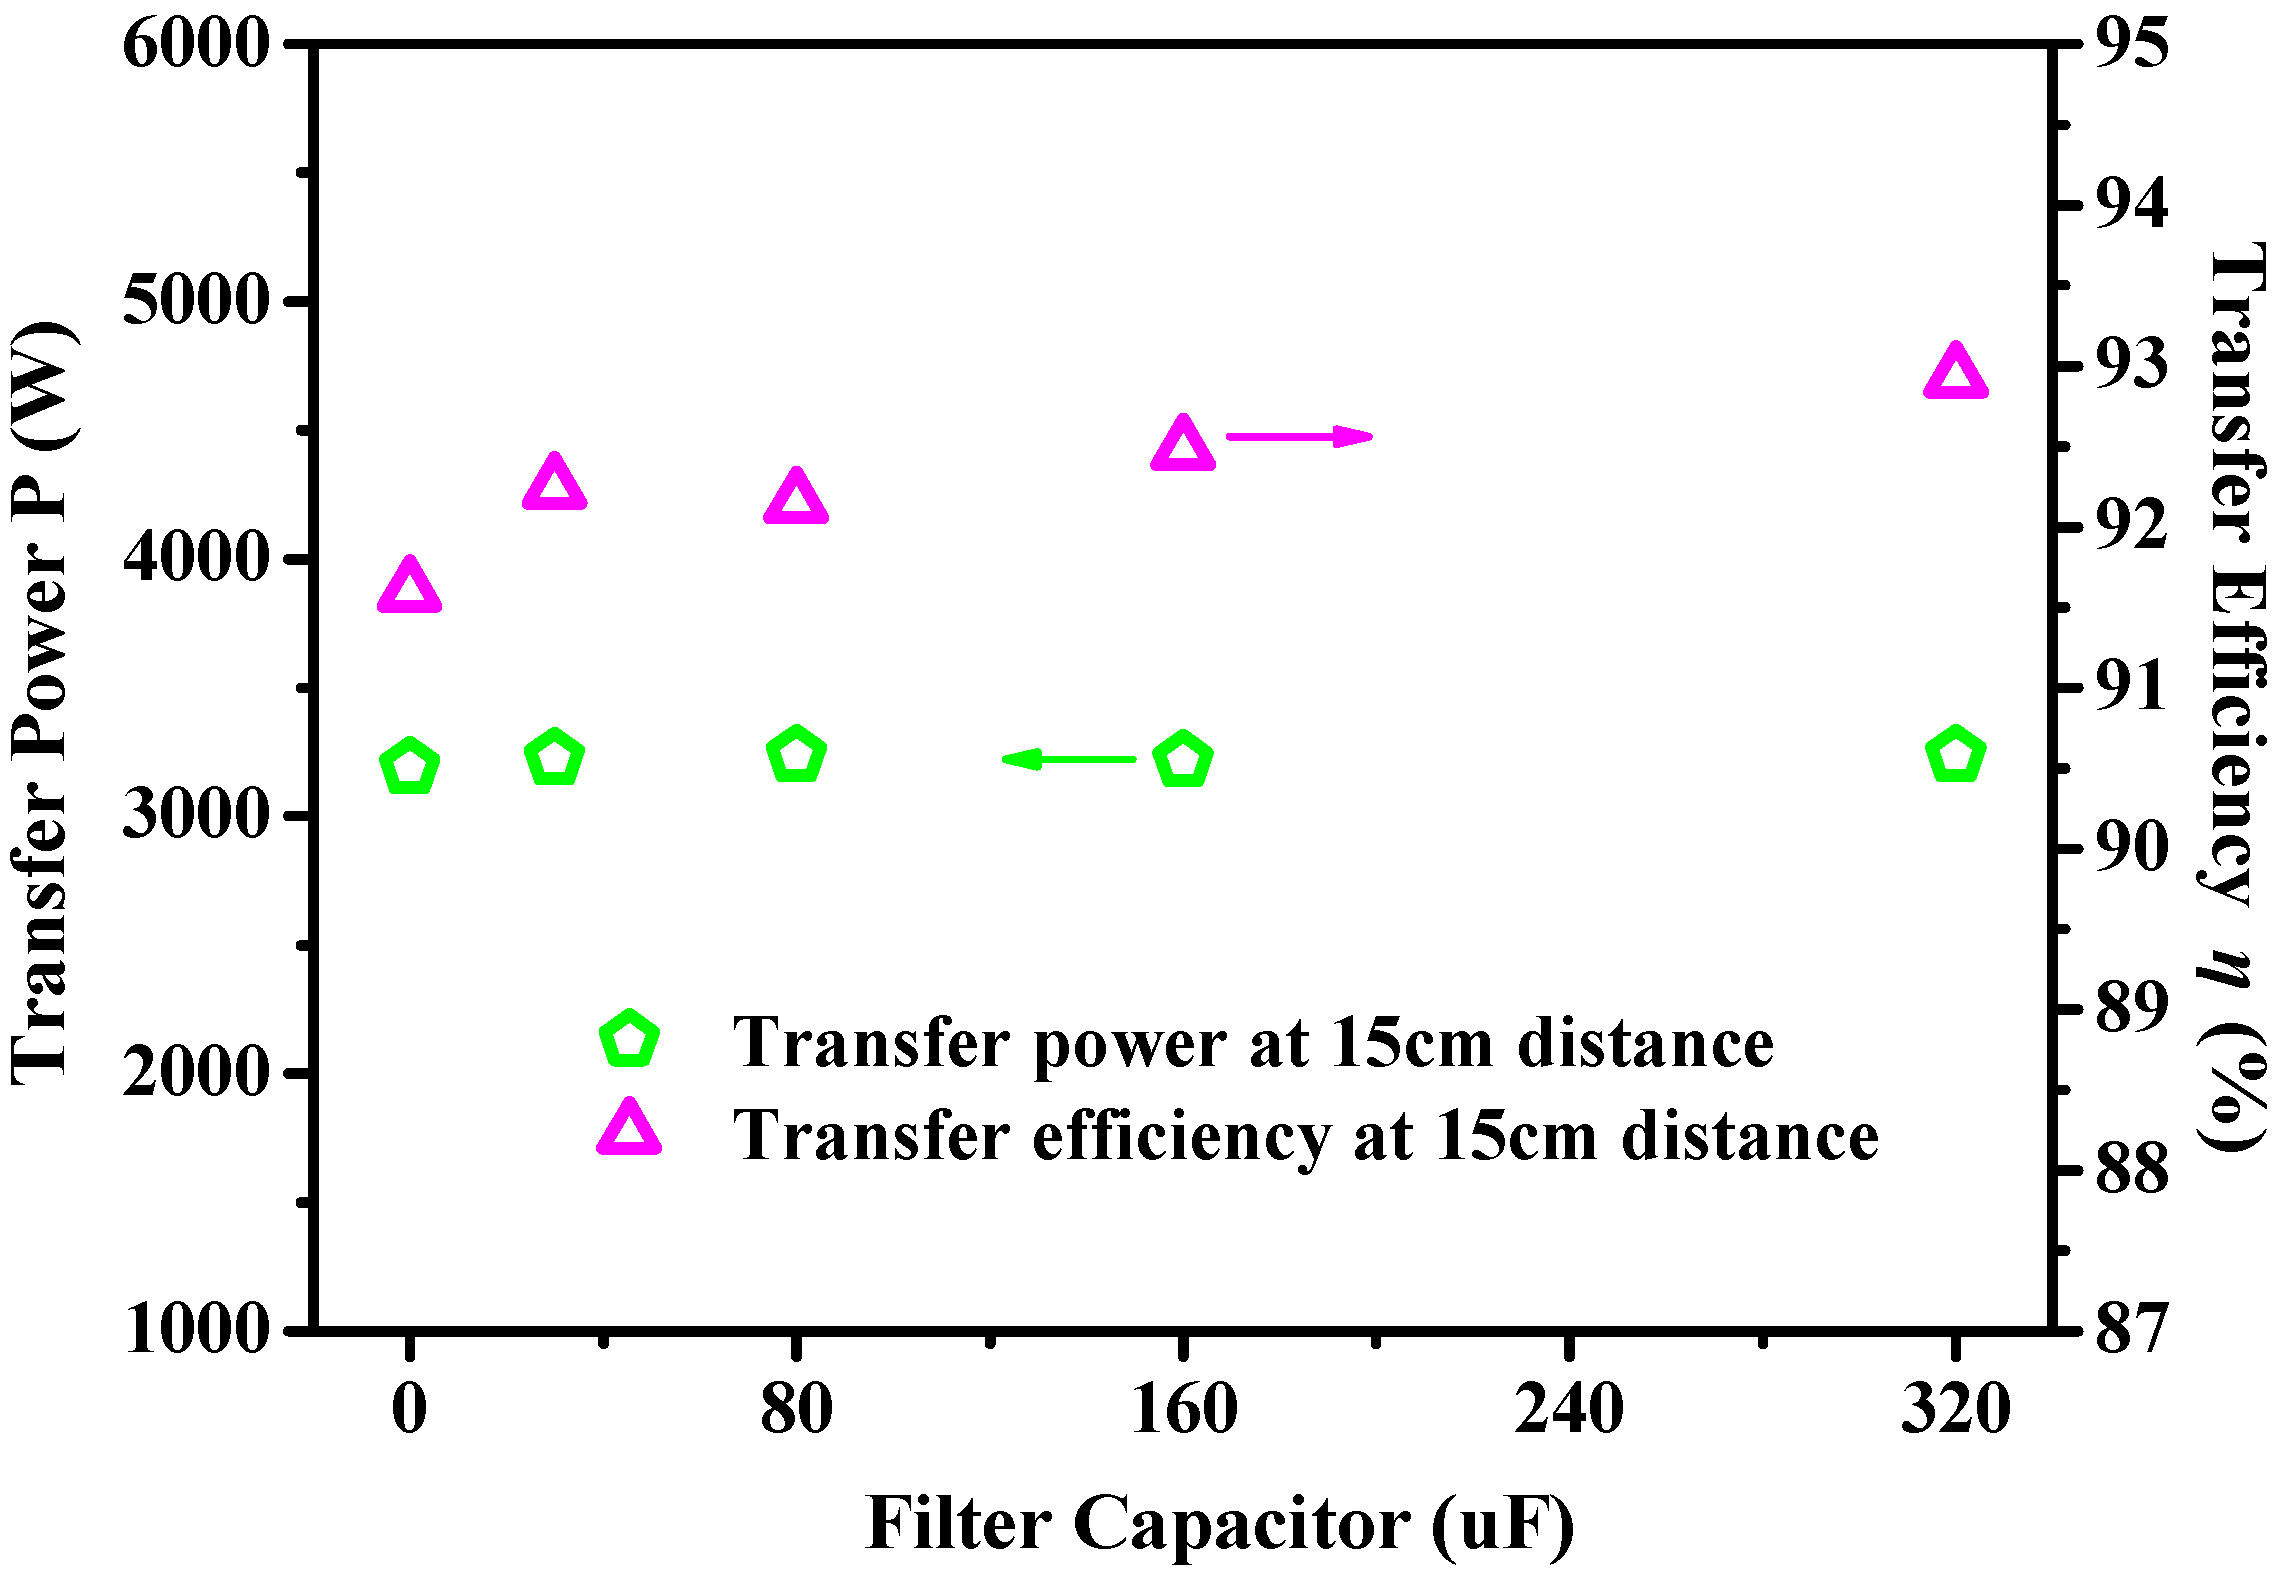
Then, we will compare the system transfer characteristics when the filter capacitors are different. As shown in
Figure 22, the system transfers the same power despite different filter capacitors, and this can also be found in
Figure 20 and
Figure 21, for the charging currents are the same (10.4 A). Also, they show a good agreement with the simulations in
Figure 12. However, the experimental transfer efficiencies are a little lower than those shown in
Figure 12. In practice, we cannot make the values of the resonate and compensating capacitors the same as those used in the simulation, and thus the system may not be in the quasi-resonant state, which lowers the system transfer characteristics. Additionally, the current probe TCP0020 is a hall device, and thus there are certain measure errors in the test currents, which could also cause the drop in efficiency. With the increase of the filter capacitors, we can find that the efficiency takes on a slightly increasing trend. However, such a small difference can be ignored in practice.
Figure 21.
Critical waveforms when the filter capacitors are (a) 30, (b) 80, (c) 160 and (d) 320 μF.
Figure 21.
Critical waveforms when the filter capacitors are (a) 30, (b) 80, (c) 160 and (d) 320 μF.
Figure 22.
System transfer characteristics with different filter capacitors at 15 cm distance.
Figure 22.
System transfer characteristics with different filter capacitors at 15 cm distance.
We have already validated that the system transfer characteristics are almost unchanged although the filter capacitors are different, and it is beneficial to the miniaturization and lightweight design of the receiver.
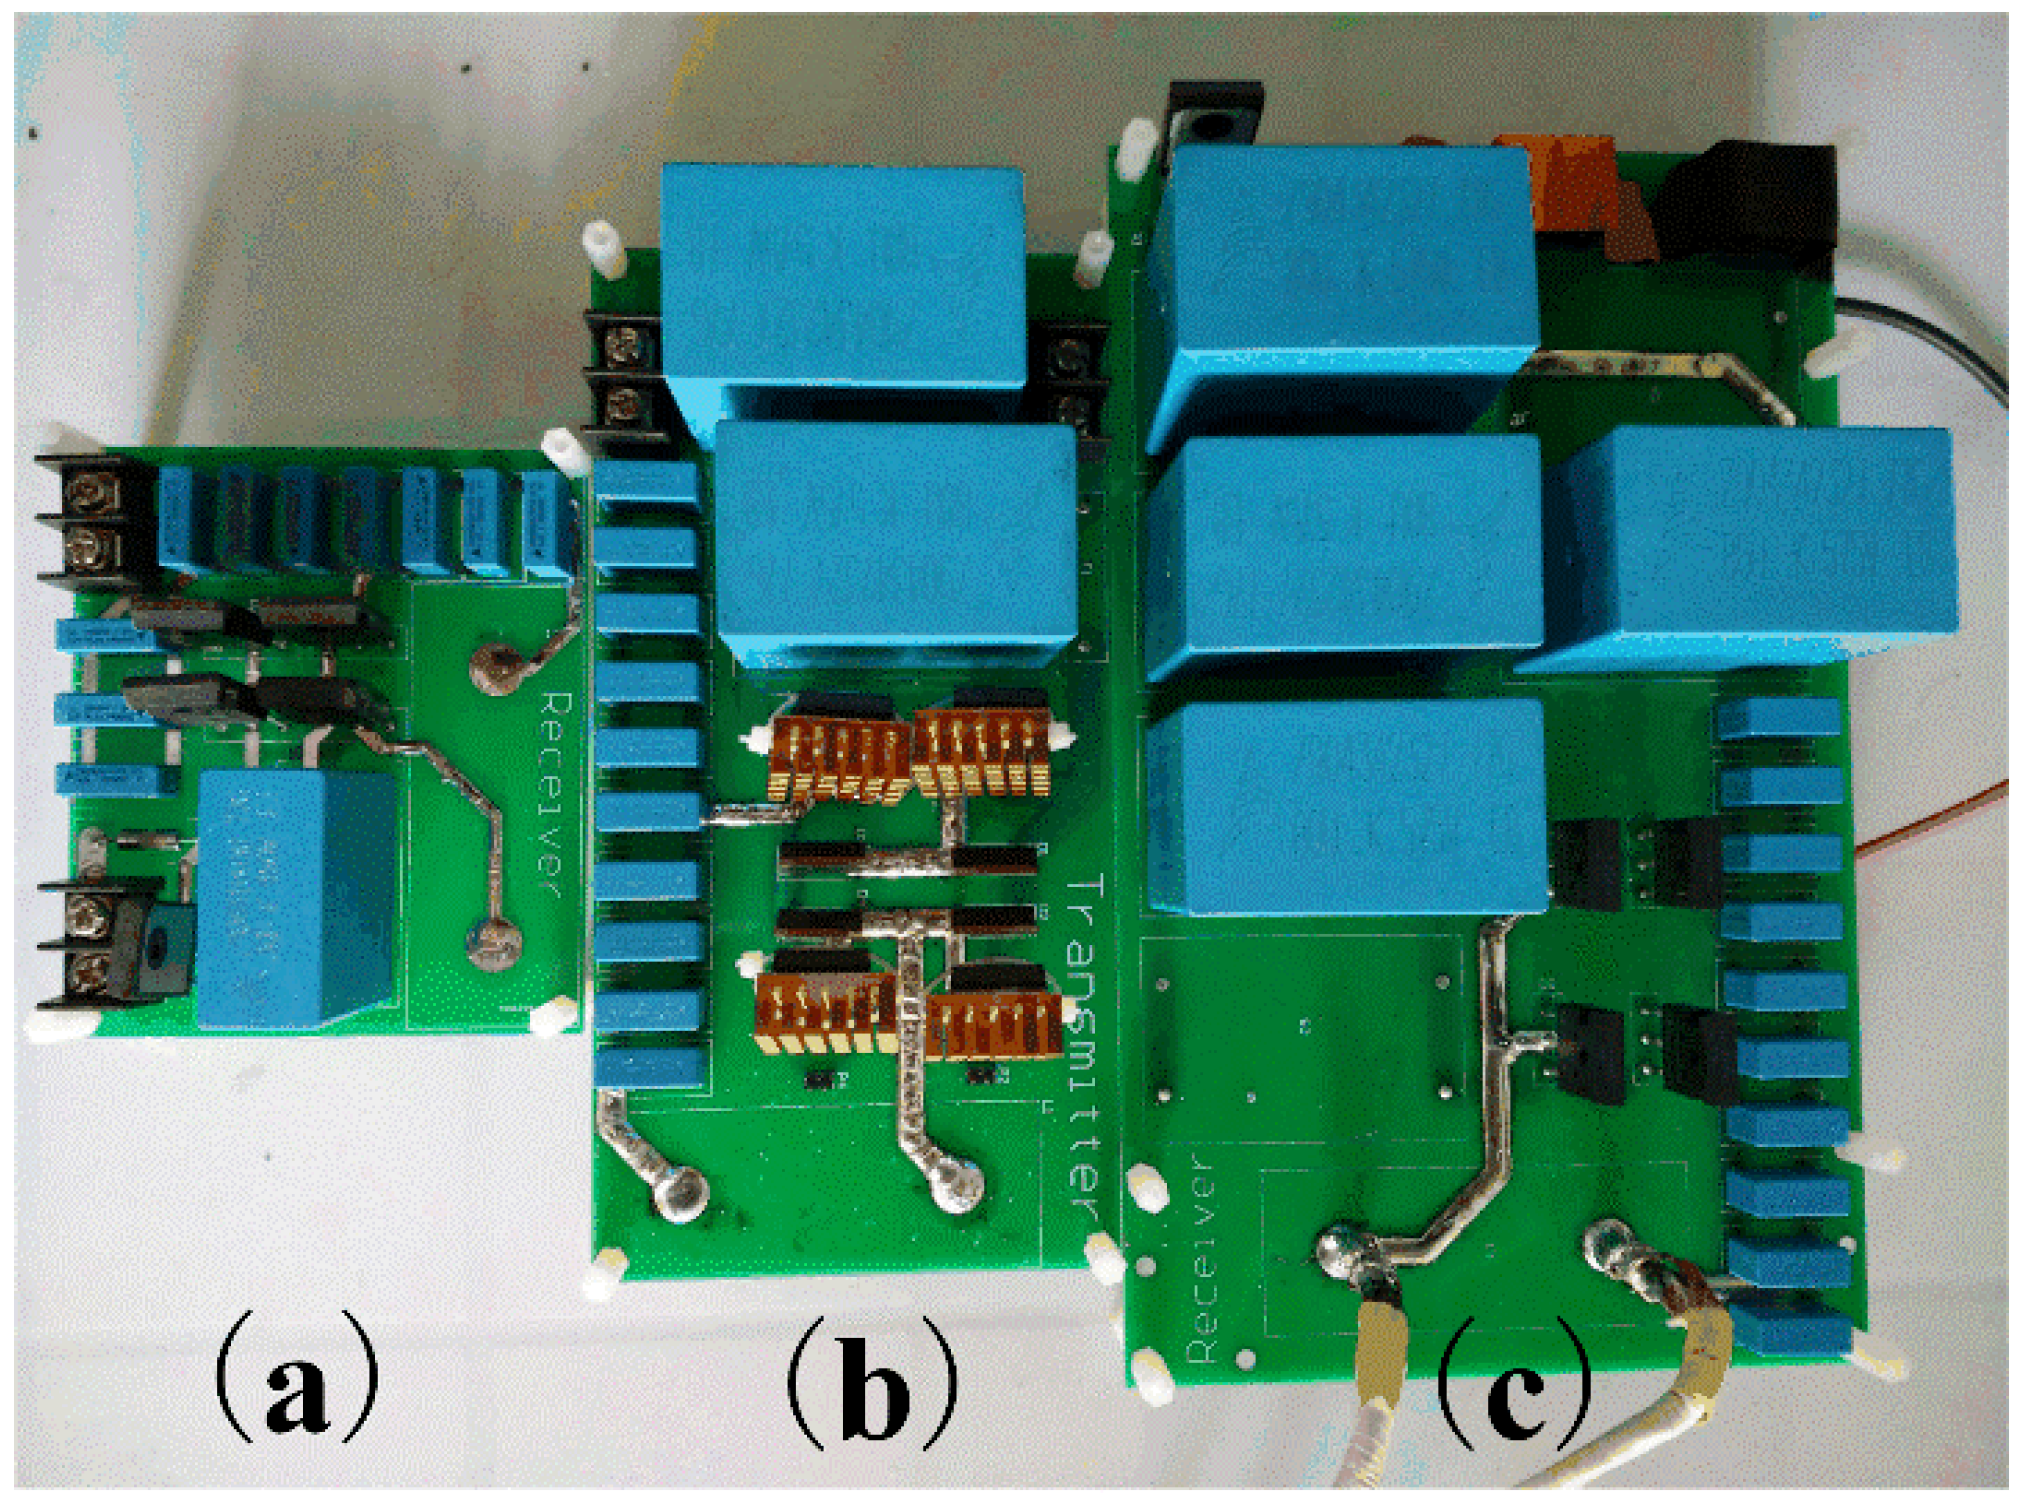
Figure 23 shows three receiver boards with different filter capacitors: the left one has a 30 μF filter capacitor, the middle one has two 80 μF filter capacitors, and the left one has four 80 μF filter capacitors. Apparently, the left board is smaller and lighter than the other two boards. Normally, the receiver board is mounted on the vehicle chassis; for that, the smaller and lighter it is, the better. If the 30 μF filter capacitor of the left receiver board in
Figure 23 is removed, the volume and weight of the board can be further reduced. This is beneficial to the design of wireless charging systems for electric vehicles.
Figure 23.
Receiver board with the 30 μF (a), 160 μF (b) and 320 μF (c) filter capacitors.
Figure 23.
Receiver board with the 30 μF (a), 160 μF (b) and 320 μF (c) filter capacitors.


