Communication Network Architectures for Smart-Wind Power Farms


1
Department of Computer Engineering, Chonbuk National University, Jeonju 561-756, Korea
2
Smart Grid Research Center, Chonbuk National University, Jeonju 561-756, Korea
*
Author to whom correspondence should be addressed.
Energies 2014, 7(6), 3900-3921; https://doi.org/10.3390/en7063900
Submission received: 11 February 2014
/
Revised: 28 May 2014
/
Accepted: 9 June 2014
/
Published: 23 June 2014
(This article belongs to the Special Issue Wind Turbines 2014)
Abstract
:Developments in the wind power industry have enabled a new generation of wind turbines with longer blades, taller towers, higher efficiency, and lower maintenance costs due to the maturity of related technologies. Nevertheless, wind turbines are still blind machines because the control center is responsible for managing and controlling individual wind turbines that are turned on or off according to demand for electricity. In this paper, we propose a communication network architecture for smart-wind power farms (Smart-WPFs). The proposed architecture is designed for wind turbines to communicate directly and share sensing data in order to maximize power generation, WPF availability, and turbine efficiency. We also designed a sensor data frame structure to carry sensing data from different wind turbine parts such as the rotor, transformer, nacelle, etc. The data frame includes a logical node ID (LNID), sensor node ID (SNID), sensor type (ST), and sensor data based on the International Electrotechnical Commission (IEC) 61400-25 standard. We present an analytical model that describes upstream traffic between the wind turbines and the control center. Using a queueing theory approach, the upstream traffic is evaluated in view of bandwidth utilization and average queuing delay. The performance of the proposed network architectures are evaluated by using analytical and simulation models.
1. Introduction
There are great efforts all over the world for moving energy generation to wind energy instead of the conventional fossil fuels as it provides clean, safe, and environmentally-friendly power. For this purpose, many large-scale wind power farms (WPFs) are already in the operation phase, and others are currently under construction or in the design phase. This progress in the wind power industry has enabled a new generation of wind turbines with more mature technology to have longer blades that capture more energy, taller towers, higher efficiency, and lower maintenance costs. Nevertheless, wind turbines are still blind machines because the control center manages and controls individual wind turbines. With the smart grid revolution, future electric power systems will be more reliable, efficient, and secure [1]. There are three major components to the smart grid: generation, distribution, and consumption. With respect to future communication and networking technologies for smart grids, most prior research has focused on communication network architectures for power consumption (home, building, factory, etc.) and on how to balance between power demand of the consumers and electric power generation. Little research has focused on communication network architectures for energy generation from renewable sources (wind power, solar energy, etc.).
The International Electrotechnical Commission (IEC) 61400-25 standard has been developed to provide uniform information exchange for monitoring and control in wind power plants. In the context of communication networks, the focus of the IEC 61400-25 standard is on onshore wind farms. The standard only provides data structures without considering new developments in wind energy. Therefore, Nguyen et al. [2] developed an information model for offshore wind farms in the smart grid. Machine-to-machine (M2M) communication is a communication technology without any form of human intervention. It is mainly driven by the maturity of wireless communication systems and sensors. Zhang et al. [3] proposed cognitive radio M2M communication for the smart grid. The authors outlined the network architecture for renewable energy field area networks (wind power and solar energy). They also described the communication networks for grid protector field area networks, neighbored area networks, and home area networks.
One of the most important demands for WPFs is to design a reliable communication network for wind farm monitoring. The control center is responsible for autonomously monitoring, managing and controlling the operation of the WPF, and human intervention is only needed in the case of configuration, maintenance, or failure repairs [4]. There are different solutions for communication networks associated with industrial applications. For example, fieldbus systems represent the first generation of industrial networks, and due to their bandwidth and throughput limitations, these systems are no longer attractive solutions in industrial applications. Currently, the second-generation industrial network is known as the real-time Ethernet, which can assure lower costs, improved performance, and higher data transfer rates [5]. Passive optical networks (PON) based on real-time Ethernet are considered to be the next generation communication networks for different industrial applications [6].
Most supervisory control and data acquisition (SCADA) systems operate with proprietary protocols with limited bandwidth and low capabilities that cannot support future communication needs. A reliable communication infrastructure is needed, as it plays the main part of enabling effective monitoring, operation, and protection both for WPF generators and power systems. There is a need for smart communication networks without human intervention between the wind turbines and the control center. To the best of our knowledge, no previous work has provided insight into smart-wind power farms (Smart-WPFs). No detailed model has been given for communication network architectures, network topologies, communication technologies, or types of shared data among wind turbines. Since wind turbines will be intelligent machines in Smart-WPFs, turbines will be able to communicate and share sensing data. Our recent work considered the recent progress of PON infrastructure for next generation large-scale WPFs [7].
In this paper, we develop the communication network architecture for Smart-WPFs. The proposed network model converge the advances in wireless communication with Ethernet passive optical network (EPON) architecture in order to implement future Smart-WPFs. We define different wind turbine applications based on IEC 61400-25 standard. We design a sensor data frame structure to carry the sensing data from different wind turbine parts and characterize the senor types and sensor data size for EPON based architecture. Fixed bandwidth allocation (FBA) is considered in order to transmit the sensing data efficiently. For wireless-based solution, we define the data type and data packet format for transmitting meteorological data among wind turbines. We evaluate the proposed network architectures in light of analytical and simulation models.
The remainder of the paper is organized as follows: in Section 2, we introduce the WPF communication network and data flow within the wind turbine and its design requirements; Section 3 explains the proposed communication network architectures for the Smart-WPFs, including the EPON-based network solution, data frame structure, and shared data among wind turbines; Section 4 provides a performance evaluation of the proposed network architectures; finally, Section 5 concludes the paper and gives directions for future work.
2. Related Works
2.1. Smart Grid for WPF
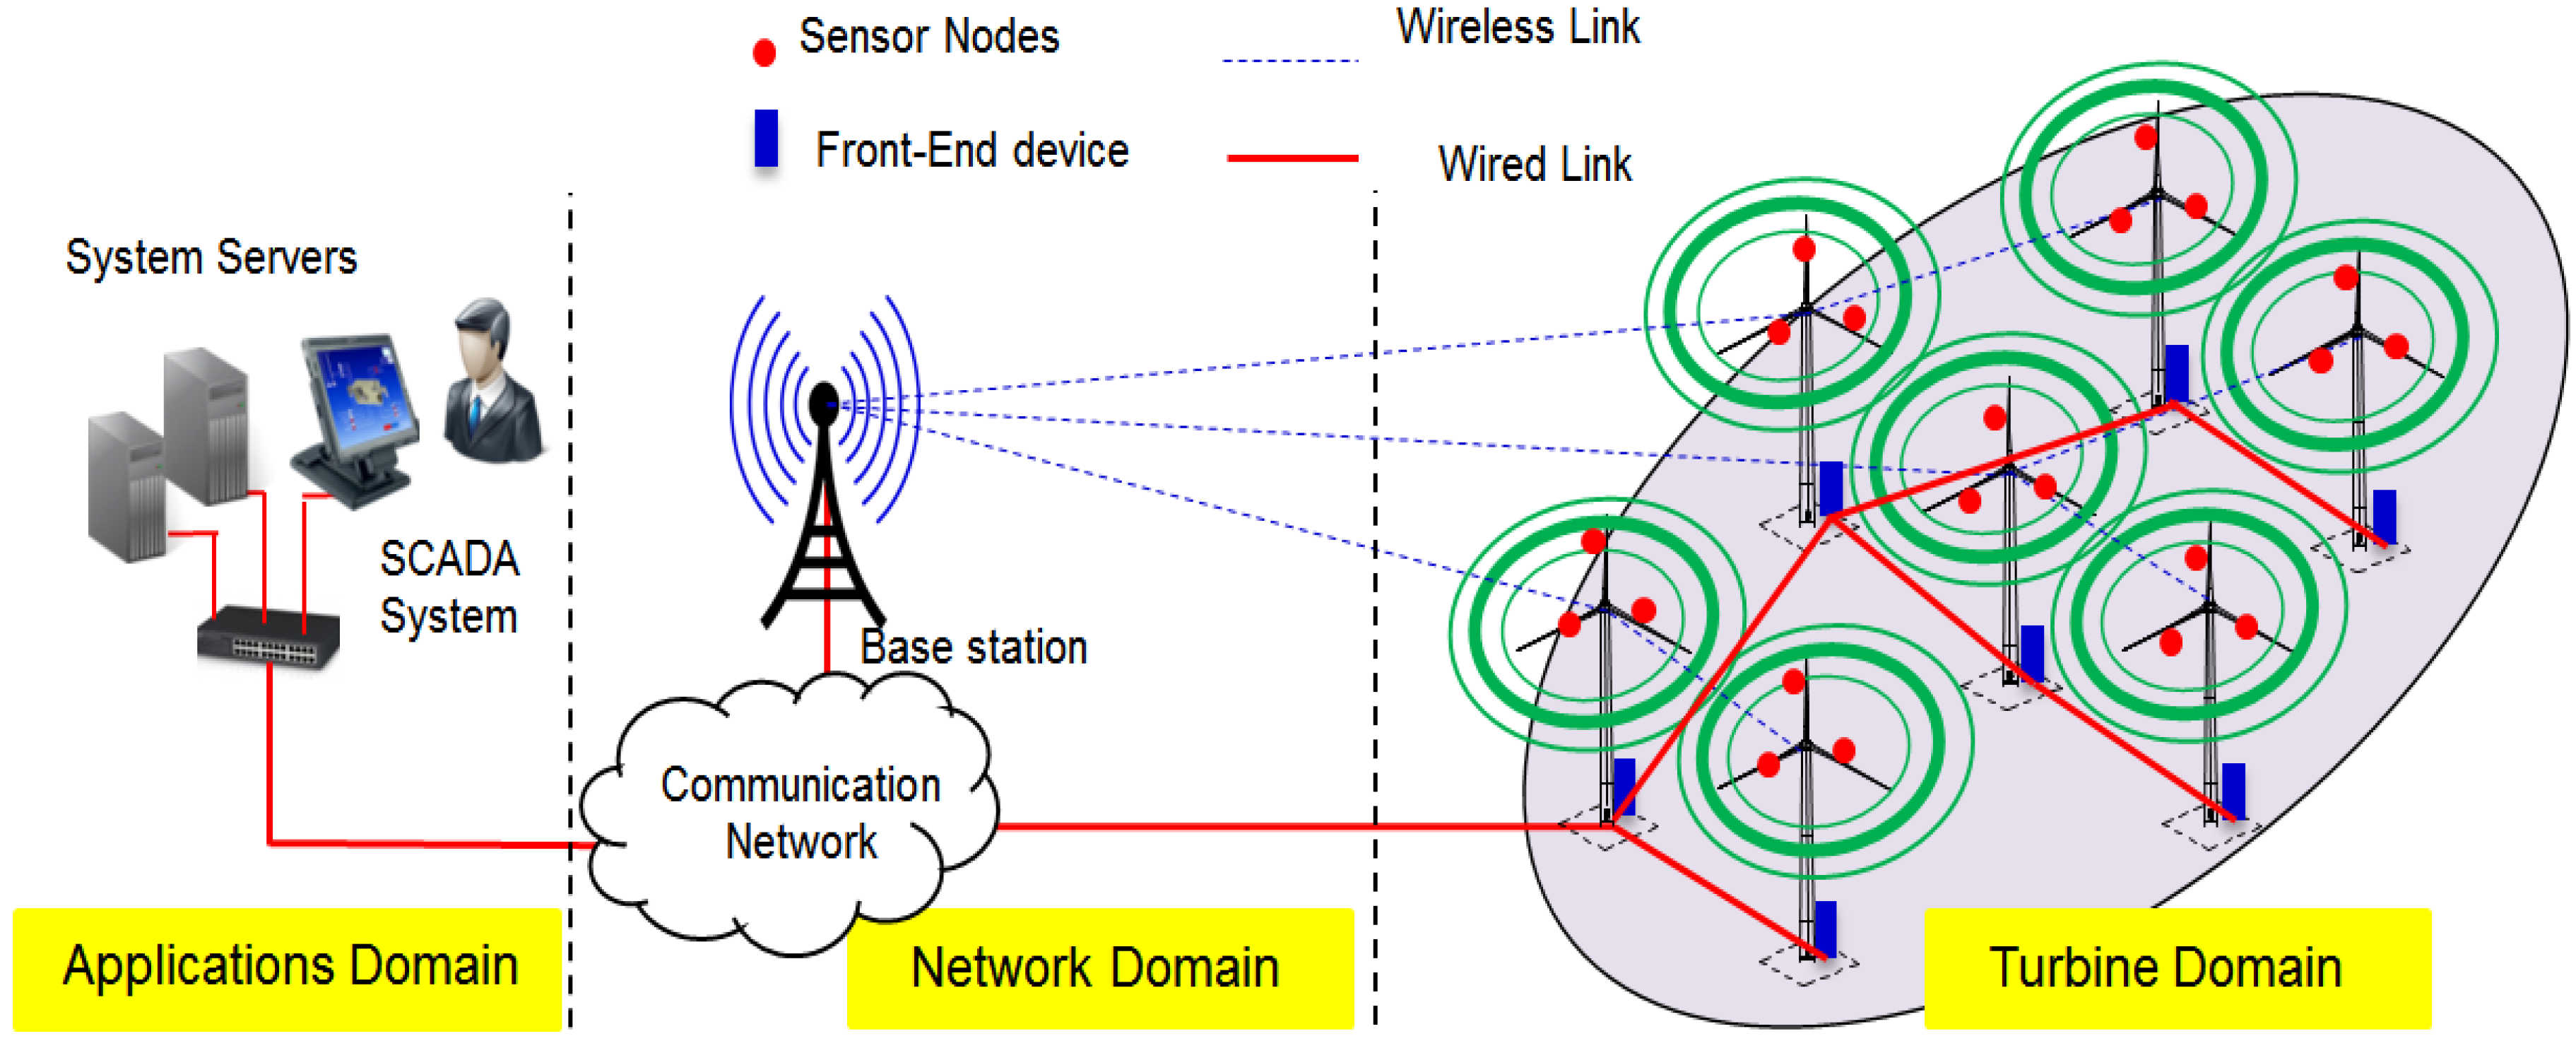
Based on the smart grid interoperability panel (SGIP), the electric power system consists of seven integrated domains: markets, operation, service provider, generation, transmission, distribution, and customers. The focus of this work is on electricity generated by WPFs. The generation domain in electric power systems is electrically connected to the transmission domain and shares interfaces with the operations, markets, and transmission domains [8]. Special attention should be given to communication infrastructure because the communication network is as important as the electric infrastructure itself, and failures in the communication network will contribute to a very high percentage of large failures for the power system [9]. There are three domains for the Smart-WPF: turbine domain, network domain and application domain as shown in Figure 1:
- •
- Turbine domain: wind turbines communicate directly and share sensing data with other wind turbines to maximize power generation, availability, and lifetime;
- •
- Network domain: supports a reliable connection between the wind farm and the main grid. It should be reliable, scalable and fast, and should satisfy a range of quality of services (QoSs) for different applications;
- •
- Application domain: helps control center operators improve the main functions of monitoring, analysis, and control.
Figure 1.
Smart-wind power farms’ (Smart-WPFs) domains. SCADA: supervisory control and data acquisition.
Figure 1.
Smart-wind power farms’ (Smart-WPFs) domains. SCADA: supervisory control and data acquisition.

Conventional WPF communication infrastructures are switch-based architectures, where each wind turbine is equipped with an industrial Ethernet switch (ESW) at the base of the tower, and optical fiber cables are used to connect between wind towers. In the case of large-scale WPFs, independent sets of switches and communication links are considered to interconnect different applications such as those involved in monitoring, operation, and protection. The transmitted data from the wind turbines may take a path through many ESWs in order to reach the control center side, based on the turbine location and the WPF topology [10,11]. The limitations of conventional WPF architectures are:
- •
- Low reliability, the failure in a wind turbine ESW may affect the remaining turbines preventing them from connecting with the control center;
- •
- High cost, the price of the ESW is too expensive, and independent sets of switches and communication links add more costs to the WPF; and
- •
- Difficulty in guaranteeing real-time monitoring and control in case of sharing the same physical link with all wind turbine traffic.
To solve the aforementioned problems, the advantages of recent technologies and services should be considered for current electric power systems, with a view on making electricity networks more efficient, reliable, scalable, extendable, and secure. Also, recent progresses made in communication technologies and protocols which had not been considered in the past should be considered to design new communication architectures for next generation WPFs [12,13].
2.2. Data Flow within the Wind Turbine and Network Requirements
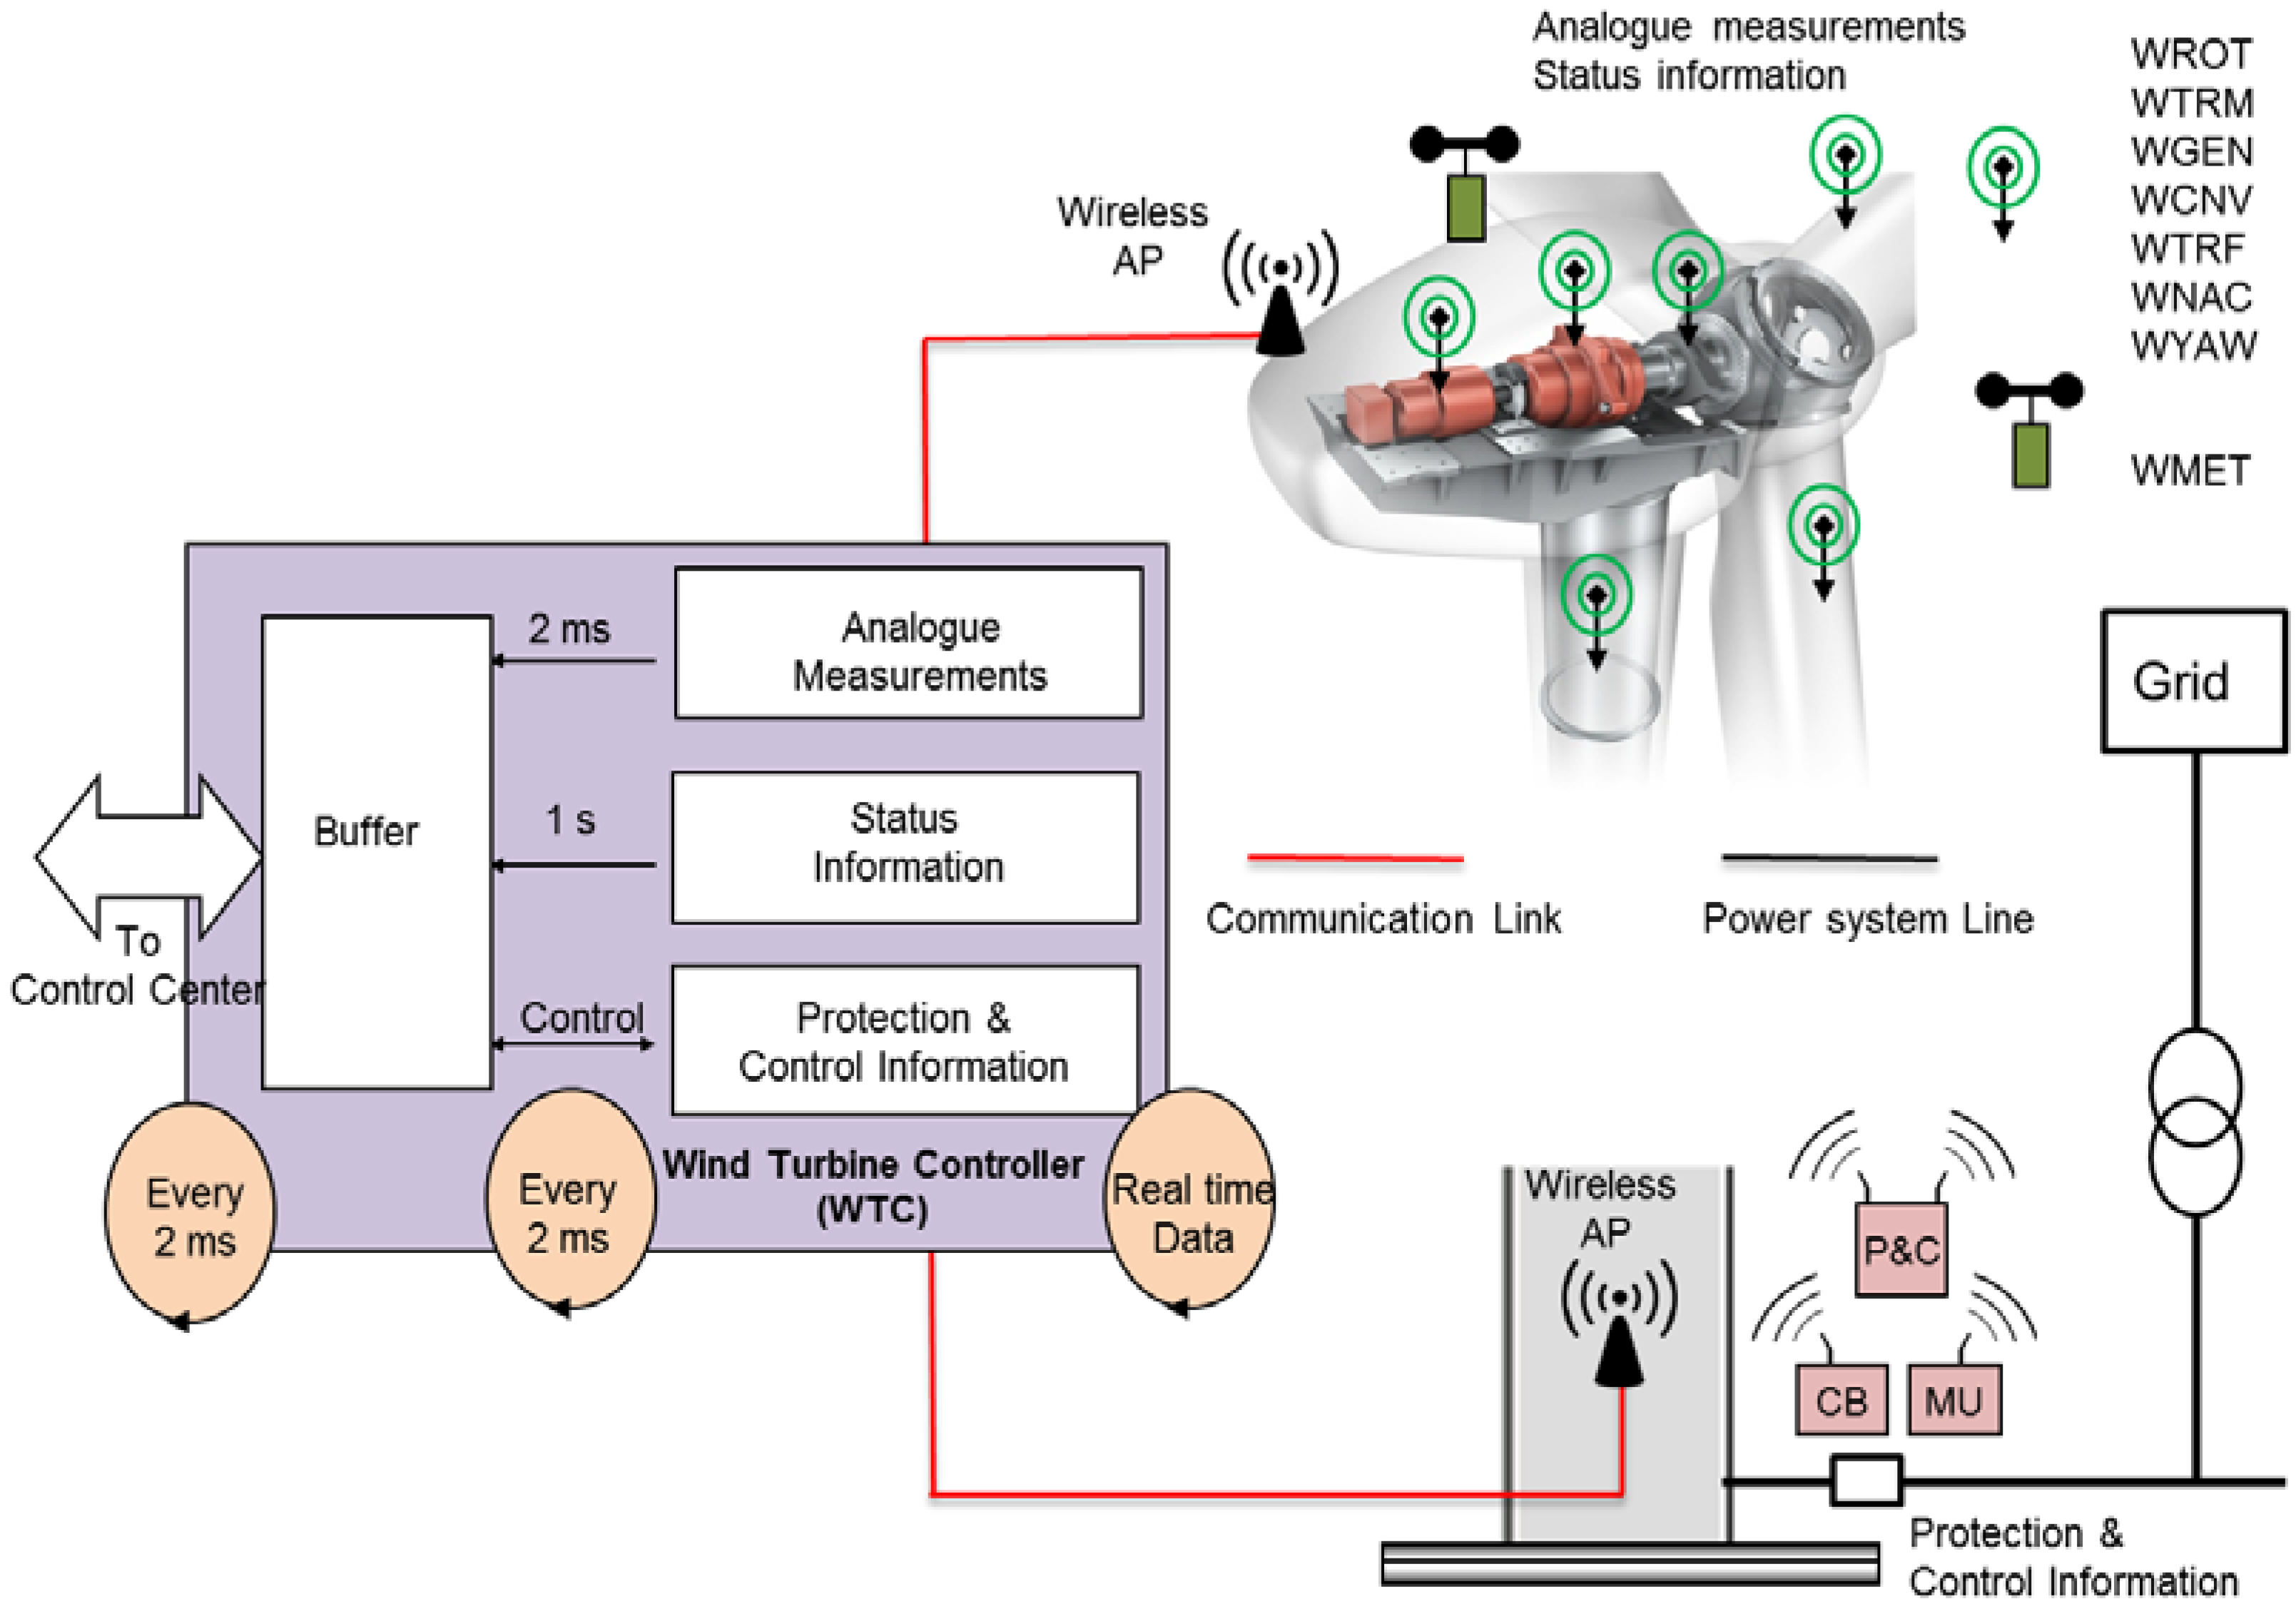
Considering the IEC 61400-25 standard, we classified the wind turbine generated data into three different categories: analogue measurements (AM), status information (SI), and protection and control information (PCI). The AM and SI represent different sensors and measurement devices periodically transmit the sensing data to the control center at different time intervals. The PCI is used for the purpose of substation automation and remote monitoring and control. In order to handle and store the generated data from the sensor nodes (SNs), wind turbines are equipped with a master PC. This master PC is connected through a communication link with the wind turbine controller (WTC), which transmits the data periodically to the control center as shown in Figure 2. Furthermore, the WTC enables the control center to connect, manage, and control the wind turbine remotely. Based on turbine manufacturer, a proprietary protocol is used to transmit the generated traffic at different time intervals [14].
Figure 2.
Generated data from sensor nodes (SNs) at the wind turbine side. AP: access point.

The design of the wind farm SCADA system and the communication infrastructure must be performed with consideration to overall system resilience to ensure the highest level of availability for the SCADA system and associated control and protection equipment [10,11]. The main design requirements are:
- •
- Environmental issues: wind turbines are exposed to extreme environmental conditions including high level of pollution, salt, humidity and abrupt temperature changes. The devices operating in the offshore environment shall have a special design for preventing corrosion and high humidity.
- •
- Redundancy: the WPF communication network shall always guarantee proper function against a single point of failure. All critical networking devices such as switches or routers shall be duplicated.
- •
- Self-healing network: the WPF communication network shall be resilient to failures and shall be characterized by fast recovery time.
Considering IEC 61400-25, the standard does not provide any specific communication network requirement for WPFs. However, critical communication characteristics such as security and QoS should be considered in order to design a communication network for WPFs. The network security must ensure the wind farm data and its protection against attacks. The QoS is one of the important parameters to evaluate the WPF communication network. It defines the network characteristics such as bandwidth, latency, packet loss, etc. Table 1 shows the communication timing requirements for different message types based on IEC 61850 [12].

Table 1.
Communication timing requirements for different message types based on International Electrotechnical Commission (IEC) 61850.
| Message types | Application | Delay requirements (ms) |
|---|---|---|
| Type 1 | Fast message | 3–100 |
| Type 2 | Medium speed | 100 |
| Type 3 | Low speed | 500 |
| Type 4 | Raw data | 3–10 |
| Type 5 | Large file transfers | 1000 |
Two different communication technologies, i.e., wired and wireless, could be used for local communication of a wind turbine data and also for the connection between the wind turbines and the control center. It is critical to select the best communication network protocols inside the wind turbine in order to maintain the real time data transmission in the system and also to meet the requirement of industrial application [15,16]. Table 2 shows different communication network technologies for WPF.
Table 2.
Communication network technologies for wind power farms (WPFs). PON: passive optical networks; WDM: wavelength division multiplexing; SONET: synchronous optical network; SDH: synchronous digital hierarchy; GSM: global system for mobile communications; and GPRS: general packet radio service.
| Technology | Standard/protocol | Data rate | Coverage range |
|---|---|---|---|
| Fiber optics | PON | 155 Mbps–2.5 Gbps | Up to 60 km |
| WDM | 40 Gbps | Up to 100 km | |
| SONET/SDH | 10 Gbps | Up to 100 km | |
| ZigBee | ZigBee | 250 kbps | Up to 100 m |
| ZigBee Pro | 250 kbps | Up to 1600 m | |
| WLAN | 802.11x | 2–600 Mbps | Up to 100 m |
| WiMAX | 802.16 | 75 Mbps | Up to 50 km |
| Cellular | GSM | Up to 14.4 kbps | 1–10 km |
| GPRS | Up to 170 kbps | ||
| 3G | 384 kbps–2 Mbps |
3. Proposed Smart-WPFs
This section proposes the communication network architectures for Smart-WPFs. They consist of a TAN, FAN and CAN. Hybrid communication architectures are used for both wired-based and wireless-based solutions to implement the proposed architectures. In view of wired solution, EPON-based communication architecture is used for communication between wind turbines and control center. We designed a sensor data frame structure to carry the sensing data from different wind turbine parts inside the wind turbine. With respect to the wireless solution, the meteorological data are selected to be shared among wind turbines.
3.1. Hierarchical Network Architectures
Recent advances in sensor technology and communication networks are considered as the main drivers to achieve Smart-WPFs. Also, M2M communication in industrial networks will enable machines to share and exchange data with little or no human intervention. In the proposed Smart-WPF, wind turbines are intelligent machines where turbines are able to communicate and share sensing data and measurements. The main features of future Smart-WPFs are described as follows:
- •
- Wind turbines communicate with other wind turbines, and wind turbines are not blind machines;
- •
- Wind turbines have many SNs that help to react to different conditions;
- •
- Wind turbines with a malfunction can use monitoring information of neighboring wind turbines;
- •
- Wind turbines integrate energy storage system and forecasting algorithms;
- •
- Wind turbines decide the time to store energy and the time to feed to the grid based on electric demand;
- •
- Each turbine can know the amount of power it generates relative to other turbines.
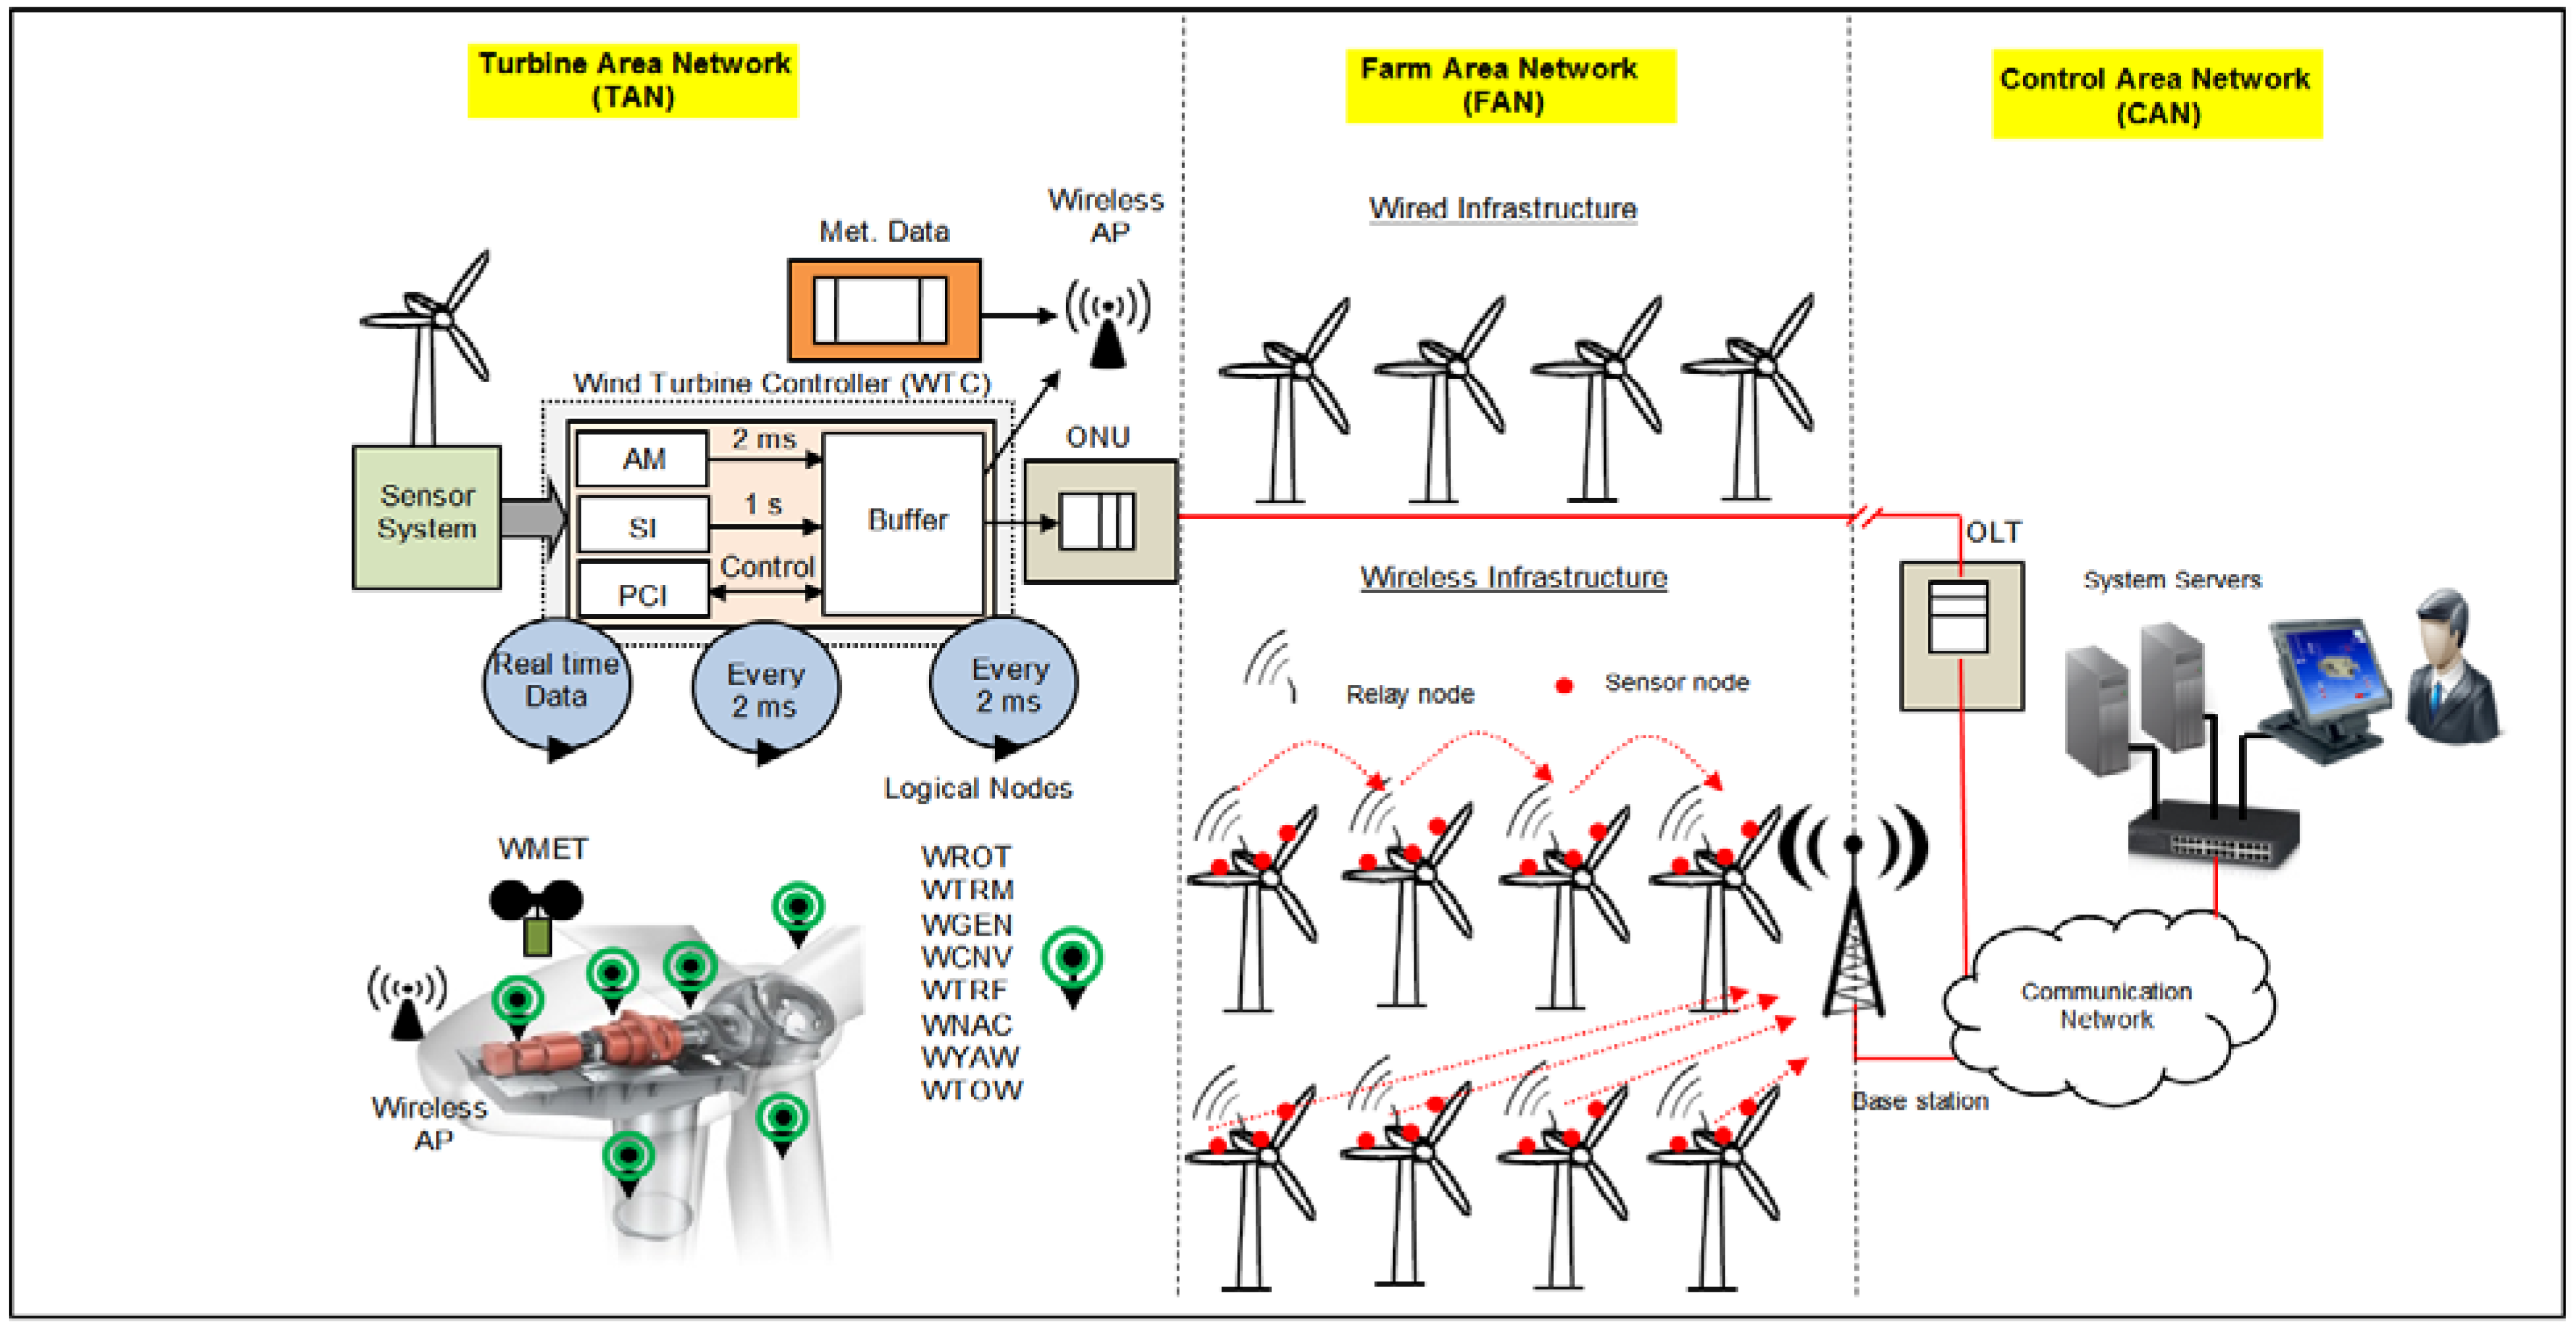
The proposed communication network architecture for the Smart-WPF consists of three networks: the turbine area network (TAN), the farm area network (FAN), and the control area network (CAN) as shown in Figure 3. It consists of hierarchical architectures where Level 1 is a sensor network in a single wind turbine, Level 2 is the wind turbine-to-wind turbine interaction in the WPF, Level 3 is the local control center to wind turbine interaction, and Level 4 is the farm-to-farm interaction to optimize grid operation. In order to implement hierarchical network architectures, a hybrid communication solution is considered. EPON-based architecture represents a wired solution, while ZigBee-Pro is considered for the wireless solution. In this work, Levels 1 and 2 are explained in more detail, while Levels 3 and 4 are out the scope of this work.
Figure 3.
Proposed communication network architecture of Smart-WPFs. AM: analogue measurements; SI: status information; PCI: protection and control information; ONU: optical network unit; and OLT: optical line terminal.
Figure 3.
Proposed communication network architecture of Smart-WPFs. AM: analogue measurements; SI: status information; PCI: protection and control information; ONU: optical network unit; and OLT: optical line terminal.

3.1.1. TAN
In order to monitor the wind turbine operation, many SNs and measurement devices are installed inside the wind turbine. In Figure 3, the WTC is located at the wind turbine side, as it represents the intermediate stage between the sensor monitoring system and the communication network interface (optical network unit (ONU) or wireless access point (AP)). The connection between the control center and the wind turbine could be configured to be direct wired, direct wireless, or hop-by-hop wireless.
3.1.2. FAN
There are two types of network infrastructures in the FAN: wired and wireless. A wired architecture is configured based on the electric power topology, where the optical fiber is embedded in the electric power cables. A wireless infrastructure is independent from the electric configuration. The EPON-based network architecture consists of an ONU at the wind turbine side and optical line terminal (OLT) at the control center. It eliminates the use of active devices (Ethernet switches) in the signal path from the wind turbine to the control center which presents a seamless, reliable, and cost-effective solution. A wireless network or radio link may be incorporated to increase the network reliability as a redundant or backup link.
3.1.3. CAN
The control center main functions are monitoring, analysis and control. There are different devices at the control center, including the meteorological server, condition monitoring system, human machine interface, circuit breaker control, and metering servers.
3.2. Upstream Traffic in an EPON-Based Network
3.2.1. Wind Farm SCADA System
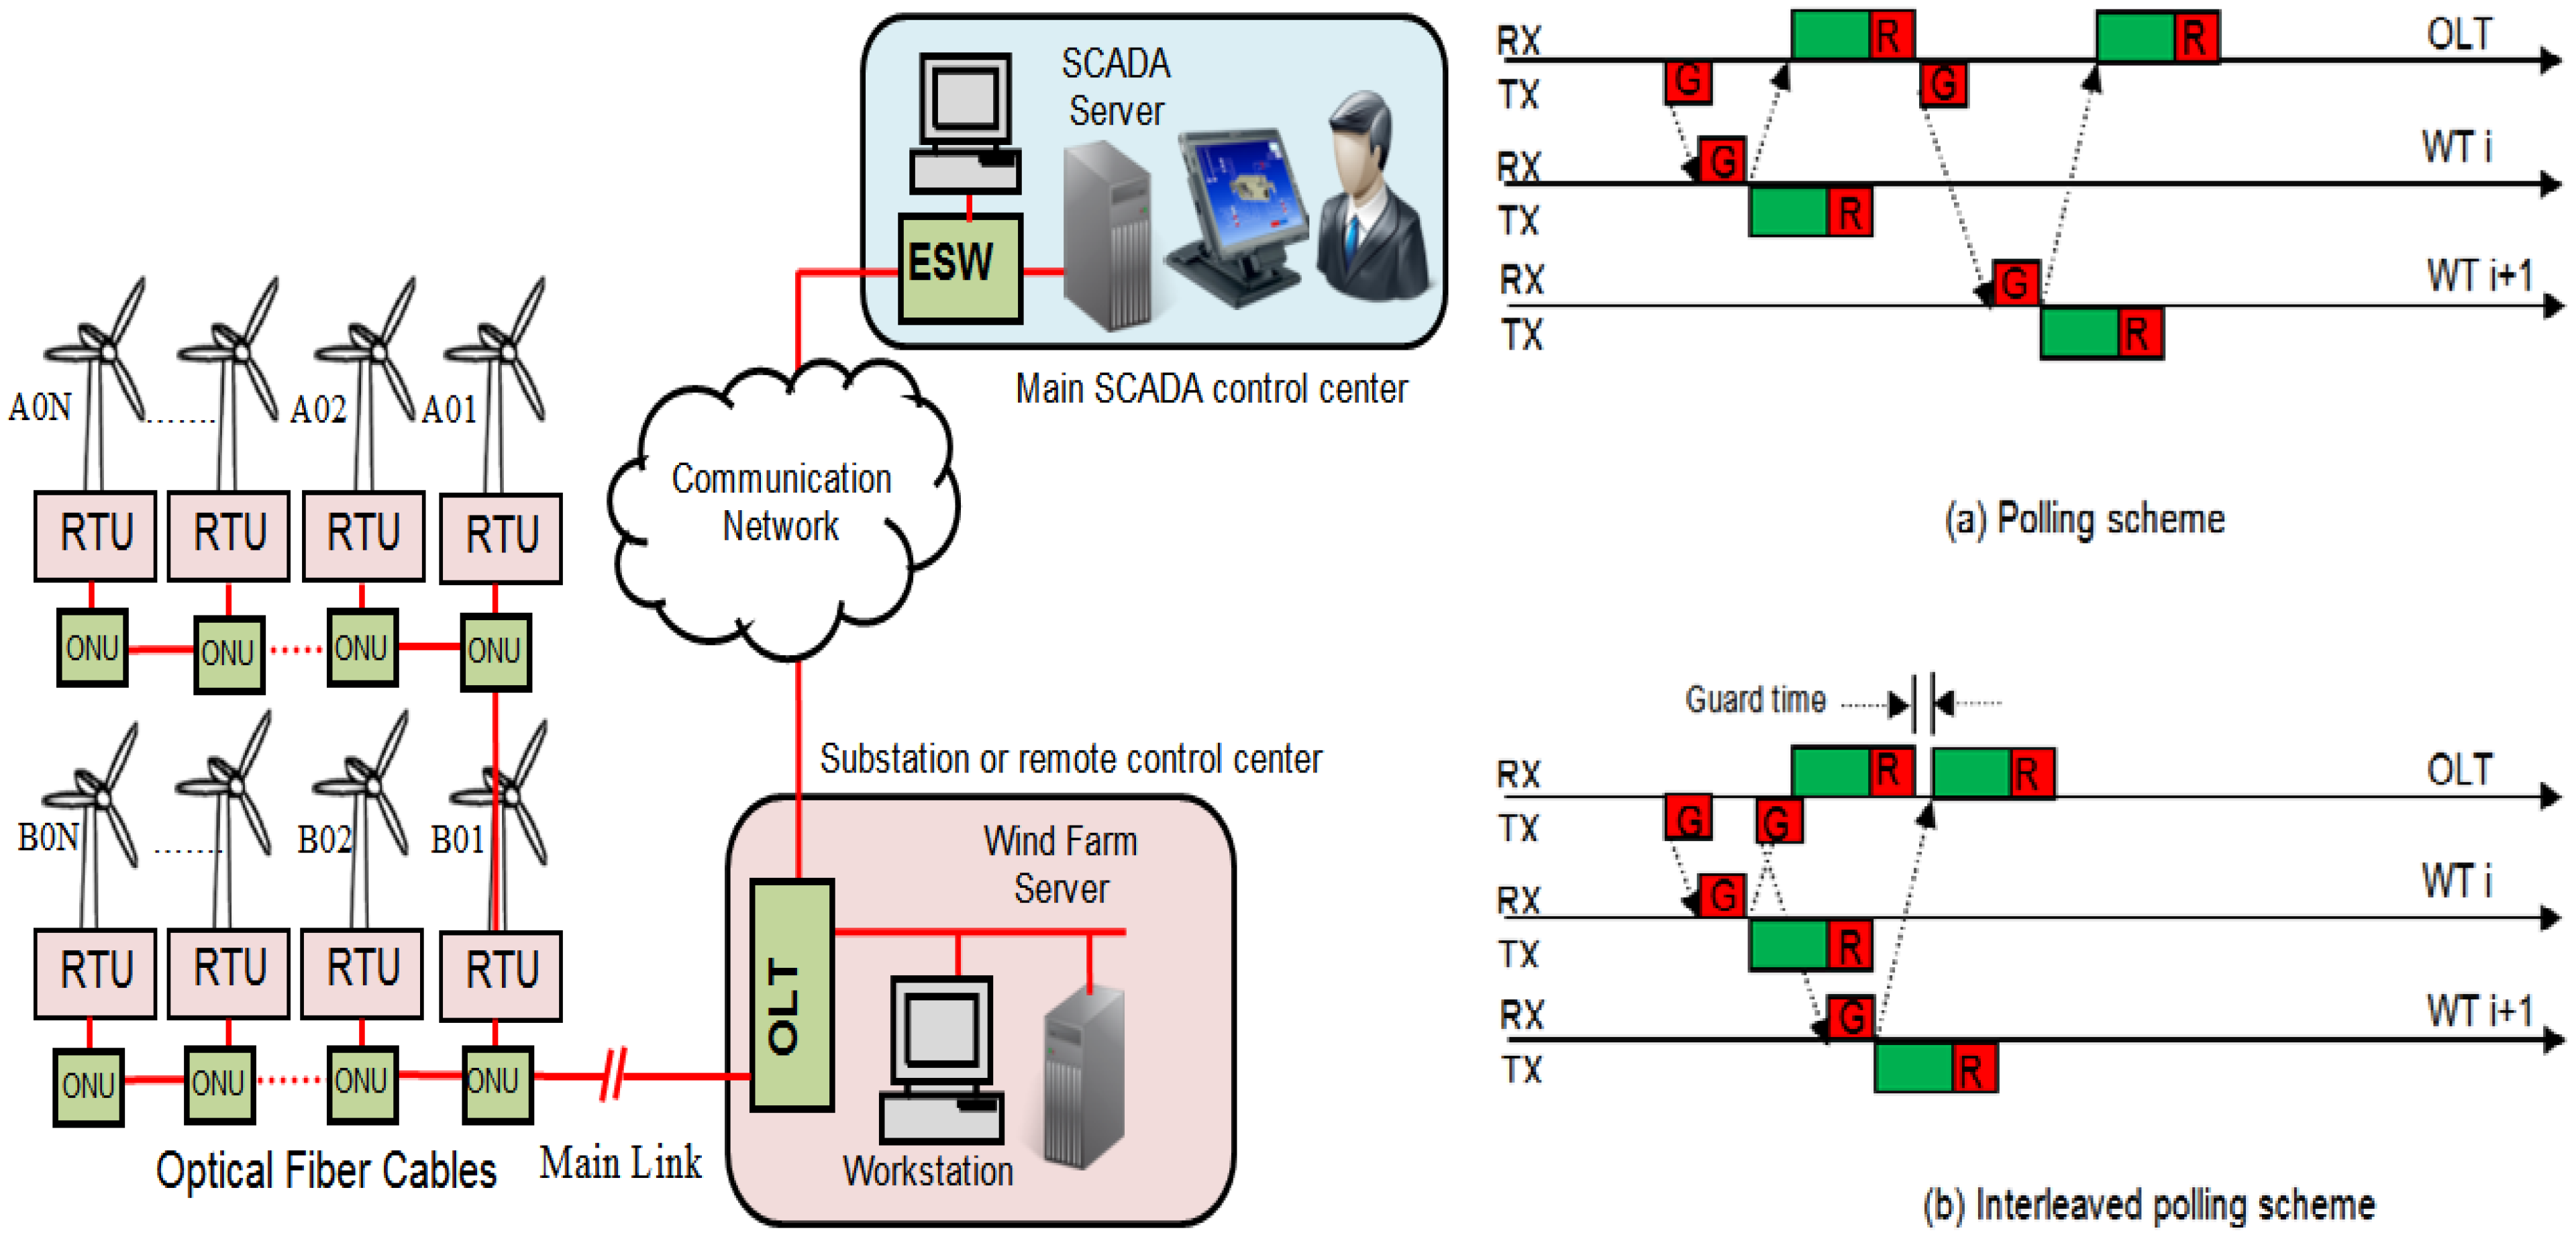
A SCADA system is responsible for collecting and managing all information between the remote terminal unit (RTU) at the wind turbine side and a SCADA server at the control center for the purpose of monitor and control. Figure 4 illustrates the basic SCADA system utilized with WPFs, where the data from all the wind turbines are collected and are sent over the optical fiber cables to the control center. Note that the SCADA server in the WPF is a device which acts as the master in a SCADA system while an RTU acts as a slave [17].
The functions of the OLT unit and the ONU unit located at wind turbine side in an EPON architecture are similar to the master/slave operation between the SCADA server and the RTU in the WPF. The SCADA server polls the RTUs for data at defined time intervals, and it can send control signals as required. Also, in an EPON system the OLT polls ONUs for data every few milliseconds. For example, if we consider the cycle time to be 2 ms, it means that the wind turbine will be polled for data 500 times within 1 s. To illustrate this concept, a simple polling scheme is shown in Figure 4a. In this scheme, the control center (OLT) sends a GATE message to WTi, and then stops waiting for data before the control center sends it to WTi+1. From the EPON system point of view, the disadvantage of poll and stop polling scheme is that a lot of bandwidth on the upstream channel is wasted and packet delay is increased [18]. Figure 4b shows an interleaved polling scheme where it allows the OLT to send a GATE message to the WTi+1 before the data from previous WTi has arrived. In this scheme a significant improvement in network performance in terms of channel utilization and average packet delay could be achieved.
Figure 4.
SCADA system for wind power farm (WPF) and upstream scheduling mechanism: (a) polling scheme; and (b) interleaved polling scheme. ESW: Ethernet switch; and RTU: remote terminal unit.
Figure 4.
SCADA system for wind power farm (WPF) and upstream scheduling mechanism: (a) polling scheme; and (b) interleaved polling scheme. ESW: Ethernet switch; and RTU: remote terminal unit.

3.2.2. Sensor Data Frame Structure
Based on the IEC 61400-25 standard, we represent a standalone wind turbine by nine logical nodes [19]. We defined the AM and SI according to the IEC 61400-25-2 standard. The total number of SNs and measurement devices are shown in Table 3. The protection and control functions of a wind turbine are represented by a merged unit-intelligent electronic device (MU-IED). The main function of the MU-IED is to process and transmit digital voltage and current signals from the current transformer (CT) and voltage transformer (VT) [20]. All three categories of generated data (AM, SI, and PCI) are transmitted to the control center, while PCI data is shared among the other turbine IEDs. If we consider the SI for a standalone wind turbine as an example, there are 29 SI transmitted periodically with an interval of 1 s. The classification aims to simplify the network model and eliminates proprietary protocols used by different turbines manufactures.
In order to identify the sensing data from the different wind turbine parts (rotor, transformer, nacelle, etc.), we designed a sensor frame structure which consists of a logical node ID (LNID), sensor node ID (SNID), sensor type (ST), sensor data, and trailer based on the IEC 61400-25 standard as shown in Figure 5. The LNID represents the location of the SN inside the turbine, the SNID identifies the SN number, and the SNT represents the type of the physically measured quantities. We considered that 102 SNs are installed in different wind turbine parts in order to monitor turbine status and conditions. In the proposed frame structure, the LNID, SNID, SNT, and trailer occupy one byte while the sensor data (data payload) occupies two bytes. The WTC collects all sensors data packets, encapsulate them into one Ethernet frame, and then transmits them to the control center. In the control center side, using the LNID and SNID, the system is able to distinguish and classify the received sensing data from the different SNs (such as vibration, temperature, pressure, displacement, etc.).
Table 3.
Logical nodes of a wind turbine. AM: analogue measurements; SI: status information; and MU-IED: merged unit-intelligent electronic device.
| LN classes | # of sensors | # of AM | # of SI | PCI |
|---|---|---|---|---|
| Rotor | 14 | 9 | 5 | MU-IED Process and transmit V & I signals from CT & VT 3-Ф voltage 3-Ф current |
| Transmission | 18 | 10 | 8 | |
| Generator | 14 | 12 | 2 | |
| Converter | 14 | 12 | 2 | |
| Transformer | 12 | 9 | 3 | |
| Nacelle | 12 | 8 | 4 | |
| Yaw | 7 | 5 | 2 | |
| Tower | 4 | 1 | 3 | |
| Meteorological | 7 | 7 | - | |
| Total | 102 | 73 | 29 | 6 |
Figure 5.
Proposed sensor frame structure.
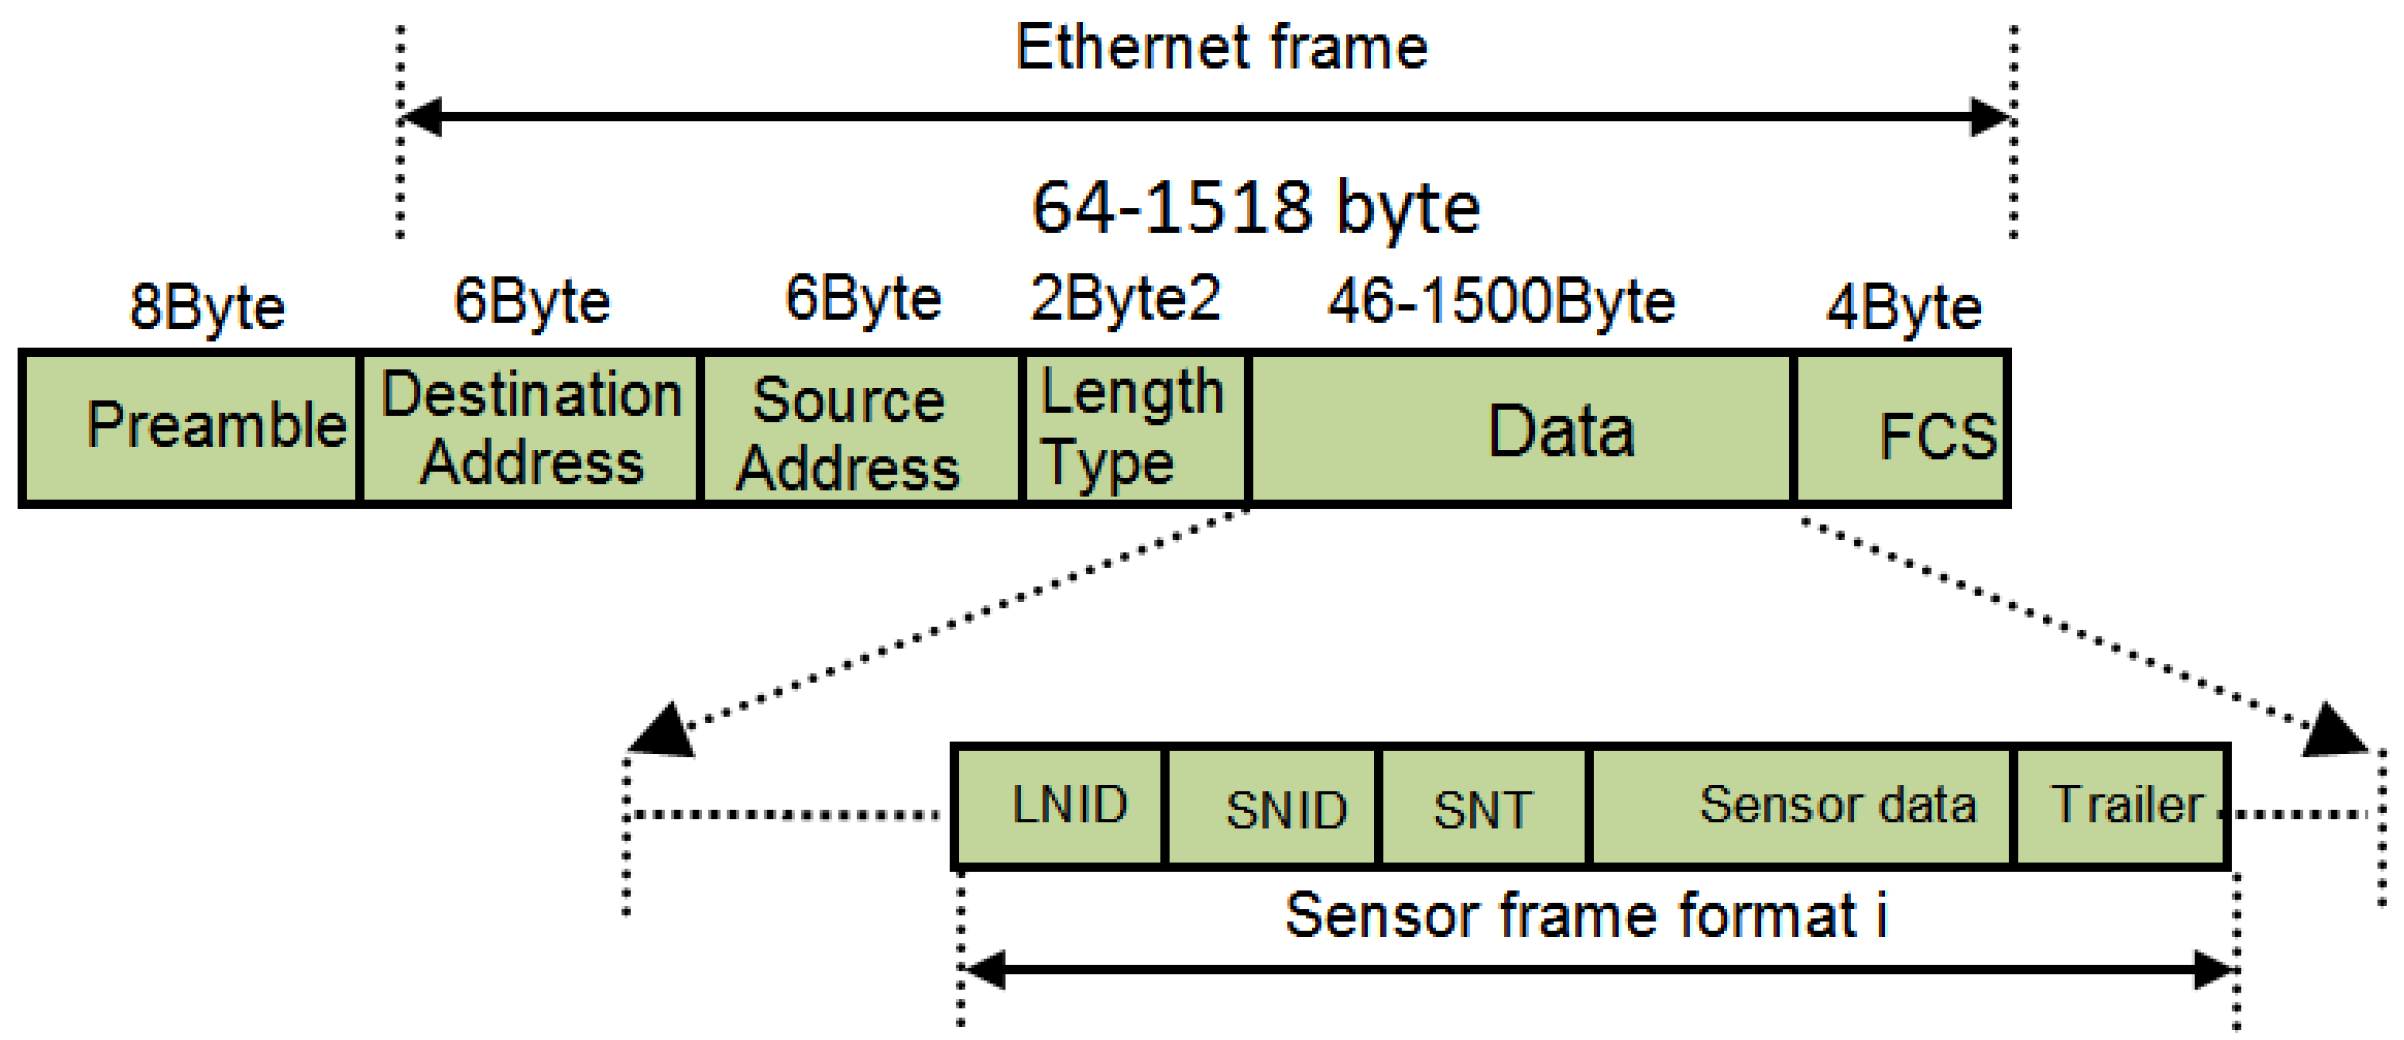
The sensor frame format could be divided into two parts, the sensor identification part and the sensing data part. The sensor identification part is fixed for all SNs (4 bytes) while the data payload part could contain one or more data packets depending on the sampling frequency of each sensor. For example, the sampling frequency of a temperature sensor is considered to be of 1 Hz. There are 16 SNs in different parts, as shown in Table 4. Each sensor transmits 6 bytes (4 bytes for identification and 2 bytes for the measured values) with a total amount of 96 bytes. If we consider the WT-ONU cycle time is 2 ms, then the received amount of data from the temperature SNs during 1 s (500 time slots) will be at the time slot number of 500.
| LN classes | # of temperature sensors | LN classes | # of temperature sensors |
|---|---|---|---|
| Rotor | 1 | Nacelle | 2 |
| Transmission | 4 | Yaw | 1 |
| Generator | 3 | Transformer | 2 |
| Converter | 2 | Meteorological | 1 |
3.2.3. Traffic Model for a Wind Turbine
To study the performance of the wind turbine communication network, detailed knowledge about wind turbine application characteristics and their traffic requirements are needed. Due to the dynamic nature of the environment, there are different operation mode for wind turbine such as normal mode, alert mode, alarm mode and emergency mode [21]. In normal operation mode, the SNs transmit the sensing data periodically to WTC. In order to optimize the wind turbine operation, the WTC exchange control information with pitch control to change the blade angle, and yaw drivers based on wind direction. In emergency operation mode, to protect wind turbines from damage at high wind speed, a control signal is sent from the WTC to the brake to stop the blades to avoid damaging them. Therefore, the amount of data exchange among SNs, WTC and control center depends on the turbine operation mode.
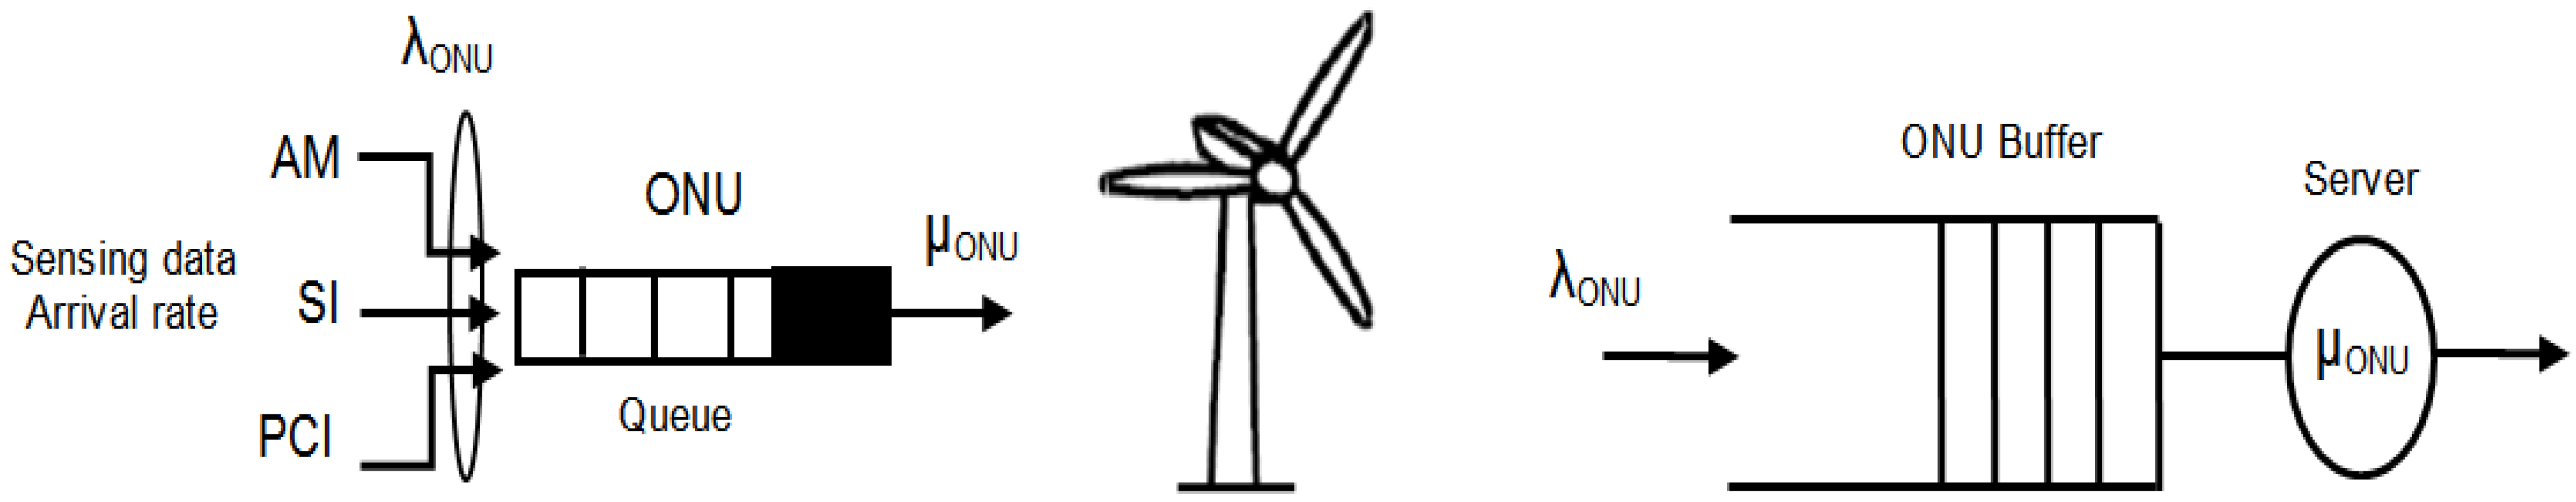
We used queuing theory to model all types of traffic inside the wind turbine [22]. Some assumptions are considered in order to simplify the wind turbine traffic model. We assume that the sensing data arrival rate (λONU) follows a Poisson process, and the service rate (μONU) follows an exponential distribution. The sensing data arrive at the WT-ONU buffer. The WT-ONU buffer size is infinite with FCFS (first-come-first-serve) discipline where all packets have equal priority. Therefore, the WT-ONU can be modeled as an M/M/1 queue system as shown in Figure 6.
Figure 6.
Queuing model of wind turbine data traffic.

The calculation of the sensing data arrival rate (λWT-ONU) at the WT-ONU is given in Equation (1). The WT-ONU receives the sensing data from different SNs and measurement devices where λAM, λSI, and λPCI are the arrival rate of AM, SI, and protection information, respectively. The sensing data arrival rate depends on the number of SNs and on the average packet generation rate of each sensor. Considering SI as an example, there are 29 SNs with packet arrivals of 6 bytes/s which result in 174 bytes/s:
λWT-ONU = λAM + λSI + λPCI
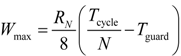
In this work, FBA allocates equal bandwidth to all wind turbines. In FBA, a fixed time slot is allocated for each wind turbine in every cycle. The advantage of using an FBA is that of simplicity as the control center always grants the maximum window size (Wmax, bytes) for each WT-ONU. The granted bandwidth for each WT-ONU and the service rate can be calculated using Equations (2) and (3), where Tcycle is the cycle time, Tg is the guard time, RN is the line rate, and N is the number of WT-ONUs:
![Energies 07 03900 i001]()
μONU = Wmax/Tcycle
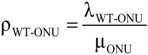
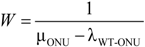
Considering FBA, the WT-ONU has a constant service rate where OLT serves Wmax (bytes) each Tmax (seconds) as shown in Equation (3). Using queuing theory, we can calculate the bandwidth utilization (ρWT-ONU) of WT-ONU using Equation (4) where λWT-ONU and μONU are the WT-ONU arrival rate from all sub-networks and the service rate of the WT-ONU, respectively. Using Little’s formula [22], the average packet delay (W) in WT-ONU is as shown in Equation (5):
![Energies 07 03900 i002]()
![Energies 07 03900 i003]()
3.3. Shared Data among Wind Turbines
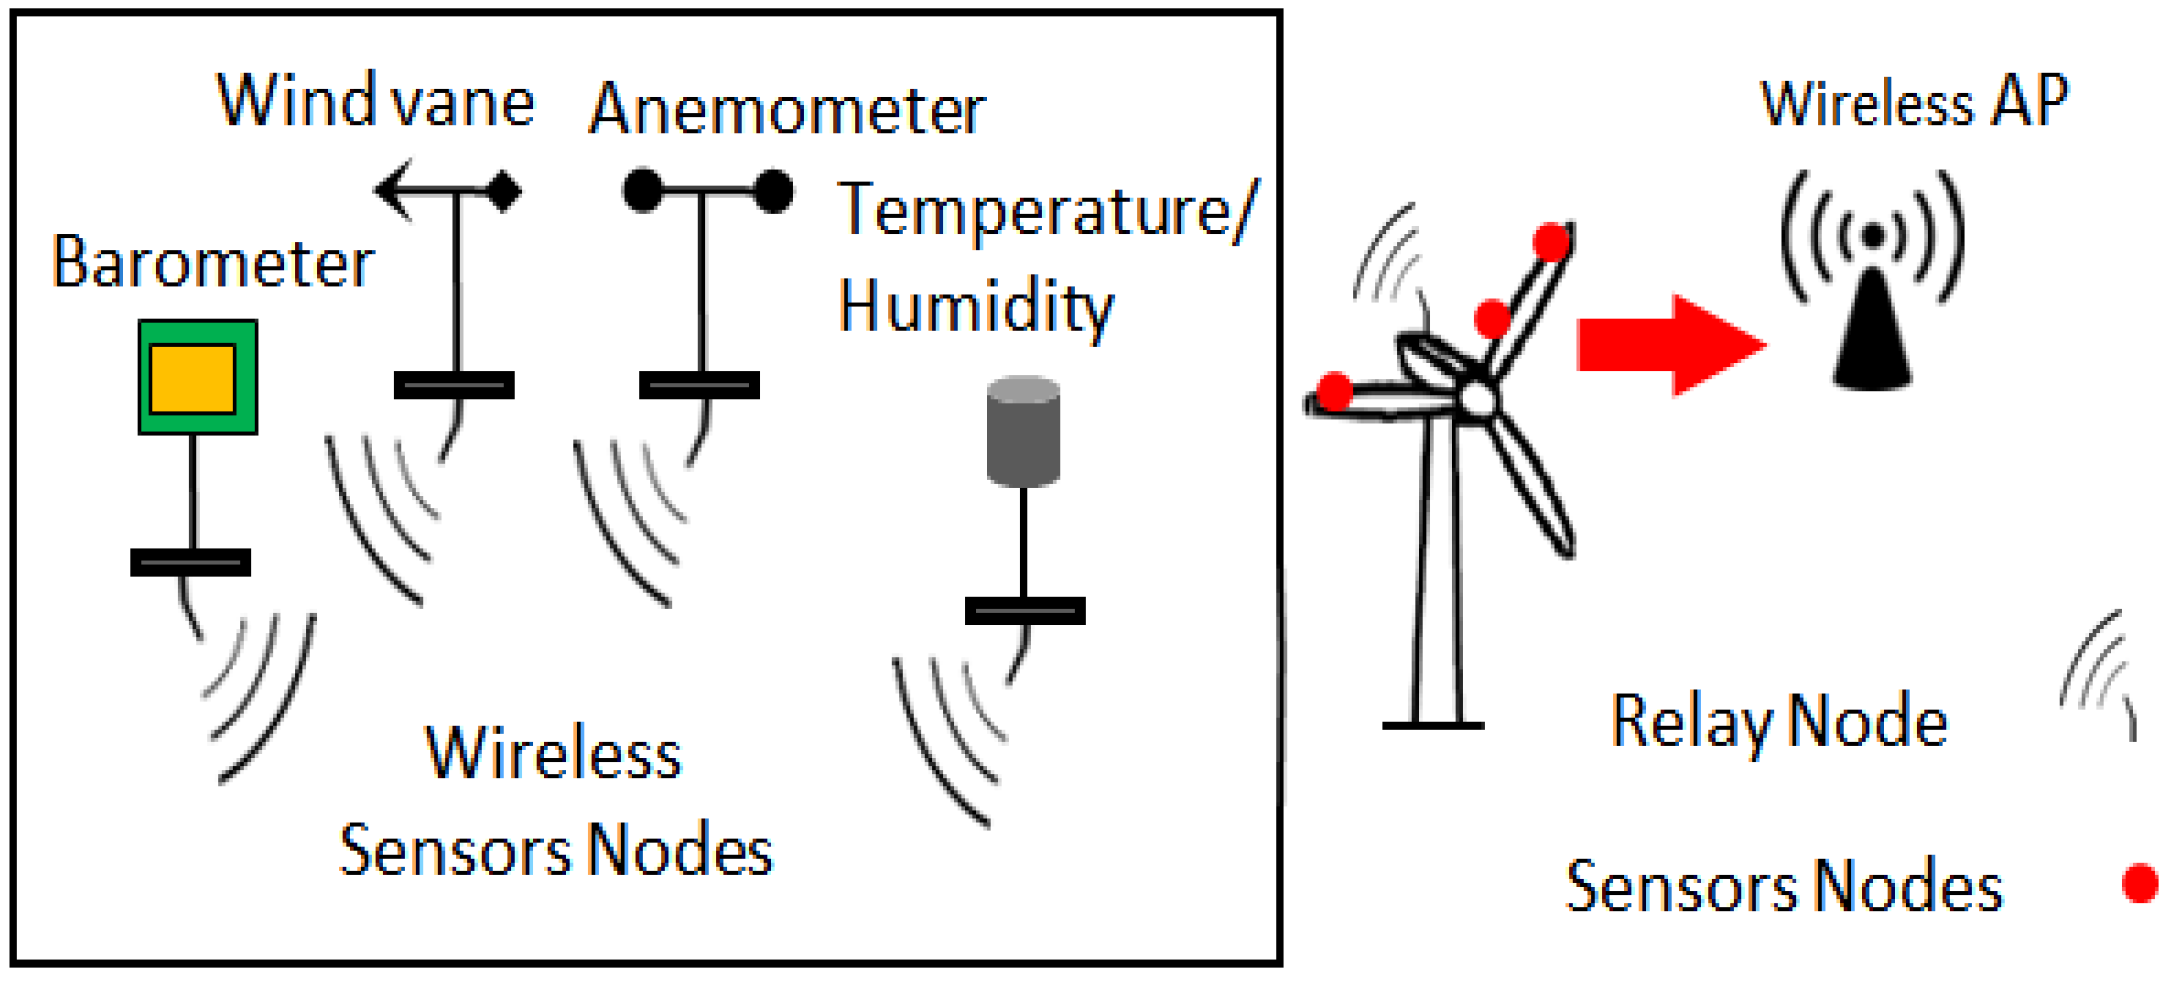
In order to share data among wind turbines or with the control center, the types of shared data should be determined. In real WPFs, the meteorological mast is used as a source for weather forecast data to manage WPF production. In this case, wind direction and wind speed are used for prediction of WPF availability and to regulate the wind turbine speed. The wind farm meteorological mast had been previously described in more detail [23]. It contains a wind vane, anemometer, barometer, temperature sensor, and humidity sensor at different heights. Table 5 shows the measuring requirements for meteorological data at each wind turbine and the calculated data rate for each SN.
| Measurement | Unit | Sampling frequency | # Channel | Data rate (bytes/s) |
|---|---|---|---|---|
| Temperature | C | 1 Hz | 1 | 2 |
| Pressure | Pa | 100 Hz | 1 | 200 |
| Humidity | % | 1 Hz | 1 | 2 |
| Wind direction | deg | 3 Hz | 1 | 6 |
| Wind speed | m/s | 3 Hz | 1 | 6 |
| Coordinator node traffic | 226 | |||
| RN traffic | 228 | |||
In our network model, we considered the meteorological data in each wind turbine to be shared and forwarded to the control center in order to achieve an accurate prediction of energy production for the WPF. There are two types of nodes at the wind turbine side as shown in Figure 7:
- •
- The SN with short-range communication (e.g., WiFi and ZigBee) is used for collecting the sensing data (temperature, pressure, humidity, wind speed, and wind direction) from the wind turbine side and sends the data to the relay node (RN);
- •
- The RN with long range communication is used to send the collected data to a nearby wind turbine or to the base station (BS).
Figure 7.
Turbine area network (TAN).
3.3.1. Shared Data Packets Formats
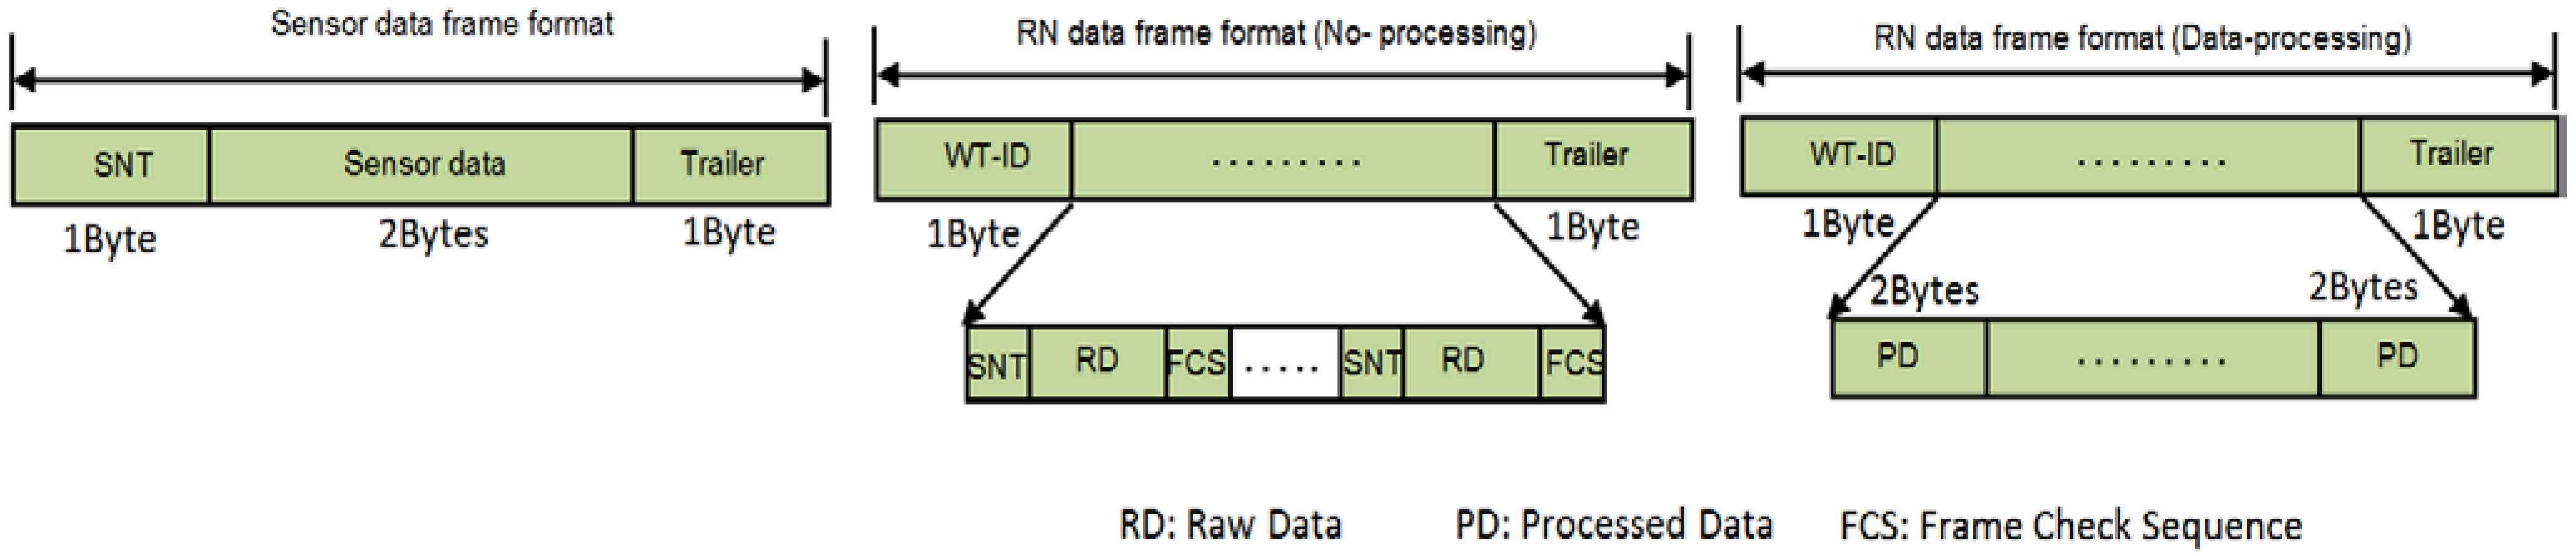
There are two types of data packet formats considered for the shared wind turbine SN data packet format and RN data packet format as shown in Figure 8:
- •
- SN data packet format: It consists of three fields: sensor node type (SNT), sensor data, and trailer. Both the SNT and the trailer are of 1 byte while the sensor data payload is of 2 bytes. Each SN receives and gathers data samples (raw data), combine them into a single packet, and then forwards them to the RN;
- •
- RN data packet format: It consists of three fields: wind turbine ID (WT-ID), sensor data, and trailer. Both the WT-ID and the trailer are of 1 byte, similar to the SN packet format while the sensor data payload has two different configurations depending on data aggregation options. The first option is performed without data processing, where the RN only aggregates the raw sensing data into a single packet without any processing (no processing, just aggregate). The second option is performed with data processing, where the RN extracts the important information from the raw sensor data and aggregates the processed data (PD) into one fixed data packet (process and aggregate). In this case, the PD field is assumed to be of 2 bytes.
Figure 8.
Data packet format of SN and relay node (RN).

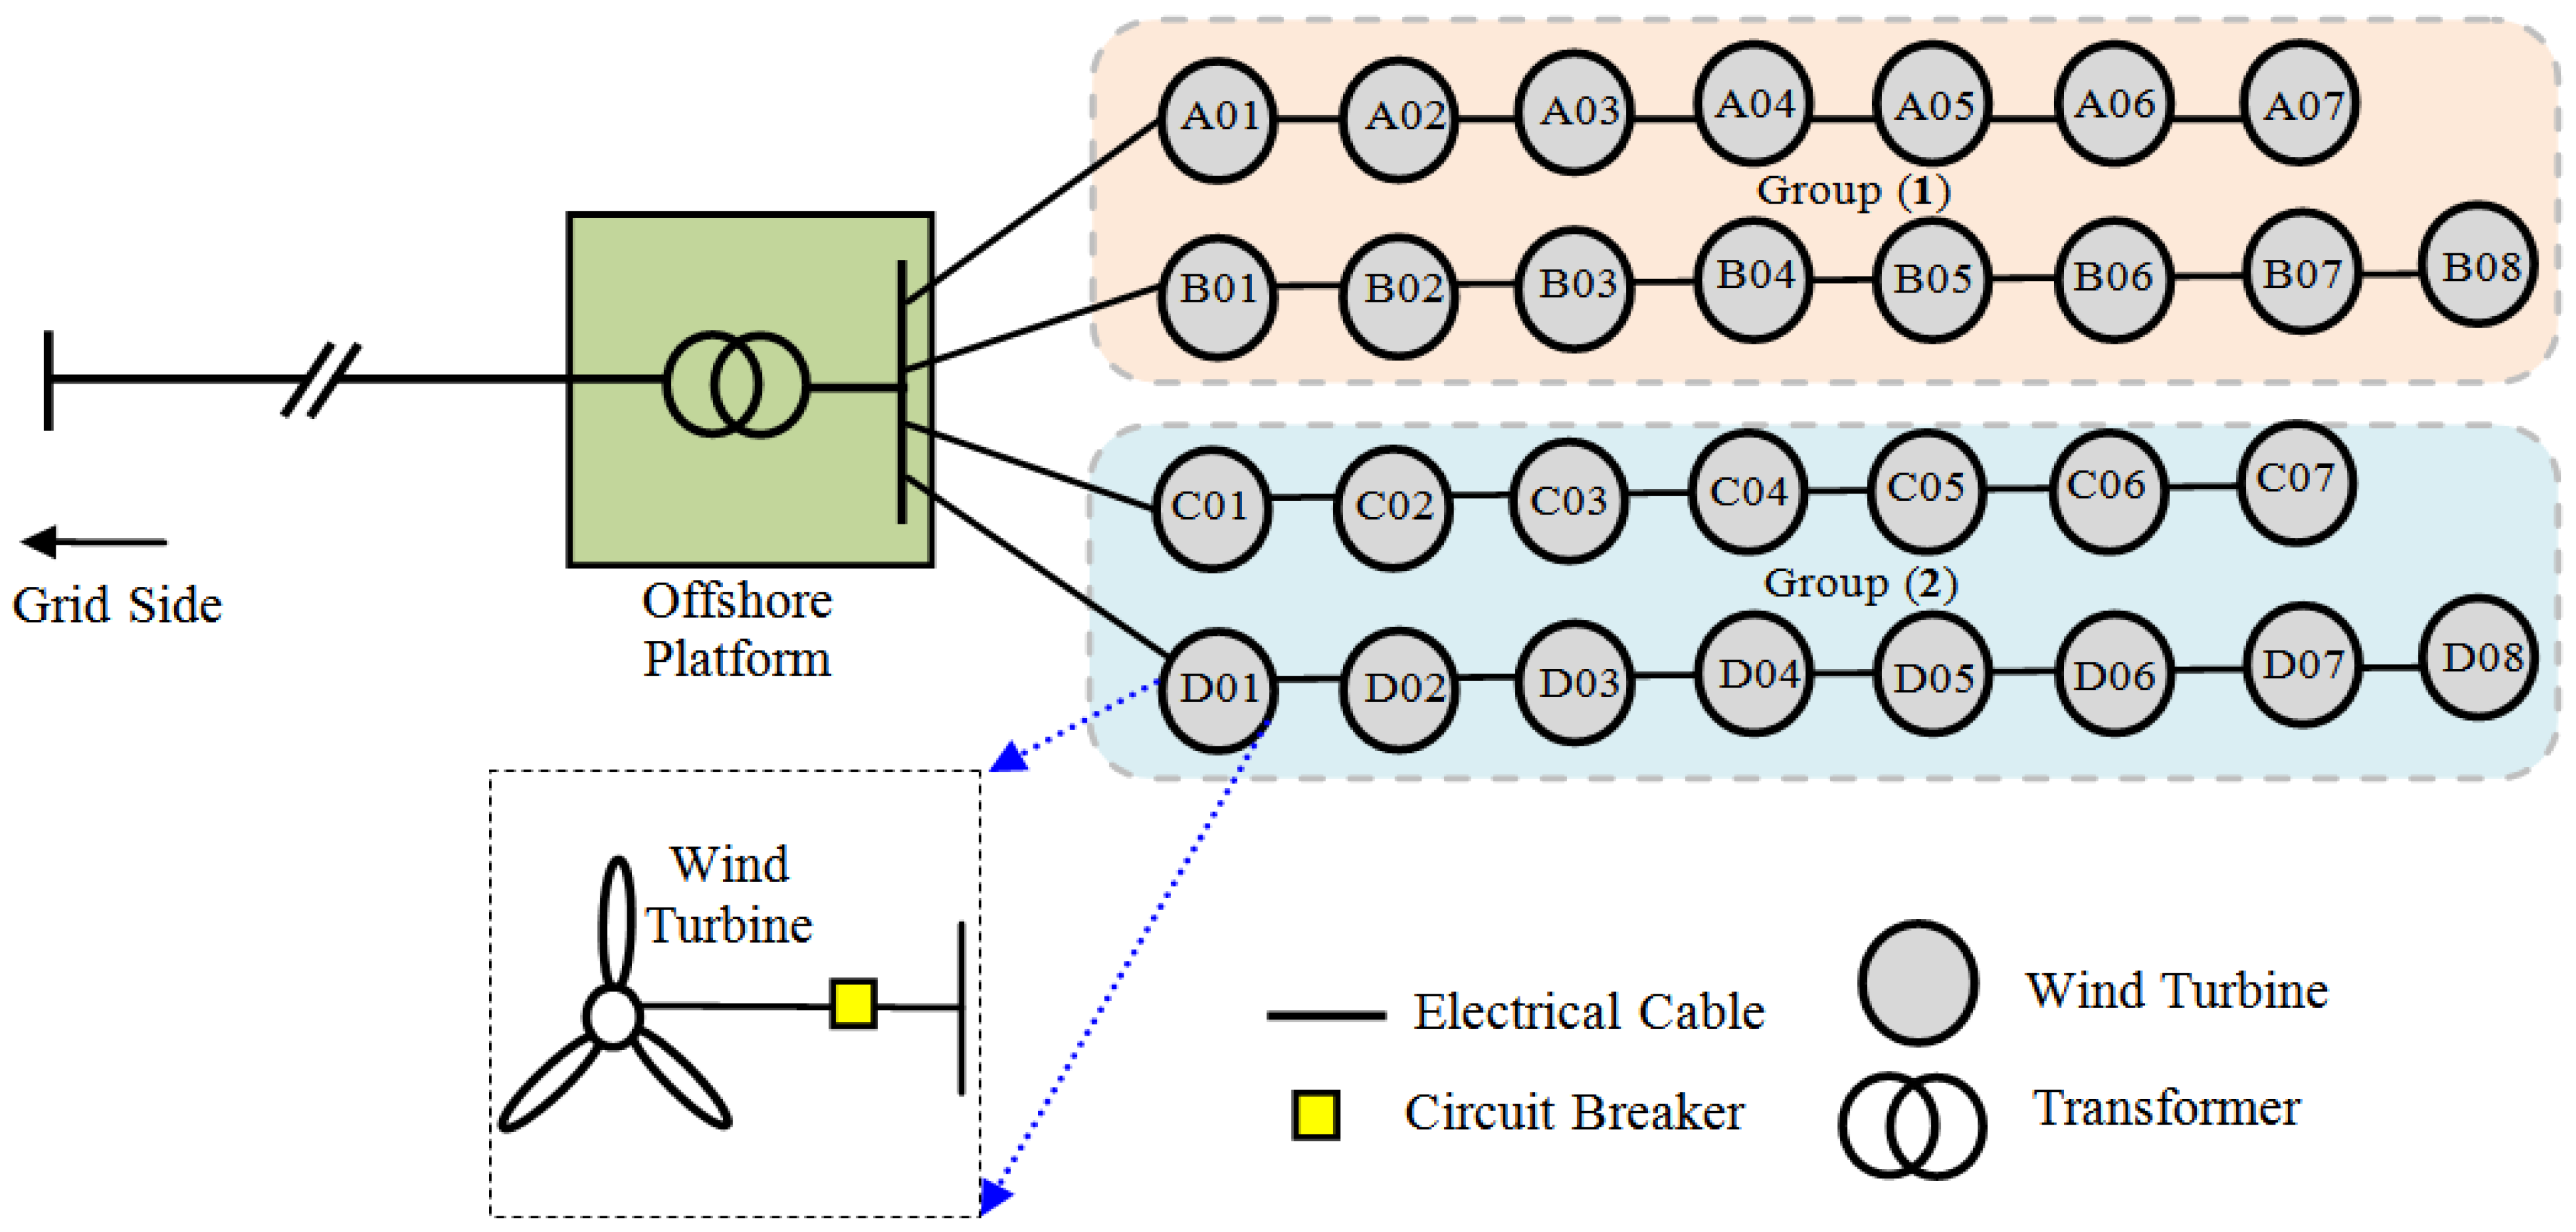
We considered the Ormonde offshore WPF as a case study. The electric system consists of three main sub-systems: the wind turbines, an internal grid, and the transmission system [24]. The wind farm covers an area of 7.8 km2 in the Irish Sea. It has a total capacity of 150 MW (30 WTs each of 5 MW). The numbers of rows/WTs are 2 × 8 WTs and 2 × 7 WTs as shown in Figure 9. The distance between wind turbines is 560 m, while the spacing between turbine rows is 760 m. The turbine hub height is 100 m, and the rotor diameter is 126 m. From the point of view of communications, Hung et al. [25] considered ZigBee Pro (31.25 kbytes/s) for monitoring the overhead transmission line due to its low power consumption and ability to transmit data up to 1.5 km in an open area. Therefore, in our network model we considered ZigBee Pro for communication between neighboring wind turbines, where the distance between the wind turbines is 560 m. The advantage of this configuration is that there is no need for protocol conversion among the SNs, coordinator nodes and RNs, because all nodes use ZigBee technology.
Figure 9.
Layout of Ormonde offshore WPF (Electric Topology).

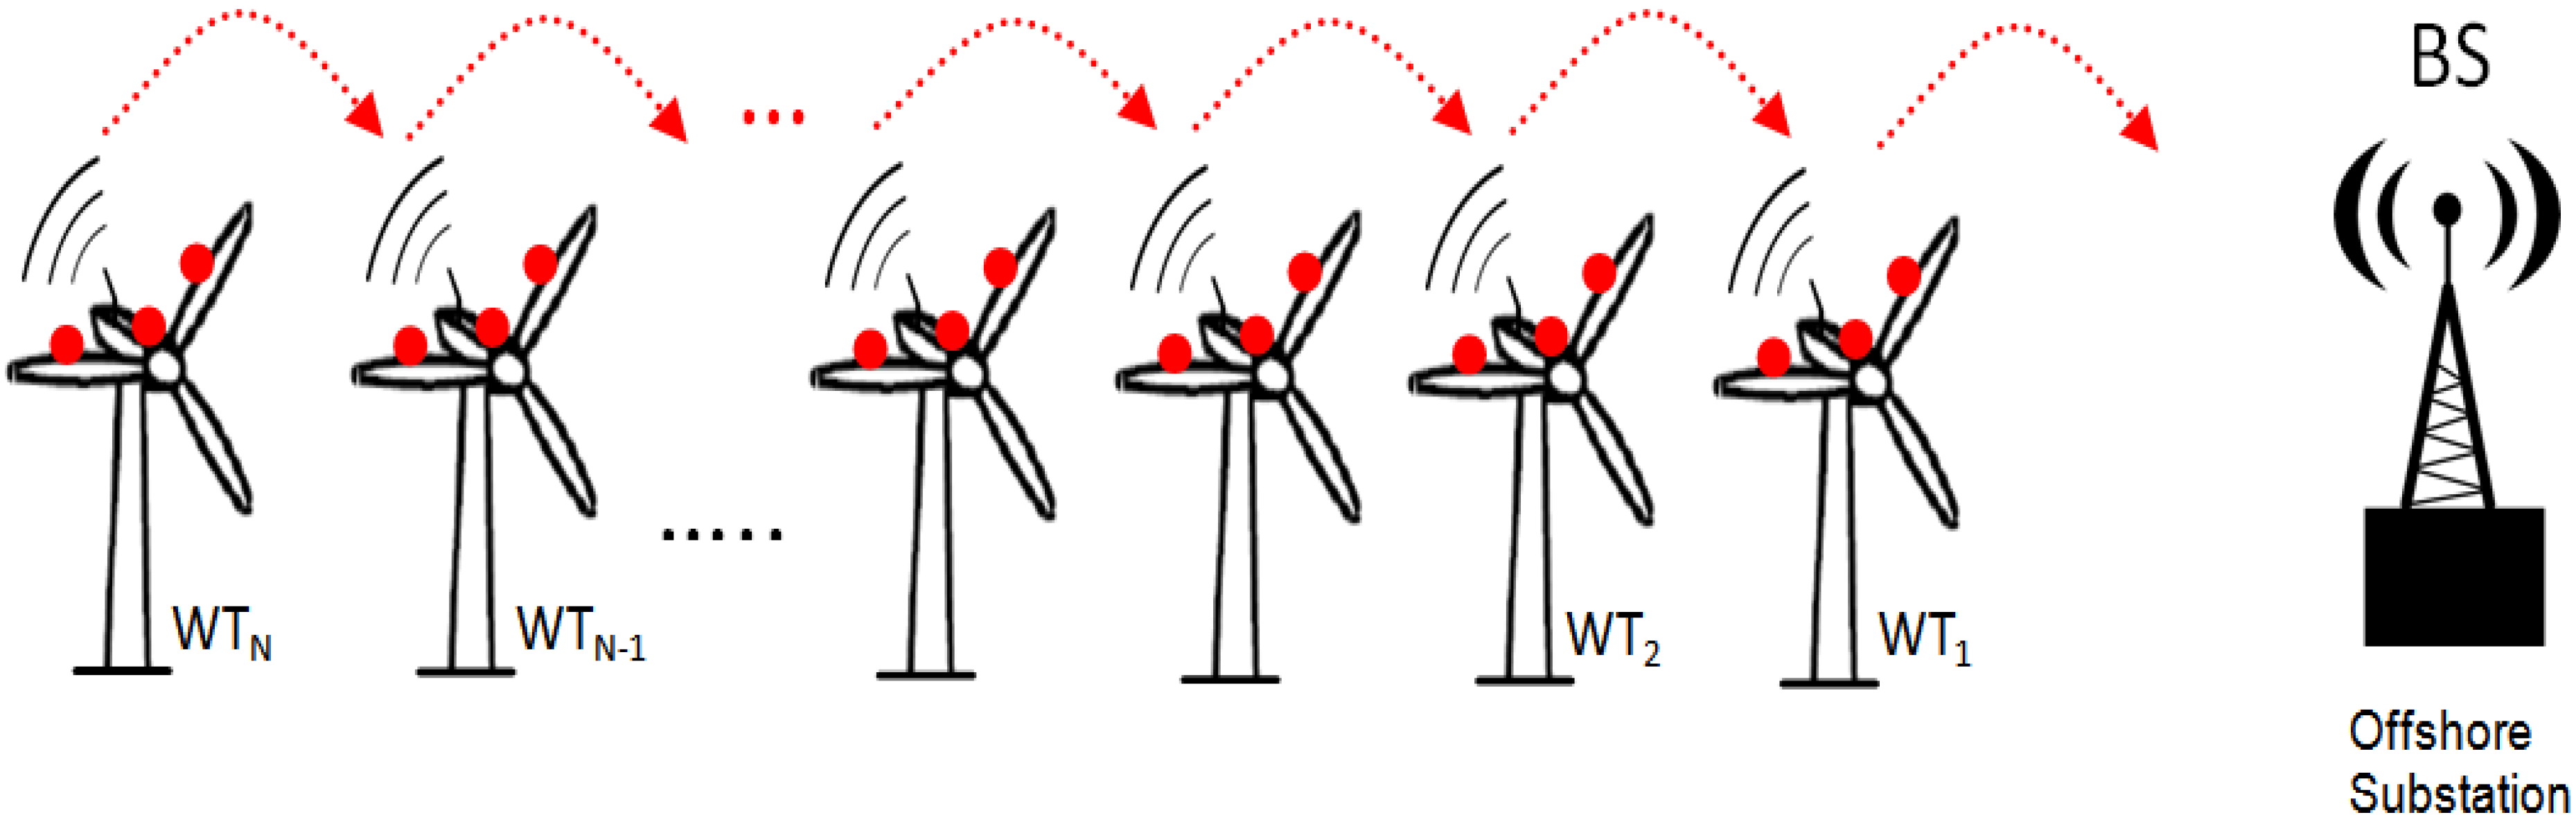
3.3.2. Linear Topology Configuration
In this section, we evaluate the performance of the FAN architecture where shared data aggregation with hop-by-hop is used. There are N wind turbines connected in a linear topology as shown in Figure 10. Communication occurs only between neighboring turbines using the RNs in a hop-by-hop manner. The BS is located at the offshore substation. The sensing data at each turbine is gathered and combined into a single data packet at the coordinator node. The coordinator node sends the data packet to the RN which forwards it in a hop-by-hop manner to the neighboring wind turbines in order to reach the BS. This data aggregation method on the RN decreases the number of data packets flowing and represents minimum energy consumption for the SNs.
Figure 10.
Linear topology configuration. BS: base station.

The point-to-point delay (latency) between neighboring turbines is represented by processing delay, queuing delay, transmission delay, and propagation delay. Since the data is forward in a hop-by-hop manner and the distance between turbines is less than 1 km, the propagation delay is about 1000/3 × 108 ≈ 3.33 μs. To simplify the latency calculation, processing delay, queuing delay, and propagation delay are neglected in our calculation and represented by a constant in Equation (6). This is due to the deterministic traffic profile and the smaller data size generated from SNs. Therefore, we assume that the queuing delay is small and can be neglected. In this case, the latency calculation (TWTi) between neighboring turbines is proportional to the data packet size and the channel transmission speed as shown in Equation (6):
![Energies 07 03900 i004]()

The size of the data packet (SWTi) forwarded from WTi to WTi−1 is calculated using Equation (7), where N is the total number of wind turbines. For example, with eight WTs connected in a linear topology the size of the data packet (SWT) at WT1, in case of raw data transmission, is about 1824 bytes (8 WTs × 228) and, in the case of PD transmission, is about 96 bytes (8 WTs × 12):
SWTi = [N – (i − 1)] × SWT
The total end-to-end (ETE) delay (TETE) for N wind turbines connected in a linear topology is calculated using Equation (8):
![Energies 07 03900 i005]()

4. Performance Evaluation
4.1. EPON-Based Architecture
We considered the WPF architecture with 16 turbines (Ormonde offshore WPF) connected in a radial topology. The EPON-based communications network is configured based on the electrical topology (the optical fiber cables are installed in the same duct of the electric collector feeder).
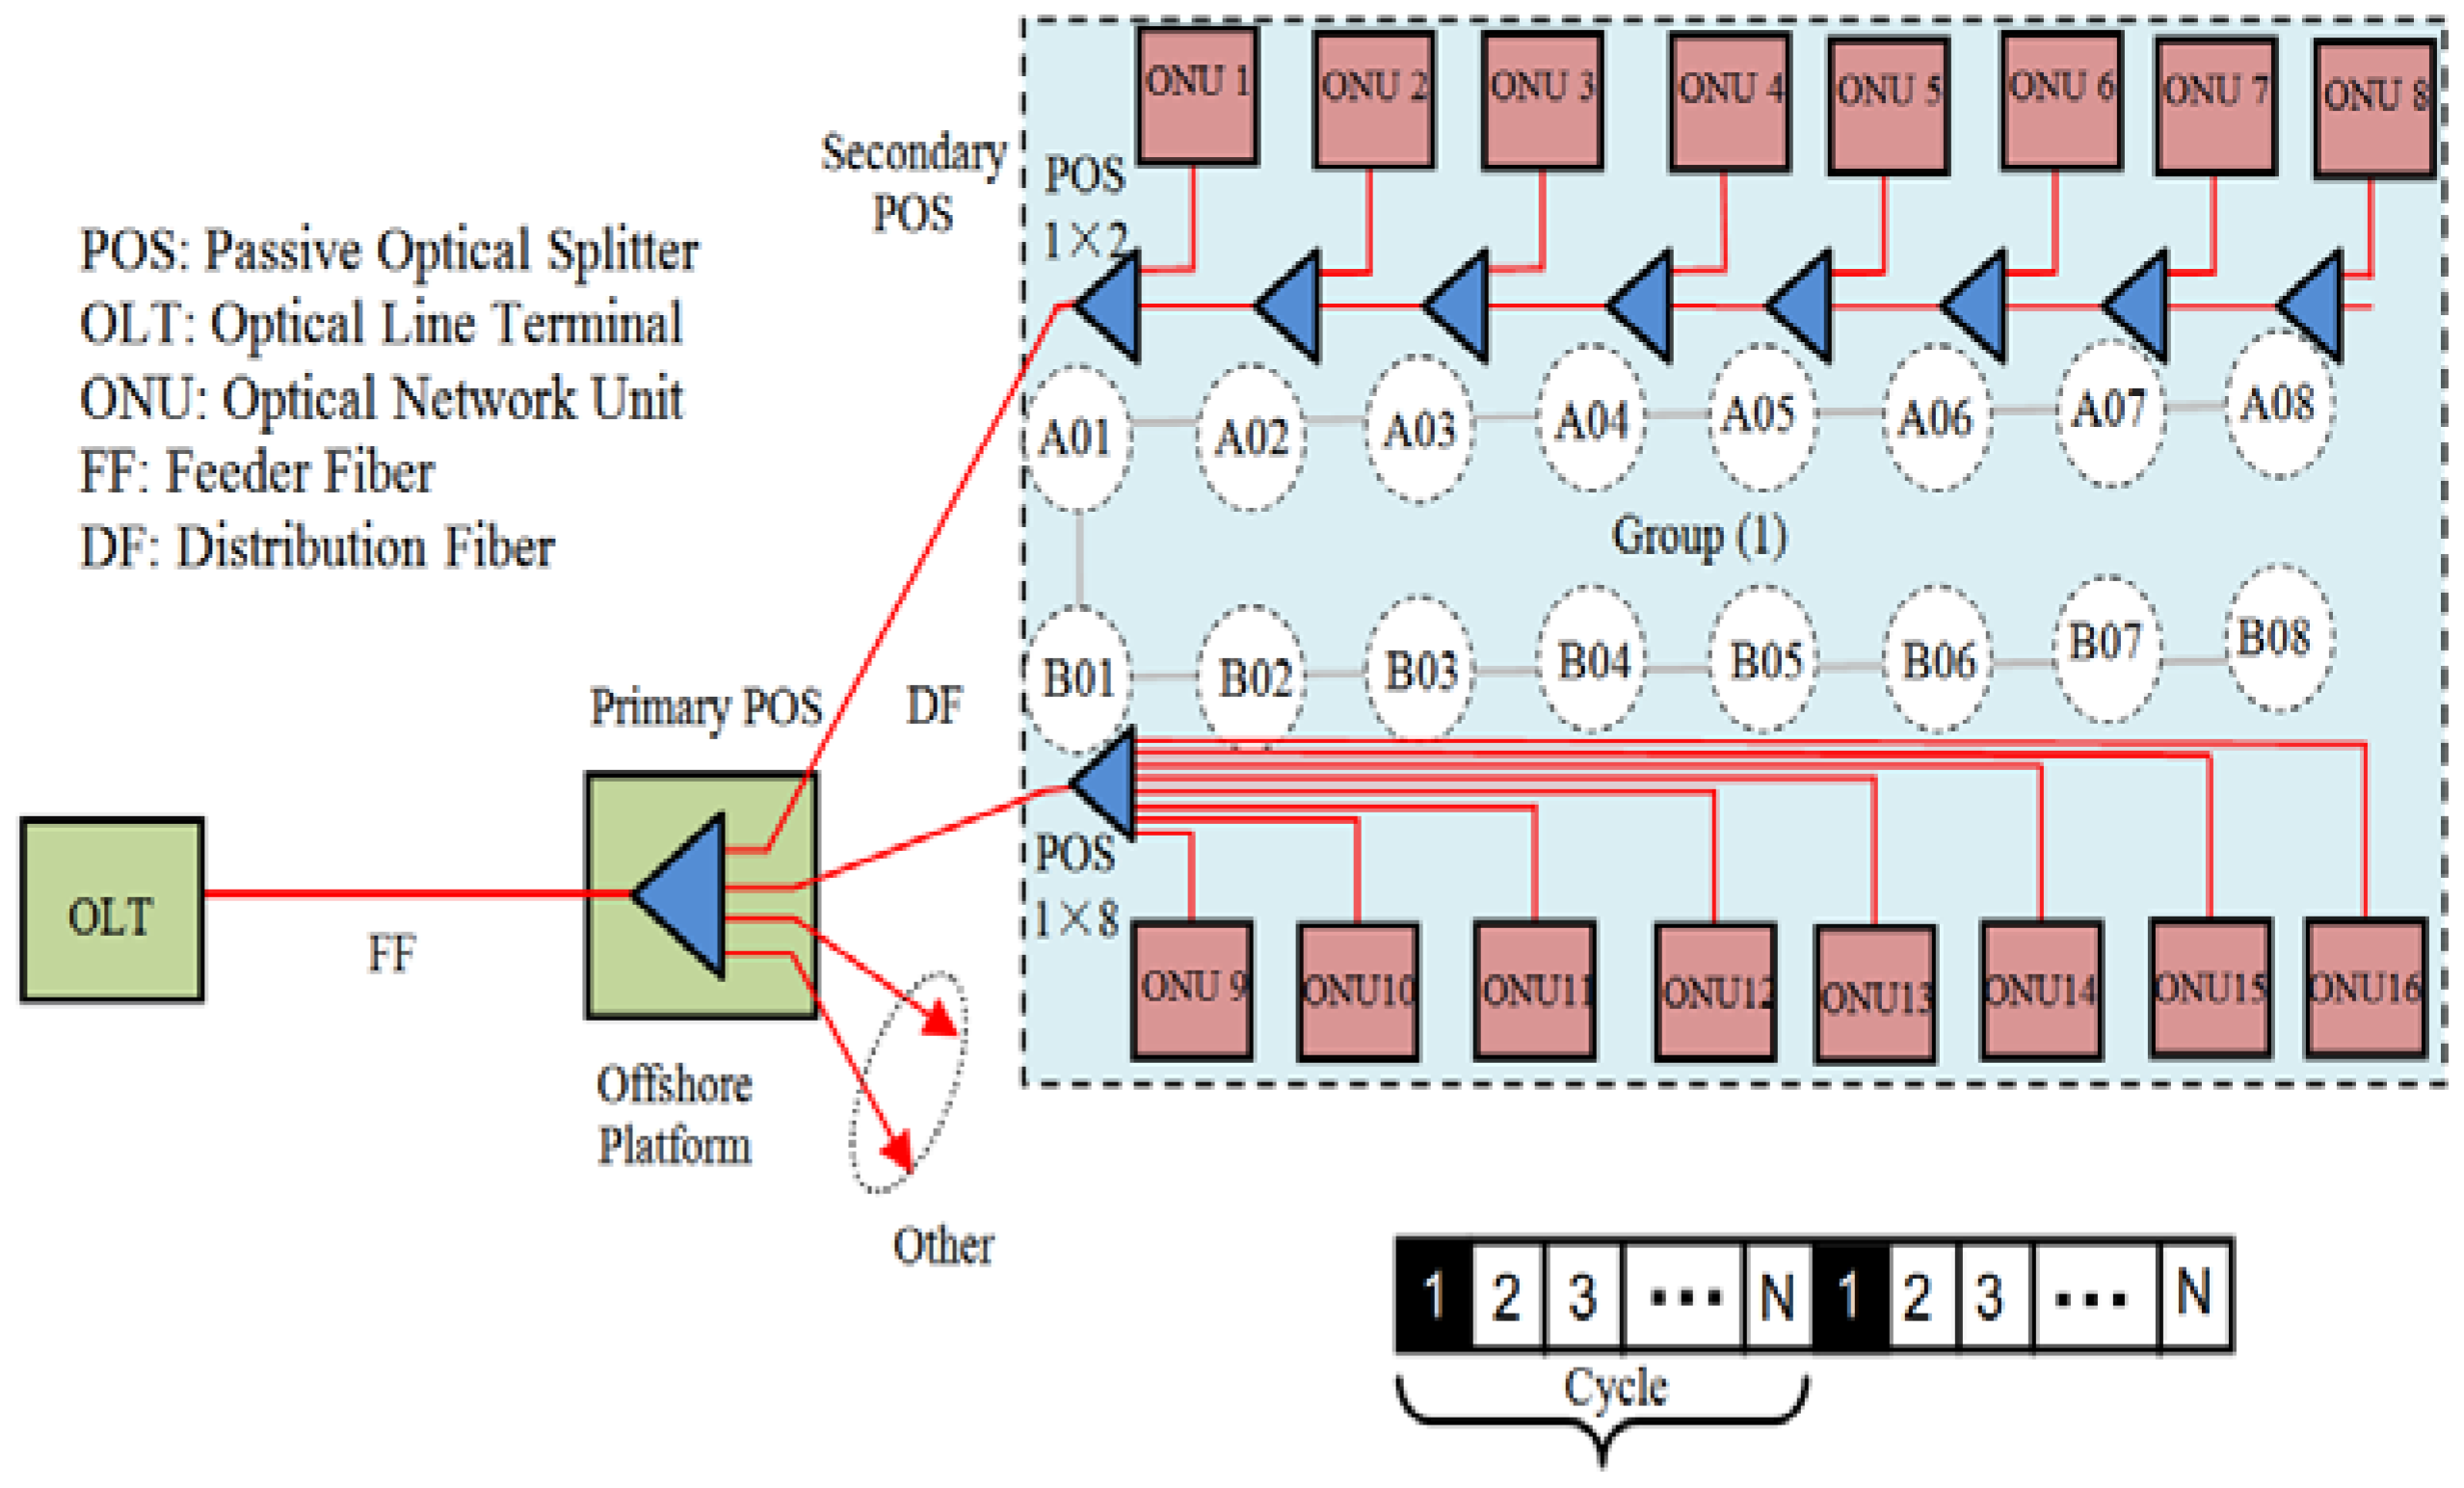
The communication network consists of an OLT in the control center and N ONUs at the wind turbines side. There are no active electronic devices used between the OLT and the WT-ONUs to reduce the complexity of maintenance and deployment. Two different communication network architectures are considered (linear topology and tree topology) as shown in Figure 11. Linear topology has the advantage of reducing the amount of deployed fiber in the network, while the tree topology can improve the network reliability where the network failure of one wind turbine will not affect the performance of other wind turbines. Table 6 shows the details of network elements for the proposed EPON-based network architectures. The remaining ports of the primary passive optical splitter (POS) can be connected to other devices located at the offshore platform.
On the wind turbine side, the sensing data (AM, SI, and PCI) are received at the WT-ONU from the different turbine parts (rotor, generator, etc.) using different SNs and devices. The received amount of sensing data is buffered in the WT-ONU until it is transmitted to the OLT during the transmission cycle. The communication link data rate between the wind turbines and the control center is RN. We considered a FBA, where the cycle time is fixed (2 ms) and defined as the time between two successive time slots assigned to the same WT-ONU.
Figure 11.
Schematic view of proposed Ethernet passive optical network (EPON) communication network for WPF.
Figure 11.
Schematic view of proposed Ethernet passive optical network (EPON) communication network for WPF.

| EPON topology | OLT | # Primary POS | # Secondary POS | ONU |
|---|---|---|---|---|
| Linear | 1 | 1 (1 × 4) | 16 (1 × 2) | 16 |
| Tree | 1 | 1 (1 × 4) | 2 (1 × 8) | 16 |
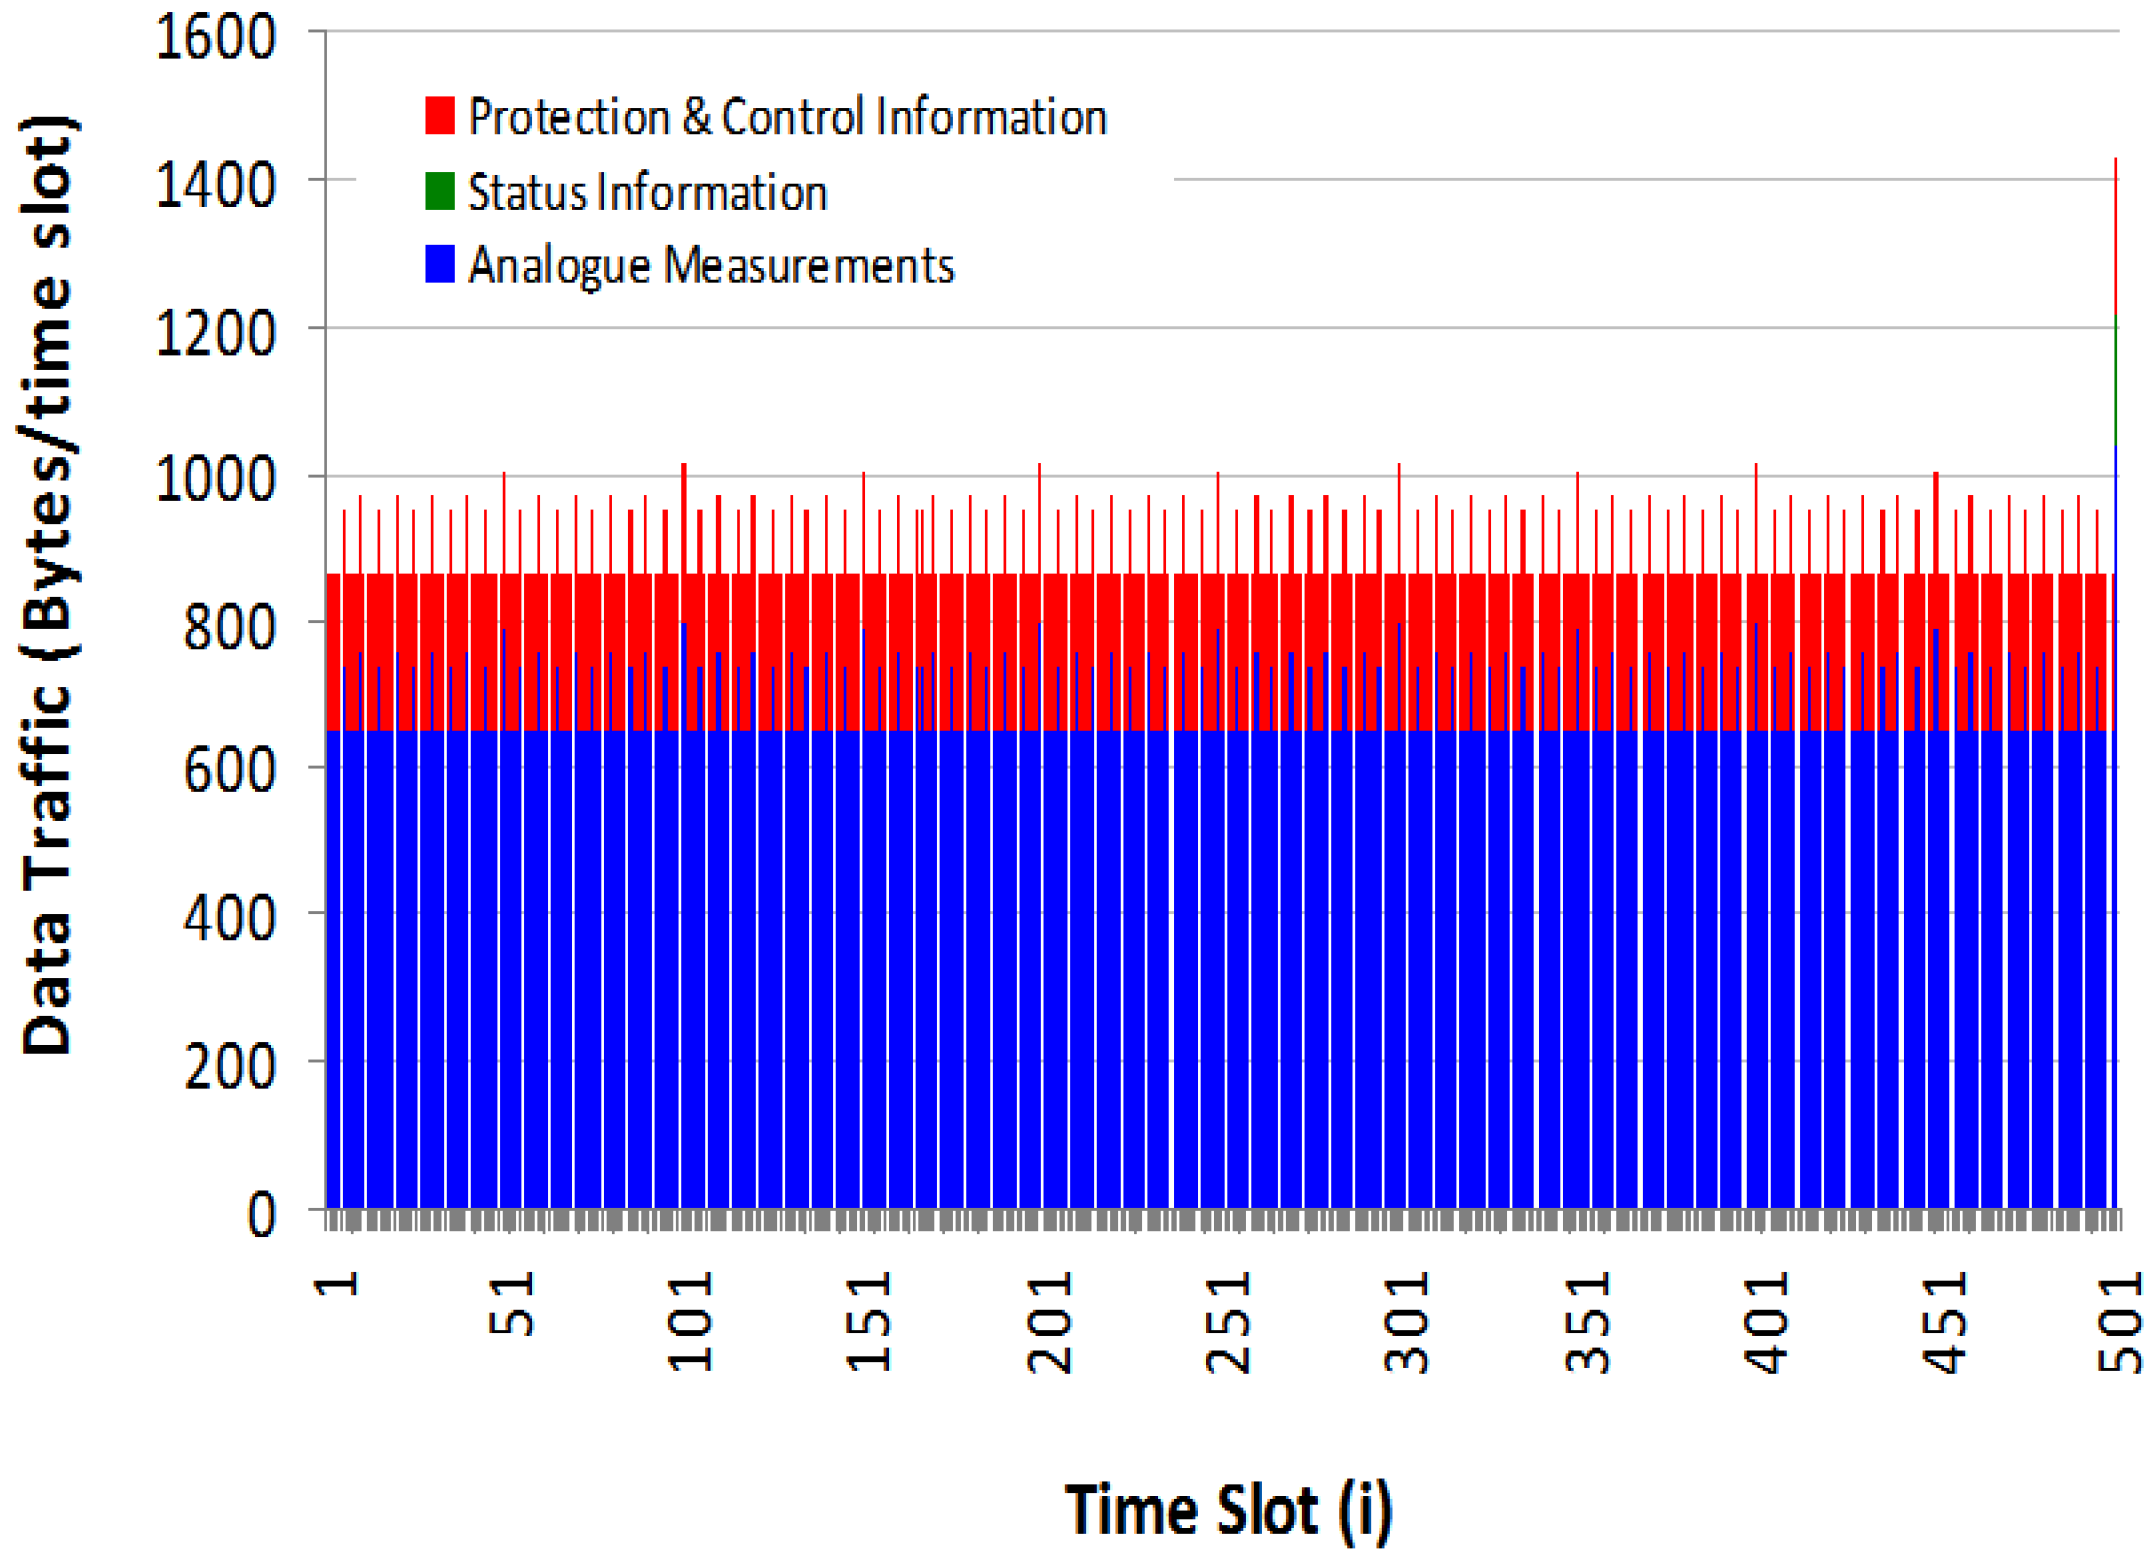
In this section, the performance evaluated in the wind turbine queue model is given. Figure 12 shows the generated data traffic during 1 s (2 ms/slot) of AM (blue), SI (green), and PCI (red) for a standalone wind turbine.
Figure 12.
Generated data traffic during 1 s (2 ms/slot).

Table 7 shows a sample of the generated data traffic from different SNs with a cycle time of 2 ms, and Table 8 shows a sample of generated data traffic at different time slots with a time duration of 1 s. Note that the received amount of sensing data is different for different time slots according to the received amount of traffic from the different SNs. All sensing data packets are collected at the WTC, are encapsulated into one Ethernet frame, and are then transmitted to the control center.
| Measurements | Sampling frequency (Hz) | Allocated slot (i) | Data size (bytes)/time slot | # channel | # sensor | Total data size (bytes)/time slot |
|---|---|---|---|---|---|---|
| Temperature | 1 Hz | 500 | 6 | 1 | 16 | 96 |
| Speed | 3 Hz | 167, 334, 500 | 6 | 1 | 3 | 18 |
| Pressure | 100 Hz | 5, 10, 15, 20, …, 500 | 6 | 1 | 7 | 42 |
| Pitch angle | 3 Hz | 167, 334, 500 | 6 | 1 | 6 | 36 |
| Vibration | 200 Hz | 5, 10, 15, 20, …, 500 | 8 | 3 | 2 | 48 |
| Voltage | 2000 Hz | 1, 2, 3, 4, 5, …, 500 | 12 | 3 | 12 | 432 |
| Current | 2000 Hz | 1, 2, 3, 4, 5, …, 500 | 12 | 3 | 6 | 216 |
| Power | 5 Hz | 100, 200, …, 500 | 6 | 1 | 2 | 12 |
| Power factor | 1 Hz | 500 | 6 | 1 | 2 | 12 |
| Humidity | 1 Hz | 500 | 6 | 1 | 3 | 18 |
| Wind direction | 3 Hz | 167, 334, 500 | 6 | 1 | 3 | 18 |
| Wind speed | 3 Hz | 167, 334, 500 | 6 | 1 | 3 | 18 |
| Displacement | 10 Hz | 50, 100, 150, …, 500 | 6 | 2 | 2 | 24 |
| Oil level | 1 Hz | 500 | 6 | 1 | 4 | 24 |
| Frequency | 10 Hz | 50, 100, 150, …, 500 | 6 | 1 | 1 | 6 |
| Torque | 50 Hz | 10, 20, 30, …, 500 | 6 | 3 | 1 | 18 |
| SI | 1 Hz | 500 | 6 | 1 | 29 | 174 |
| P&C MU-IED | 2000 Hz | 1, 2, 3, 4, 5, …, 500 | 12 | 3 | 6 | 216 |
| Time slot (i) | AM (bytes) | SI (bytes) | PCI (bytes) |
|---|---|---|---|
| 1 | 648 | - | 216 |
| 5 | 738 | - | 216 |
| 10 | 756 | - | 216 |
| 50 | 786 | - | 216 |
| 100 | 798 | - | 216 |
| 400 | 798 | - | 216 |
| 500 | 1,038 | 174 | 216 |
| Accumulated Traffic | 334,680 | 174 | 108,000 |
| Total Traffic | Standalone wind turbine (total traffic = 3.54 Mbps) | ||
The value of the frame length is calculated depending on the received amount of traffic from the different SNs. For example, the received amount of traffic at time slot 500 is 1428 bytes (1038 bytes (AM) + 174 bytes (SI) + 216 bytes (PCI)). Note that the calculation is only for the sensing data and does not include the Ethernet frame identification such as the source address, destination address, etc. It is clear from Table 8 that total traffic from a standalone wind turbine is about 3.54 Mbps with a maximum generated traffic of 1428 bytes at time slot 500, as shown in Figure 12. The average amount of generated traffic from the wind turbine is about 885 bytes/time slot. To evaluate the performance of the WT-ONU, two different link speeds (RN) are considered: 100 Mbps and 1 Gbps. The guard time Tg is 5 μs. In this case, the maximum transmission window using Equation (2) is 1500 bytes/time slot for 100 Mbps while it is of 15,000 bytes/time slot for 1 Gbps.
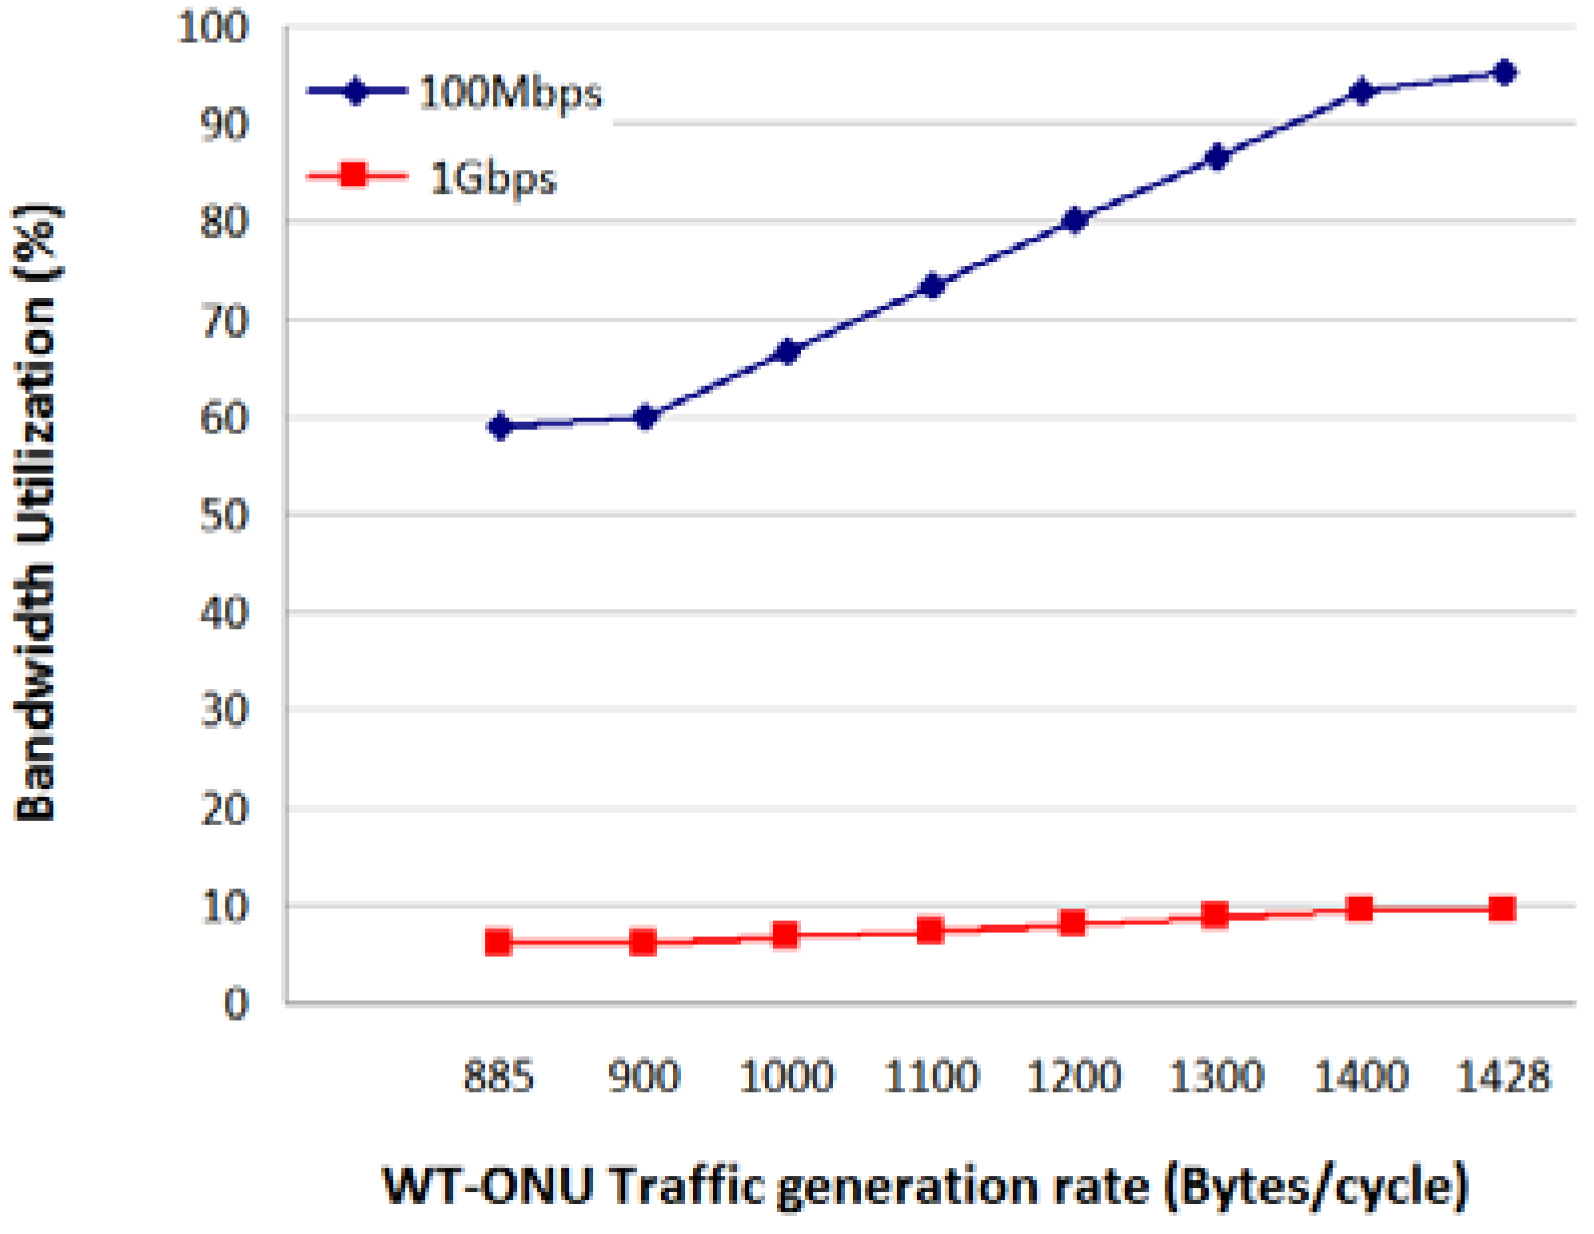
4.1.1. Utilization Efficiency
Utilization efficiency describes whether the WT-ONU is able to handle the amount of arrival traffic or not. If this value is greater than 1, it means that the amount of arrival traffic is greater than the service time of the ONU. Figure 13 shows the relation between bandwidth utilization of the WT-ONU and traffic generation rate λWT-ONU. The OLT always grants a fixed window size for the WT-ONU using an FBA algorithm. For the 100 Mbps link, the WT-ONU bandwidth utilization are about 59% and 95% for the data arrival rate of 885 bytes/time slot and 1428 bytes/time slot, respectively. In case of the 1 Gbps link, the results show that the WT-ONU bandwidth utilization is nearly fixed with small change of about 10% of its allocated capacity.
Figure 13.
Bandwidth utilization of WT-ONU.
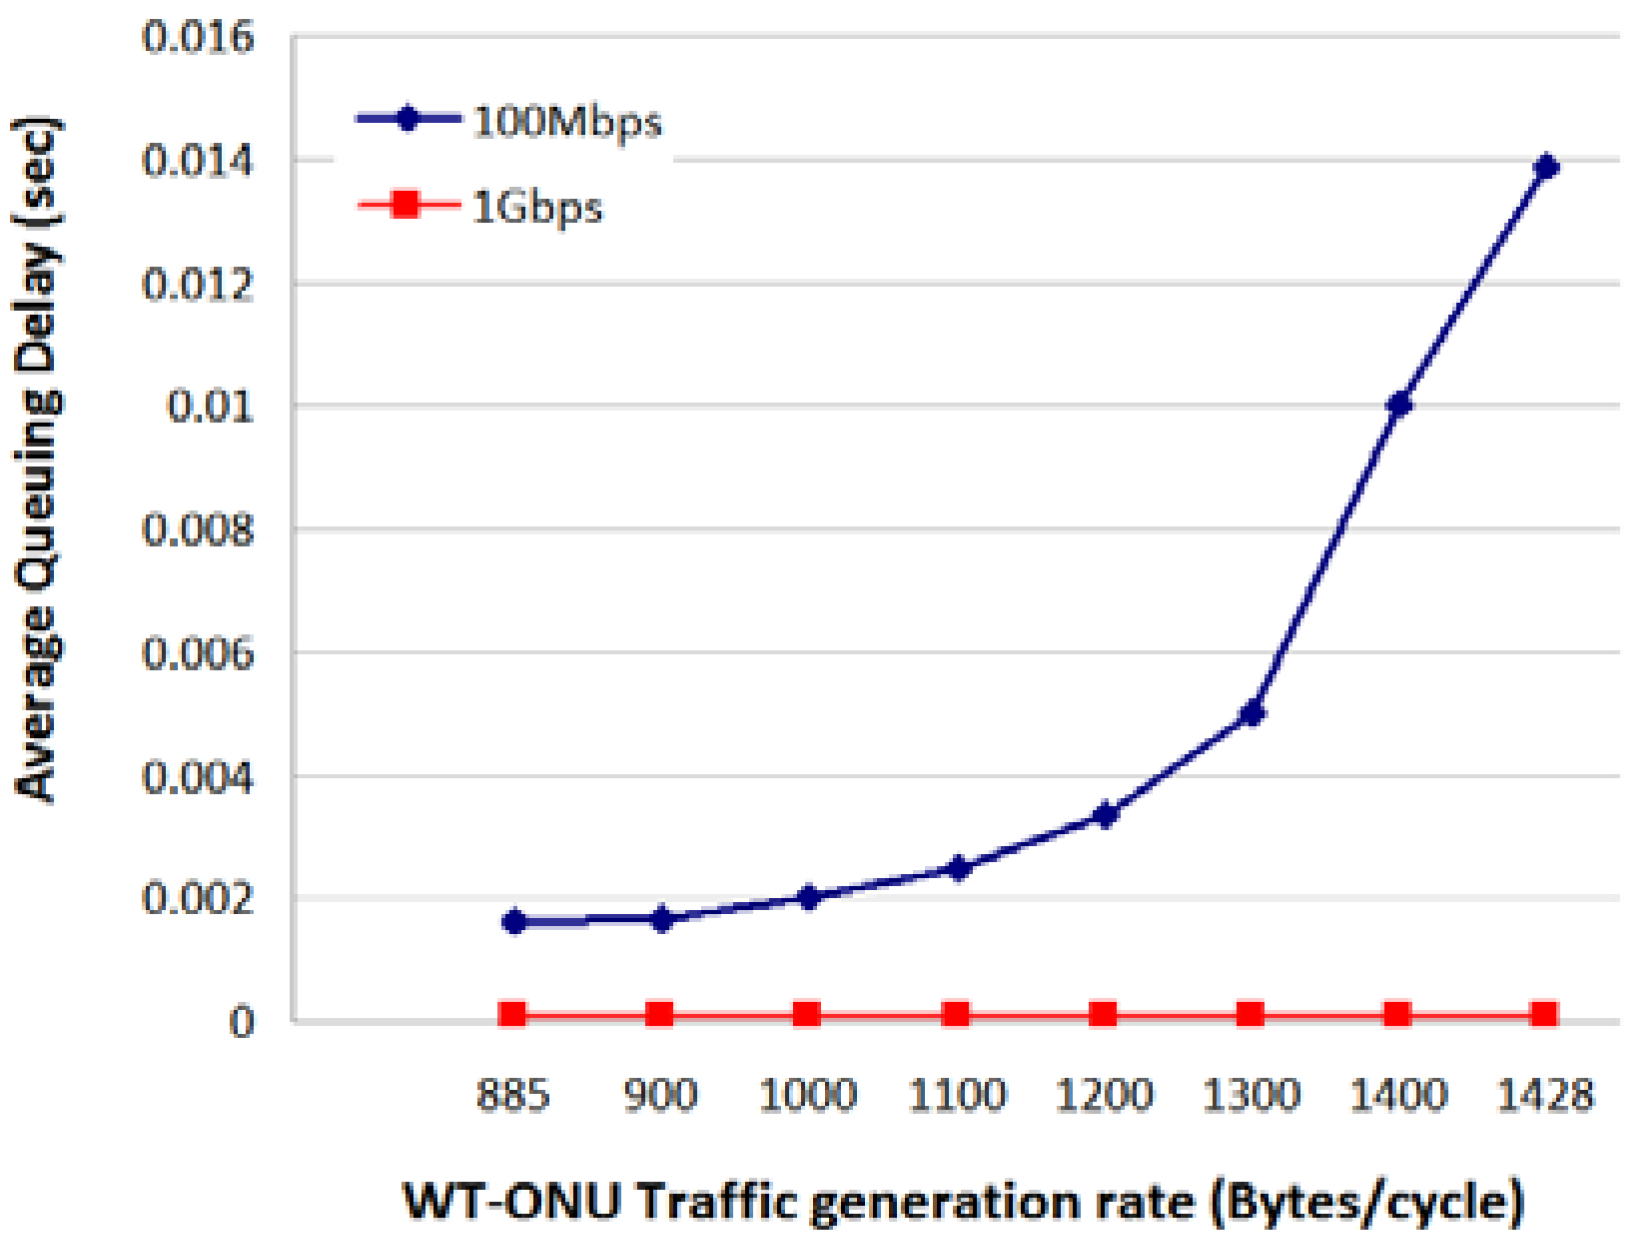
4.1.2. Average Queuing Delay
Figure 14 shows the average queuing delay in the WT-ONU queue. Under a heavy traffic load, the average queuing delay is 13.88 ms for the 100 Mbps link and about 0.073 ms for the 1 Gbps link. The increasing value of delay for the 100 Mbps link can be explained since the traffic load of the WT-ONU is about 0.95 for λmax = 1428 bytes, and traffic is nearly equal to the WT-ONU service rate.
Figure 14.
Average queuing delay of WT-ONU.

4.2. Wireless-Based Architecture
We used optimized network engineering tool (OPNET) modeler to evaluate the network performance for the shared data architecture. Figure 15 shows the OPNET model for the TAN (only meteorological data). The total received data at the coordinator node is of 226 bytes, which is consistent with our calculation in Table 5. The left part of Figure 15 shows a ZigBee-based network model of the wind turbine. There are five end devices representing the meteorological SNs (temperature, wind speed, pressure, humidity and wind direction) and one coordinator. The network is configured in a star topology.
Figure 15.
Optimized network engineering tool (OPNET) model for meteorological data shared among wind turbines.
Figure 15.
Optimized network engineering tool (OPNET) model for meteorological data shared among wind turbines.
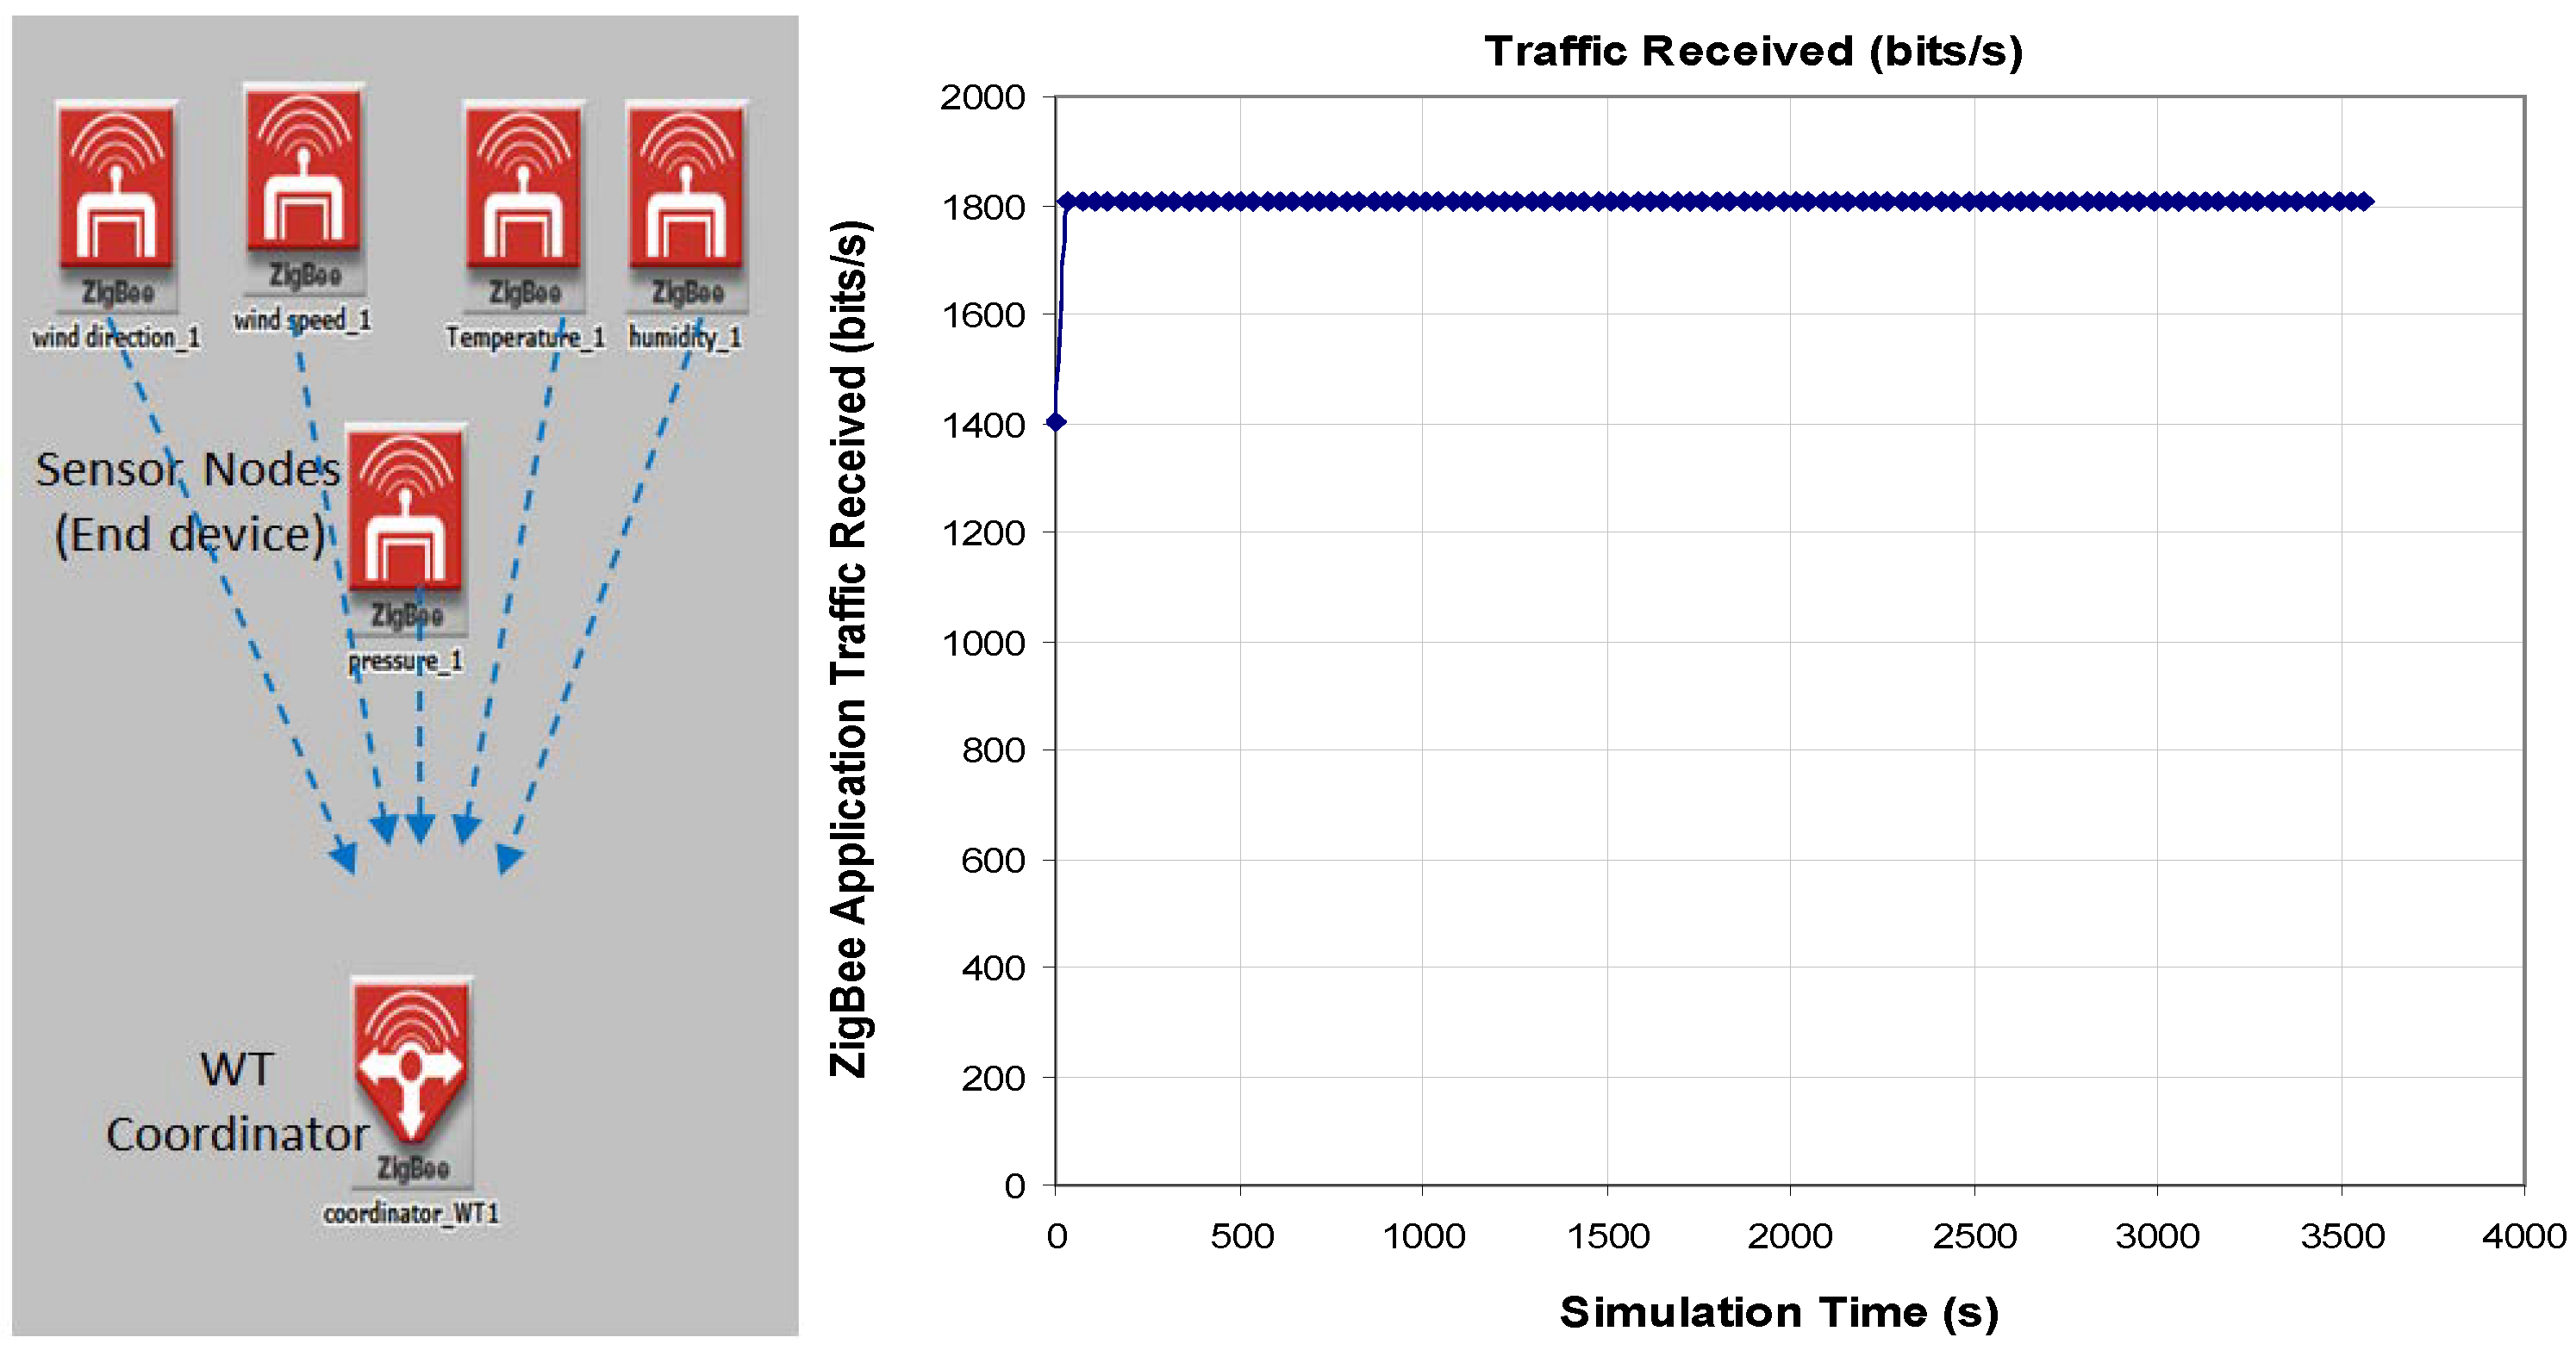
Figure 16 shows the ETE delay for sensing data received at the coordinator SNs. The maximum ETE delay is about 4.5 ms. The difference in the ETE delay between the SNs and the coordinator node at wind turbines is due to the wireless channel contention in a ZigBee-based architecture.
Figure 16.
ETE delay of sensing data at WT coordinator (8 WTs).
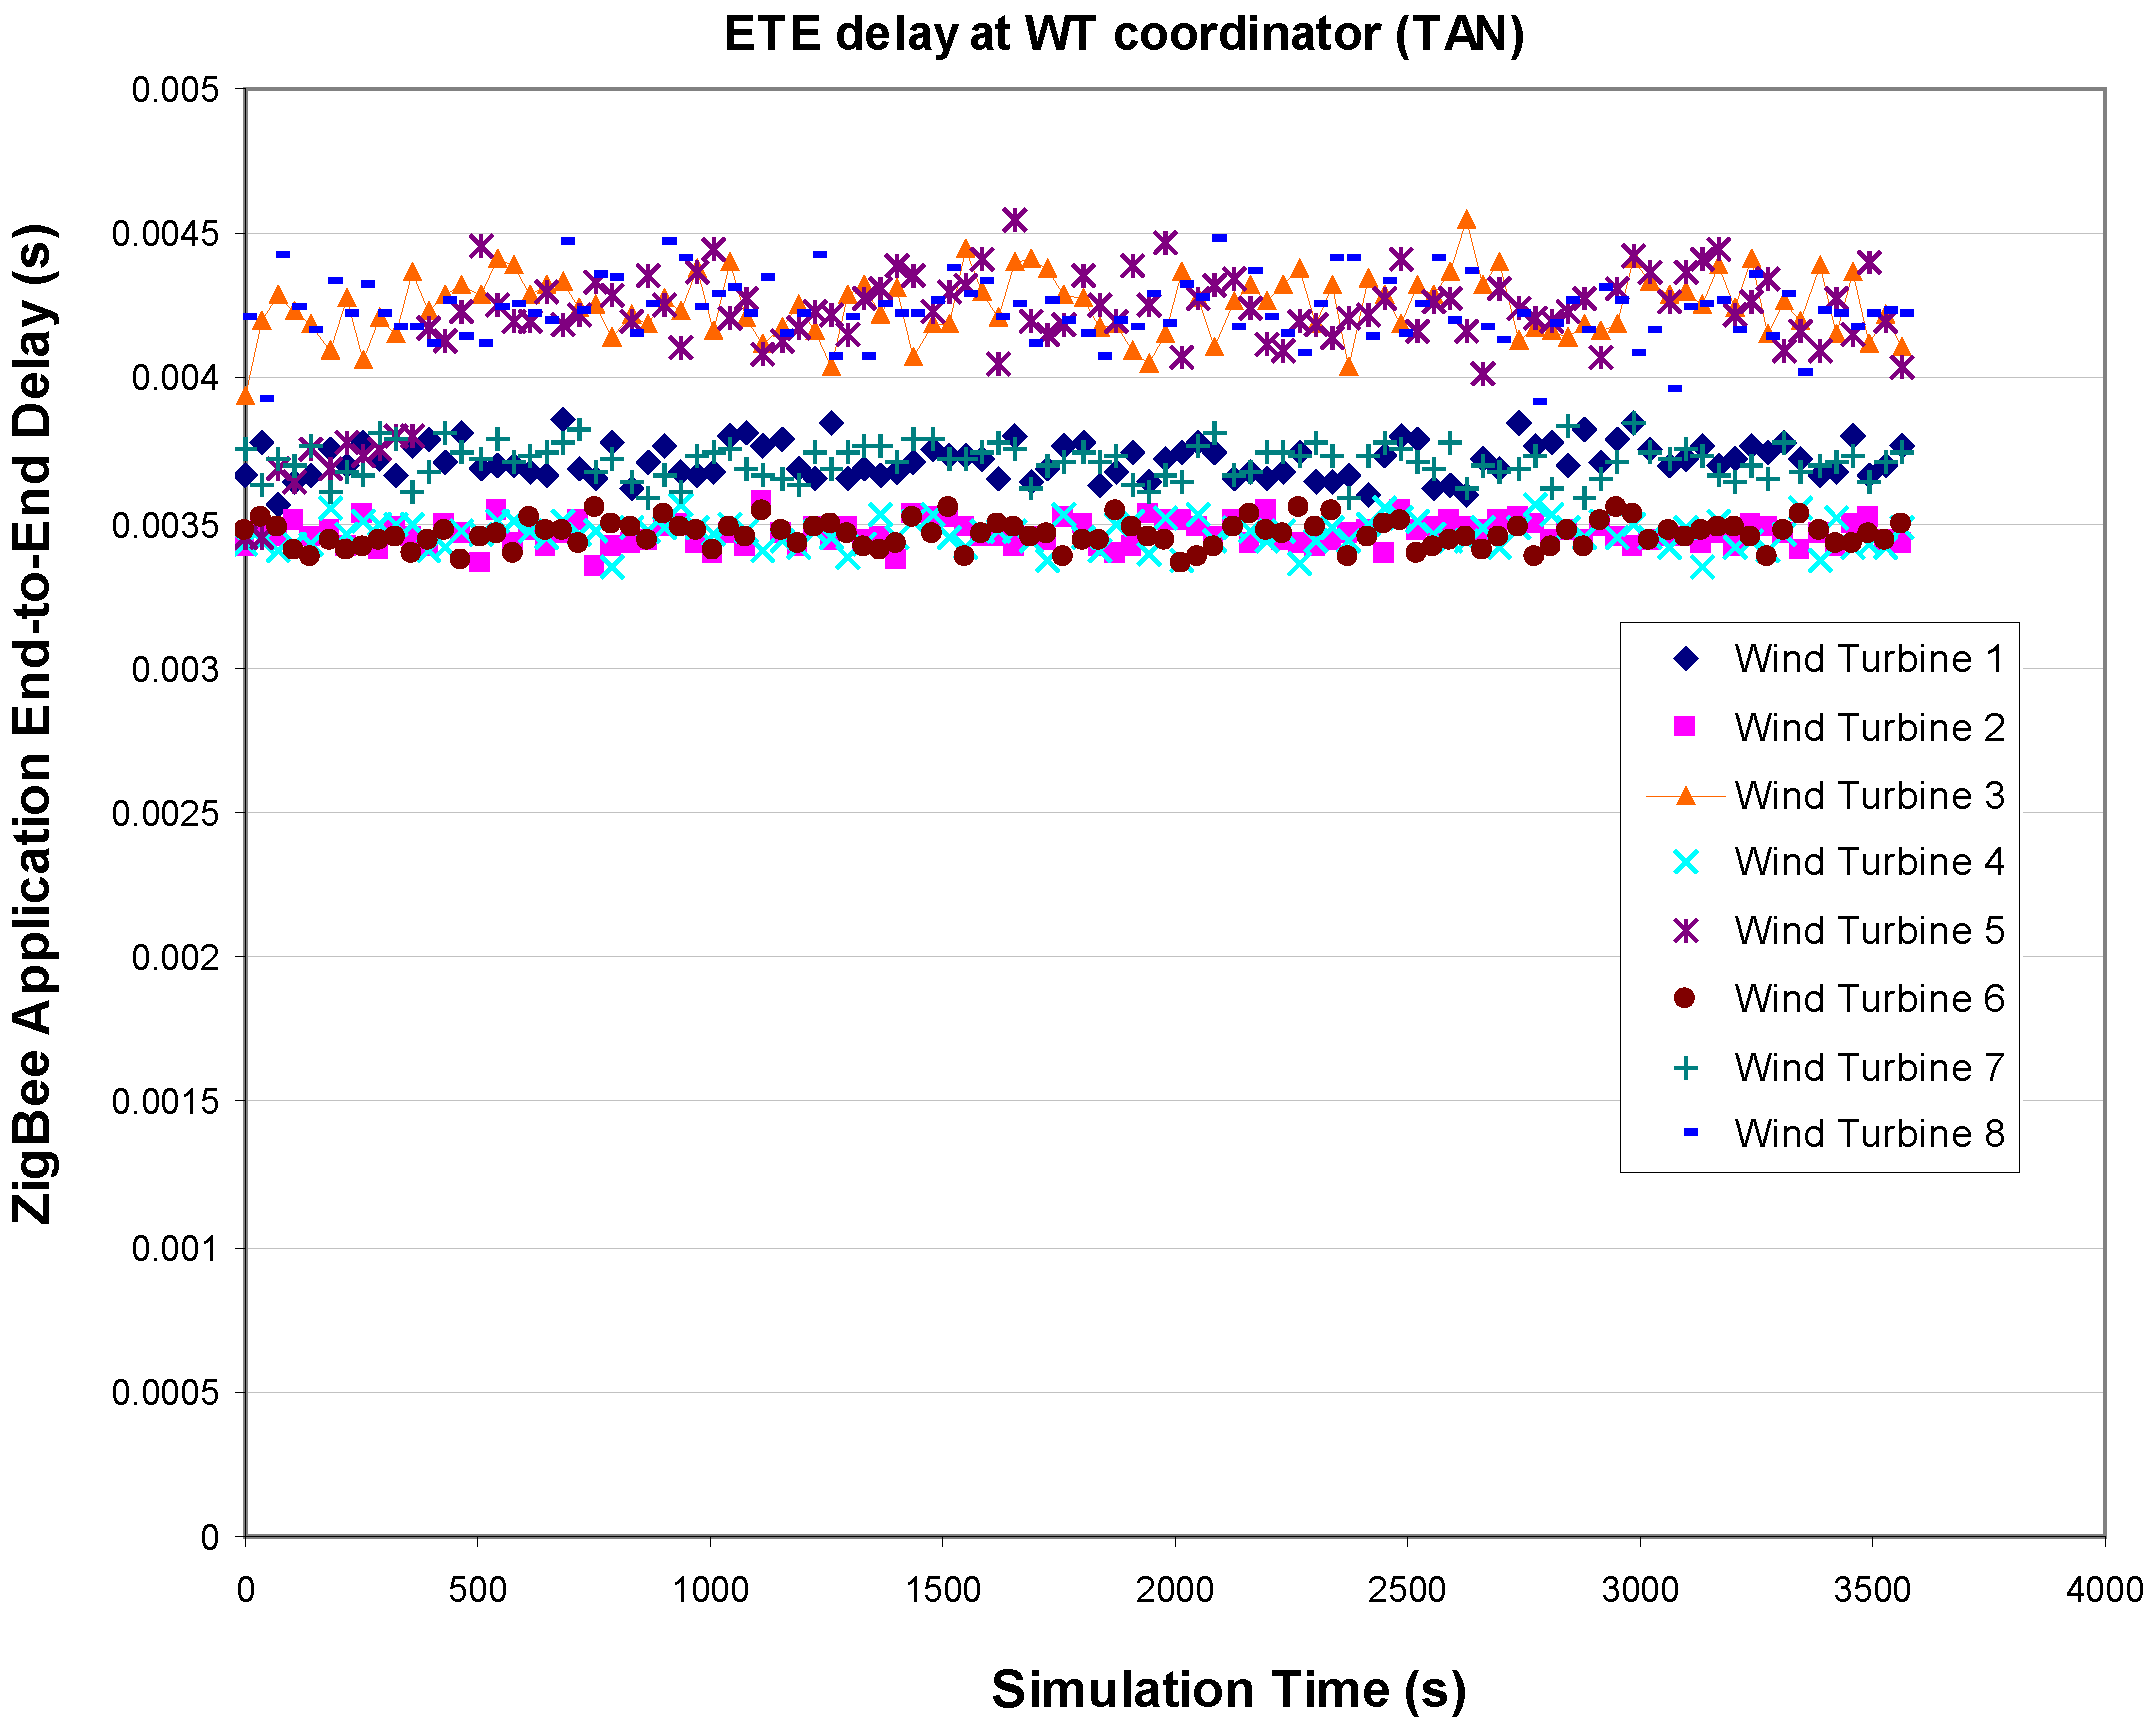
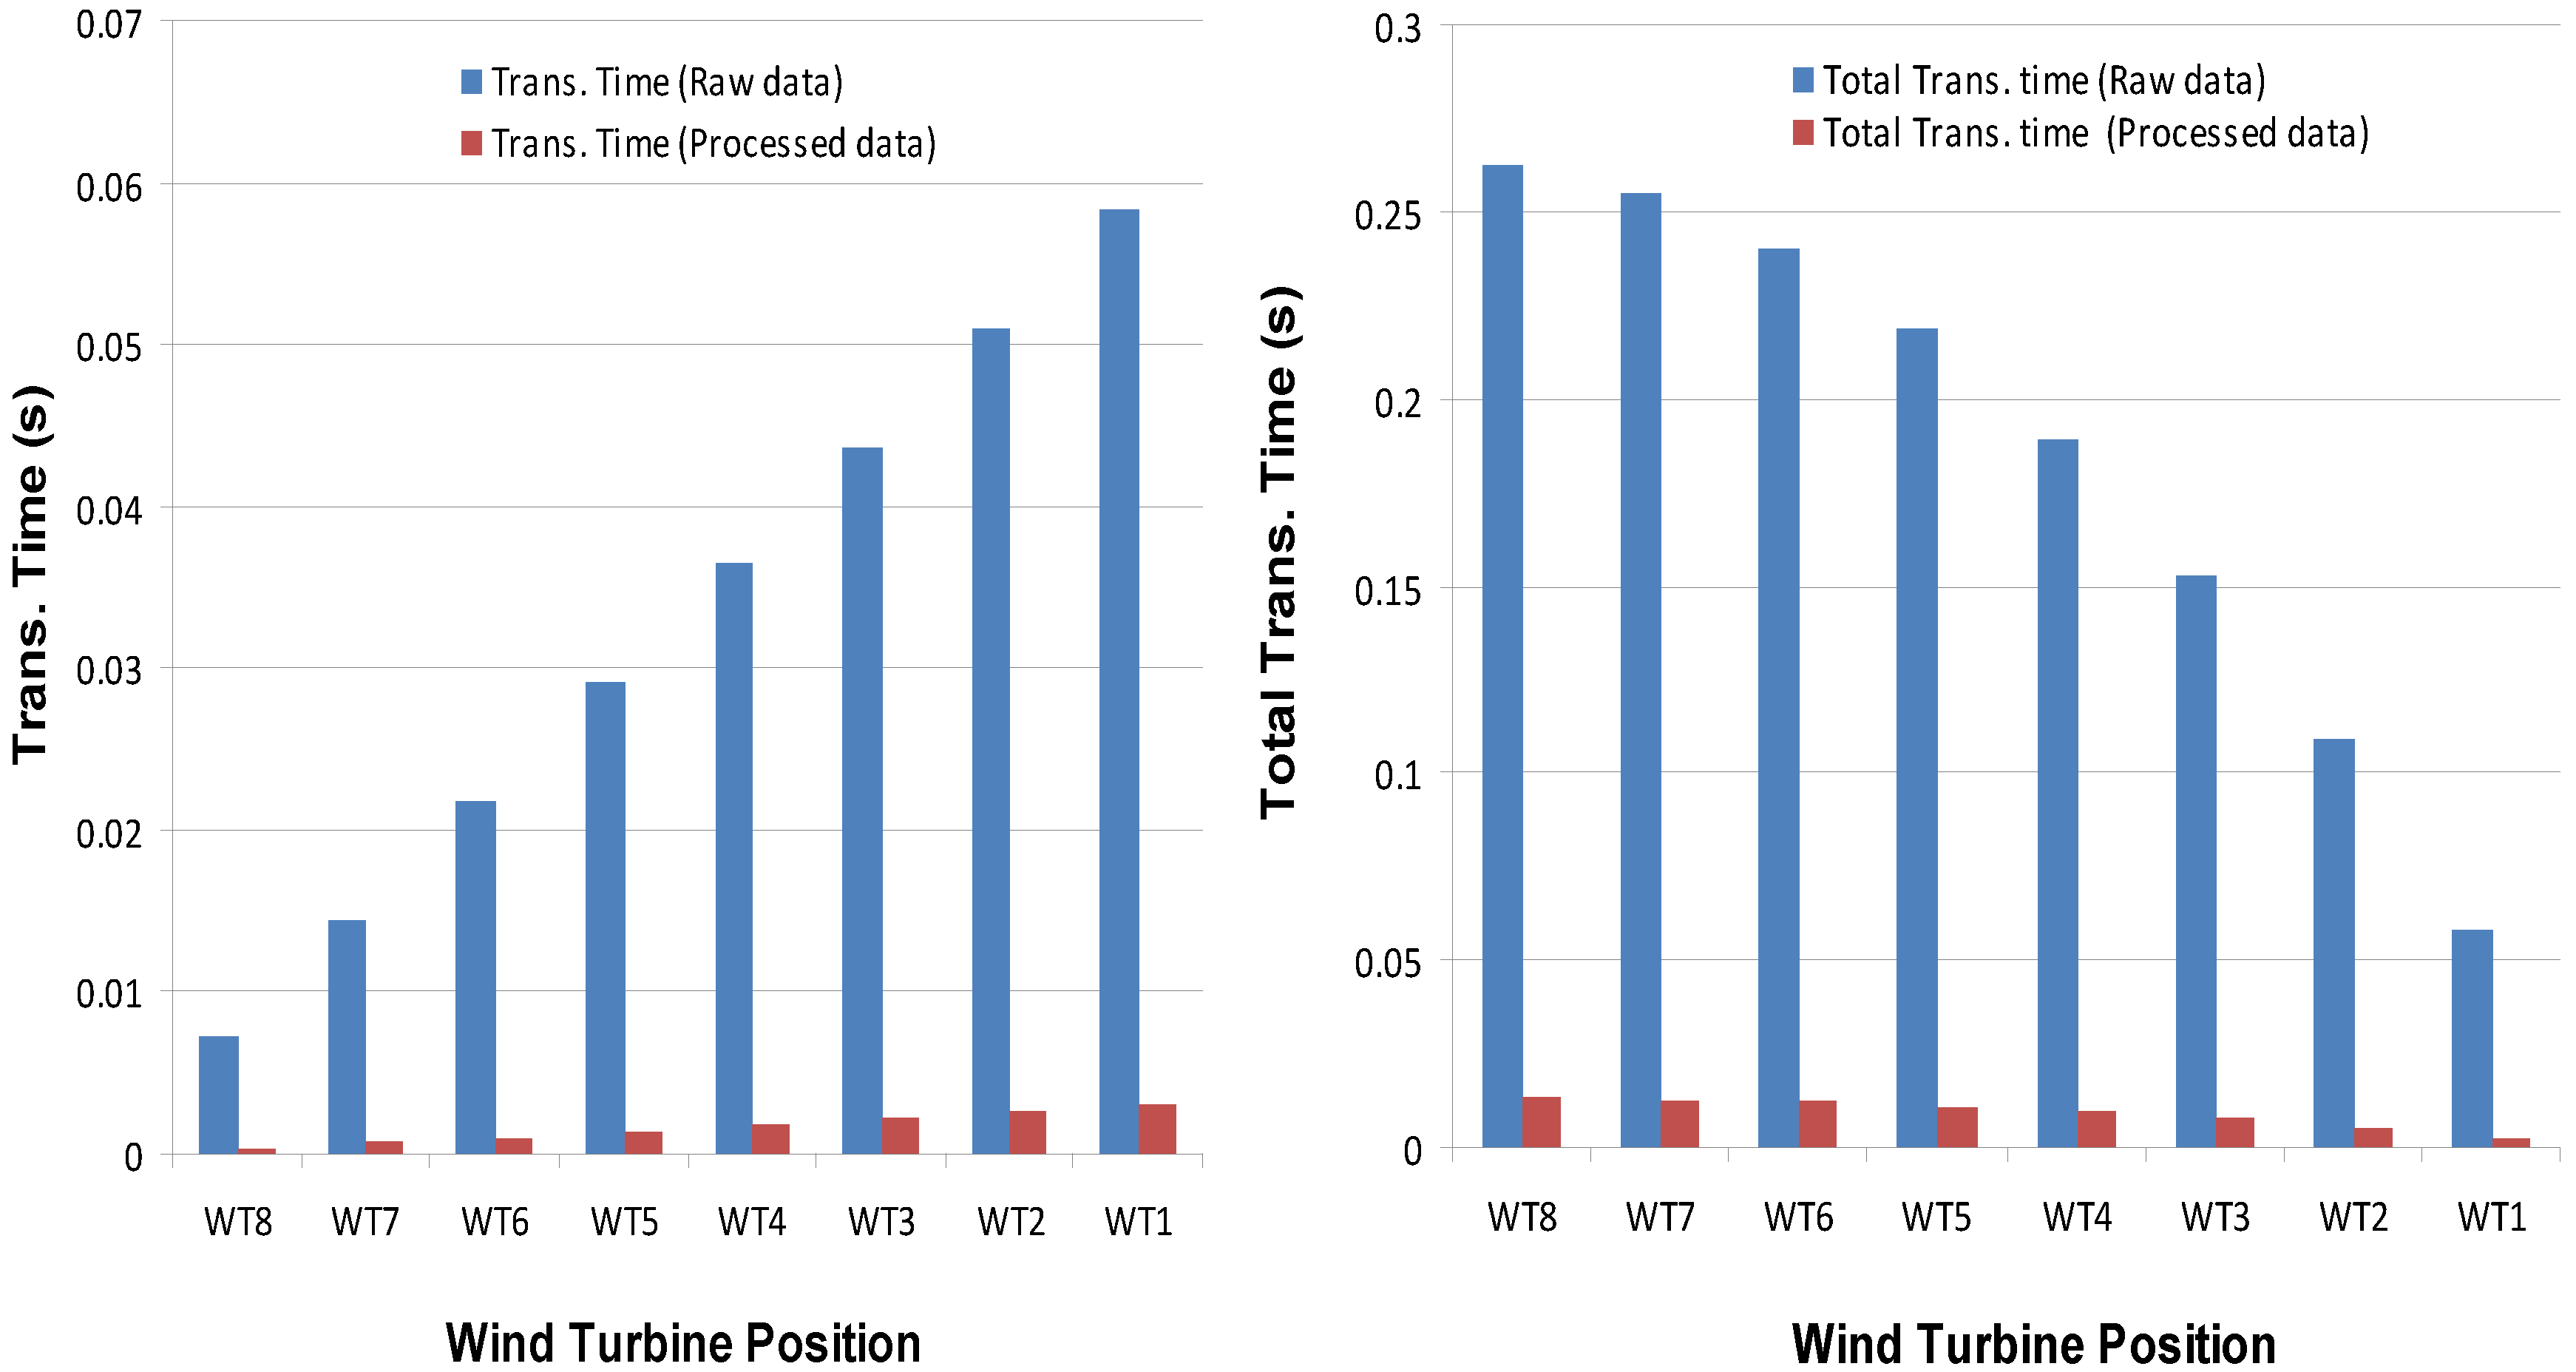
Figure 17 shows the transmission time of the meteorological data among WTs for a group of 8 WTs. At WT8, the amount of meteorological data is 228 bytes (raw data), and the transmission delay is about 0.00729 s (228 × 8/(250 × 103)). The meteorological data arrived at WT1 through seven hops. At WT1, the amount of meteorological data is 1824 bytes (8 WTs × 228) and the transmission delay is about 0.0583 s (1824 × 8/(250 × 103)). In case of PD transmission at RN, the transmission delay at WT2 is about 0.00268 s (7 × 12 × 8/(250 × 103)). The total transmission time of the data packets from the farthest wind turbine (WT8) to the BS is about 0.2626 s for raw data transmission while 0.0138 s for PD transmission. This implies that the control center is able to collect the meteorological data from all wind turbines within 0.0138 s (in case PD) in order to achieve an accurate prediction of energy production for the WPF.
Figure 17.
Transmission time of sensing data packets among WTs.

5. Conclusions
In this paper, we have proposed communication network architectures for S-WPFs. To do it, we have explored network architectures, topologies, and technologies for establishing communications within and among wind turbines in a WPF. The proposed communication architecture consists of three networks: the TAN, the FAN, and the CAN. With respect to a wired solution, we studied the upstream traffic for the proposed EPON-based architecture for a standalone wind turbine. Based on the IEC 61400-25 standard, we classified the generated amount of traffic into three different categories: AM, SI, and protection information. A sensor data frame structure is designed to carry the sensing data from different wind turbine parts, and FBA is considered in order to transmit the sensing data efficiently. An analytical model using queueing theory is used to evaluate network performance in view of bandwidth utilization and average queuing delay. Using a 1 Gbps link, the average queuing delay showed stable performance compared to the 100 Mbps link. Under heavy traffic loads, the average queuing delay was about 13.88 ms for the 100 Mbps link while it was about 0.073 ms for the 1 Gbps link. With respect to a wireless solution, there are two types of nodes, SN and RN, in the TAN. The meteorological data in each turbine are selected to be shared and forwarded directly to the control center. The proposed TAN was modeled and simulated in terms of the amount of received data and end to end delay using an OPNET modeler. The FAN transmitted the meteorological data from the wind turbines to the control center within 0.0138 s. The simulation results showed that the maximum ETE delay of sensing data at the RN was of about 4.5 ms. Our ongoing work is to develop a simulation model to evaluate the network performance for a hybrid network architecture (EPON/WiMAX).
Acknowledgments
This work was supported by the National Research Foundation of Korea (NRF) funded by the Korea government (MSIP) (2010-0028509).
Conflicts of Interest
The authors declare no conflict of interest.
References
- Bouhafs, F.; Mackay, M.; Merabti, M. Links to the future: Communication requirements and challenges in the smart grid. IEEE Power Energy Mag. 2012, 10, 24–32. [Google Scholar] [CrossRef]
- Nguyen, T.H.; Prinz, A.; Friiso, T.; Nossum, R. Smart Grid for Offshore Wind Farms: Towards an Information Model Based on the IEC 61400-25 Standard. In Proceedings of the 2012 IEEE Innovative Smart Grid Technologies (ISGT), Washington, DC, USA, 16–20 January 2012; pp. 1–6.
- Zhang, Y.; Yu, R.; Nekovee, M.; Liu, Y.; Gjessing, S. Cognitive machine-to-machine communications: Visions and potentials for the smart grid. IEEE Netw. 2012, 26, 6–13. [Google Scholar]
- Potter, C.H.; Hancke, G.P.; Silva, B.J. Machine-to-Machine: Possible Applications in Industrial Networks. In Proceedings of the International Conference on Industrial Technology (ICIT 2013), Cape Town, South Africa, 25–28 February 2013; pp. 1321–1326.
- Gaj, P.; Jasperneite, J.; Felser, M. Computer communication within industrial distributed environment—A survey. IEEE Trans. Ind. Inform. 2013, 9, 182–189. [Google Scholar] [CrossRef]
- Wu, G.; Su, F.; Li, X.; Zou, W.; Chen, J. Real-time Ethernet based on passive optical networks. Opt. Eng. 2013, 52, 1–6. [Google Scholar]
- Ahmed, M.A.; Yang, W.-H.; Kim, Y.-C. Performance Evaluation of EPON-Based Communication Network Architectures for Large-Scale Offshore Wind Power Farms. In Multimedia and Ubiquitous Engineering; Springer: Dordrecht, The Netherlands, 2013; Volume 240, pp. 841–848. [Google Scholar]
- In NIST Framework and Roadmap for Smart Grid Interoperability Standards, Release 1.0; NIST Special Publication 1108. National Institute of Standards and Technology: Gaithersburg, MD, USA, 2010.
- Shahraeini, M.; Javidi, M.H.; Ghazizadeh, M.S. Comparison between communication infrastructures of centralized and decentralized wide area measurement systems. IEEE Trans. Smart Grid 2011, 2, 206–211. [Google Scholar] [CrossRef]
- Goraj, M.; Epassa, Y.; Midence, R.; Meadows, D. Designing and Deploying Ethernet Networks for Offshore Wind Power Applications—A Case Study. In Proceedings of the Managing the Change, 10th IET International Conference on Developments in Power System Protection (DPSP 2010), Manchester, UK, 29 March–1 April 2010; pp. 1–5.
- Pettener, A.L. SCADA and Communication Network for Large Scale Offshore Wind Power Systems. In Proceedings of the IET Conference on Renewable Power Generation (RPG 2011), Edinburgh, UK, 6–8 September 2011; pp. 1–6.
- Khan, R.H.; Khan, J.Y. A comprehensive review of the application characteristics and traffic requirements of a smart grid communications network. Comput. Netw. 2013, 57, 825–845. [Google Scholar] [CrossRef]
- Yu, F.R.; Zhange, P.; Xiao, W.; Choudhury, P. Communication systems for grid integration of renewable energy resources. IEEE Netw. 2011, 25, 22–29. [Google Scholar]
- Johnsson, A.; Svensson, J. In Wind Power Communication—Design and Implementation of Test Environment for IEC61850/UCA2; Elforsk Rapport 02:16. Elforsk AB: Stockholm, Sweden, 2002. [Google Scholar]
- Parikh, P.; Kanabar, M.G.; Sidhu, T.S. Opportunities and Challenges of Wireless Communication Technologies for Smart Grid Applications. In Proceedings of the 2010 IEEE Power and Energy Society Meeting, Minneapolis, MN, USA, 25–29 July 2010; pp. 1–7.
- Gungor, V.C.; Sahin, D.; Koçak, T.; Ergüt, S.; Buccella, C.; Cecati, C.; Hancke, G.P. Smart grid technologies: Communication technologies and standards. IEEE Trans. Ind. Inform. 2011, 7, 529–539. [Google Scholar] [CrossRef]
- Kawady, T.A.; Mansour, N.M.; Taalab, A.I. Wind Farm Protection Systems: State of the Art and Challenges. In Distributed Generation; Gaonkar, D.N., Ed.; InTech: Rijeka, Croatia, 2010; Chapter 12; pp. 265–288. [Google Scholar]
- Kramer, G. Ethernet Passive Optical Networks; McGraw-Hill: New York, NY, USA, 2005. [Google Scholar]
- In Wind Turbines—Part 25-2: Communications for Monitoring and Control of Wind Power Plants—Information ModelsInternational Standard IEC 61400-25-2, 1st ed.; International Electrotechnical Commission (IEC): Geneva, Switzerland, 2006.
- Wei, M.; Chen, Z. Distribution System Protection with Communication Technologies. In Proceedings of the 36th Annual Conference on IEEE Industrial Electronics Society (IECON 2010), Glendale, CA, USA, 7–10 November 2010; pp. 3328–3333.
- Karthikeya, B.R.; Schutt, R.J. Overview of wind park control strategies. IEEE Trans. Sustain. Energy 2013, 99, 1–7. [Google Scholar]
- Williams, R.H. Probability Statistics, and Random Processes for Engineers, 1st ed.; Brooks Publishing Company: Pacific Grove, CA, USA, 2003. [Google Scholar]
- Oh, K.Y.; Kim, J.Y.; Lee, J.K.; Ryu, M.S.; Lee, J.S. An assessment of wind energy potential at the demonstration offshore wind farm in Korea. Energy 2012, 46, 555–563. [Google Scholar] [CrossRef]
- Madariagay, A.; Martinez de Alegria, I.M.; Martin, J.L.; Eguia, P.; Ceballos, S. Analysis of the Technology Currently Used in Offshore Wind Energy Systems. In Proceedings of the 37th Annual Conference on IEEE Industrial Electronics Society (IECON 2011), Melbourne, Australia, 7–10 November 2011; pp. 831–836.
- Hung, K.S.; Lee, W.K.; Li, V.O.K.; Lui, K.S.; Pong, P.W.T.; Wong, K.K.Y.; Yang, G.H.; Zhong, J. On wireless Sensors Communication for Overhead Transmission Line Monitoring in Power Delivery Systems. In Proceedings of the 1st International Conference on Smart Grid Communications (SmartGridComm 2010), Gaithersburg, MD, USA, 4–6 October 2010; pp. 309–314.
© 2014 by the authors; licensee MDPI, Basel, Switzerland. This article is an open access article distributed under the terms and conditions of the Creative Commons Attribution license (http://creativecommons.org/licenses/by/3.0/).
Share and Cite
MDPI and ACS Style
Ahmed, M.A.; Kim, Y.-C. Communication Network Architectures for Smart-Wind Power Farms. Energies 2014, 7, 3900-3921. https://doi.org/10.3390/en7063900
AMA Style
Ahmed MA, Kim Y-C. Communication Network Architectures for Smart-Wind Power Farms. Energies. 2014; 7(6):3900-3921. https://doi.org/10.3390/en7063900
Chicago/Turabian StyleAhmed, Mohamed A., and Young-Chon Kim. 2014. "Communication Network Architectures for Smart-Wind Power Farms" Energies 7, no. 6: 3900-3921. https://doi.org/10.3390/en7063900