Determining the Maximum Depth of Hydrothermal Circulation Using Geothermal Mapping and Seismicity to Delineate the Depth to Brittle-Plastic Transition in Northern Honshu, Japan

Abstract
: This paper defines the maximum possible vertical extent of hydrothermal circulation in granitic crust, and thus the maximum depth within which geothermal reservoirs can be encountered. To evaluate prospective geothermal fields we constructed a geothermal database in northern Honshu, Japan that includes 571 points of thermal data of existing wells and hot springs. Depth-temperature curves were normalized by the Activity Index for three-dimensional extrapolation and a depth contour map of the 380 °C isotherm was plotted as an assumed brittle-plastic transition for granitic crust. Shallower-depth anomalies of the brittle-plastic transition on this map are closely coincident with the Quaternary volcanoes and their prospective geothermal fields. It should be noted that the bottom of the spatial distribution of seismicity in the volcanic fields shows strong correlation to the 380 °C isotherm. This result indicates reliability of the subsurface three-dimensional thermal map and suggests that the 380 °C isotherm strongly constrains the bottom surface of seismicity, fracturing and hydrothermal convection in granitic crust.1. Introduction
Since the unprecedented disastrous Great East Japan Earthquake at 11 March 2011, geothermal energy is being re-evaluated as a more crucial energy resource, not only as green energy, but also as indigenous energy in northern Japan. When compared to other renewable energy sources, the main strength of geothermal energy among the variety of renewable energy sources is that it can be produced stably in all weather conditions, whereas its main weakness is that it uses invisible underground resources prolonging development lead time as well as increasing the initial investment risks and costs. In order to explore subsurface geothermal resources, geological, geochemical and geophysical exploration techniques have been developed, but one of the efforts that should be done is the estimation of subsurface thermal structure from thermal data such as existing wells and hot springs.
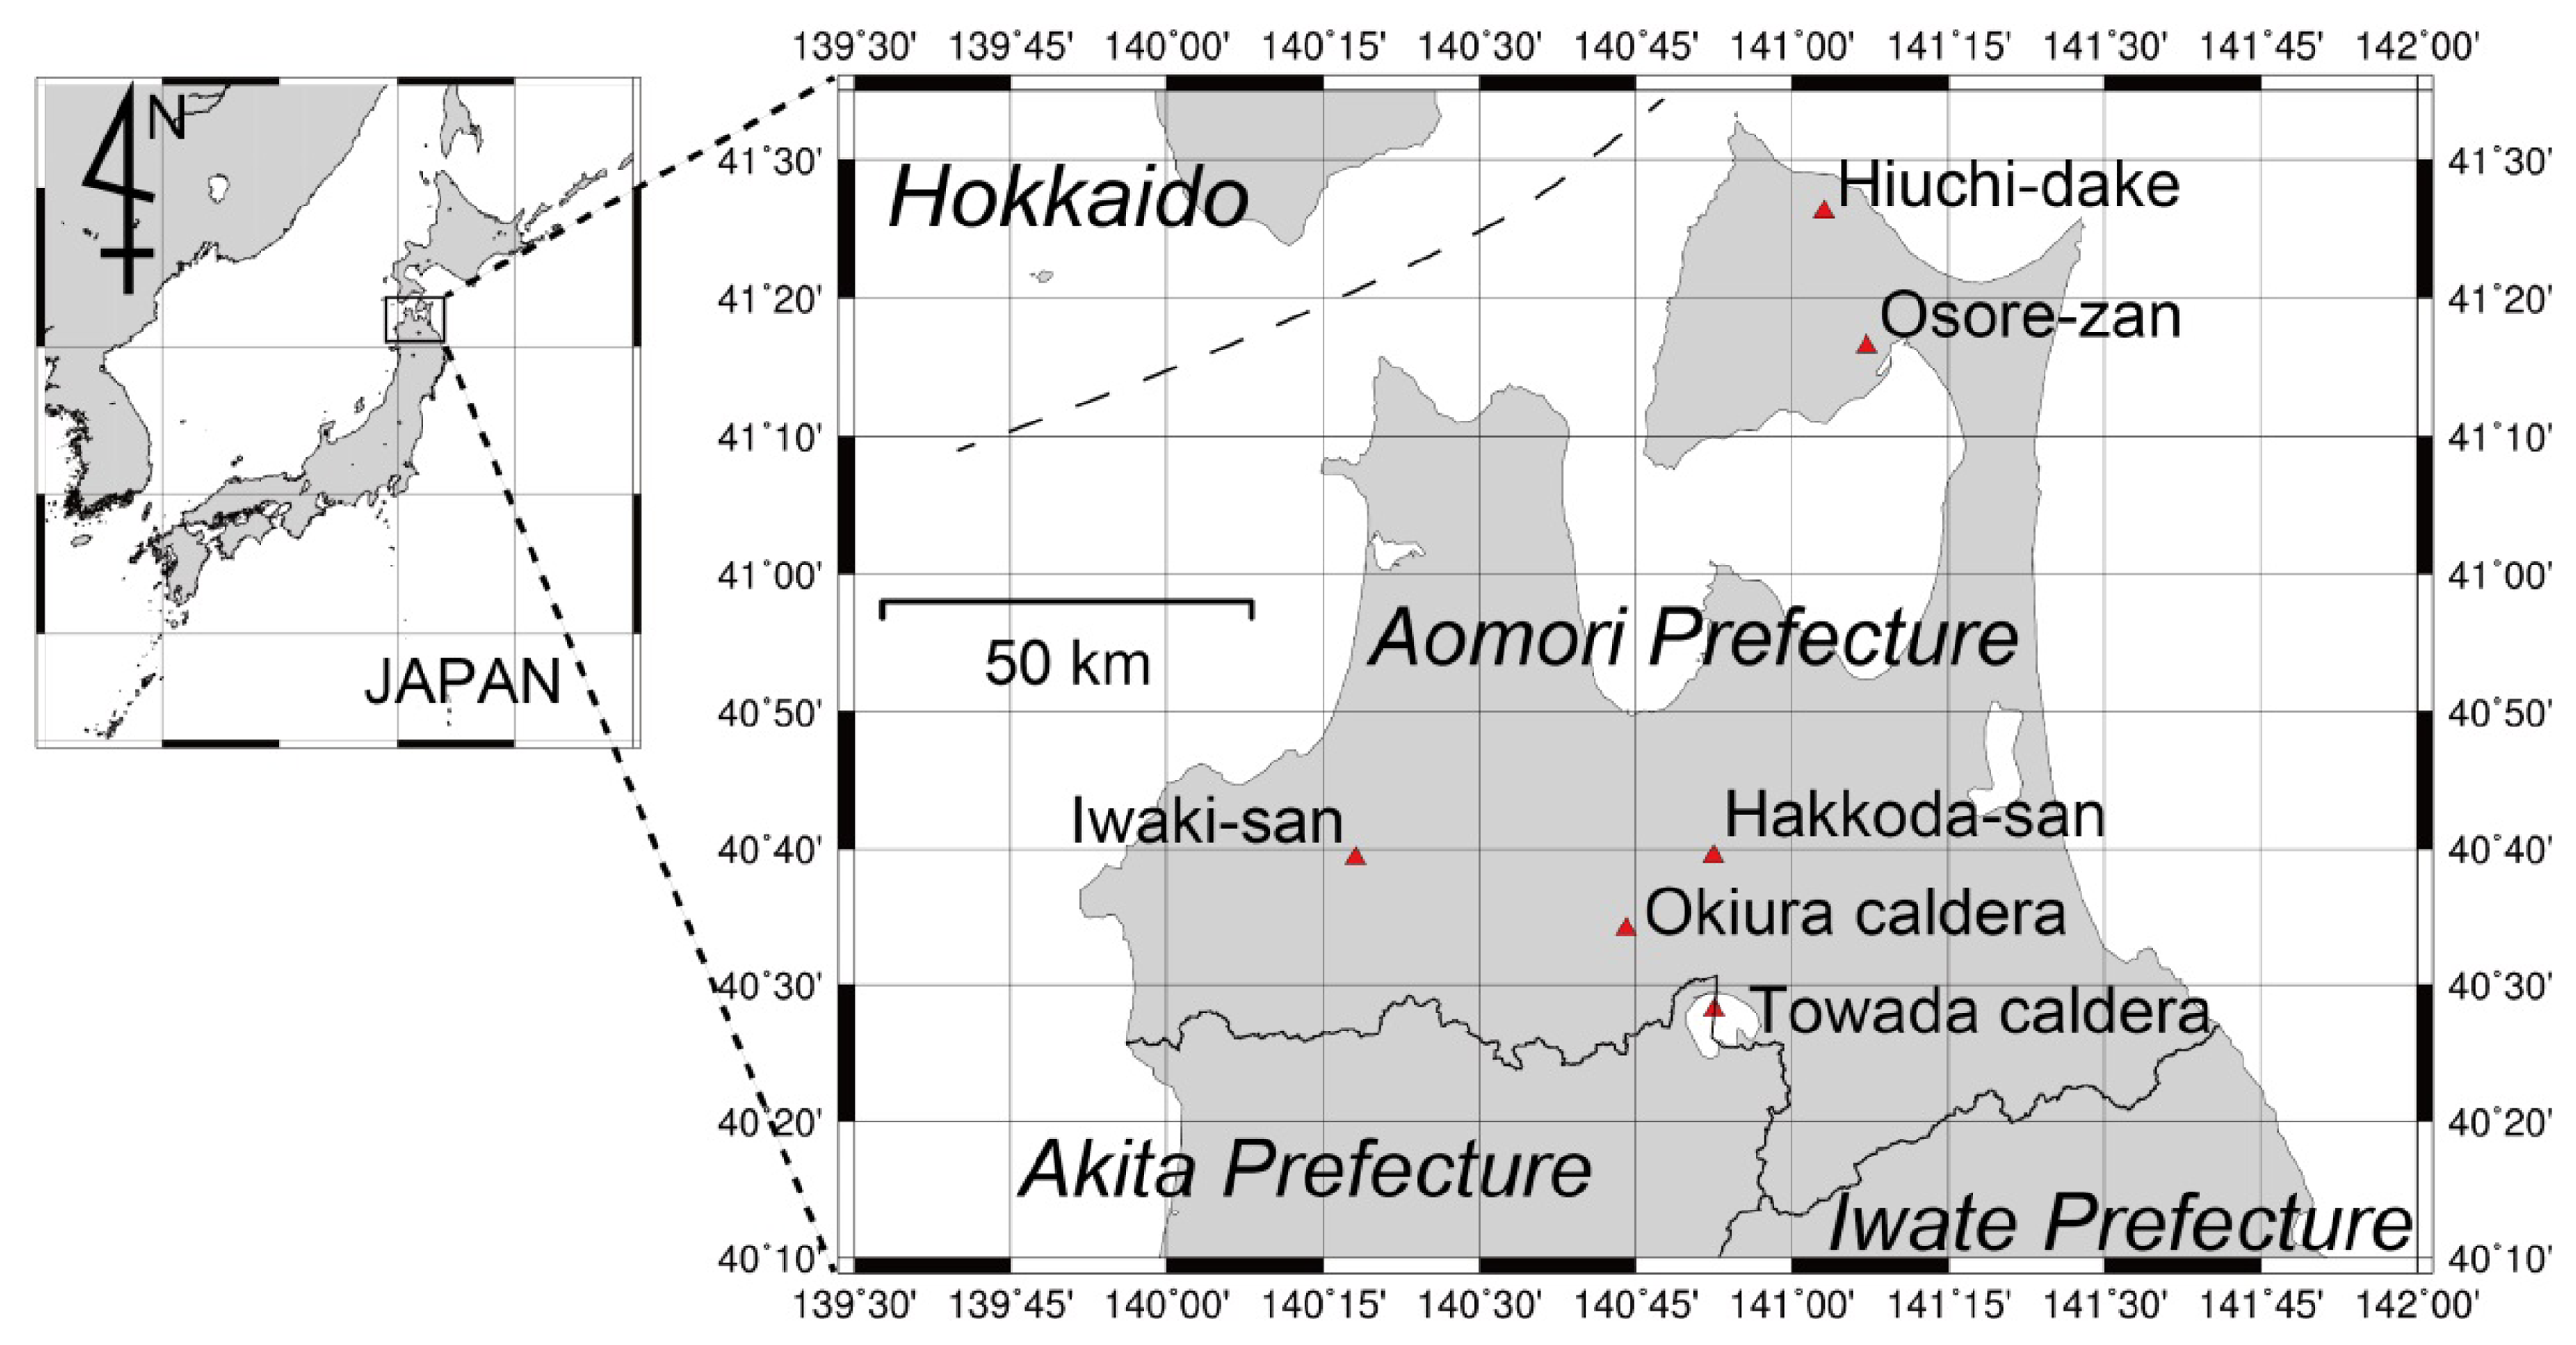
Fortunately 27,219 hot spring sources are distributed all over Japan [1], and numerous hot springs are concentrated in Aomori Prefecture, a northern end of Honshu Island, Japan (Figure 1). Most of these Japanese hot springs are artificially developed by shallow wells. We constructed a geothermal database in Aomori Prefecture that includes available information on geothermal exploratory wells, hot spring wells, and natural hot springs.
The neighboring Iwate Prefecture and Akita Prefecture have three installed geothermal power plant units, respectively, including the oldest Matsukawa plant in Japan that has been working for an almost half century since 1966, but unfortunately no geothermal power plants have been developed in Aomori Prefecture so far. The geothermal database we have set up, will assist geothermal development in Aomori Prefecture before detailed geothermal exploration surveys are carried out in individual geothermal fields.
The geothermal database can be applied to draw a variety of subsurface thermal structures. As the spatial density of the point data is still relatively limited, it will be adequate to apply the data to a broad but fundamental structure. One of the objectives would be to map the depth of the brittle-plastic transition because it is synonymous with the bottom of the permeability and comprises the broadest as well as most fundamental structure delineating a bottom of the entire hydrothermal convection sphere.
This paper describes a geothermal database in Aomori Prefecture and draws a map of the depth of the brittle-plastic transition based on some depth-temperature normalization techniques that allow three-dimensional extrapolation in up-flow zones. Then, this map of the depth of the brittle-plastic transition is verified by the bottom of seismicity which is far independent destruction phenomena from the thermal structure concerned. We used the Generic Mapping Tools 4.5.9 for drawing most of figures in this paper [2].
2. Geothermal Database
Our geothermal database consists of 35 points of geothermal exploratory well data, 510 points of hot spring well data and 26 points of natural hot spring data. Our geothermal database was based on two main data sources, both of which are open to the public. One is “Record of Hot Spring Geology in Aomori Prefecture” published by the Department of Health and Welfare, Aomori Prefectural Office in 1997 [3]. The other is “Atlas of Hydrothermal Systems in Japan” published from the Geological Survey of Japan, the National Institute of Advanced Industrial Science and Technology (AIST) in 2007 [4].
The “Record of Hot Spring Geology in Aomori Prefecture” describes 434 points of hot spring data in Aomori Prefecture by their locations, well depths, discharge temperatures, discharge rates, major chemical constituents and geological columns along the wells. Among them 26 hot springs are natural hot springs with no artificial drilling. We used the 26 points of natural hot spring data and 395 points of hot spring data developed by wells of which both the well depth and discharge temperature are known. We digitized all the paper-based data from the report.
The “Atlas of Hydrothermal Systems in Japan” describes 7203 points of hot spring data and 3066 well data points from all over Japan for drawing a variety of geothermal maps. We used 115 points of hot spring data and 35 points of geothermal exploratory well data from Aomori Prefecture. They were also originally paper-based data, but a digital-version on CD-ROM was published later [5].
3. Estimate of Subsurface Geothermal Structure
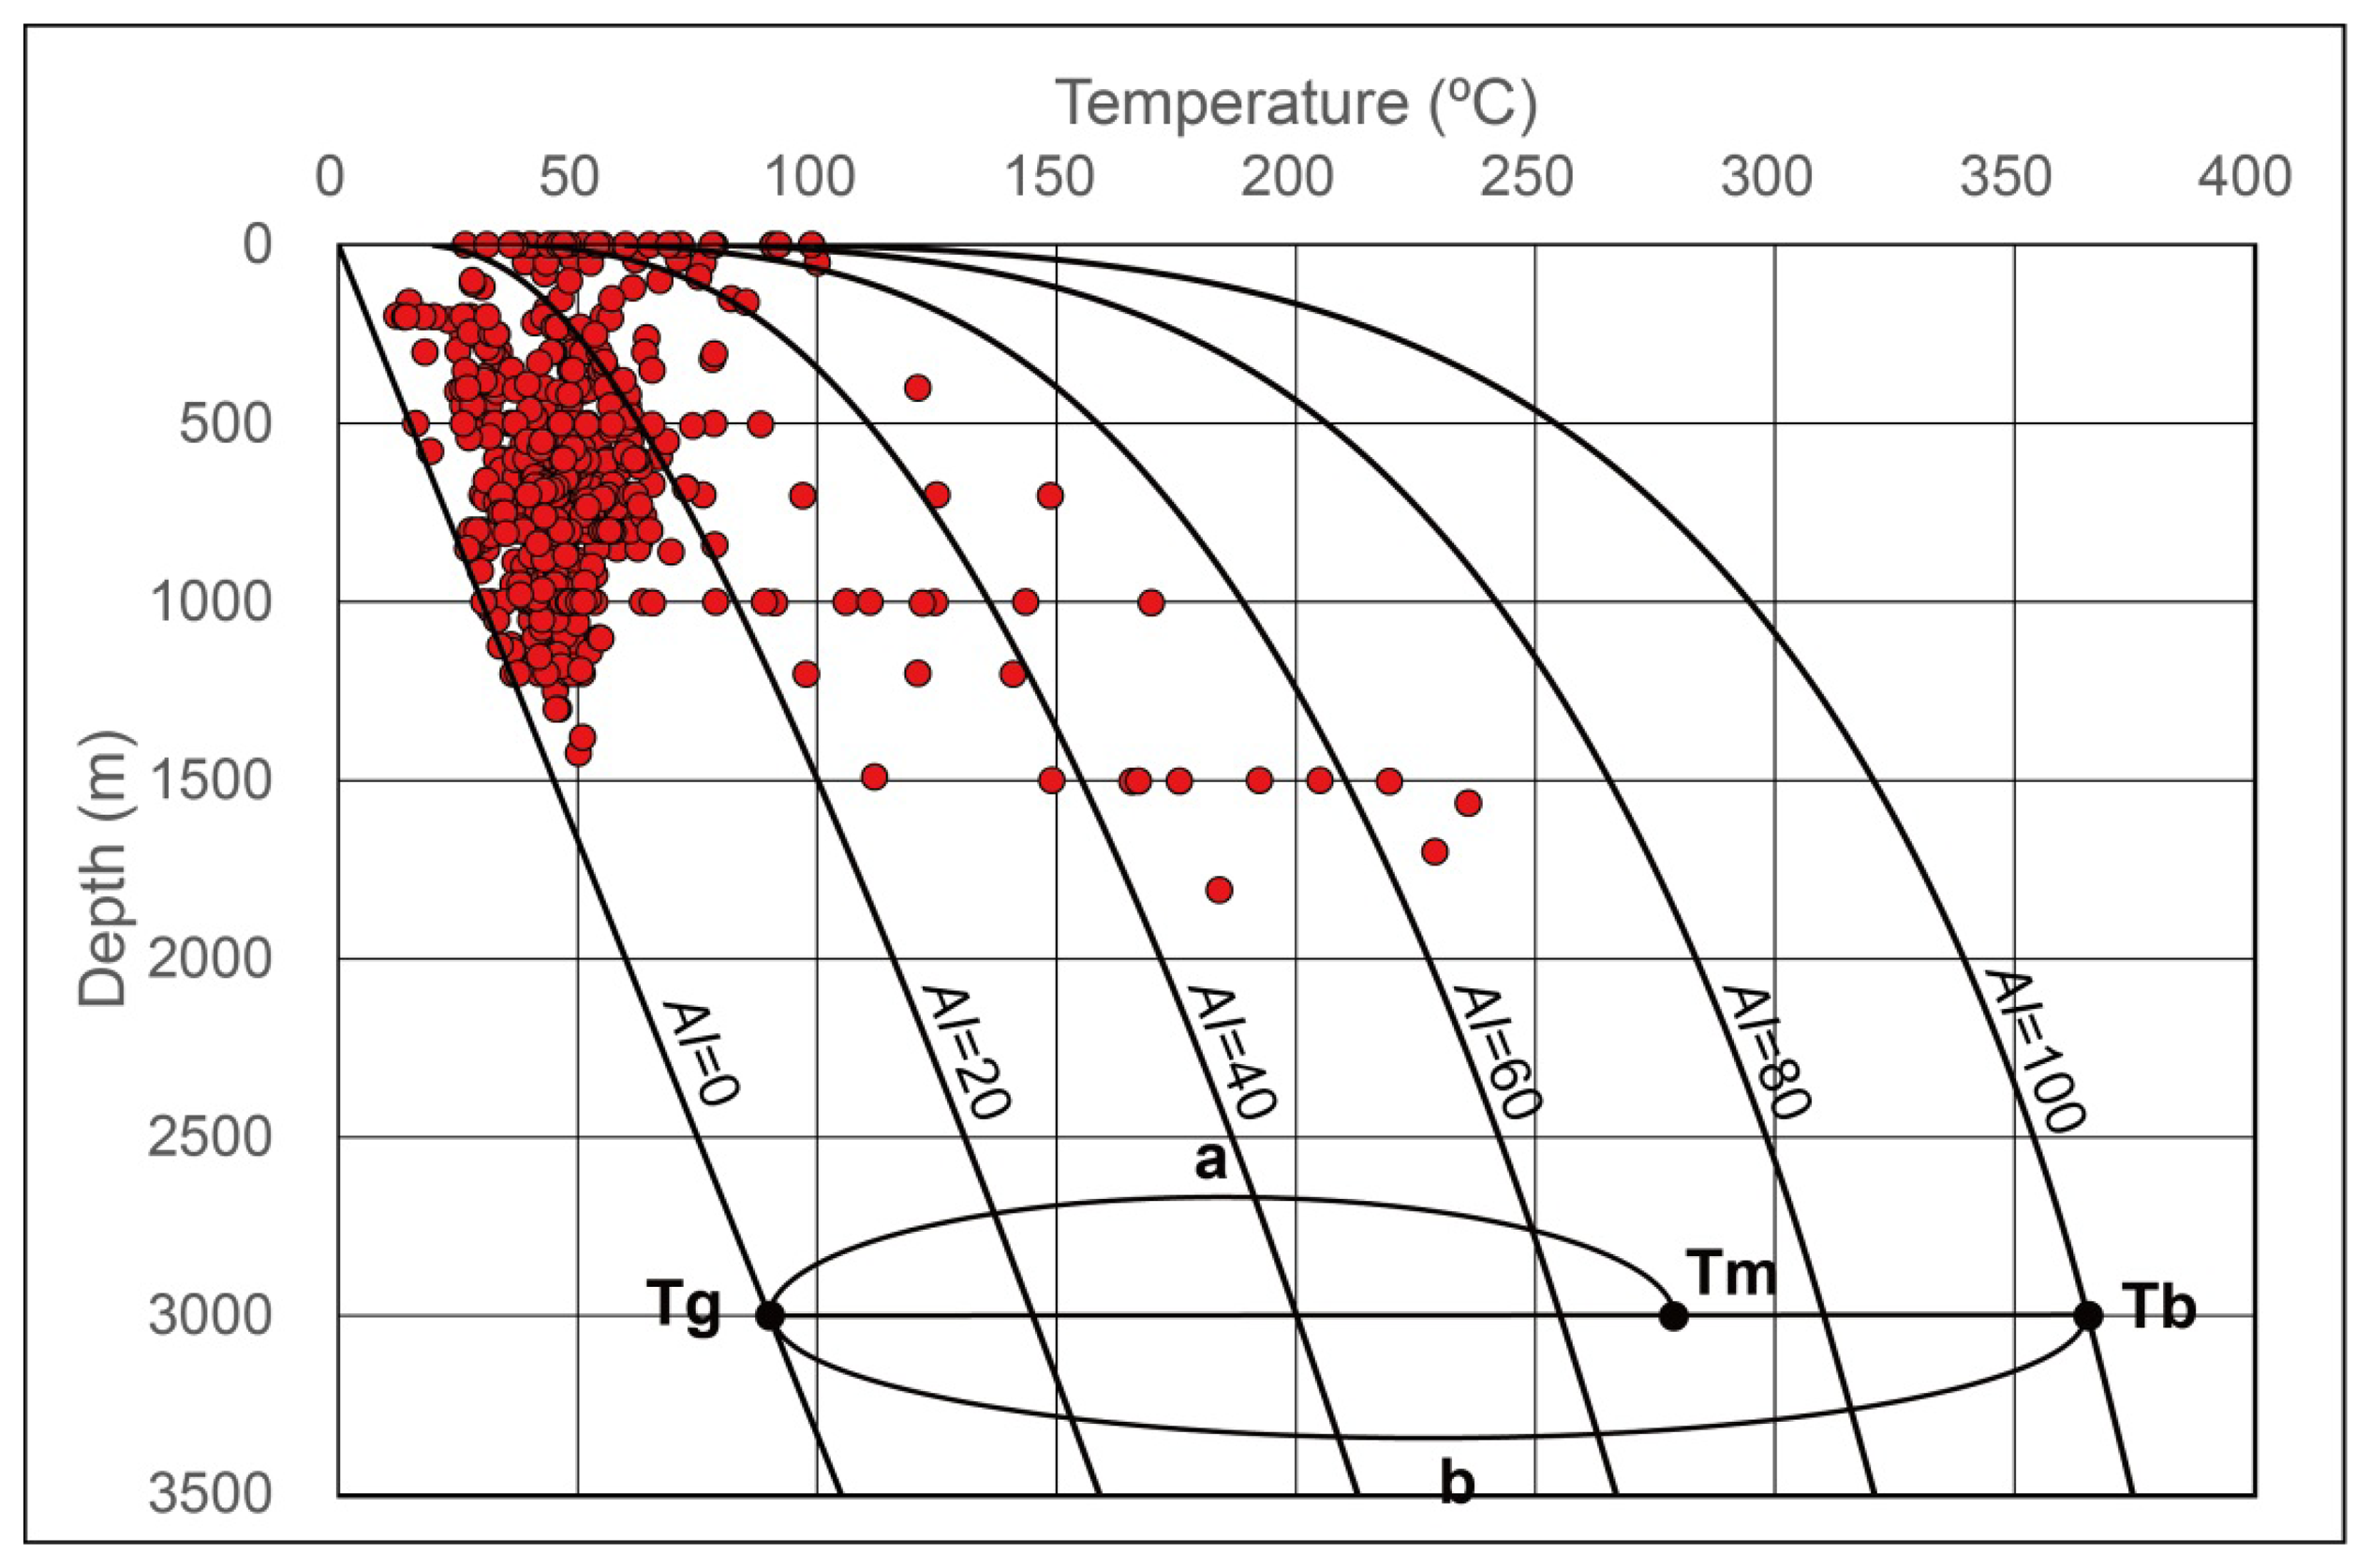
Determining accurate subsurface three-dimensional thermal structure is one of the ultimate goals on geothermal exploration. However, depth-temperature curves obtained by temperature logging in geothermal wells show usually complicated patterns due to the permeability variation of given geological formations with depth and three-dimensional geothermal structure that cannot easily be acquired. Then, normalization techniques for depth-temperature curves are necessary. One of the normalization techniques is the Activity Index originally proposed for evaluating temperature ranks of geothermal fields by Hayashi [6].
Geothermal exploration mainly concerns up-flow zones of the hydrothermal convection system rather than down-flow zones. The highest temperature curves in up-flow zones are normally limited by the boiling point temperature curve [7]. The lowest temperature curves are normally limited by the linear thermal conduction curve with an average continental geothermal gradient 30 °C/km. The Activity Index (AI) is defined by the following equation:
The AI 100 curve exactly coincides with the boiling point temperature curve of pure water and is here calculated in the approximation equation by Haas [7]. When the Activity Index can be determined at a given depth, we can extrapolate the normalized temperature curve to the arbitrary depth using the Equation (1) [6]. Therefore, we can easily plot the subsurface three-dimensional thermal structure by this normalization technique. When the temperature logging data are available, the borehole temperature is used as Tm at the given depth. However, only discharge temperature is available on most of hot spring wells. Tm was approximated by the discharge temperature on these hot springs. It is convenient that the discharge temperature in Celsius degree of natural hot springs at the ground surface can be adopted as the same numbers of AI as discussed by Hayashi [6]. As natural hot springs represent the surface manifestation of a hydrothermal up-flow, their temperatures tend to form a cluster around 100 °C. However, natural hot springs are only 26 pieces among the entire 536 hot springs in this database and no biases are found in the normalization by the Activity Index. Chemical geothermometry is useful to estimate reservoir temperatures, but we did not use the method because it does not provide the depth information. As a result, we can use 571 point data for AI mapping in Aomori Prefecture (Figure 2).
Pure water reaches a critical point temperature near the depth of 3500 m. However, the critical point of water dramatically shifts to the higher temperature with increasing salinity in the natural brine system so that we simply extrapolated the AI curves to the depth of 15 km. Then, we can plot the subsurface three-dimensional thermal structure of upper crust in Aomori Prefecture.
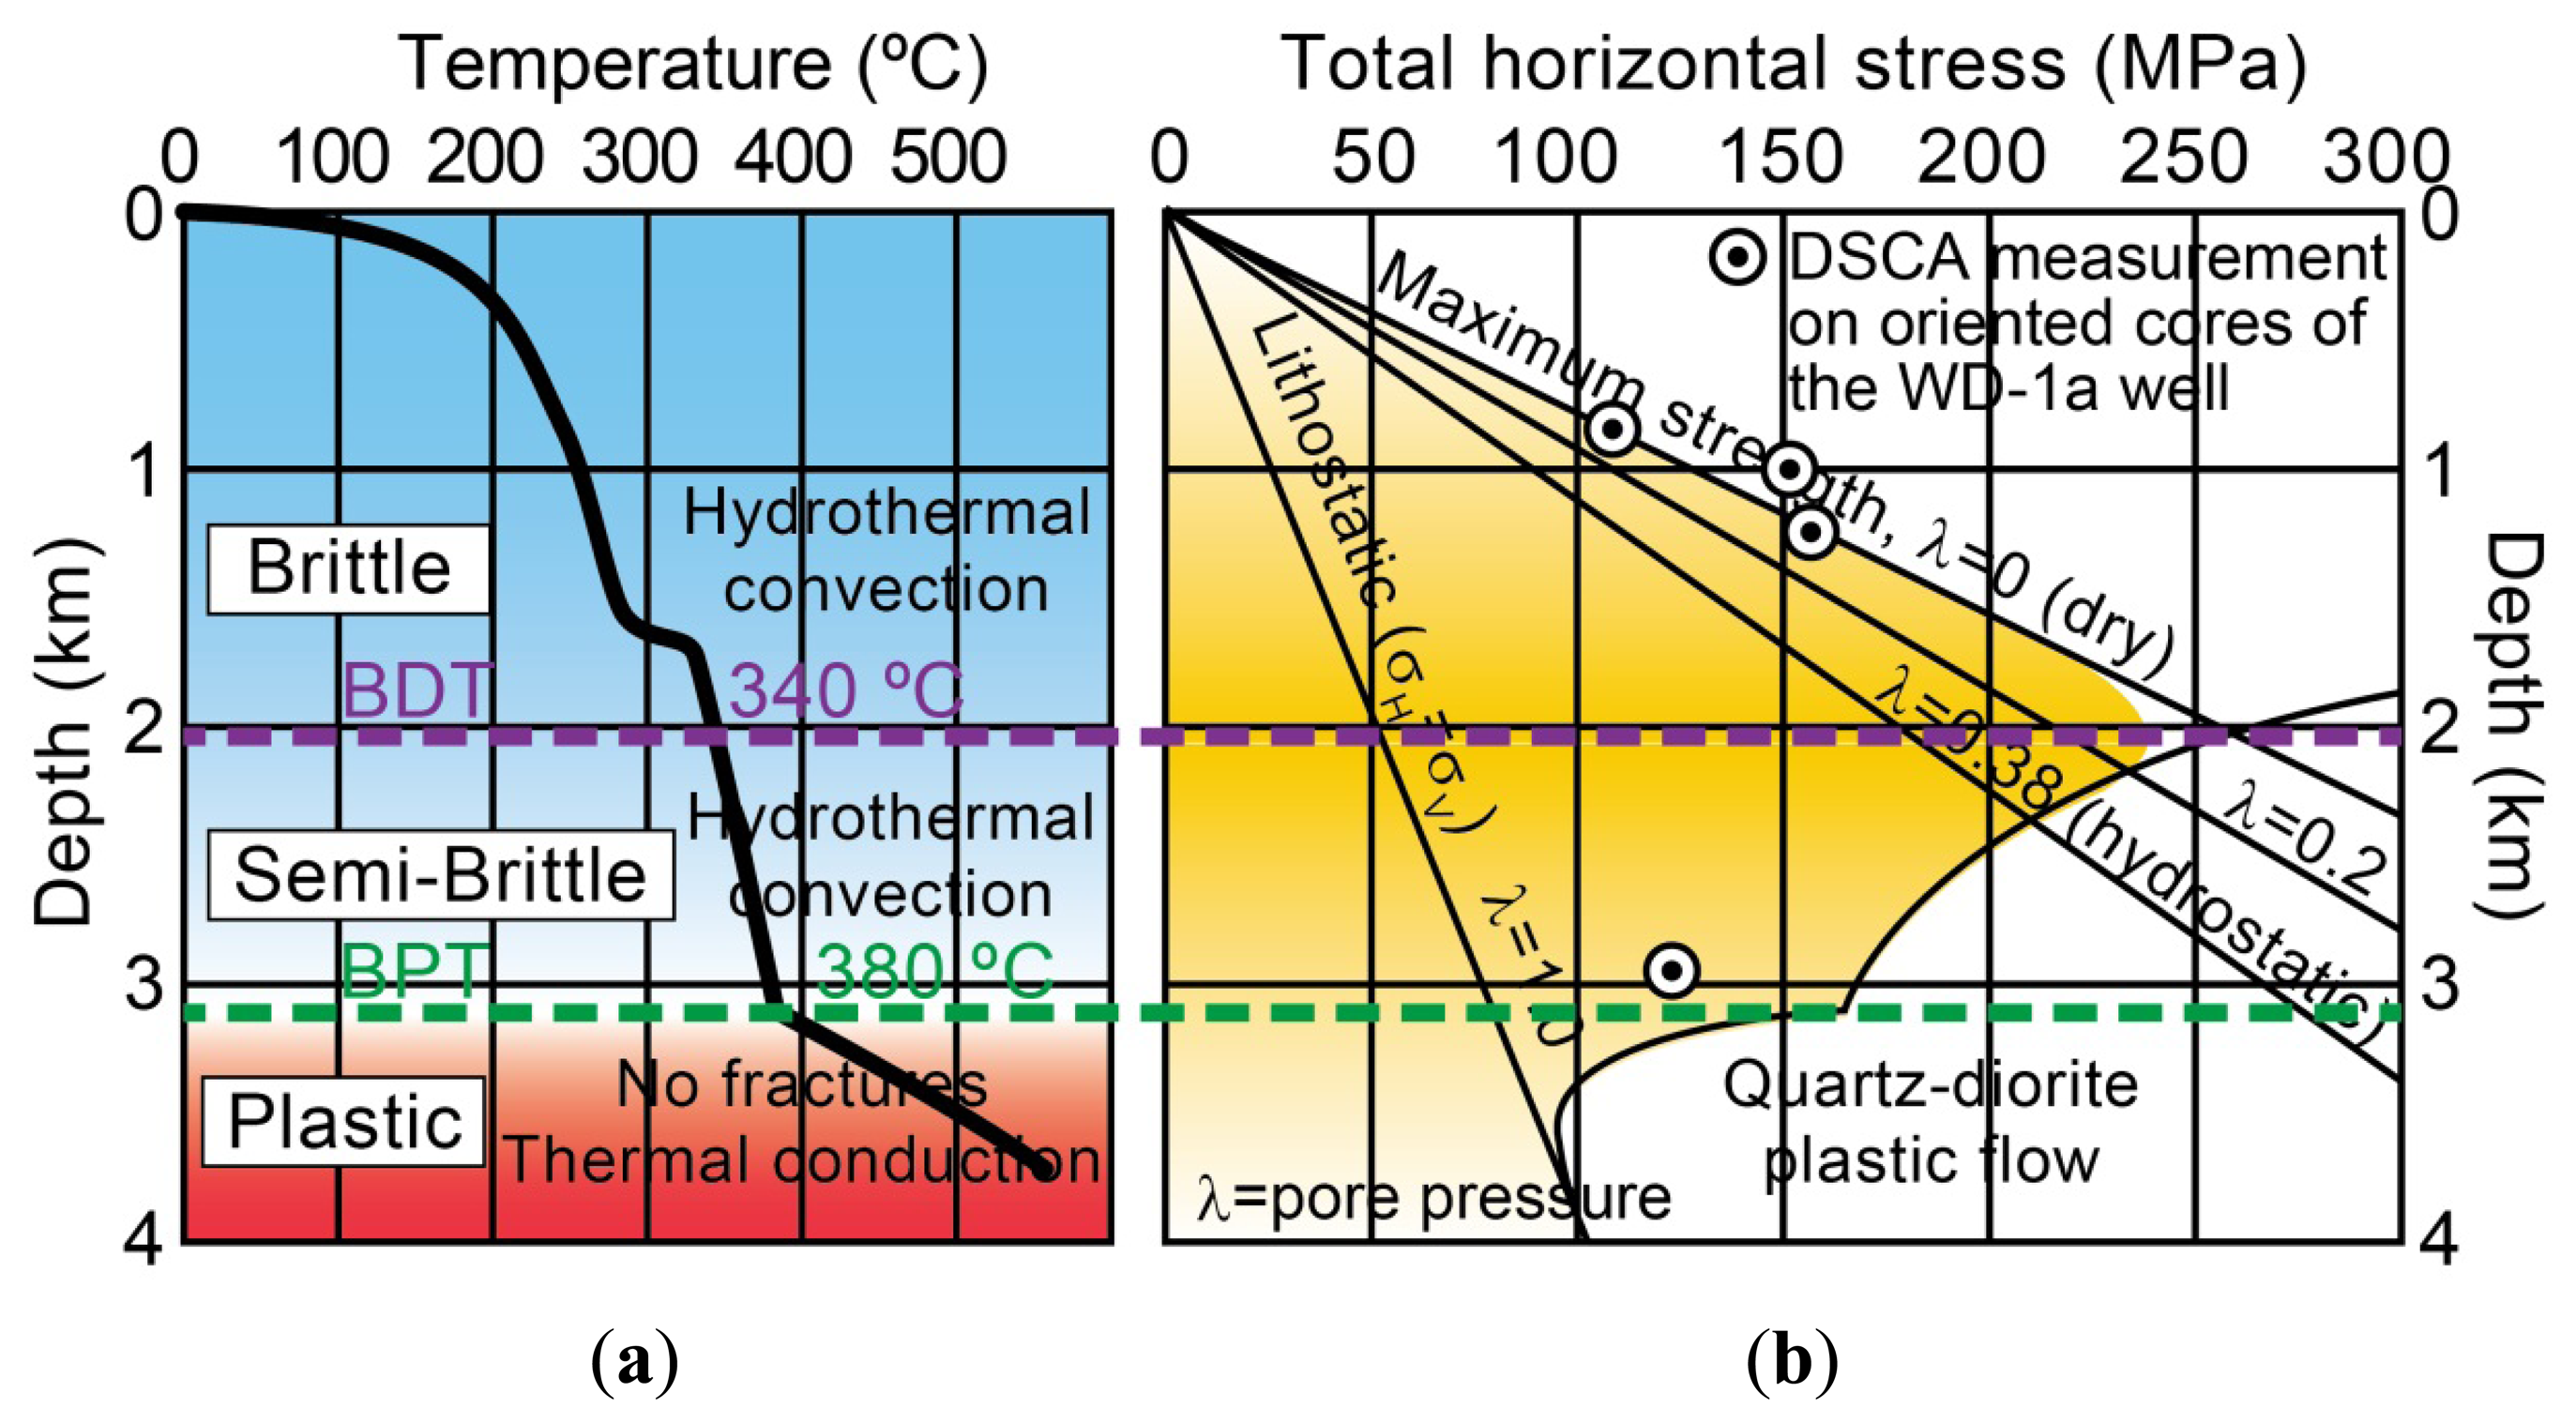
We here try to plot the brittle-plastic transition which is critically important to delineate the bottom surface of hydrothermal convection, particularly to extract the shallower apices of the isothermal surface associated with high-level magmatic intrusions. Deformed rocks within fault zones indicate that the transition from purely brittle to purely plastic deformation processes may occur over a relatively broad range of temperature and pressure [8]. This range is often denoted as a semi-brittle region between the brittle-ductile transition (BDT) and the brittle-plastic transition (BPT) [9]. For quartz and feldspar rich rocks in continental crust this range occurs at an approximate temperature in the range from 250 to 400 °C.
The temperature of the in-situ brittle-plastic transition in an actual borehole was too high to be measured by the conventional temperature logging tools but it was successfully measured by a variety of techniques in the well WD-1a which was drilled into the depth of 3729 m in the Kakkonda geothermal field, Iwate Prefecture, northern Japan in 1995 [10]. The bottom-hole temperature exceeded 500 °C (Figure 3) [10,11]. The temperature profile includes a temperature inflection point at 380 °C and at the depth of 3100 m where a boiling point curve above the depth shows a hydrothermal convection zone and a steep gradient thermal conduction curve below the depth shows a non-fracture and non-hydrothermal convection zones [10,11]. The temperature inflection point at 380 °C is thus considered to be the brittle-plastic transition (BPT) on granitic crust [12] (Figure 3). On the other hand, the maximum strength zone was estimated at the temperature 340 °C and at the depth of 2000 m by the high density of fractures, measurements of the differential strain curve analysis (DSCA) [13] on oriented cores and the theory of the strength envelope of lithosphere [12]. This maximum strength zone can be denoted as the brittle-ductile transition (BDT; Figure 3). The brittle-ductile transition (BDT) is important for a nest of earthquakes and fractures because of the preferred stress concentration on the maximum strength zone [12]. From a geothermal point of view, the brittle-plastic transition (BPT) is crucial because it is a bottom surface of seismicity, fracturing and hydrothermal convection.
Thus, the most reliable temperature of the brittle-plastic transition is 380 °C on granitic crust [10–12], and we tried to draw the depth of the 380 °C isothermal surface from the Activity Index. Figure 4 shows the calculated results of the assumed brittle-plastic transition. Most of the depth of the brittle-plastic transition showed deeper than 12 km below sea level. However, the prominent shallow depth anomalies coincide with the Quaternary clustered volcanoes such as Hiuchi-dake and Osore-zan in the Shimokita Peninsula to the north and Hakkoda-san to the south. The map is consistent with known prospective geothermal fields.
4. Discussion: Verification by Seismicity
Shallow-depth anomalies of the 380 °C isotherm are exactly consistent with the areas of the Quaternary volcanoes and their prospective geothermal fields (Figures 1 and 4). The shallowest apex is observed at a depth about 5 km in the Hakkoda-san clustered volcano area that seems not necessarily shallow as a magmatic heat source region. It is due to the regional-scale smooth contouring from the scarce random point data and 0.2 min (about 370 m) gridding. The map would provide the subsurface three-dimensional thermal structure and seems useful for subsurface geothermal assessments. However, further verification would be expected from a scientific point of view. To verify the reliability of the subsurface three-dimensional thermal structure on this map seismicity is useful because the seismic phenomenon is primarily independent from thermal phenomena.
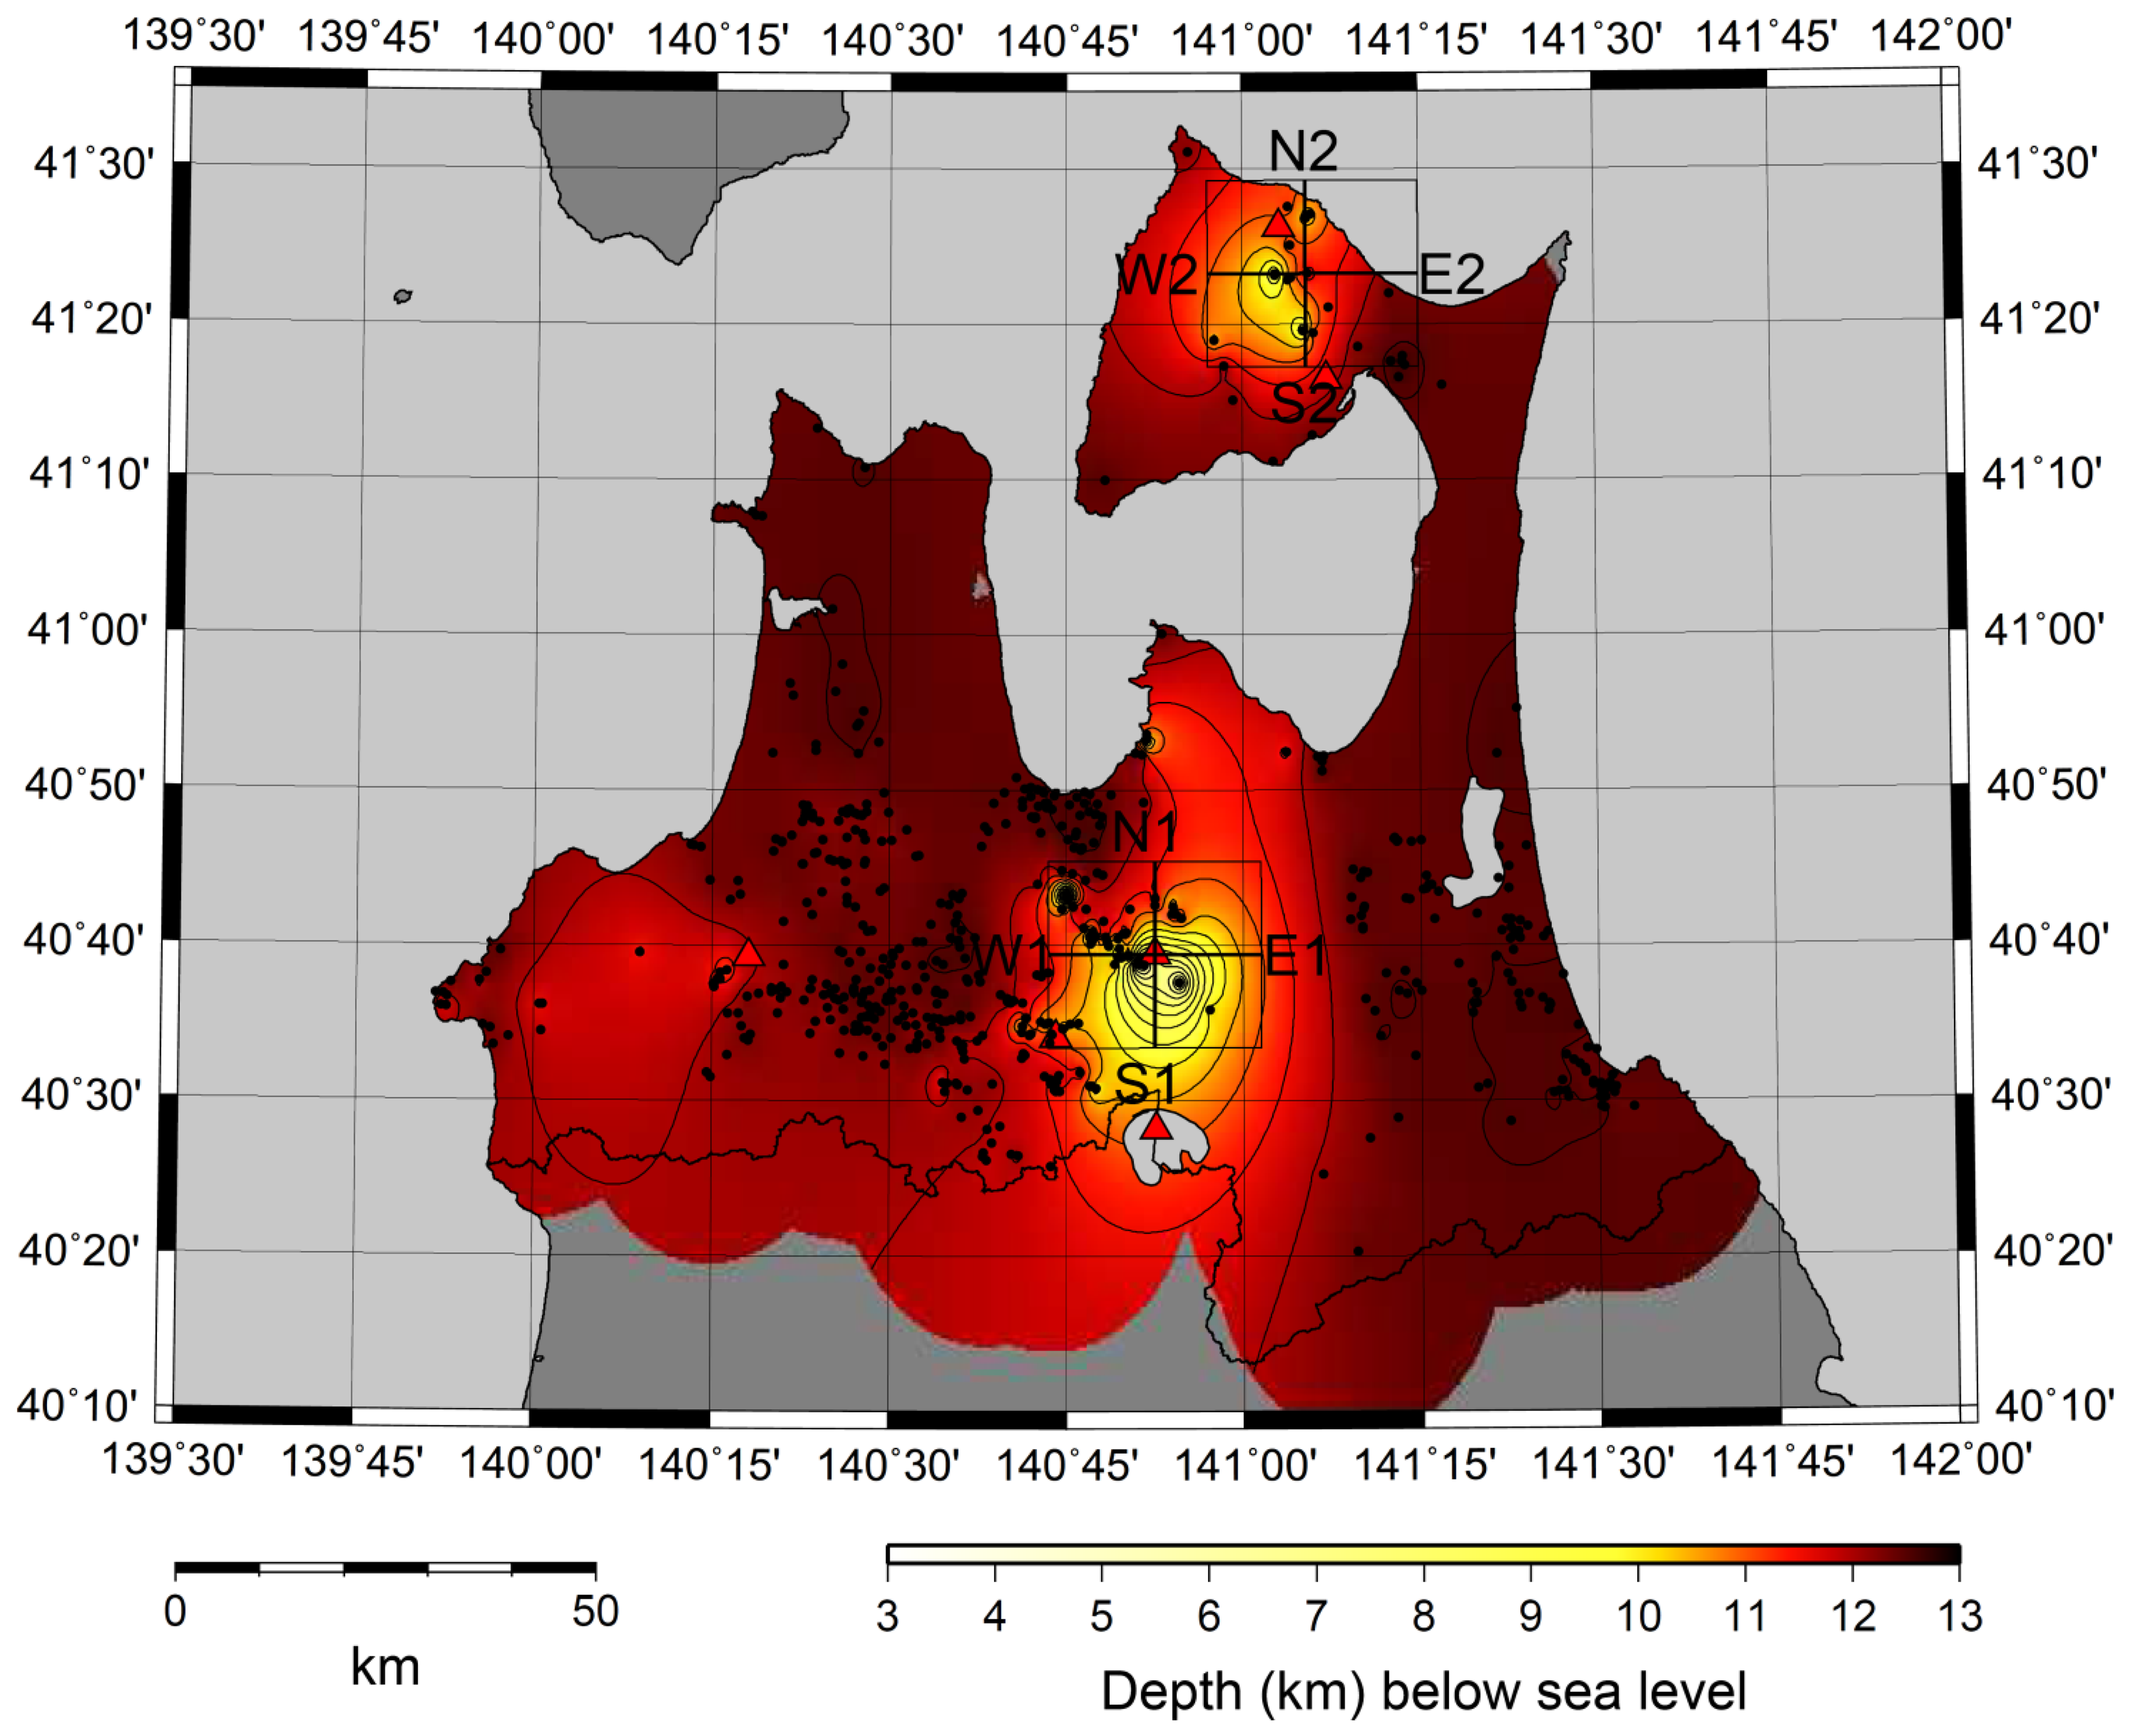
We used the earthquake catalog provided by the Japan Meteorological Agency (JMA) [14]. The JMA earthquake data were collected in Aomori Prefecture during the period from January 1990 to July 2012. As these data include deep subduction zone earthquakes, we selected earthquake data with their epicenters to be shallower than the depth of 20 km. To verify the reliability of the map (Figure 4), the spatial distribution of the earthquakes is compared with the thermal structure (Figure 5). The thermal point data such as wells and hot springs are restricted on the land areas. Therefore, we selected earthquake data on the land area too.
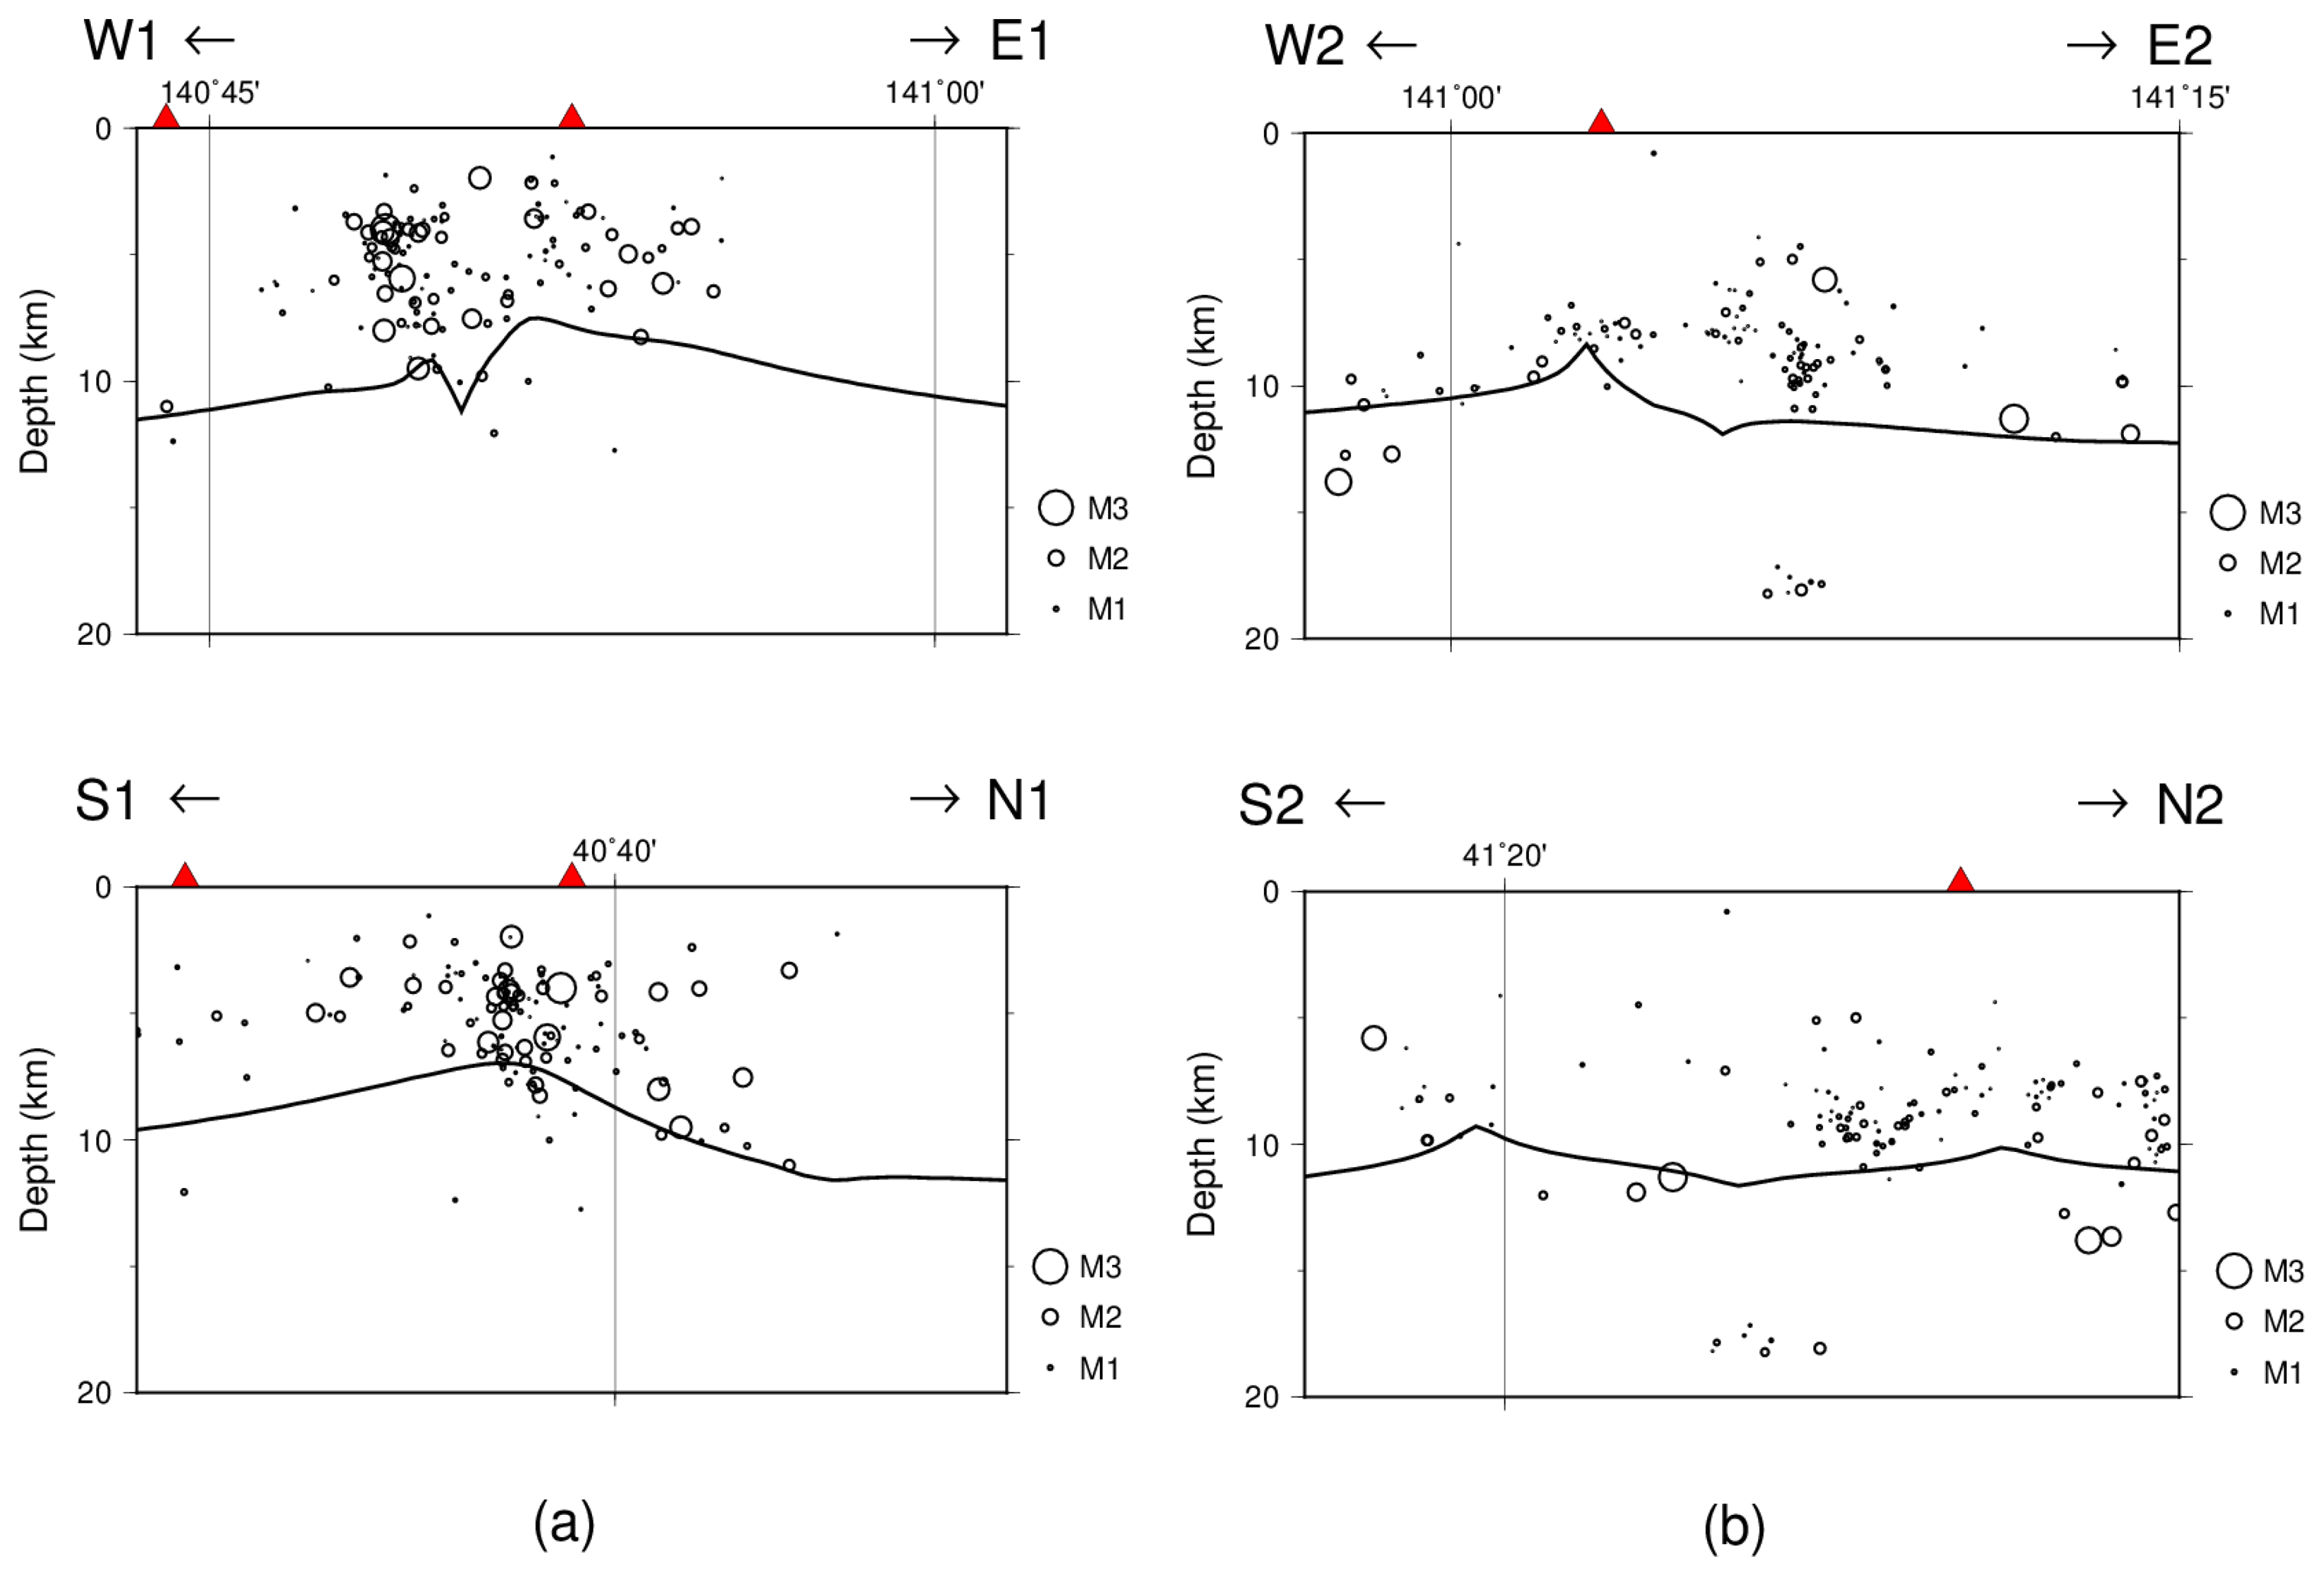
Figure 5 shows the estimated 380 °C isotherm produced from the Activity Index. Hakkoda volcano area and Shimokita Peninsula area show the prominent anomalies that are characterized by the dramatically shallower depth of the brittle-plastic transition than other areas. The bottom of the spatial distribution of seismicity shows the strong correlation to the 380 °C isotherm. This result indicates that the subsurface three-dimensional thermal map in Figure 4 is basically reliable. This result also suggests that the 380 °C isotherm strongly correlates to the bottom surface of seismicity, fracturing and hydrothermal convection. Geothermal database and the Activity Index are useful to draw the subsurface three-dimensional thermal structure.
5. Conclusions
Based on the geothermal database for available thermal data such as wells and hot springs in Aomori Prefecture, northern Honshu, Japan, depth-temperature curves were normalized by the Activity Index for three-dimensional extrapolation and a depth contour map of the 380 °C isotherm was plotted as an assumed brittle-plastic transition for granitic crust. Shallower-depth anomalies of the brittle-plastic transition on this map are closely coincident with the Quaternary volcanoes and their prospective geothermal fields. It should be noted that the bottom of the spatial distribution of seismicity in the volcanic fields shows strong correlation to the 380 °C isotherm. This result indicates reliability of the subsurface three-dimensional thermal map and suggests that the 380 °C isotherm strongly constrains the bottom surface of seismicity, fracturing and hydrothermal convection in granitic crust.
Acknowledgments
This work was supported by the Japan Society for the Promotion of Science (JSPS) Kakenhi (Grant-in-Aid for Scientific Research B) Grant Number 26281053. We thank the Japan Meteorological Agency (JMA) and the Ministry of Education, Culture, Sports, Science and Technology in Japan (MEXT) for providing the earthquake epicenter data. This paper benefited from the comments and suggestions of three anonymous reviewers.
Conflicts of Interest
The authors declare no conflict of interest.
References
- Ministry of the Environment, Japan. The State of Use of Hot Springs in Japan in the Fiscal Year 2012. Available online: http://www.env.go.jp/nature/onsen/data/riyo_h24_1.pdf (accessed on 1 May 2014). In Japanese.
- Wessel, P.; Smith, W.H.F. New, improved version of the generic mapping tools released. Eos Trans. Am. Geophys. Union 1998, 79, 579. [Google Scholar]
- Record of Hot Spring Geology in Aomori Prefecture; Department of Health and Welfare, Aomori Prefectural Office: Aomori, Japan, 1997; In Japanese.
- Muraoka, H.; Sakaguchi, K.; Tamanyu, S.; Sasaki, M.; Shigeno, H.; Mizugaki, K. Atlas of Hydrothermal Systems in Japan; Geological Survey of Japan, the National Institute of Advanced Industrial Science and Technology (AIST): Tsukuba, Japan, 2007; In Japanese. [Google Scholar]
- Geothermal Potential Map in Japan; Digital Geoscience Map GT-4 (CD-ROM; Geological Survey of Japan, the National Institute of Advanced Industrial Science and Technology (AIST): Tsukuba, Japan, 2009; In Japanese.
- Hayashi, M.; Taguchi, S.; Yamasaki, T. Activity index and thermal history of geothermal systems. Geotherm. Resour. Counc. Trans. 1981, 5, 177–180. [Google Scholar]
- Haas, J.L., Jr. The effect of salinity on the maximum thermal gradient of a hydrothermal system at hydrostatic pressure. Econ. Geol. 1971, 66, 940–946. [Google Scholar]
- Sibson, R.H. Fault rocks and fault mechanisms. J. Geol. Soc. Lond. 1977, 133, 191–213. [Google Scholar]
- Kohlstedt, D.L.; Evans, B.; Mackwell, S.J. Strength of the lithosphere: Constraints imposed by laboratory experiments. J. Geophys. Res. 1995, 100, 17587–17602. [Google Scholar]
- Ikeuchi, K.; Doi, N.; Sakagawa, Y.; Kamenosono, H.; Uchida, T. High-temperature measurements in well WD-1a and the thermal structure of the Kakkonda geothermal system, Japan. Geothermics 1998, 27, 591–607. [Google Scholar]
- Muraoka, H.; Uchida, T.; Sasada, M.; Yagi, M.; Akaku, K.; Sasaki, M.; Yasukawa, K.; Miyazaki, S.; Doi, N.; Saito, S.; et al. Deep geothermal resources survey program: Igneous, metamorphic and hydrothermal processes in a well encountering 500 °C at 3729 m depth, Kakkonda, Japan. Geothermics 1998, 27, 507–534. [Google Scholar]
- Muraoka, H. Geothermal Energy. In Handbook of Climate Change Mitigation; Chen, W., Seiner, J., Suzuki, T., Lackner, M., Eds.; Springer: Berlin, Germany, 2012; pp. 1325–1353. [Google Scholar]
- Strickland, F.G.; Ren, N.K. Use of differential strain curve analysis in predicting in situ stress state for deep wells. Proceedings of the 21st U.S. Symposium of Rock Mechanics, Rolla, MI, USA, 27–30 May 1980; pp. 523–532.
- Okada, Y.; Kasahara, K.; Hori, S.; Obara, K.; Sekiguchi, S.; Fujiwara, H.; Yamamoto, A. Recent Progress of Seismic Observation Networks in Japan—Hi-Net, F-Net, K-NET and KiK-net. Earth Planets Space 2004, 56, 15–28. [Google Scholar]


© 2014 by the authors; licensee MDPI, Basel, Switzerland. This article is an open access article distributed under the terms and conditions of the Creative Commons Attribution license ( http://creativecommons.org/licenses/by/3.0/).
Share and Cite
Suzuki, Y.; Ioka, S.; Muraoka, H. Determining the Maximum Depth of Hydrothermal Circulation Using Geothermal Mapping and Seismicity to Delineate the Depth to Brittle-Plastic Transition in Northern Honshu, Japan. Energies 2014, 7, 3503-3511. https://doi.org/10.3390/en7053503
Suzuki Y, Ioka S, Muraoka H. Determining the Maximum Depth of Hydrothermal Circulation Using Geothermal Mapping and Seismicity to Delineate the Depth to Brittle-Plastic Transition in Northern Honshu, Japan. Energies. 2014; 7(5):3503-3511. https://doi.org/10.3390/en7053503
Chicago/Turabian StyleSuzuki, Yota, Seiichiro Ioka, and Hirofumi Muraoka. 2014. "Determining the Maximum Depth of Hydrothermal Circulation Using Geothermal Mapping and Seismicity to Delineate the Depth to Brittle-Plastic Transition in Northern Honshu, Japan" Energies 7, no. 5: 3503-3511. https://doi.org/10.3390/en7053503