Optimal Charging Scheduling of Electric Vehicles in Smart Grids by Heuristic Algorithms


Abstract
: Transportation electrification has become an important issue in recent decades and the large scale deployment of electric vehicles (EVs) has yet to be achieved. The smart coordination of EV demand addresses an improvement in the flexibility of power systems and reduces the costs of power system investment. The uncertainty in EV drivers' behaviour is one of the main problems to solve to obtain an optimal integration of EVs into power systems. In this paper, an optimisation algorithm to coordinate the charging of EVs has been developed and implemented using a Genetic Algorithm (GA), where thermal line limits, the load on transformers, voltage limits and parking availability patterns are taken into account to establish an optimal load pattern for EV charging-based reliability. This methodology has been applied to an existing residential low-voltage system. The results indicate that a smart charging schedule for EVs leads to a flattening of the load profile, peak load shaving and the prevention of the aging of power system elements.
1. Introduction
Transportation electrification has become an important issue in recent decades mainly because of the potential for reducing energy consumption [1]. It should be noted that in Spain 41% of total energy produced is consumed by the transportation sector [2]. Several targets related to greenhouse emission footprints, oil dependence and costs and integration of renewable energy must be reached by incorporating EVs [3]. Moreover, improvements in battery technology and significant reductions in EV costs have led to an increase in the number of EVs incorporated into systems [4,5].
EVs are treated as a new moving load (grid-to-vehicle, or G2V) with storage availabilities (vehicle-to-grid, or V2G) in power distribution networks [6]. These moving demands have significant influence on power networks even if large scale EV demand is not accommodated in a suitable way [7,8]. An EV can be considered a flexible load that can be charged throughout the day instead of following a rigid charging schedule [9,10]. The flexibility of the EV demand will improve the operation of power systems in terms of flattening the load curve on main substation transformers, providing, in addition, peak shaving services, reduced power system losses, reduced aging of transformers and lines, and increased renewable energy penetration [11] as well as providing financial support [9–18]. In an uncontrolled, or “dumb”, scenario, EVs should be charged when the owner arrives at his home [16,19]; however, potential problems such as sudden peak demand or sudden overloading could be shaped or flattened by using a smart charging schedule for the EV's batteries [20]. Moreover, the optimal scheduling of EV battery charging could allow high EV penetration without requiring any upgrades to the existing electricity infrastructure [21] (cables and transformers), thereby reducing investment expenses. Optimal scheduling also offers the possibility of managing EVs as V2G [19,22–24], providing ancillary services to network operators [25]. The optimisation of EV charging is a demand-response strategy that must be incorporated into Demand-Side Management (DSM) and implemented by a EV aggregator to improve the flexibility of the distribution network [9].
A number of studies were performed on the impact of EV integration into power systems [26–29]. A study shown in article [27] attempted to maximise the amount of energy that can be delivered to all the EVs in a fixed period of time taking into account network technical limits and using a linear programming methodology. However, the behaviour of electric vehicle users is not considered in the formulation of the problem. In reference [28], a direct load control management technique is developed to maximise the net energy supplied to the batteries and simultaneously minimise the total energy cost by incorporating charging patterns of a plug-in electric car; however, the technical network limits are not included in the problem formulation. In [29], the authors use the coordination of EV charging by considering EVs as distributed energy resources to smooth the load profile. Although they include a mobility pattern in their study, it should be noted that the mobility profile is not a realistic one and simply leads to theoretical results. Another research study [14] developed a smart load management framework for plug-in electric vehicles (PEVs) based on peak demand shaving, obtaining, concurrently, an improvement in the voltage profile and minimising power losses. The study was performed by taking into account the PEV owner's preferred fixed charging periods. The authors of reference [12] coordinated the charging of EVs to maximise the use of renewable energy in the transportation sector. Furthermore, they consider stochastic driving patterns and employ simple linear programming.
In [16], a GA drives the charging process to minimise the impact on peak load avoidance, parking availability and the charging control. Shaaban and Saadany [30] implemented the optimal charging of EVs using GAs and incorporated only light-duty fleet users' behaviours without considering peak load shaving in their formulation. In this paper, a different EV charging optimisation will be used to fill existing gaps such as the necessity to consider realistic driving patterns as well as the various charging characteristics and different vehicle penetration levels into low-voltage networks. The objective of this study is to utilise the EV demand to smooth the load profile and to reduce and prevent the aging of transformer substations and distribution lines. The main contributions of the paper are as follows:
The application of a novel optimisation method based on GAs for the demand side management of EVs in low-voltage distribution networks from a Spanish electricity distribution company (Unión Fenosa Distribución, Madrid, Spain).
A model of a 24-hour electric vehicle charge pattern obtained from a Spanish survey of vehicle drivers' behaviour.
First, different EV penetration scenarios into low-voltage residential networks have been considered to address the impact of EVs on distribution networks. Second, electric vehicle user behaviour constraints that are based on real-world driving mobility in Spain are considered in the optimisation algorithm. Third, the potential to charge EVs during non-consecutive hours, throughout the period permitted for charging the EVs, by means of interrupted charging are included in the optimisation process to develop a more comprehensive approach. Finally, a GA, implemented in MATLAB® (Natick, MA, USA), is used to develop the smart schedule for EV charging instead of using deterministic models that are widely used [18]. Many optimisation problems can be solved by linear programming and other deterministic algorithms. However, when the dimension of the problem becomes large, linear programming algorithms cannot address the problem in a reasonable amount of time, and in many cases such as the one discussed in this paper, it is not an appropriate approach [31].
The structure of the paper is as follows: mobility patterns are developed in Section 2 according to Spanish users' behaviour. Section 3 focuses on the EV charging model. The smart charging methodology and the GA implementation are developed in Section 4. Studies and results of the smart charging model for low-voltage topologies are presented in Section 5. Finally, the conclusions are given in Section 6.
2. Electric Vehicle User Behaviour
One of the main problems related to EV integration into distribution power networks is predicting the mobility behaviour of the EV, which depends on each individual EV driver [30]. To meet the total EV charging demand in a way that enhances the load profile, it is necessary to develop a parking availability pattern that lets the smart grid aggregator determine the possible scheduling of EV charging.
In this study, a survey of vehicle user behaviour, MOVILIA (Encuesta de Movilidad de las Personas Residentes en España) [32] carried out by the Spanish Ministry of Industry (Madrid, Spain) is used to determine the parking patterns of vehicles for each topology of this study. MOVILIA provides information about the type of trip (trips to work, for shopping, leisure, etc.) and the duration of the trip. The MOVILIA results focus attention on periods related to work that correspond to the majority of the trips.
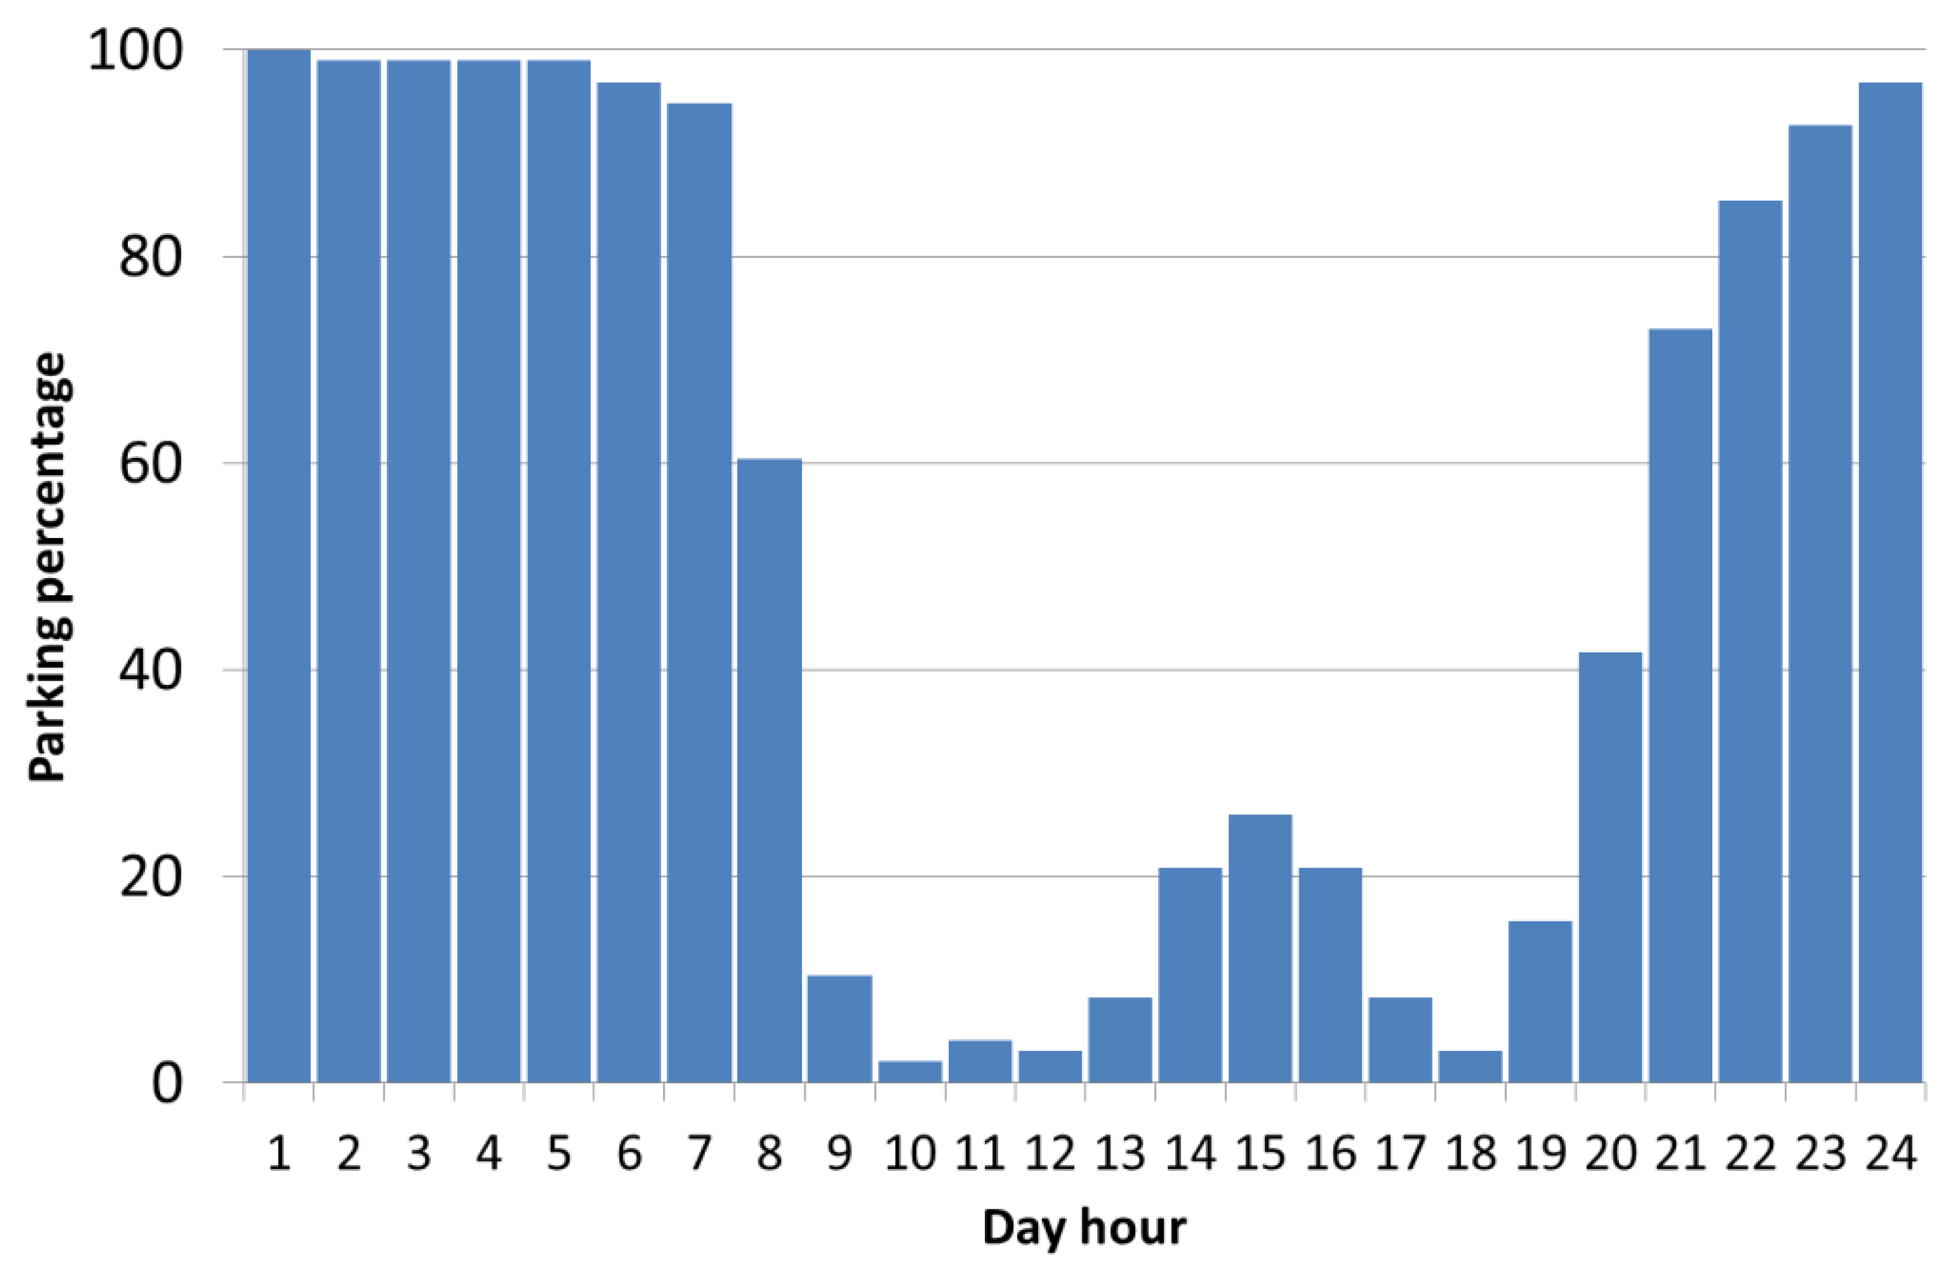
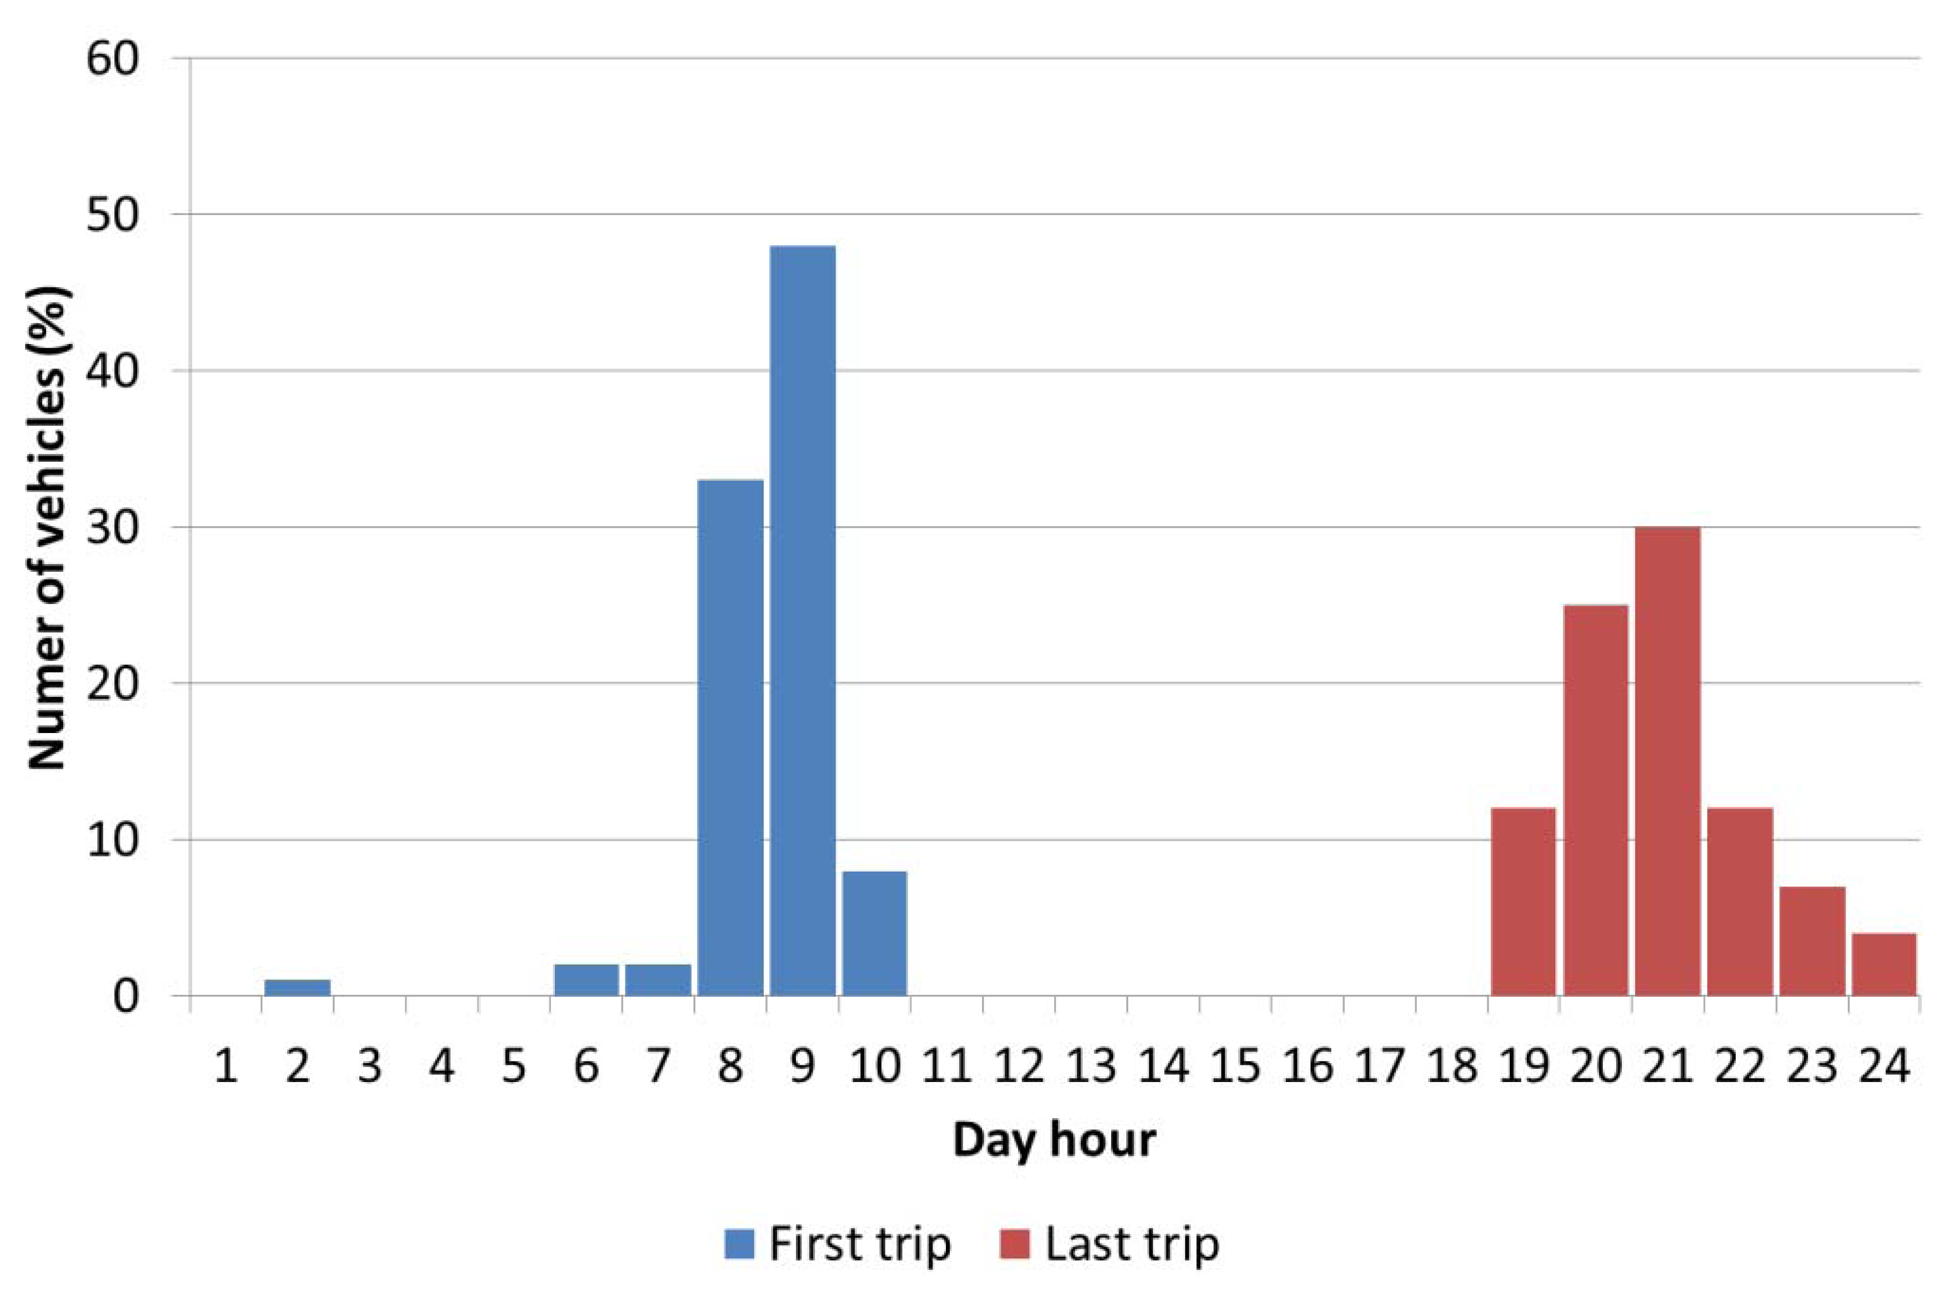
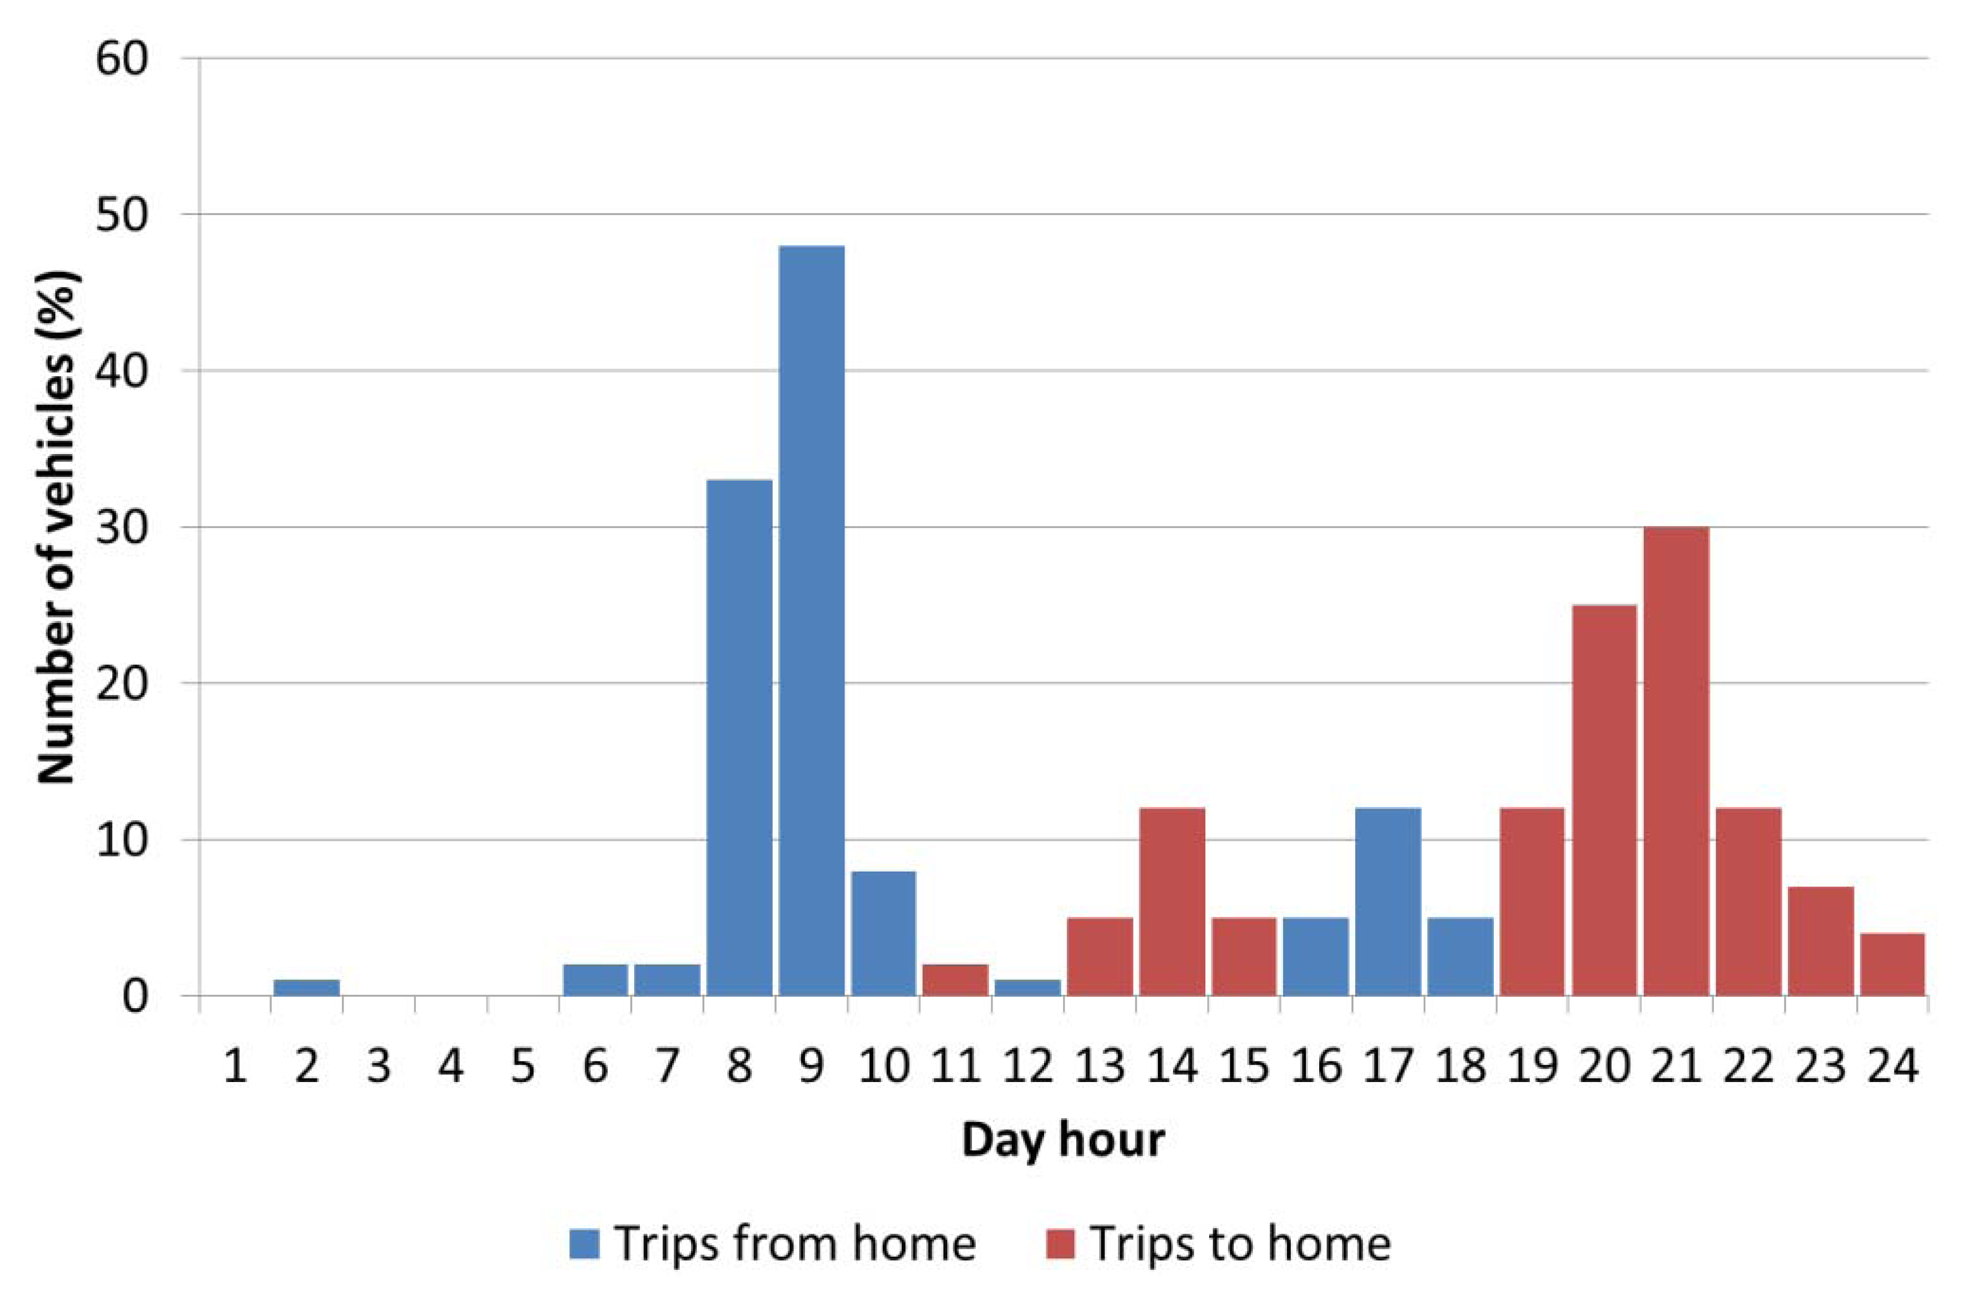
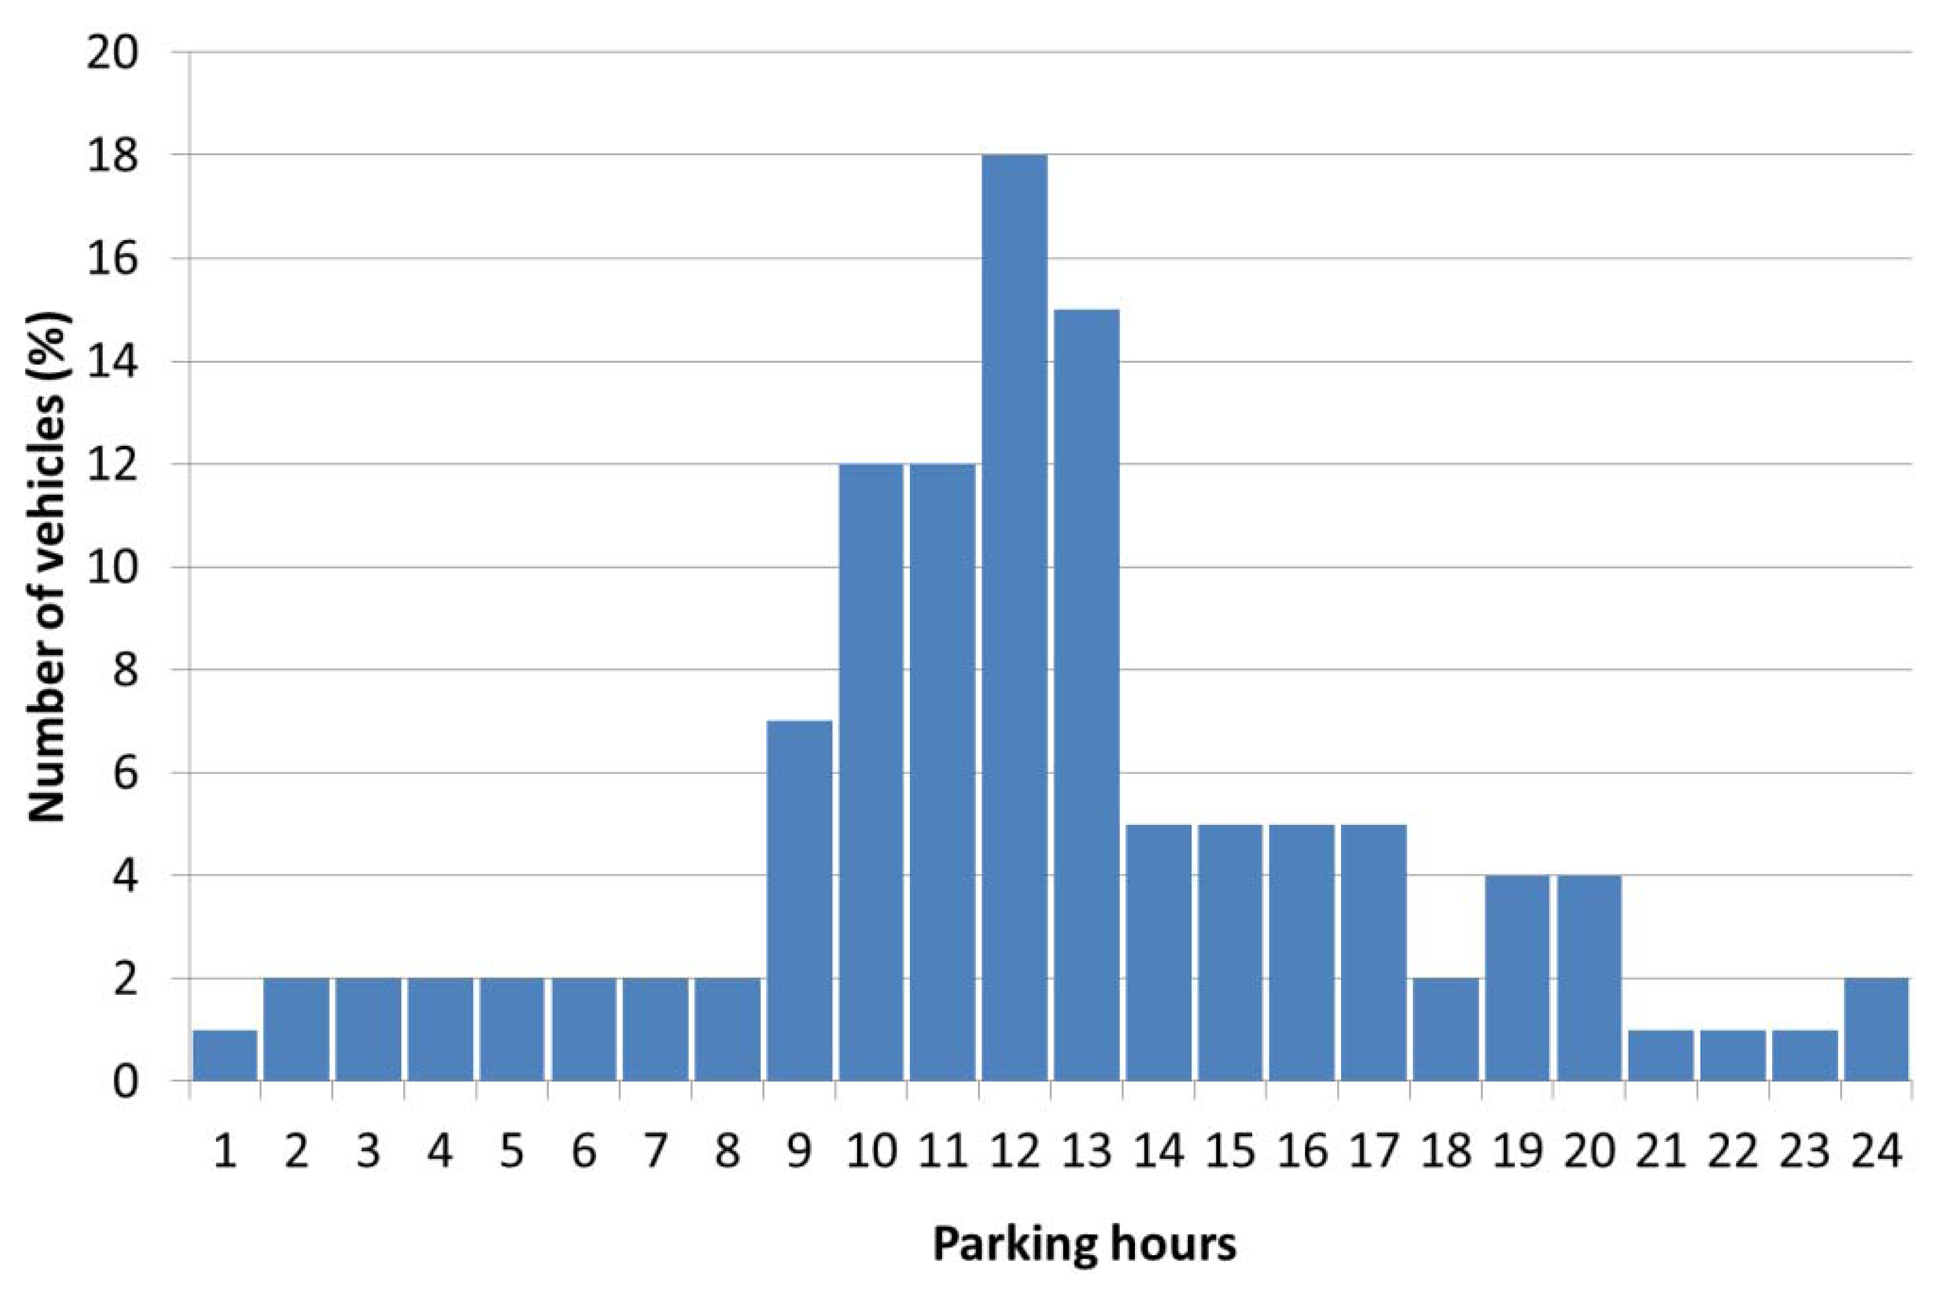
MOVILIA distributes the trips in a typical day into eight categories: trips from/to home, movements from/to work, leisure trips, shopping trips, accompany trips, trips to/from school or study centres, visiting friends/family and others. By extracting the trips suitable for the residential topology (trips from/to home), it becomes possible to estimate the periods of the day that the EV is plugged-in at home. Figure 1 shows the hourly statistical distribution for the first and last trip from/to home. According to Figure 1, it should be noted that Spanish vehicle users leave home between 8:00 and 10:00 in the morning (first trip of the day), which corresponds to the beginning of business activity, and return home between 19:00 and 24:00 (last trip of the day). In Figure 2, all the vehicle trips during a working day are shown. Taking into account the previous data, Figure 3 shows the number of hours that vehicles are parked at home during the day. As shown, 18% of EVs are parked at home and connected to the grid for 12 h, and only 2% of EVs are parked 24 h per day. Finally, the number of EVs parked at home and available to be charged hourly, or the parking pattern, is shown in Figure 4. These results show that that 98% of EVs are parked at home at 2:00, whereas only 2% of EVs are parked at home at 10:00. Comparing the first and last hour of the day, Figure 4 shows that at 24:00, only 96% of EVs have returned home, which means that the last trips of 2% for EVs take place between 24:00 and 1:00. The parking pattern of a residential low-voltage network can be obtained by taking into account the percentage of EVs that could be parked at home for each of the 24 h in a day, which is related to the total number of available EVs connected to the network. EVs are mainly parked at home between 19:00 and 7:00, and it should be noted that EVs finish arriving home at 1:00 instead of at 24:00.
3. Electric Vehicle Battery Charging
The electrification requirements of the transportation sector are not very significant at the moment. For this reason, we use 2020 as the target year because this is when the number of EVs on the road is expected to be higher [17].
EVs can be modelled as mobility loads whose main characteristics are charging time, power demand and the rate of charge [33,34]. In a dynamic analysis, such as EV control, dynamic models of the EV batteries must be considered [16] where EV batteries can be approximated by a voltage source VOC in series with an equivalent constant resistance of the battery cell Ri in which the active power characteristic of the EV battery represents the charging process. However, for planning and scheduling purposes, we consider that the EV aggregator manages the EVs' distributed storage batteries to provide DSO the required flexibility of services. To accomplish this, the EV aggregator receives the information on the initial State-Of-Charge (SOCinitial) of the EV batteries for each of the 24 h in a day. It is assumed that the SOC of each battery must be between a maximum (SOCmax) and minimum level (SOCmin). In this paper, it is considered that EV aggregator performs the optimal scheduling using the following data from the EV charging station: time of connection; initial state of charge; actual state of charge (SOC); final state of charge; type of vehicle and customer charging mode as it is defined in the Standard ISO/IEC 15118 [35]. Additionally, a typical value of battery charger efficiency of 90% is considered in the EV energy demand from the grid.
For each of the charging periods, a PEV charges until its desired state of charge (SOC) is reached Equation (1):
Several EV charging infrastructures (currents and grid connection types) are described in the International Standard IEC 61851-1 [36] as shown in Table 1. Charging Mode 1 is the most preferred charging infrastructure followed in residential distribution networks mode, which corresponds to a slow charging rate of 3.7 kW, mainly because EV drivers have enough time for a slow charge (four to eight hours, depending on the charge level) [15], and it is the most suitable method for domestic environments [32].
4. Smart Charging Scheme: Problem Formulation
The scheduling of EV load demand is an important issue for current power networks [37,38]. Several charging schemes have been developed during recent years that can be classified into four categories: dumb charging schemes (the EVs charging starts just when they are plugged-in at home), conventional controlled charging schemes (the charging process is time-delayed to avoid peak demand periods), smart charging schemes (a G2V charging scheme is determined by an intelligent algorithm to improve the operation of the power network) and V2G-G2V charging schemes (the charging and discharging of EV batteries are controlled to optimise power system operation).
This study focuses on an optimal EV charging strategy to flatten the load profile of the transformer substation of the distribution network; in addition, peak demand shaving and technical network limits are considered. To achieve this goal, it must be considered that all the EV load requirements must be supplied according to the parking patterns developed in Section 2 and must take into account technical network constraints, such as thermal limits of cables and voltage violations at buses.
A 24-hour load demand profile of a residential network and the low-voltage network topology are used as input data in the optimisation problem. The decision parameters are the EV charging demand that might be used for each of the 24 h. In this study, a slow charging connection is considered because it is the normal charging infrastructure installed in residential power networks. The result of the study is a 24-hour optimal EV batteries power charging schedule.
4.1. Objective Function
The goal of the optimisation problem is to obtain the daily optimal scheduling of EV demand to flatten the loading profile of the transformer substation. The loading profile at the transformer corresponds to the addition of a residential load demand for each house connected to the network and a total EV hourly demand. To level the load profile of the whole system and avoid the deviation of the load between consecutive hours, it is necessary to develop an optimal schedule of EV charging to fill the gaps of the residential load profile during periods of lower load demands and avoid charging EVs during peak load hours. To achieve this, the objective function is given as a measure of main transformer load profile deviation between consecutive hours Equation (2):
4.2. Constraints
The constraints of the optimisation problem are organised into several categories.
4.2.1. Parking Patterns
The optimal scheduling of EV battery charging must utilise the availability of the EVs at the Customer Point Of Connection (CPOC) Equation (3). The parking patterns developed in Section 2 show the possible hours of connection for EVs to be charged. Every hour, the parking availability of the EV must be checked to assess the available EV demand:
4.2.2. EV Demand
The energy demand of EVs that must be accommodated in the study's framework depends on the number of EVs connected to the power system, the size of the battery, SOCmax and the SOC of the battery when the user arrives at home from the last trip (SOCinitial) Equation (4). The SOCinitial is transferred from the EV to the CPOC and is subsequently registered by the EV aggregator. It is considered that all the energy demand of the EV batteries must be covered throughout the 24 h charging process:
Moreover, the SOC of the battery of each EV must be within the limits in every step of the simulation Equation (5):
When the SOCmax is reached, the EV charging is complete. SOCmin is limited by the maximum Depth of Discharge (DOD). Under normal operating conditions optimum DOD should not be discharge above 80% of the rated battery size (typically SOCmin ≈ 0.2).
4.2.3. Power-Flow Constraints
Basic equality constraints correspond to the power-flow equations for every bus Equations (6)–(9):
4.2.4. Charging Constraints
To improve the power system operation, the peak transformer substation load demand must not be exceeded after adding EV charging/discharging Equation (10) energy to the residential electricity demand. Dumb, conventional controllable charge and smart charging approaches are included as constant power loads in the power flow and correspond to EVdemandG2V (h) in Equation (10). G2V + V2G options add a new term in Equation (8) that corresponds to the energy injected to the network by EV(EVgenerationV2G (h)):
4.2.5. Network's Technical Limits
The voltage levels in buses are not allowed to fall outside the maximum and minimum limits according to the grid voltage regulation Equation (11):
The thermal limits of network components corresponding to the ratio of the apparent power flowing though the lines and the main transformer substations must be taken into account during the optimisation process. These constraints are summarised in Equations (12) and (13):
4.3. GA Implementation
In recent decades, intelligent algorithms have been applied to address complex, real-world power system optimisation, which involves a large number of possible solutions [39,40]. The application of evolutionary algorithms, such as GAs, has received considerable attention because of the difficulty of extending conventional optimisation techniques to those types of problems [32] and assessing the problem in near real time. For this reason, GAs appear to be an acceptable algorithm for smart charging scheduling of PEV [37,41].
Genetic algorithms (GA) are a family of computational optimisation models developed by Holland [42] and first implemented by Hopgood and Goldberg [43] to solve both constrained and unconstrained optimisation problems. GAs are based on natural evolution processes, which can be deduced from the employed operators that are clearly inspired by natural sequences and from the main driver of the GA, which would be defined as a biological selection. One of the main advantages of GAs is that they work with a set of possible solutions, called the population, that will be modified at each stage (generation) of the algorithm based on a genetic operator. The algorithm evolves to a new generation of individuals by executing reproduction, mutation and crossover operations among the individuals of this population. The main advantages offered by GAs over conventional optimisation algorithms are as follows [44]:
GAs do not require initial information about the system to begin the searching process because they work only with coding (chromosomes), which will be optimised according to the objective functions and the proper constraints.
The algorithms can explore various regions in the search space simultaneously by using multiple points of the population and iterative characteristics. This represents one of the most important distinctions from traditional optimisation algorithms, where only one direction in the search space can be followed.
The best individuals are selected among parents and offspring generations, making the process more likely to converge to a global optimum.
The choice of the optimization algorithm depends on different aspects, such as: the required quality of solutions, the computing time, the selection of the objective functions or the problem's constraints. Some deterministic algorithms can be very fast but in many cases they can only be applied for small size problems where only a single objective function is required and the number of constraints is reduced. In this paper, GA has been selected because they offer great flexibility to consider multi-objective functions and they are able to work, simultaneously, with several constraints. Moreover, GAs have proved to be robust optimization techniques [39] dealing with non-linear and non-convex problems as the one shown in this paper.
The objective of the present study is to minimise the load profile deviation by means of EV optimal charging. Variables used in the optimisation problem are the hourly demands. Using this approach, the GA chromosome is composed of 24 genes (Load demand1, Load demand2, Load demand3, …, Load demand24). Genes are encoded by real numbers that correspond to hourly total demands according to Equation (14). The hourly load demand involves the hourly home electricity demand, hourly electricity demand using a G2V scheme and the hourly EV power production using a V2G scheme as is shown in Equation (14):
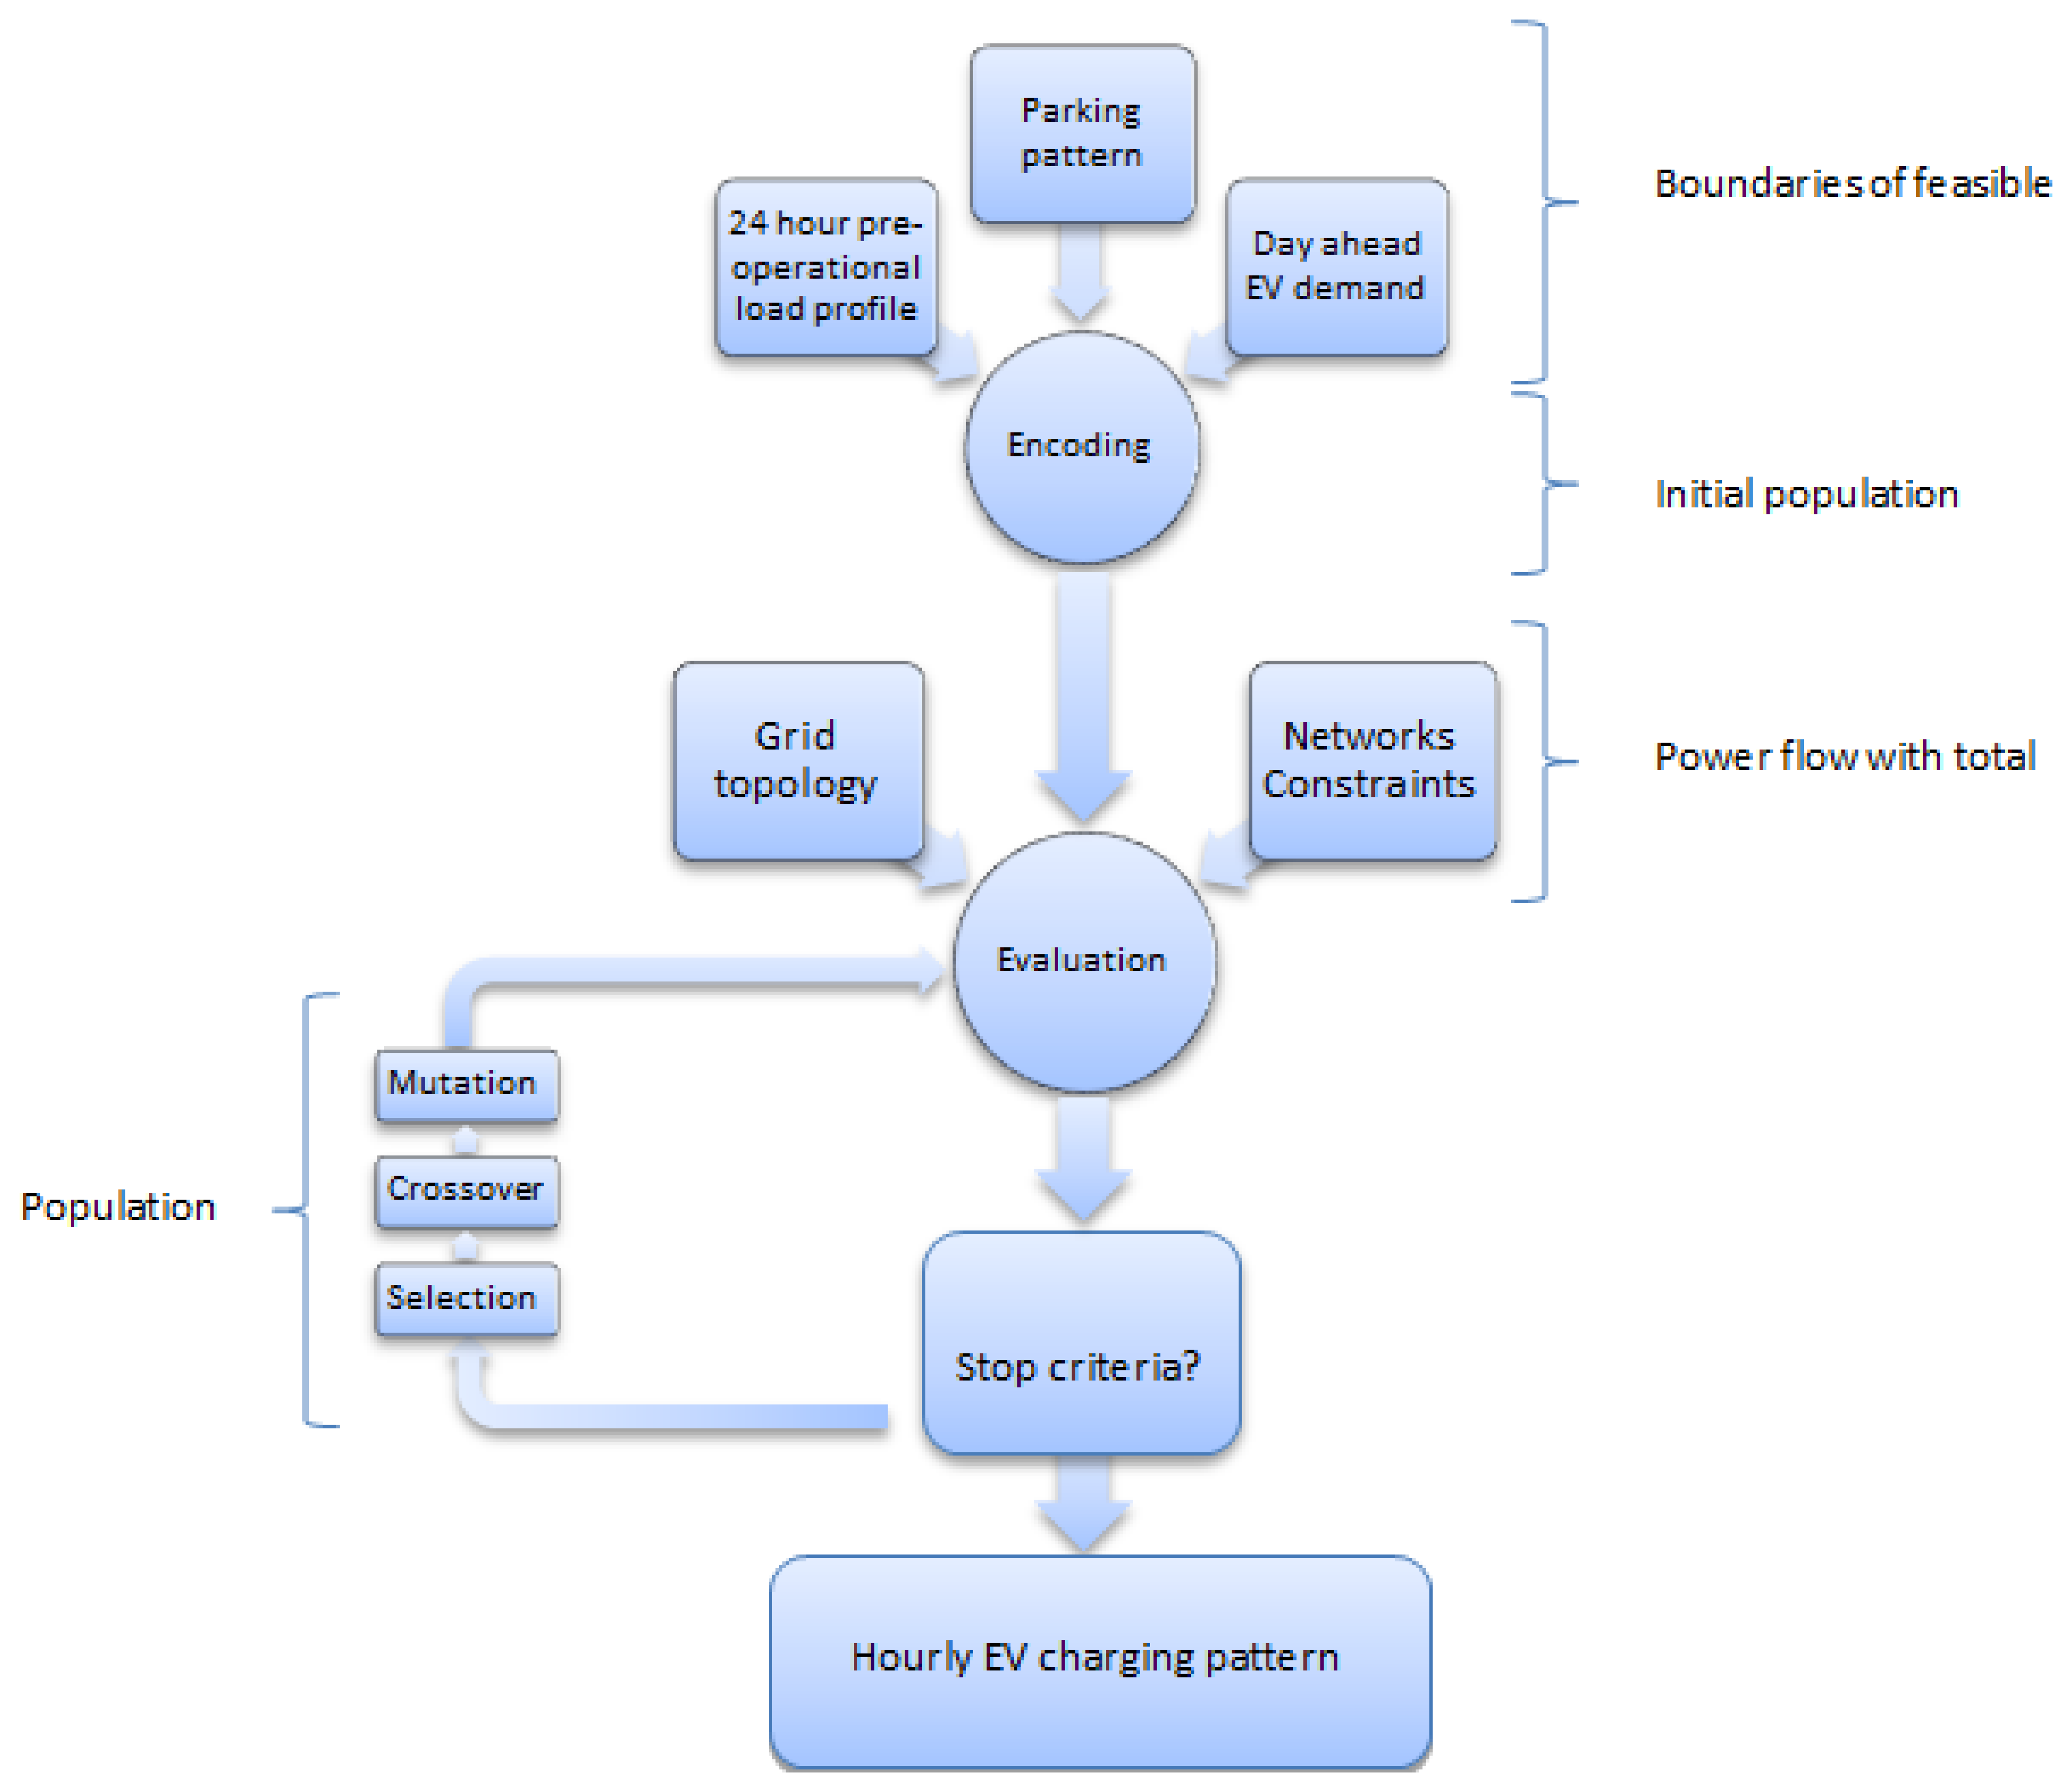
The engine of the GA is the Fitness Function (FF) (2), which assigns a goodness value to each individual of the population and is employed to drive the evolution process. In this study, the FF must fulfil the charging requirements of all the EVs connected at each hour and minimise the deviation of the load profile of the main transformer (residential electricity demand or pre-load profile + EV load profile + power losses). The GA determines the optimal EV load demand during each hour. A scheme of the algorithm is given as follows (see Figure 5):
The GA implementation begins with the encoding. The 24-hour parking pattern developed in Section 2, 24-hour day-ahead EV demand and the 24-hour load demand are used as boundaries to determinate the feasible solution space of the population. A large population size (100 individuals) is selected as the initial population to increase the convergence rate to the global solution. The selection of the population size is a critical factor in the GA implementation because large values increase the convergence rate to the global solution, but this also increases the computation time.
When the initial population is created, information about the low-voltage grid topology is considered in the evaluation process. The feasibility of each individual in terms of the FF (2), considering network constraints (3)–(13), is evaluated using a power flow.
After the evaluation and scaling of each individual, the population evolves through genetic operators to a new population. The roulette method approach is used for the selection operator, and a rate of 50% is assigned to the crossover operators.
To improve the evolution of the GA process, a mutation rate of 50% is selected. Two elitism children are maintained at each generation to ensure the best solution throughout the process.
The process continues until the stopping criteria have been reached. In this study, a convergence tolerance of 10−6 and 100 maximum generations are used as the stopping criteria.
Finally, the result of the GA shows the optimal management of EV charging. The optimal solution corresponds to the pre-operational load plus the EV contribution and power losses calculated in the power flow.
5. Study and Results
5.1. Grid Topology
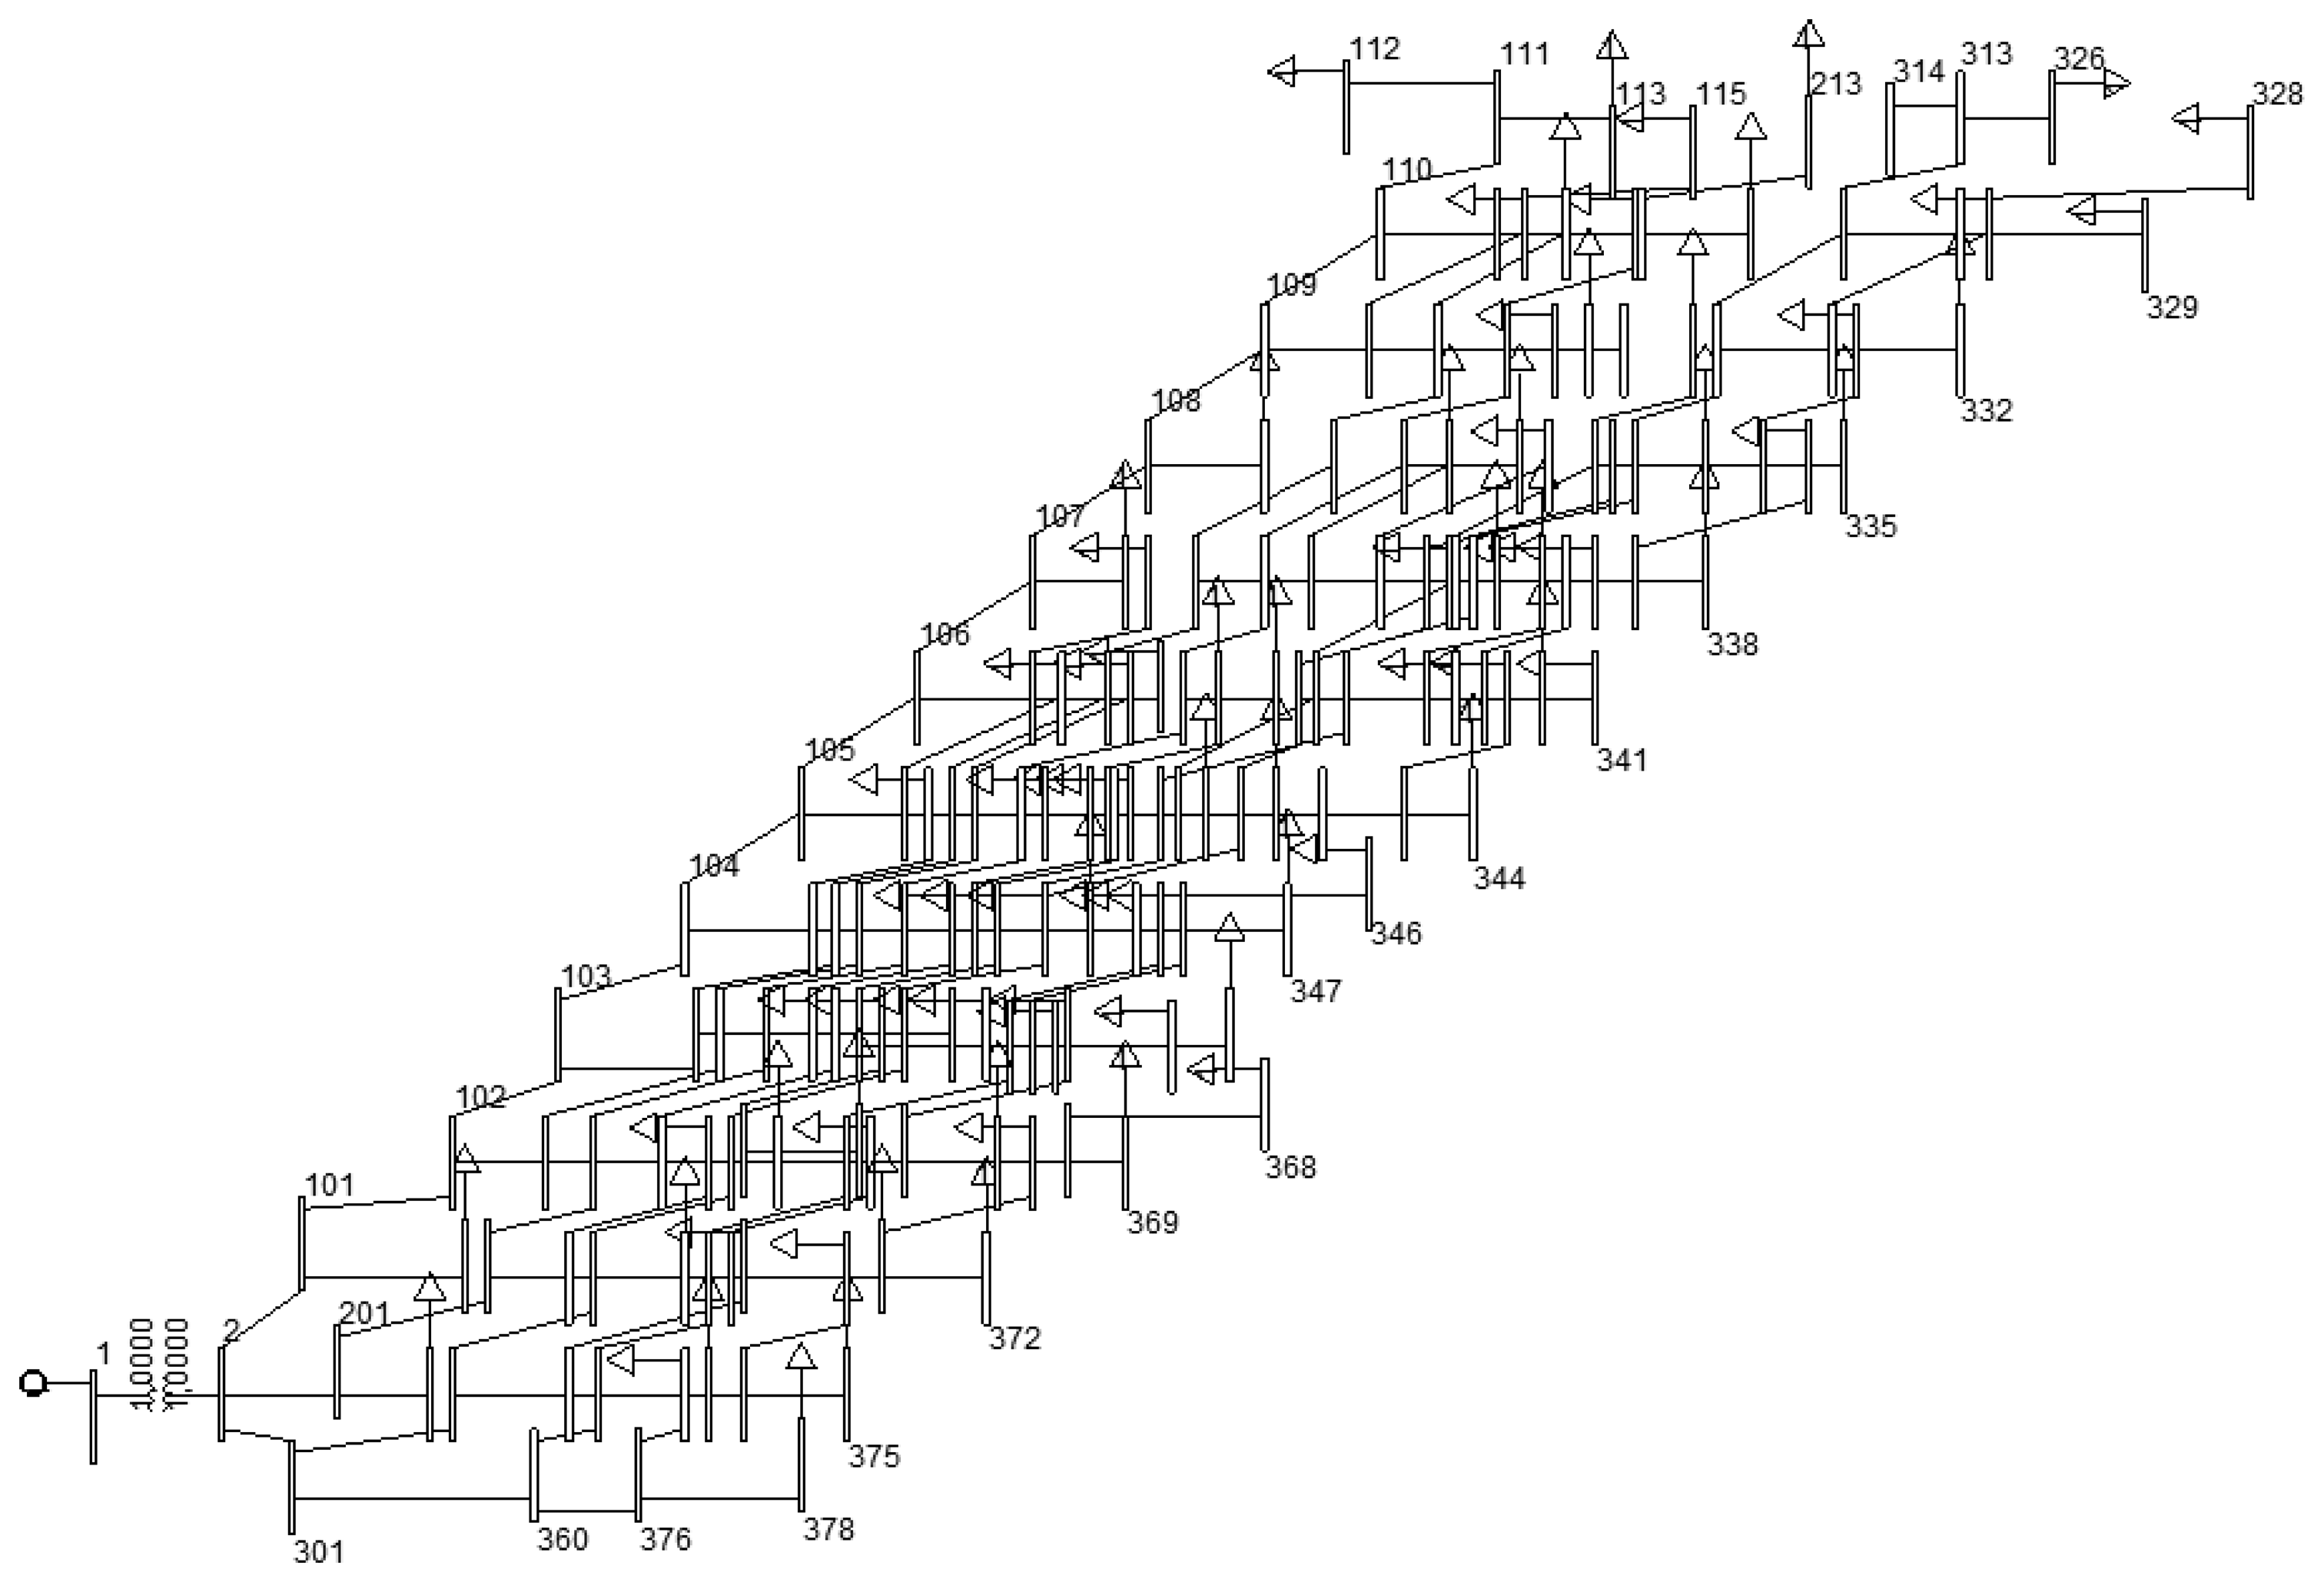
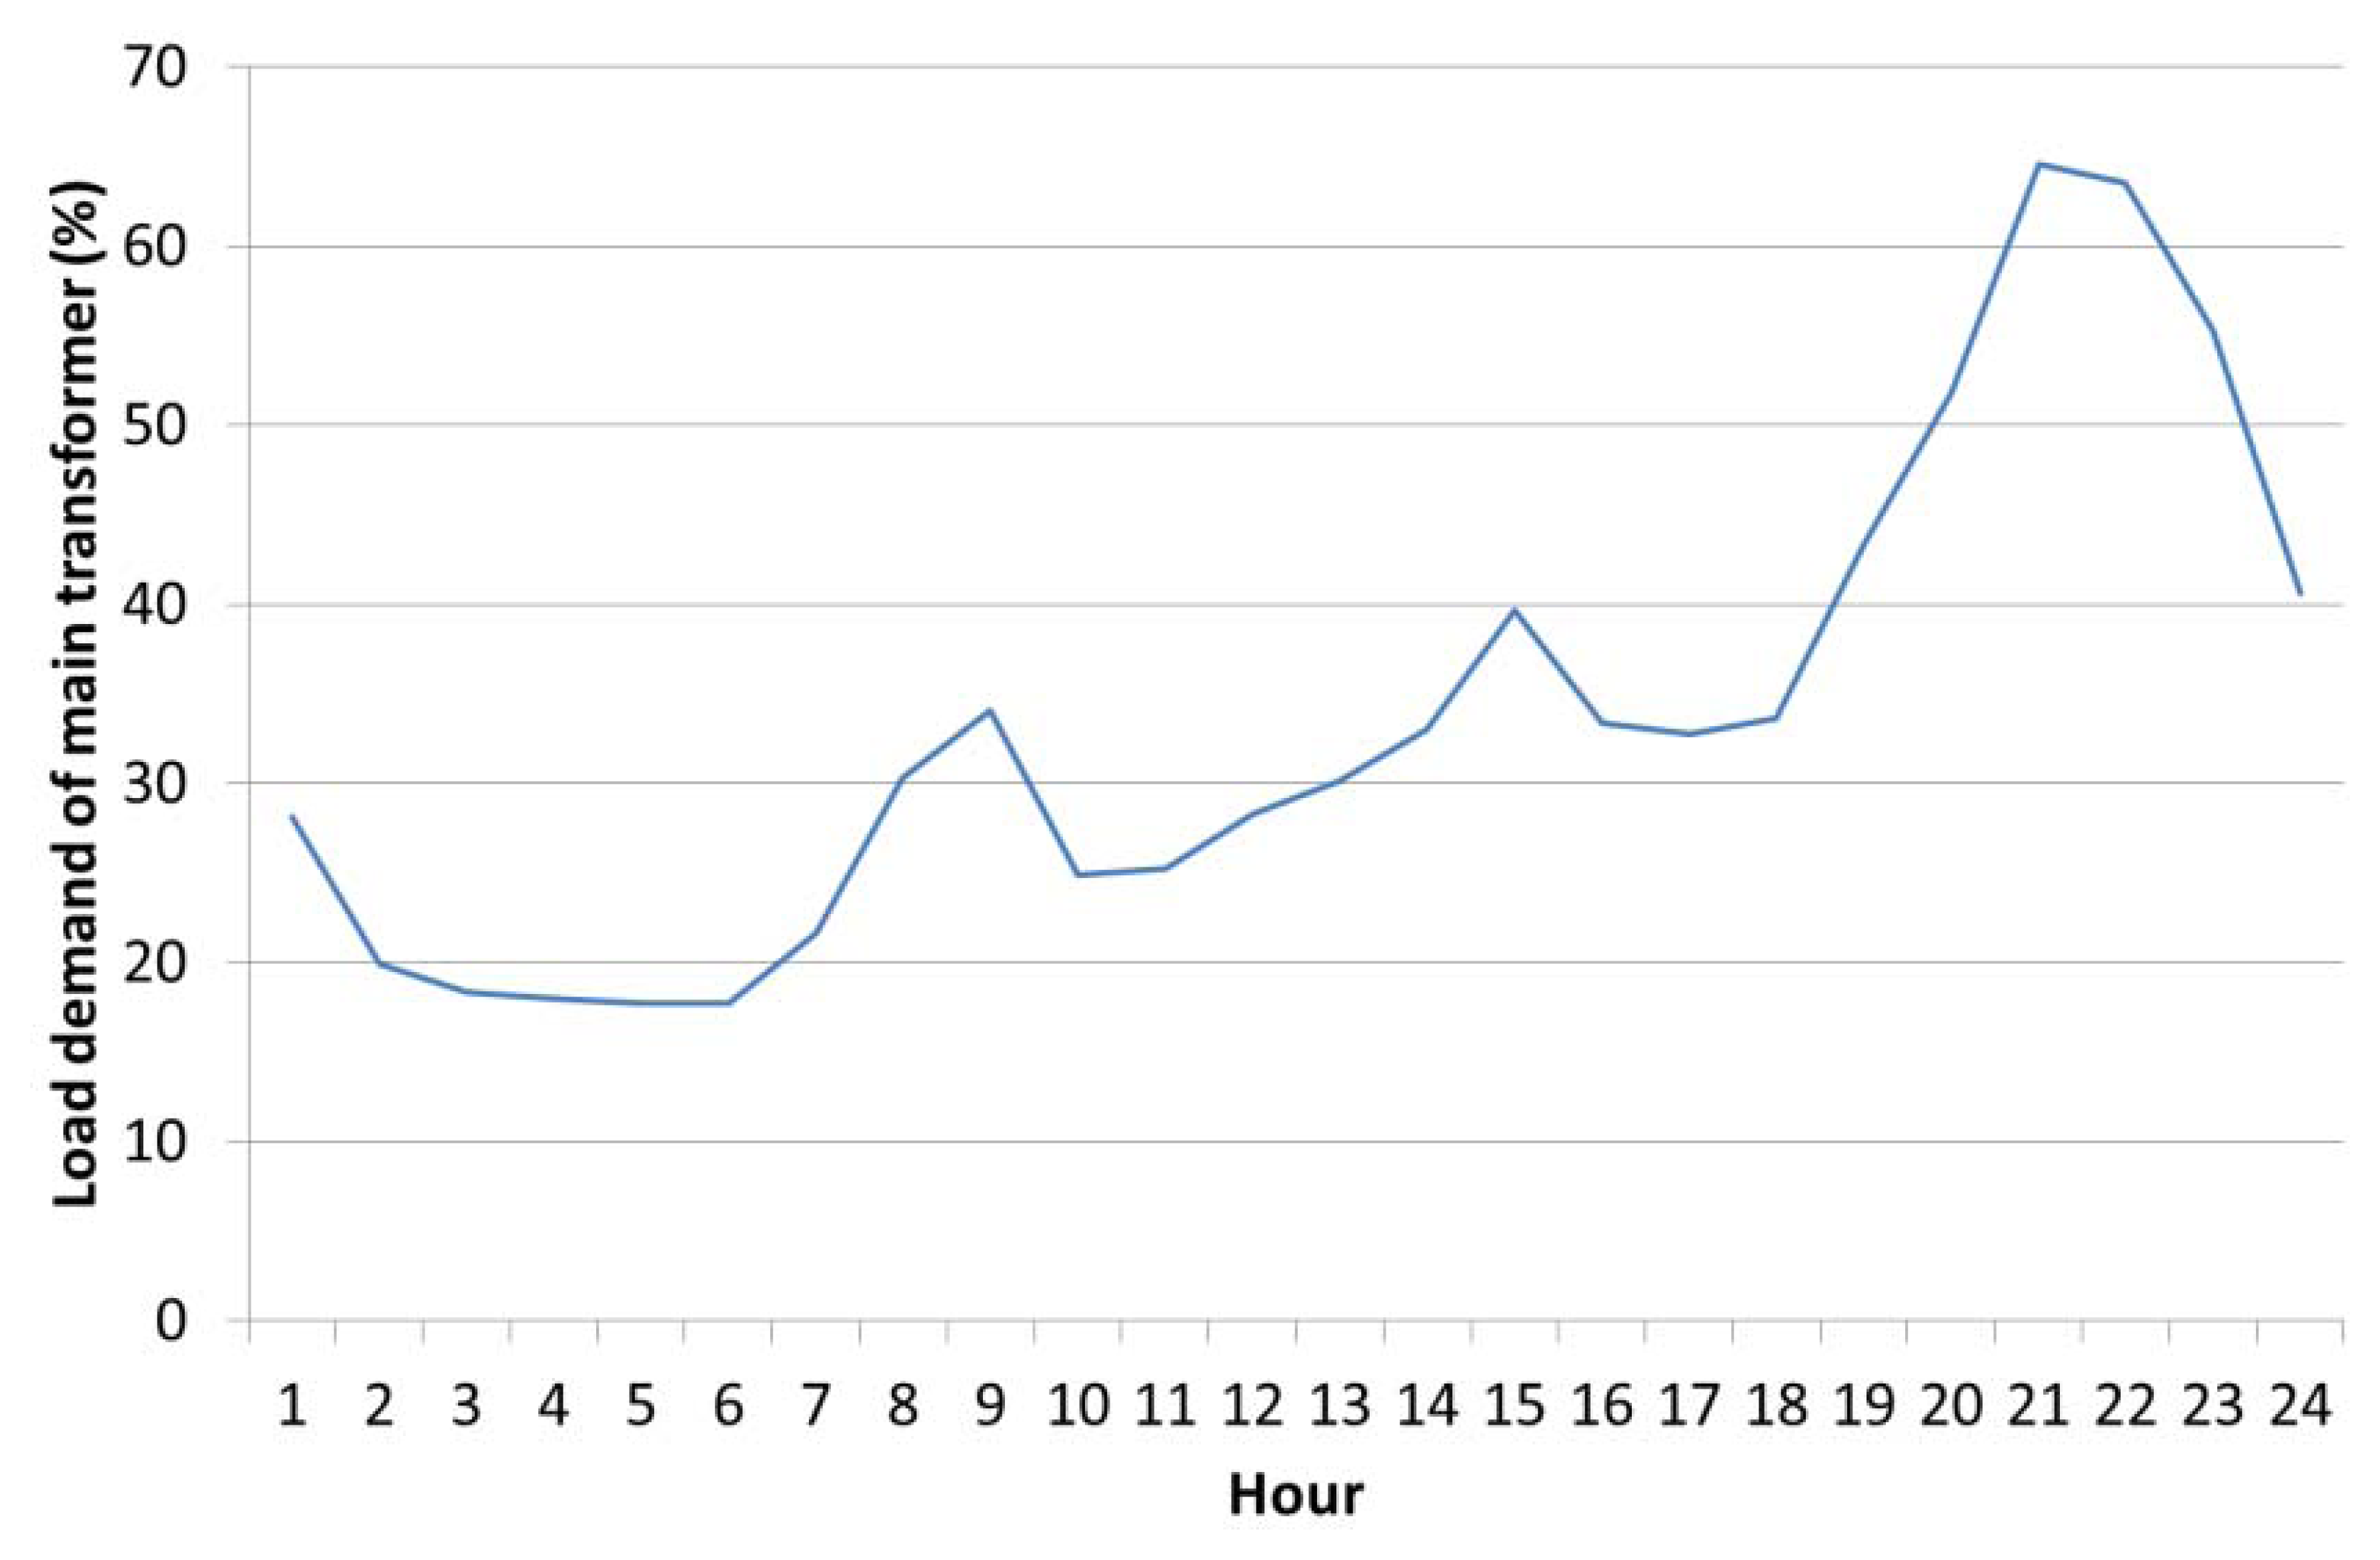
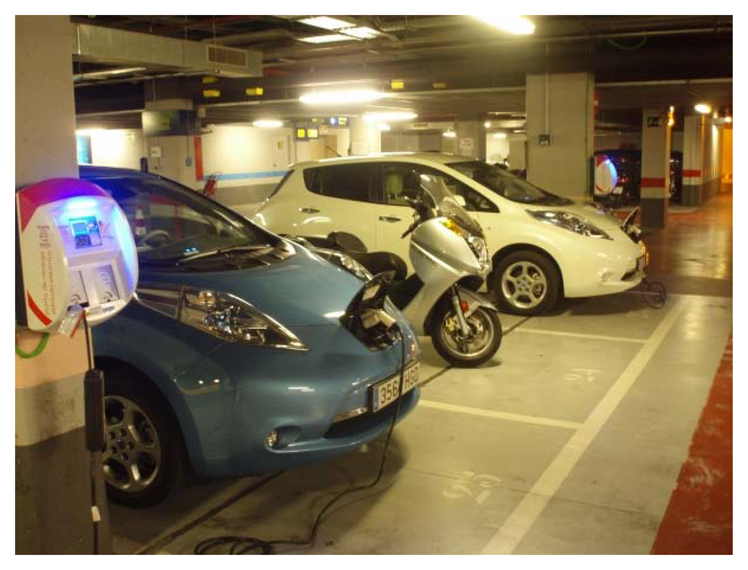
The optimised EV charging schedule shown in this paper has been applied to low-voltage distribution networks from a Spanish electricity distribution company (Unión Fenosa), which is shown in Figure 6. The residential distribution network corresponds to an existing low-voltage network with a main substation transformer that provides electricity for N = 100 individual customers connected to several feeders. Grid data are detailed in the Appendix. Figure 7 shows one of the parking charge points available at the network.
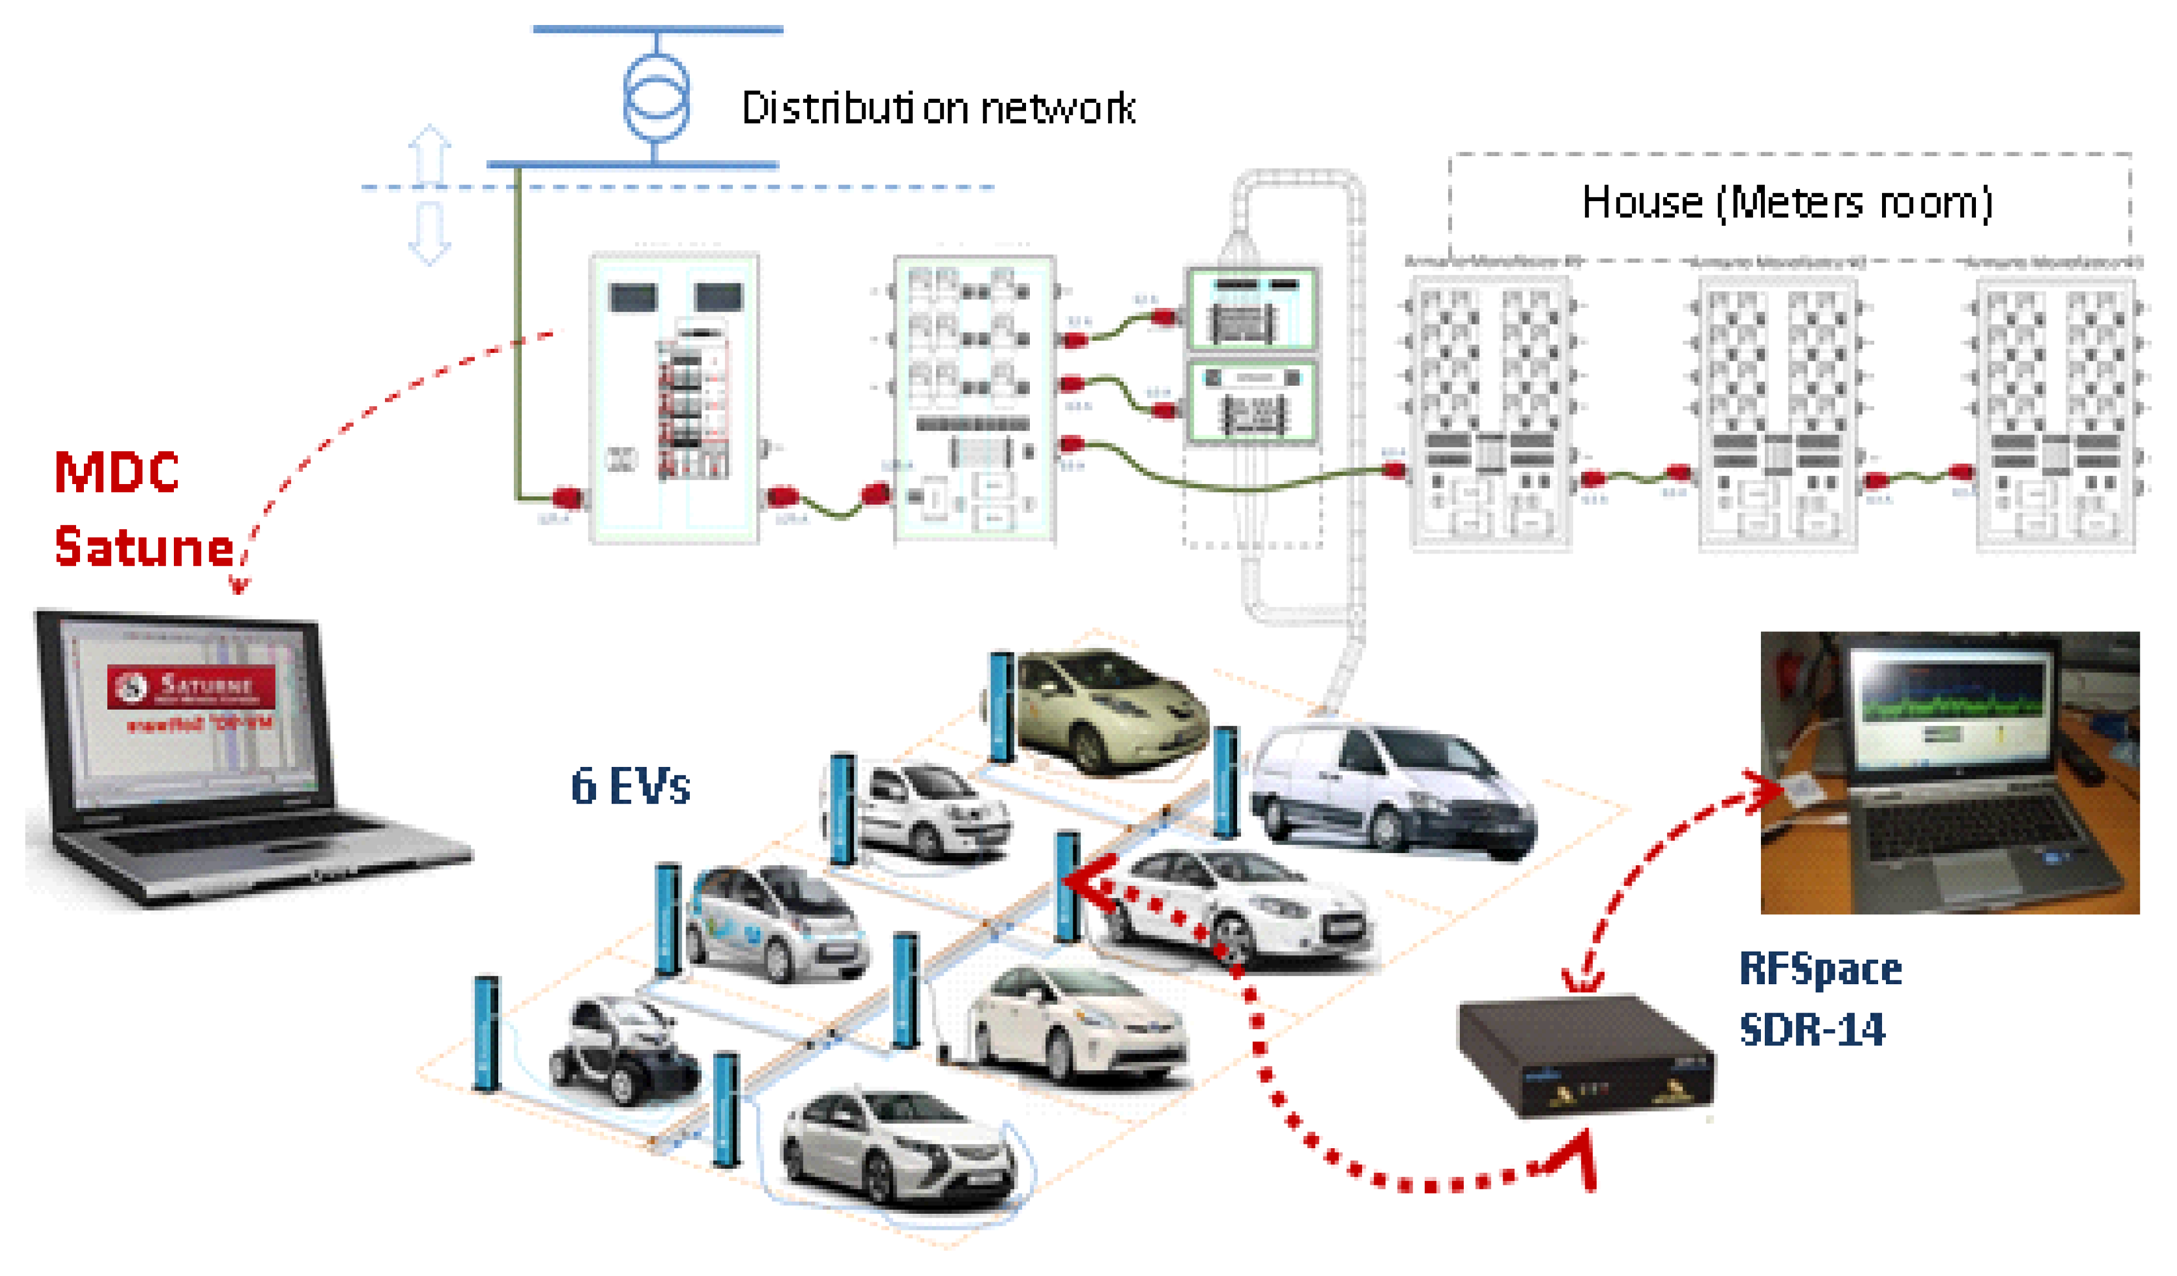
Figure 8 shows the EV parking infrastructure of a multiple charge point location of a distribution system equivalent to the system under study. The daily baseline load profile measured at the main substation transformer is shown in Figure 9. It is assumed that each individual house can have one or two EVs; consequently, the EV population connected to the network can be considered to be 1.5 N.
In this study, it is assumed that the charging process corresponds to a slow charge and that the EV batteries are fully charged throughout the day: continuously during the fixed time duration (for example, 3 h) or discontinuously throughout the day. The charging rate at the CPOC is 16 A, which corresponds to an AC voltage of 250 V based on Mode 1 of the IEC 61581-1 standard. It is considered that the state of charge (SOC) at the end of the last trip of the day is 20%. It is also assumed that the CPOC is equipped with technology to control the charge of the battery of the EV by using signals from the smart grid aggregator.
5.2. Studies
The optimal scheduling strategy described in previous sections has been implemented in the residential network. Three EV penetration scenarios have been considered: a low penetration level (5%), medium penetration level (20%) and a high penetration level (50%). Four different types of EV charging processes (dumb, conventional, smart G2V and smart G2V + V2G) have been applied to the residential network.
5.2.1. Dumb Charging Strategy
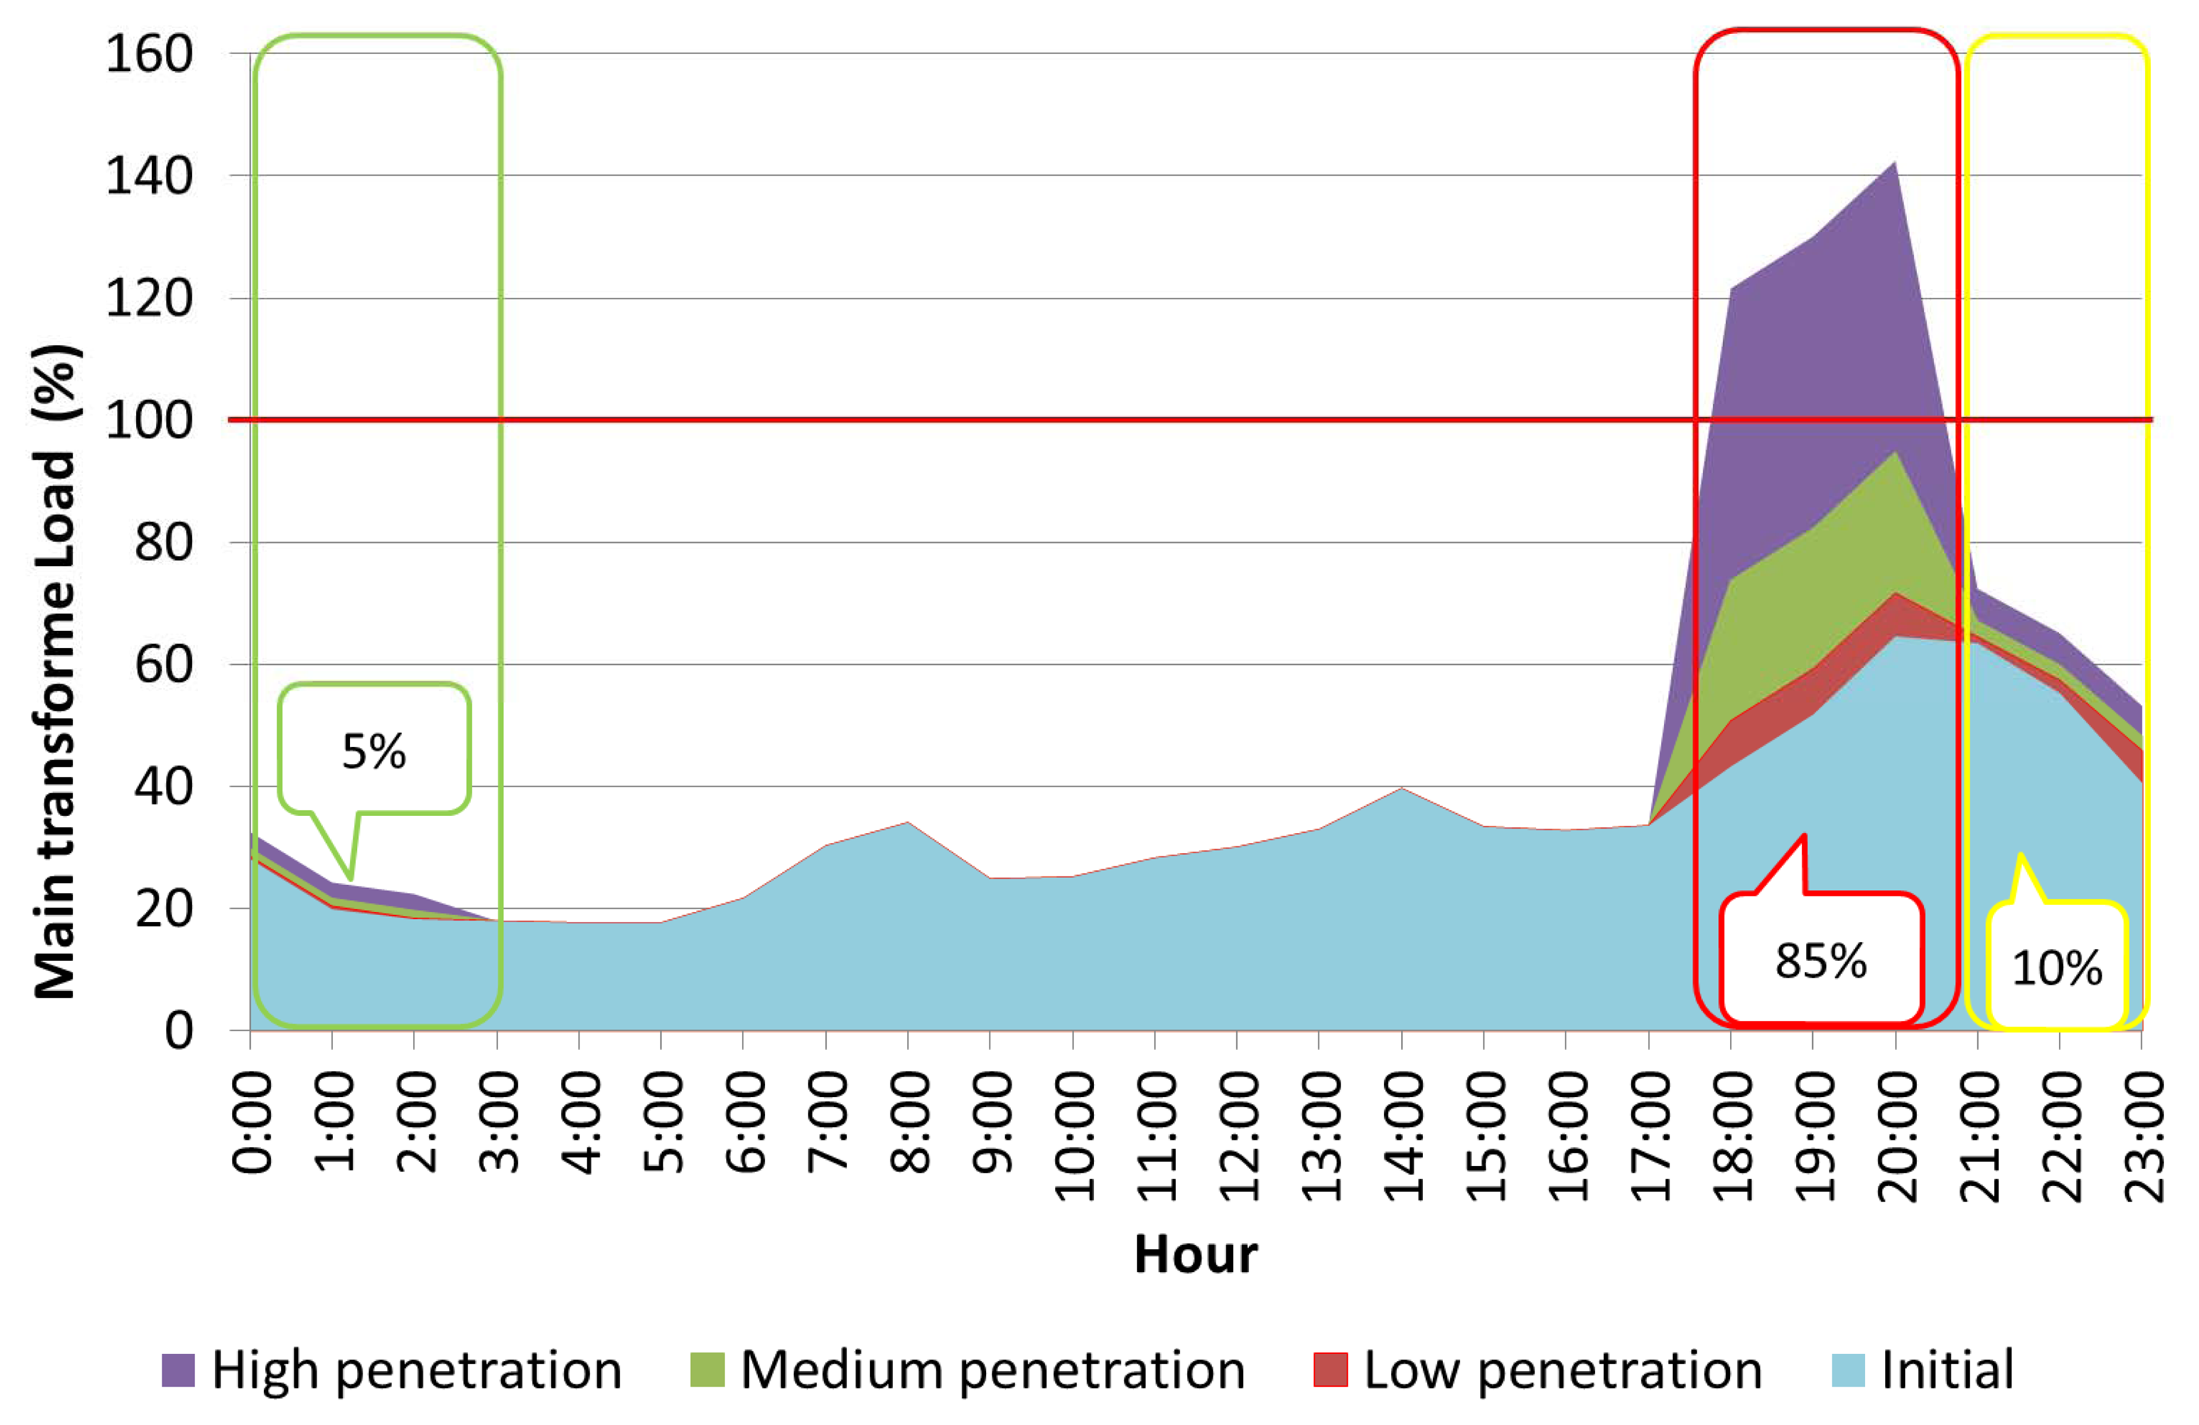
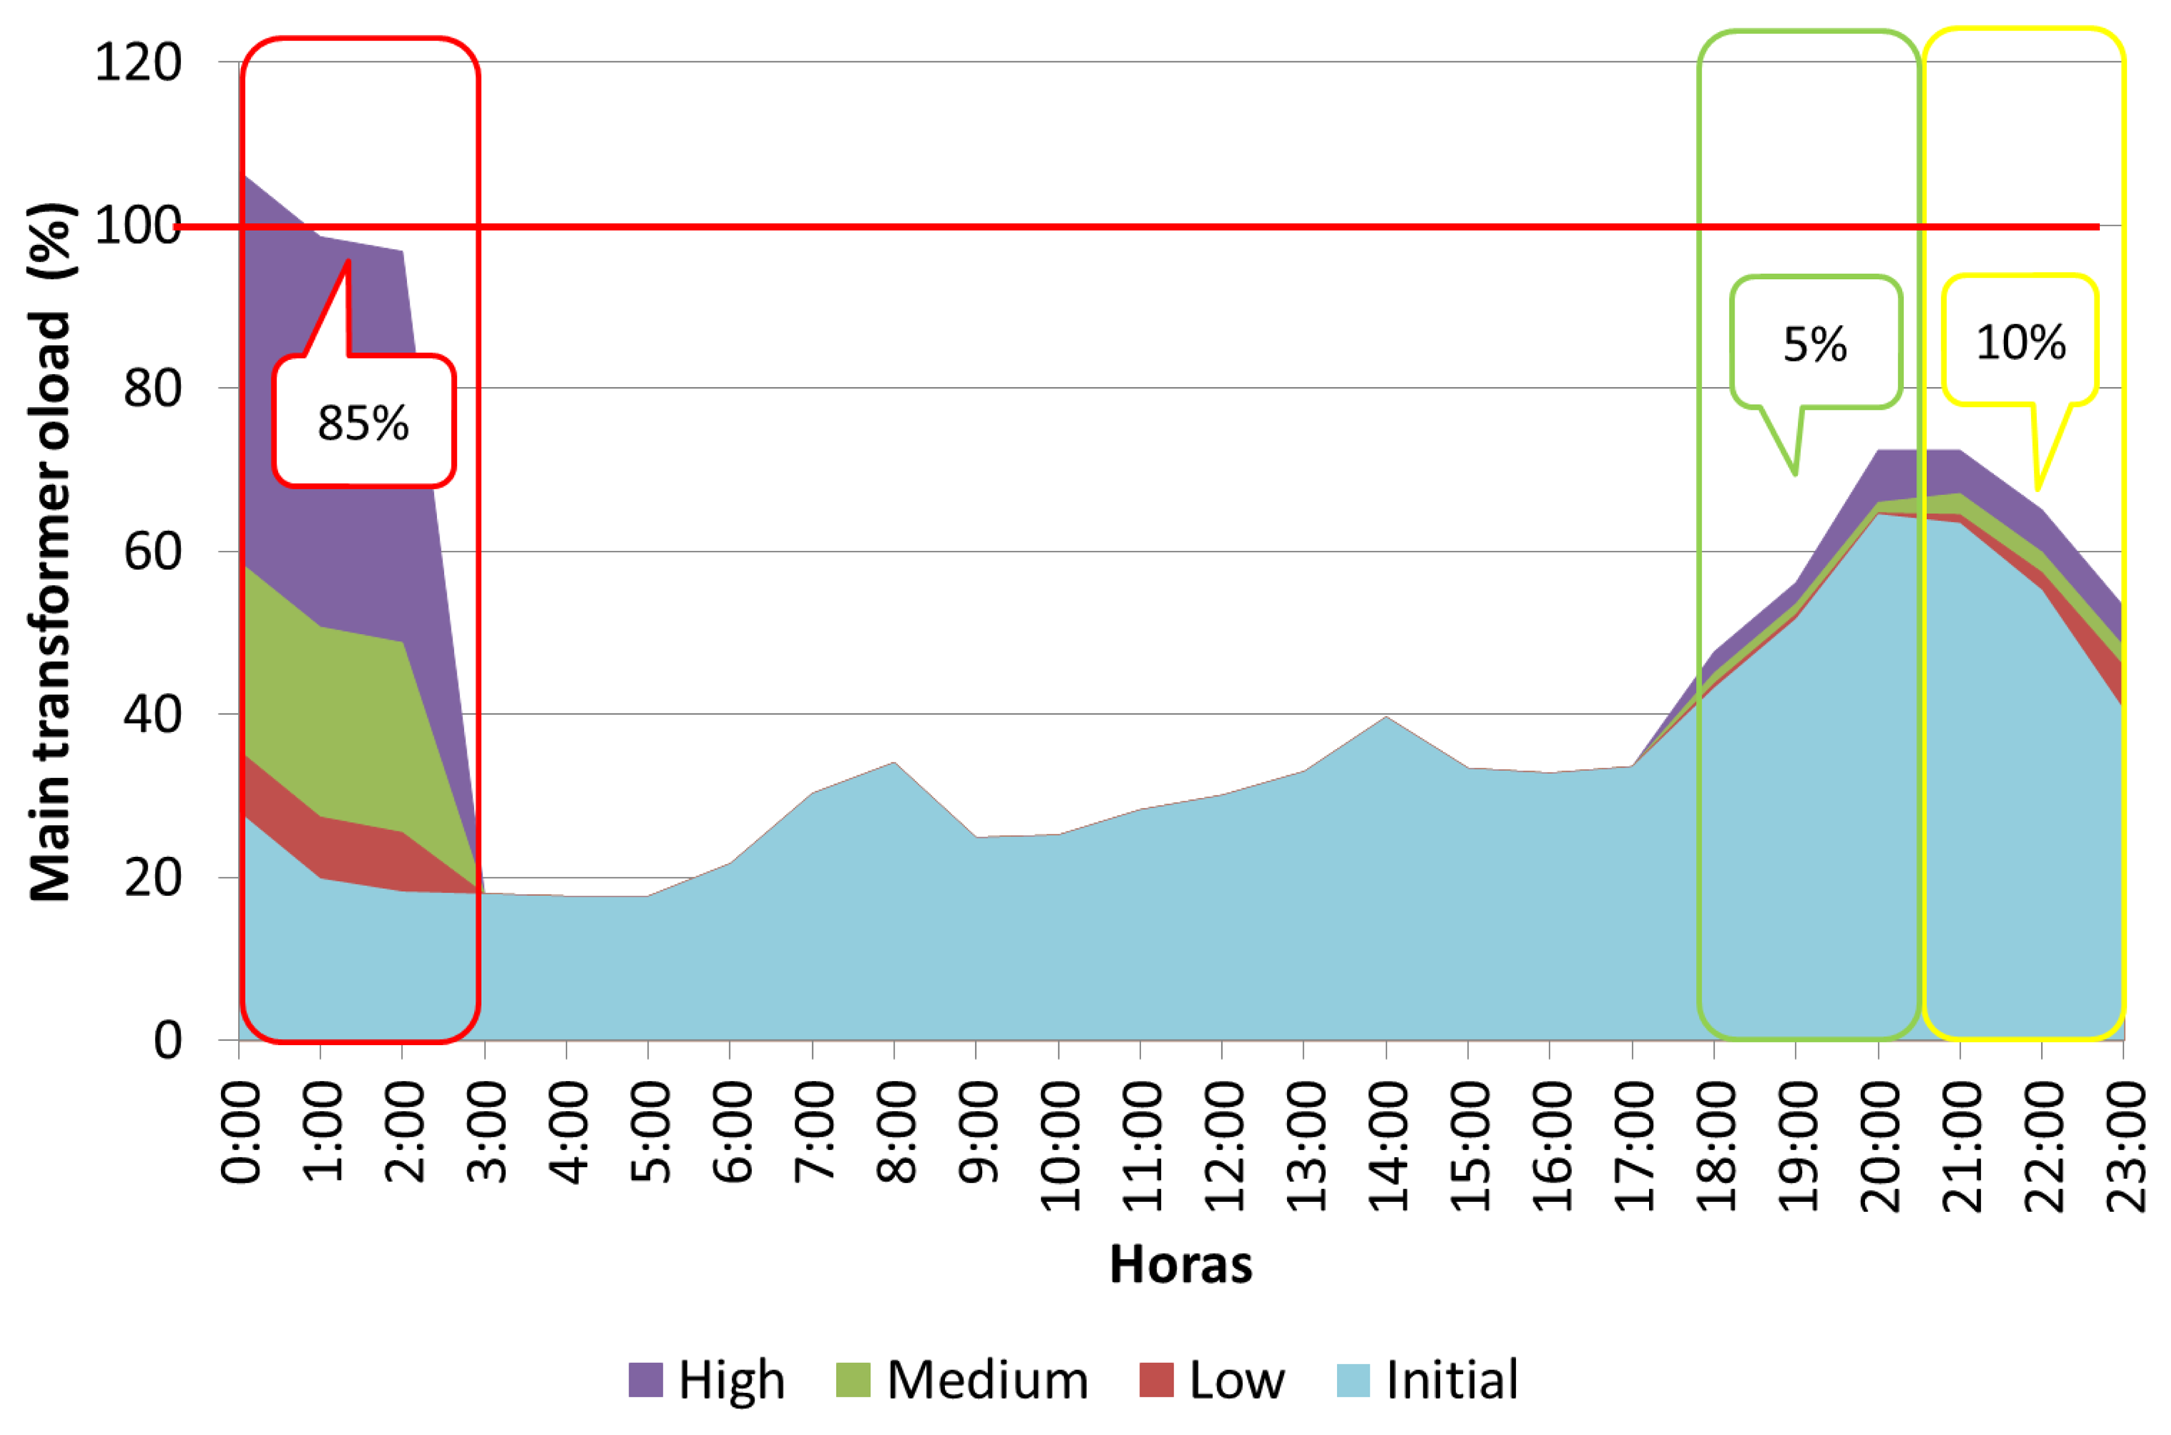
For the dumb charging strategy, electric vehicles are charged as soon as the EV is plugged-in at home. In this case, the charging process is performed using a slow charge. Based on the vehicle user behaviour study MOVILIA [32], it is considered that the EVs are connected to the network, and consequently charged, during the following periods:
85% of the EVs arrive at home between 18:00 and 20:59, and they are supposed to be plugged into the electricity network immediately. This period of time occurs during the peak load demand on the substation transformer, which is called the peak period.
5% of the EVs are connected to the network between 24:00 and 2:59, which coincides with the valley load demand.
10% of the EVs are plugged-in and charged between 21:00 and 23:59.
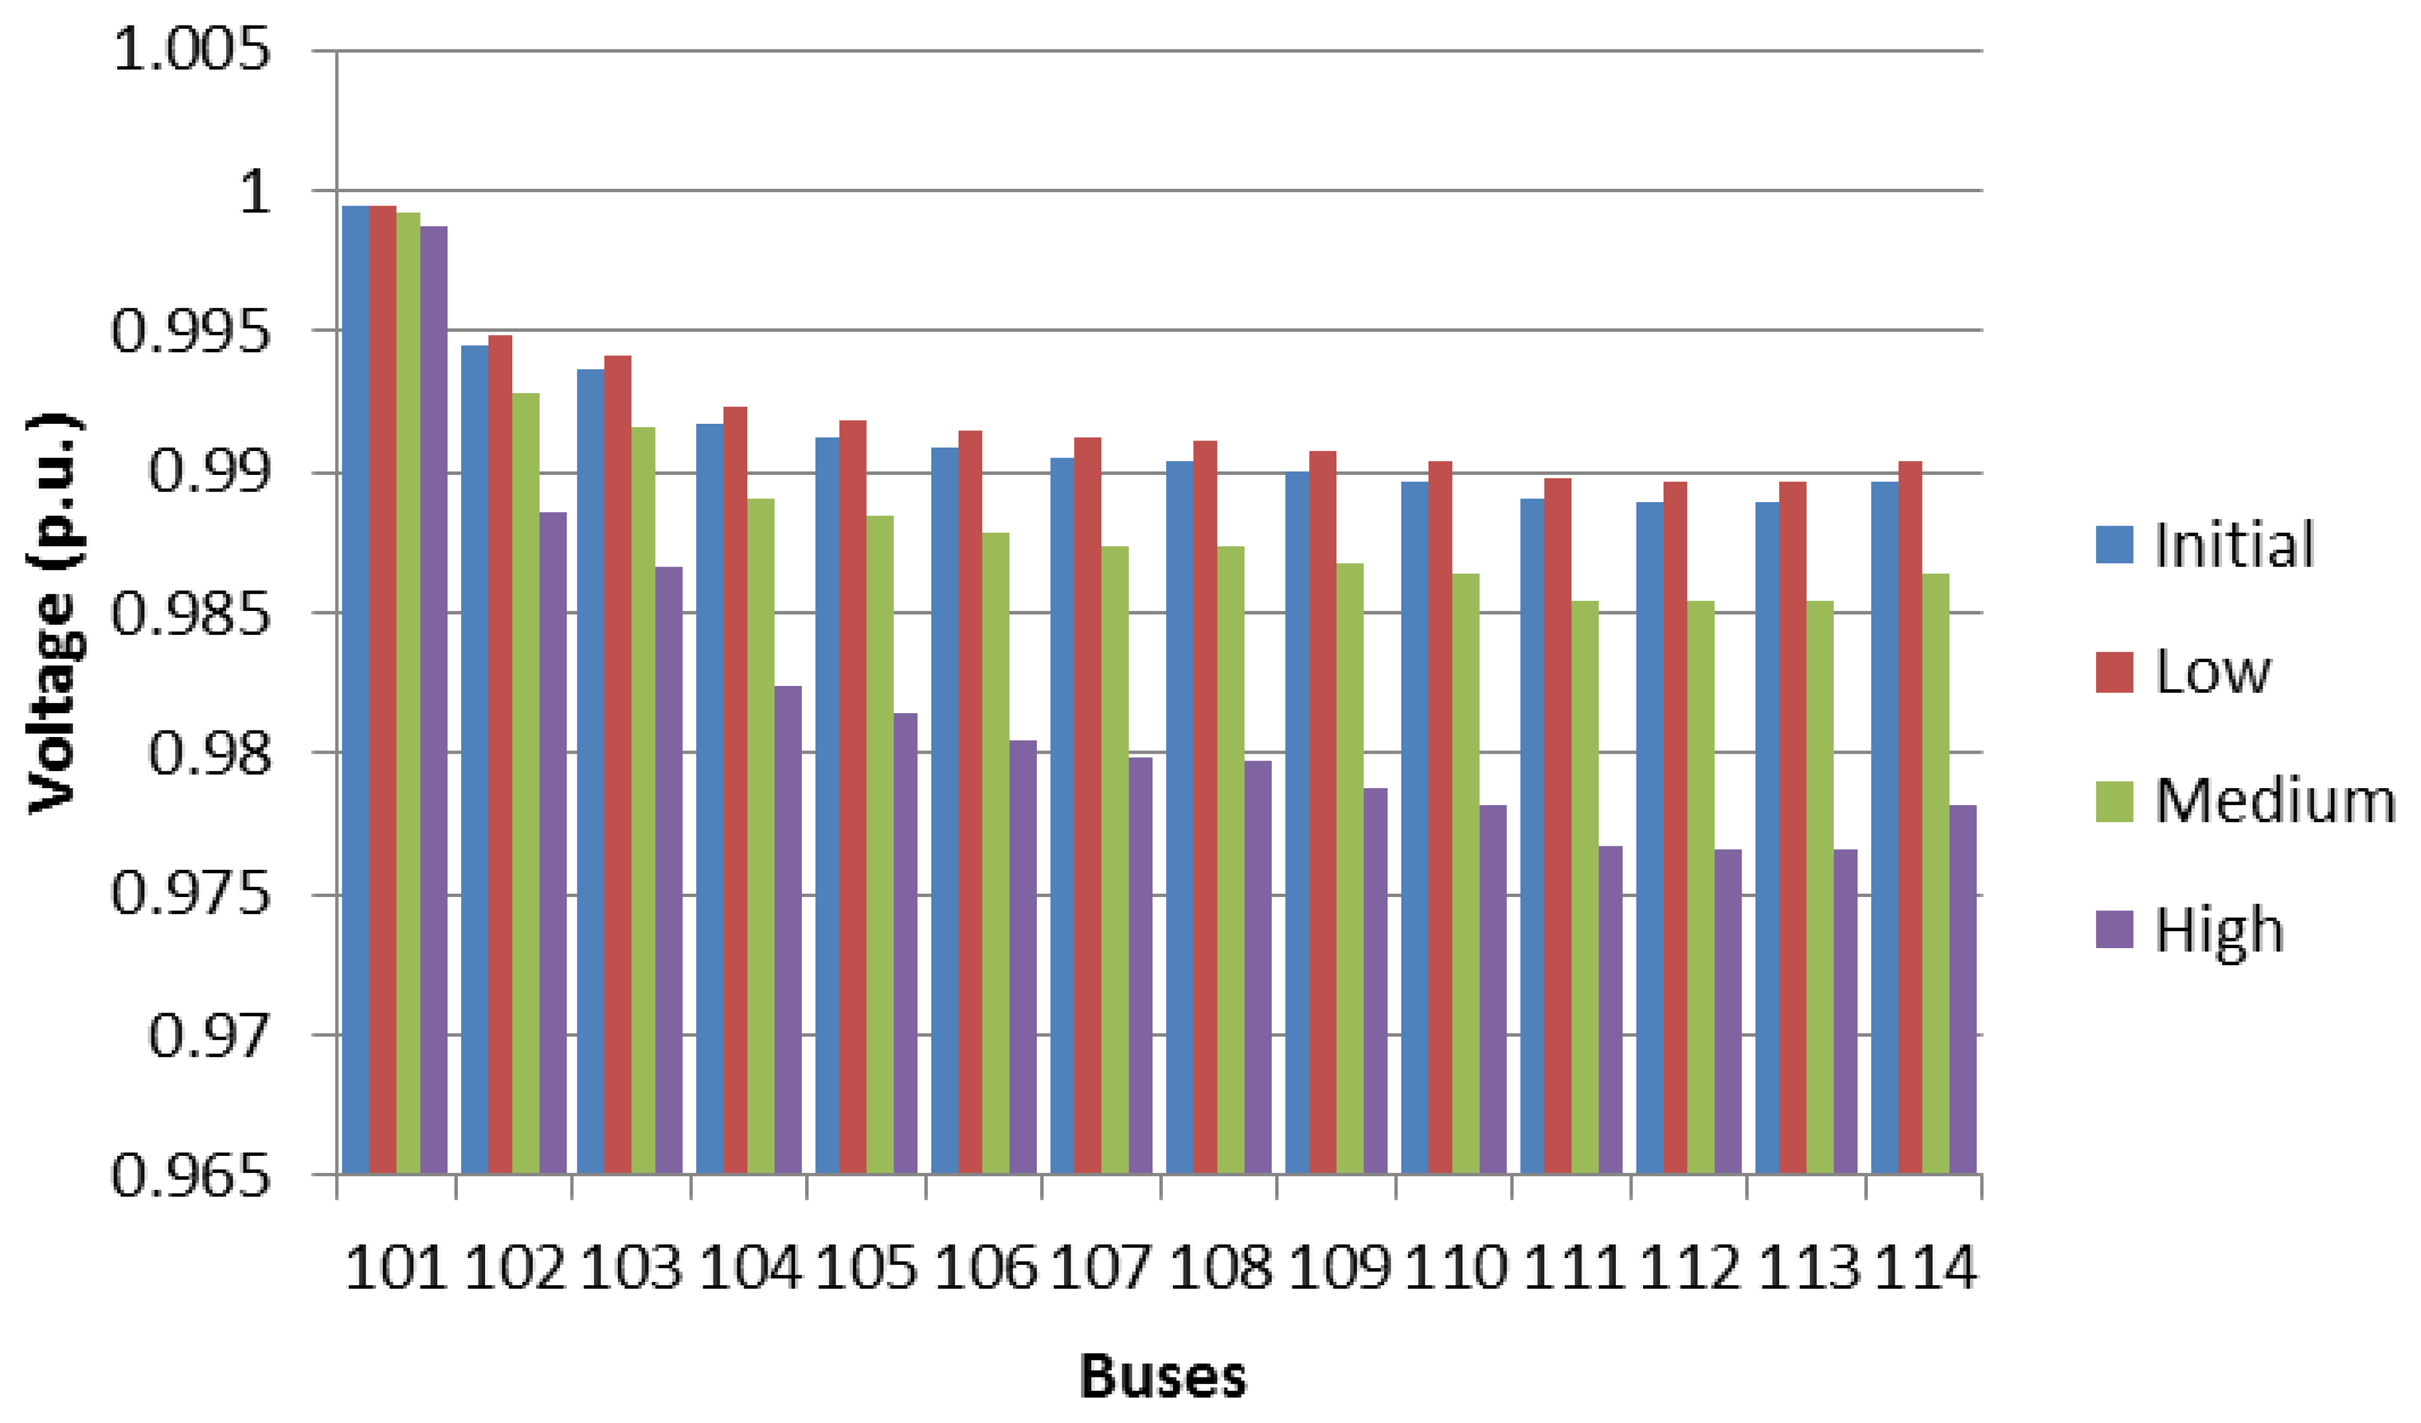
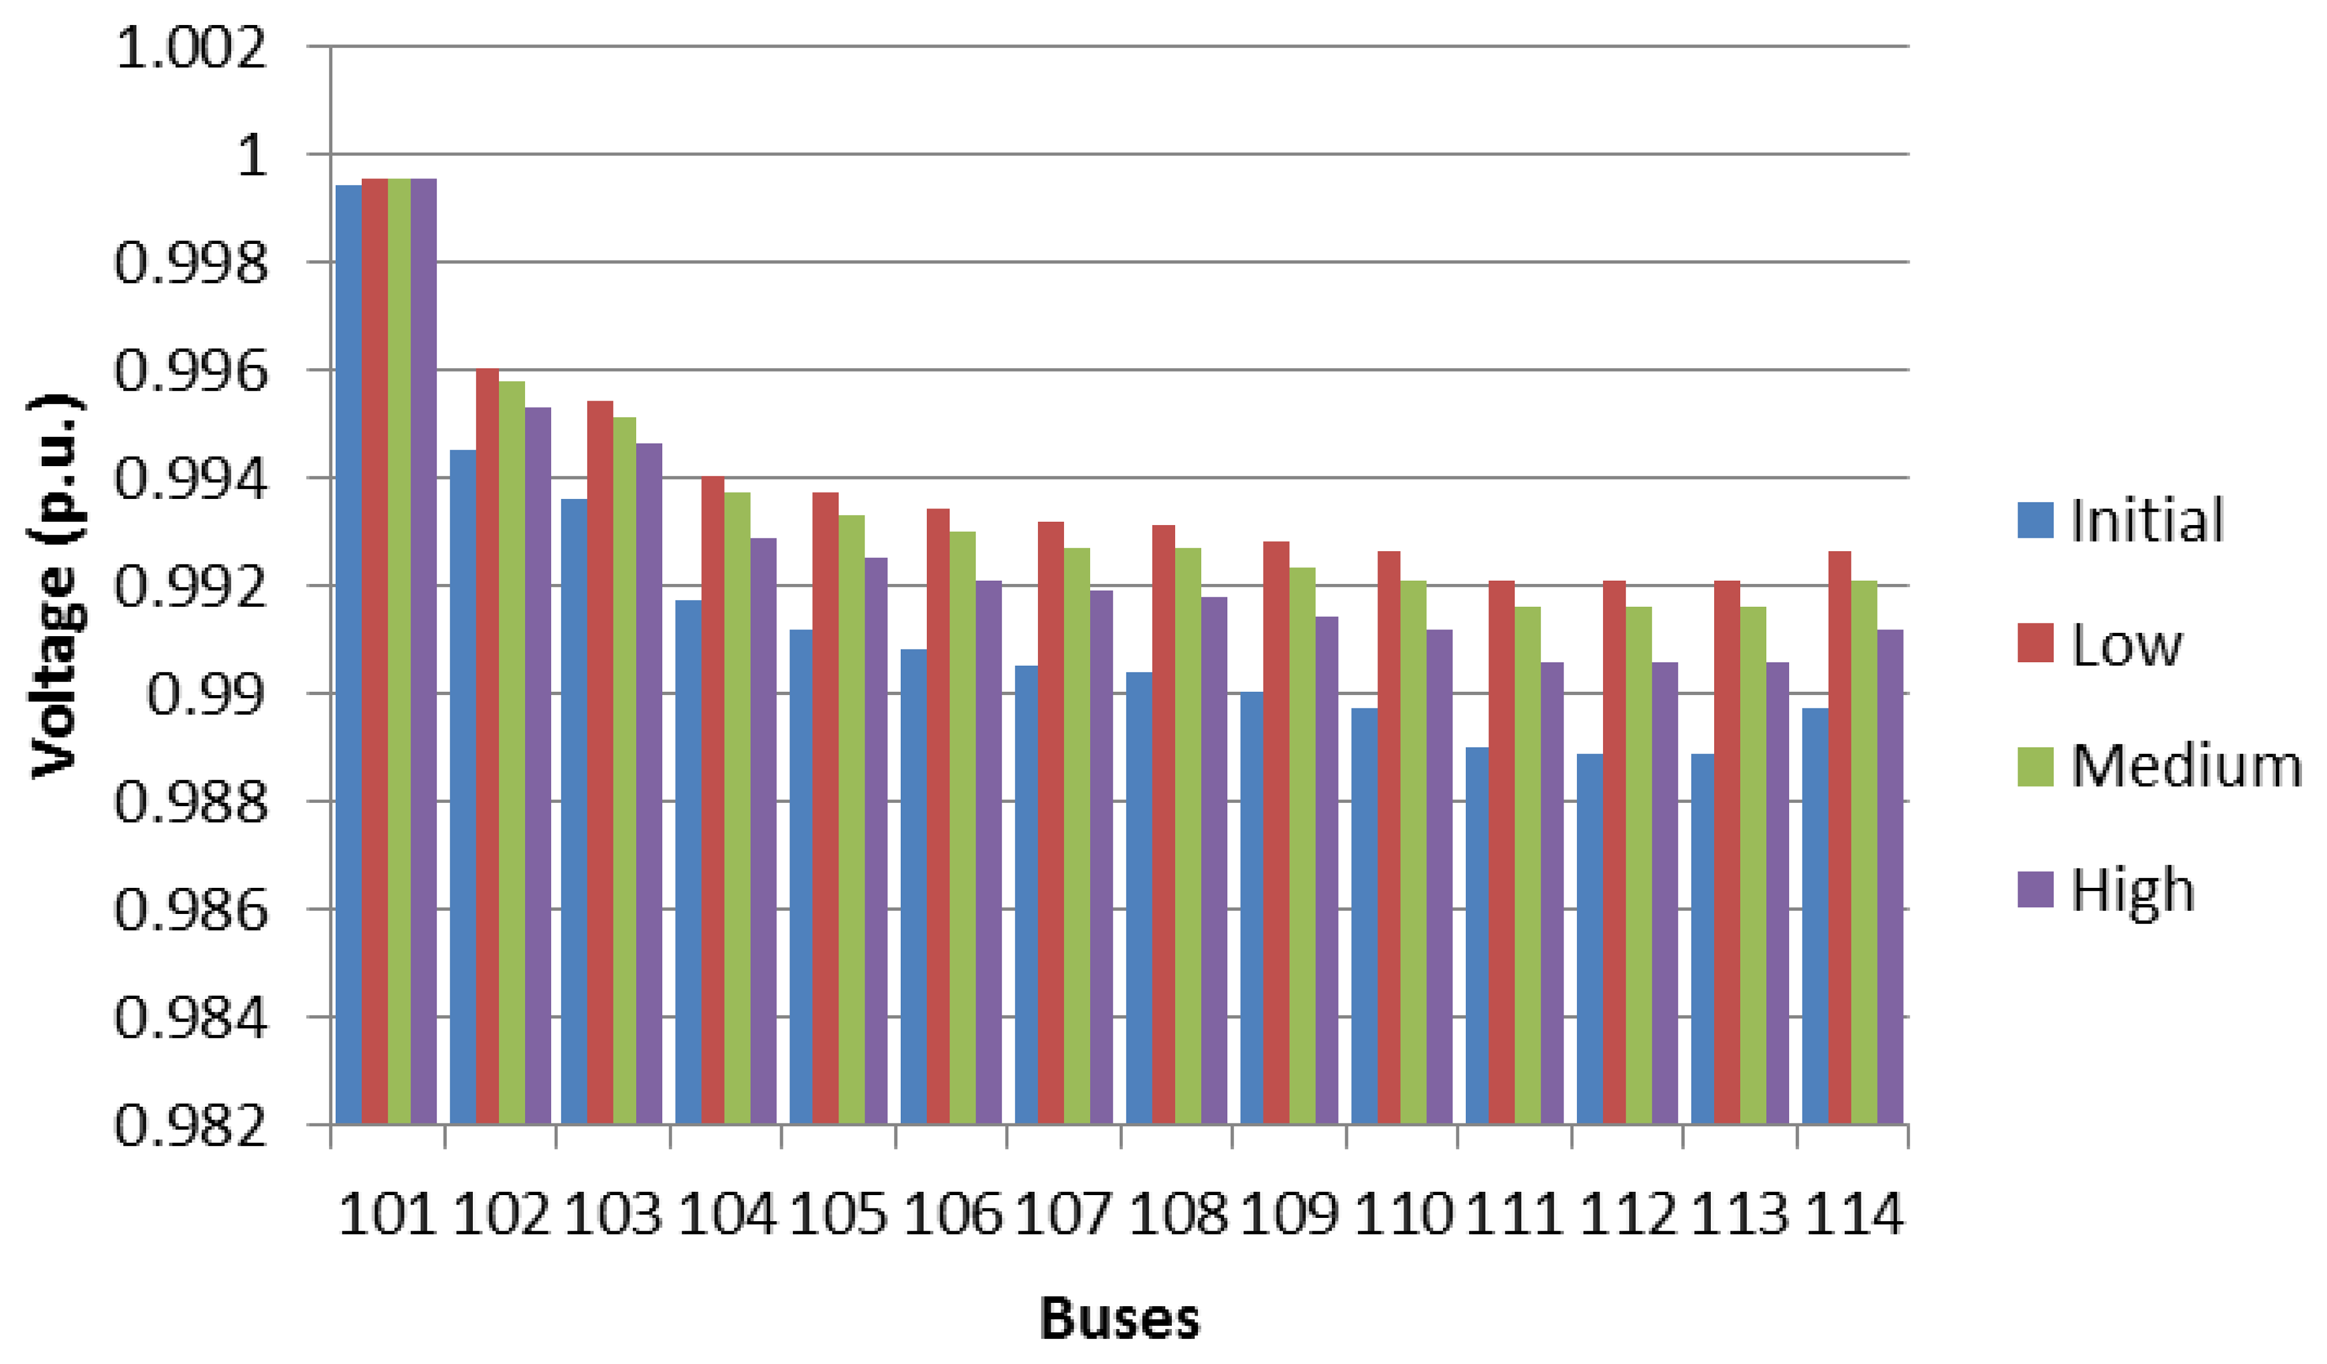
Figure 10 shows the percentage of the load of the main transformer of the residential networks, for a dumb EV charging schedule, where the three EV penetration levels and time frames are analysed. It should be observed that with dumb charging, the main transformer substation is overloaded at the peak periods for a high penetration level, which corresponds to an overloading of 140% occurring at 20:00. Figures 11, 12 and 13 show the voltage profile of the main branches for feeders 1, 2 and 3, respectively, under different EV penetration levels, considering the maximum loading hour (20:00). It should be noted that the bus voltages remain under the allowable limits for the most overloaded hour, and the bus voltages vary between 0.97 p.u and 1.03 p.u.
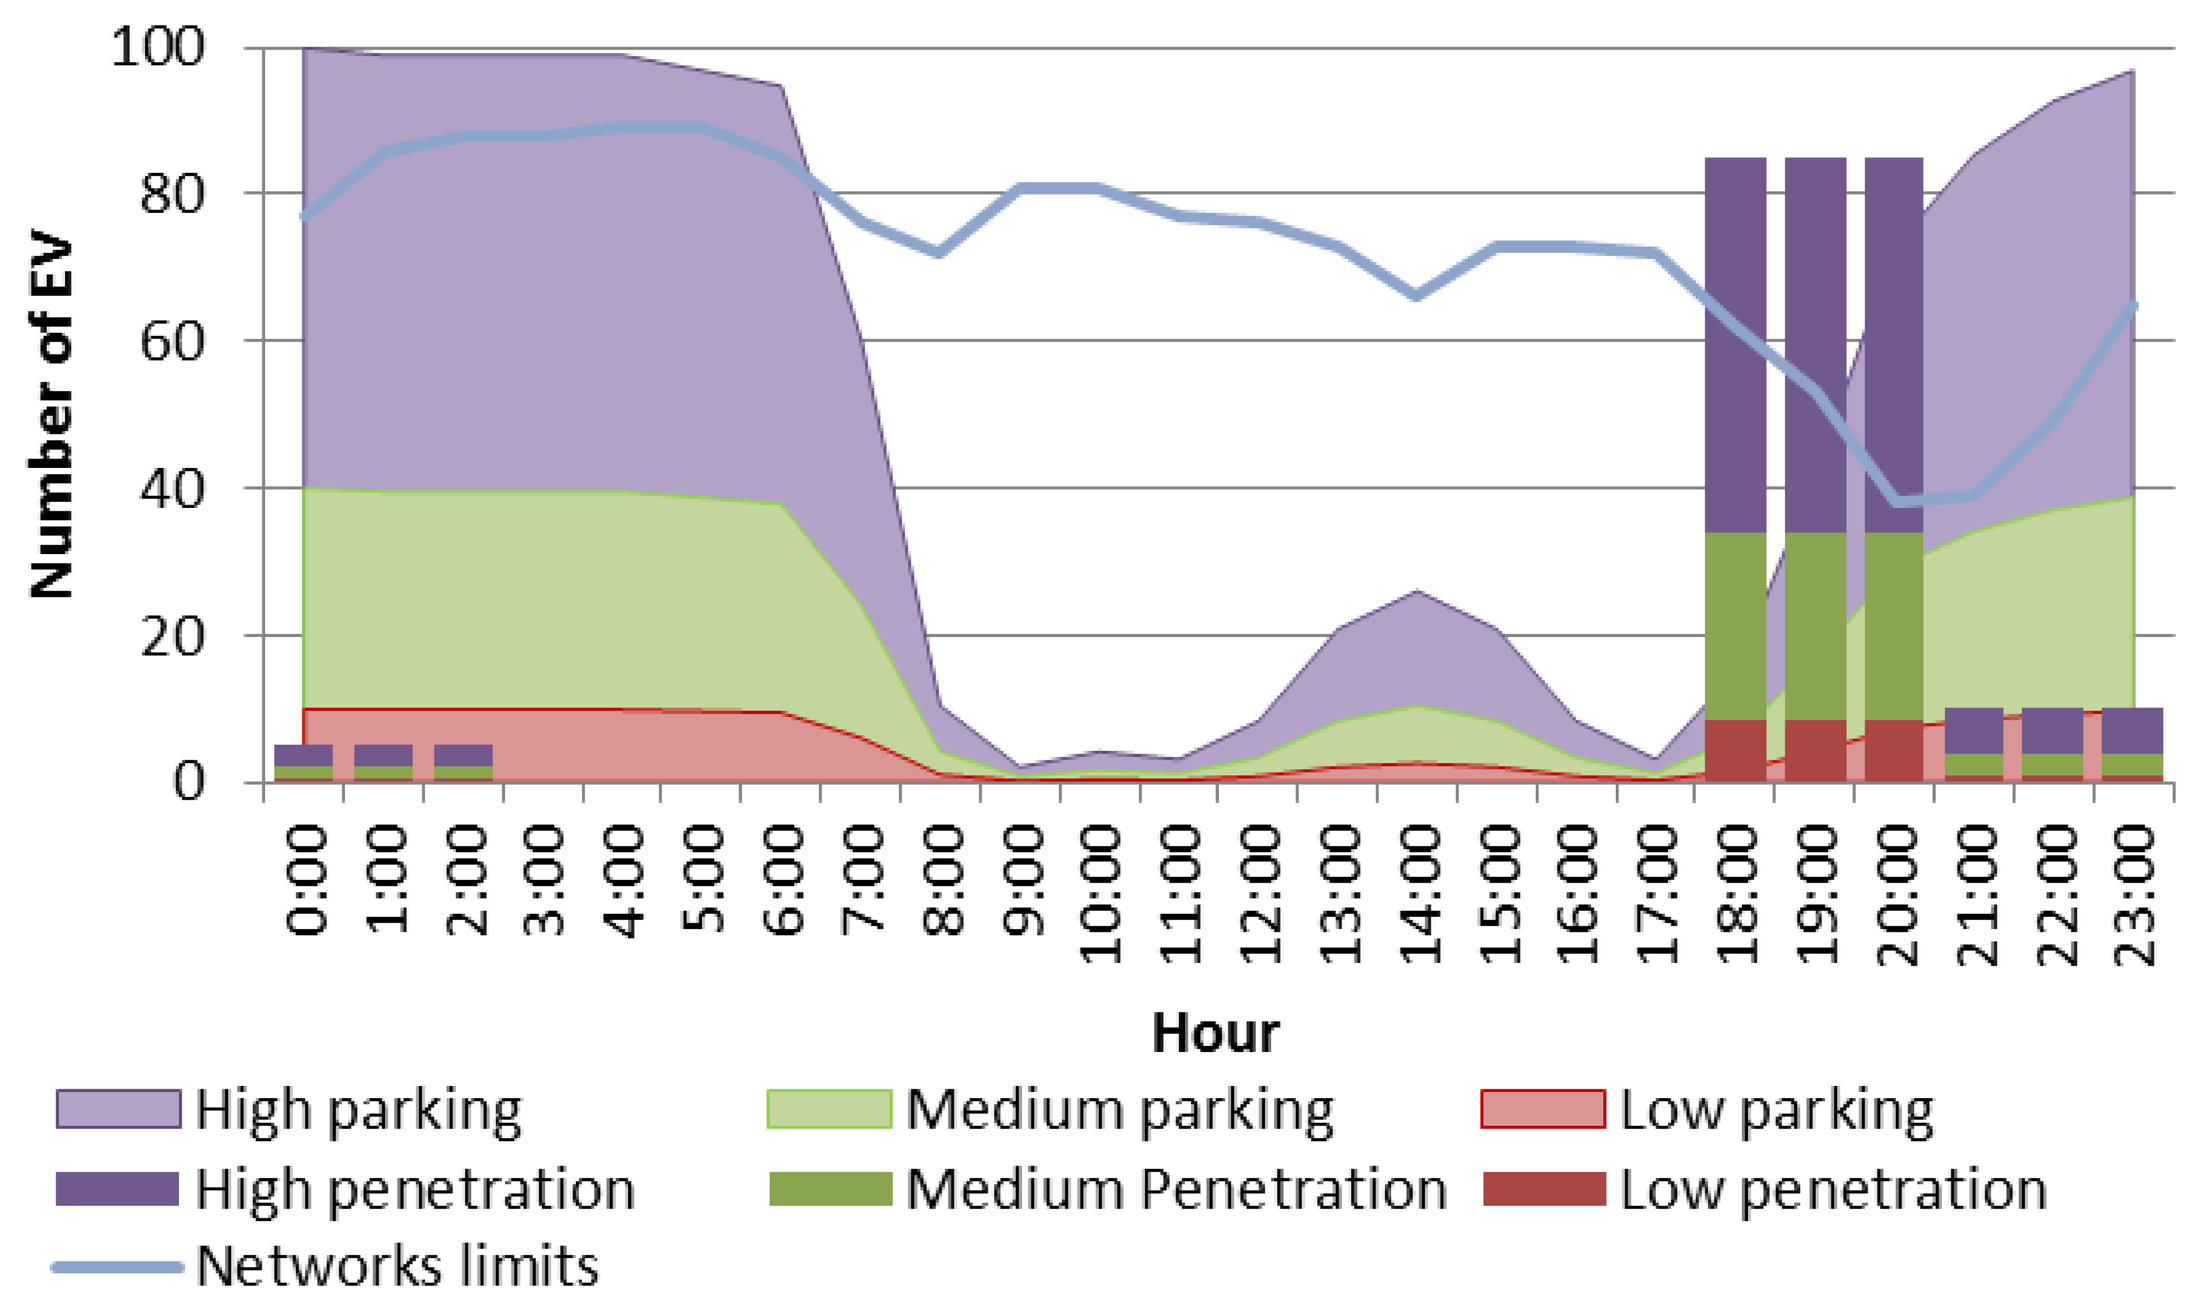
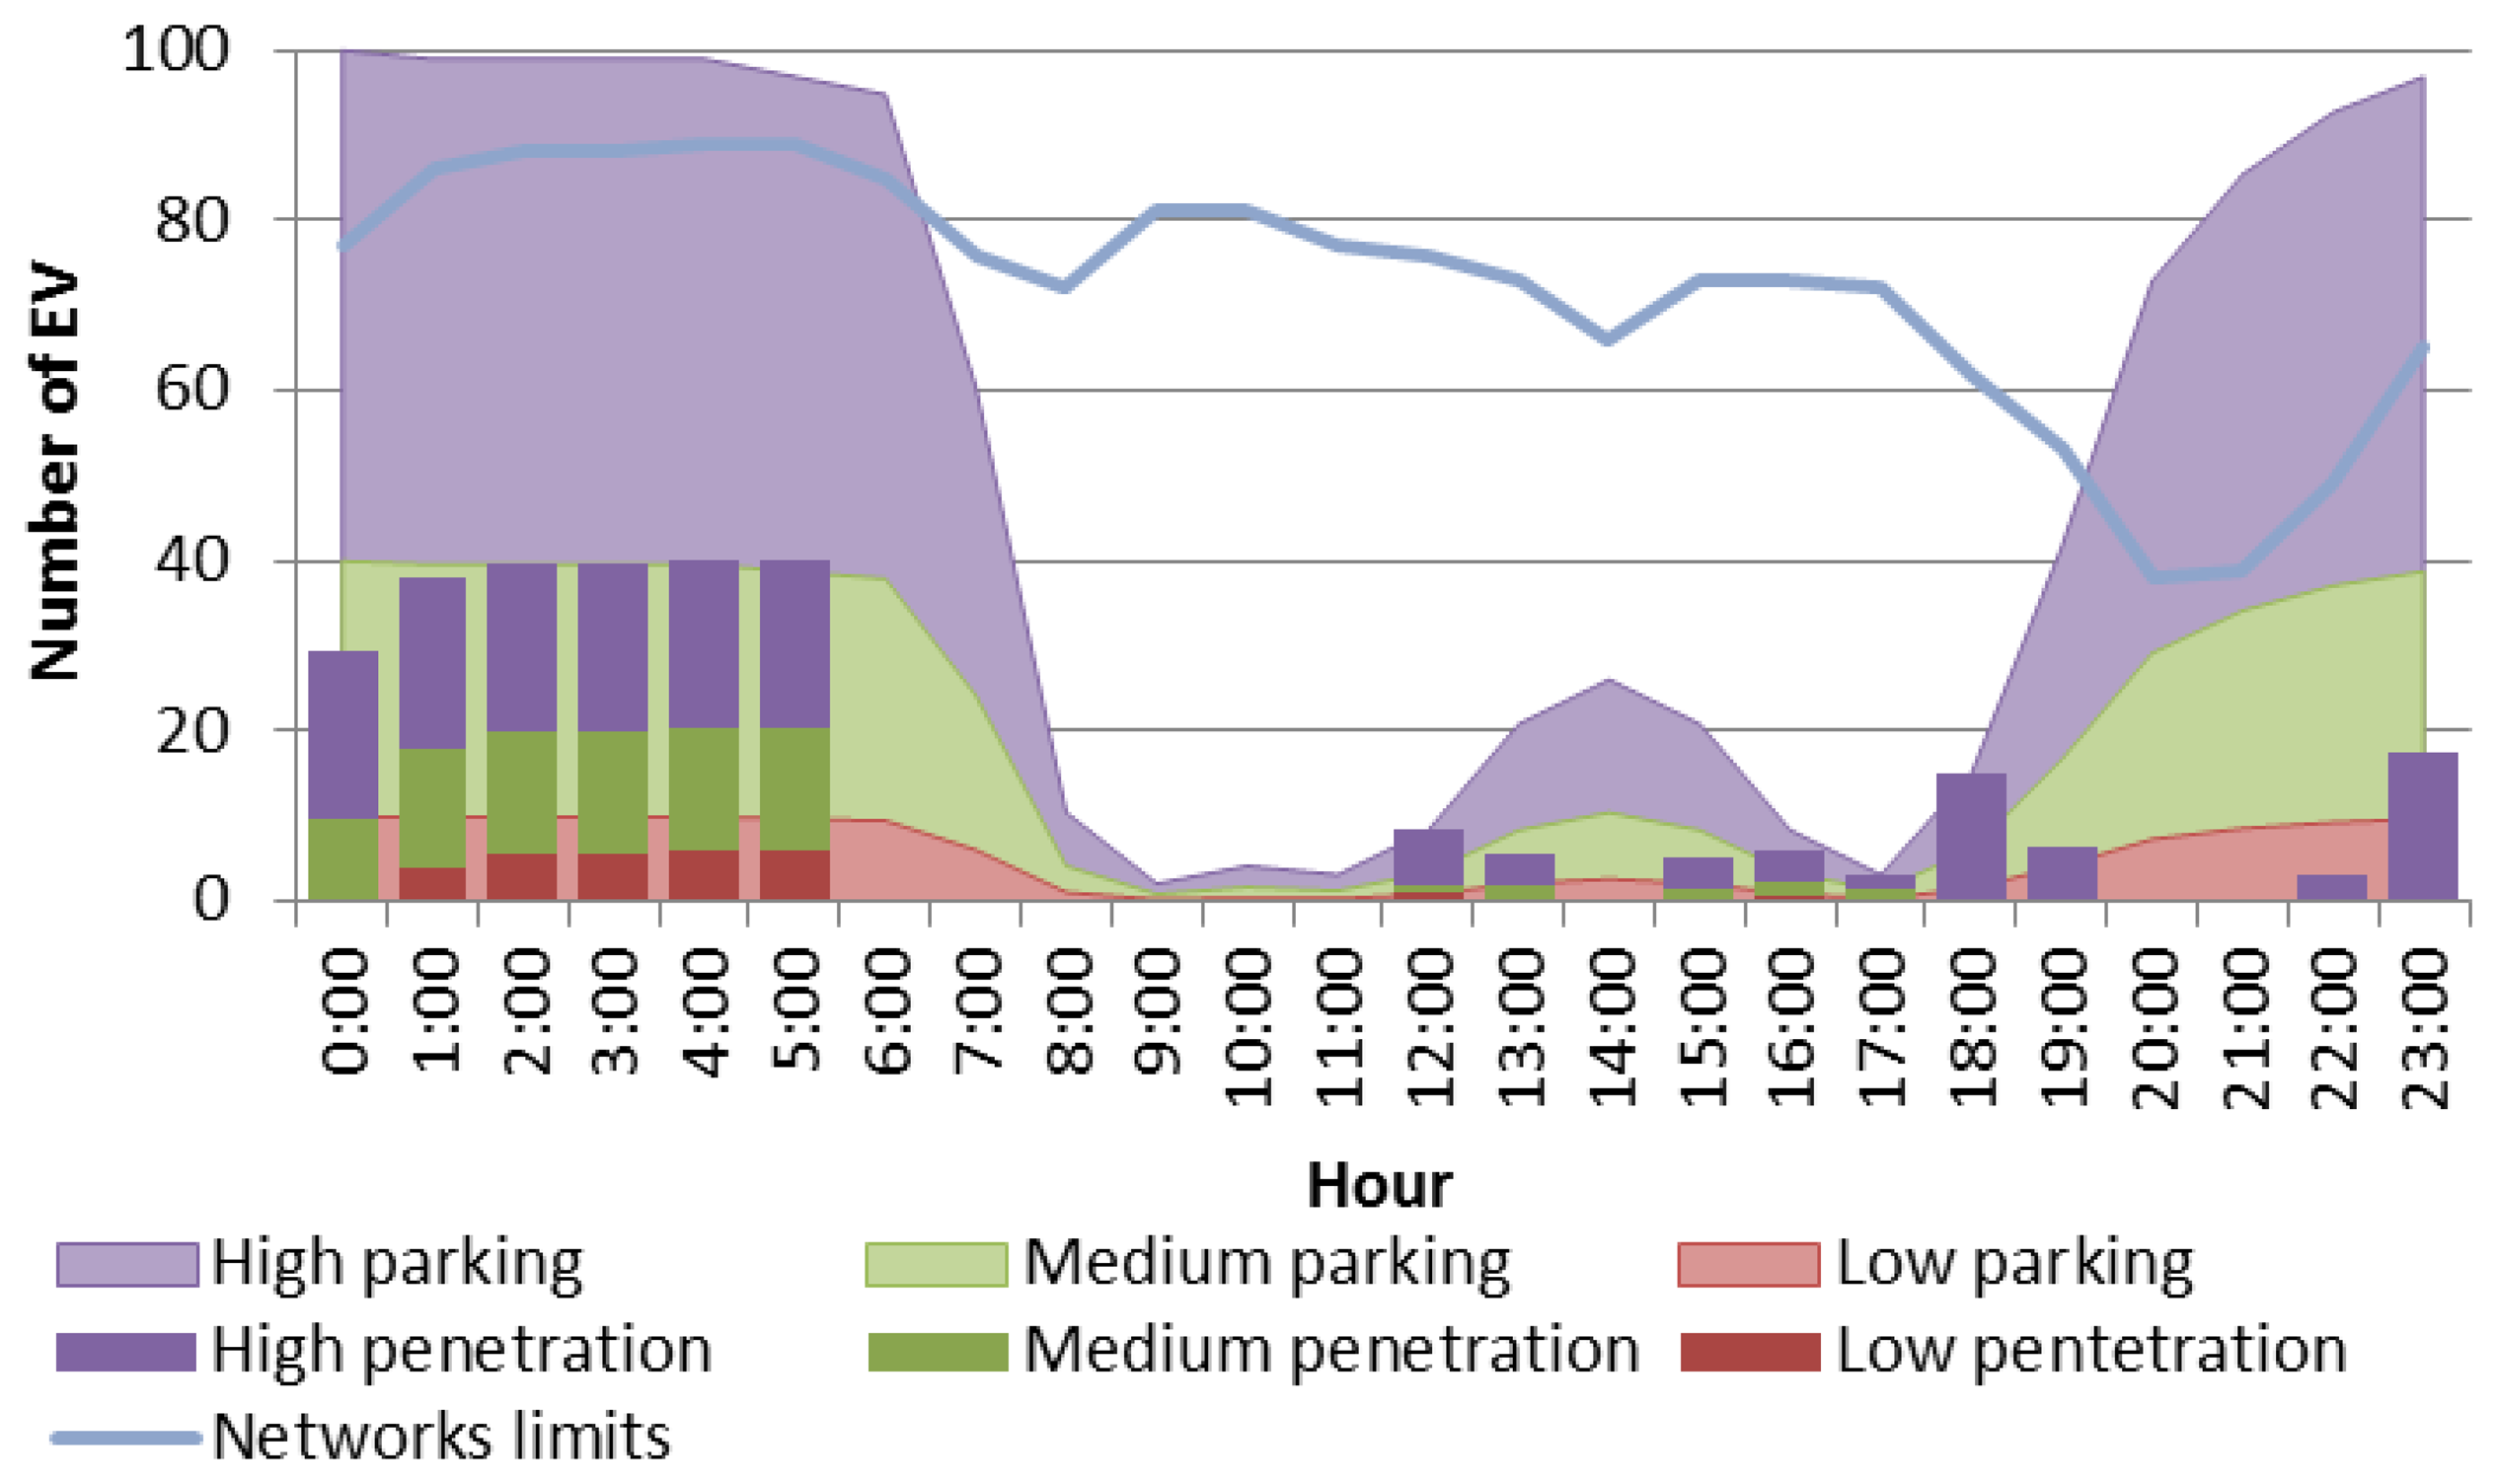
To determine the capacity of the residential network to assess the EV demand, an analysis of the power system capacity was performed. The maximum number of EVs that could be charged within network limits is shown with a blue line in Figure 14. Moreover, Figure 14 shows an hourly comparison between the number of EVs that are parked at home and therefore are available to be charged using the parking pattern described in Section 2, for each penetration level (represented by low, medium and high parking areas), and for the EV charging pattern provided by the GA (low, medium and high penetration columns). It should be noted that during peak hours, the amount of EV charging exceeds the maximum load capacity of the main substation transformer; therefore, this dumb charging strategy produces an overload of the main transformer from 19:00 to 21:59 for high EV penetration.
5.2.2. Conventional Controlled Charging
In this situation, the EV is plugged into the electricity network as soon as the driver arrives home. However, the charging process is controlled by the smart grid aggregator based on the time frame. The charging periods considered by the aggregator are the following:
85% of EVs are charged during the valley load period, and the charging process is initiated at 1:00, considering slow charging and continuous charge duration (for example, 3 h).
5% of EVs are charged during the peak load periods (19:00–21:59).
10% of EVs are charged during the remaining hours of the day.
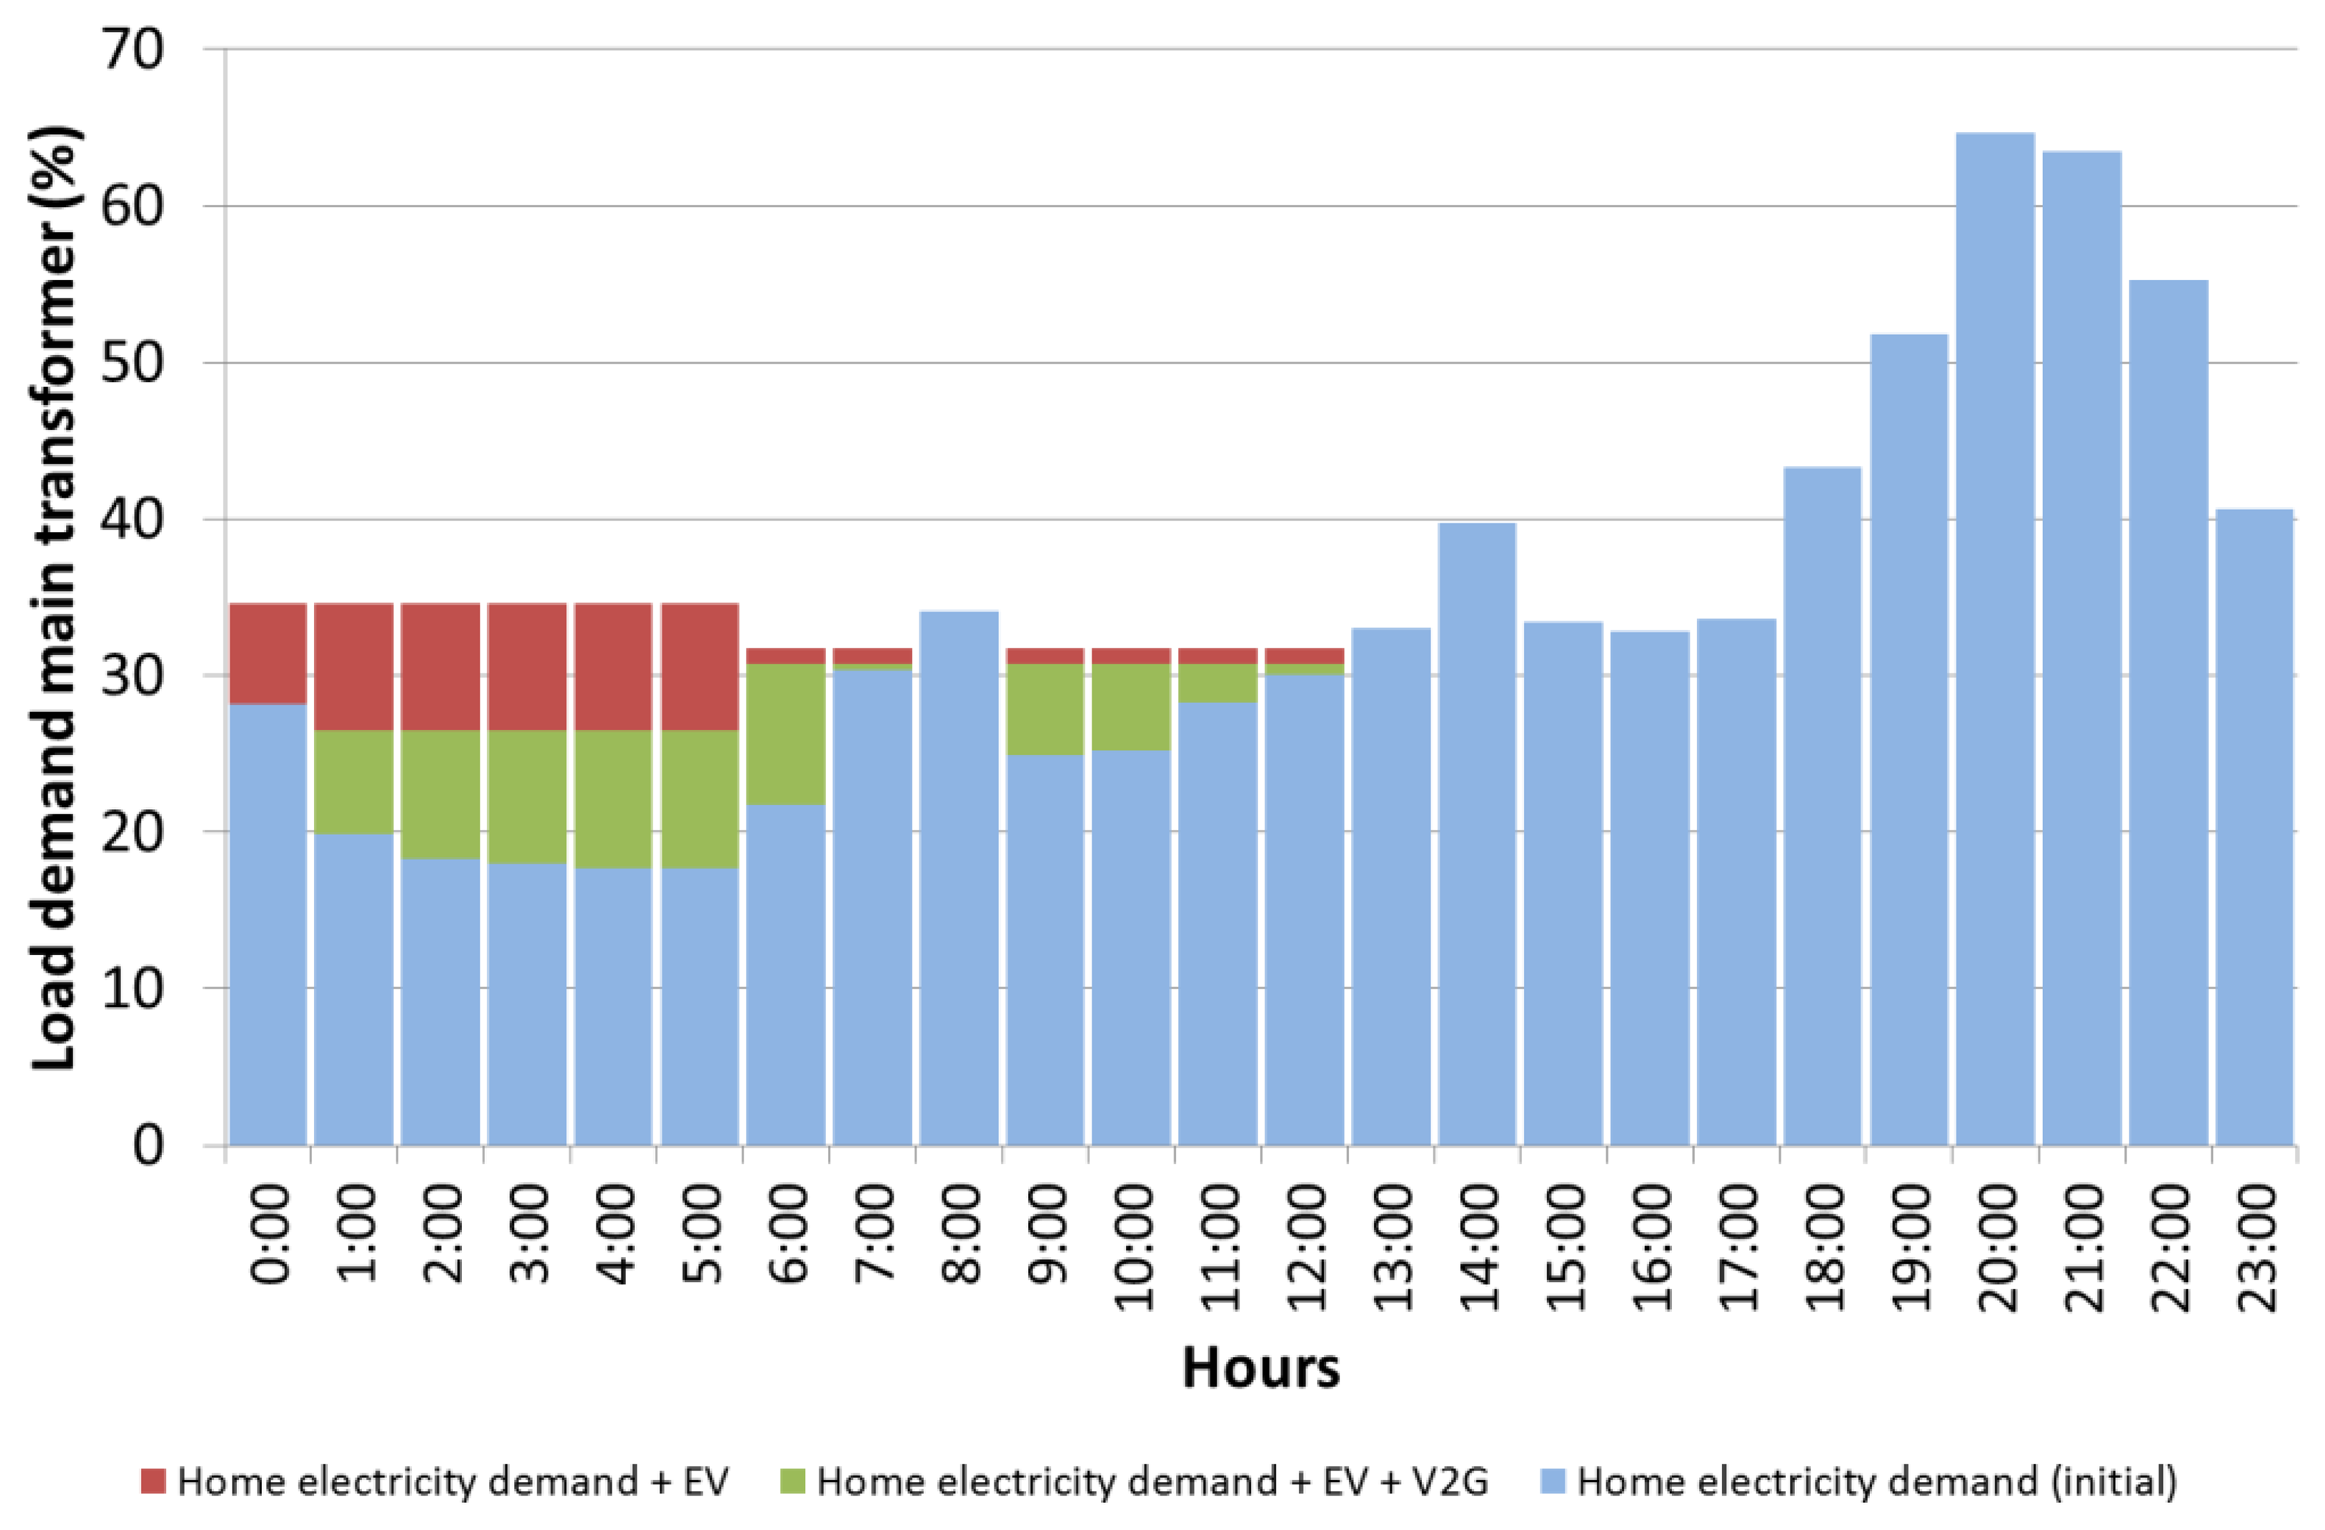
Figure 15 represents the final loading (%) at the substation transformer. It should be noted that the final loading only exceeds network capacity during the first hour of the day and for high penetration levels. Because the controlled charging scheme only considers the time delay and initiates the EV charging at the same moment in time, the peak demand is displaced from 21:00 (without EVs) to 24:00 (with EVs). Voltage profiles for the three main feeders are shown in Figures 16, 17 and 18 for different EV penetration levels and for the hour h = 0:00.
Figure 19 provides the following information:
- -
Blue solid line represents the maximum number of EV that could be charged considering network limits.
- -
Stacked bar graph represents the number of EVs charging hourly for low, medium and high penetration levels.
- -
Colored area represents the number of EVs parked at home and available to be charged based on the parking patterns for low, medium and high penetration levels.
5.2.3. Smart Management G2V
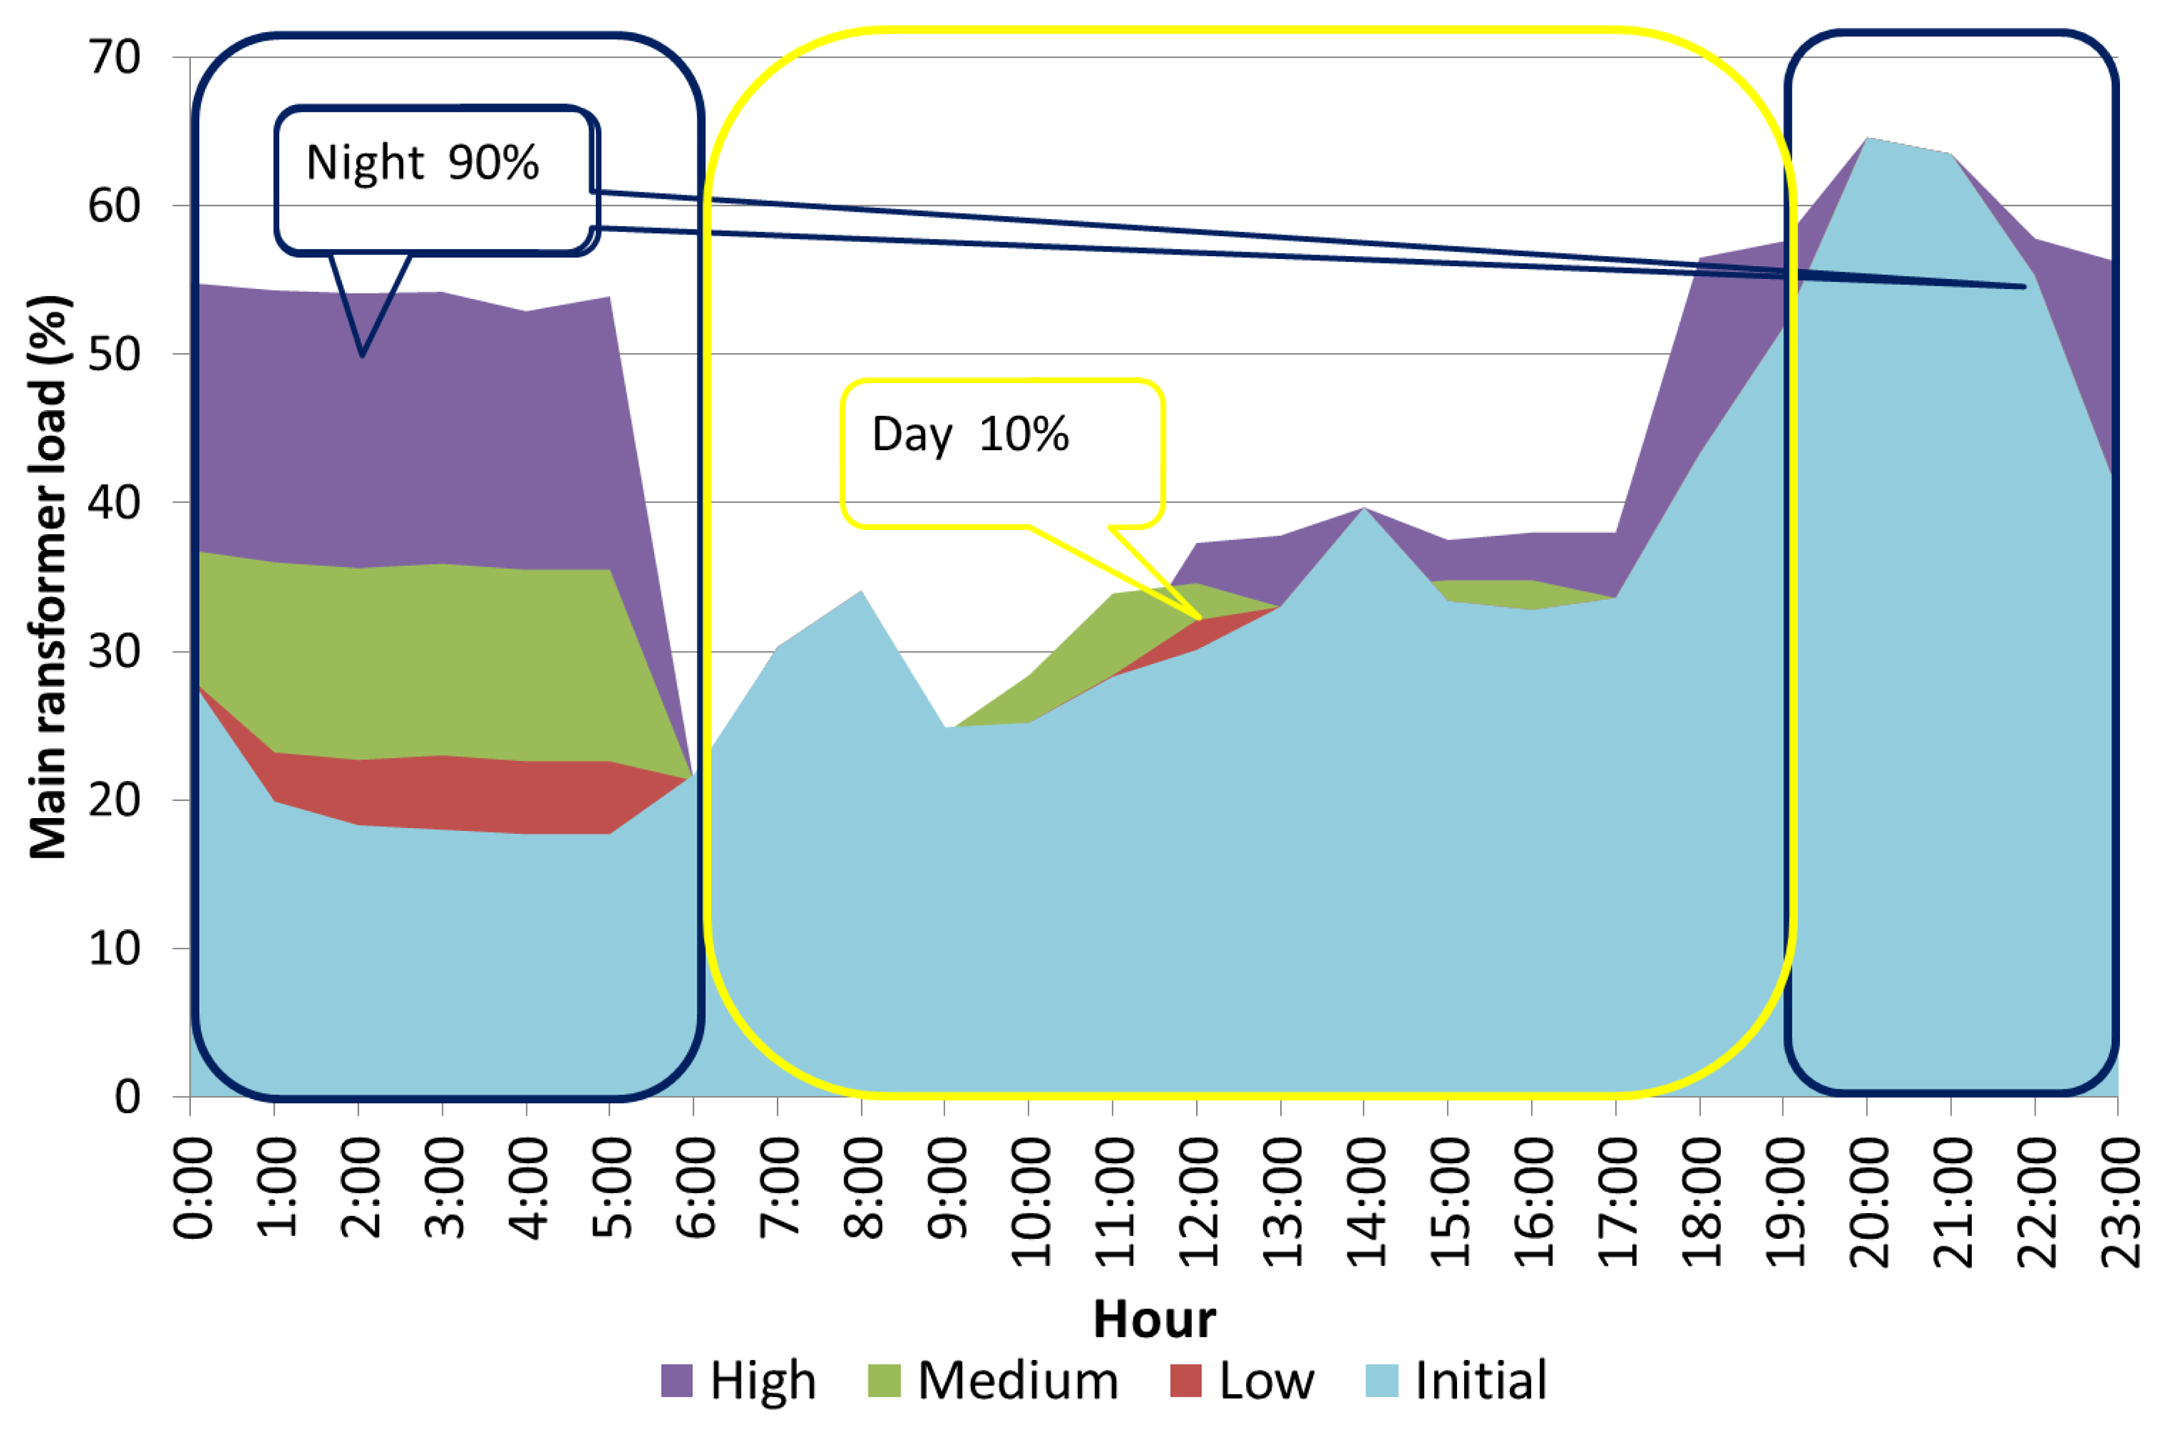
In this section, the smart G2V load management technique is applied to the residential low-voltage network. Smart management is based on the GA developed in Section 4.3. In this case, two periods of time are considered for fully charging EVs throughout the day: during the daylight period (7:00–18:59) 10% of parked EVs are charged, and 90% of EVs are charged during the night timeframe (19:00–6:59). As shown in Figure 20, the smart G2V EV load management technique improves the post-operation load profile of the main transformer. In this case, the peak load of the main transformer is not exceeded during any hour. It can be observed that the electricity demand for the high EV penetration level is spread throughout the night so that no overload takes place. Figure 21 shows an EV pattern connection for the different penetration levels and compares it with the availability parking pattern and the maximum number of EVs for the overload. The GA charging pattern does not exceed the maximum number of EVs for overload or the parking pattern in any case.
5.2.4. Smart Management G2V + V2G
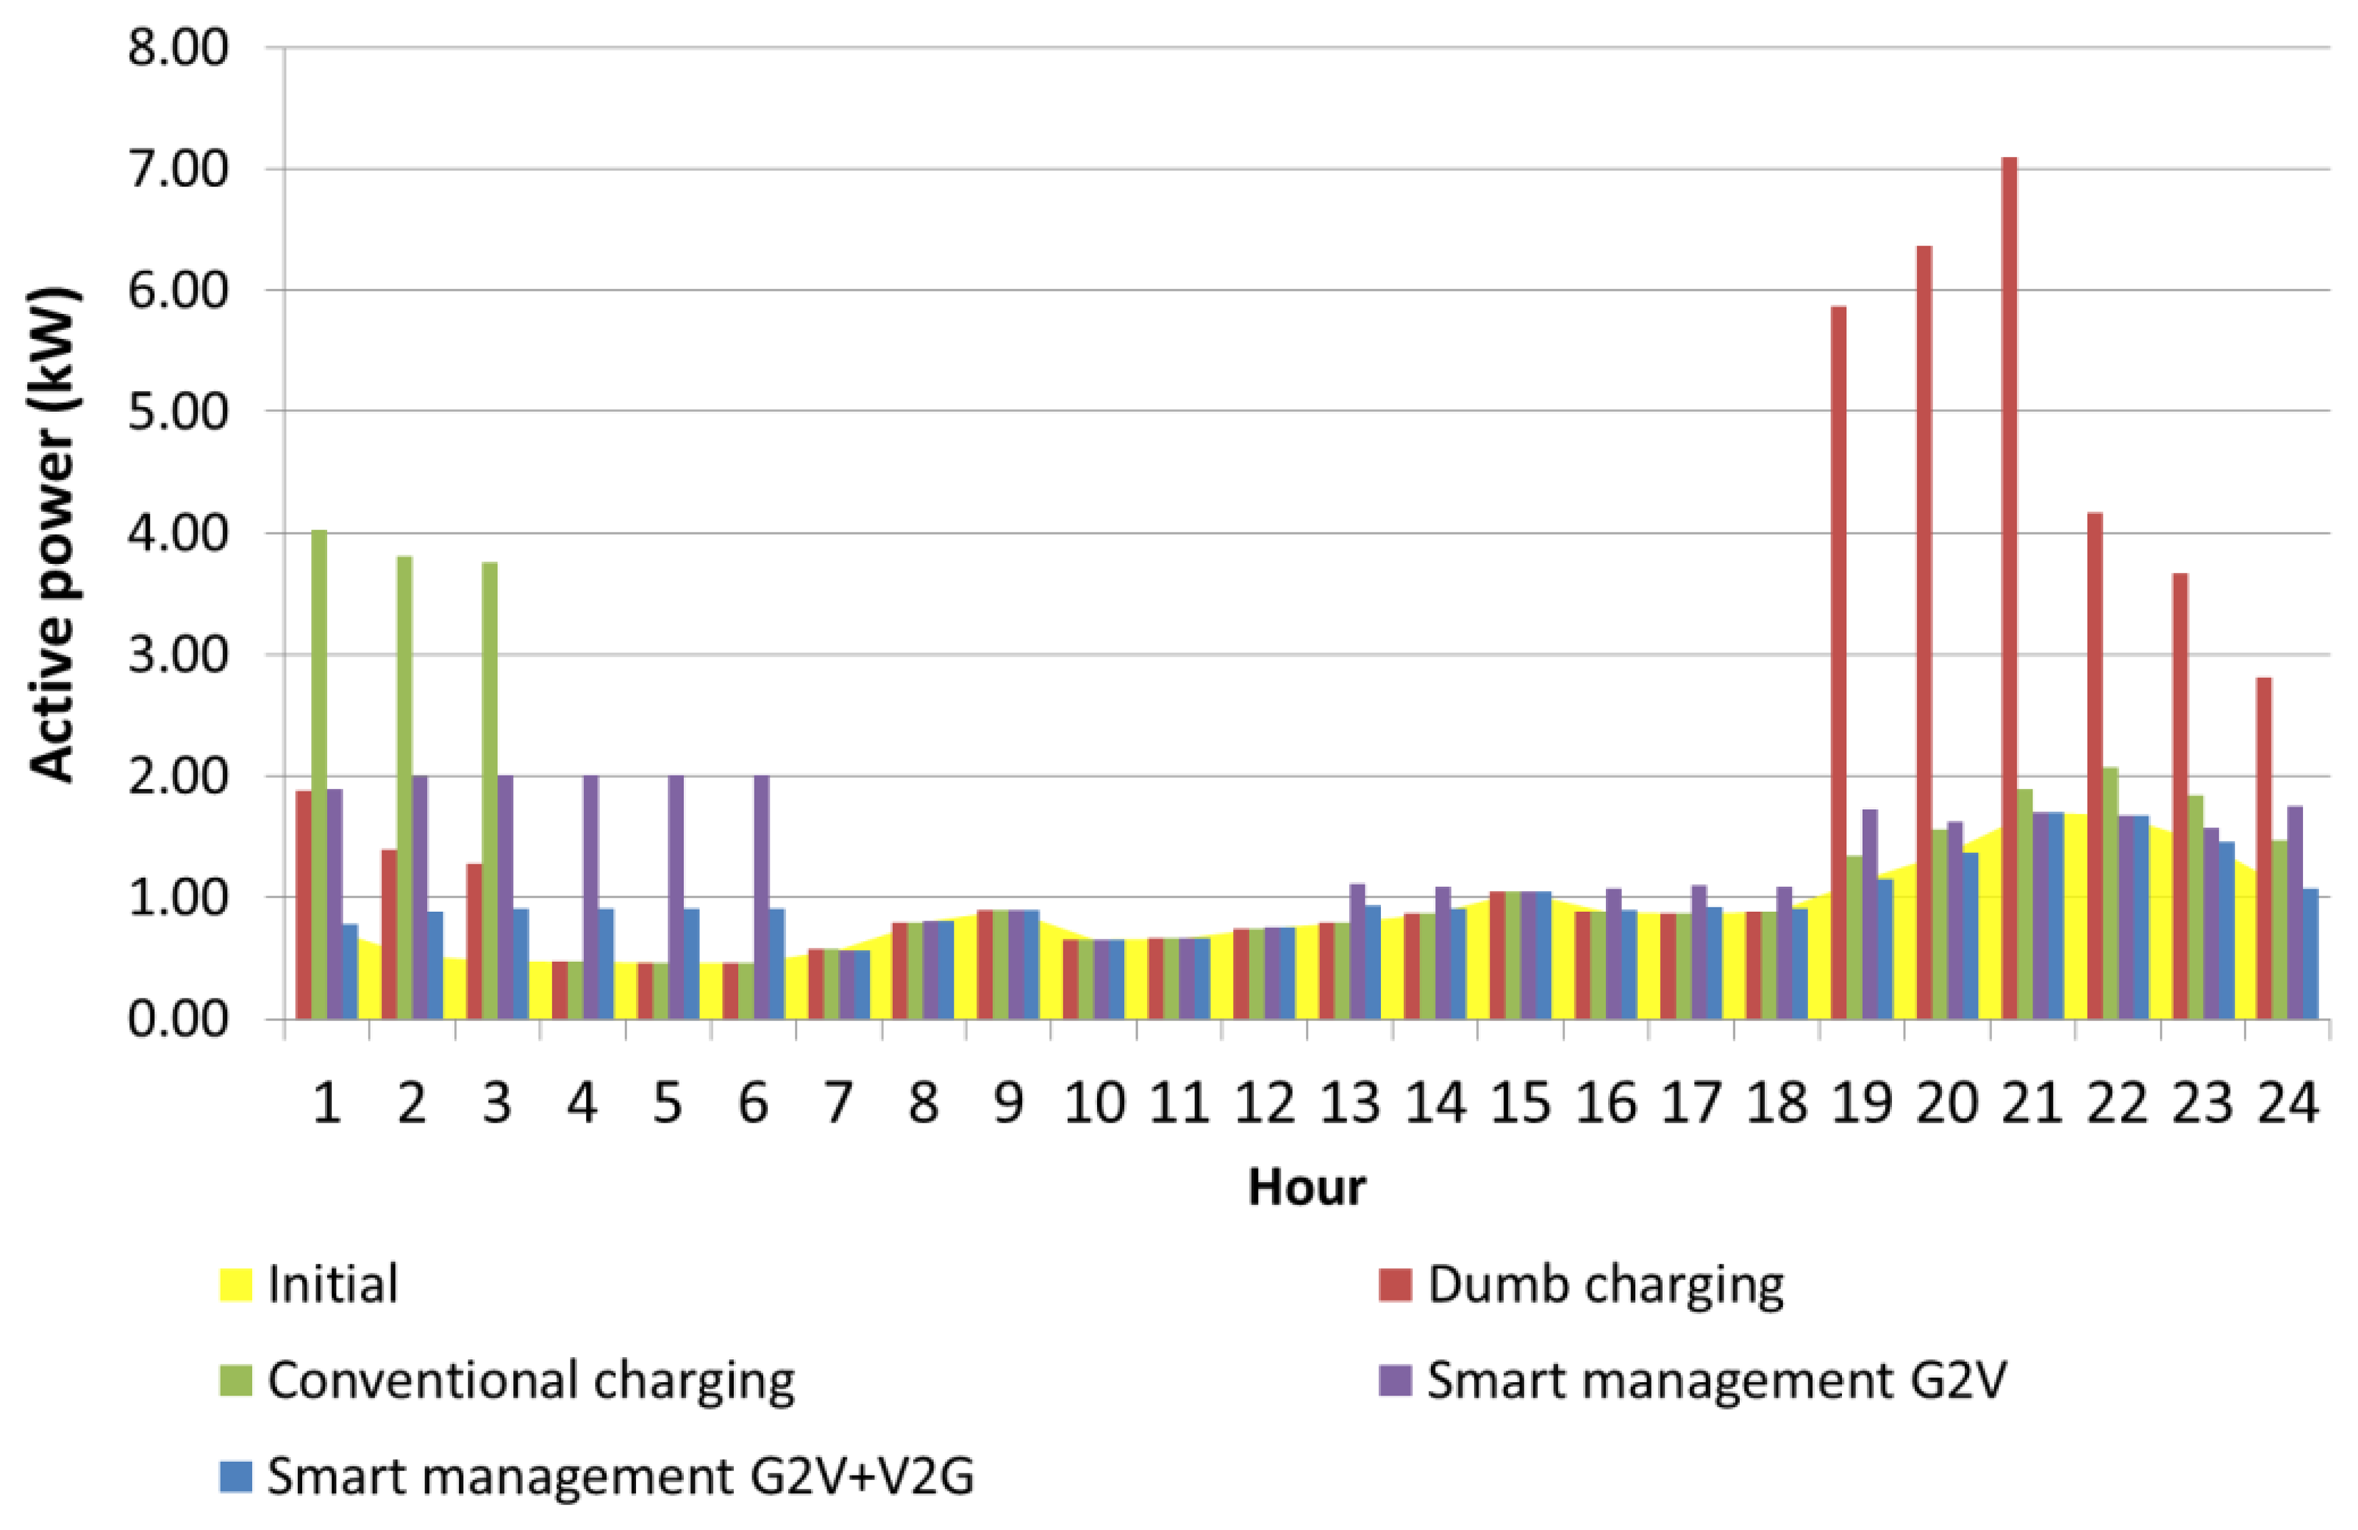
The Smart G2V + V2G load management technique is applied to the low-voltage power system under study. In this case, the EVs are assumed to be equipped with technology capable of providing energy stored in the battery to the grid (V2G) when they are parked at home; therefore, EVs can act as loads and generators. This new capability enables EVs to offer ancillary services, such as spinning reserves and regulation, to the system operators by working as flexible energy storage resources [13]. Smart scheduling with a combination of G2V and V2G offers the possibility of managing EVs as V2G to the smart grid aggregator, offering peak savings. In addition, they can be used as G2V providers, offering the service of valley filling. Moreover, EVs capable of acting as flexible storage units could be managed in terms of energy demand requirements for movements of daily trips and energy storage required as a producer based on the DSM. The storage capacity could lead to greater integrations of distributed energy resources by assessing their energy fluctuations. EVs with V2G technology could be charged, discharged or disconnected during each hour of the day. For this reason, the scheduling management of V2G must optimise the charging and discharging of the batteries to improve the operations of power systems, reducing the necessity of installing additional new reactive power resources or generation sources. In smart V2G management, it is assumed that a percentage of the energy stored in EV batteries could be delivered to the grid during several hours in a day. It is considered that the V2G exchange is possible only when EVs are plugged-in at home; therefore, two timeframes are considered: daylight (7:00–18:59), when 10% of the V2G stored energy can be injected into the network, and during the night, when 90% of the EVs are plugged-in at home and are capable of delivering part of their stored energy to the grid. According to the 2020 forecast of EV penetration levels [16], a smart G2V + V2G analysis has been developed for a medium penetration level of EVs in the network. As shown in Figure 22, the smart G2V + V2G load management technique (green columns) improves the post-operation load profile of the smart G2V main transformer. A brief reduction of the load demand on the power network throughout the day is possible because of the V2G capability of the EV; therefore, the load profile is reduced by 20% between 24:00 and 6:00 compared to the total load demand at the main transformer for the G2V scheme. As in the previous case, it should be noted that the smart G2V+V2G technique avoids main transformer overload and respects parking patterns. Figure 23 shows the power profile in feeder number 3 where EVs are connected for different charging strategies: Dumb charging; conventional charging; Smart management G2V; Smart G2V + V2G management technique. It can be noted that power flowing across feeder's lines is fairly constant throughout the day by using smart charging. Smart G2V + V2G management technique prevents the aging of distribution feeder elements.
6. Conclusions
This paper develops a smart scheme for EV battery-charging management. The realistic behaviour of drivers has been used to obtain the mobility patterns and parking availability aspect of EVs to improve the charging and discharging process. EV integration into power systems has been carried out based on peak shavings and valley filling services. In addition, the reduction of substation transformer aging has been proved. A comparison between dumb, conventional, smart G2V and smart G2V + V2G battery management techniques in an existing residential network has also been performed.
The problem is solved using GAs and focuses on an authentic residential low-voltage topology. The formulation of the problem takes into account network constraints, which are related to voltage limits, lines and transformer thermal limits, as well as battery models. Moreover, the availability connection patterns have been incorporated as inequality constraints. The result of the GA is the optimal schedule for charging EV batteries throughout the day, taking into account drivers' behaviour.
Four different management techniques have been tested in the power system. The first corresponds to uncontrollable, or dumb, management in which EVs charge their batteries as soon as they arrive home. It should be noted that under this scheme, the peak load increases and exceeds the thermal limits of the substation transformer accelerating the aging of the transformers. The second schedule corresponds to conventional management in which EVs are charged in a new time frame that corresponds to valley hours. In this case, the load profile has a new peak demand during the night hours, and in high EV penetration level, the substation transformer is overloaded. The third and fourth schemes correspond to smart management techniques. The G2V management technique improves the load profile of the daily demand, and the substation transformer is not overloaded in any case. A combination of smart G2V and V2G EV charging techniques improves the load profile as well, and it should be noted that in this smart charging scenario, the total load demand of the main transformer during valley frame hours is smaller than in the G2V scenario. This is caused by the capacity of the EVs to discharge their batteries and provide this energy to the power system, thus reducing the stress on the transformer. Focusing on the last management scheme, EVs could be treated as loads or generators depending on the necessities of the DSO. This flexibility in the behaviour of EVs offers a number of advantages to DSOs in terms of assessing the load demand of power systems and flattening the load profile as has been demonstrated in this paper and reducing transformer aging. Furthermore, V2G technology can be used to address distributed energy resource generation oscillations and allows EVs to be treated as new generators in the electricity generation portfolio.
Acknowledgments
This work has been partially funded by the Spanish Ministry of Industry, Energy and Tourism under contract DOMOCELL TSI-020100-2009-849.
Conflicts of Interest
The authors declare no conflict of interest.
Appendix

| Branch | Line R (p.u.) | Line X (p.u.) | Branch | Line R (p.u.) | Line X (p.u.) |
|---|---|---|---|---|---|
| 1 | 0.714 | 0.452 | 18 | 2.962 | 1.872 |
| 2 | 0.712 | 0.450 | 19 | 1.339 | 0.194 |
| 3 | 1.829 | 1.156 | 20 | 2.499 | 1.580 |
| 4 | 5.851 | 3.698 | 21 | 1.332 | 0.193 |
| 5 | 11.030 | 1.600 | 22 | 13.322 | 2.078 |
| 6 | 1.431 | 0.904 | 23 | 0.260 | 0.164 |
| 7 | 1.652 | 1.044 | 24 | 1.776 | 0.277 |
| 8 | 5.647 | 3.569 | 25 | 1.776 | 0.277 |
| 9 | 1.784 | 1.128 | 26 | 0.346 | 0.219 |
| 10 | 1.674 | 1.058 | 27 | 0.346 | 0.219 |
| 11 | 1.332 | 0.193 | 28 | 1.776 | 0.258 |
| 12 | 1.675 | 1.059 | 29 | 1.776 | 0.258 |
| 13 | 1.332 | 0.193 | 30 | 1.776 | 0.258 |
| 14 | 1.443 | 0.912 | 31 | 1.776 | 0.258 |
| 15 | 1.332 | 0.193 | 32 | 1.776 | 0.258 |
| 16 | 0.368 | 0.233 | 33 | 1.776 | 0.258 |
| 17 | 1.333 | 0.194 | 34 | 1.776 | 0.258 |
| 35 | 1.776 | 0.258 | 79 | 3.297 | 2.084 |
| 36 | 3.688 | 2.331 | 80 | 4.461 | 2.820 |
| 37 | 1.335 | 0.194 | 81 | 3.009 | 1.902 |
| 38 | 3.581 | 2.263 | 82 | 1.997 | 1.262 |
| 39 | 1.332 | 0.193 | 83 | 1.295 | 0.188 |
| 40 | 1.824 | 1.153 | 84 | 3.743 | 2.366 |
| 41 | 1.332 | 0.193 | 85 | 1.332 | 0.193 |
| 42 | 1.848 | 1.168 | 86 | 2.823 | 1.784 |
| 43 | 2.123 | 1.342 | 87 | 1.332 | 0.193 |
| 44 | 1.332 | 0.193 | 88 | 1.332 | 0.193 |
| 45 | 1.336 | 0.194 | 89 | 3.398 | 2.148 |
| 46 | 1.776 | 0.258 | 90 | 1.776 | 0.258 |
| 47 | 1.776 | 0.258 | 91 | 1.776 | 0.258 |
| 48 | 1.776 | 0.258 | 92 | 1.776 | 0.258 |
| 49 | 1.776 | 0.258 | 93 | 1.776 | 0.258 |
| 50 | 1.776 | 0.258 | 94 | 2.327 | 1.471 |
| 51 | 1.776 | 0.258 | 95 | 1.327 | 0.193 |
| 52 | 1.776 | 0.258 | 96 | 5.825 | 3.681 |
| 53 | 1.776 | 0.258 | 97 | 1.340 | 0.194 |
| 54 | 1.776 | 0.258 | 98 | 0.378 | 0.239 |
| 55 | 1.776 | 0.258 | 99 | 1.310 | 0.190 |
| 56 | 3.243 | 2.050 | 100 | 4.588 | 2.899 |
| 57 | 1.332 | 0.193 | 101 | 1.332 | 0.193 |
| 58 | 4.950 | 3.129 | 102 | 1.776 | 0.258 |
| 59 | 1.332 | 0.193 | 103 | 1.776 | 0.258 |
| 60 | 3.712 | 2.346 | 104 | 3.659 | 2.313 |
| 61 | 1.330 | 0.193 | 105 | 1.332 | 0.193 |
| 62 | 0.346 | 0.219 | 106 | 2.315 | 1.463 |
| 63 | 0.346 | 0.219 | 107 | 1.332 | 0.193 |
| 64 | 1.776 | 0.258 | 108 | 0.564 | 0.356 |
| 65 | 1.776 | 0.258 | 109 | 1.332 | 0.193 |
| 66 | 1.776 | 0.258 | 110 | 2.651 | 1.675 |
| 67 | 1.776 | 0.258 | 111 | 0.260 | 0.164 |
| 68 | 1.776 | 0.258 | 112 | 1.776 | 0.258 |
| 69 | 1.776 | 0.258 | 113 | 1.776 | 0.258 |
| 70 | 1.984 | 1.254 | 114 | 1.776 | 0.258 |
| 71 | 3.583 | 0.520 | 115 | 1.776 | 0.258 |
| 72 | 2.376 | 1.502 | 116 | 1.776 | 0.258 |
| 73 | 0.712 | 0.450 | 117 | 1.776 | 0.258 |
| 74 | 2.390 | 1.510 | 118 | 4.883 | 3.086 |
| 75 | 1.332 | 0.193 | 119 | 0.497 | 0.314 |
| 76 | 0.976 | 0.617 | 120 | 1.207 | 0.763 |
| 77 | 1.331 | 0.193 | 121 | 1.332 | 0.193 |
| 78 | 0.194 | 0.123 | 122 | 5.718 | 3.614 |
| 123 | 1.332 | 0.193 | 165 | 1.776 | 0.258 |
| 124 | 1.559 | 0.986 | 166 | 1.776 | 0.258 |
| 125 | 1.332 | 0.193 | 167 | 1.776 | 0.258 |
| 126 | 1.564 | 0.988 | 168 | 1.776 | 0.258 |
| 127 | 1.332 | 0.193 | 169 | 1.776 | 0.258 |
| 128 | 1.564 | 0.989 | 170 | 1.776 | 0.258 |
| 129 | 1.332 | 0.193 | 171 | 1.776 | 0.258 |
| 130 | 1.563 | 0.988 | 172 | 1.776 | 0.258 |
| 131 | 1.332 | 0.193 | 173 | 1.776 | 0.258 |
| 132 | 6.533 | 4.129 | 174 | 1.776 | 0.258 |
| 133 | 1.332 | 0.193 | 175 | 1.776 | 0.258 |
| 134 | 1.646 | 1.040 | 176 | 1.776 | 0.258 |
| 135 | 1.332 | 0.193 | 169 | 1.776 | 0.258 |
| 136 | 1.647 | 1.041 | 170 | 1.776 | 0.258 |
| 137 | 1.332 | 0.193 | 171 | 1.776 | 0.258 |
| 138 | 1.623 | 1.026 | 172 | 1.776 | 0.258 |
| 139 | 1.332 | 0.193 | 173 | 1.776 | 0.258 |
| 140 | 0.625 | 0.395 | 174 | 1.776 | 0.258 |
| 141 | 1.776 | 0.258 | 175 | 1.776 | 0.258 |
| 142 | 1.332 | 0.193 | 176 | 1.776 | 0.258 |
| 143 | 1.329 | 0.840 | 177 | 1.776 | 0.258 |
| 144 | 1.776 | 0.258 | 178 | 1.570 | 0.993 |
| 145 | 1.776 | 0.258 | 179 | 1.332 | 0.193 |
| 146 | 1.332 | 0.193 | 180 | 1.574 | 0.995 |
| 147 | 1.617 | 1.022 | 181 | 1.332 | 0.193 |
| 148 | 1.332 | 0.193 | 182 | 1.572 | 0.994 |
| 149 | 1.332 | 0.193 | 183 | 1.332 | 0.193 |
| 150 | 1.610 | 1.018 | 184 | 1.332 | 0.193 |
| 151 | 1.332 | 0.193 | 185 | 1.831 | 1.157 |
| 152 | 1.862 | 1.177 | 186 | 1.776 | 0.258 |
| 153 | 0.346 | 0.219 | 187 | 1.776 | 0.258 |
| 154 | 0.346 | 0.219 | 188 | 0.346 | 0.219 |
| 155 | 1.776 | 0.258 | 189 | 0.346 | 0.219 |
| 156 | 1.776 | 0.258 | 190 | 1.776 | 0.258 |
| 157 | 1.776 | 0.258 | 191 | 1.776 | 0.258 |
| 158 | 1.776 | 0.258 | 192 | 1.776 | 0.258 |
| 159 | 1.776 | 0.258 | 193 | 1.776 | 0.258 |
| 160 | 1.776 | 0.258 | 194 | 1.776 | 0.258 |
| 161 | 1.776 | 0.258 | 195 | 1.776 | 0.258 |
| 162 | 1.776 | 0.258 | 196 | 1.776 | 0.258 |
| 163 | 1.776 | 0.258 | 197 | 1.776 | 0.258 |
| 164 | 1.776 | 0.258 |
References
- Azad, A.P.; Beaude, O.; Lasaulce, S.; Pfeiffer, L. An optimal control approach for EV charging with distribution grid ageing. Proceedings of the 2013 First International Black Sea Conference on Communications and Networking (BlackSeaCom), Batumi, Adjara, 3–5 July 2013; pp. 206–210.
- Guía práctica de la energía: Consumo eficiente y responsable. Available online: http://www.idae.es/index.php/mod.pags/mem.detalle/relcategoria.1161/id.542/relmenu.64 (accessed on 30 January 2014).
- Browne, D.; O'Mahony, M.; Caulfield, B. How should barriers to alternative fuels and vehicles be classified and potential policies to promote innovative technologies be evaluated. J. Clean. Prod. 2012, 35, 140–151. [Google Scholar]
- Silvester, S.; Beella, S.K.; van Timmeren, A.; Bauer, P.; Quist, J.; van Dijk, S. Exploring design scenarios for large-scale implementation of electric vehicles; the Amsterdam Airport Schiphol case. J. Clean. Prod. 2013, 48, 211–219. [Google Scholar]
- Lopes, J.A.P.; Soares, F.J.; Almeida, P.M.R. Integration of Electric Vehicles in the Electric Power System. IEEE Proc. 2011, 99, 168–183. [Google Scholar]
- Weis, A.; Jaramillo, P.; Michalek, J. Estimating the potential of controlled plug-in hybrid electric vehicle charging to reduce operational and capacity expansion costs for electric power systems with high wind penetration. Appl. Energy 2014, 115, 190–204. [Google Scholar]
- Fernandes, C.; Frías, P.; Latorre, J.M. Impact of vehicle-to-grid on power system operation costs: The Spanish case study. Appl. Energy 2012, 96, 194–202. [Google Scholar]
- Clement-Nyns, K.; Haesen, E.; Driesen, J. The impact of vehicle-to-grid on the distribution grid. Electr. Power Syst. Res. 2011, 81, 185–192. [Google Scholar]
- Finn, P.; Fitzpatrick, C.; Connolly, D. Demand side management of electric car charging: Benefits for consumer and grid. Energy 2012, 42, 358–363. [Google Scholar]
- Soares, J.; Canizes, B.; Lobo, C.; Vale, Z.; Morais, H. Electric Vehicle Scenario Simulator Tool for Smart Grid Operators. Energies 2012, 5, 1881–1899. [Google Scholar]
- Sexauer, J.M.; McBee, K.D.; Bloch, K.A. Applications of probability model to analyze the effects of electric vehicle chargers on distribution transformers. Proceedings of the 2011 IEEE Electrical Power and Energy Conference (EPEC), Winnipeg, Canada, 3–5 October 2011; pp. 290–295.
- Pantoš, M. Stochastic optimal charging of electric-drive vehicles with renewable energy. Energy 2011, 36, 6567–6576. [Google Scholar]
- Mets, K.; Verschueren, T.; de Turck, F.; Develder, C. Exploiting V2G to optimize residential energy consumption with electrical vehicle (dis)charging. Proceedings of the 2011 IEEE First International Workshop on Smart Grid Modeling and Simulation (SGMS), Brussels, Belgium, 17 October 2011; pp. 7–12.
- Masoum, A.S.; Deilami, S.; Moses, P.S.; Masoum, M.A.S.; Abu-Siada, A. Smart load management of plug-in electric vehicles in distribution and residential networks with charging stations for peak shaving and loss minimisation considering voltage regulation. Gener. Transm. Distrib. 2011, 5, 877–888. [Google Scholar]
- Zhang, P.; Qian, K.; Zhou, C.; Stewart, B.G.; Hepburn, D.M. A Methodology for Optimization of Power Systems Demand Due to Electric Vehicle Charging Load. IEEE Trans. Power Syst. 2012, 27, 1628–1636. [Google Scholar]
- Zheng, J.; Wang, X.; Men, K.; Zhu, C.; Zhu, S. Aggregation Model-Based Optimization for Electric Vehicle Charging Strategy. IEEE Trans. Smart Grid 2013, 4, 1058–1066. [Google Scholar]
- Wang, J.; Liu, C.; Ton, D.; Zhou, D.; Kim, J.; Vyas, A. Impact of plug-in hybrid electric vehicles on power systems with demand response and wind power. Energy Policy 2011, 39, 4016–4021. [Google Scholar]
- Acha, S.; Green, T.C.; Shah, N. Effects of optimised plug-in hybrid vehicle charging strategies on electric distribution network losses. Proceedings of the IEEE PES Transmission and Distribution Conference and Exposition, New Orleans, LA, USA, 19–22 April 2010; pp. 1–6.
- Kiviluoma, J.; Meibom, P. Methodology for modelling plug-in electric vehicles in the power system and cost estimates for a system with either smart or dumb electric vehicles. Energy 2011, 36, 1758–1767. [Google Scholar]
- Green, R.C., II; Wang, L.; Alam, M. The impact of plug-in hybrid electric vehicles on distribution networks: A review and outlook. Renew. Sustain. Energy Rev. 2011, 15, 544–553. [Google Scholar]
- Karfopoulos, E.L.; Hatziargyriou, N.D. A Multi-Agent System for Controlled Charging of a Large Population of Electric Vehicles. IEEE Trans. Power Syst. 2013, 28, 1196–1204. [Google Scholar]
- Valsera-Naranjo, E.; Sumper, A.; Villafafila-Robles, R.; Martínez-Vicente, D. Probabilistic Method to Assess the Impact of Charging of Electric Vehicles on Distribution Grids. Energies 2012, 5, 1503–1531. [Google Scholar]
- Yano, H.; Kudo, K.; Ikegami, T.; Iguchi, H.; Kataoka, K.; Ogimoto, K. A novel charging-time control method for numerous EVs based on a period weighted prescheduling for power supply and demand balancing. Proceedings of 2012 IEEE PES Innovative Smart Grid Technologies (ISGT), Washington, DC, USA, 16–20 January 2012; pp. 1–6.
- Ehsani, M.; Falahi, M.; Lotfifard, S. Vehicle to Grid Services: Potential and Applications. Energies 2012, 5, 4076–4090. [Google Scholar]
- Luo, Z.; Hu, Z.; Song, Y.; Xu, Z.; Lu, H. Optimal Coordination of Plug-In Electric Vehicles in Power Grids With Cost-Benefit Analysis—Part I: Enabling Techniques. IEEE Trans. Power Syst. 2013, 28, 3546–3555. [Google Scholar]
- Heydt, G.T. The Impact of Electric Vehicle Deployment on Load Management Strategies. IEEE Trans. Power Appar. Syst. 1983, 102, 1253–1259. [Google Scholar]
- Richardson, P.; Flynn, D.; Keane, A. Optimal Charging of Electric Vehicles in Low-Voltage Distribution Systems. IEEE Trans. Power Syst. 2012, 27, 268–279. [Google Scholar]
- Sanchez-Martin, P.; Sanchez, G.; Morales-España, G. Direct Load Control Decision Model for Aggregated EV Charging Points. IEEE Trans. Power Syst. 2012, 27, 1577–1584. [Google Scholar]
- Singh, M.; Kumar, P.; Kar, I. A Multi Charging Station for Electric Vehicles and Its Utilization for Load Management and the Grid Support. IEEE Trans. Smart Grid 2013, 4, 1026–1037. [Google Scholar]
- Shaaban, M.F.; El-Saadany, E.F. Accommodating High Penetrations of PEVs and Renewable DG Considering Uncertainties in Distribution Systems. IEEE Trans. Power Syst. 2014, 29, 259–270. [Google Scholar]
- Sivanandam, S.N.; Deepa, S.N. Introduction to Genetic Algorithm; Springer: Berlin, Germany, 2007. [Google Scholar]
- Encuesta de Movilidad de las Personas Residentes en España (Movilia 2006/2007). Available online: http://www.fomento.gob.es/MFOM/LANG_CASTELLANO/ATENCION_CIUDADANO/INFORMACION_ESTADISTICA/Movilidad/Movilia2006_2007/default.htm (accessed on 14 April 2014).
- Qian, K.; Zhou, C.; Allan, M.; Yuan, Y. Modeling of load demand due to EV battery charging in distribution systems. IEEE Trans. Power Syst. 2011, 26, 802–810. [Google Scholar]
- Taylor, J.; Maitra, A.; Alexander, M.; Brooks, D.; Duvall, M. Evaluation of the impact of plug-in electric vehicle loading on distribution system operations. Proceedings of the IEEE Power & Energy Society General Meeting, Calgary, AB, Canada, 26–30 July 2009; pp. 1–6.
- International Organization for Standardization (ISO). Road Vehicles—Vehicle-to-Grid Communication Interface—Part 2: Network and Application Protocol Requirements; ISO 15118-2:2014; International Organization for Standardization: Geneva, Switzerland, 2014. [Google Scholar]
- The International Electrotechnical Commission (IEC). Electric Vehicle Conductive Charging System—Part 1: General Requirement; IEC 61851-1; The International Electrotechnical Commission: London, UK, 2001. [Google Scholar]
- Wang, Z.; Wang, S. Grid Power Peak Shaving and Valley Filling Using Vehicle-to-Grid Systems. IEEE Trans. Power Deliv. 2013, 28, 1822–1829. [Google Scholar]
- Galus, M.D.; Wietor, F.; Andersson, G. Incorporating valley filling and peak shaving in a utility function based management of an electric vehicle aggregator. Proceedings of the 2012 3rd IEEE PES International Conference and Exhibition on Innovative Smart Grid Technologies (ISGT Europe), Berlin, Germany, 14–17 October 2012; pp. 1–8.
- Lee, K.Y.; El-Sharkawi, M.A. Modern Heuristic Optimization Techniques Theory and Applications to Power Systems, 1st ed.; Wiley: Hoboken, NJ, USA, 2008. [Google Scholar]
- Amaris, H.; Alonso, M.; Alvarez-Ortega, C. Reactive Power Management of Power Networks with Wind Generation, 1st ed.; Springer: Berlin, Germany, 2013. [Google Scholar]
- Su, W.; Chow, M.-Y. Computational intelligence-based energy management for a large-scale PHEV/PEV enabled municipal parking deck. Appl. Energy 2012, 96, 171–182. [Google Scholar]
- Holland, J.H. Adaptation in Natural and Artificial Systems: An Introductory Analysis with Applications to Biology, Control, and Artificial Intelligence, 1st ed.; University of Michigan Press: Ann Arbor, MI, USA, 1975. [Google Scholar]
- Goldberg, D.E. Genetic Algorithms in Search, Optimization and Machine Learning; Adddison-Wesley: Boston, MA, USA, 1989. [Google Scholar]
- Alonso, M.; Amaris, H.; Alvarez-Ortega, C. Integration of renewable energy sources in smart grids by means of evolutionary optimization algorithms. Expert Syst. Appl. 2012, 39, 5513–5522. [Google Scholar]
Nomenclature
| Bik | Susceptance of branch between nodes ith and kth |
| CPOC | Customer Point of Connection |
| DOD | Depth of Discharge |
| DSM | Demand Side Management |
| DSO | Distribution System Operator |
| EV | Electric Vehicles |
| FF | Fitness Function |
| G2V | Grid to Vehicle |
| GA | Genetic Algorithm |
| Gik | Conductance of branch between nodes ith and kth |
| Ii | Thermal loading of line ith |
| Ii, max | Maximum Thermal loading of line ith |
| PEV | Plug in Electrical Vehicles |
| Pi | Active power injection at node ith |
| Qi | Reactive power injection at node ith |
| Snominal | Nominal power of substation transformer |
| SOC | State of Charge |
| SOCi,max | Maximum State of Charge of EV ith |
| SOCi,min | Minimum State of Charge of EV ith |
| Sh | Hourly distribution transformer load |
| SSubstation transformer | Thermal loading of Substation transformer |
| V2G | Vehicle to Grid |
| Vi | RMS Node voltage at bus ith |
| Vi,max | Maximum Voltage at bus ith |
| Vi,min | Minimum Voltage at bus ith |
| Θij | Voltage angle difference between node ith and jth |


| Connection Mode | Grid connection | AC voltage | AC current | Type of charge |
|---|---|---|---|---|
| Mode 1 (AC) | 1 phase | 230 V | 16 A | Slow |
| 3 phase | 400 V | 16 A | Slow | |
| Mode 2 (AC) | 1 phase | 230 V | 32 A | Slow |
| 3 phase | 400 V | 32 A | Slow | |
| Mode 3 (AC) | 1 phase | 230 V | 32 A | Slow |
| 3 phase | 690 V | 250 A | Medium | |
| Mode 4 (DC) | – | 600 V | 400 A | Fast |
© 2014 by the authors; licensee MDPI, Basel, Switzerland. This article is an open access article distributed under the terms and conditions of the Creative Commons Attribution license ( http://creativecommons.org/licenses/by/3.0/).
Share and Cite
Alonso, M.; Amaris, H.; Germain, J.G.; Galan, J.M. Optimal Charging Scheduling of Electric Vehicles in Smart Grids by Heuristic Algorithms. Energies 2014, 7, 2449-2475. https://doi.org/10.3390/en7042449
Alonso M, Amaris H, Germain JG, Galan JM. Optimal Charging Scheduling of Electric Vehicles in Smart Grids by Heuristic Algorithms. Energies. 2014; 7(4):2449-2475. https://doi.org/10.3390/en7042449
Chicago/Turabian StyleAlonso, Monica, Hortensia Amaris, Jean Gardy Germain, and Juan Manuel Galan. 2014. "Optimal Charging Scheduling of Electric Vehicles in Smart Grids by Heuristic Algorithms" Energies 7, no. 4: 2449-2475. https://doi.org/10.3390/en7042449