On-Site Radon Detection of Mining-induced Fractures from Overlying Strata to the Surface: A Case Study of the Baoshan Coal Mine in China


Abstract
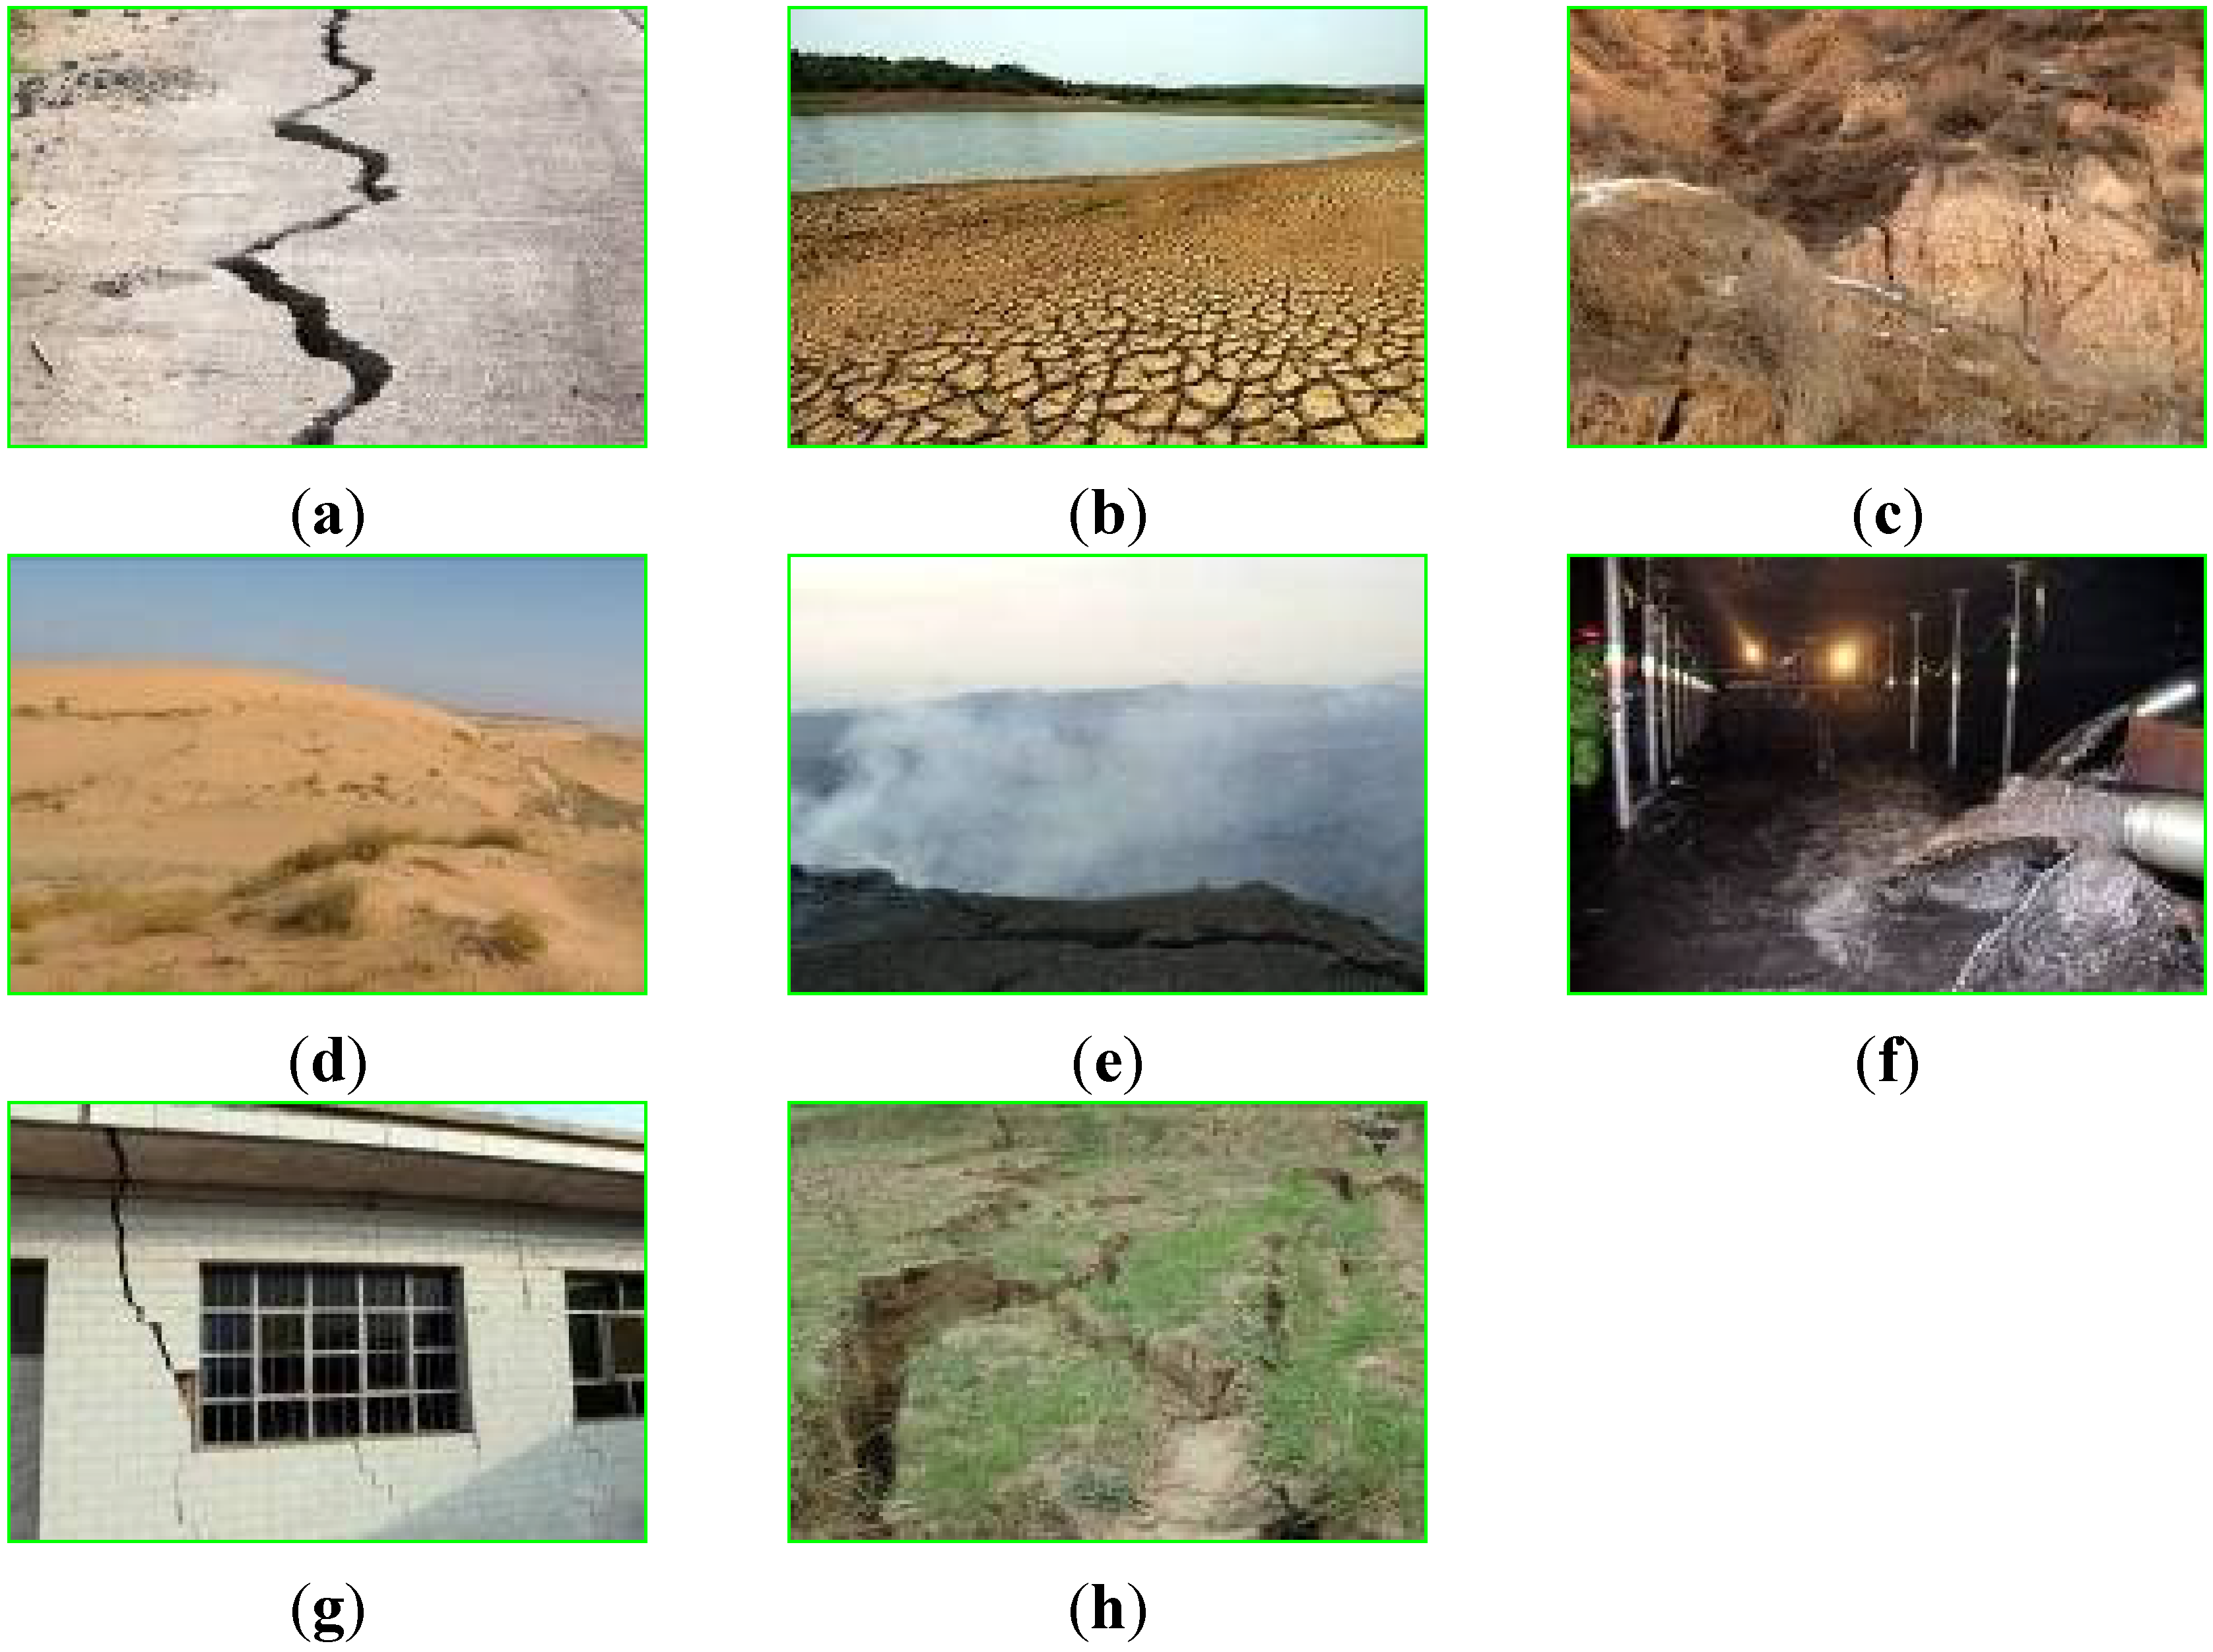
:1. Introduction
2. Mining and Geological Conditions
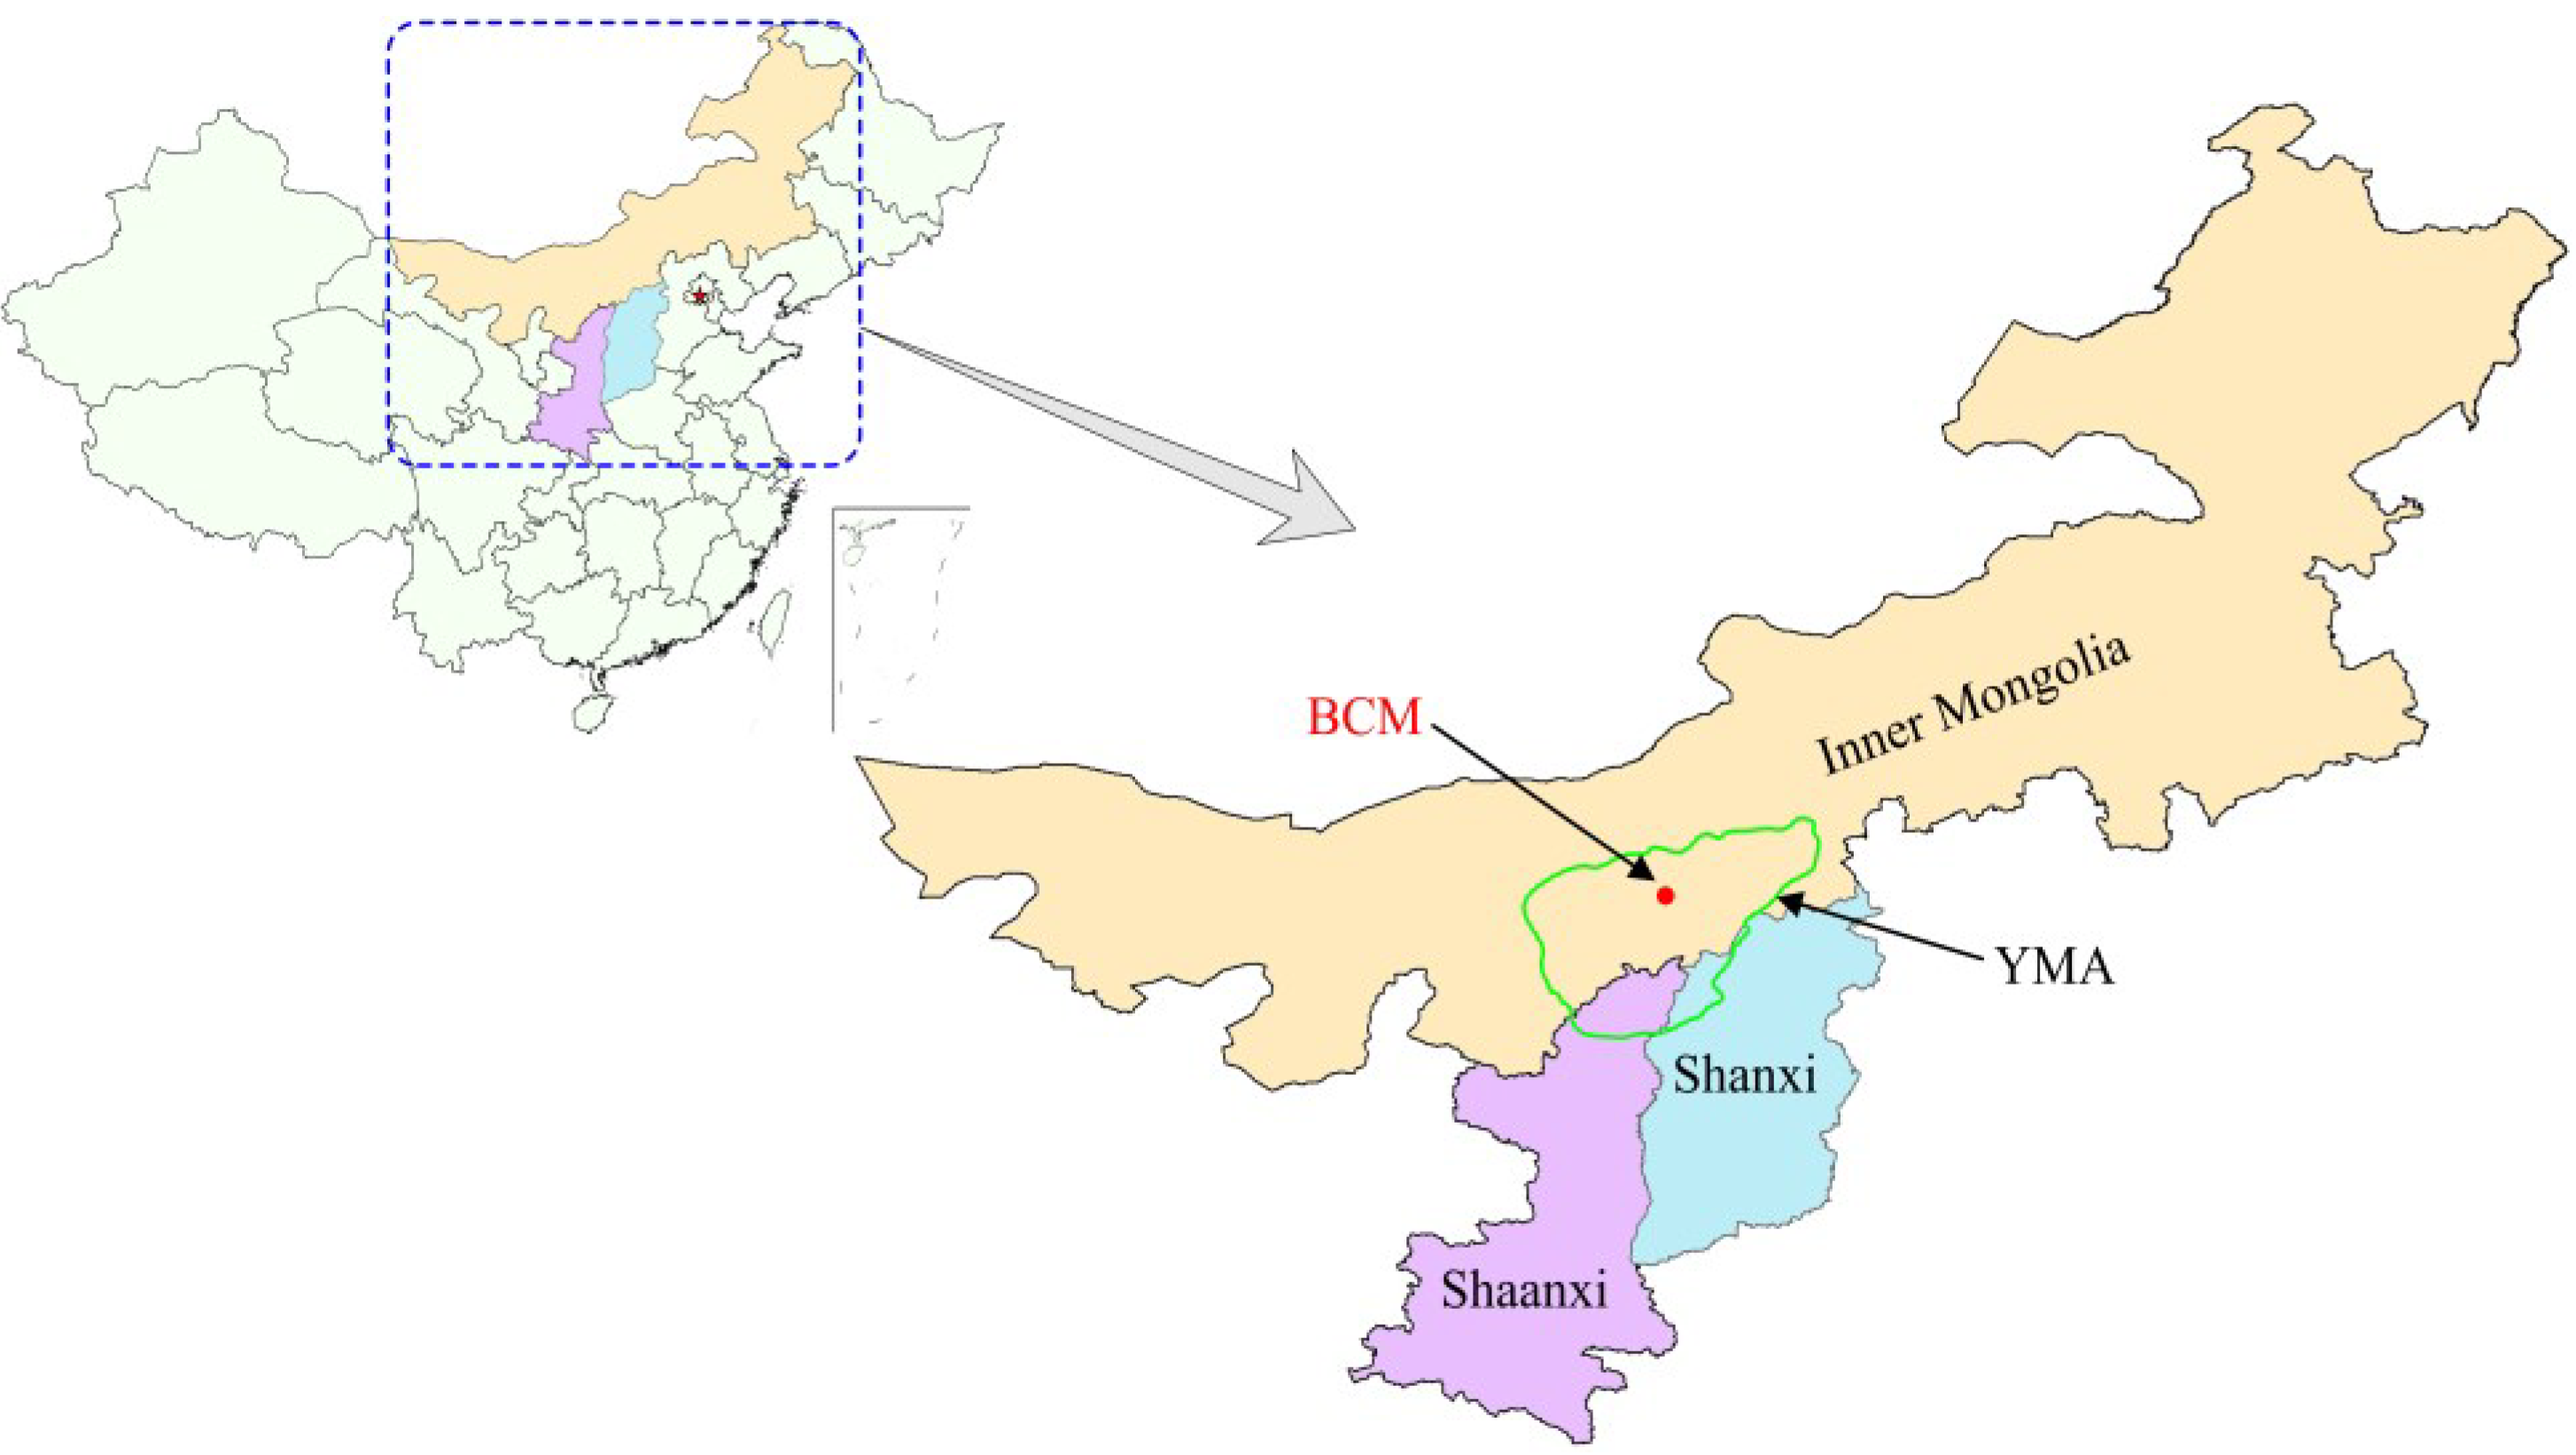
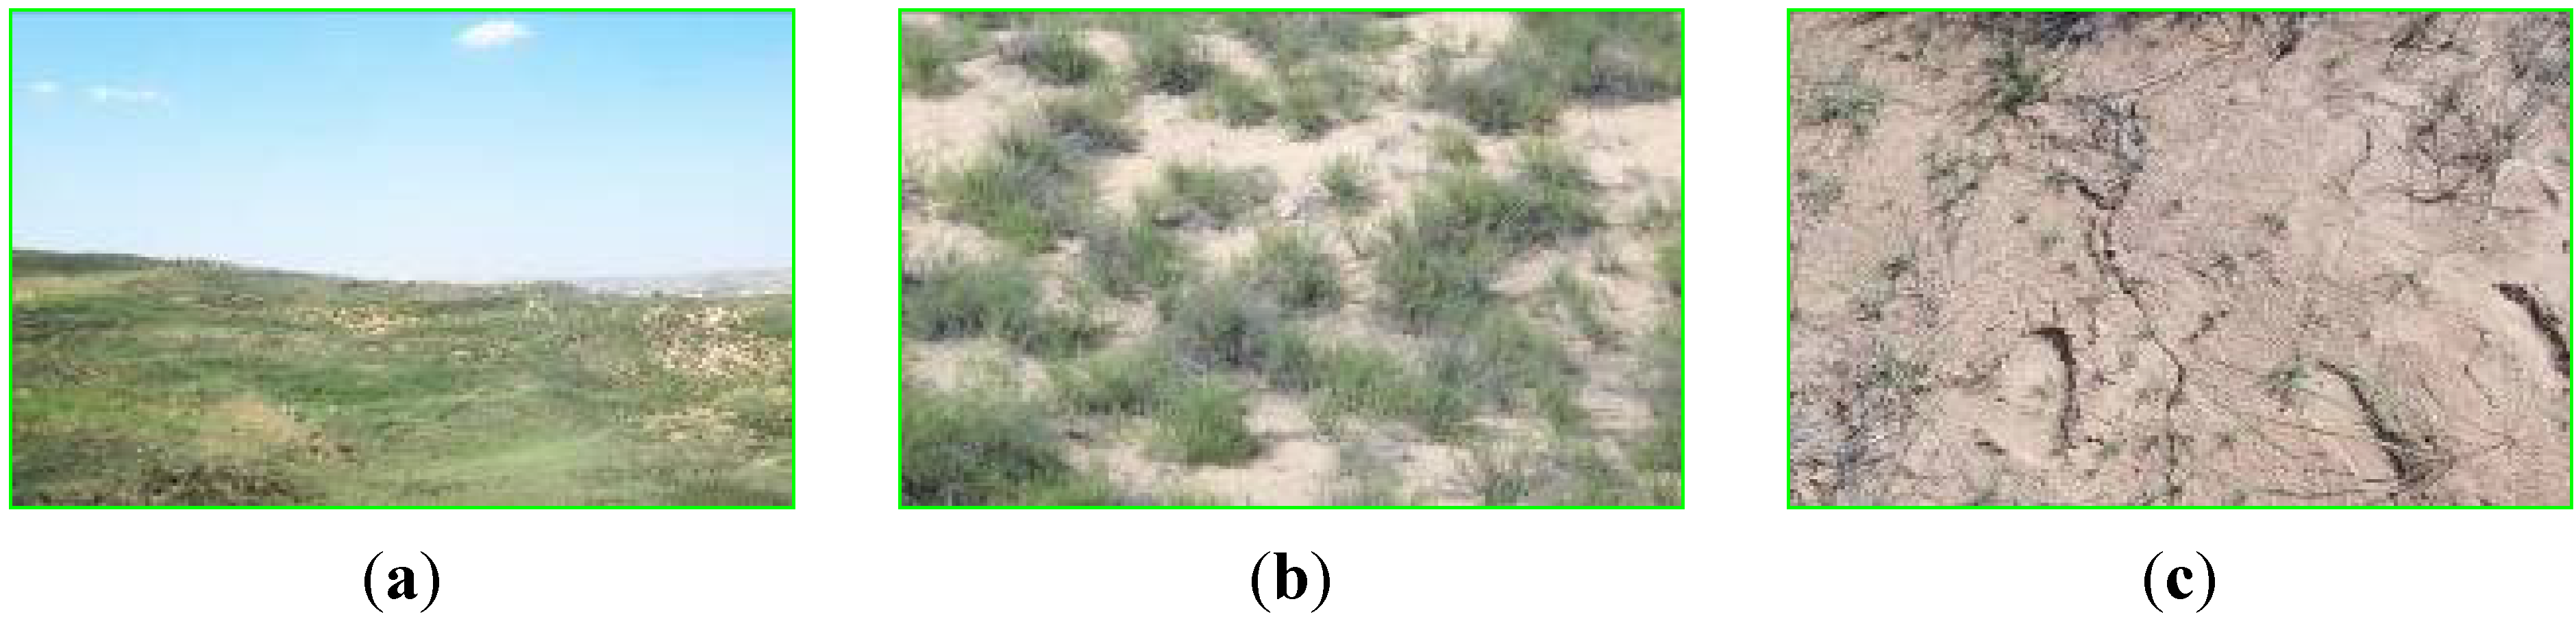
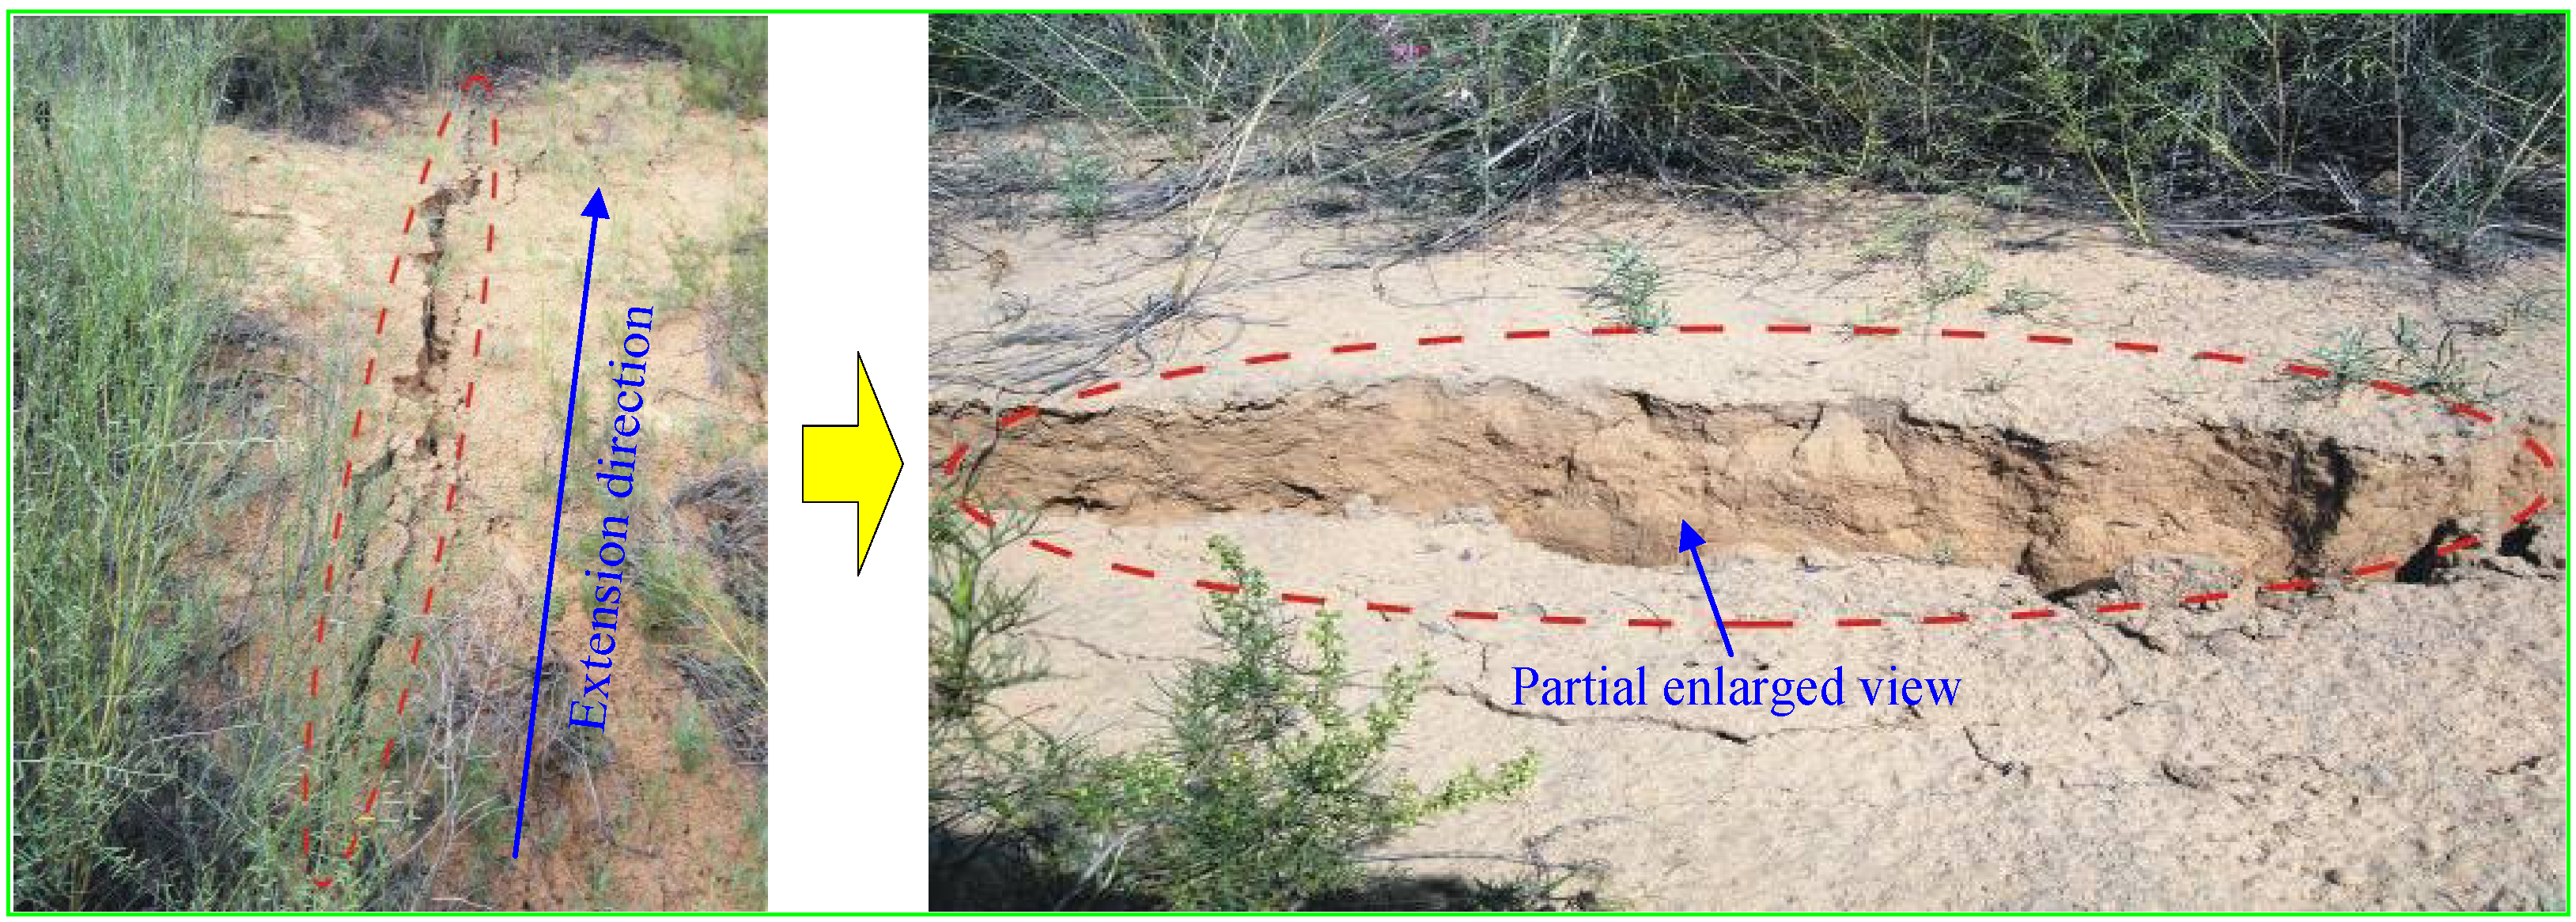
2.1. Location and Surface Morphology of the Study Area


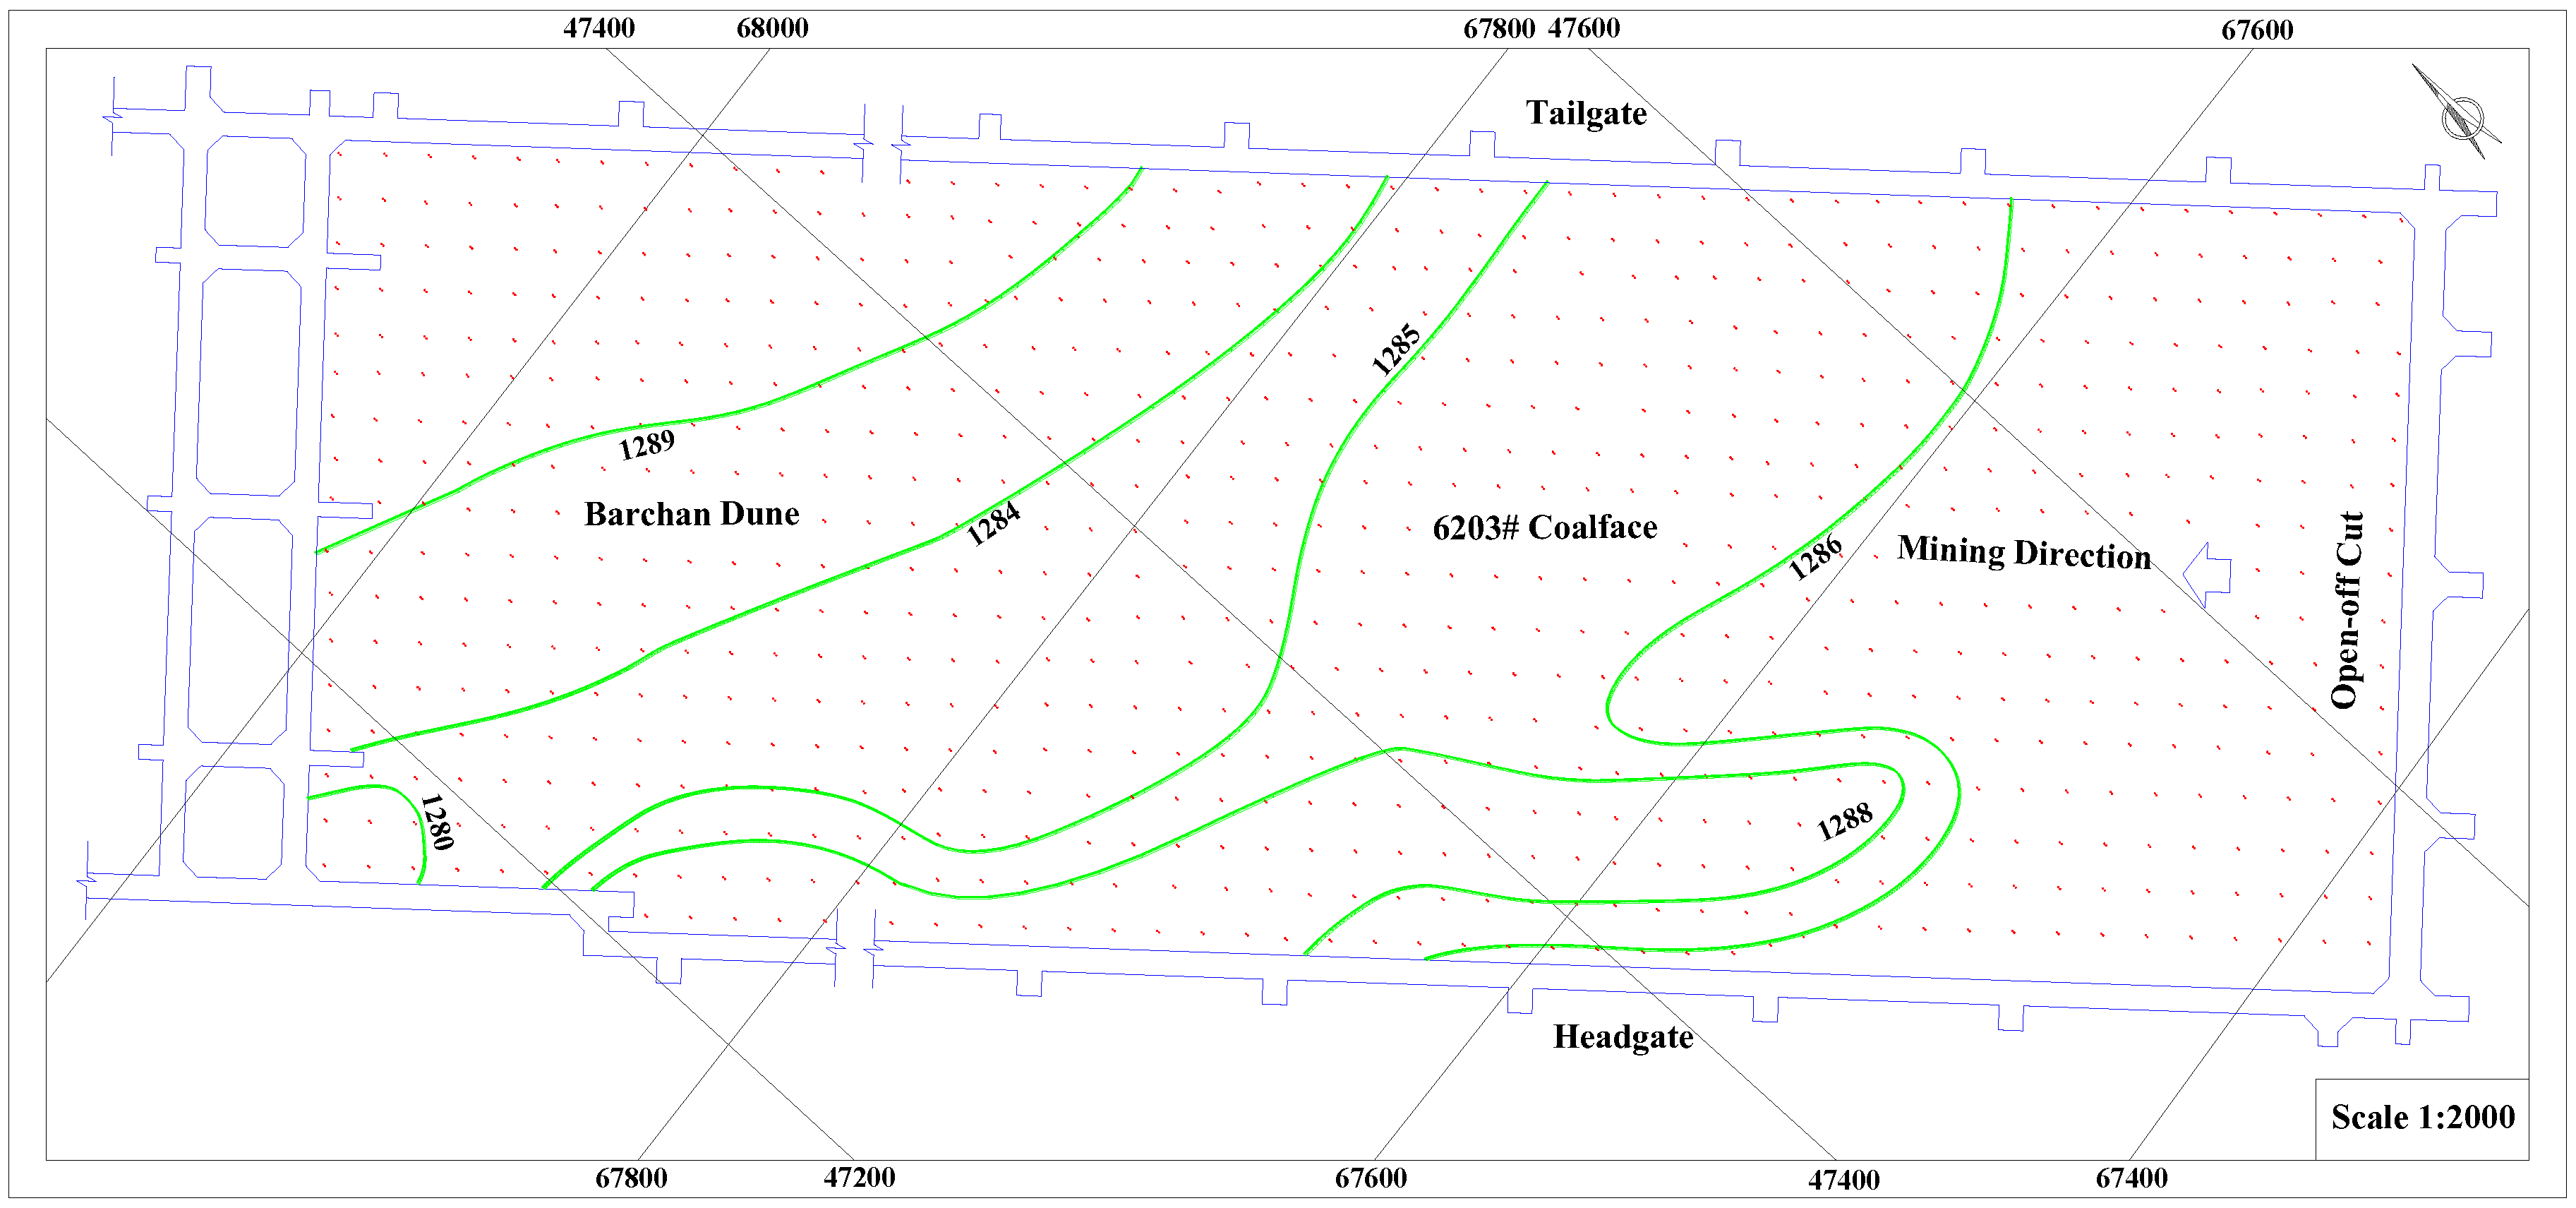
2.2. Mining and Geological Conditions of the 6203# Coalface


| Sequence | Lithology | Thickness (m) | Depth (m) | Remarks |
|---|---|---|---|---|
| 1 | Aeolian sand | 22.0 | 22.0 | Aquifer located at the base |
| 2 | Mudstone | 9.5 | 31.5 | Aquiclude |
| 3 | Weathered sandstone | 15.3 | 46.8 | - |
| 4 | Sandy mudstone | 9.2 | 56.0 | - |
| 5 | Siltstone | 7.7 | 63.7 | - |
| 6 | Packsand | 10.6 | 74.3 | Main roof (Key stratum) |
| 7 | Silty mudstone | 3.5 | 77.8 | Immediate roof |
| 8 | Coal | 5.0 | 82.8 | 6# coal seam |
| 9 | Packsand | 6.8 | 89.6 | Immediate floor |
3. Method of Radon Detection on the Surface
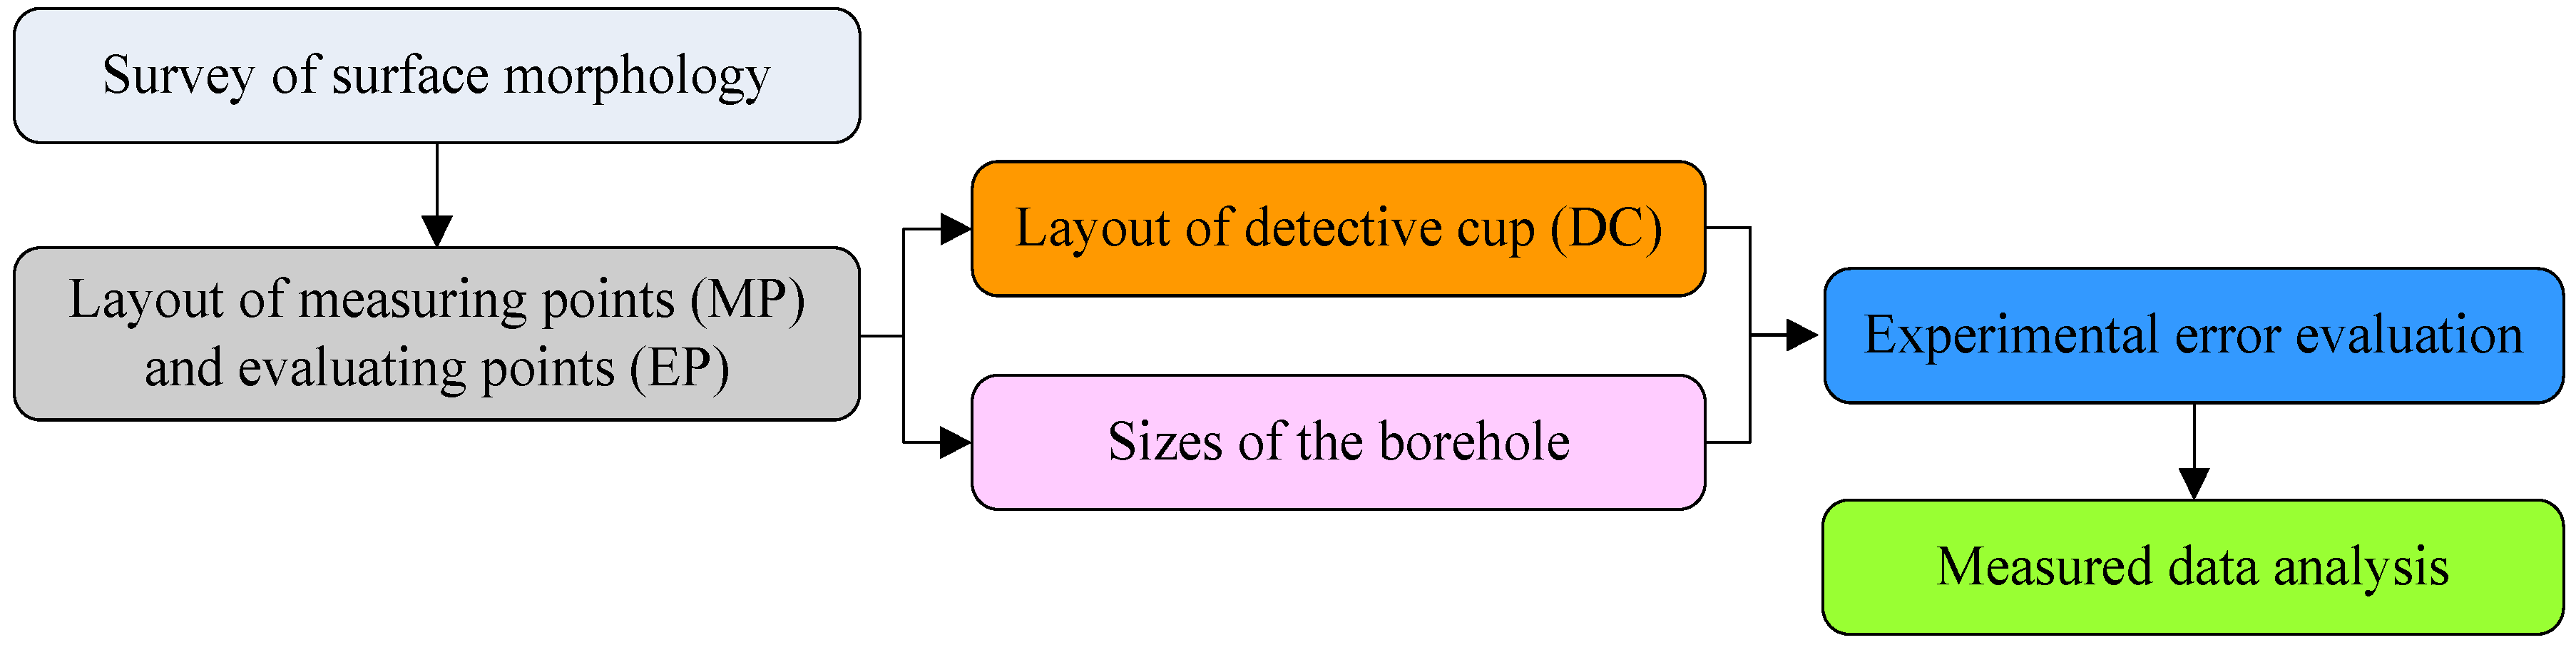
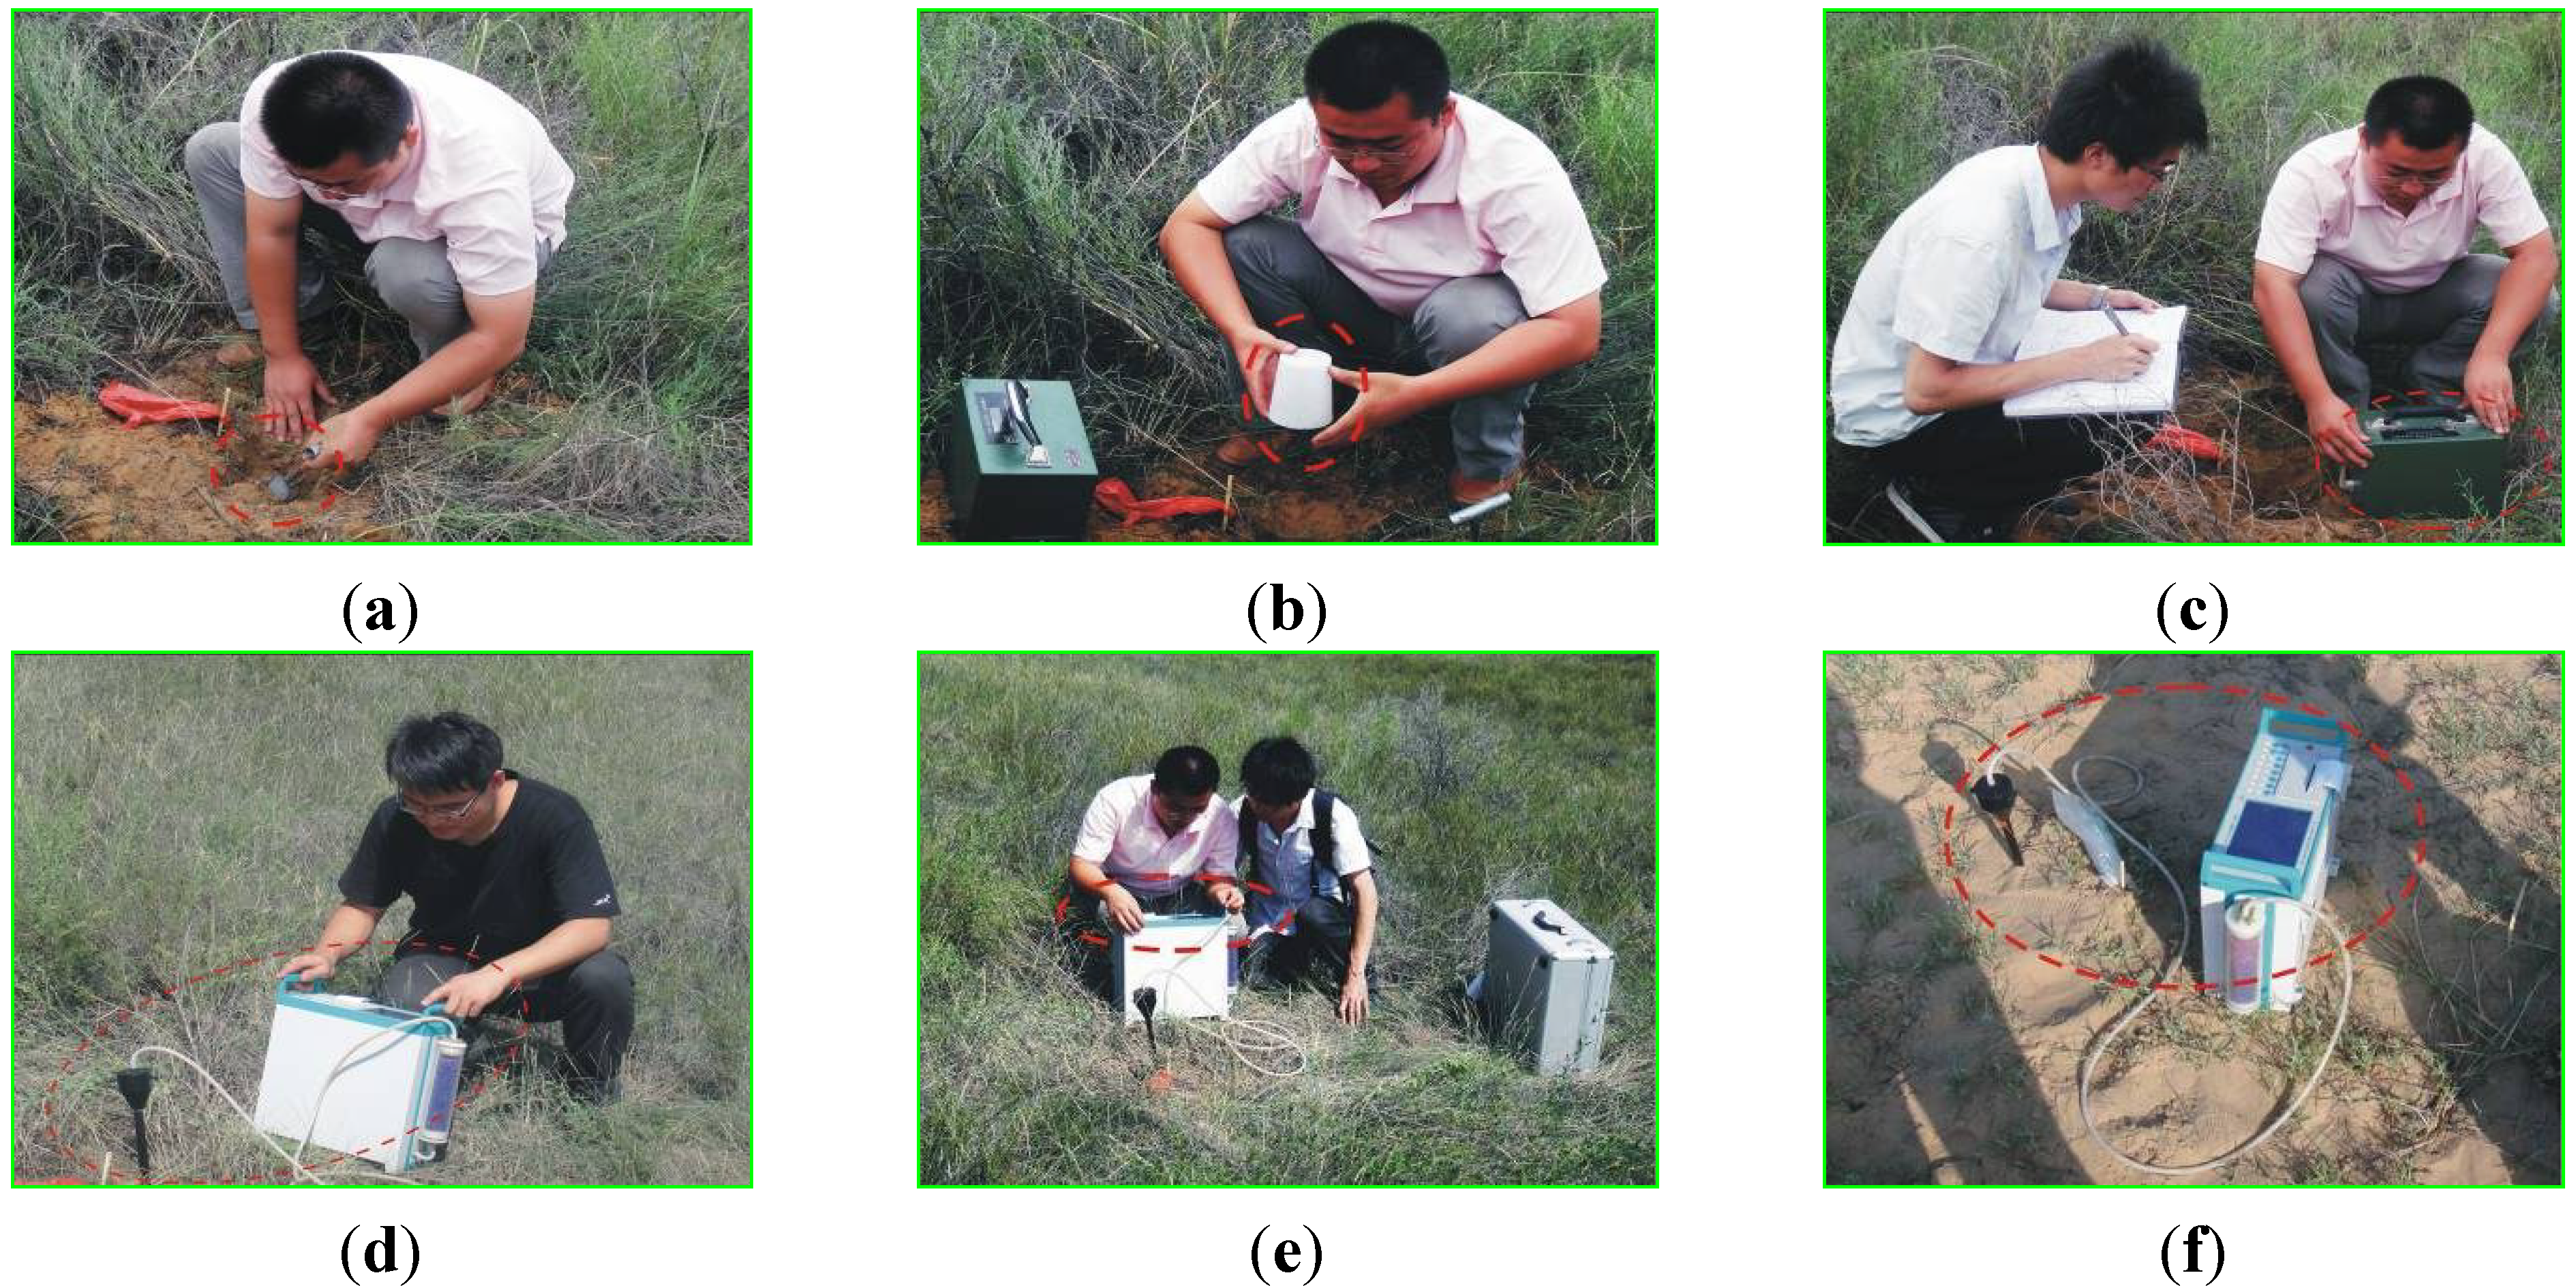
3.1. Steps for Radon Detection on the Surface

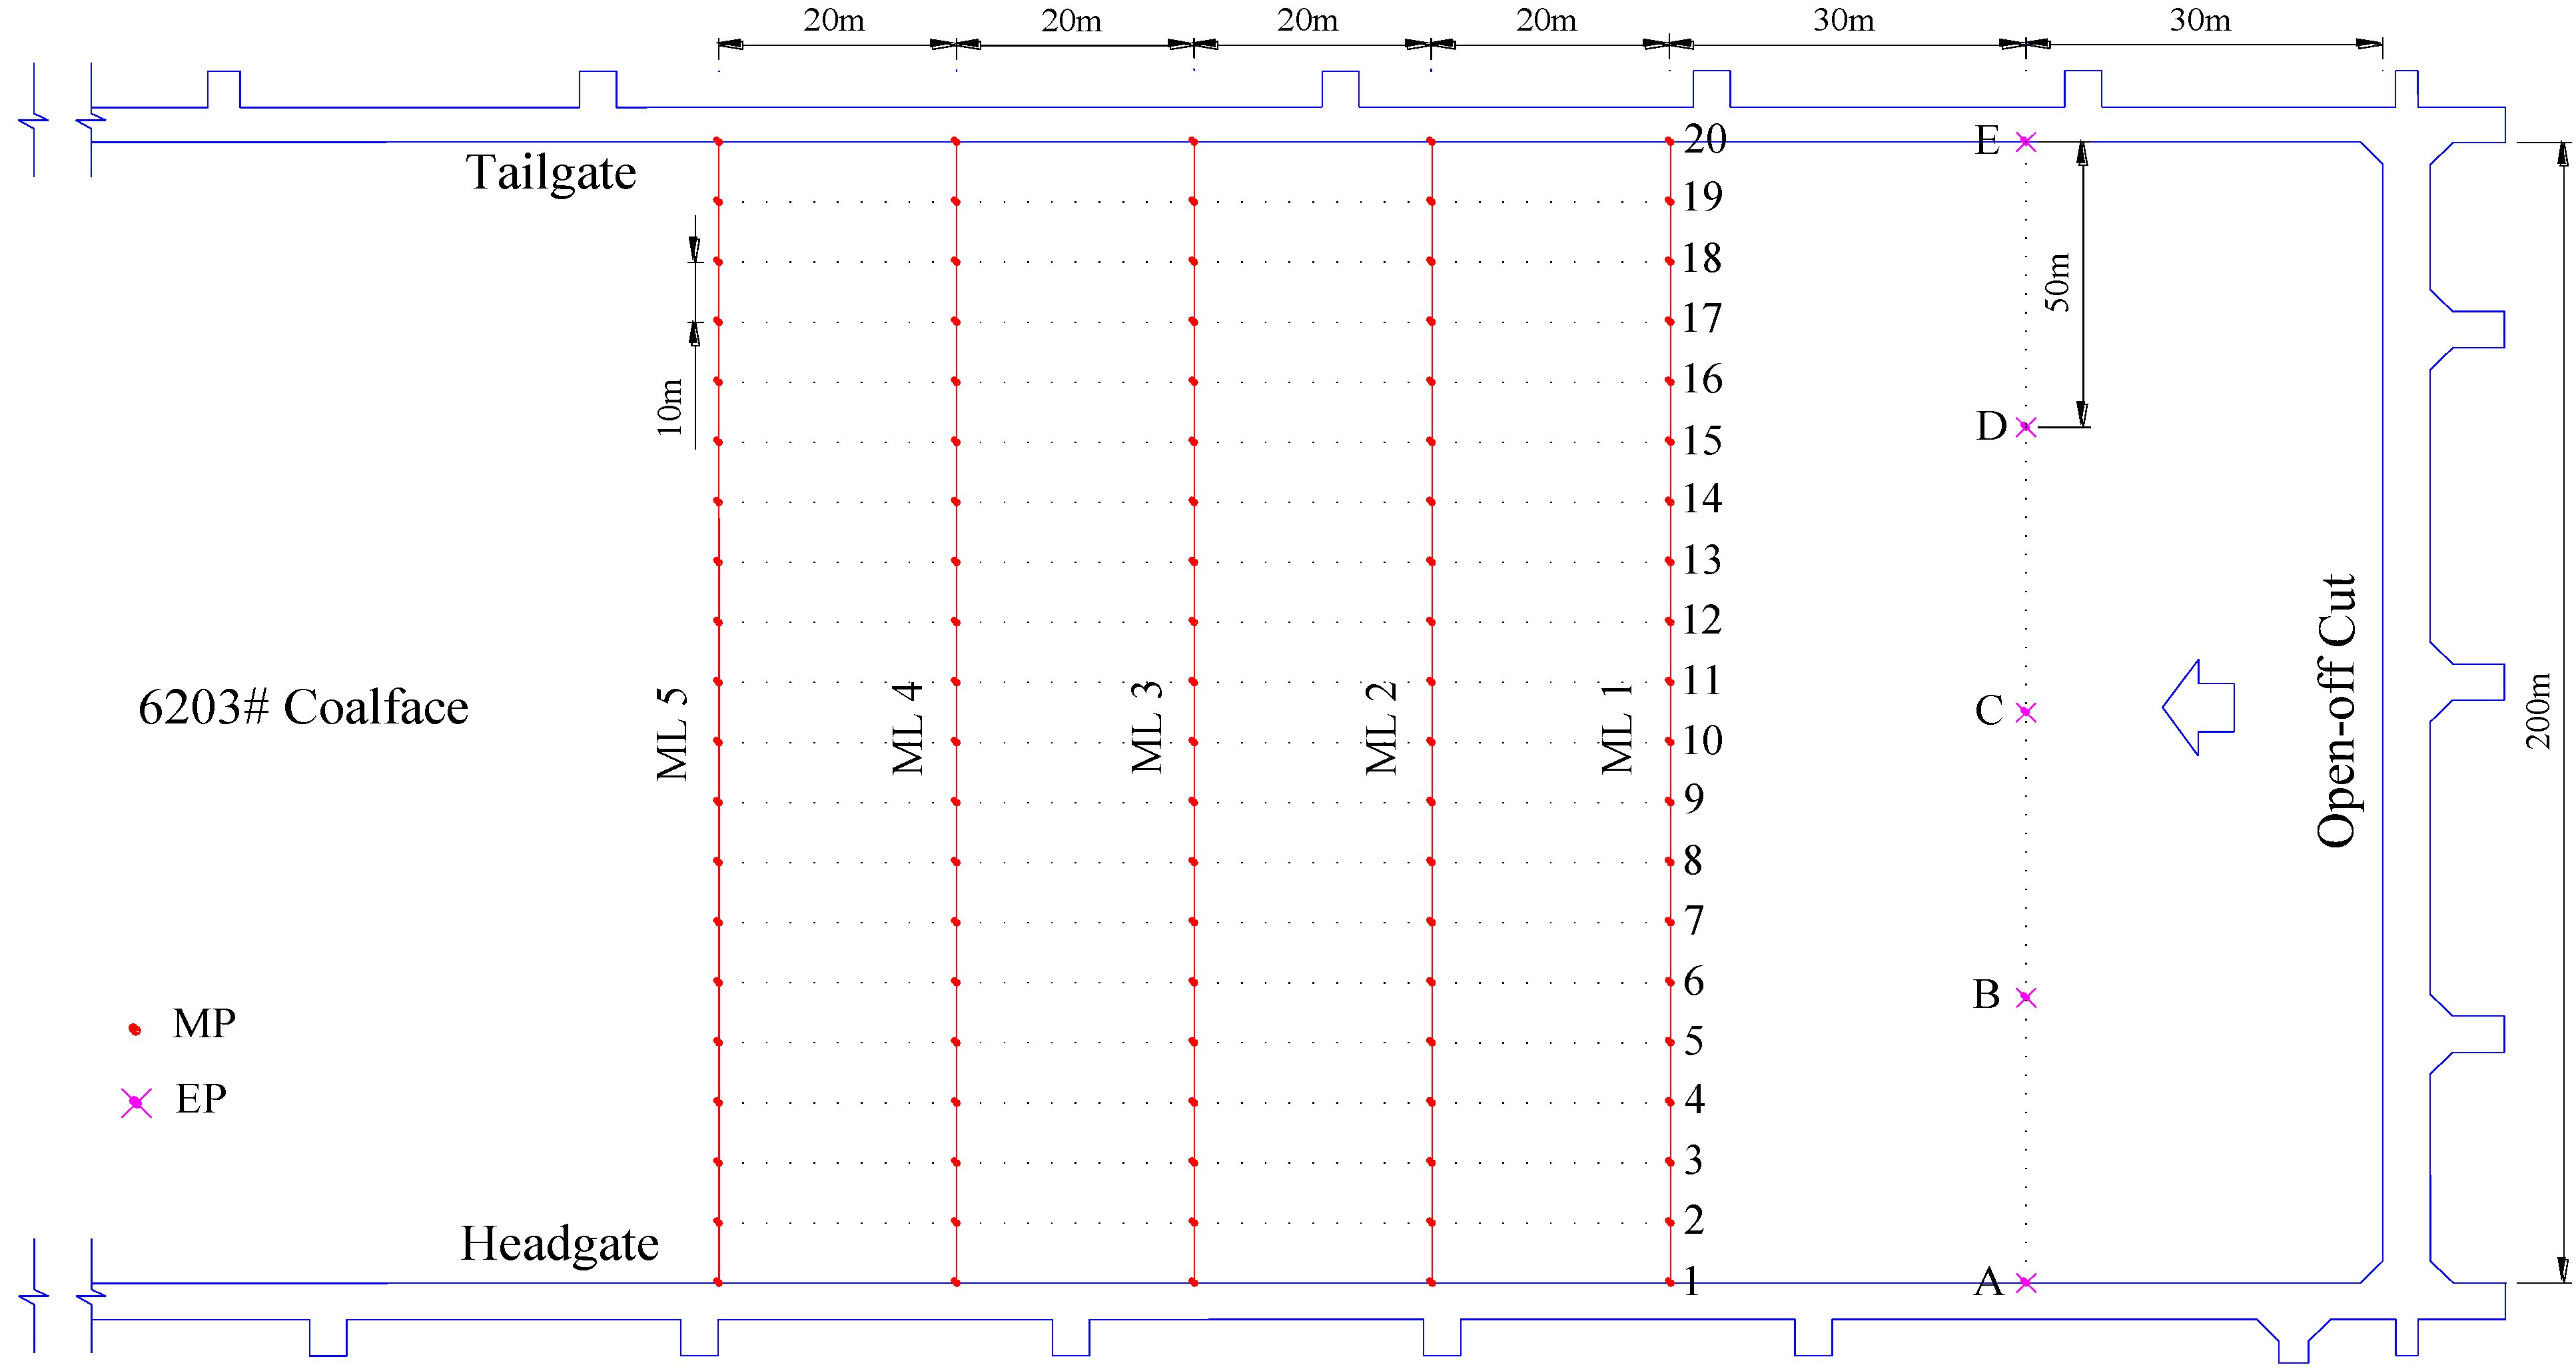
3.2. Layout Schemes of the Measuring Points (MP) and Evaluating Points (EP)


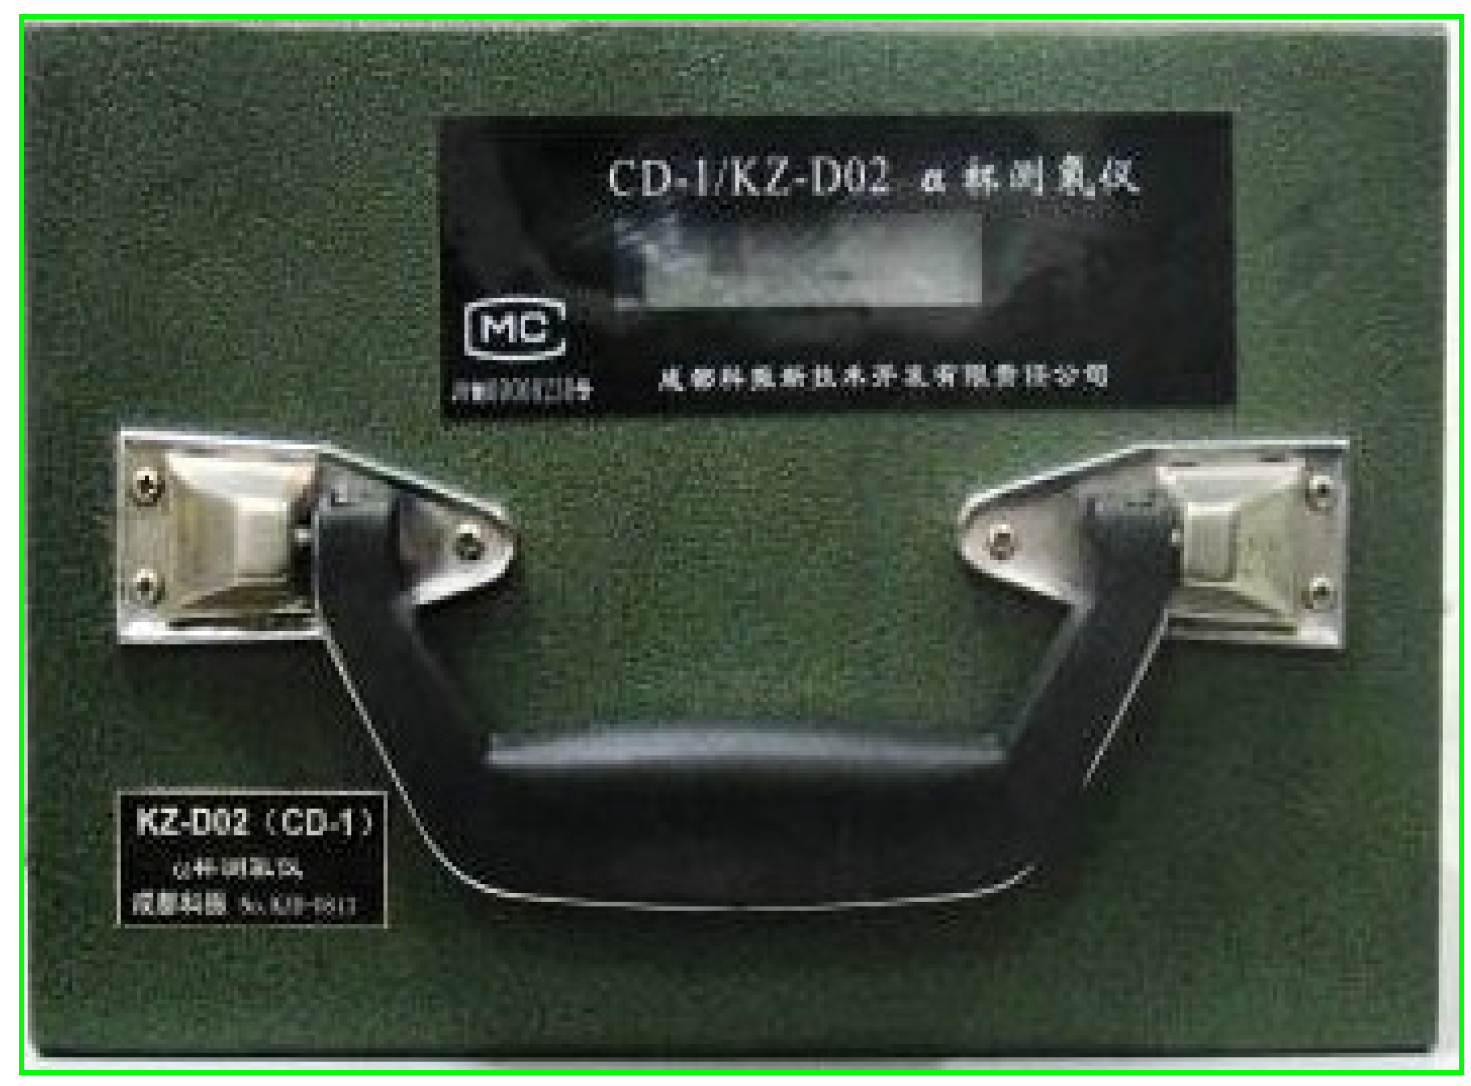
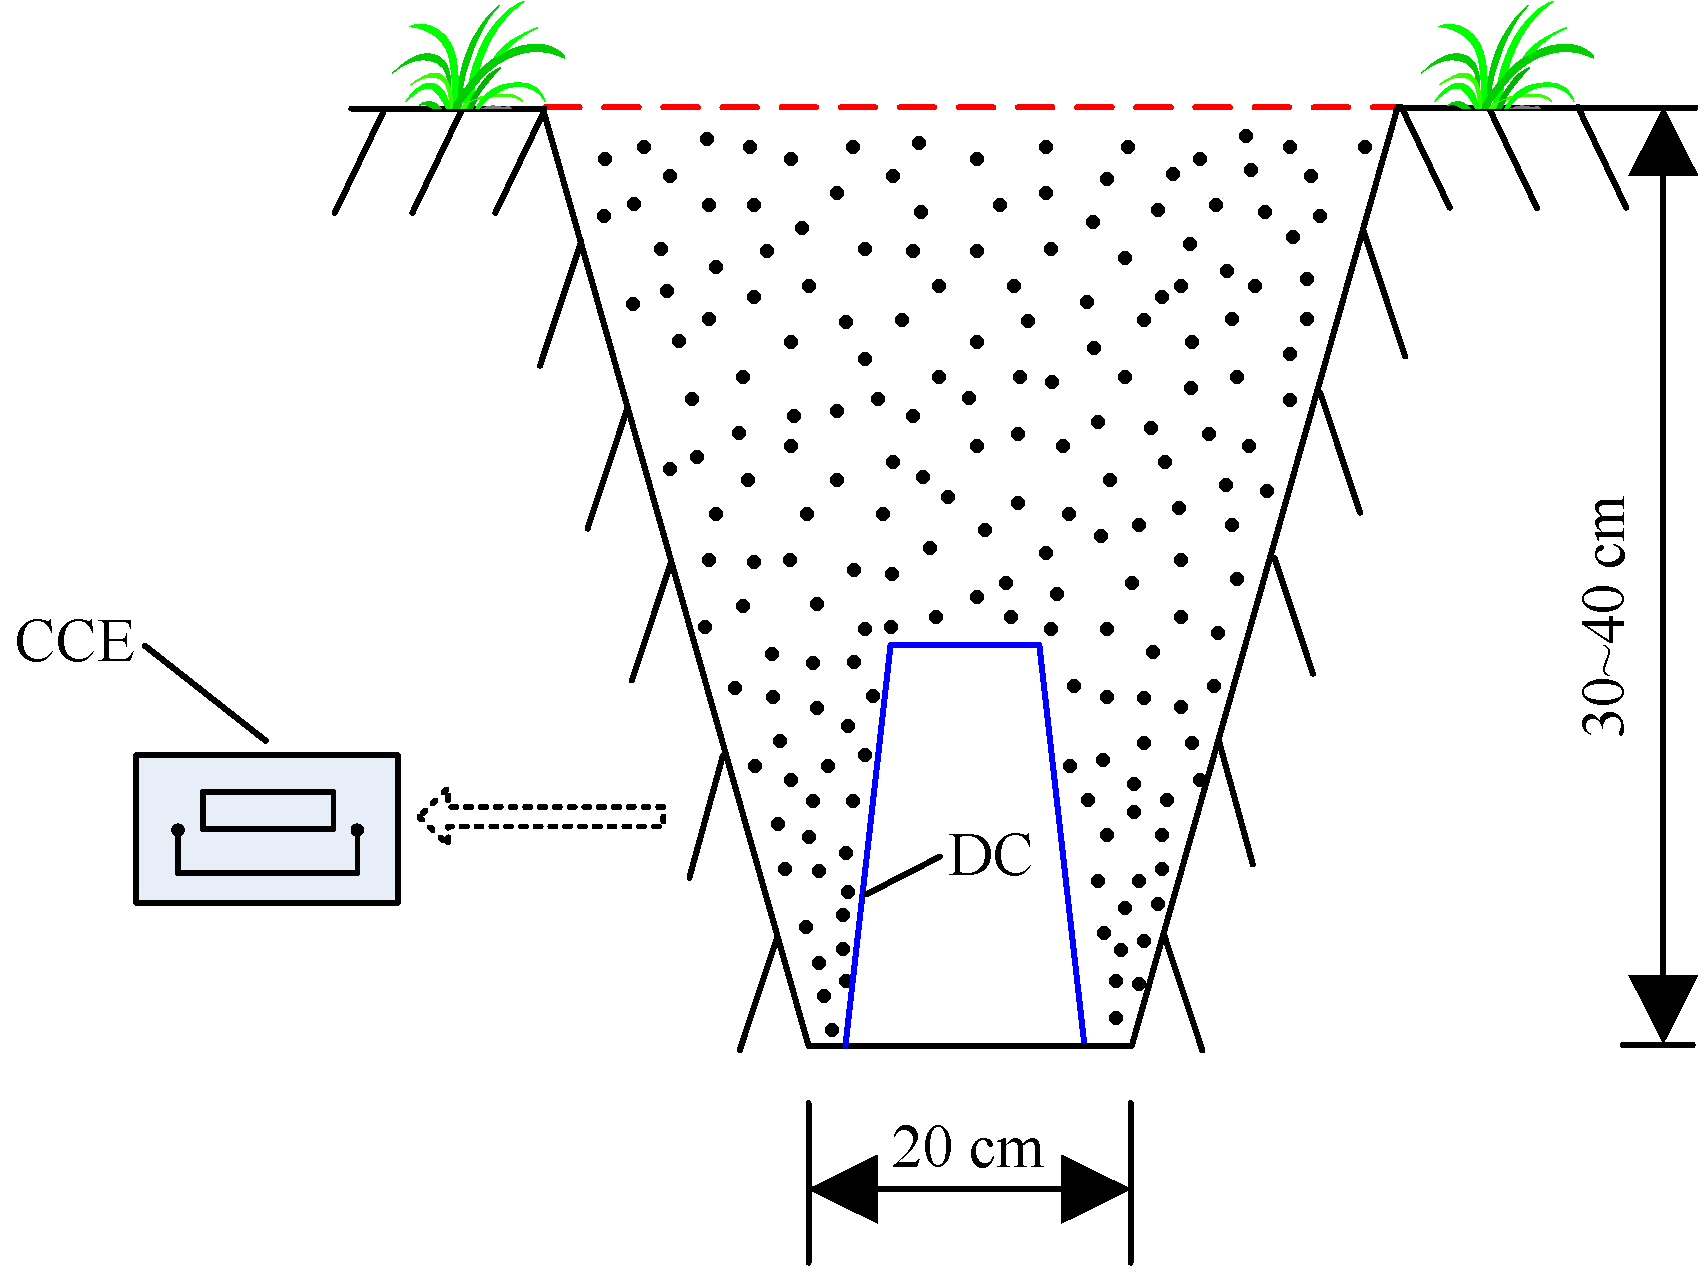
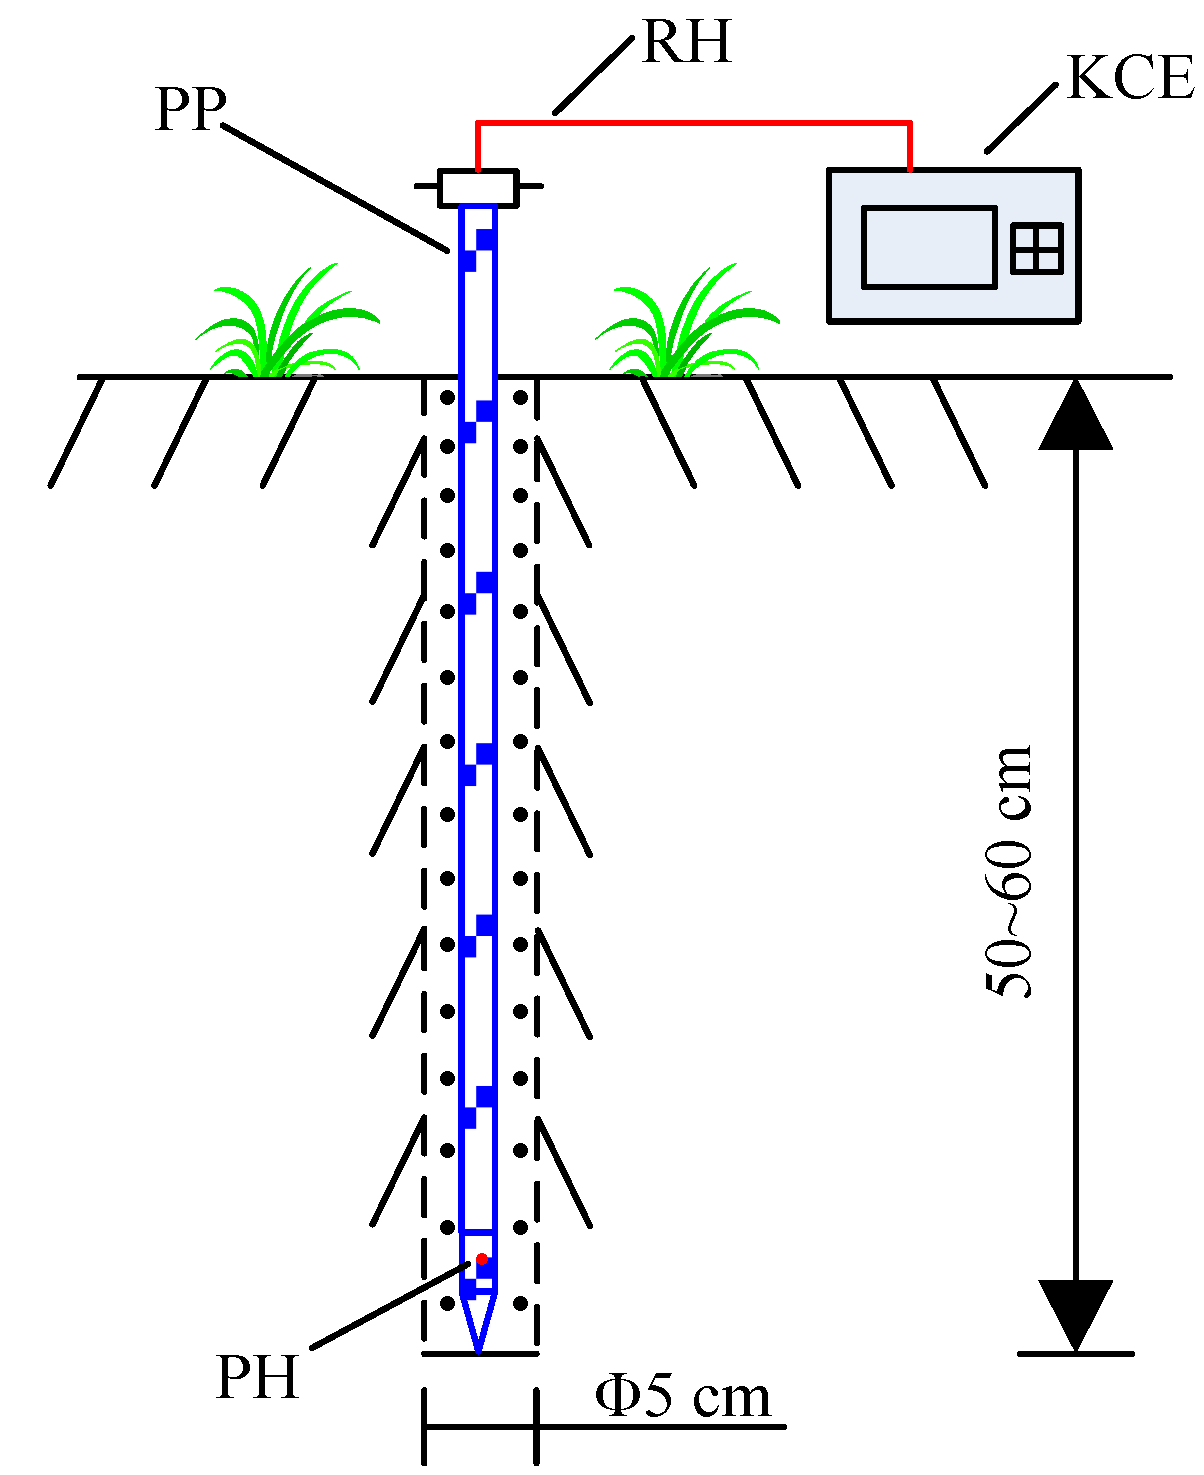
3.3. Layout of the Detective Cup (DC)

3.4. Sizes of the Borehole

4. On-Site Radon Detection Trial and Measured Data Analysis
4.1. On-Site Radon Detection Trial

4.2. Measured Data Analysis
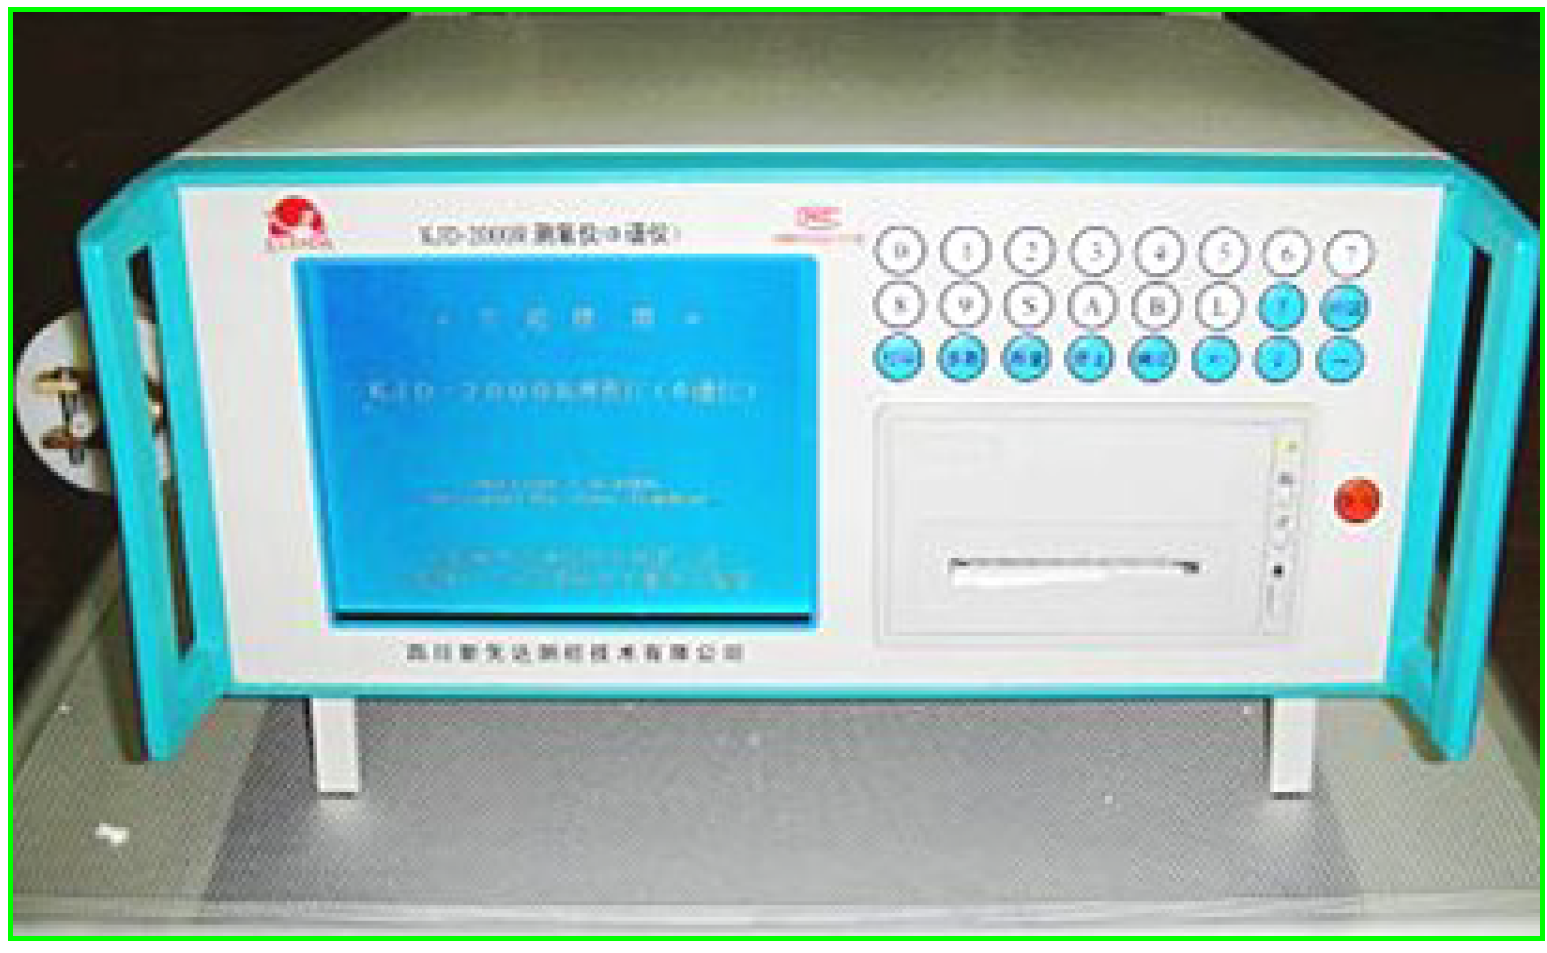
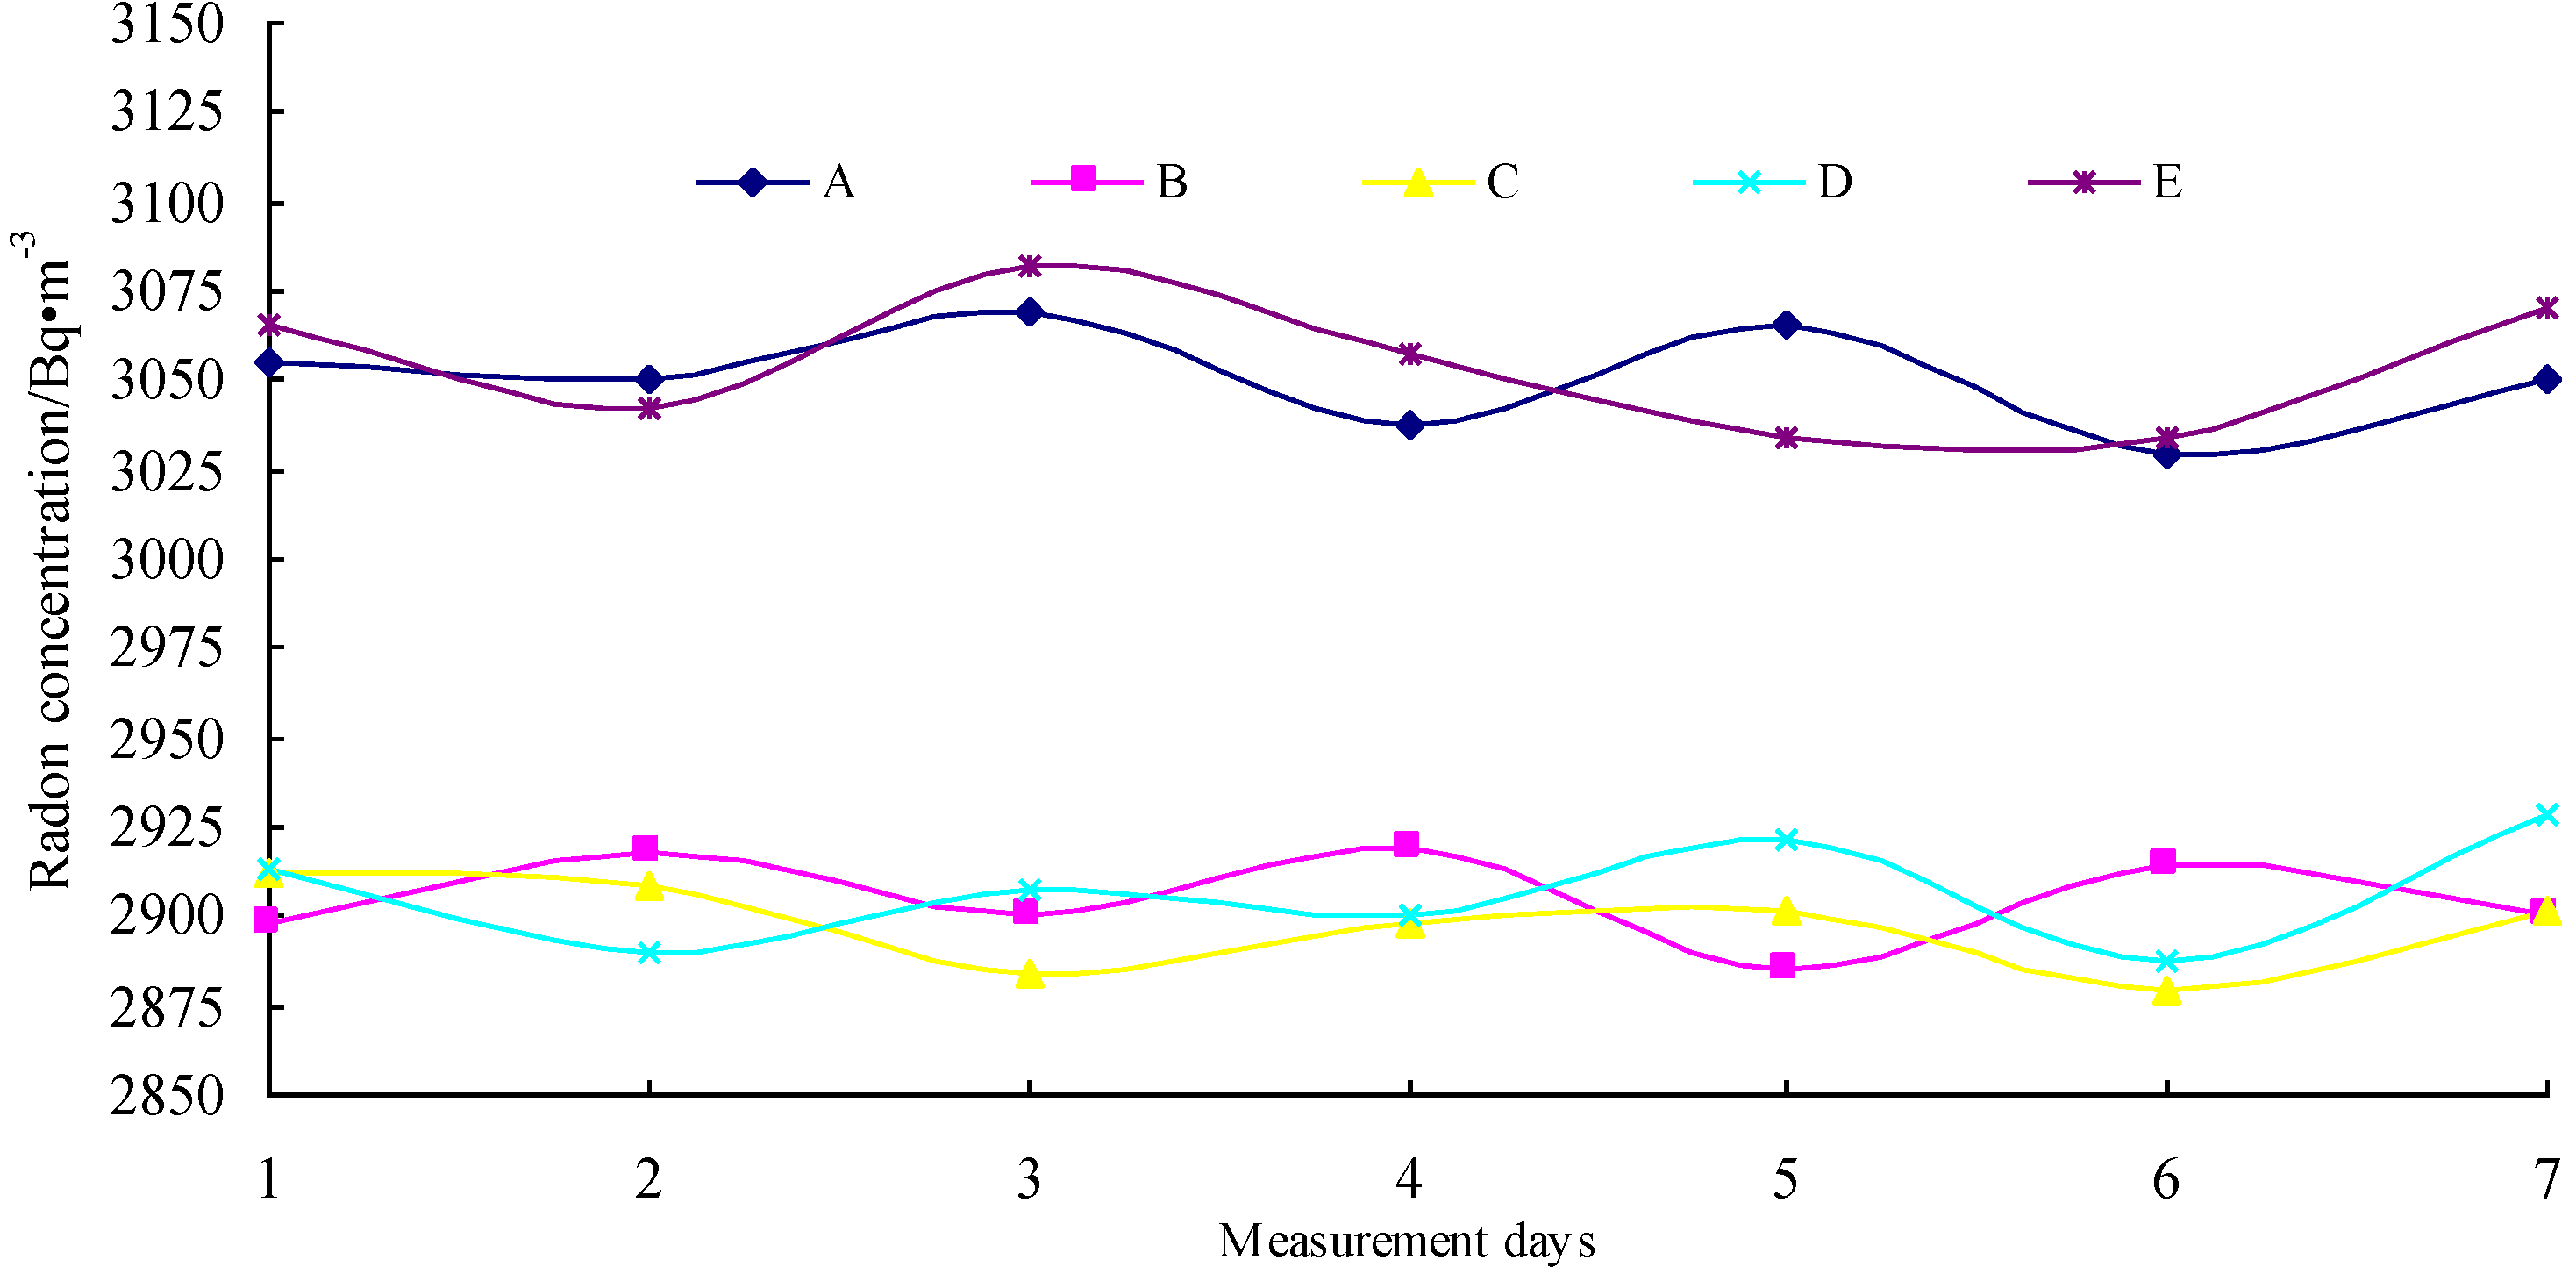
4.2.1. Experimental Error Evaluation

| EP | Average value | Standard deviation σ | Coefficient of variation |
|---|---|---|---|
| A | 3051 | 34.93 | 1.15% |
| B | 2905 | 31.05 | 1.07% |
| C | 2898 | 30.10 | 1.04% |
| D | 2907 | 37.63 | 1.29% |
| E | 3041 | 46.15 | 1.51% |
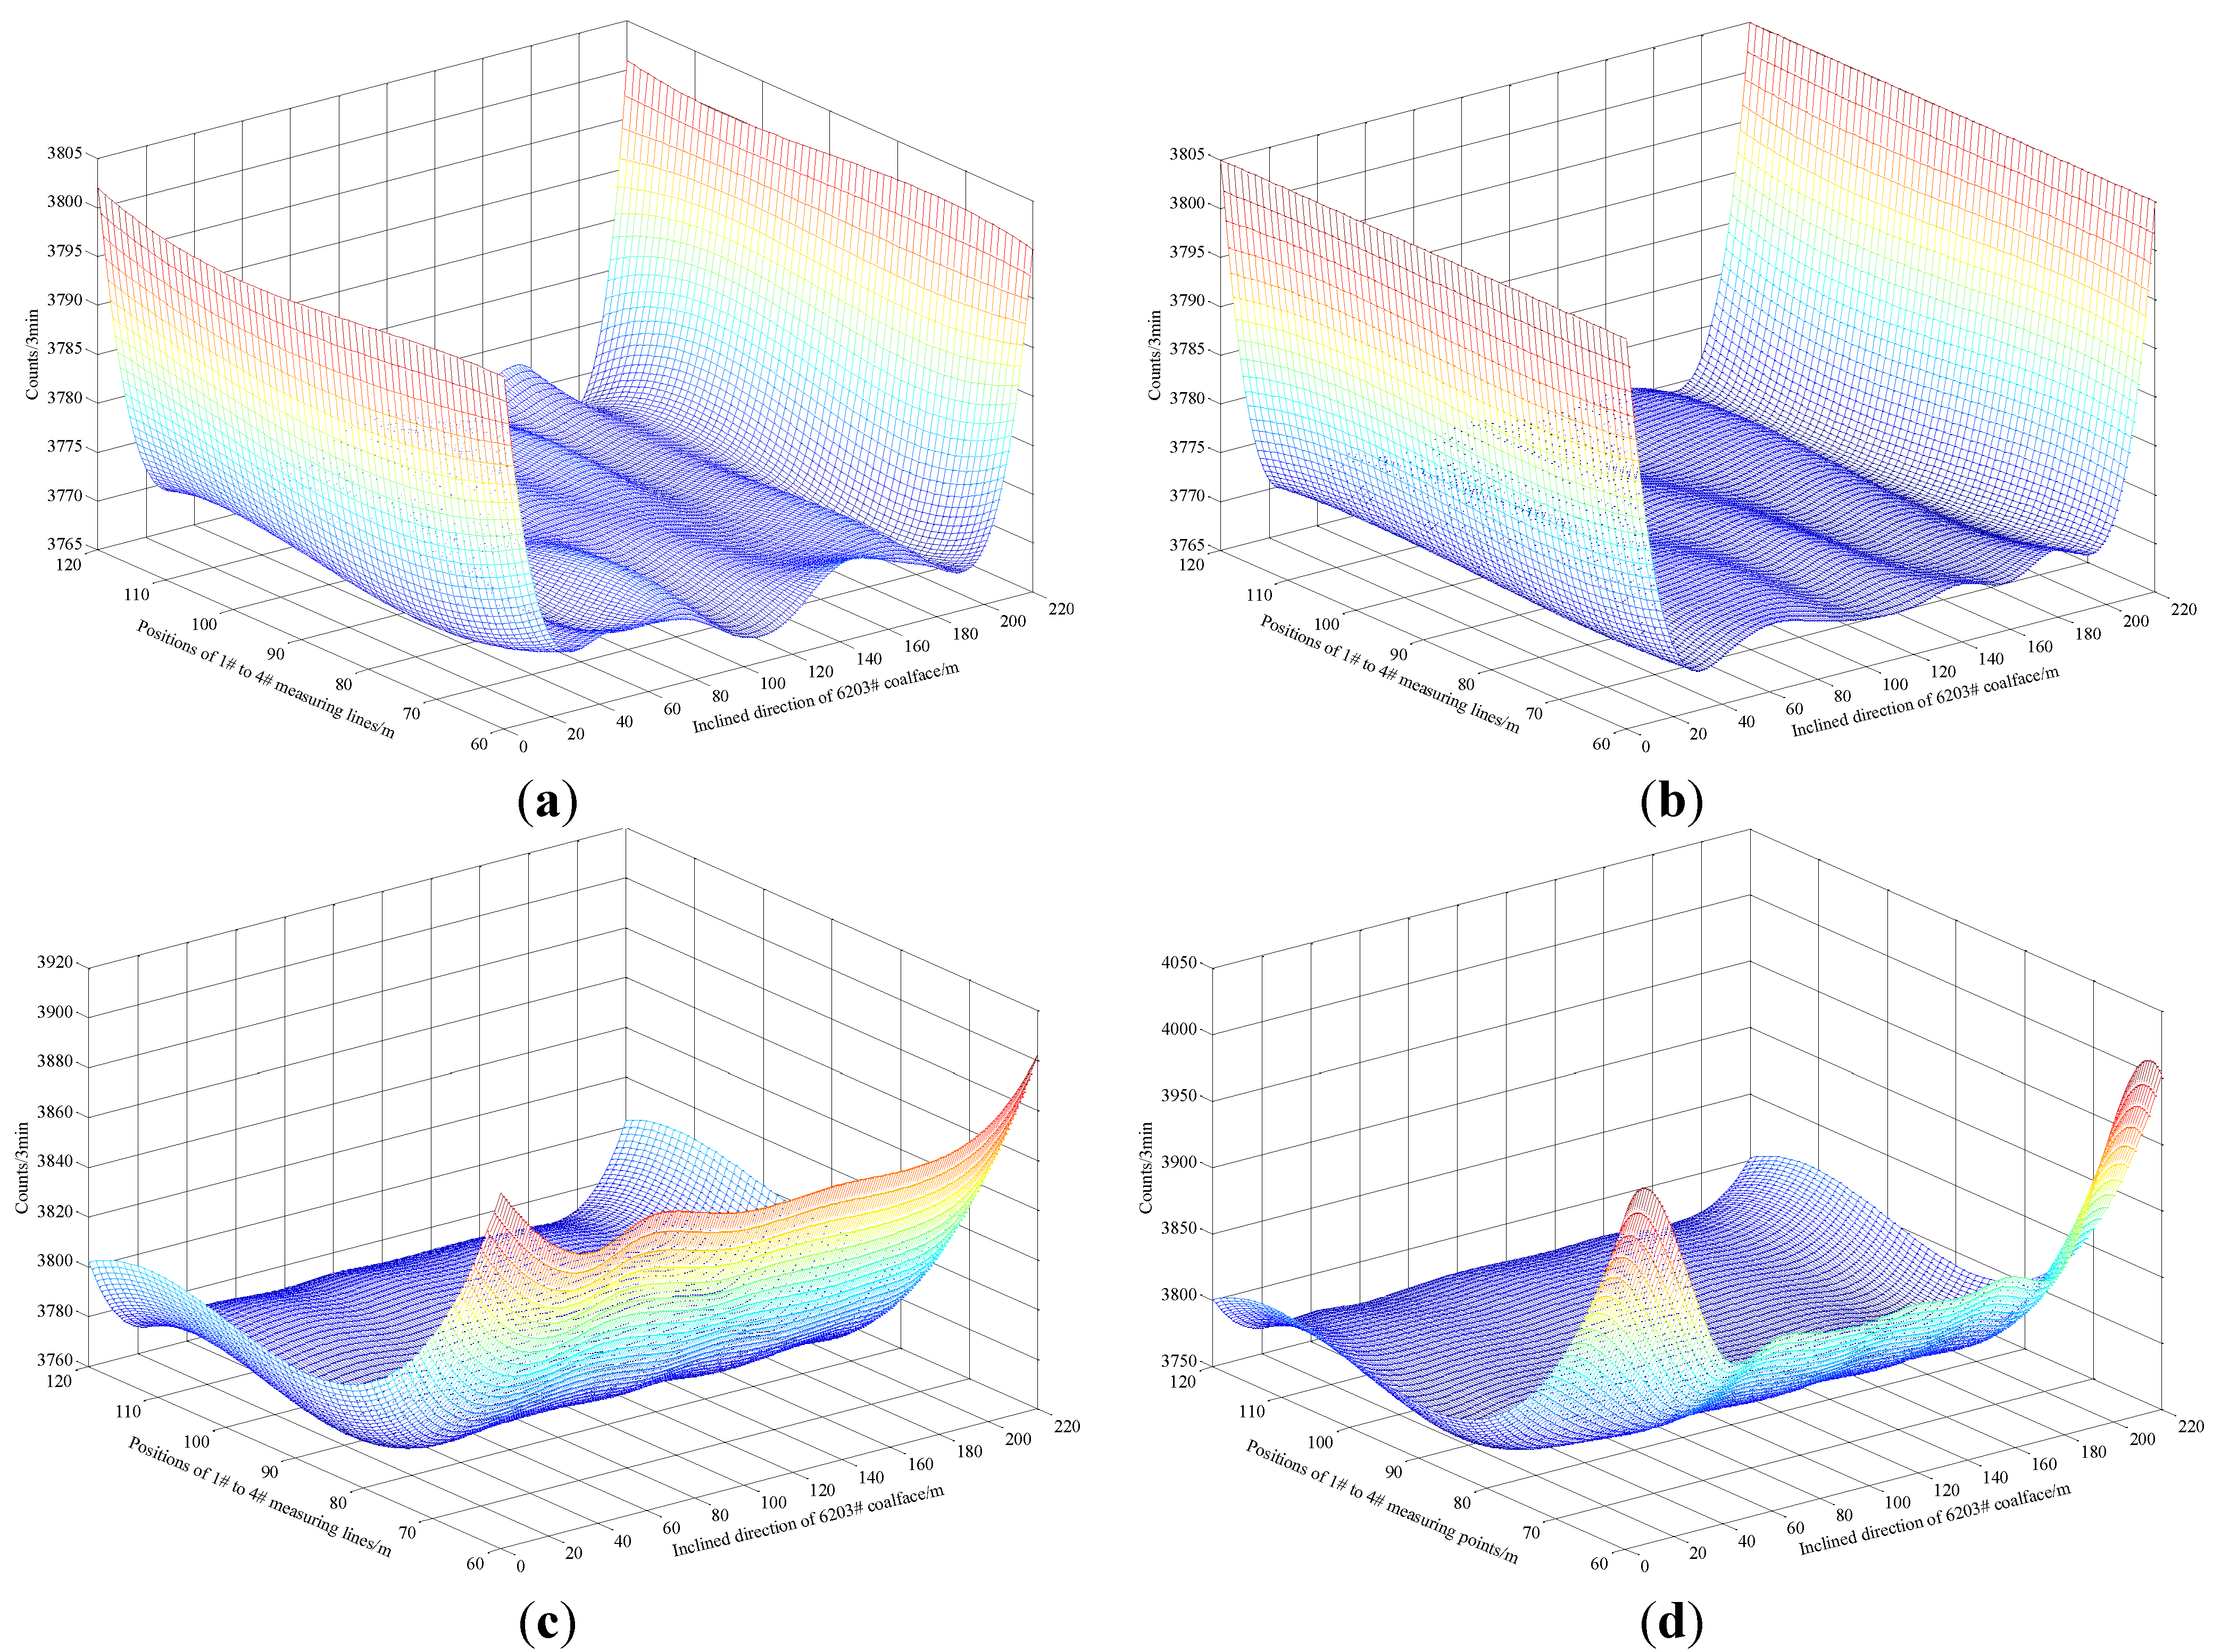
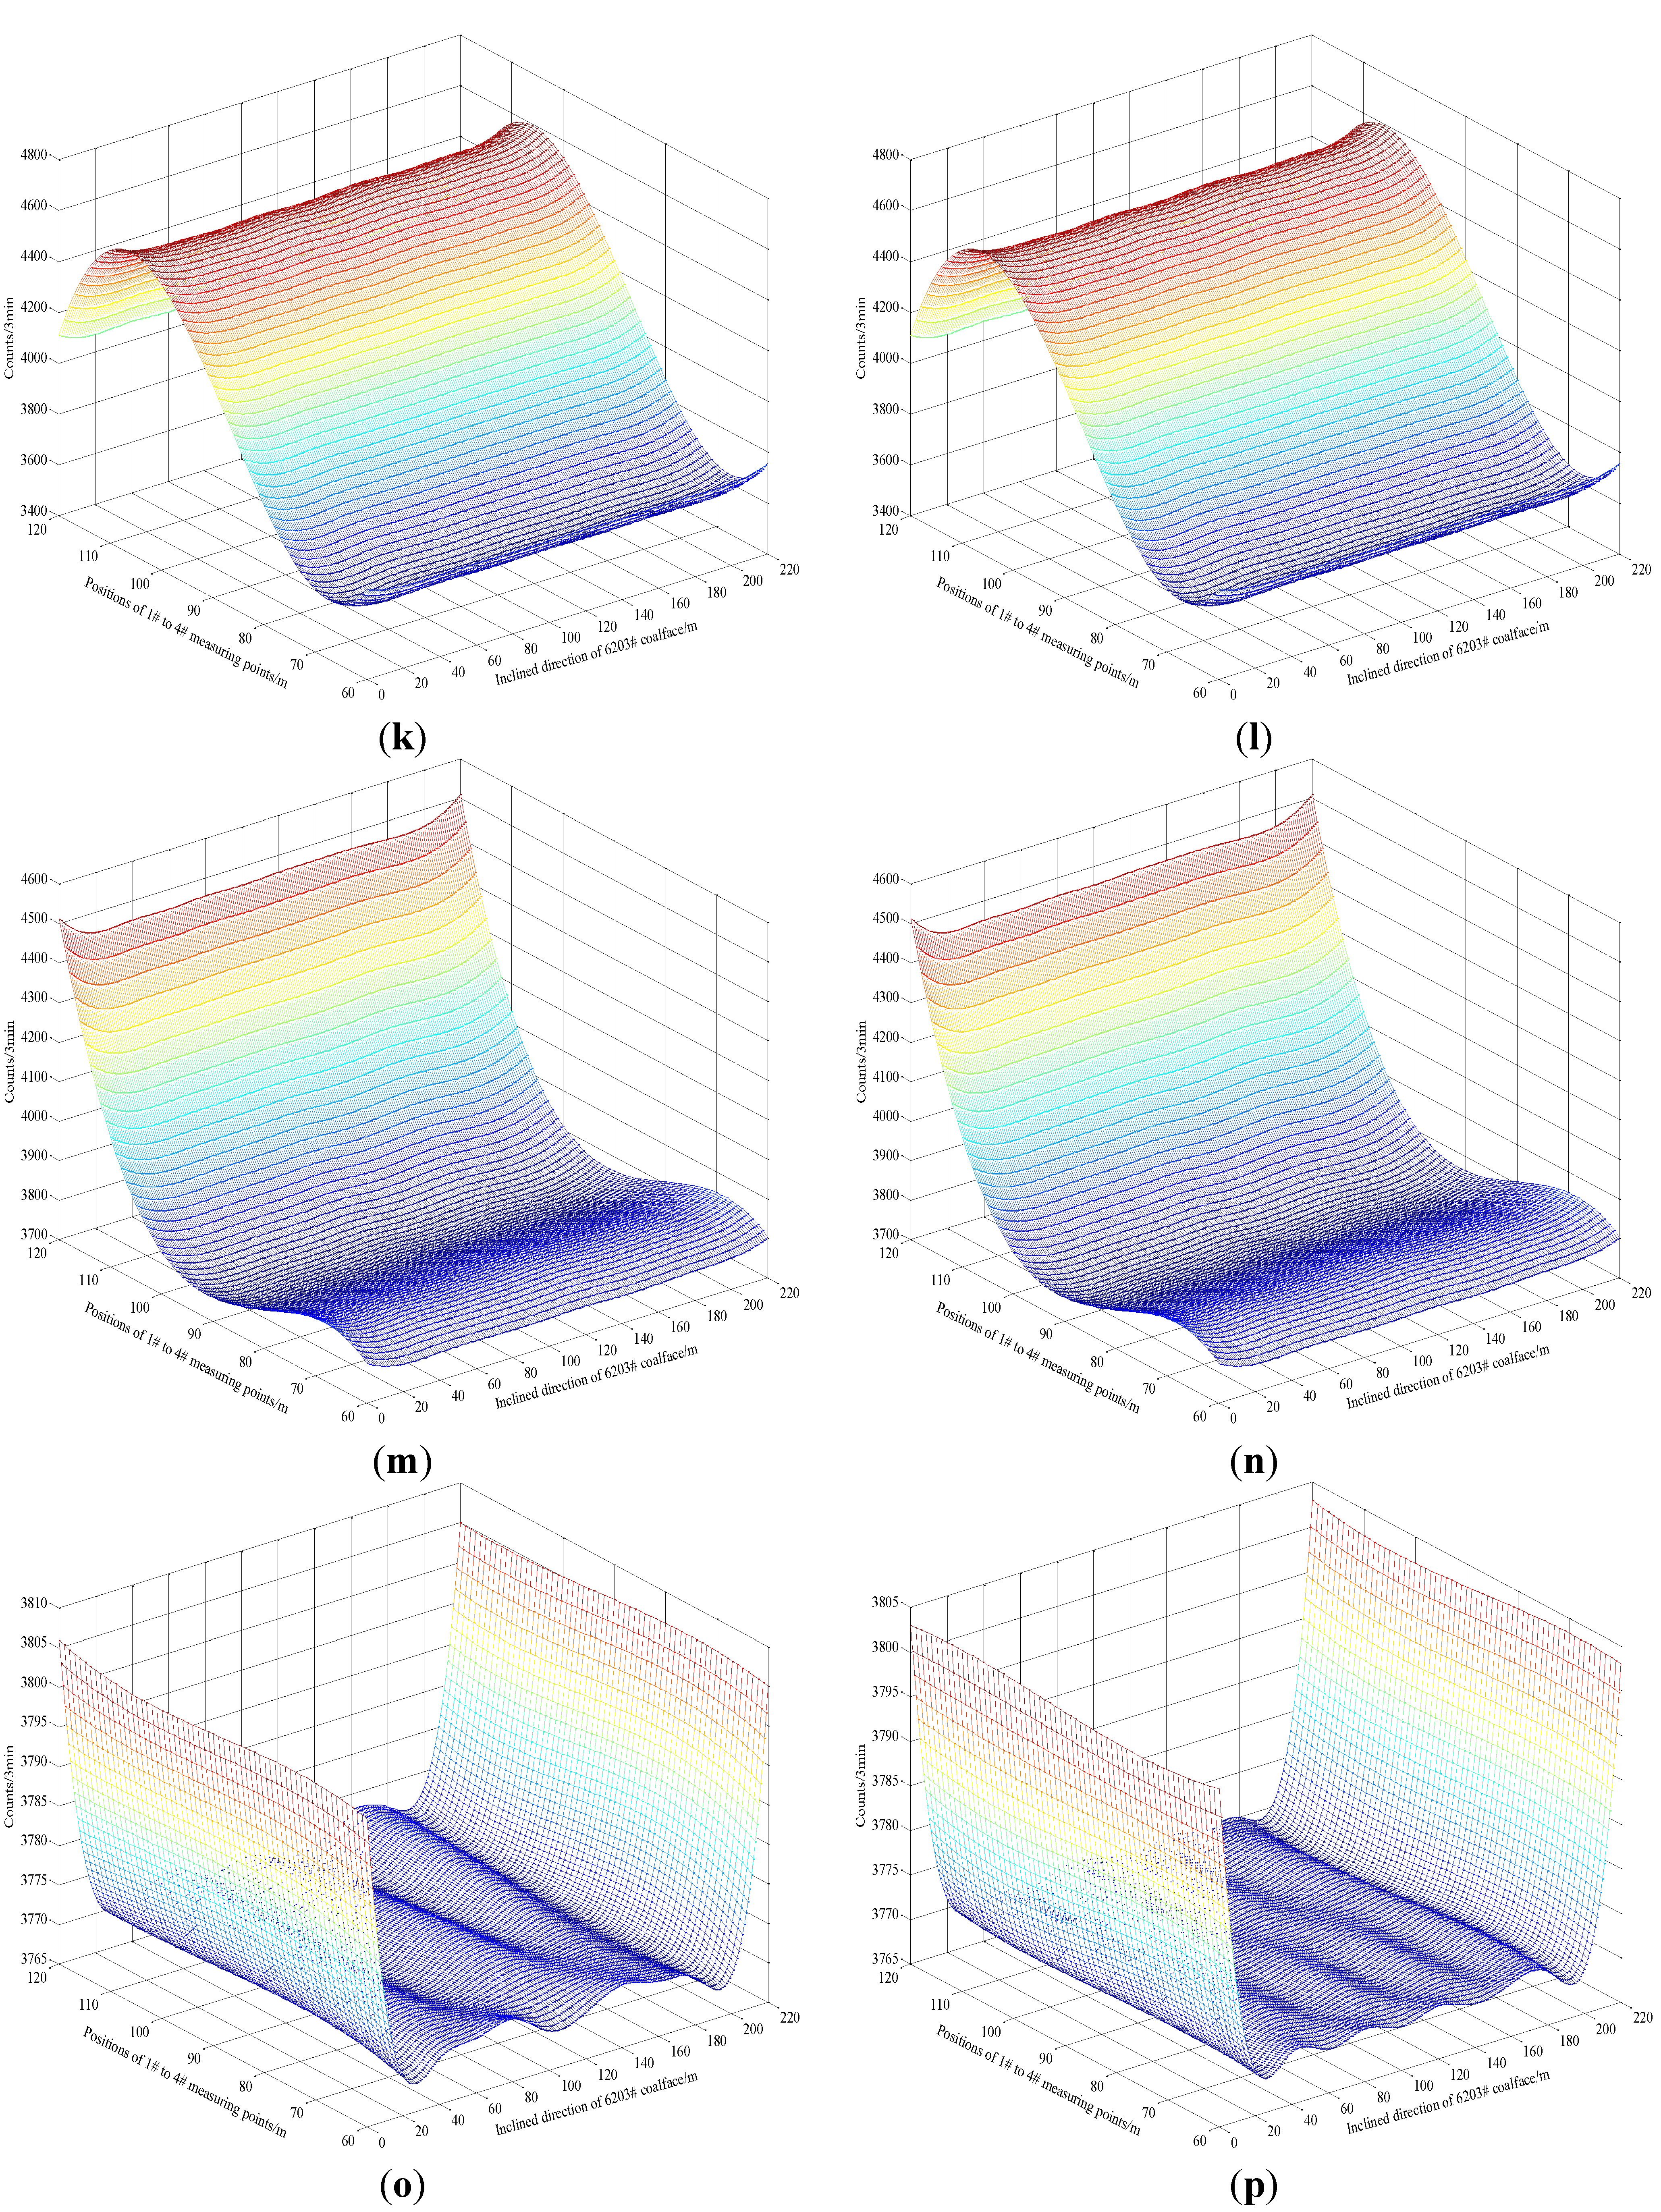
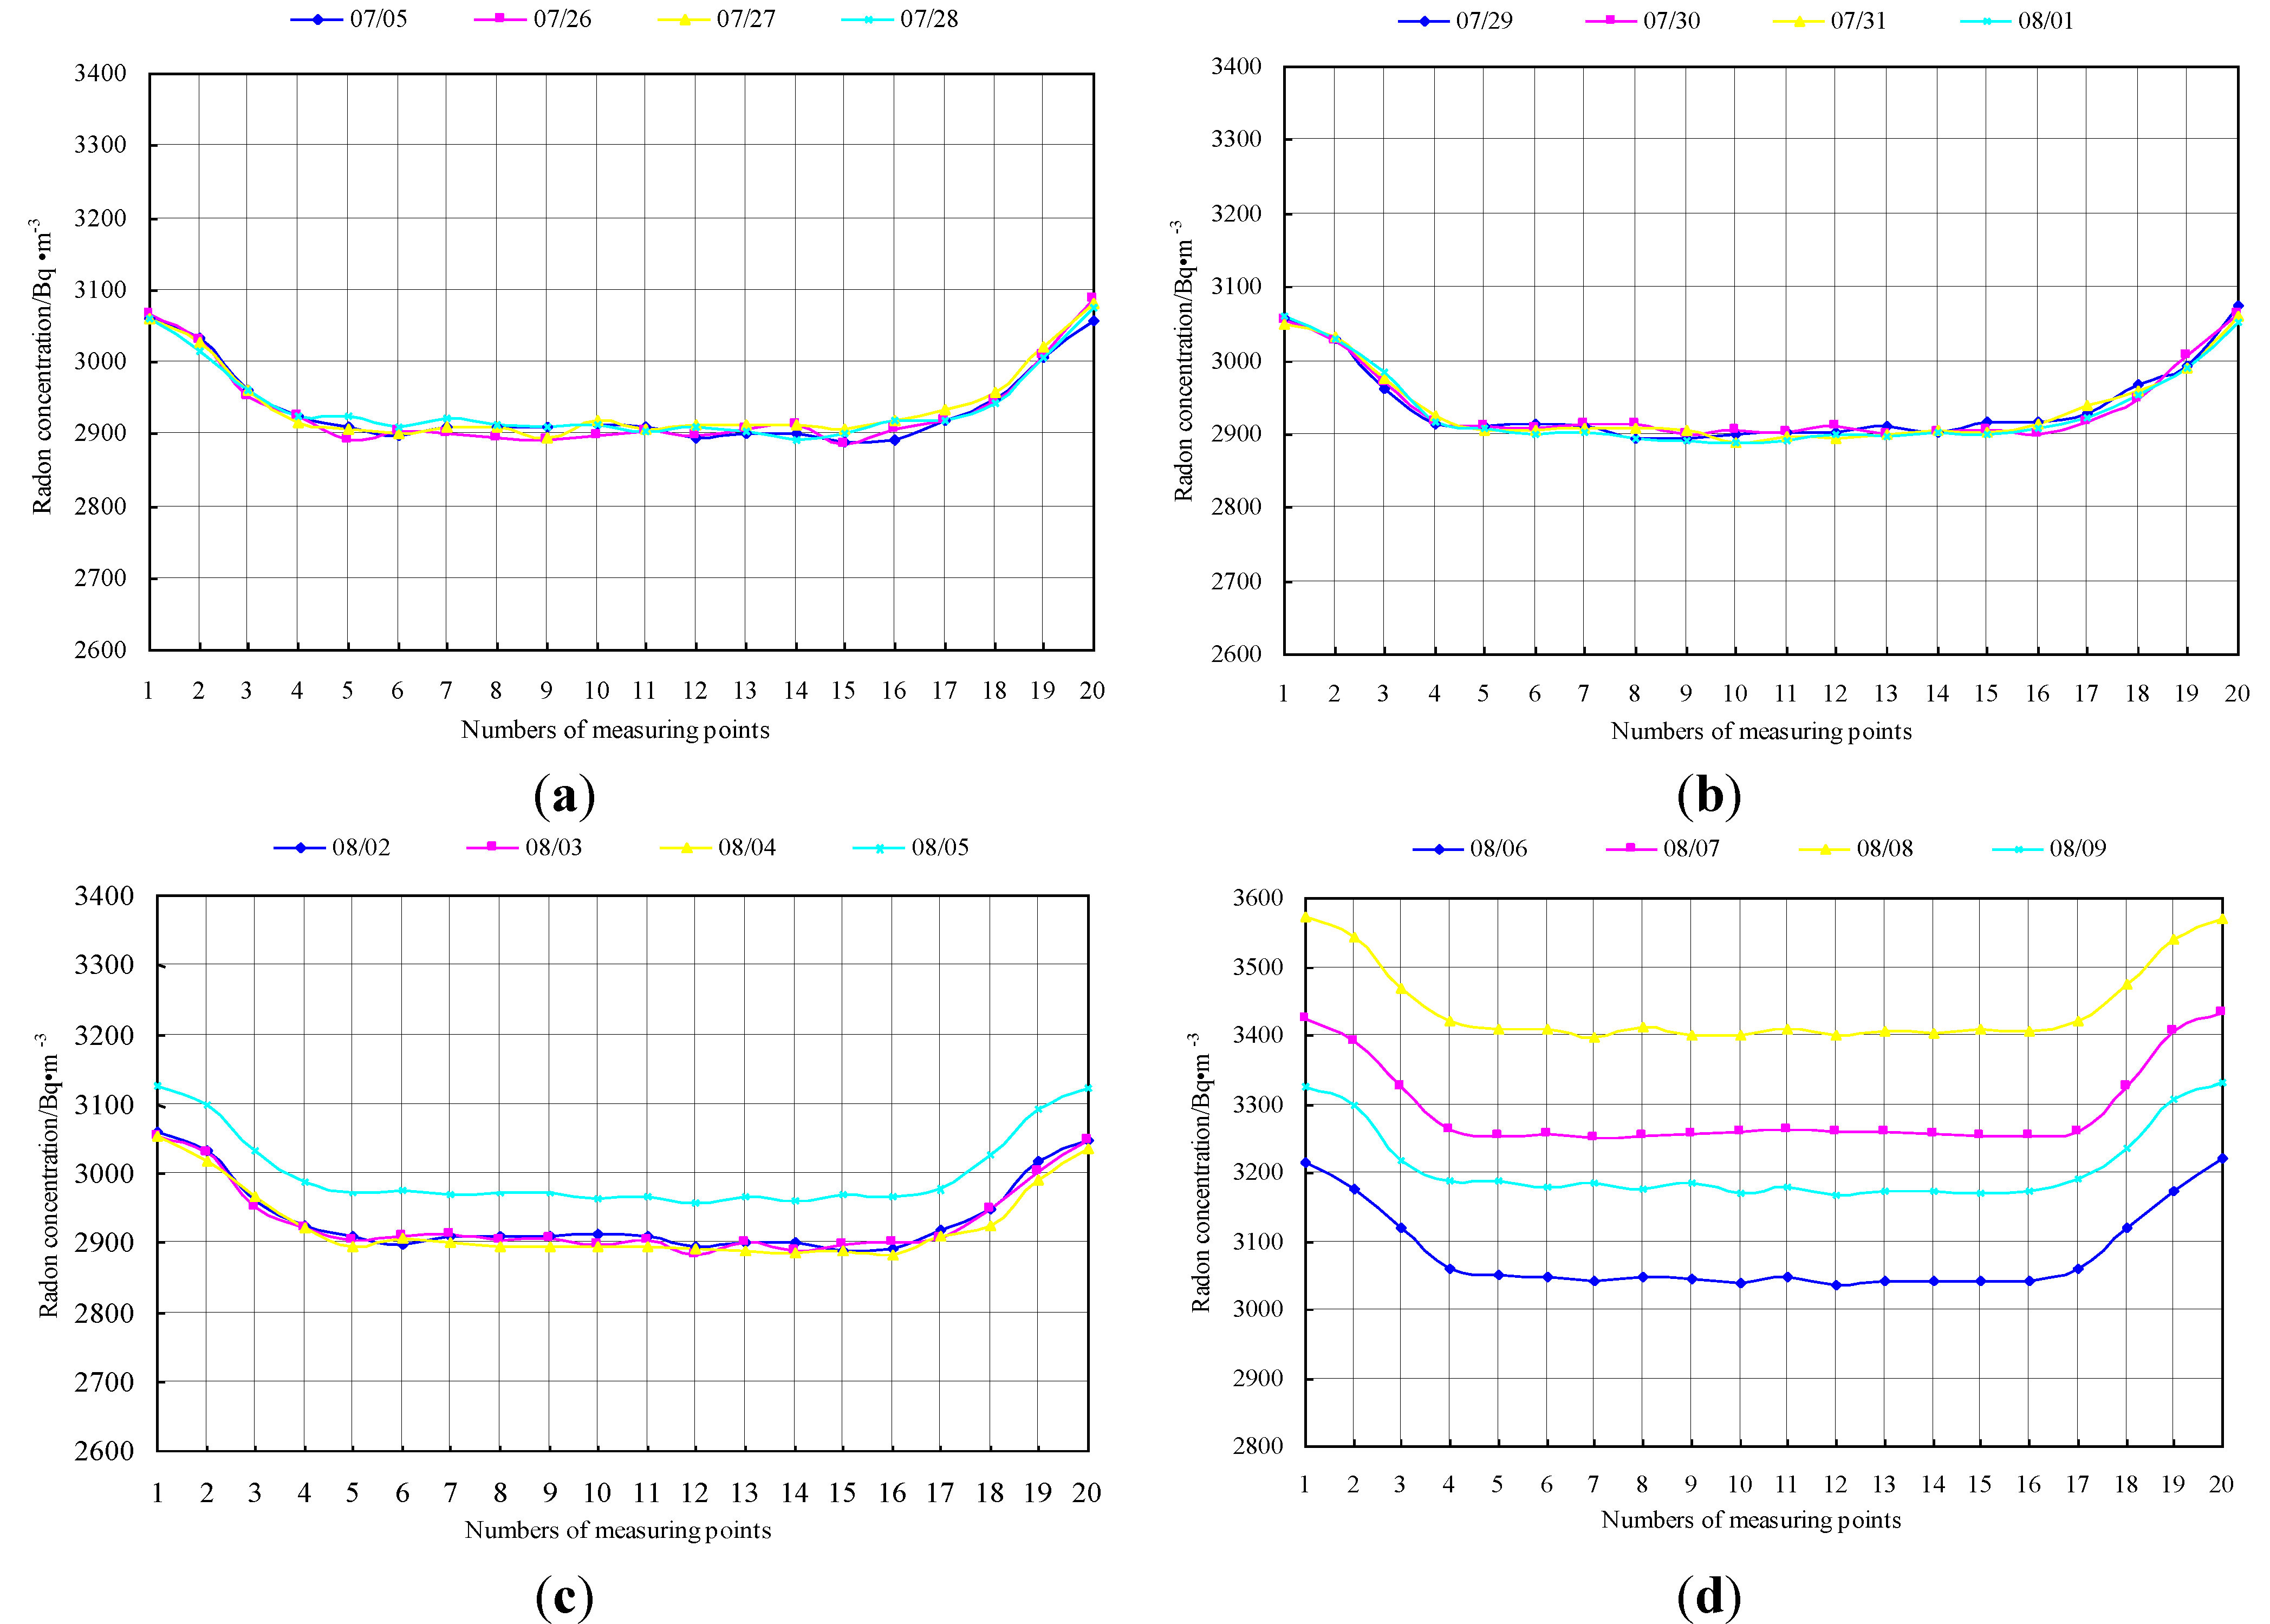
4.2.2. Measured Data Analysis
| Date | Advance distance (m) | Date | Advance distance (m) |
|---|---|---|---|
| 25 July | 8.8 | 2 August | 84.8 |
| 26 July | 18.3 | 3 August | 93.7 |
| 27 July | 27.2 | 4 August | 100.3 |
| 28 July | 38.6 | 5 August | 109.1 |
| 29 July | 47.9 | 6 August | 117.7 |
| 30 July | 57.6 | 7 August | 127.6 |
| 31 July | 66.3 | 8 August | 137.0 |
| 1 August | 75.9 | 9 August | 147.5 |


5. Discussion
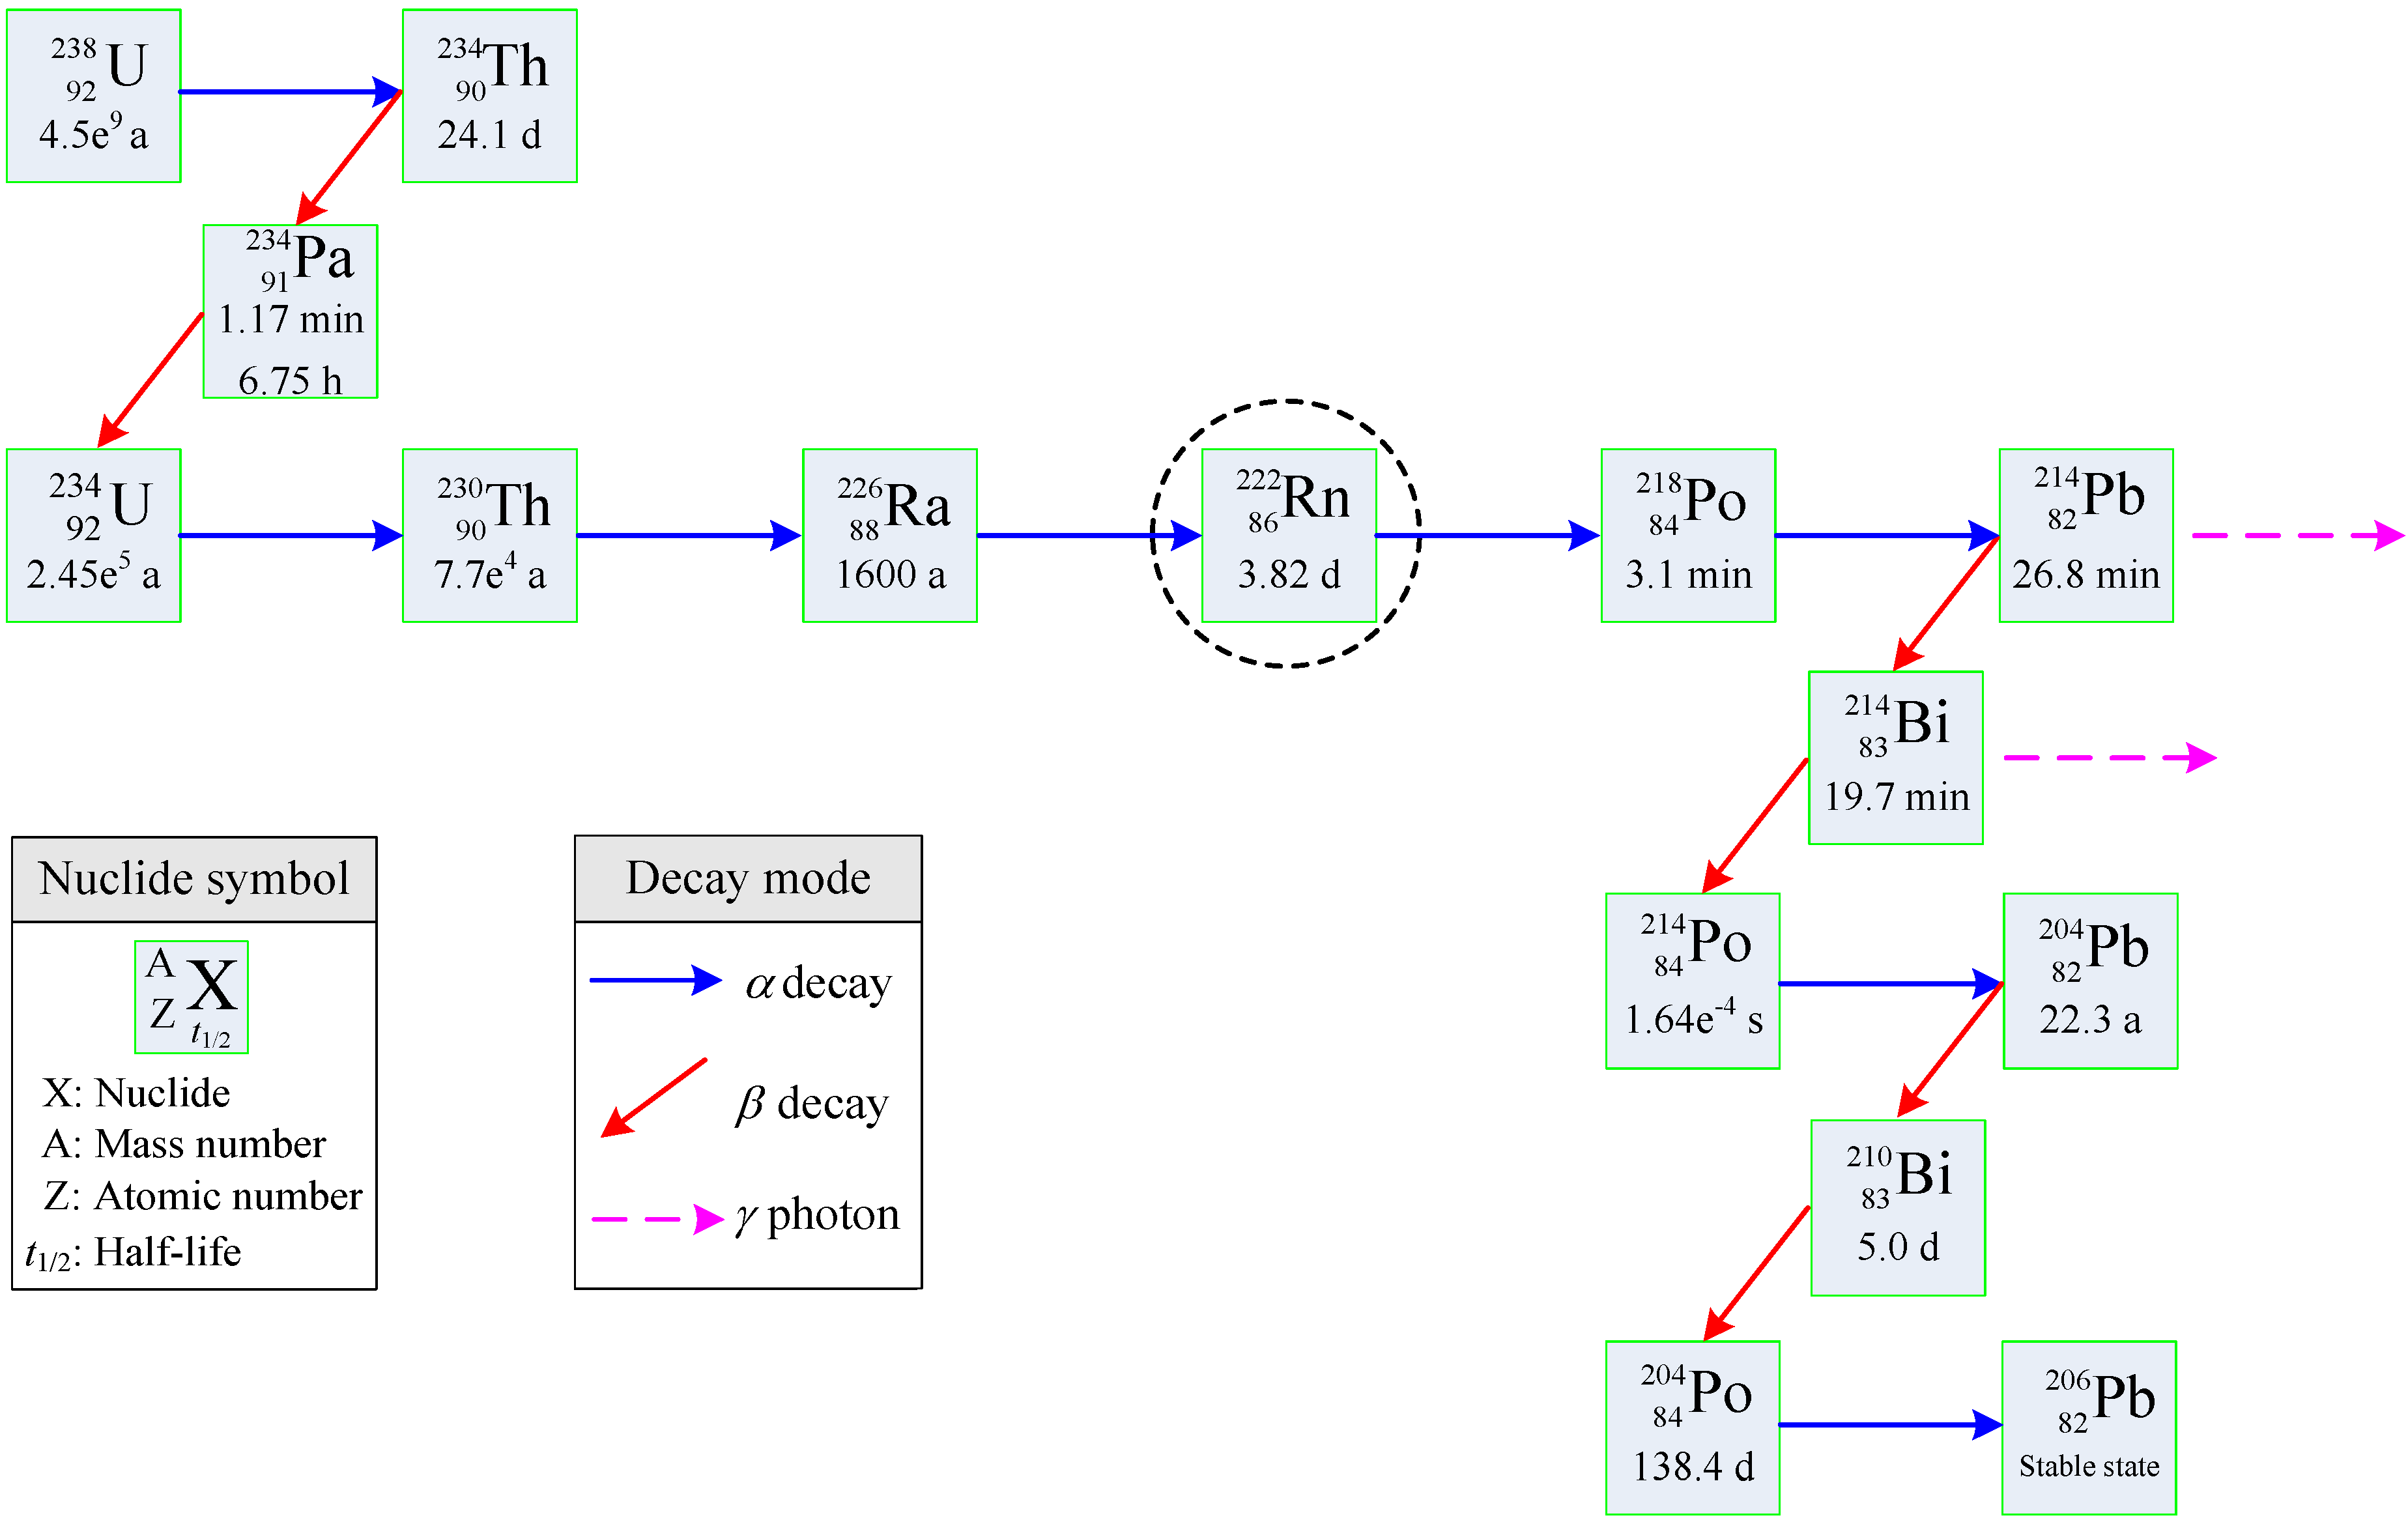
5.1. The Source of Radon
5.2. The Mechanism of Radon Migration
- (a)
- Radon diffusion and convection. Fliigge and Zimens first proposed that radon migration was caused by the diffusion effect in 1939 [37,38]. They suggested that radon migrates from areas of high concentration to areas of low concentration, a migration based on the Fick Theorem. Fleisher and Mogro Campero were the first to propose that radon migration was driven by the convection effect in 1979 [39,40]. Radon has been reported to travel considerable distances under the convection effect. However, many researchers have found that the combination of diffusion and convection is a viable migration mechanism for radon over distances of hundreds of meters [41,42].
- (b)
- (c)
- (d)
- Relay transmission. It may be radium to transmit radon and radon to transmit radon, also may be to rely on other matter or natural force. There are two types of transmission: two-step relay and multi-step relay. The authors think that the action of relay transmission may interpret the long migration of radon [47,48].
- (e)
- Infinite source model. The build-up of stress prior to an earthquake or the release of the stress after the event can cause the change in strain field within the earth. This field is expected to extend to long distance if the earth acts as an elastic continuum. Wherever the ground is squeezed, the pore spaces are narrowed non-linearly and radon gas will be extruded. Wattananikorn et al. [49] considers that an earth model in which an infinite source is overlain by an overburden of thickness which contains no radon source.
- (f)
- He-Rn cluster. Jia et al. [50] found that radon and most of its daughters and parents are decaying bodies that are able to radiate α-particles. After deceleration, the 4He combine with 222Rn and its daughters and parents to form He-Rn atomic clusters. When the buoyancy of air is greater than the gravity of the clusters, the self-ascending phenomenon occurs.
5.3. The Principle of Radon Detection Technique
5.4. Requirements for Future Research
- (a)
- A series of laboratory tests are necessary in order to investigate the effect of uncertain factors, such as strata types, moisture content, and mineral particle size, on radon concentration in strata, especially reduce the degree of influence due to environmental factors that can affect the radon variability. This is the most elementary study for radon detection technique.
- (b)
- How the mining-induced effect affects the movement of radon through strata? Although some numerical models of radon migration in soil have been proposed, there are few published studies available. Therefore, numerical modeling analysis is necessary to study the mining-induced effect on radon movement, in particular on its upright migration through underground multilayer strata. This study is of fundamental significance to the radon detection technique.
- (c)
- More on-site detection work on mining-induced fractures in overlying strata by using radon technique on the surface should be undertaken. These studies should consider the effect of various mining and geological conditions for quantitative study on the development law of mining-induced fractures in overlying strata.
- (d)
- If the conditions are allowable, the multi-parameter information should be synthetically considered. In recent years, some studies have investigated the detection of other forms of energy (e.g., acoustic emission, electromagnetic emission and neutron emission) as a reliable method for the monitoring of fracture phenomena and environmental protection against seismicity. For example, Carpinteri et al. [55] observed that energy emission during the failure process, clearly indicating charge redistribution, and neutron bursts, necessarily involving nuclear reactions, by subjecting quasi-brittle materials such as granite rocks to compression tests. Borla et al. [56] measured the electromagnetic pulses generated during micro-cracking of rock specimens by a dedicated loop antenna sensitive up to MHz, then took into account the relationship between electromagnetic emissions, neutron emissions and seismic activity, finally considered that it would be possible to set up a sort of alarm system that could be at the base of a warning network. Therefore, we should consider using the detection of other forms of energy together with radon measurement for our research.
6. Conclusions
- (1)
- Due to its properties, the radon migration process is relatively intricate and the various mechanisms suggested for its transport through the overlying strata are not fully understood. However, the diffusion and convection effects are widely considered to be the primary mechanism of radon migration, which lays the theoretical basis for the relevant research.
- (2)
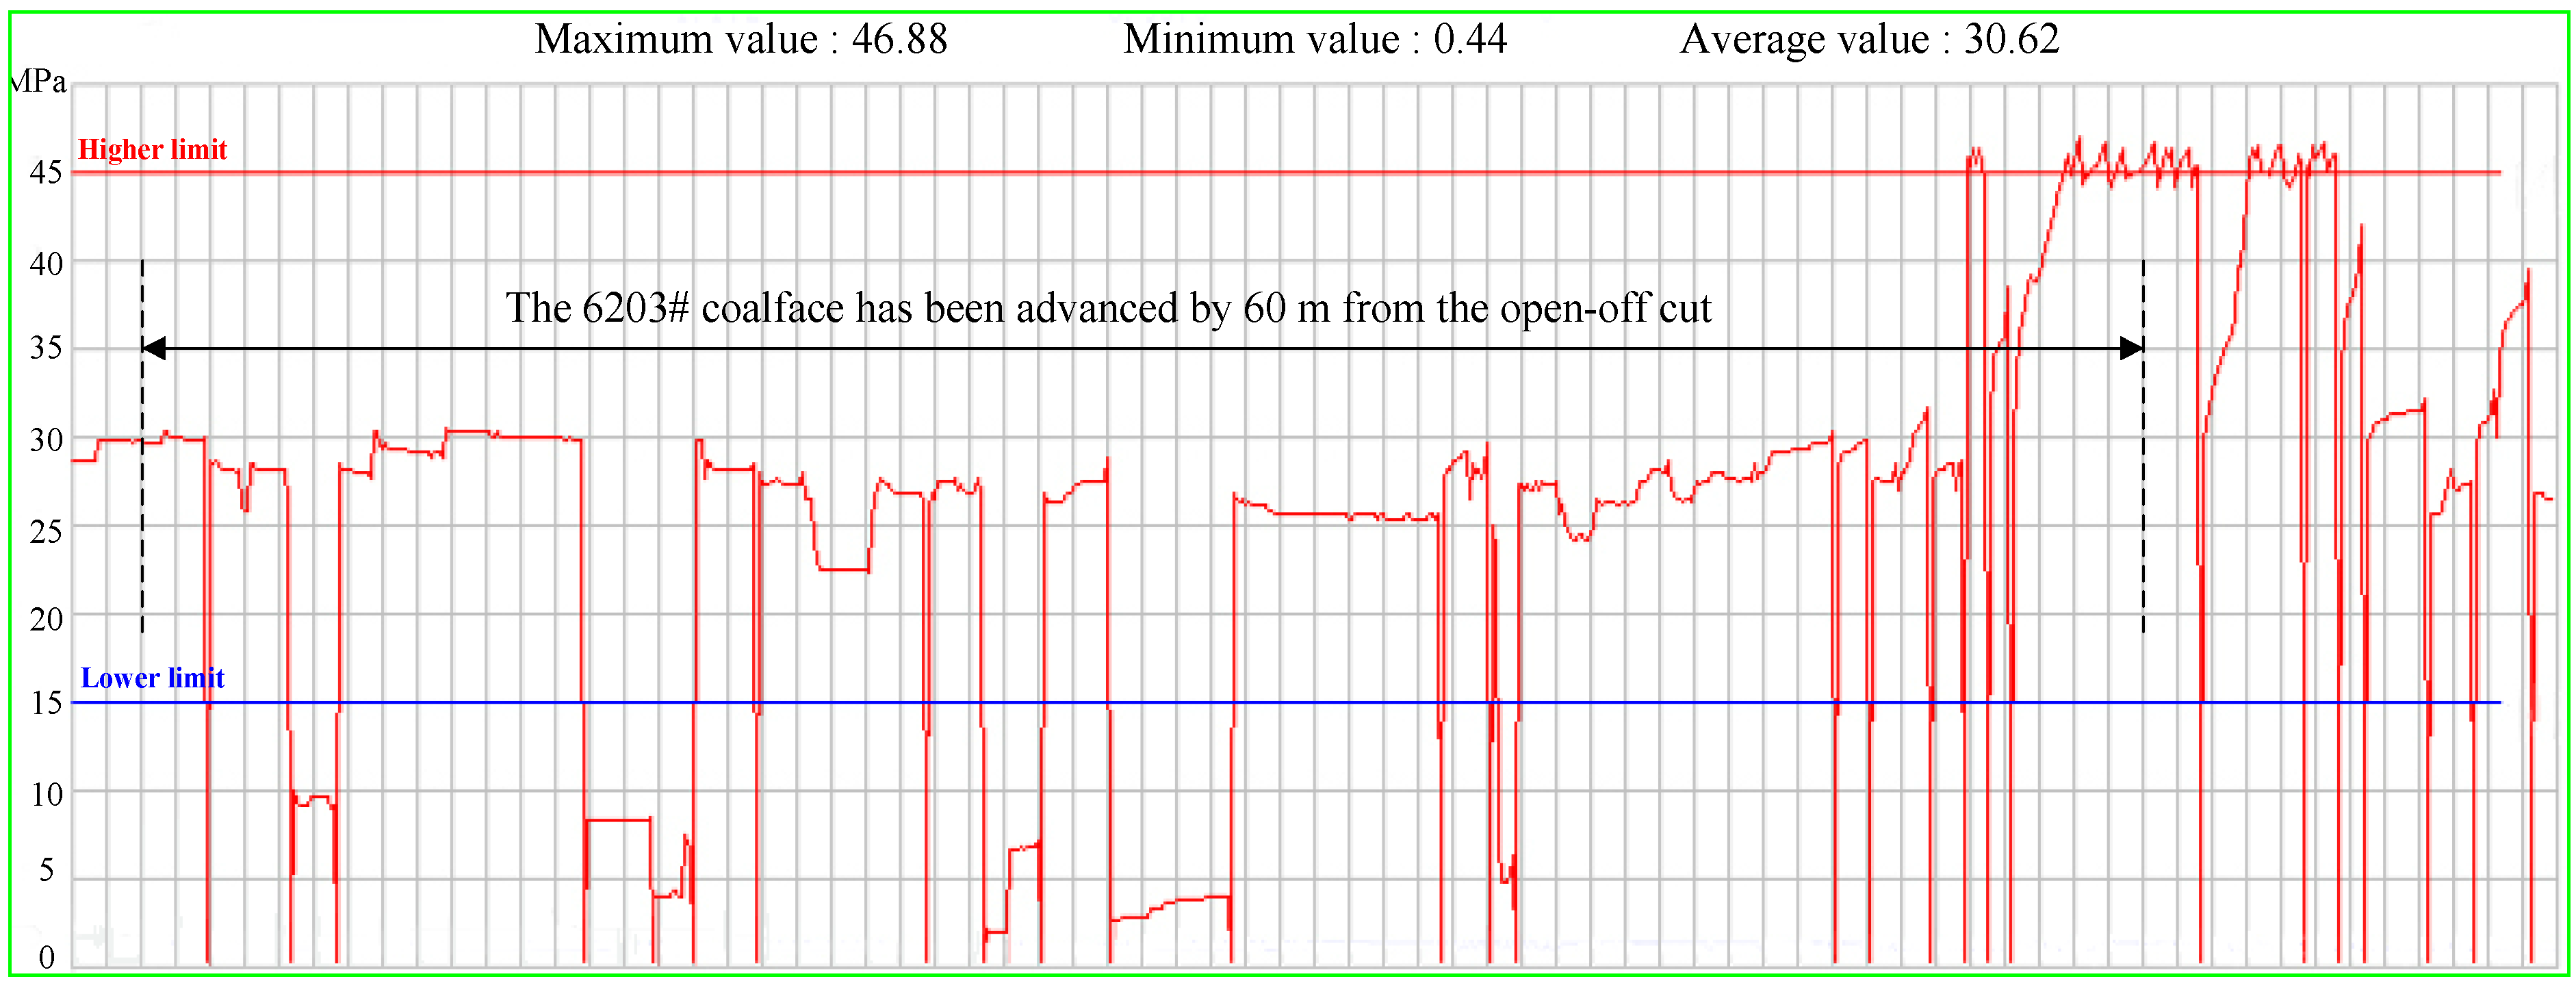
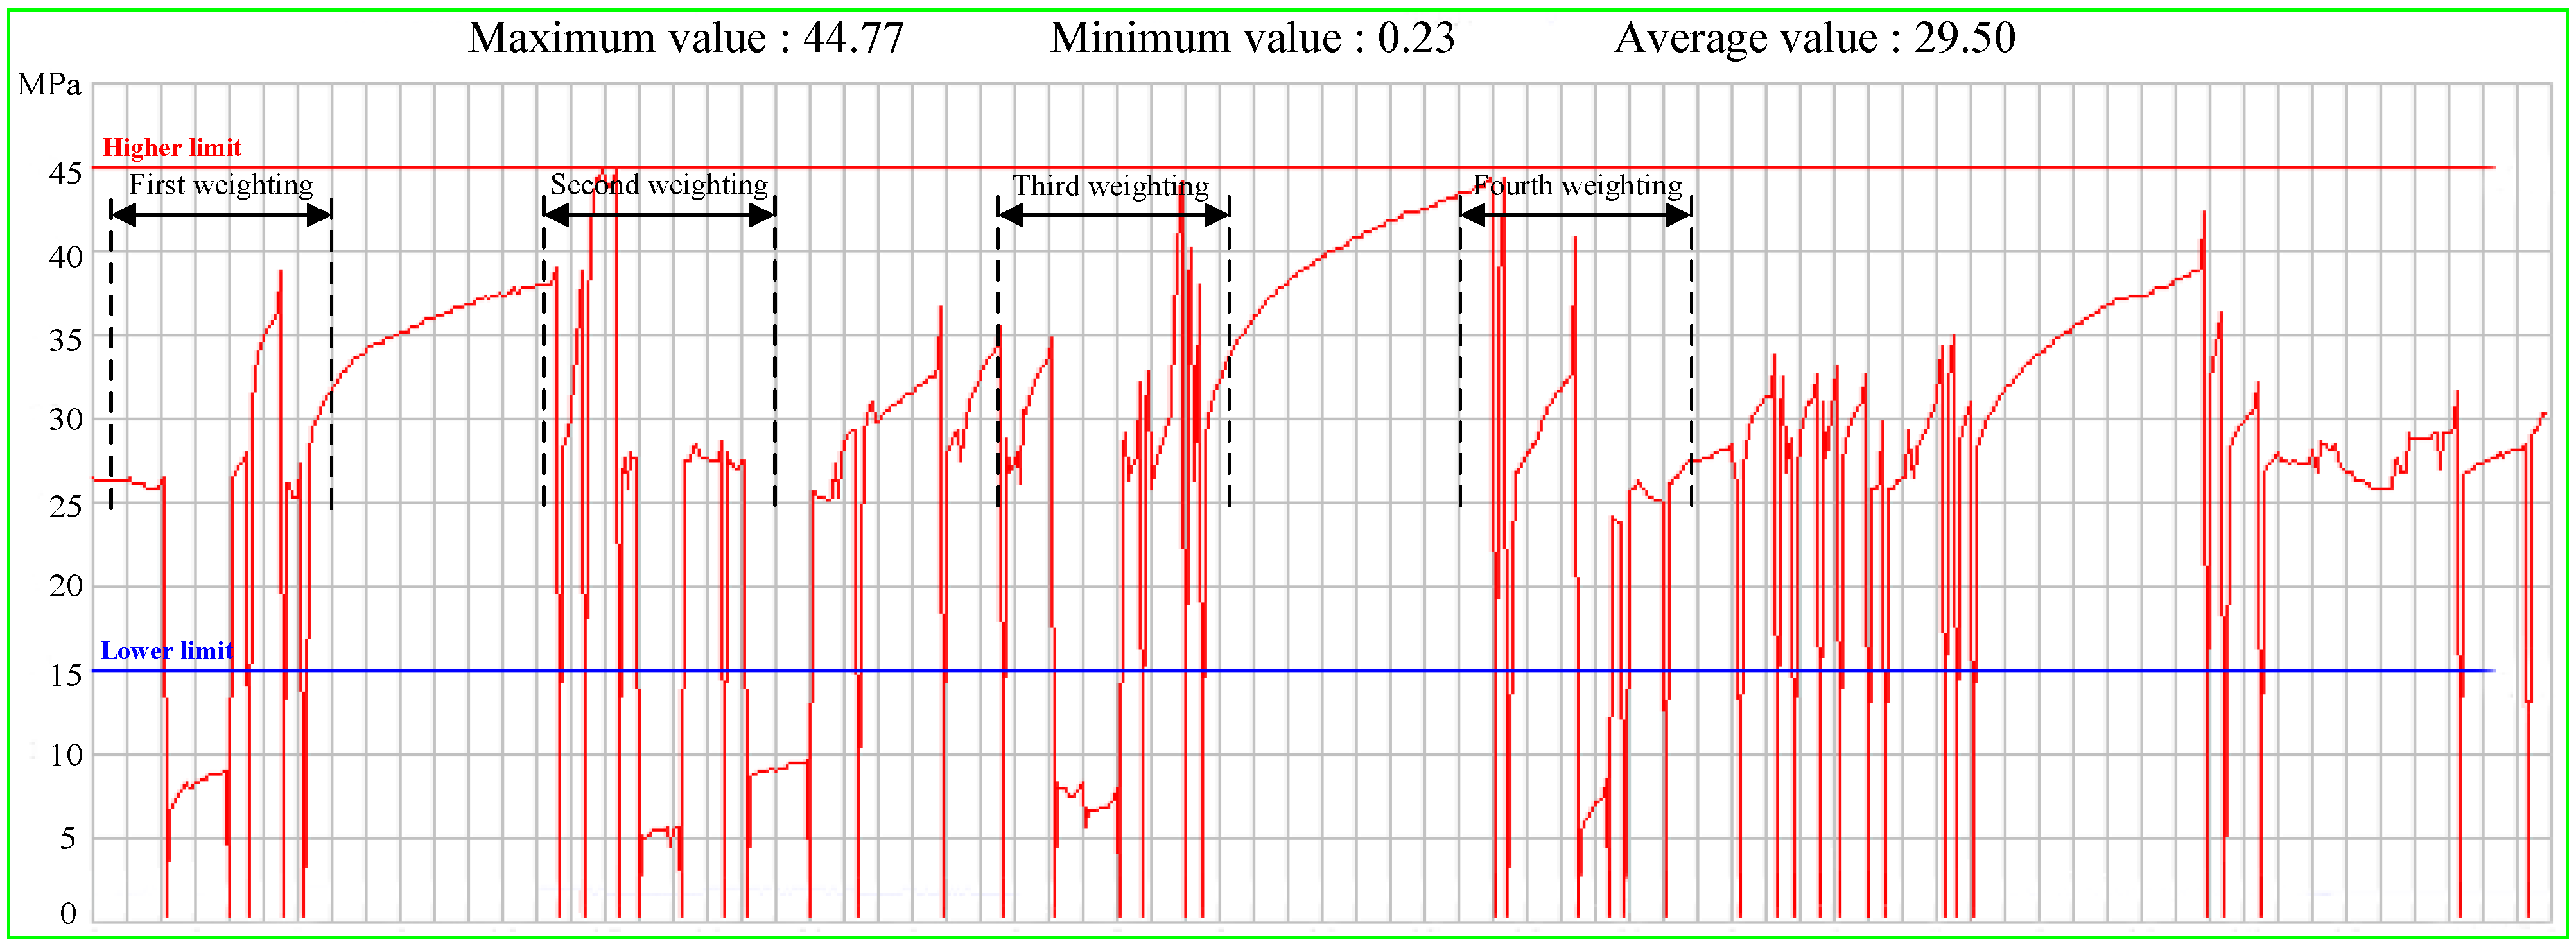
- The on-site radon detection trial conducted in the 6203# coalface demonstrates that the first weighting step is about 60 m, and the average periodic weighting step is about 20 m. These values are consistent with the observation results of underground mine pressure. In addition, it is inferred that the influence coverage of the advanced abutment pressure is equal to 30 m.
- (3)
- Although this study is based on specific detection conditions and limited measured data, the results suggest that the radon detection of mining-induced fractures from overlying strata to the surface is feasible. The radon detection technique may not directly help to prevent from any damage, as the damages (e.g., rock fracture, roof failure) already have happened during underground coal mining. Nevertheless, based on the detection results, the corresponding control measures of mining techniques (rapid advance, reducing mining height, localized backfill, grouting reinforcement, etc.) can be performed to reduce the development of the mining-induced fractures for the mitigation of safety issues as well as the adverse environmental consequences. Therefore, the new detection method should be generalized to account to the caused damage for the coal companies in western mining areas in China, which is also the long-term aim of this study.
- (4)
- In order to apply the radon technique to the detection of mining-induced fractures in overlying strata with greater certainty, further studies are needed in future, such as a series of laboratory tests, numerical modeling analysis, more on-site detection work, and multi-parameter information consideration.
Acknowledgments
Author Contributions
Conflicts of Interest
References
- Yu, S.W.; Wei, Y.M. Prediction of China’s coal production-environmental pollution based on a hybrid genetic algorithm-system dynamics model. Energy Policy 2012, 42, 521–529. [Google Scholar] [CrossRef]
- Chang, J.; Leung, D.Y.C.; Wu, C.Z.; Yuan, Z.H. A review on the energy production, consumption, and prospect of renewable energy in China. Renew. Sust. Energy Rev. 2003, 7, 453–468. [Google Scholar] [CrossRef]
- Zhou, H.D.; Wu, Q.; Fang, M.; Ren, Z.B.; Jin, L.F. Prediction of demand trends of coking coal in China based on grey linear regression composition model. Int. J. Glob. Energy Issues 2013, 36, 197–209. [Google Scholar] [CrossRef]
- Zhang, D.S.; Fan, G.W.; Liu, Y.D.; Ma, L.Q. Field trials of aquifer protection in longwall mining of shallow coal seams in China. Int. J. Rock Mech. Min. Sci. 2010, 47, 908–914. [Google Scholar] [CrossRef]
- Zhang, W.; Zhang, D.S.; Wu, L.X.; Wang, X.F. Numerical simulation on dynamic development features of mining induced fractures in overlying strata during shallow coal seam mining. Electron. J. Geotech. Eng. 2013, 18, 5531–5543. [Google Scholar]
- Ma, L.Q.; Zhang, D.S.; Li, X.; Fan, G.W.; Zhao, Y.F. Technology of groundwater reservoir construction in goafs of shallow coalfields. Int. J. Min. Sci. Technol. 2009, 19, 730–735. [Google Scholar]
- Yang, Y.K.; Kang, T.H.; Hao, X.L.; Zheng, T.B.; Wang, A. Research on in-situ purification technique of mine water in Shendong mining area. Energy Educ. Sci. Tech. 2012, 29, 209–216. [Google Scholar]
- Li, G.Y.; Zhou, W.F. Impact of karst water on coal mining in North China. Environ. Geol. 2006, 49, 449–457. [Google Scholar] [CrossRef]
- Zhang, D.S.; Fan, G.W.; Ma, L.Q.; Wang, X.F. Aquifer protection during longwall mining of shallow coal seams: A case study in the Shendong Coalfield of China. Int. J. Coal Geol 2011, 86, 190–196. [Google Scholar] [CrossRef]
- Ma, L.Q.; Du, X.; Wang, F.; Liang, J.M. Water-preserved mining technology for shallow buried coal seam in ecologically-vulnerable coal field: A case study in the Shendong coal field of China. Disaster Adv. 2013, 6, 268–278. [Google Scholar]
- Fan, G.W.; Zhang, D.S.; Zhai, D.Y.; Wang, X.F.; Lu, X. Laws and mechanisms of slope movement due to shallowly buried coal seam mining under ground gully. J. Coal Sci. Eng. 2009, 15, 346–350. [Google Scholar] [CrossRef]
- Zhang, J.C.; Peng, S.P. Water inrush and environmental impact of shallow seam mining. Environ. Geol. 2005, 48, 1068–1076. [Google Scholar] [CrossRef]
- Zhu, S.Y.; Jiang, Z.Q.; Cao, D.T.; Sun, Q.; Yang, C.W. Restriction function of lithology and its composite structure to deformation and failure of mining coal seam floor. Nat. Hazards 2013, 68, 483–495. [Google Scholar] [CrossRef]
- Wu, Q.; Wang, M.Y. Characterization of water bursting and discharge into underground mines with multilayered groundwater flow systems in the North China coal basin. Hydrogeol. J. 2006, 14, 882–893. [Google Scholar] [CrossRef]
- Lai, X.P.; Cai, M.F.; Xie, M.W. In situ monitoring and analysis of rock mass behavior prior to collapse of the main transport roadway in Linglong Gold Mine, China. Int. J. Rock Mech. Min. Sci. 2006, 43, 640–646. [Google Scholar] [CrossRef]
- Palchik, V. Localization of mining-induced horizontal fractures along rock layer interfaces in overburden: field measurements and prediction. Environ. Geol. 2005, 48, 68–80. [Google Scholar] [CrossRef]
- Zhang, S.T.; Liu, Y. A simple and efficient way to detect the mining induced water-conducting fractured zone in overlying strata. Energy Proc. 2012, 16, 70–75. [Google Scholar] [CrossRef]
- Qian, M.G.; Shi, P.W. Mining Pressure and Strata Control, 1st ed.; China University of Mining & Technology Press: Xuzhou, China, 2003. (In Chinese) [Google Scholar]
- Lehmann, B.E.; Ihly, B.; Salzmann, S.; Conen, F.; Simon, E. An automatic static chamber for continuous 220Rn and 222Rn flux measurements from soil. Radiat. Meas. 2004, 38, 43–50. [Google Scholar] [CrossRef]
- Ciotoli, G.; Etiope, G.; Guerra, M.; Lombardi, S.; Duddridge, G.A.; Grainger, P. Migration of gas injected into a fault in low-permeability ground. Q. J. Eng. Geol. Hydrogeol. 2005, 38, 305–320. [Google Scholar] [CrossRef]
- Rohnsch, W.; Przyborowski, S.; Ettenhuber, E. Investigation and evaluation of the radiation exposure situation in uranium mining areas of Eastern Germany. Radiat. Prot. Dosim. 1992, 45, 127–132. [Google Scholar]
- Zhang, W.; Zhang, D.S.; Wang, X.F.; Xu, M.T.; Wang, H.Z. Analysis of mathematical model for migration law of radon in underground multilayer strata. Math. Probl. Eng. 2014, 2014, 250852:1–250852:9. [Google Scholar]
- Zhang, W.; Zhang, D.S.; Fan, G.W. Design of comprehensive test system for detecting overlying strata mining-induced fractures on surface with radon gas. Int. J. Min. Sci. Technol. 2011, 21, 823–827. [Google Scholar]
- Zhang, W.; Zhang, D.S.; Ma, L.Q.; Wang, X.F.; Fan, G.W. Dynamic evolution characteristics of mining-induced fractures in overlying strata detected by radon. Nucl. Sci. Tech. 2011, 22, 334–337. [Google Scholar]
- Winkler, R.; Ruckerbauer, F.; Bunzl, K. Radon concentration in soil gas: A comparison of the variability resulting from different methods, spatial heterogeneity and seasonal fluctuations. Sci. Total Environ. 2001, 272, 273–282. [Google Scholar] [CrossRef] [PubMed]
- Banjanac, R.; Udovicic, V.; Dragic, A.; Jokovic, D.; Maletic, D.; Veselinovic, N.; Grabez, B. Daily variations of gamma-ray background and radon concentration. Rom. J. Phys. 2013, 58, 14–21. [Google Scholar]
- Wu, J.M.; Wu, X.W. Study and application of 222Rn technique in coal mines. China Coal 1998, 24, 22–24. (In Chinese) [Google Scholar]
- Xue, S.; Winkelmann, N. Detection of Underground Spontaneous Combustion of Coal with Surface-Based Radon Technique at Dartbrook Mine; University of Wollongong: Wollongong, Australia, 2005; pp. 265–270. [Google Scholar]
- Luo, H.H.; Tang, D.Z.; Yan, Q.T.; He, W.; Xu, H. Radioactive elements in natural gas: A case study on distribution of gaseous 222radon and its origin mechanism. Nat. Hazards 2012, 63, 647–657. [Google Scholar] [CrossRef]
- Lowe, S.; Pettenato, R. Reduction of indoor radon by air cleaning-case study. J. Environ. Eng. 2000, 126, 1125–1130. [Google Scholar] [CrossRef]
- Kristiansson, K.; Malmqvist, L. Evidence for nondiffusive transport of 222Rn in the ground and a new physical model for the transport. Geophys. 1982, 47, 1444–1452. [Google Scholar] [CrossRef]
- Toutain, J.P.; Baubron, J.C. Gas geochemistry and seismotectonics: A review. Tectonophysics 1999, 304, 1–27. [Google Scholar] [CrossRef]
- Villalbaa, L.; Colmenero, S.L.; Montero, C.M.E.; Cano, J.A.; Renteria, V.M.; Delgado, M.C.J.; Jurado, T.L.A.; Davila, R.I.; Herrera, P.E.F. Radon concentrations in ground and drinking water in the state of Chihuahua, Mexico. J. Environ. Radioact. 2005, 80, 139–151. [Google Scholar] [CrossRef] [PubMed]
- Calugaru, D.G.; Crolet, J.M. Identification of radon transfer velocity coefficient between liquid and gaseous phases. C.R. Mecanique 2002, 330, 377–382. [Google Scholar] [CrossRef]
- Wu, J.M.; Gao, S.Q. Study on temperature detection technique at fire district of coal spontaneous combustion and its application. China Saf. Sci. J. 2004, 14, 109–112. (In Chinese) [Google Scholar]
- Xue, S.; Dickson, B.; Wu, J. Application of 222Rn technique to locate subsurface coal heatings in Australian coal mines. Int. J. Coal Geol. 2008, 74, 139–144. [Google Scholar] [CrossRef]
- Semkow, T.M.; Parekh, P.P. The role of Radium distribution and porosity in radon emanation from solids. Geophys. Res. Lett. 1990, 17, 456–465. [Google Scholar] [CrossRef]
- Shuleikin, V.N. Radon transport to the near-surface soil and air layers. Izv. Atmos. Ocean. Phys. 2013, 49, 853–859. [Google Scholar] [CrossRef]
- Gingrich, J.E. Radon as a geochemical exploration tool. J. Geochem. Explor. 1984, 21, 13–19. [Google Scholar] [CrossRef]
- Reimer, G.M. Reconnaissance techniques for determining soil-gas radon concentrations: An example from Prince Georges County, Maryland. Geophys. Res. Lett. 1990, 17, 809–812. [Google Scholar] [CrossRef]
- Pal, M.; Graaf, E.R.; Meijer, R.J.; Wit, M.H.; Hendriks, N.A. Experimental set-up for measuring diffusive and advective transport of radon through building materials. Sci. Total Environ. 2001, 272, 315–321. [Google Scholar] [CrossRef] [PubMed]
- Cheng, Y.X.; Wang, N.P.; Hou, S.L.; Liu, Q.C. Theoretical research on source of radon from earth into air. Radiat. Prot. Bull. 2001, 21, 15–18. [Google Scholar]
- Wilkening, M.H.; Watkins, D.E. Air exchange and 222Radon concentration in the Carlsbad Cavens. Health Phys. 1976, 31, 139–143. [Google Scholar] [CrossRef] [PubMed]
- Belikov, V.T.; Shestakov, A.F. Use of variations in radon concentration in determining spatial and temporal characteristics of destruction zones. Russ. J. Nondestruct. Test. 2000, 36, 231–236. [Google Scholar] [CrossRef]
- Varhegyi, A.; Hakl, J.; Monnin, M.; Morin, J.P.; Seidel, J.L. Experimental study of radon transport in water as test for a transportation microbubble model. J. Appl. Geophys. 1992, 29, 37–46. [Google Scholar] [CrossRef]
- Zhou, Z.Y.; Tao, S.; Xu, F.L.; Dawson, R. A physical-mathematical model for the transport of heavy metals and toxic matter from point sources by geogas microbubbles. Ecol. Model. 2003, 161, 139–149. [Google Scholar] [CrossRef]
- Wu, H.S.; Bai, Y.S.; Lin, Y.F.; Chang, G.L. The action of relay transmission of the radon migration. Chin. J. Geophys. 1997, 40, 136–142. (In Chinese) [Google Scholar]
- Folger, P.F.; Poeter, E.; Wantye, R.B.; Day, W.; Frishman, D. 222Rn transport in fractured crystalline rock aquifer: results from numerical simulations. J. Hydrol. 1997, 195, 45–57. [Google Scholar] [CrossRef]
- Wattananikorn, K.; Kanaree, M.; Wiboolsake, S. Soil gas radon as an earthquake precursor: Some considerations on data improvement. Radiat. Meas. 1998, 29, 593–598. [Google Scholar] [CrossRef]
- Jia, W.Y.; Fang, F.; Zhou, R.S.; Ma, Y.J.; Qiu, Y.D.; Hou, X.S.; Wu, Y.P.; Zu, X.L.; Wang, X.Q. Internal causes of radon and its daughters upward migration and cluster phenomenon. J. Chengdu Univ. Technol. 1999, 26, 171–175. (In Chinese) [Google Scholar]
- Nazaroff, W.W. Radon transport from soil to air. Rev. Geophys. 1992, 30, 137–160. [Google Scholar] [CrossRef]
- Sun, H.B.; Furbish, D.J. Moisture content effect on radon emanation in porous media. J. Contam. Hydrol. 1995, 18, 239–255. [Google Scholar] [CrossRef]
- Hutter, A.R. Spatial and temporal variations of soil gas 220Rn and 222Rn at two sites in New Jersey. Environ. Int. 1996, 22, 455–469. [Google Scholar] [CrossRef]
- Xue, S.; Wang, J.; Xie, J.; Wu, J. A laboratory study on the temperature dependence of the radon concentration in coal. Int. J. Coal Geol. 2010, 83, 82–84. [Google Scholar] [CrossRef]
- Carpinteri, A.; Lacidogna, G.; Borla, O.; Manuello, A.; Niccolini, G. Electromagnetic and neutron emissions from brittle rocks failure: Experimental evidence and geological implications. Sadhana 2012, 37, 59–78. [Google Scholar] [CrossRef]
- Borla, O.; Lacidogna, G.; Battista, E.D.; Niccolini, G.; Carpinteri, A. Electromagnetic emission as failure precursor phenomenon for seismic activity monitoring. Fract. Fatigue Fail. Damage Evol. 2015, 5, 221–229. [Google Scholar]
© 2014 by the authors; licensee MDPI, Basel, Switzerland. This article is an open access article distributed under the terms and conditions of the Creative Commons Attribution license (http://creativecommons.org/licenses/by/4.0/).
Share and Cite
Zhang, W.; Zhang, D.-S.; Wu, L.-X.; Wang, H.-Z. On-Site Radon Detection of Mining-induced Fractures from Overlying Strata to the Surface: A Case Study of the Baoshan Coal Mine in China. Energies 2014, 7, 8483-8507. https://doi.org/10.3390/en7128483
Zhang W, Zhang D-S, Wu L-X, Wang H-Z. On-Site Radon Detection of Mining-induced Fractures from Overlying Strata to the Surface: A Case Study of the Baoshan Coal Mine in China. Energies. 2014; 7(12):8483-8507. https://doi.org/10.3390/en7128483
Chicago/Turabian StyleZhang, Wei, Dong-Sheng Zhang, Li-Xin Wu, and Hong-Zhi Wang. 2014. "On-Site Radon Detection of Mining-induced Fractures from Overlying Strata to the Surface: A Case Study of the Baoshan Coal Mine in China" Energies 7, no. 12: 8483-8507. https://doi.org/10.3390/en7128483