Article

Optimization of Experimental Model Parameter Identification for Energy Storage Systems

1
Department of Industrial and Information Engineering, Second University of Naples, Via Roma 29, Aversa (CE) 81031, Italy
2
Department of Information Engineering Infrastructure and Sustainable Energy, University Mediterranea of Reggio Calabria, Via Graziella (Loc. Feo Vito), Reggio Calabria 89124, Italy
*
Author to whom correspondence should be addressed.
Energies 2013, 6(9), 4572-4590; https://doi.org/10.3390/en6094572
Submission received: 28 March 2013 / Revised: 22 August 2013 / Accepted: 26 August 2013 / Published: 3 September 2013

Abstract

:
The smart grid approach is envisioned to take advantage of all available modern technologies in transforming the current power system to provide benefits to all stakeholders in the fields of efficient energy utilisation and of wide integration of renewable sources. Energy storage systems could help to solve some issues that stem from renewable energy usage in terms of stabilizing the intermittent energy production, power quality and power peak mitigation. With the integration of energy storage systems into the smart grids, their accurate modeling becomes a necessity, in order to gain robust real-time control on the network, in terms of stability and energy supply forecasting. In this framework, this paper proposes a procedure to identify the values of the battery model parameters in order to best fit experimental data and integrate it, along with models of energy sources and electrical loads, in a complete framework which represents a real time smart grid management system. The proposed method is based on a hybrid optimisation technique, which makes combined use of a stochastic and a deterministic algorithm, with low computational burden and can therefore be repeated over time in order to account for parameter variations due to the battery’s age and usage.

1. Introduction

The Smart Grid was envisioned to take advantage of all available modern technologies so as to transform the current grid into a “smarter” grid. The main objective of having a “smarter” grid is, in particular, to facilitate the integration of: (i) renewable resources including solar and wind power at all levels from consumer premises to centralized plants in order to advance global energy sustainability; (ii) all types of energy storage and other resources such as plug-in electric vehicles (PEVs) to counter the variability of renewable resources and demand.
Renewable resources, while supplementing generation capacity and addressing environmental concerns, bring reliability into question due to their volatility. Demand response and electric storage facilities are necessary to be able to address the economic viability of the grid and are perceived as supporting reliability by mitigating peak demand and load variability.
Electrical energy storage systems disaggregate into a number of fairly well-defined categories [1,2,3,4,5,6,7]. Battery storage appears to be the most promising due to improvements in technology as well as its economy of scale. Storage tends to flatten the net demand profile and, as such, is expected to improve reliability. In addition, most battery storage devices can respond in millisecond time scales. Hence they can be valuable as enablers of fast controls in a Smart Grid. Storages of various sizes can be distributed throughout the grid, ranging from end-user customer premises to major substations and central power stations. This can alleviate congestion in terms of both transmission as well as distribution.
In batteries, the energy of chemical compounds acts as a storage medium. A battery is a device that can store electrical power in the form of chemical energy and release this energy by means of chemical reactions when needed [8,9]. Since the characteristics of the battery (chemical reactions) are seriously influenced by the internal and external environment, it is necessary to establish accurate battery models which can facilitate the utilization of batteries more efficiently.
This paper focuses on battery-based electrical energy storage for Smart Grids. In particular, the paper aims to present an optimisation method to identify the model parameters obtained from experimental data. The accurate model thus obtained can be integrated, in addition to energy source models and electrical loads, in a complete framework which represents a real-time Smart Grid management system that aims to achieve robust real-time control over the network from the perspective of stability and energy supply forecasting. The proposed method is based on a hybrid optimisation technique which makes combined use of stochastic as well as deterministic algorithms and has a low computational burden, therefore making it possible to repeat it over time in order to account for parameter variations arising as a result of battery age and usage. Similar techniques have been used by authors in other power system applications as well as for the measurement of transducer compensation and energy consumption minimization in electrical railway traction systems [10,11,12,13,14,15]. The content of this paper is structured as follows: in Section 2, after a brief review of the main battery models and the main factors influencing their accuracy, the utilized battery model is explained. In Section 3, the proposed procedure is presented: the experimental setup for battery characterization and the implemented optimization techniques are shown. Finally, Section 4 shows the experimental results and a comparison with other techniques explained in scientific literature.

2. The Battery Model

Mathematical battery models aim to predict the behavior of batteries starting from a specific set of parameters. There are numerous factors that affect a battery’s operation including discharge rate, charge rate, battery age, battery type, and temperature. There are many methods of modeling battery operation and each model has its own benefits and drawbacks [16,17,18,19,20,21,22,23,24,25,26,27,28,29,30,31,32,33,34,35,36,37,38,39,40,41,42,43].
A wide variety of battery models with varying degrees of complexity have been developed. The two primary modeling strategies are circuit-oriented and mathematical modeling strategies [23,25,31,32]. The most simple battery models [24,28] are the mathematical models primarily based on the Shepherd Relation [30]. However, most conventional mathematical battery models are considered to work only for specific applications and can provide inaccurate results with 5%–20% error rates [29]. This paper investigates the possibility of an increment in the simulation result accuracy that is obtainable with the adoption of a simple Shepherd model [24], including some modifications, but with a more sophisticate extraction of model parameters from the results of experimental characterisation. In the following investigation, a brief review of factors affecting battery models and a description of the utilised model are reported.

2.1. Factors Affecting Battery Models

A rechargeable battery is composed of one or more electrochemical cells that convert stored chemical energy into electrical energy during a discharge process or convert electrical energy into chemical energy during a charge process [8,9]. The chemical reactions associated with the energy conversion take place at the two electrodes. The current in the battery arises from the transfer of electrons from one electrode to the other. When there is no current flow through a cell, the difference between the potentials of the positive and negative electrodes produces an Open-Circuit Voltage (OCV, E0) of the cell. When the current flows, however, mass transport is required to bring the reacting substances to the electrode surface or carry them away. As a result, the voltage under current flow is different from the OCV and the difference comprises: (i) an overvoltage at the electrodes caused by electrochemical reactions and concentration deviations on account of transport phenomena and (ii) ohmic voltage drops caused by the electronic as well as the ionic current flows in the conducting parts including the electrolyte, current-collectors and active masses [8,9]. Other important factors affecting battery performance and models include: battery capacity (Q), state-of-charge (SoC), state-of-health (SoH), rate of charge and discharge, temperature, and age [24].
The battery capacity represents the maximum amount of energy that can be extracted from the battery under certain conditions and is determined by the mass of active material contained in the battery. The SoC is defined as the fraction of the full capacity that is available for further discharge. The OCV of a battery is normally a function of the SoC due to the polarization impact, which is a factor that must be considered in battery modeling. The charging/discharging rates affect the rated battery capacity. According to Peukert’s equation, if the battery is being discharged very quickly, then the amount of energy that can be extracted from the battery is reduced [8,9,24]. The age and history of a battery also have impacts on the capacity of a battery. According to [44], SoC and SoH could be estimated from temperature and impedance measurements.

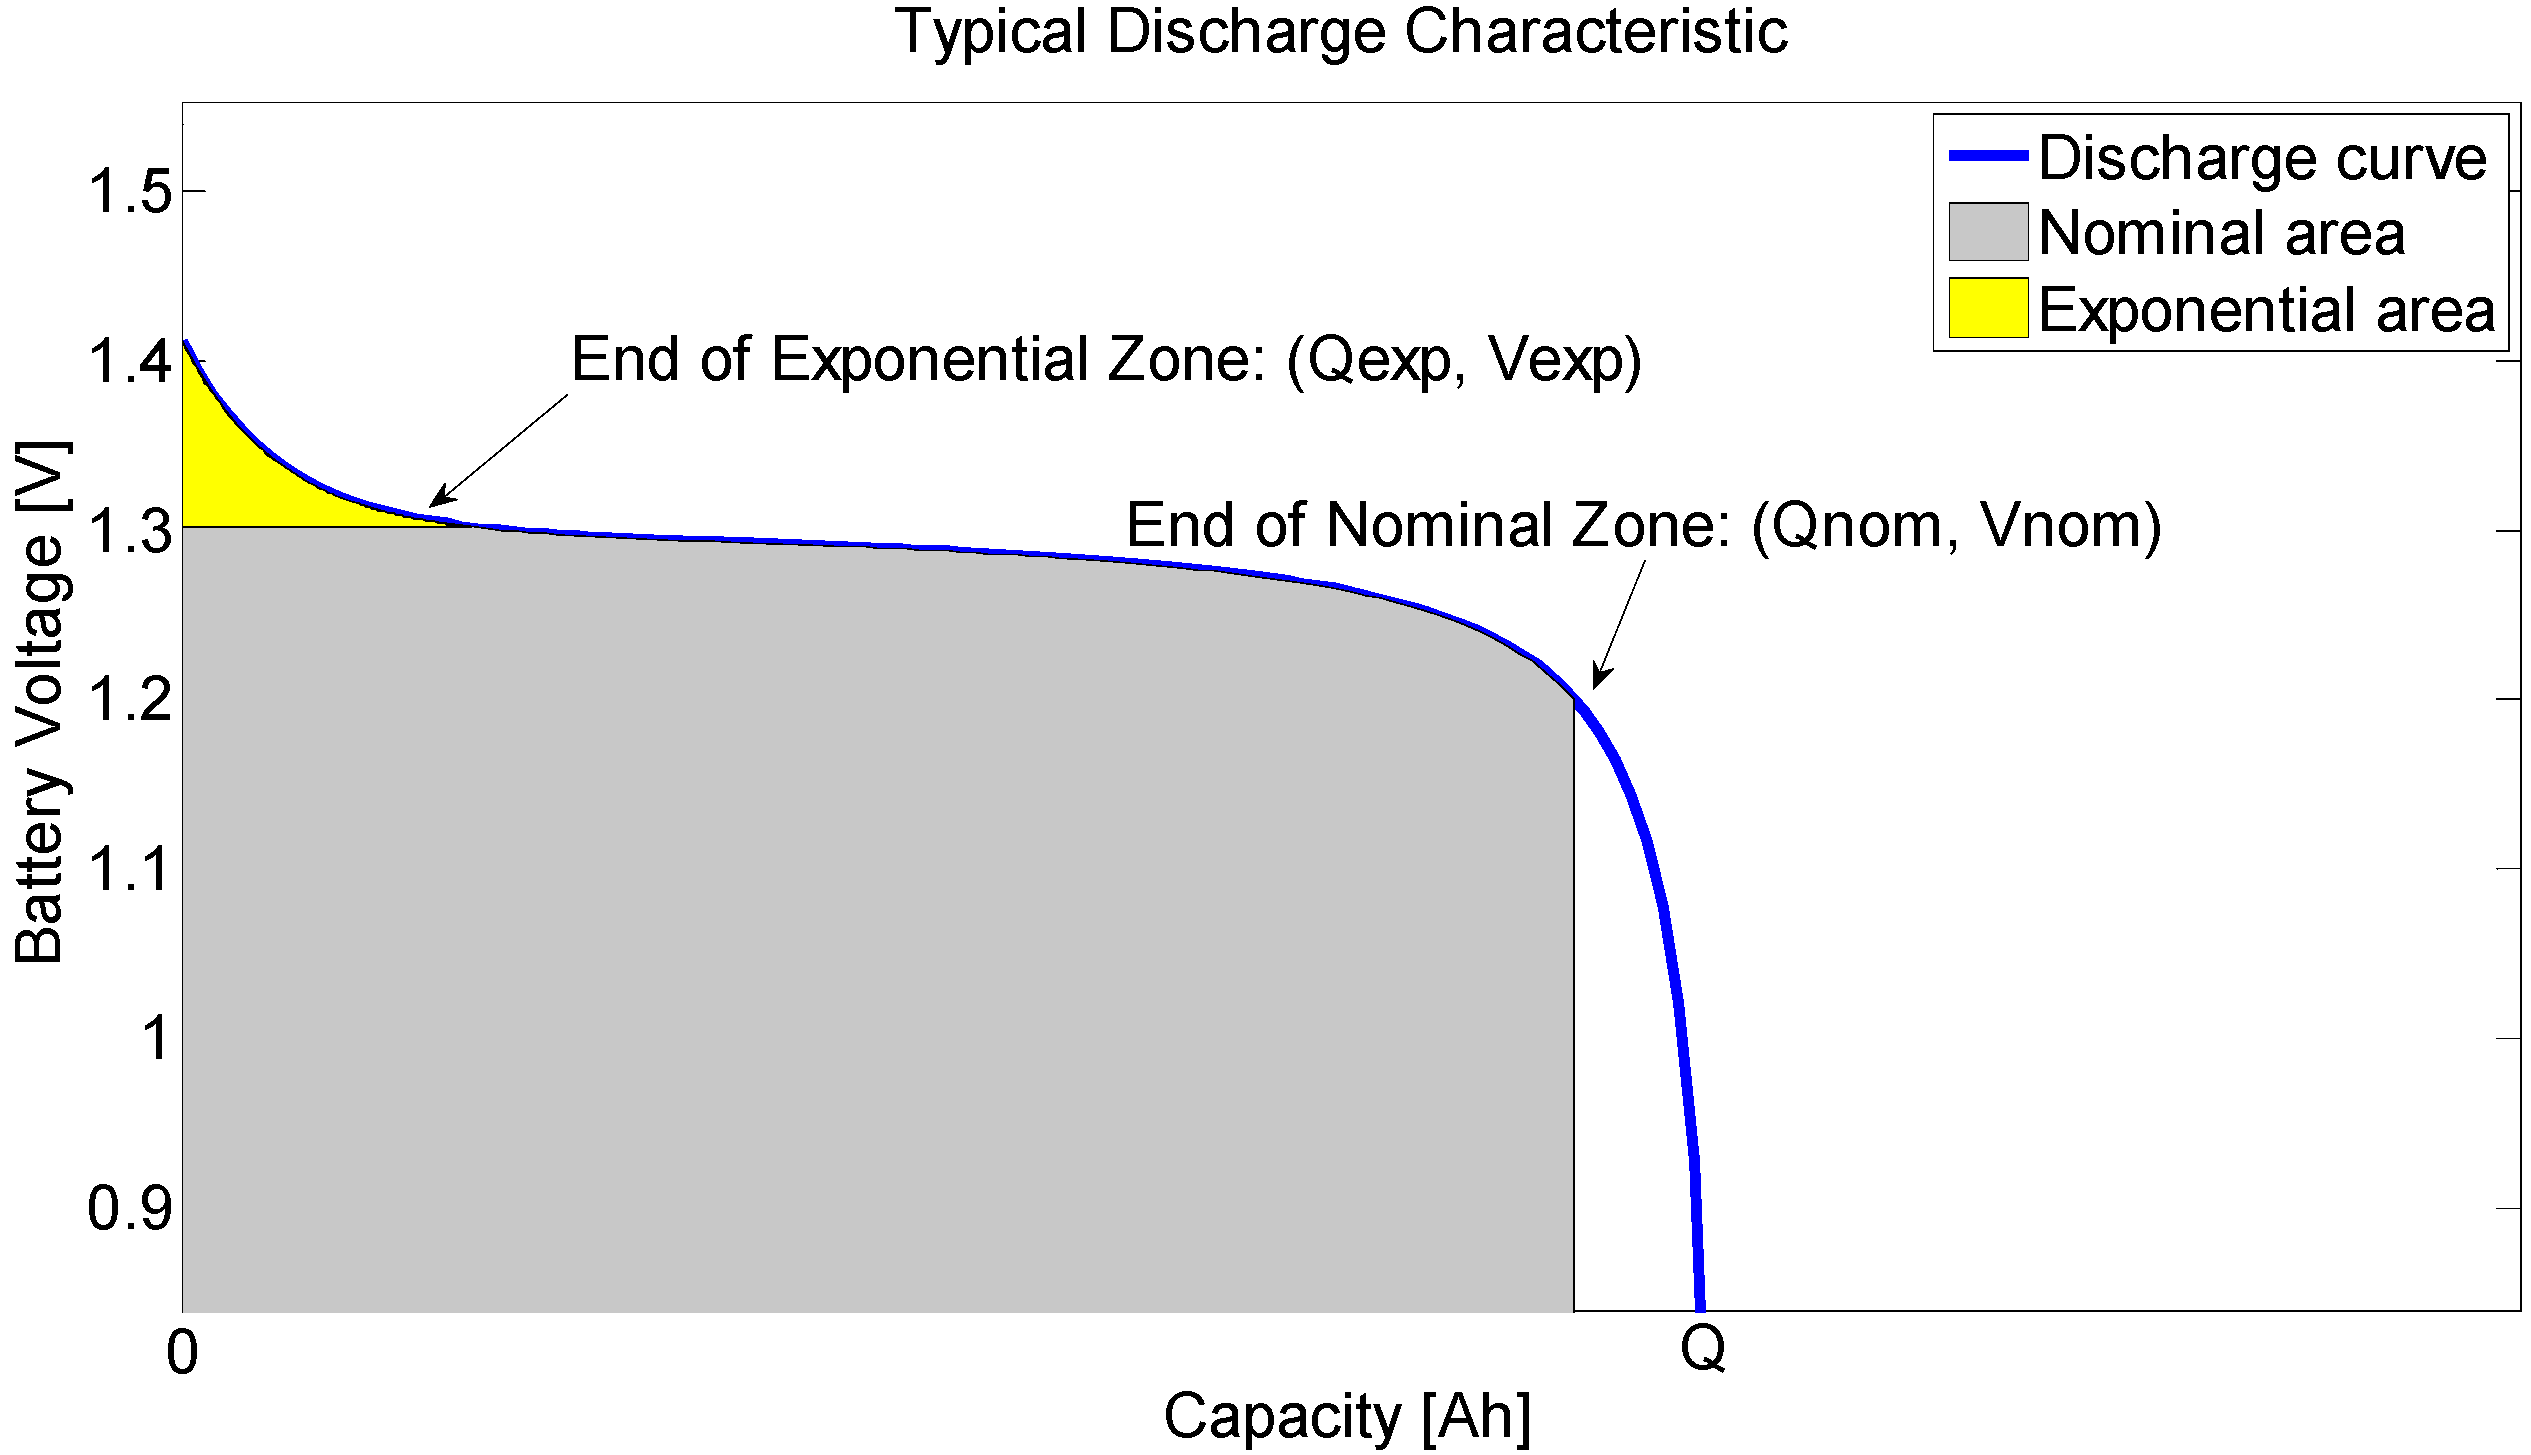
2.2. The Discharge Model

The Figure 1 shows a typical discharge characteristic, for a Nickel-Metal-Hydride cell.
Figure 1. Typical discharge curve.
Energies 06 04572 g001
The adopted discharge model is similar to the Shepherd model but some terms are added. In fact, the adopted mathematical model for battery voltage is expressed in Equation (1), where all the quantities are explained in Table 1.
V d i s = E 0 K Q Q i t · i t R · i + A · exp ( B · i t ) K Q Q i t · i *
Table 1. Explanation of the quantities of Equation (1).
QuantityDescription
V d i s Battery voltage during discharge process [V]
E 0 Battery constant voltage [V]
K Polarization constant [V/Ah] or Polarization resistance [Ω]
Q Battery capacity [Ah]
i t = i d t Actual battery charge [Ah]
A Exponential zone amplitude [V]
i * Filtered current [A]
B Exponential zone time constant inverse [Ah]−1
R Internal resistance [Ω]
i Battery current [A]
The term K Q Q i t · i t is the polarization voltage expressed in such way as to better represent the OCV behavior; A · e x p ( B · i t ) is an exponential term added to represent more accurately the voltage dynamics when the current varies and to take into account the OCV as a function of SoC; R p o l = K Q Q i t represent an additional polarization resistance that with the adoption of a filtered current i * is able to reproduce an experimentally found voltage slow dynamic behavior for a current step response.
The term which represents the exponential zone voltage in Equation (1) is valid for the Li-Ion battery. For the other batteries (Lead-Acid, NiMH and NiCD), there is a hysteresis phenomenon between the charge and the discharge, regardless of the SoC of the battery [41]. This behavior occurs only in the exponential area, as shown in Figure 2 for a typical Lead-Acid battery. This phenomenon can be represented by a non-linear dynamic system:
V e x p ( t ) ˙ = B · | i ( t ) | · [ V e x p ( t ) + A · s i g n ( i ) ]
where V e x p ( t ) is the exponential zone voltage and sign ( i ) select the part of the equation used for the charging ( sign ( i ) = 1 ) or discharging ( sign ( i ) = 0 ) stage. The exponential voltage depends on its initial value V e x p ( t 0 ) .
Figure 2. Hysteresis in exponential zone for a Lead-Acid battery.
Energies 06 04572 g002

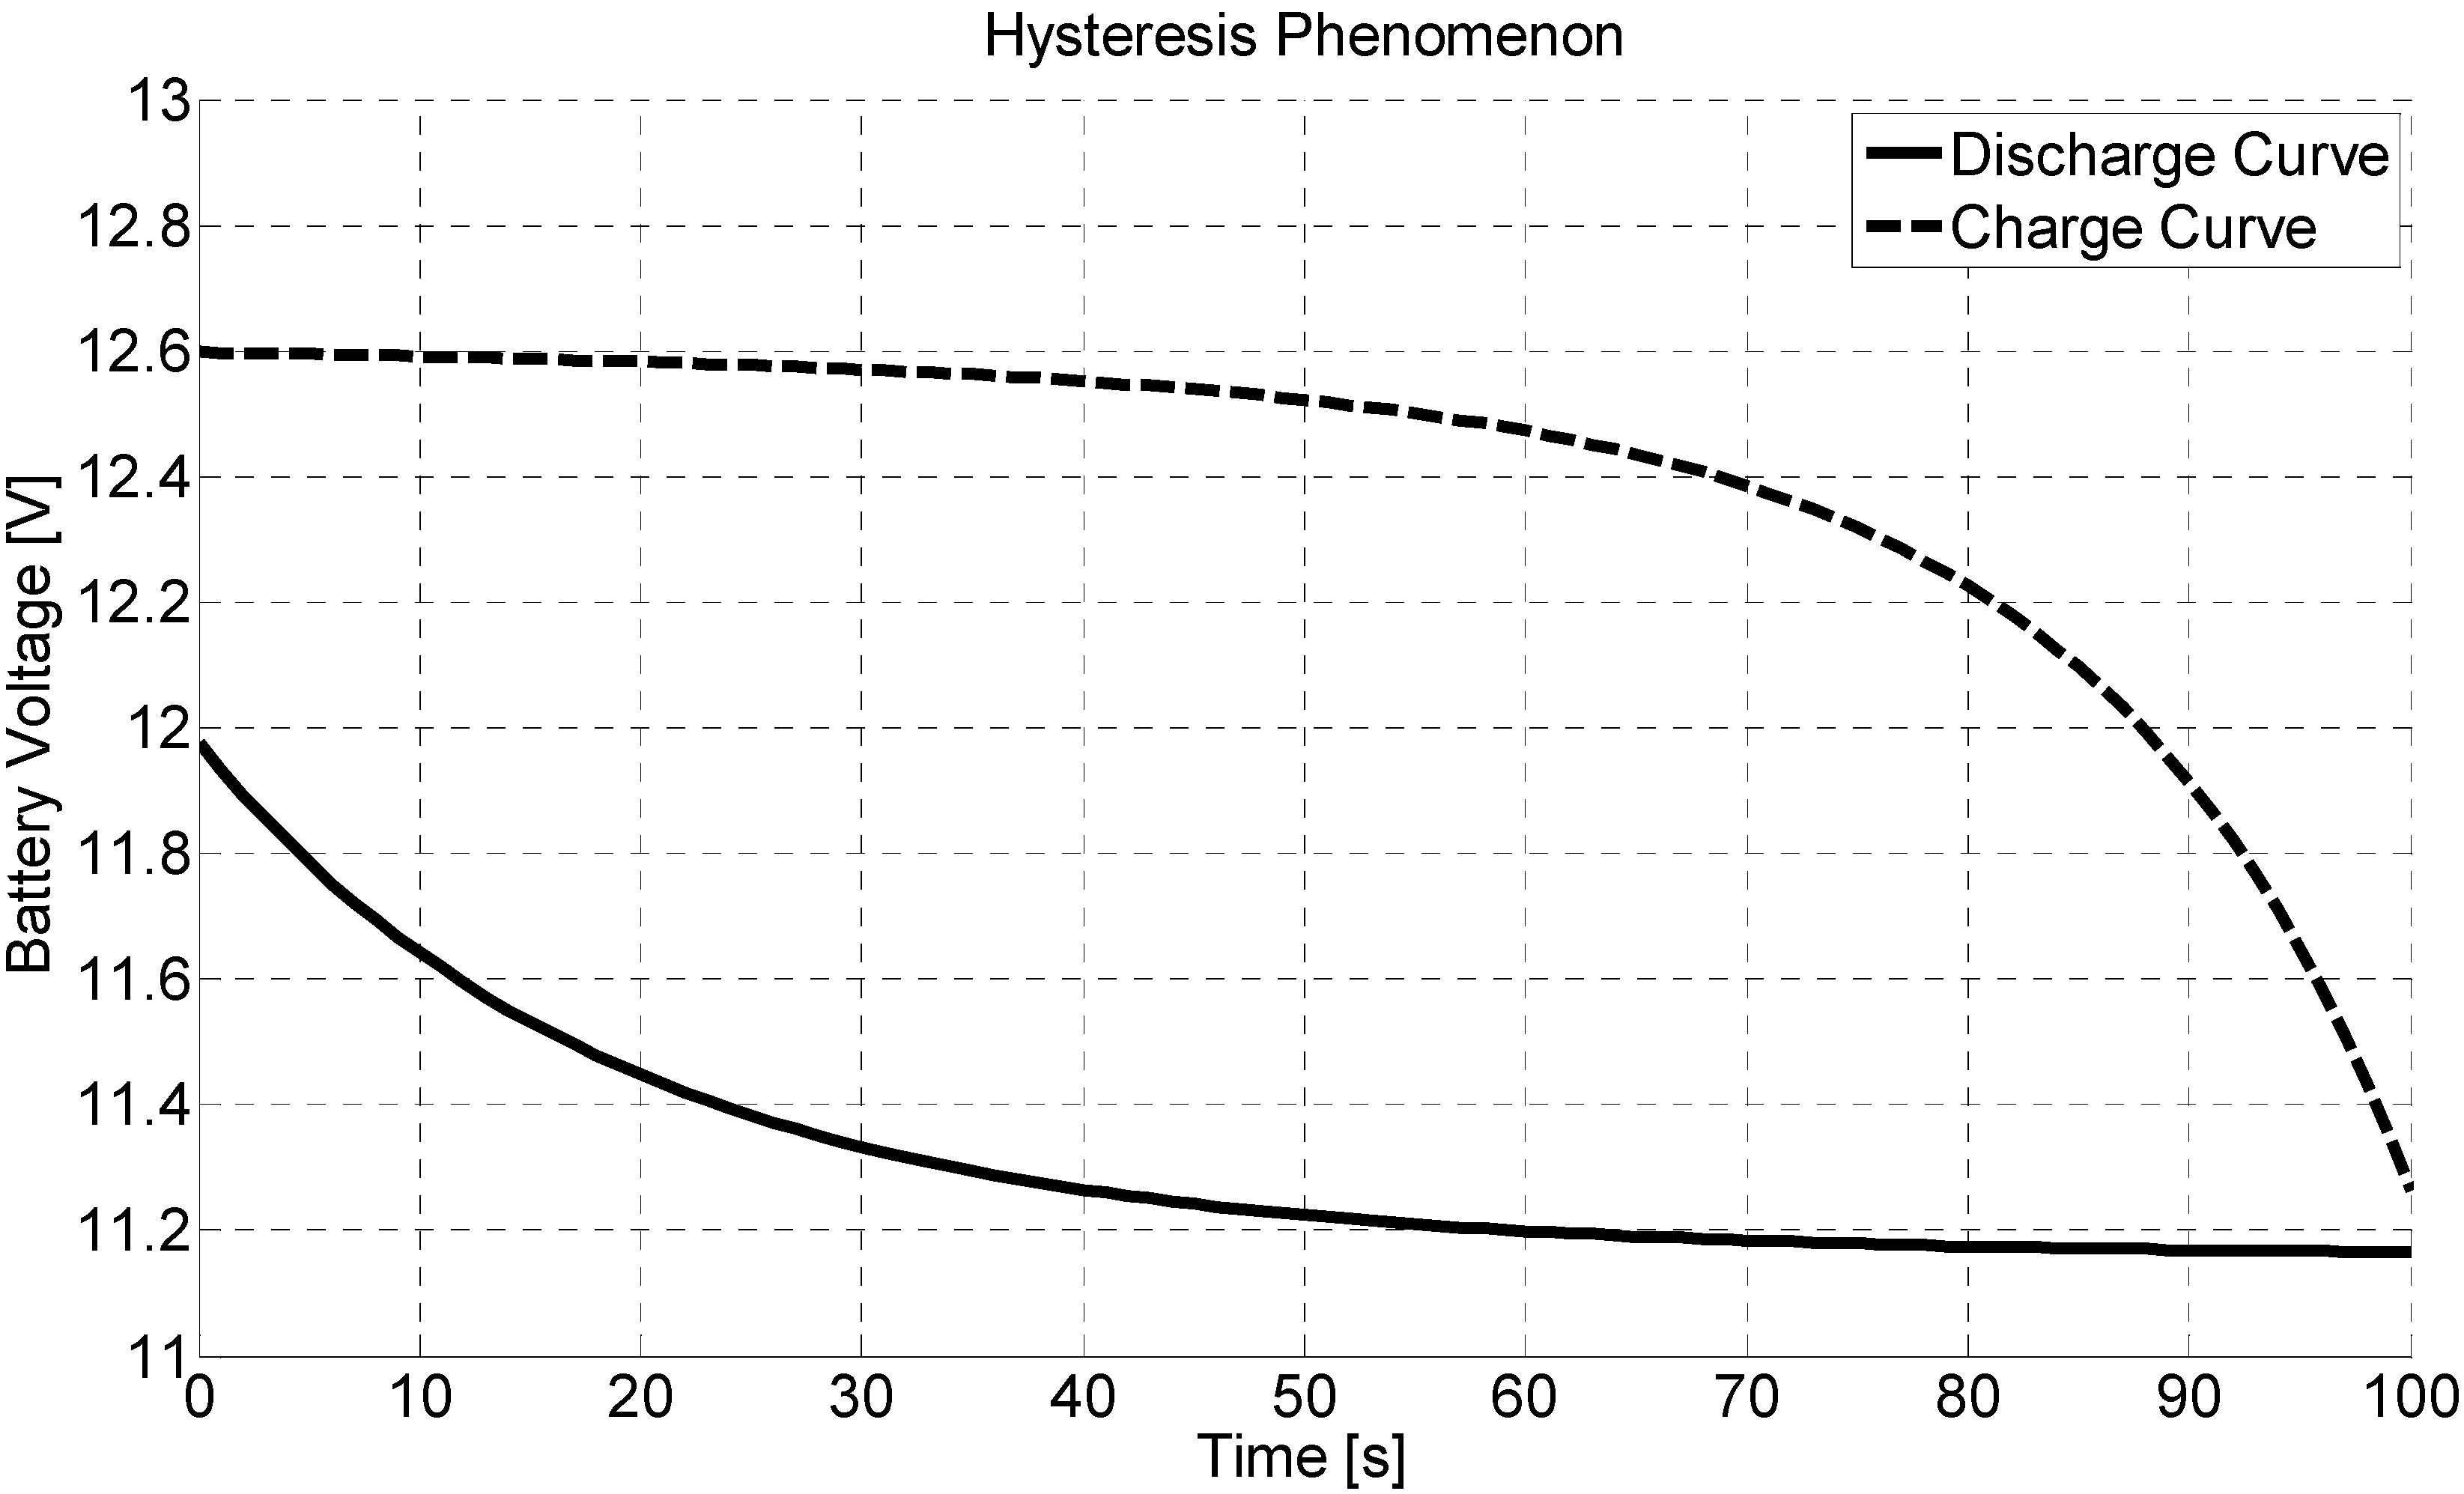
2.3. The Charge Model

The charge behavior, particularly the End of Charge (EoC) characteristic, is different and depends on the battery type. The Lead-Acid and Li-Ion batteries have the same EoC characteristics, because the voltage increases rapidly when the battery reaches the full charge. This phenomenon is modeled on the polarization resistance term. In the charge mode, the polarization resistance increases until the battery is almost fully charged ( it = 0 ). Above this point, the polarization resistance increases abruptly. Instead of the additional polarization resistance of the discharge model (4), the polarization resistance is now indicated by:
R p o l = K Q i t
Theoretically, when it = 0 (fully charged), the polarization resistance is infinite. This is not exactly the case in practice. Indeed, experimental results have shown that the contribution of the polarization resistance is shifted by about 10% of the capacity of the battery. Equation (6) can be rewritten as:
R p o l = K Q i t 0.1 · Q
Like the discharge model, the exponential voltage for the Li-Ion battery is the A · exp ( B · it ) term and for the Lead-Acid battery, the voltage is given by Equation (5). The NiMH and NiCd batteries have a particular behavior at End-of-Charge (EoC). Indeed, after the battery has reached the full charge voltage, the voltage decreases slowly, depending on the current amplitude. This phenomenon is very important to model because a battery charger monitors the V value to stop the charge.
This behavior is represented by modifying the charge polarization resistance. When the battery is fully charged ( i t = 0 ), the voltage starts to drop. The charger continues to overcharge the battery ( i t < 0 ) and the voltage decreases. This phenomenon can be represented by decreasing the polarization resistance when the battery is overcharged by using the absolute value of the charge ( i t ):
R p o l = K Q | i t | 0.1 · Q
Similarly to the discharge model, the exponential voltage for these batteries is given by (5). Finally, the equations for the four types of batteries are reported in Table 1:
Table 1. Charge and discharge equations for the four types of batteries.
Lead-Acid Discharge V b a t t = E 0 R · i K Q Q i t · ( i t + i * ) + V e x p ( t )
Charge V b a t t = E 0 R · i K Q i t 0.1 · Q · i * K Q Q i t · i t + V e x p ( t )
Li-Ion Discharge V b a t t = E 0 R · i K Q Q i t · ( i t + i * ) + V e x p ( t )
Charge V b a t t = E 0 R · i K Q i t 0.1 · Q · i * K Q Q i t · i t + A · e x p ( B · i t )
NiMH and NiCd Discharge V b a t t = E 0 R · i K Q Q i t · ( i t + i * ) + V e x p ( t )
Charge V b a t t = E 0 R · i K Q | i t | 0.1 · Q · i * K Q Q i t · i t + V e x p ( t )

3. Model Parameter Identification

The method for identifying the model parameters of the battery proposed in [23,24] is based on the evaluation of the “Typical Discharge Characteristics” on the manufacturer datasheet of the battery and does not require experimental tests on the battery. It has been experimentally verified that such an approach, being simple and fast, is also of poor accuracy and can lead to significant deviations in battery behavior estimation, especially in dynamic conditions. In fact, the “Typical Discharge Characteristics” on the manufacturer datasheet of the battery are, in most cases, not characteristics of the specific battery but, at most, average values deducted for entire batteries stock. For this reason they can lead to a forecasting of battery behavior which is very different from the actual response. Moreover, some typical quantities of the battery, and thus some parameters of its model vary with battery life usage and conditions: a discharge curve experimentally taken at the beginning of the battery life could not represent the actual discharge curve of a battery with a certain number of charge-discharge cycles. A continuous estimation and updating of the parameters is necessary to obtain reliable results over time.
As it was previously said, in this paper the proposed approach to the identification of battery model parameters is based on the experimental evaluation of the discharge curve of the battery and on an optimisation procedure for the parameter assessment. The presented results in the following explanation refer to discharge at the nominal current (typically equal to 20% of the battery capacity) but the methods can also be extended to different currents with minor changes. The research procedure of model parameters is based on the minimization of a fitness function through the use of a hybrid optimisation technique (i.e., the combined use of a stochastic and a deterministic algorithm). The fitness function is a scalar function of the battery model parameters whose value carries out the deviation of the model from the experimental data. In the following subsections the automated measurement station for battery characterisation and the optimisation procedure are described.

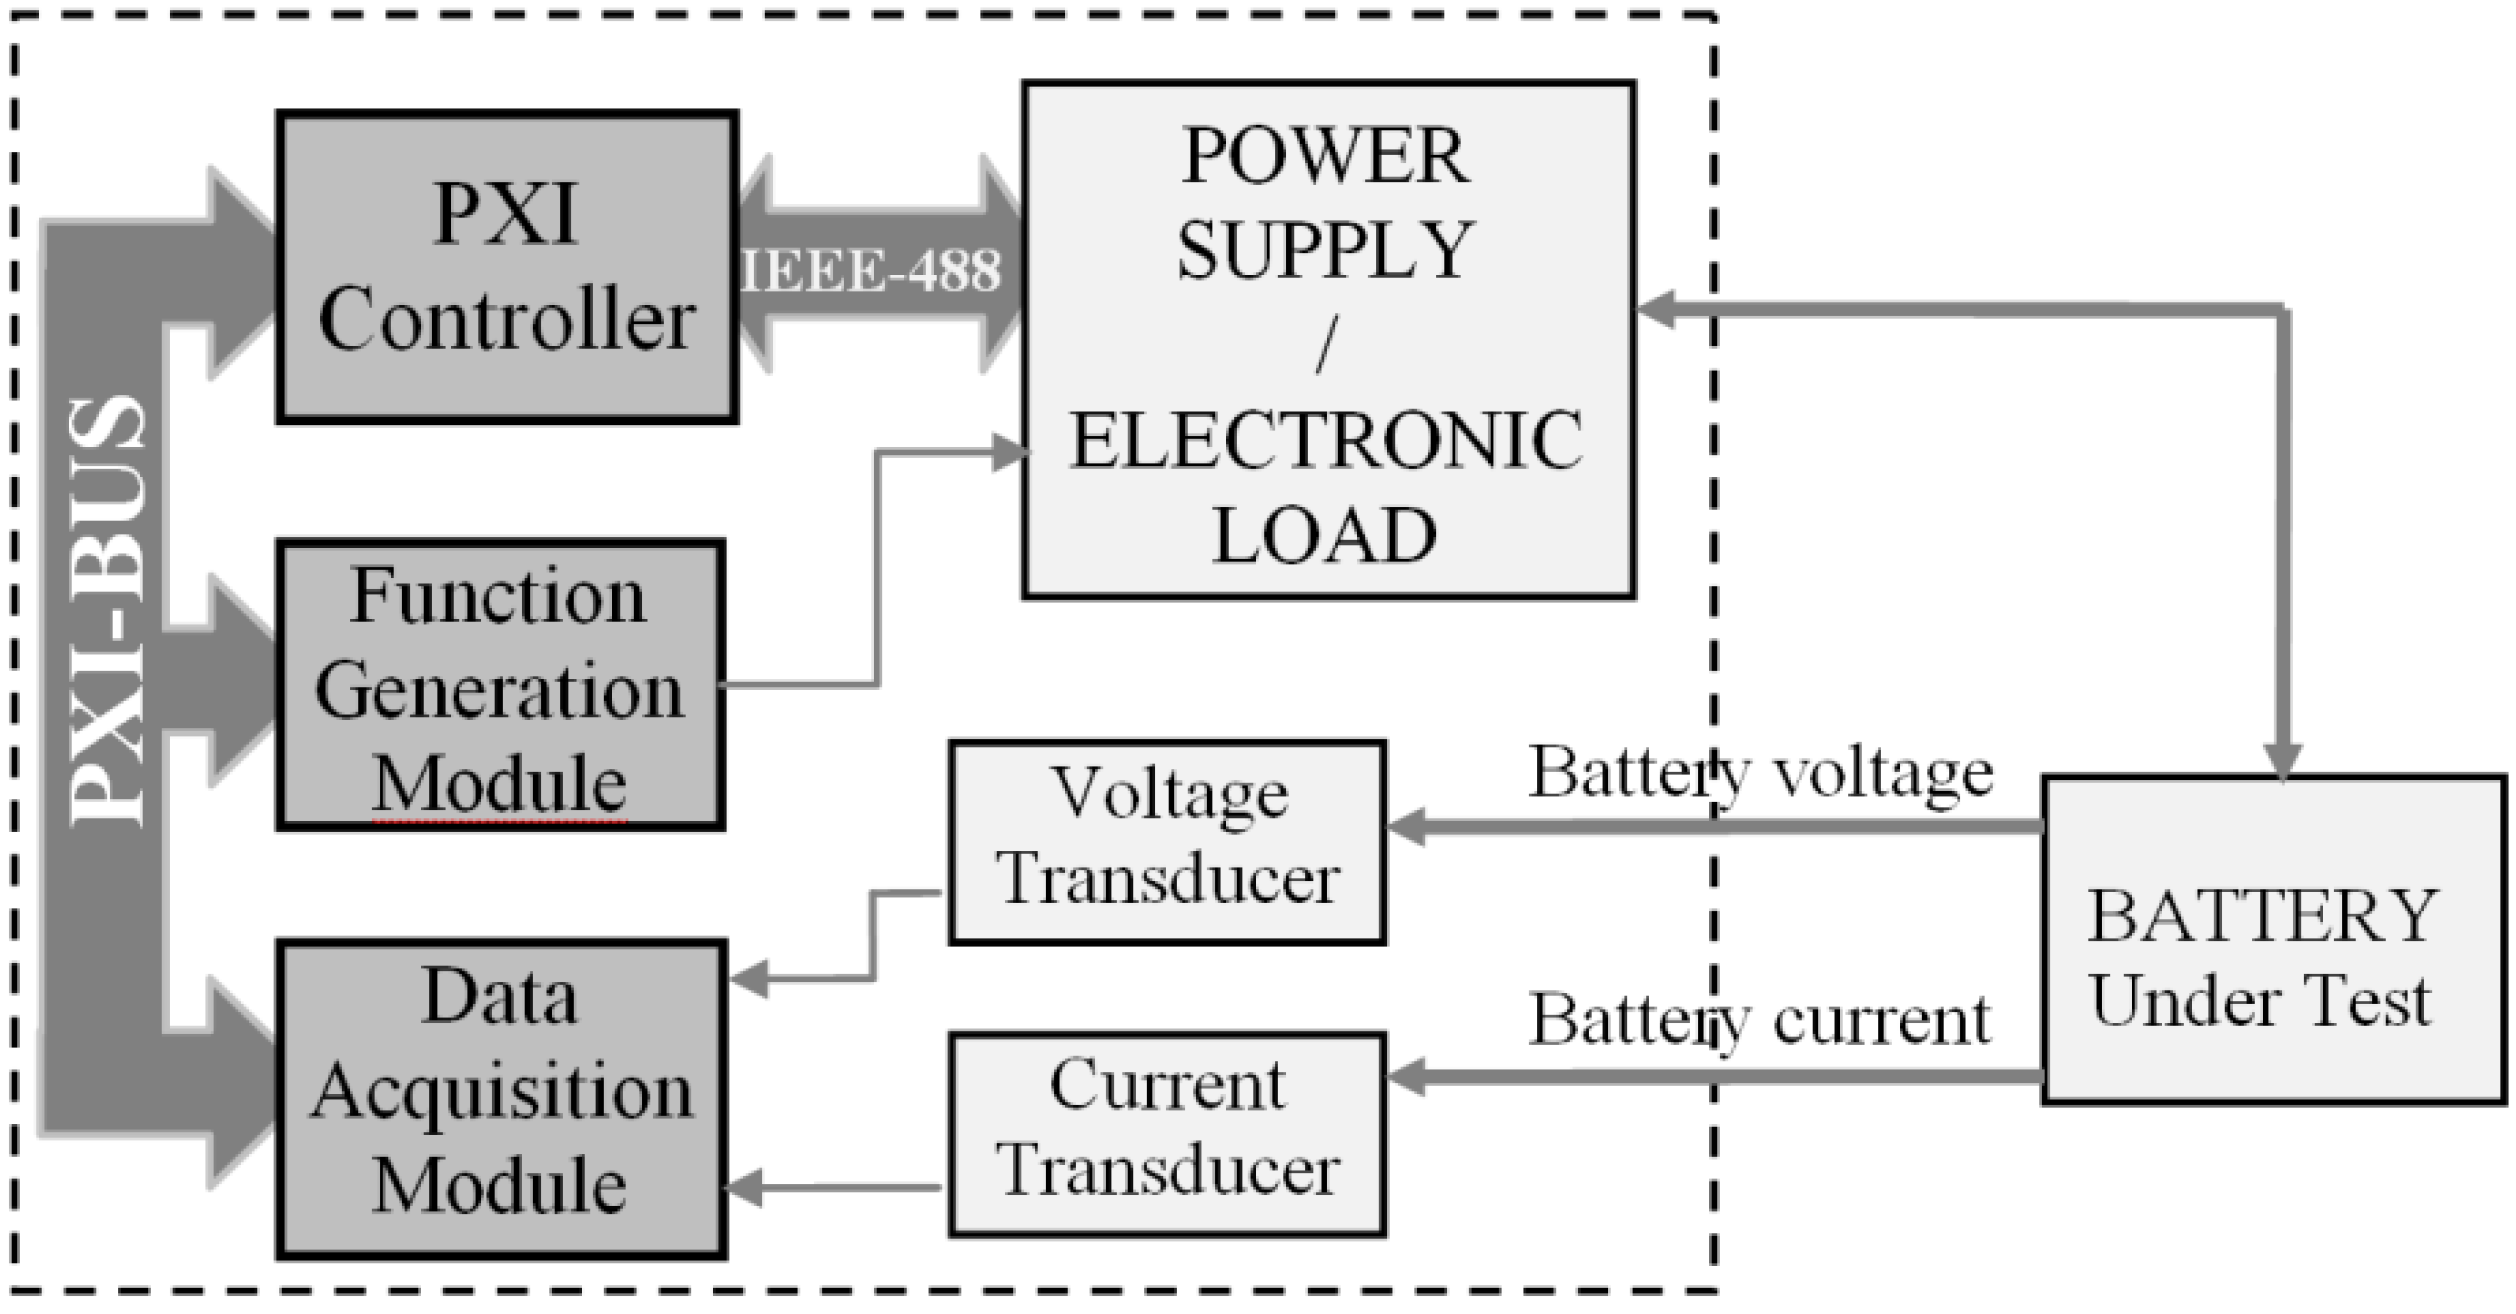
3.1. Automated Measurement Station

In order to characterize the battery and record experimental data for model parameter identification and model validation, an Automated Measurement Station (AMS) has been set up. It is based on a four quadrant power supply, numerically controlled through IEEE 488 bus, and a PXI platform. Its block scheme is shown in Figure 3. It includes a module for data acquisition and one module for waveform generation. The data acquisition module has eight synchronous analog inputs and ±10 V input range, 16 bits resolution and 500 kHz maximum sampling rate per channel. The generation module has one analog output at 16 bits, ±12 V output range, 100 MHz maximum generation frequency and a memory of 256 MB. Through the generation module, the desired waveforms are generated and then amplified. The utilised power supply is the Kepco BOP 20–20 M, with output ranges of ±20 Vpeak for voltage and ±20 Apeak for current; the frequency bandwidth is in the range of DC-50 kHz.
Figure 3. Block scheme of the realized Automated Measurement Station.
Energies 06 04572 g003
It can operate in the four quadrants of the Voltage/Current plane and can therefore be used as a supply as well as an electronic load, i.e., to charge and to discharge the battery. Moreover, thanks to its wide output frequency range, it can be used both in static as well as dynamic charge/discharge conditions. As a voltage transducer, a resistive voltage divider has been used, while as current transducer a current shunt (Lem Norma Triax Shunt) with an input range of ±30 ARMS and a resistance of 10 mΩ has been used. Measurement software has been developed in LabView, a graphical programming environment, measuring instruments oriented and distributed by National Instruments.

3.2. Optimization Procedure

A standard optimisation problem requires the definition of a scalar function, named fitness function or objective function: it must be applicable to every possible solution for the problem as it represents the validity of that solution. So a fitness function F may be defined as:
F : x X F ( x ) ϵ R
where X is the space of the solutions; x a possible solution in X and R is the set of real numbers. The best solution is an x ^ such that:
F ( x ^ ) = o p t   F ( x )
where o p t   F ( x ) can be the minimum or maximum of the function F, depending on the actual situation.
For the case at hand the fitness function has been defined as follows:
F ( x ) = 1 N k = 1 N [ V M e a s ( k ) V M o d ( k ) ] 2 + ( V f u l l E 0 + R · i A )
V M o d ( k ) = E 0 R · i + K Q Q i · k T c [ i · k T c + i * ( k T c ) ] + V e x p ( k T c )
i * ( k T c ) = i · ( 1 e k T c τ )
x = ( E 0 ,   R ,   K , τ , B , A )
where V M o d ( k ) is the model output at time k T c ; V M e a s ( k ) is the measured battery voltage at time k T c ; T c is the sampling interval; N is the number of points; τ is the time constant of the filtered current i * ; i is the discharge current and x is the vector of the variables, i.e., the model parameters which have to be identified.
The Equation (9) comes from the discharge equation for a Lead-Acid battery reported in Table 2, where the quantities are now dependent on the discrete time variable k T c . The quantity i t , which is the integral of the current over the time, can be expressed as the product of the current i and the time k T c since experimental data obtained from a discharge process at constant current is considered.
Table 2. Values of model parameters obtained from the two procedures.
QuantitySimplified procedureProposed procedure
Q [Ah]27.4027.40
E 0 [V]12.7012.44
R [mΩ]50.0081.30
K [Ω]-[V/Ah]0.0850.016
τ [s]30.0019.31
B [s−1]15.73112.37
A [V]0.520.17
The battery capacity Q is a known parameter since it is directly obtained from experimental data. Experimental data, i.e., the battery voltage values during a discharge process, is obtained using a completely charged battery and making it discharge at a constant nominal current (typically equal to 20% of the battery capacity).
The fitness function in Equation (11) is composed of two terms: the first represents the root mean square error among measured and simulated battery discharge curves, while the second represents a condition on battery voltage which should be verified at the time t = 0 , before the current changes its value from zero to nominal value. This term can be obtained from the equation of a battery model substituting t = 0 . Considering the formulation of the fitness function in Equation (11), an optimal solution for the problem is an x ^ that minimizes it [10,11,12,13,14,15].
The choice of the best parameter values for optimal approximation of battery operation can be formulated, from the mathematical point of view, as an inverse problem [45] and solved by adopting optimisation techniques [46]. An objective function, describing the difference between desired and obtained frequency responses has to be defined and minimized by an optimisation algorithm. The choice of the chosen objective function affects at the same time the optimality of the solution as well as the computational complexity of the research.
The optimisation problem here studied has a non-linear objective function with six independent variables. Therefore, the research space should be R6, with R being the whole set of real numbers. Nevertheless, this interval can be reduced adopting some constraints on solution characteristics. The constraints divide the research space into feasible and infeasible regions with remarkable reduction of computational burden [47]. Constraints can be of two types:
  • equality and inequality constraints;
  • bounds on variable values.
A solution that does not satisfy all the constraints and all the bounds is called an infeasible solution and it is ignored. A constraint, for the case in question, must be imposed on the variables: They must be greater than zero. So a linear inequality constraint is imposed. In order to numerically study the Equation (11), a hybrid scheme based on the combination of a stochastic and deterministic approach has been adopted [48,49]. The two approaches are used in a combined way to take advantages of their complementary characteristics. In fact, the deterministic approach is the fastest way to calculate a solution but the quality of the results strongly depends on the choice of the starting point. Non-deterministic approaches do not depend on the initial choice and are usually slow in finding out optimal solutions. Starting from these considerations, an initial exploration of space of solutions is made by a genetic algorithm having a population size greater than the number of variables chosen as a target. Then, the obtained values are used as initial points to run a constrained deterministic approach based on the Sequential Quadratic Programming (SQP) [47] to find out an optimal solution. The SQP algorithm was preferred over simpler algorithms (such as zero-order methods) taking into account the information about the derivative of the objective function and, in addition, to include in direct way the above-mentioned constraints. The optimisation routine was written in a MatLab environment, using the “Global Optimisation Toolbox”. Regarding the computational burden, the proposed method requires about ten seconds to converge to optimal solutions, running on a commercial Personal Computer with standard performance, based on the Microsoft Windows operating system. Such a convergence time was obtained utilizing the following values for the main genetic algorithm parameters: (1) population size equal to four times the number of points of experimental characteristic [45,46,47,48,49], i.e., 64; (2) generation limit equal to 50; (3) fitness limit equal to zero; (4) stall generation limit equal to 20 s; (5) stall time limit equal to 1000 s; (6) tolerance on fitness function value equal to 10−9; (7) tolerance on constraint value equal to 10−15.

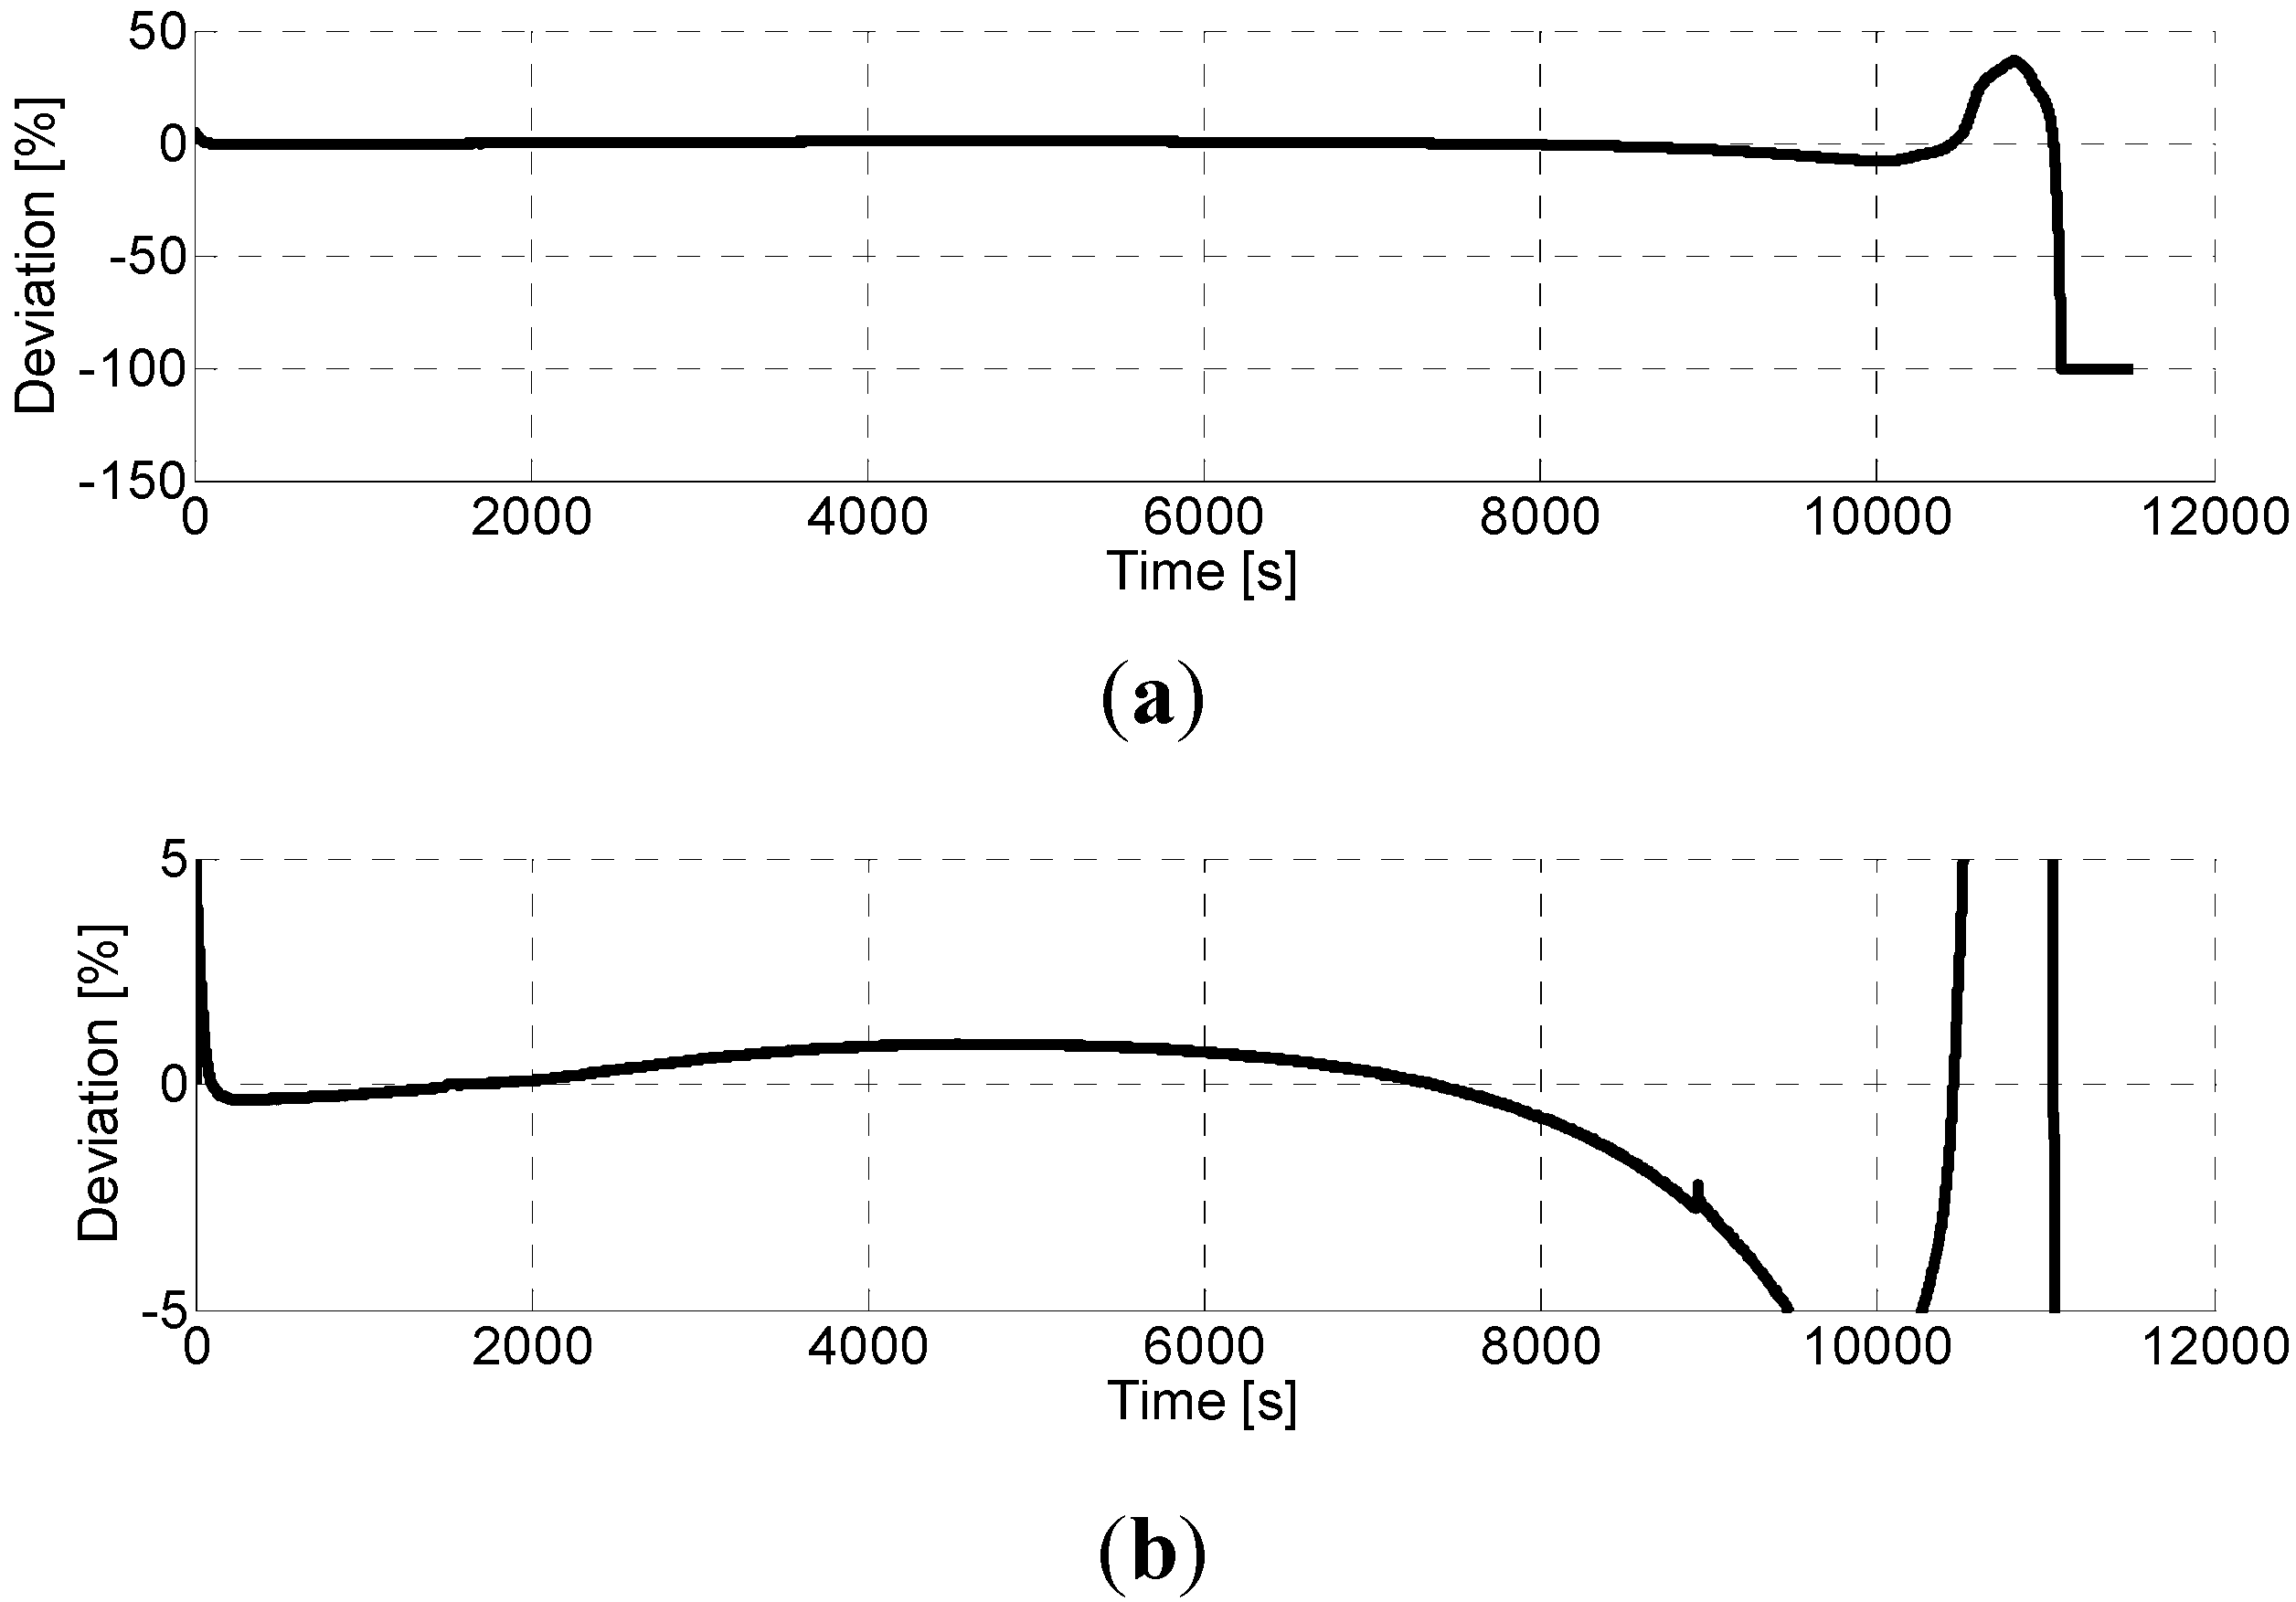
4. Experimental Results

In scientific literature, some papers propose the identification of the parameter values of the battery model based on an optimisation algorithm. In [23], a method for the parameter extraction for the runtime-based circuit-oriented battery model is presented. It is based on a strategy of minimizing the RMS error between measured and equivalent-circuit-estimated battery terminal voltages; the estimated battery voltage is considered as a function of the battery circuit parameter. The obtained results under static conditions are quite good, but no validation of the model under dynamic conditions is presented; moreover, it is said that such a method is computationally expensive. In [50], a model of the battery and a methodology for determining the parameters of a battery model using the catalog data of the batteries and Multiobjective Optimisation Genetic Algorithm is proposed. The technique is applied to different battery types. The presented experimental results refer only to static conditions. Moreover, since the method is not based on experimental data for the parameter identification, but rather on data taken from a battery datasheet, it cannot account for fabrication tolerances, the battery’s state of health, etc.
In this section results regarding experimental characterisation of a battery, identification of its model parameters and model validation in dynamic conditions are presented. They refer to a lead-acid 12 V, 44 Ah battery, but the procedure remains valid also for the other types of analyzed batteries, i.e., NiMH, Li-Ion, NiCd. Moreover, in order to prove its effectiveness, the obtained results have been compared with those obtained by simplified methods for parameter identification proposed in [23,24]. The simplified procedure is applied to the experimental discharge curve unlike what was done in [23,24] where reference was made to the discharge curve reported in the manufacturer datasheet so better results are expected. The applied simplified procedure proposed in [23,24], and here modified, consists of the following steps:
  • assigning a value for internal resistance R , evaluating it from an experimental test;
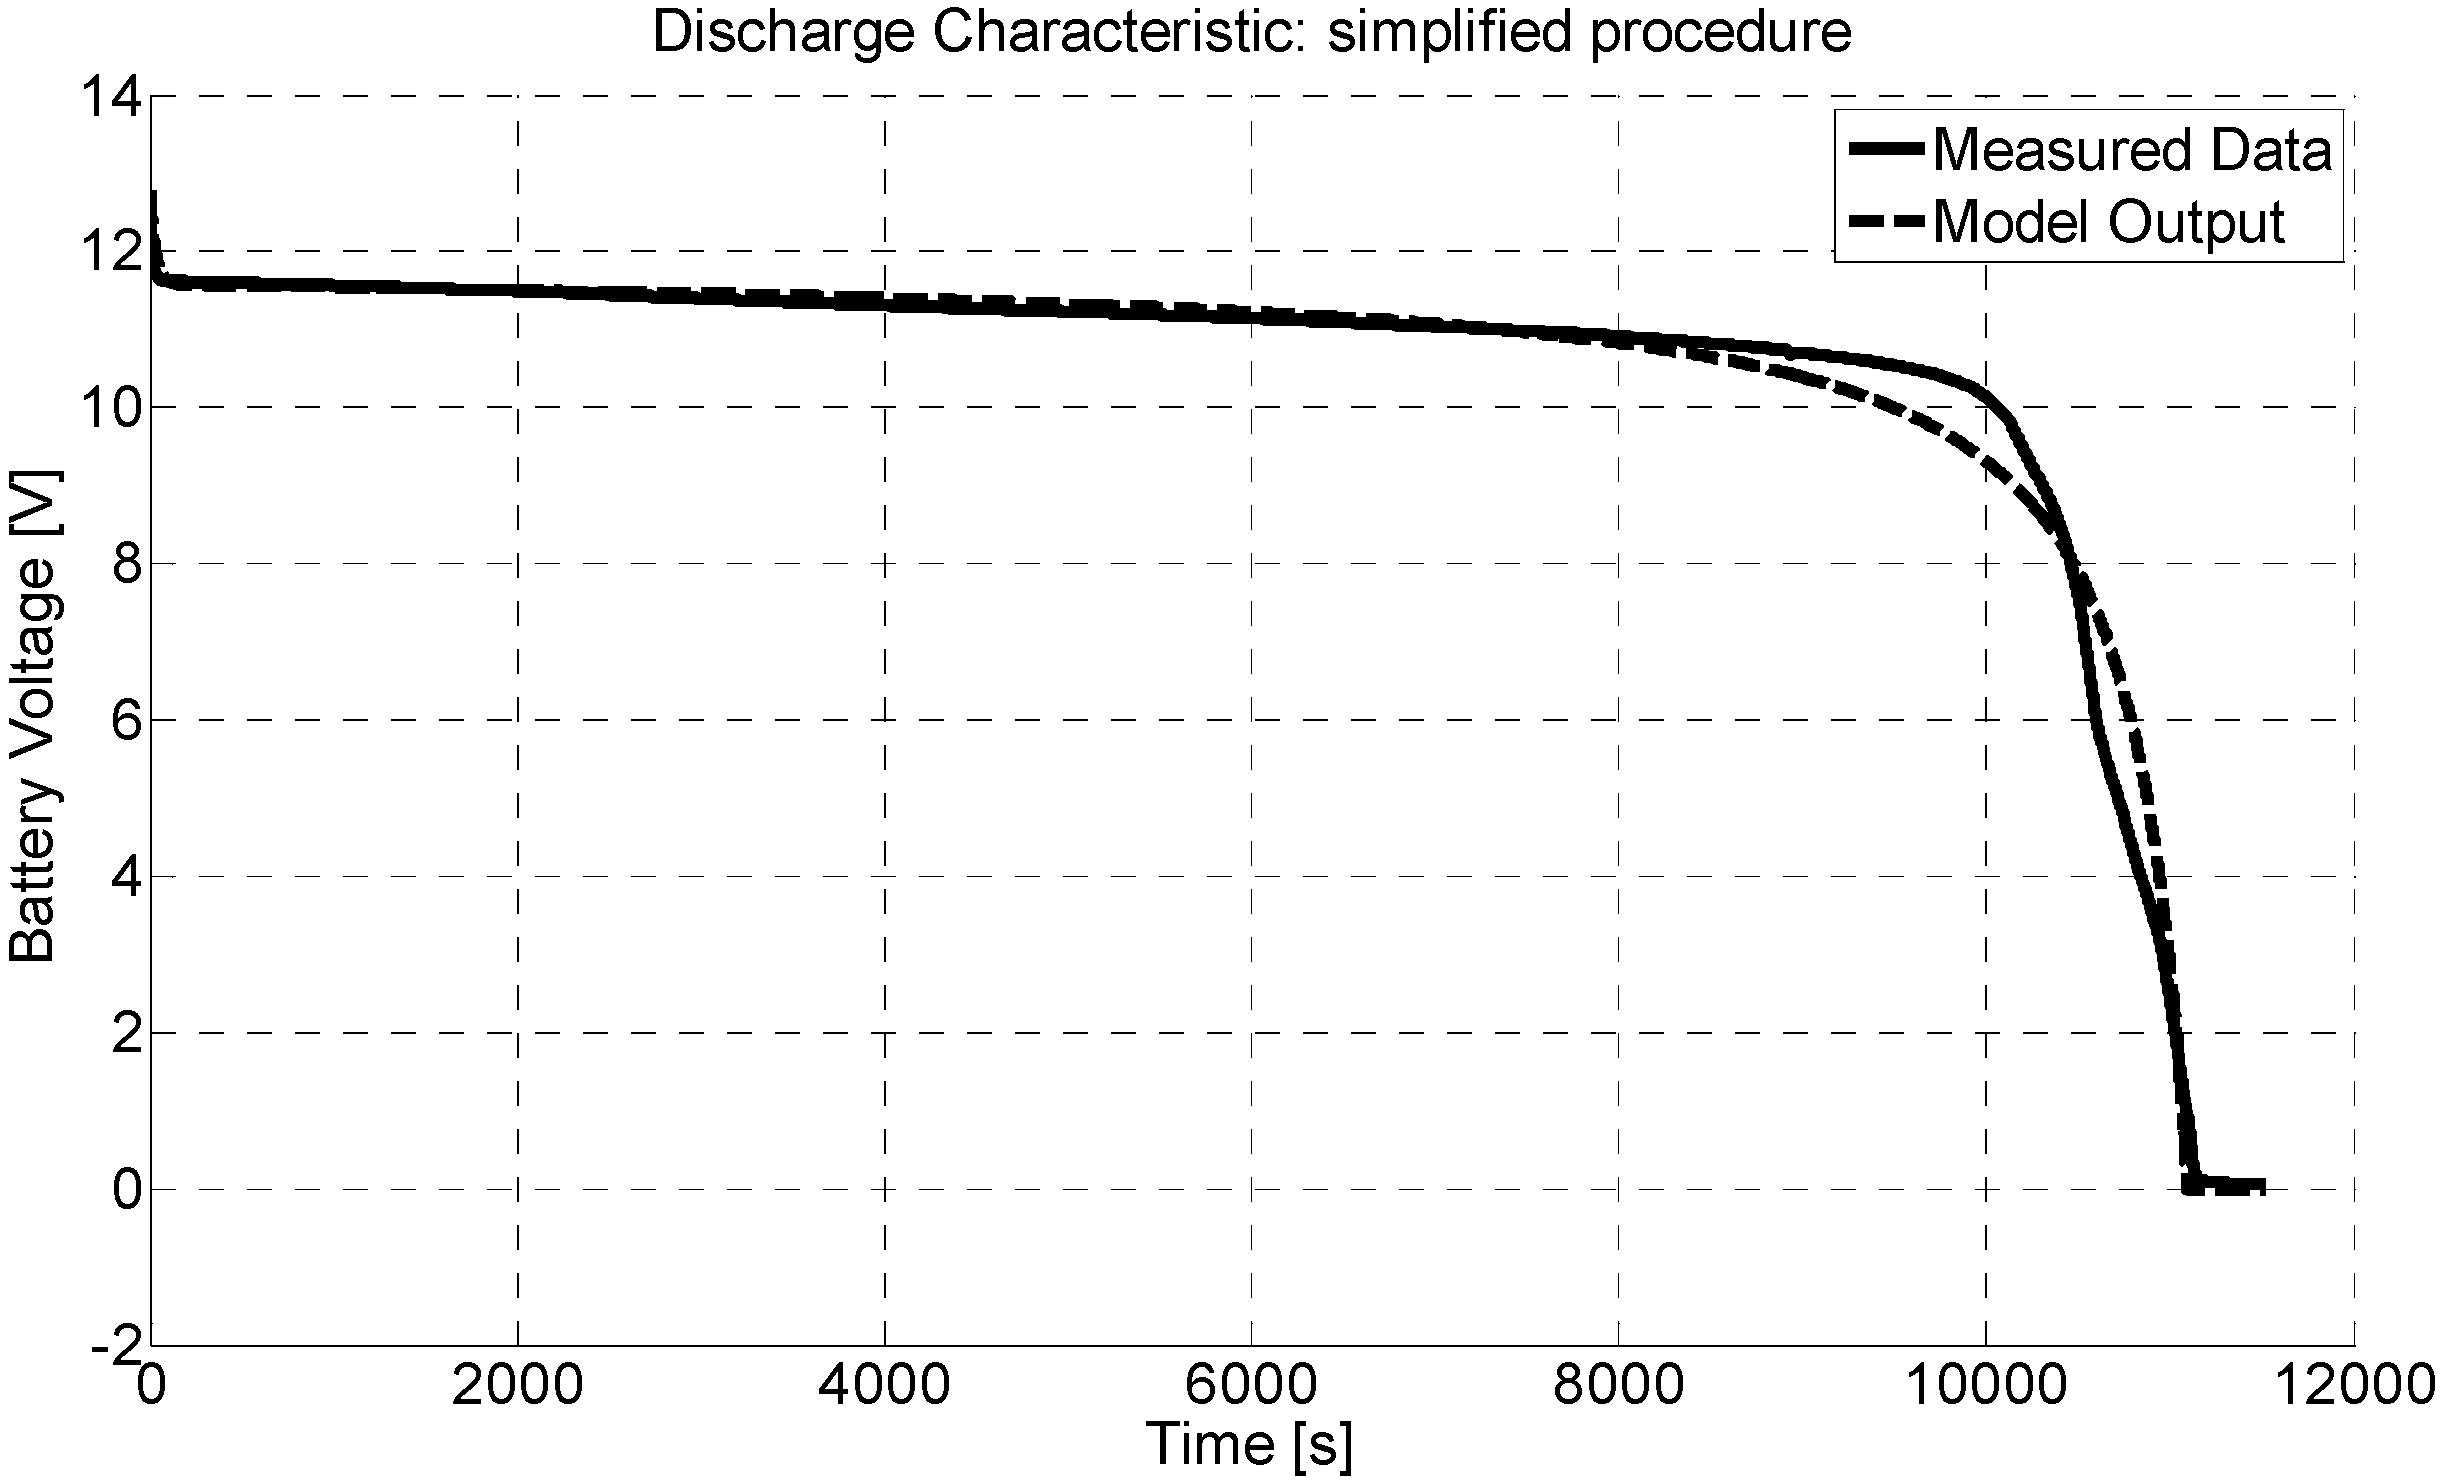
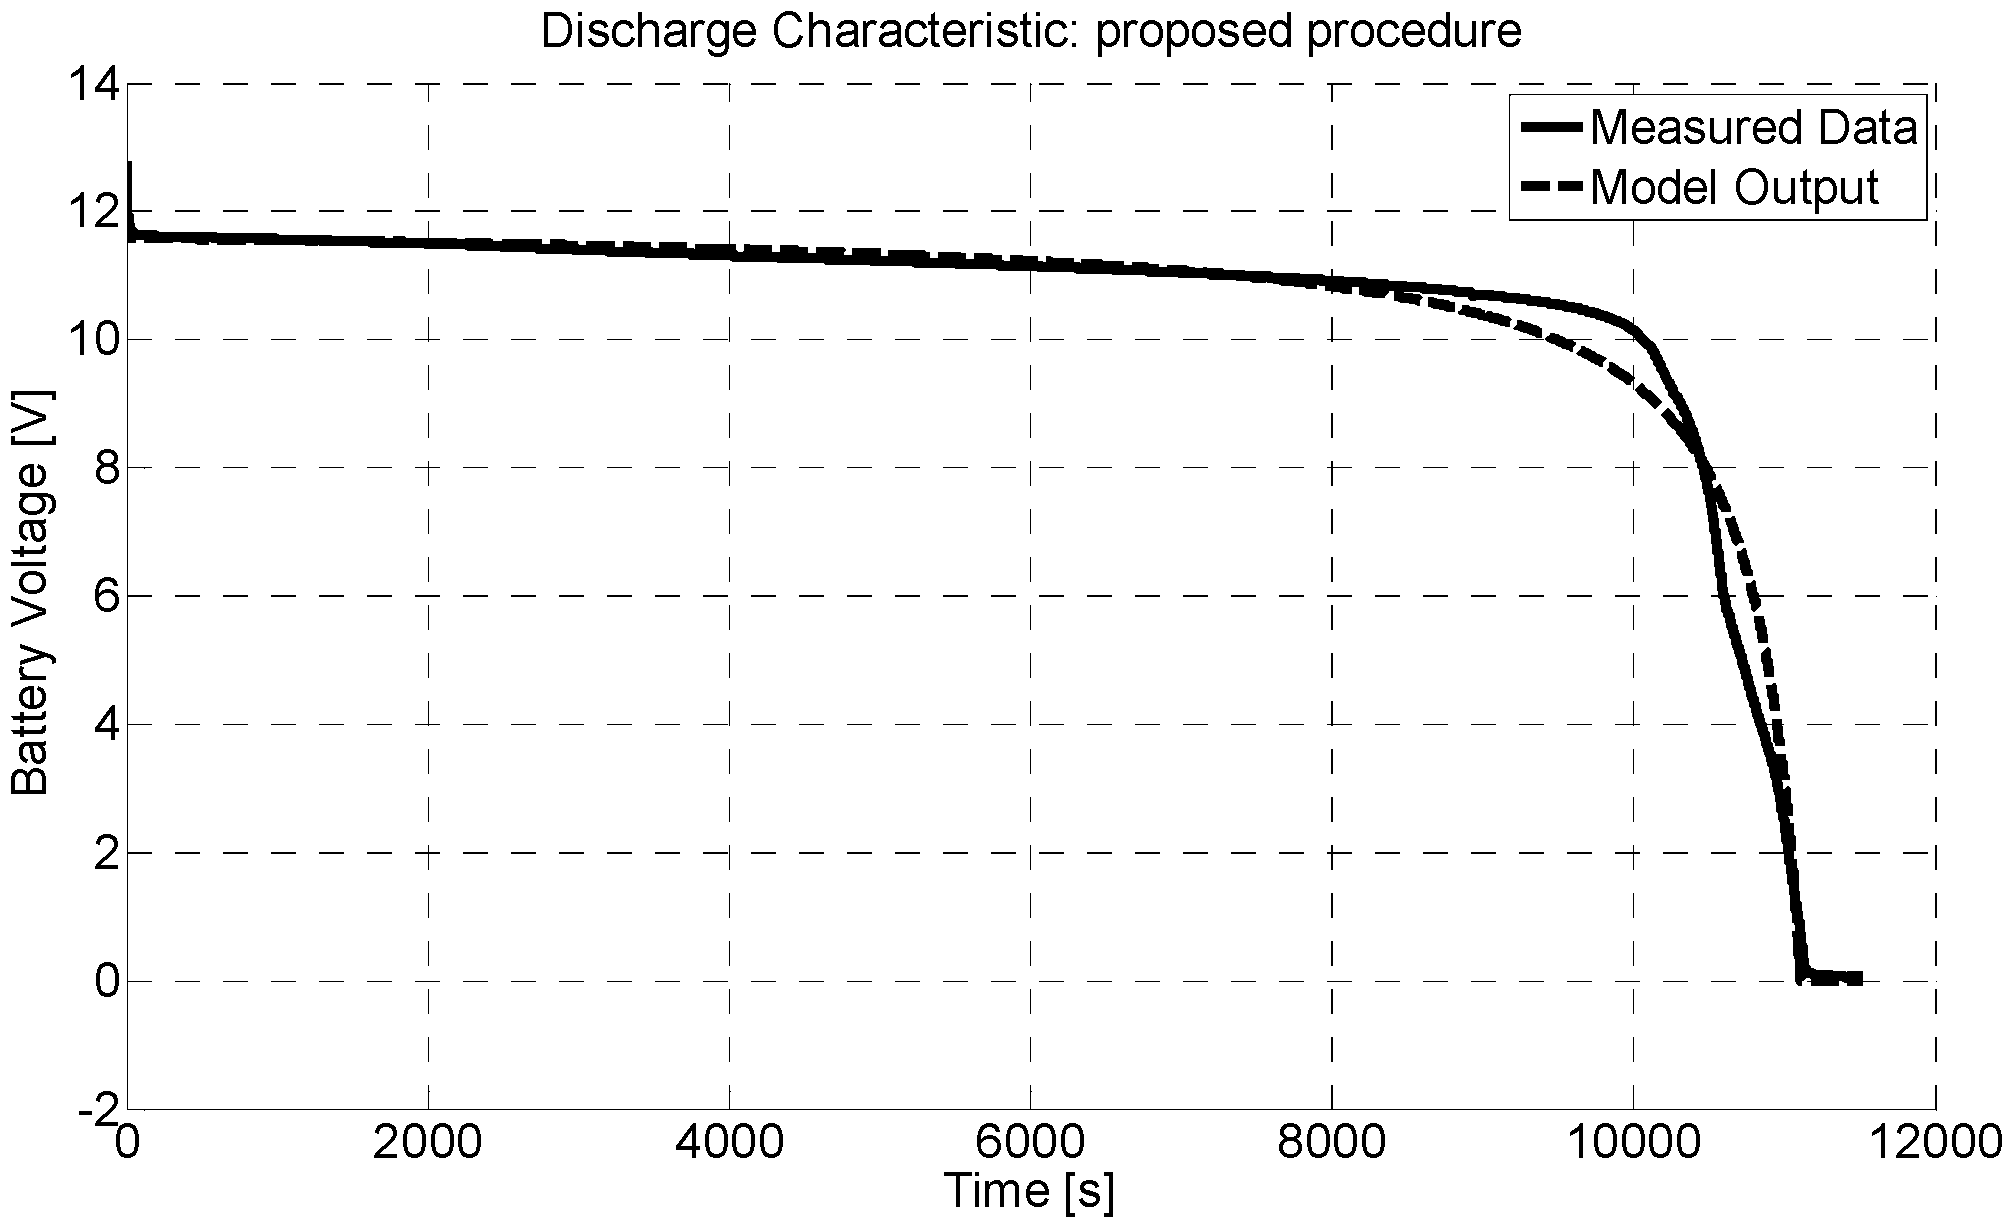
  • evaluating values for Q , V f u l l ,   V e x p , Q e x p , V n o m ,   Q n o m from experimental discharge curve (as illustrated in Figure 1) and extracting from them τ ,   B , A ;
  • calculating the values of the two remaining parameters, E 0 and K , from two other points of the experimental discharge curve in the nominal zone.
In the following two subsections the results obtained from tests in static and dynamic conditions are presented.

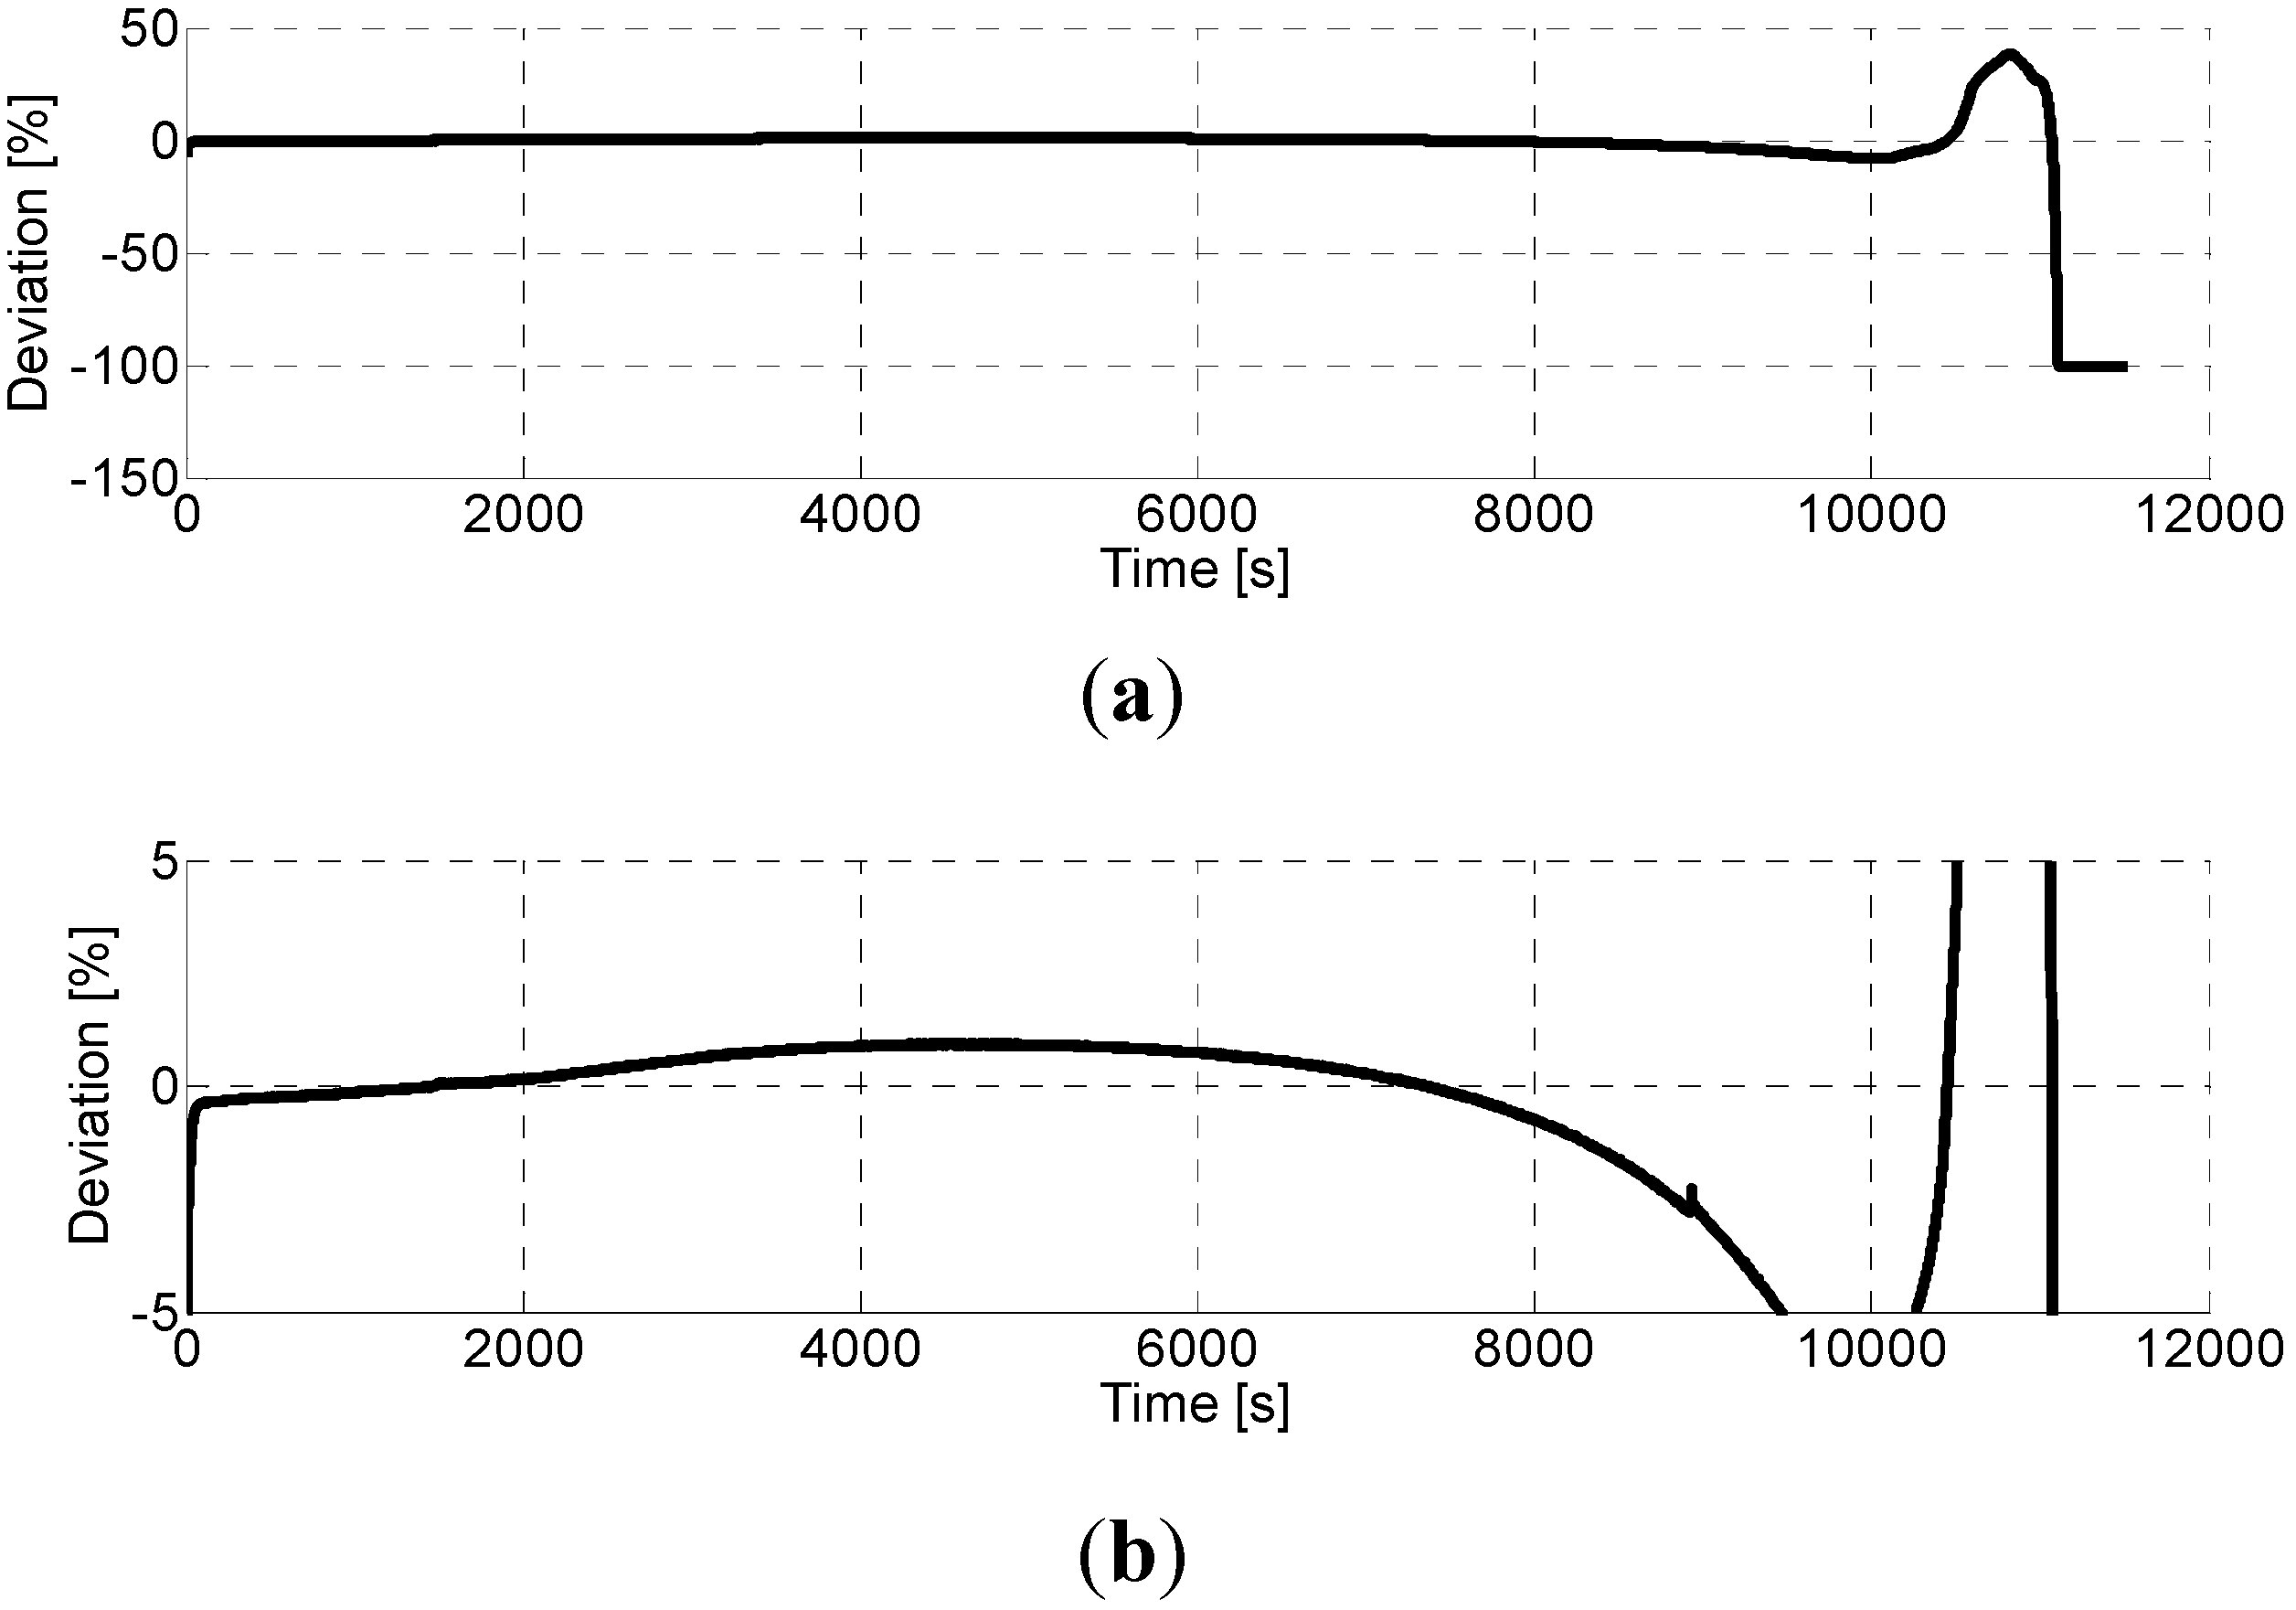
4.1. Experimental Validation in Static Conditions

The battery being tested has been completely discharged at a constant current of 8.8 A, that is a current equal to 20% of battery capacity (44 Ah). According to the Peukert effect ([8,9,24]), the extracted charge is lower than the rated capacity and equal to 27.4 Ah, which corresponds to a time for complete discharge equal to 11,209 s. The simplified procedure and the proposed identification procedure have been applied to the measured discharge curve. The obtained values of the model parameters are reported in Table 2.
With the values of model parameters reported in Table 2, the deviations between model outputs and experimental data have been evaluated. Figure 4 shows the measured discharge curve and the model output, where parameters are those obtained with the simplified procedure; Figure 5 shows the relative deviation. Figure 6 and Figure 7 refer to the results obtained with the proposed procedure. Figure 6 shows the measured discharge curve and the model output, where the parameters are those obtained with the proposed procedure; Figure 7 shows the relative deviation.
Figure 4. Measured discharge curve and model output with parameters from simplified procedure.
Energies 06 04572 g004
Some comments stem from Figure 4, Figure 5, Figure 6 and Figure 7. First of all, the exponential zone is well approximated with the proposed procedure, resulting in a maximum deviation lower than 1%; the deviation in the exponential zone with simplified procedure is about 4%. Then, in the nominal zone the root mean squared deviation is about 0.5% with the proposed procedure and about 0.9% with the simplified procedure. Finally, the end of the characteristic is not well approximated with both methods. In any case, this is a part of the curve that is not of interest: in fact, the residual charge is only a very little fraction of the battery capacity and, moreover, battery voltage rapidly decreases, representing therefore a very difficult operating zone for every power converter (such as inverters or DC/DC converters).
Therefore, in static conditions, the proposed method produces results with a better approximation than those obtained by means of the simplified procedure, both in the exponential zone as well as in the nominal zone.
Figure 5. Relative deviation among measured data and model output (simplified procedure). (a) Discharge characteristic: Simplified procedure; (b) Zoom of Figure 5a.
Energies 06 04572 g005
Figure 6. Measured discharge curve and model output with parameters from proposed procedure.
Energies 06 04572 g006
Figure 7. Relative deviation among measured data and model output (proposed procedure). (a) Discharge characteristic: Proposed procedure; (b) Zoom of Figure 7a.
Energies 06 04572 g007

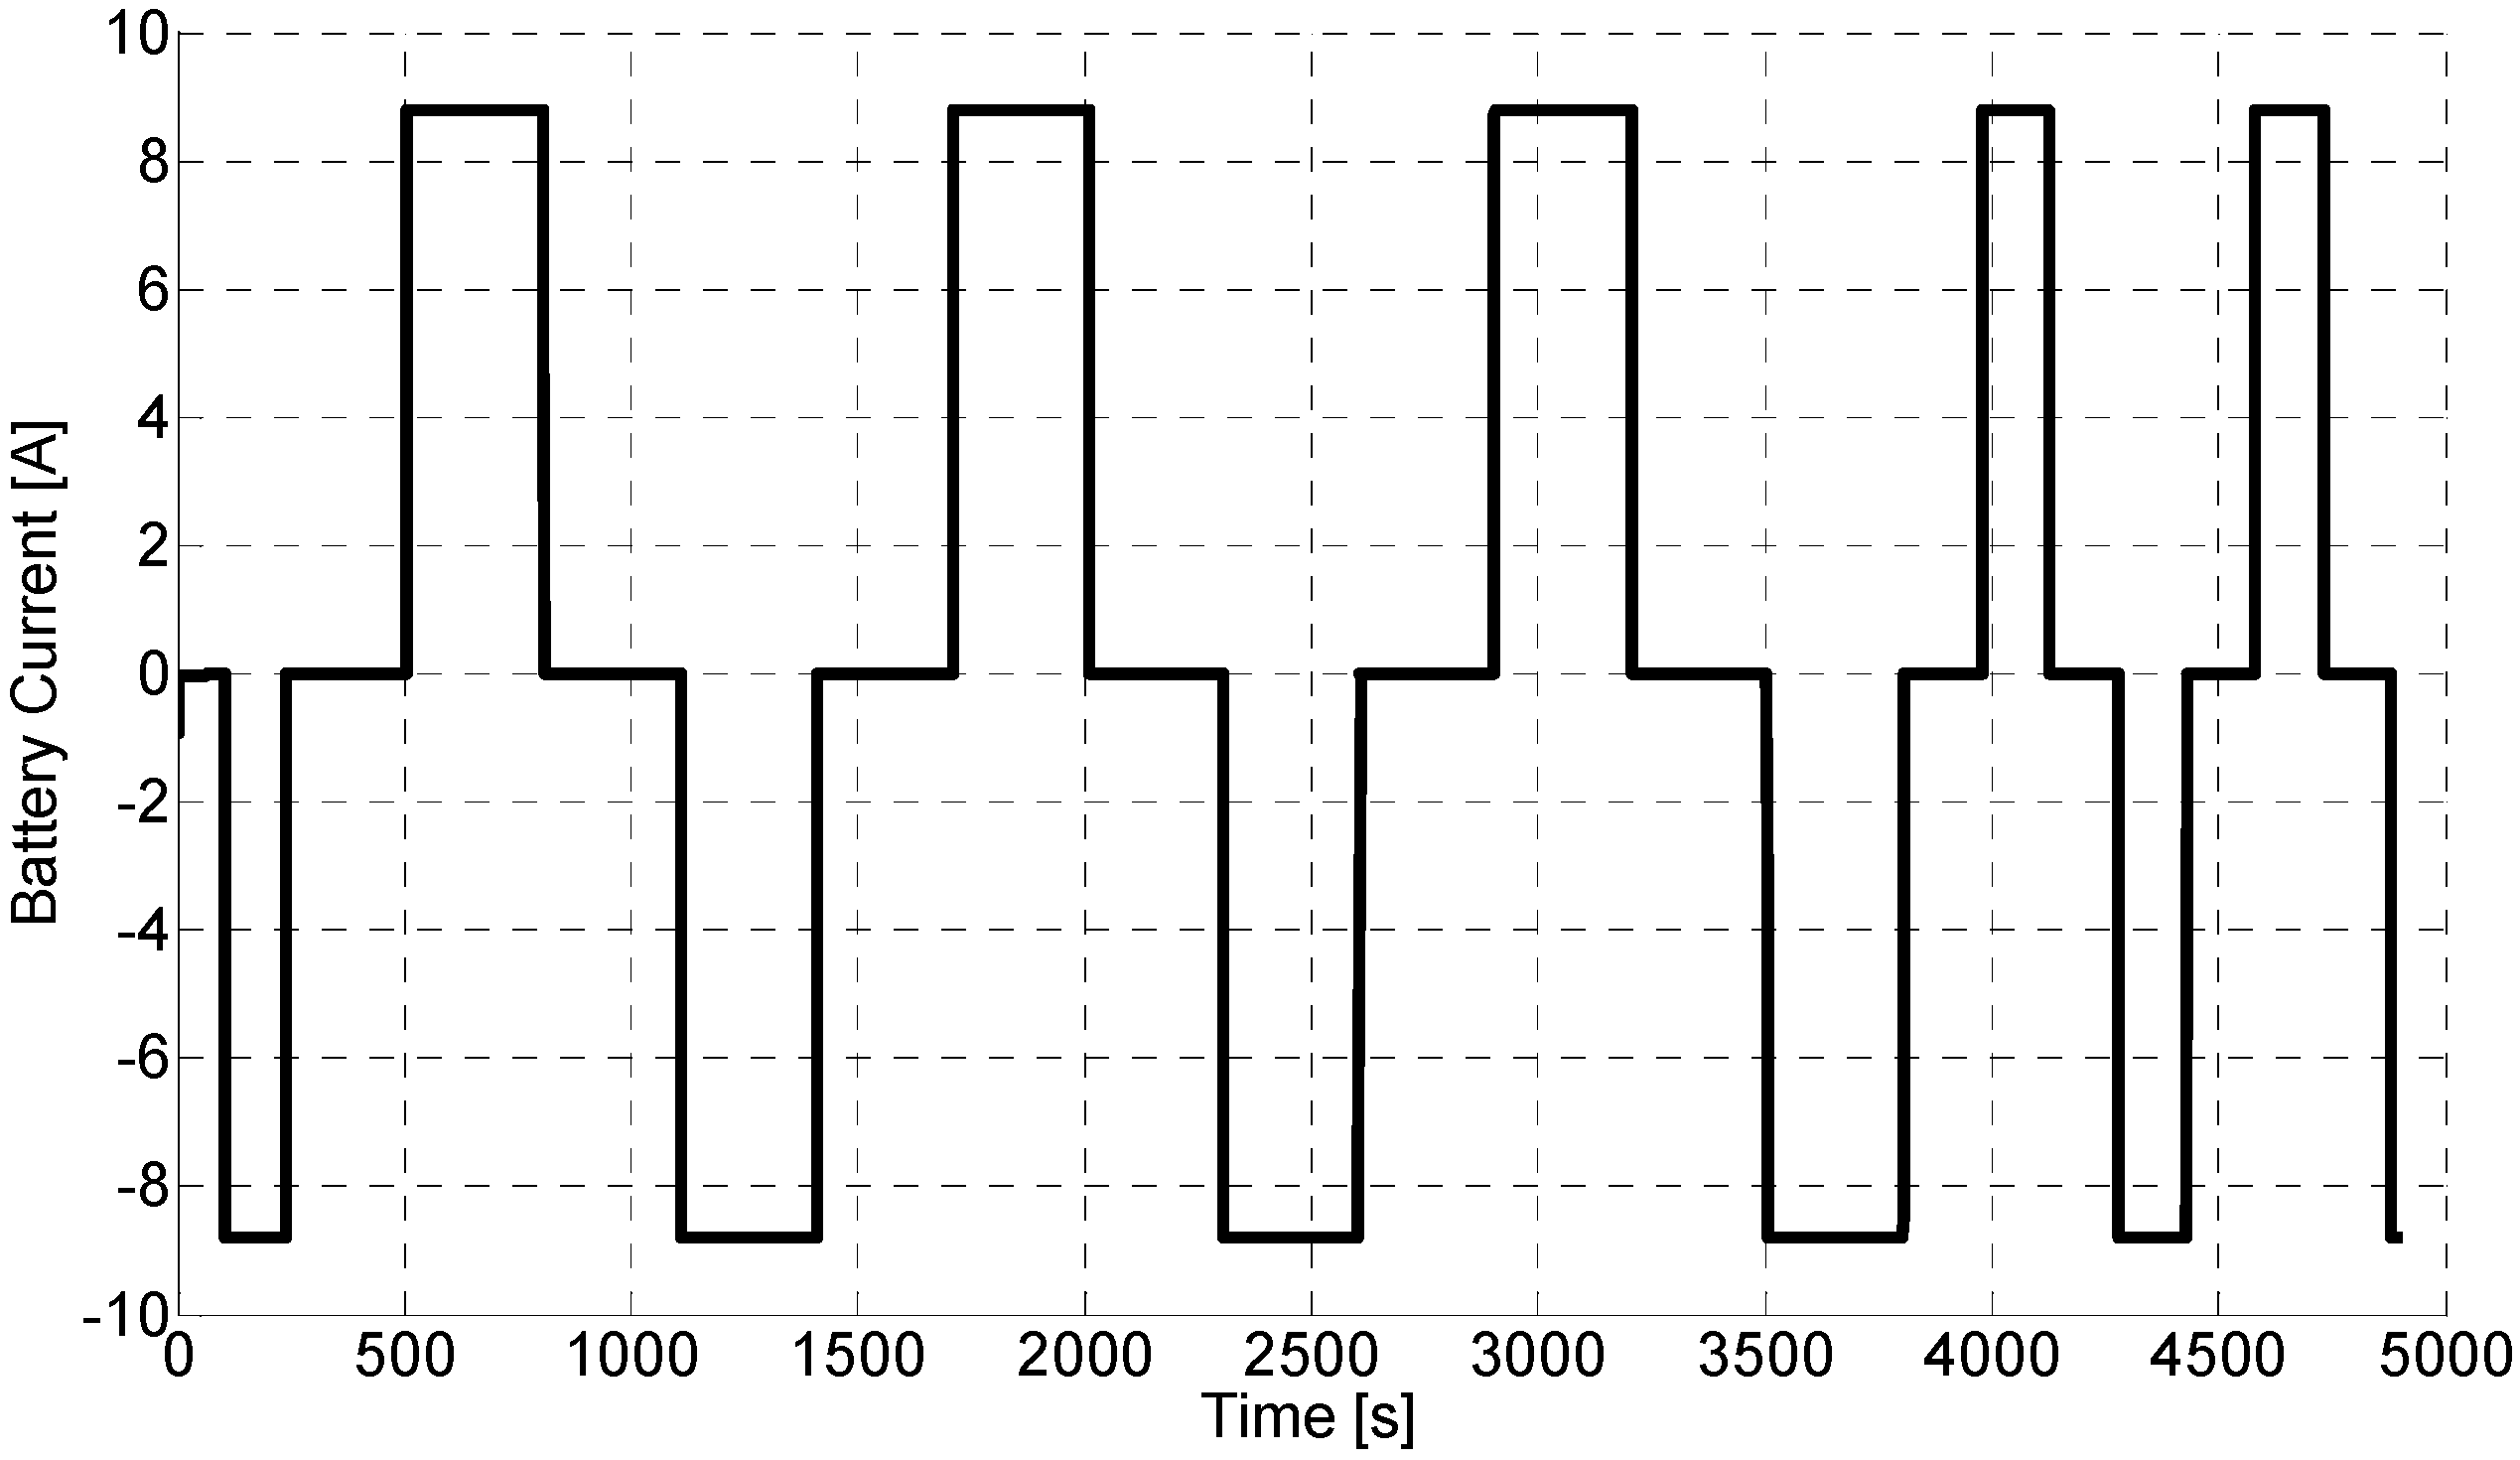
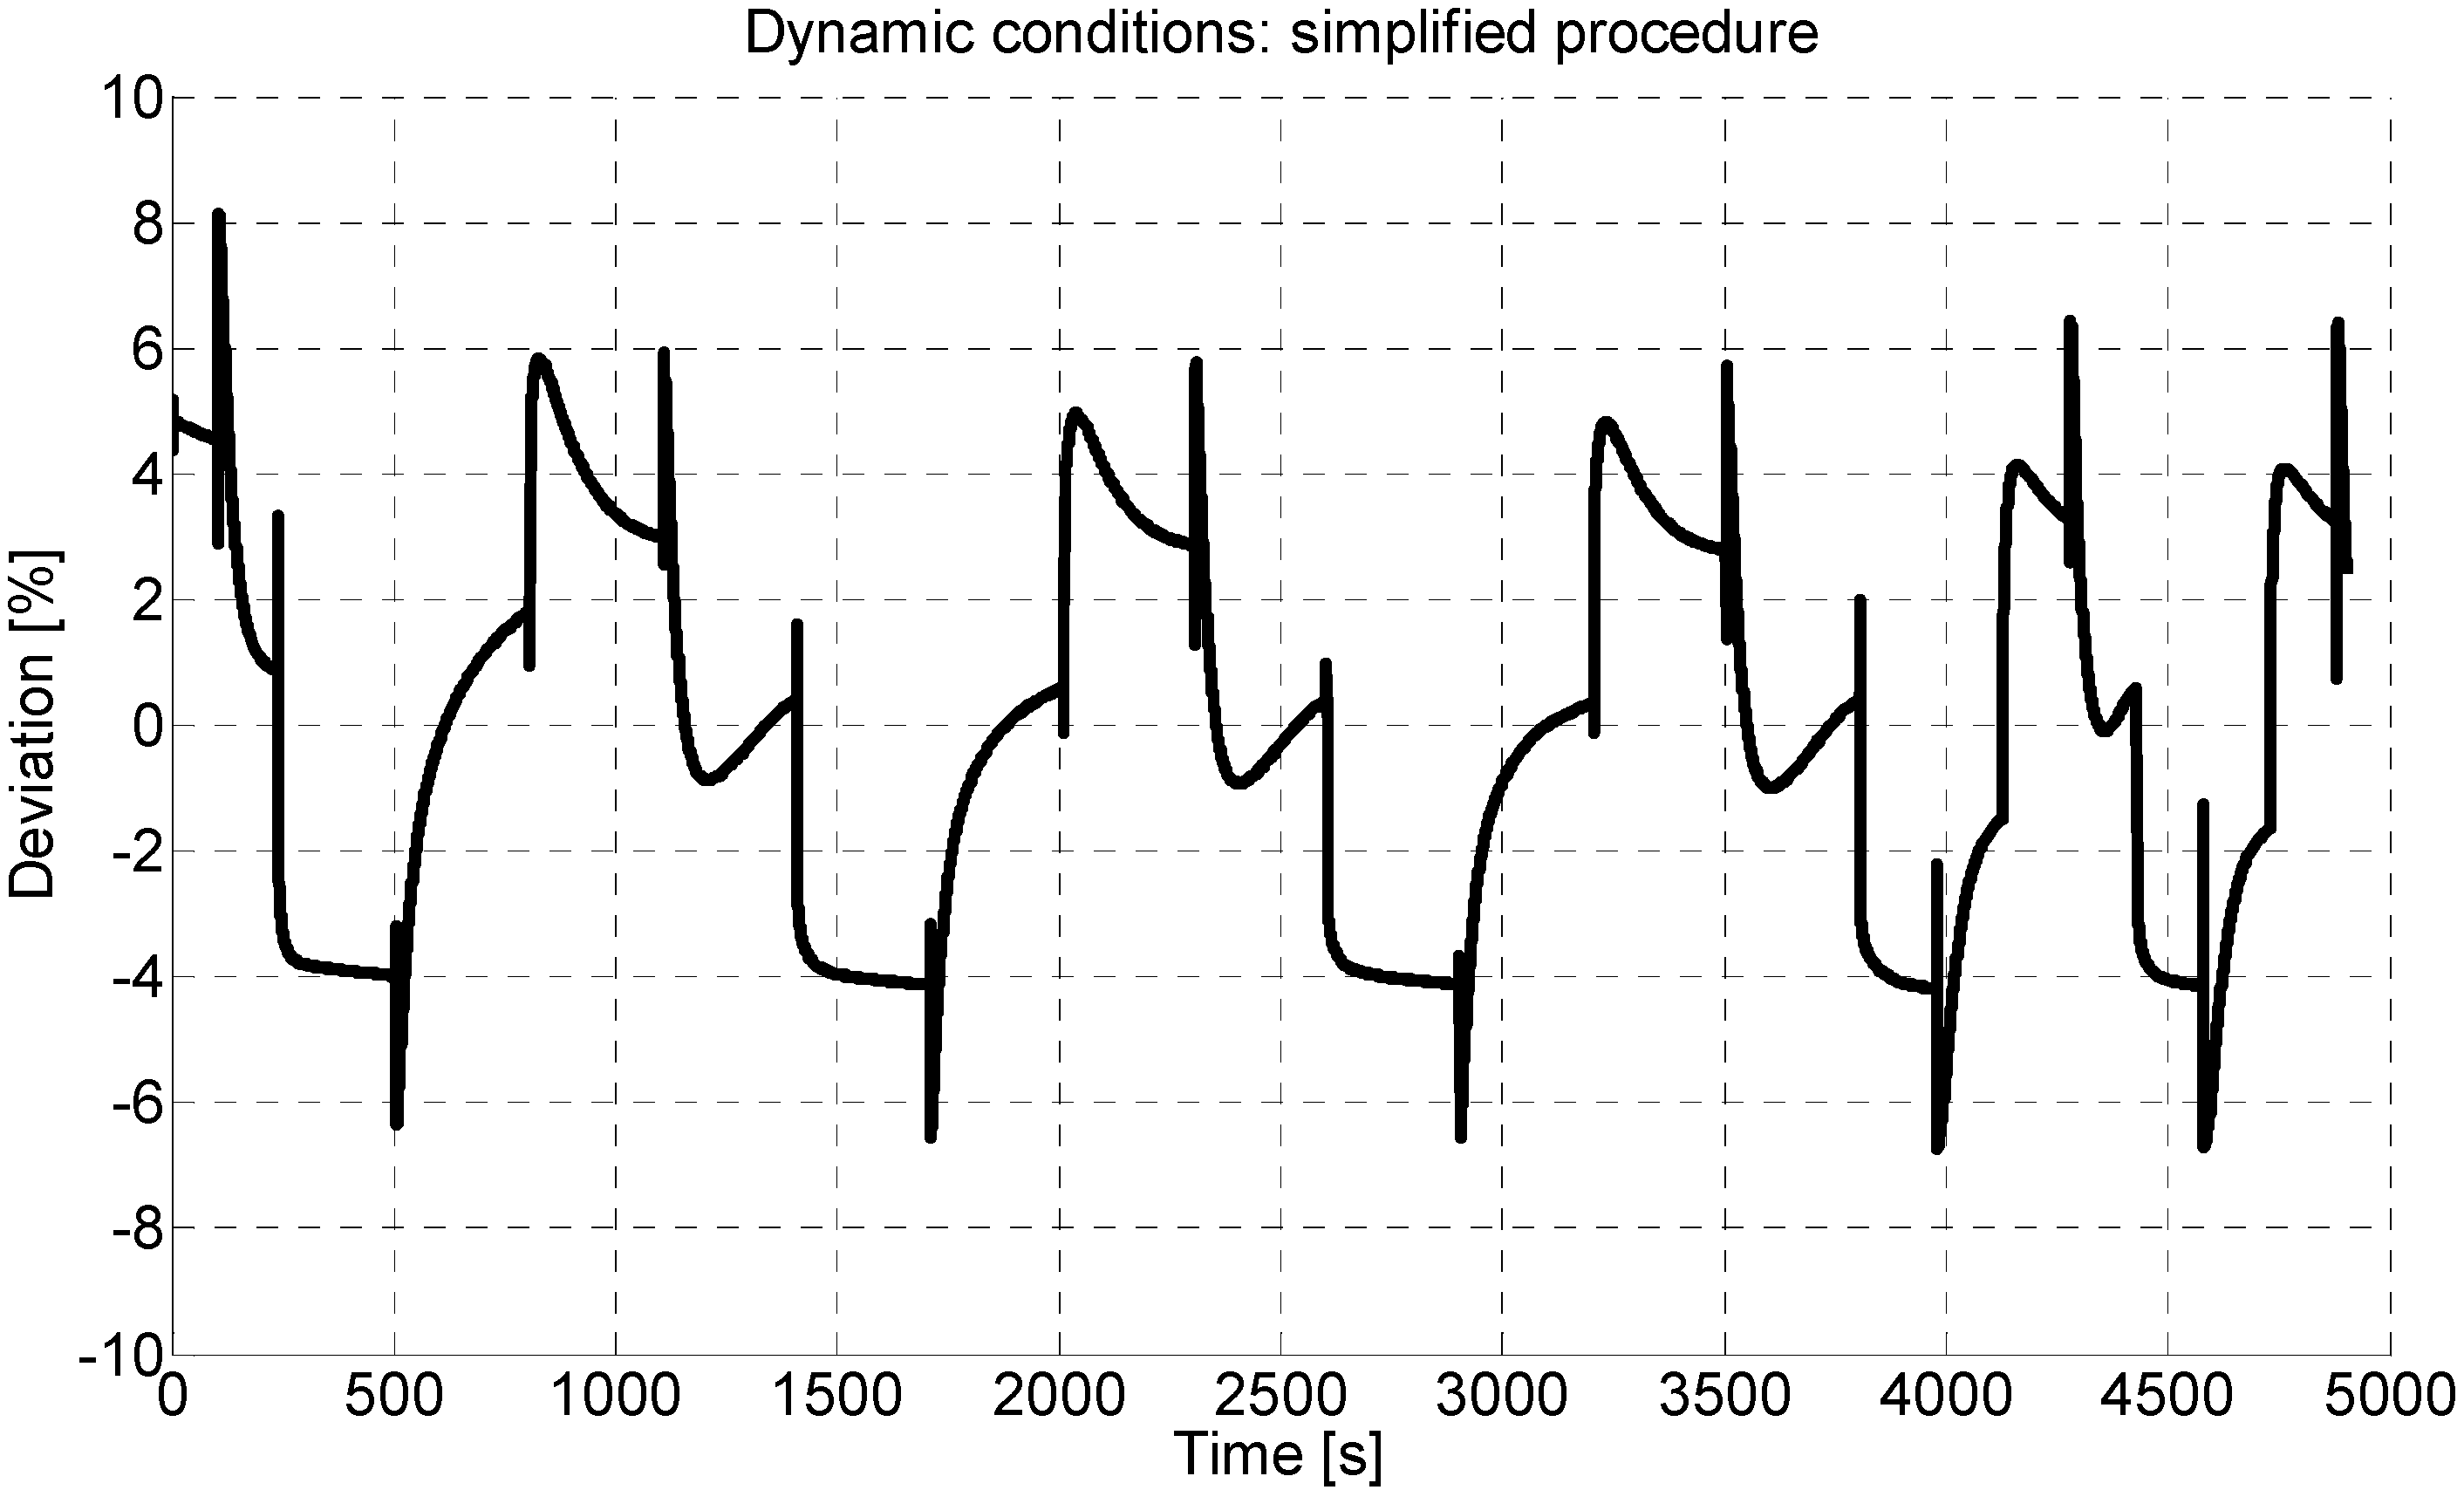
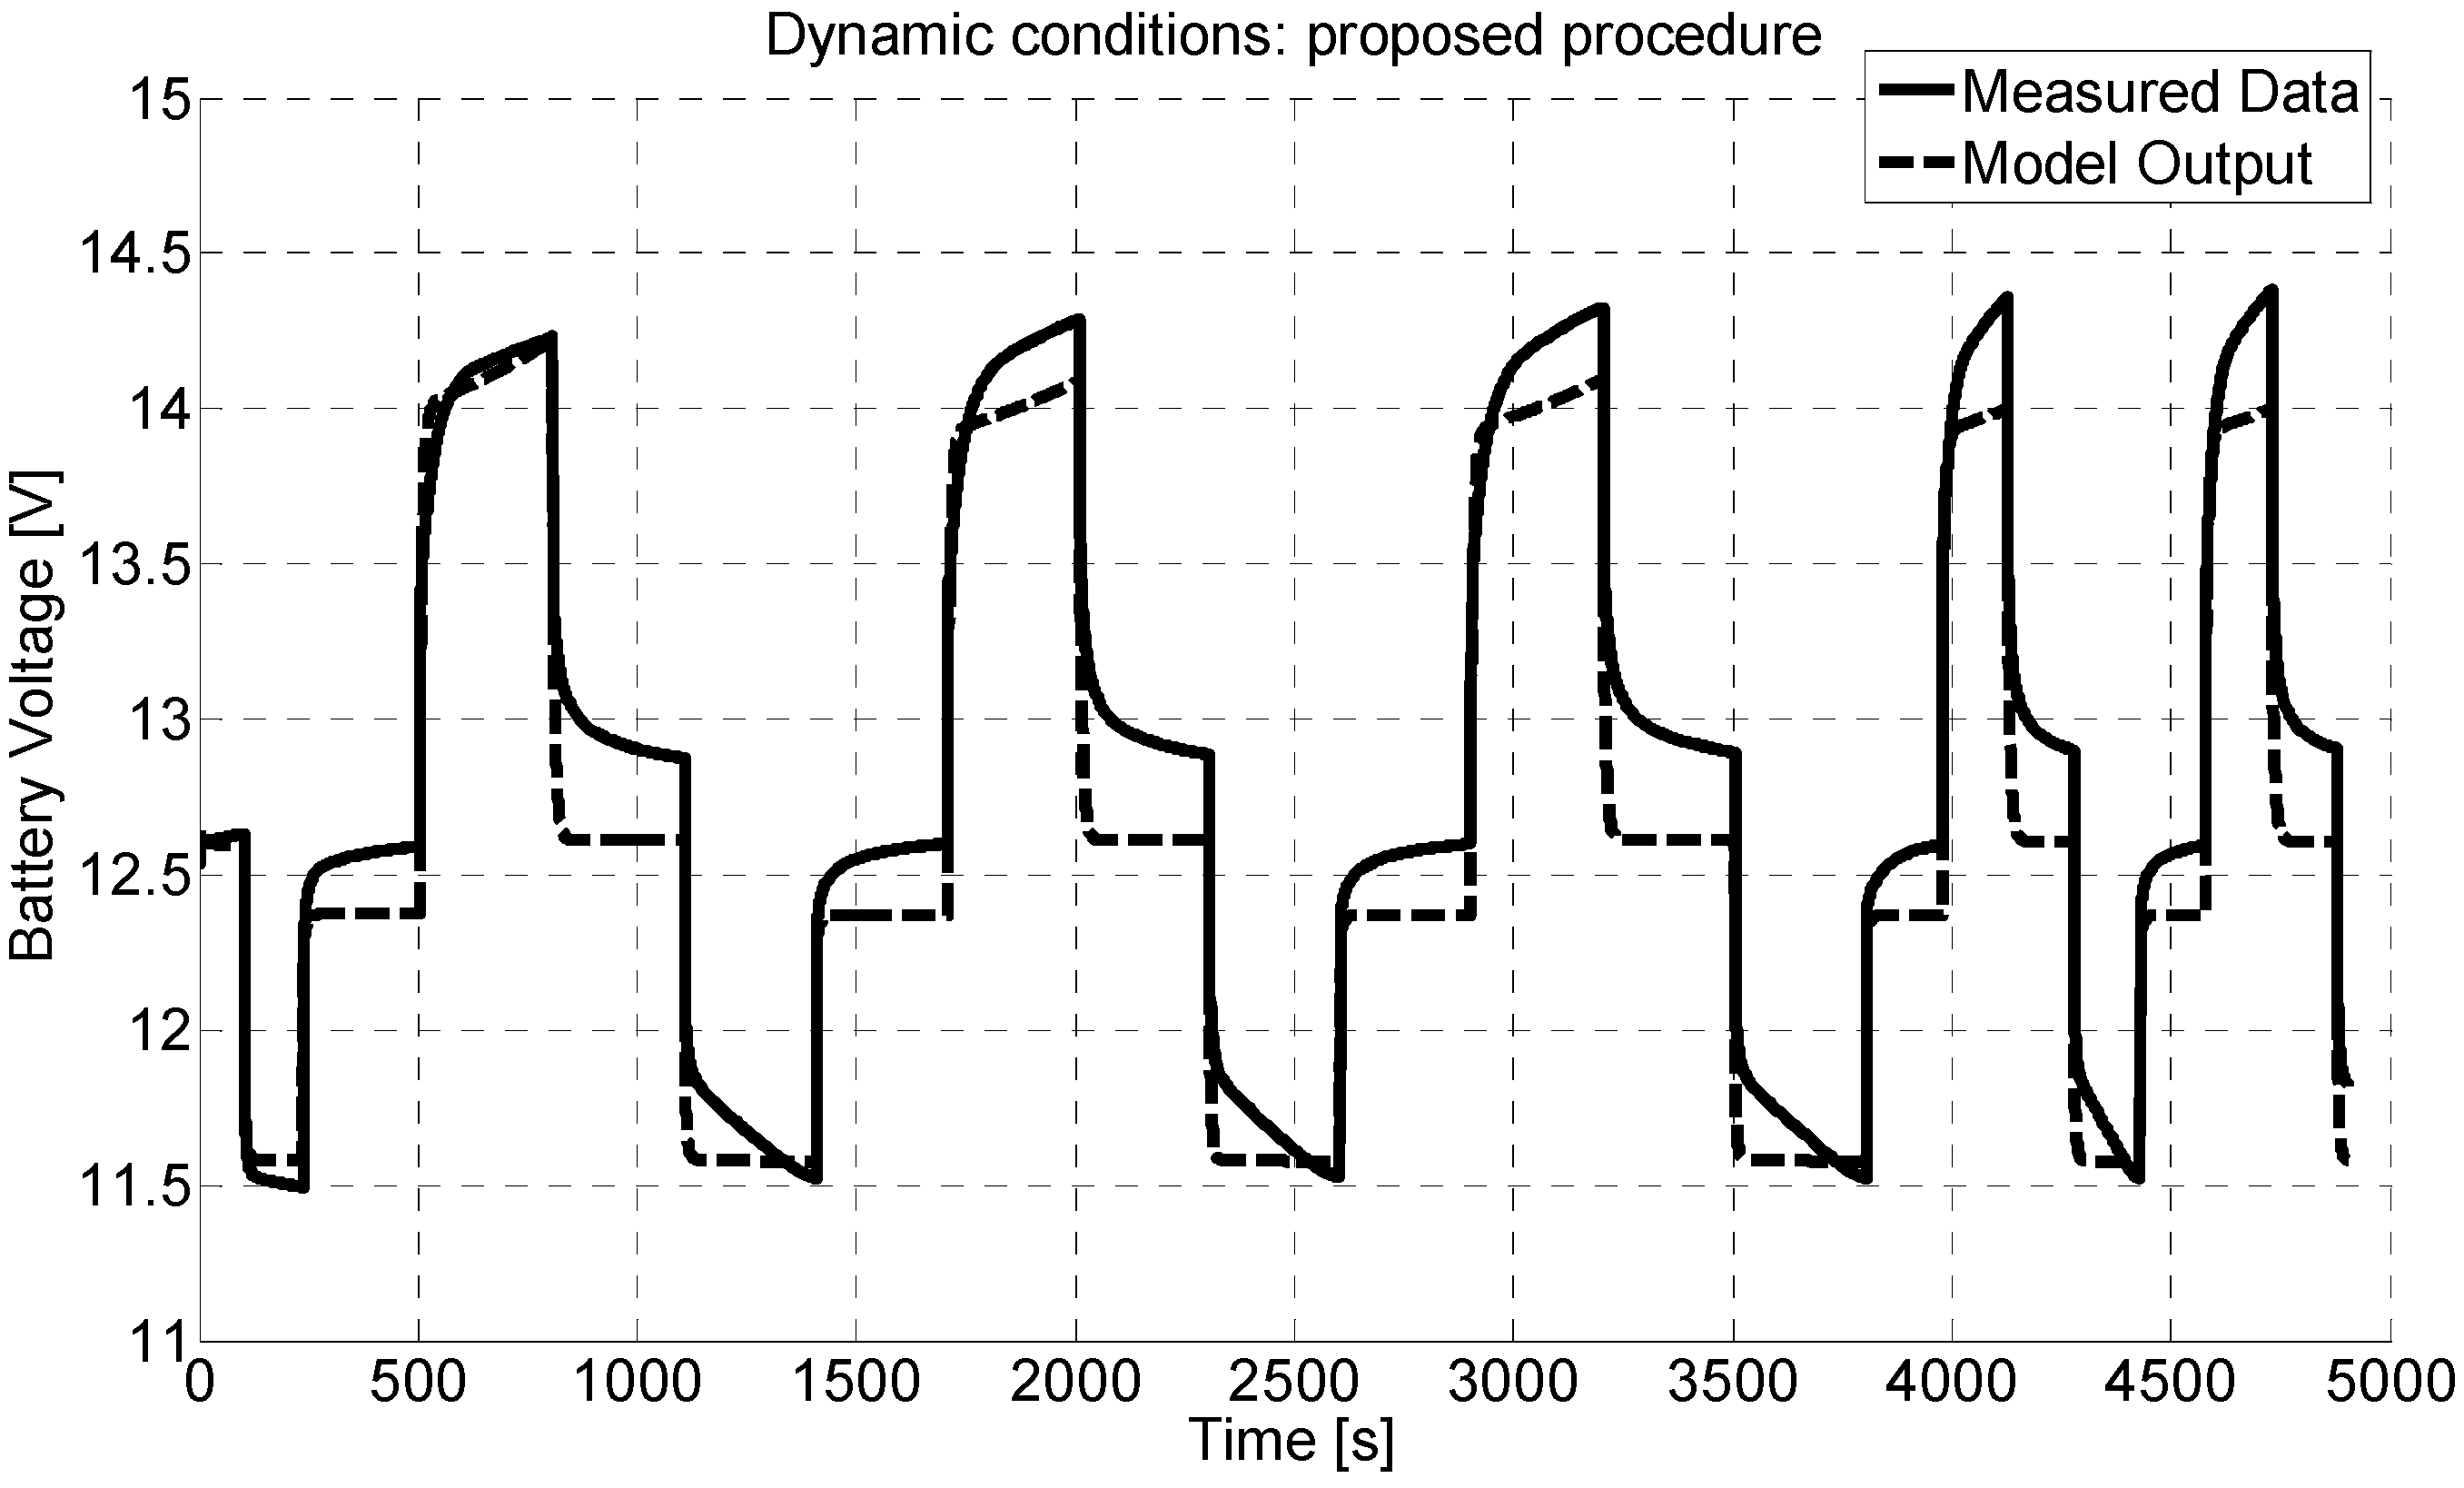
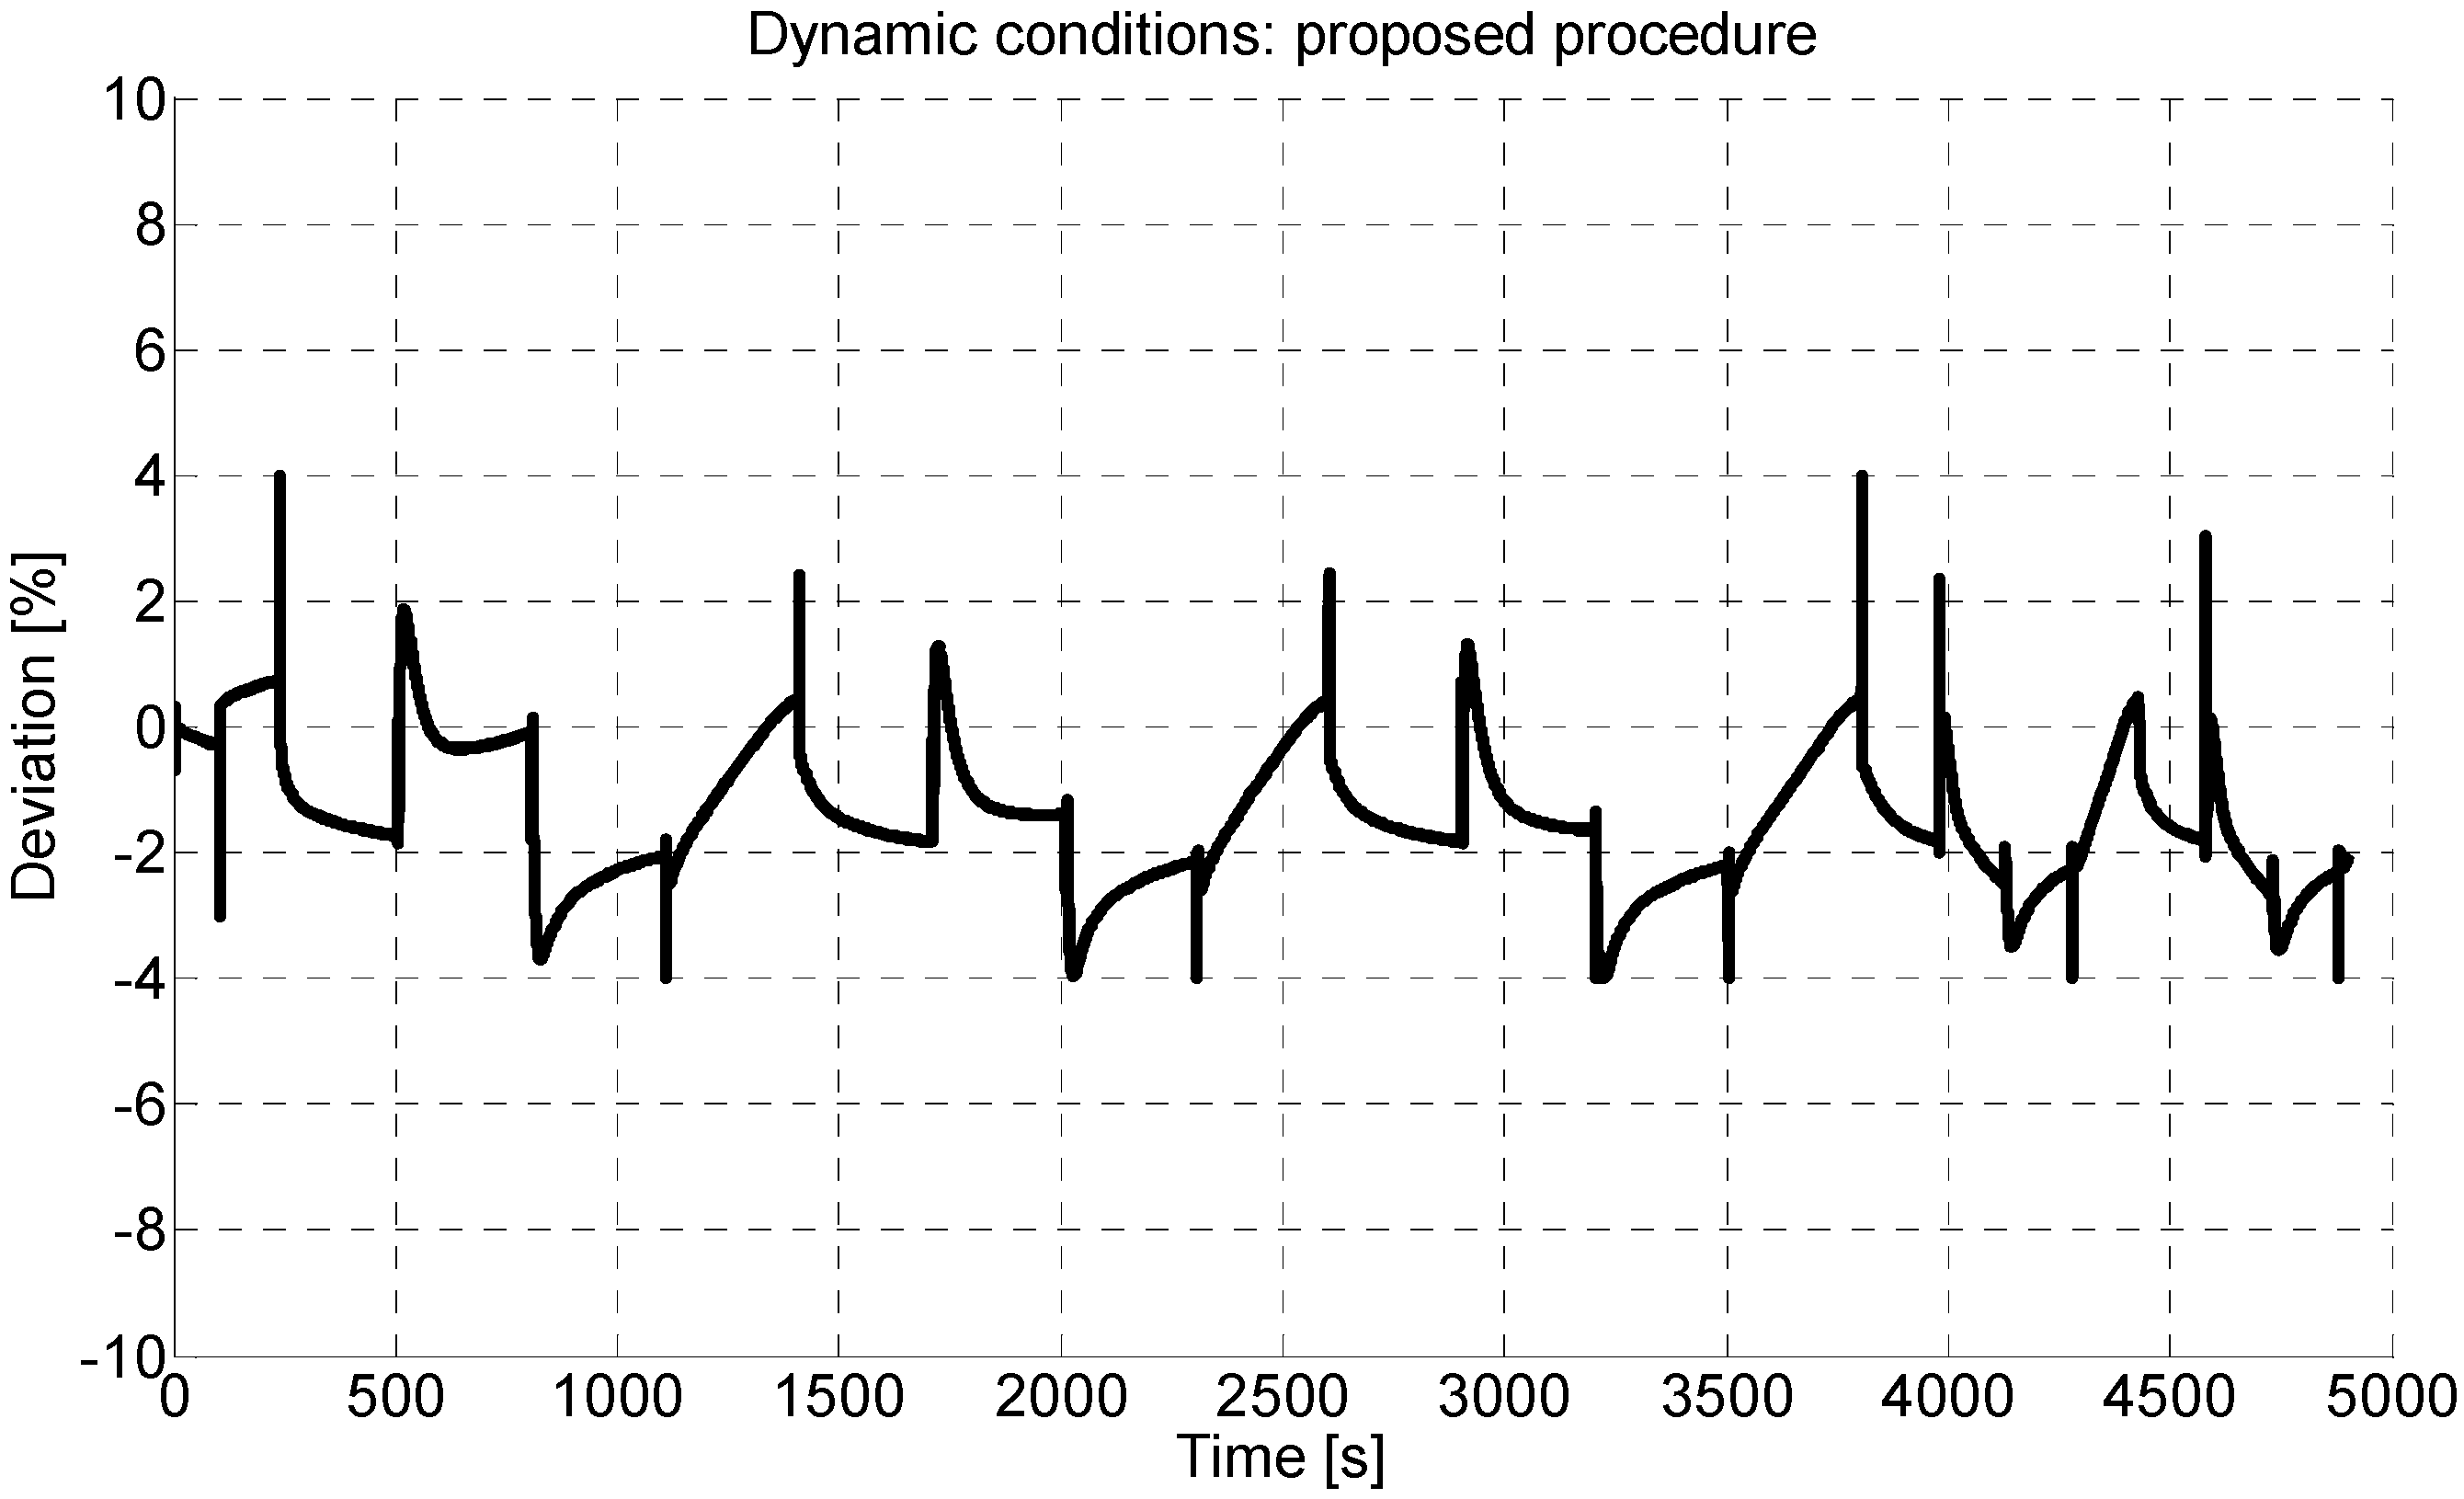
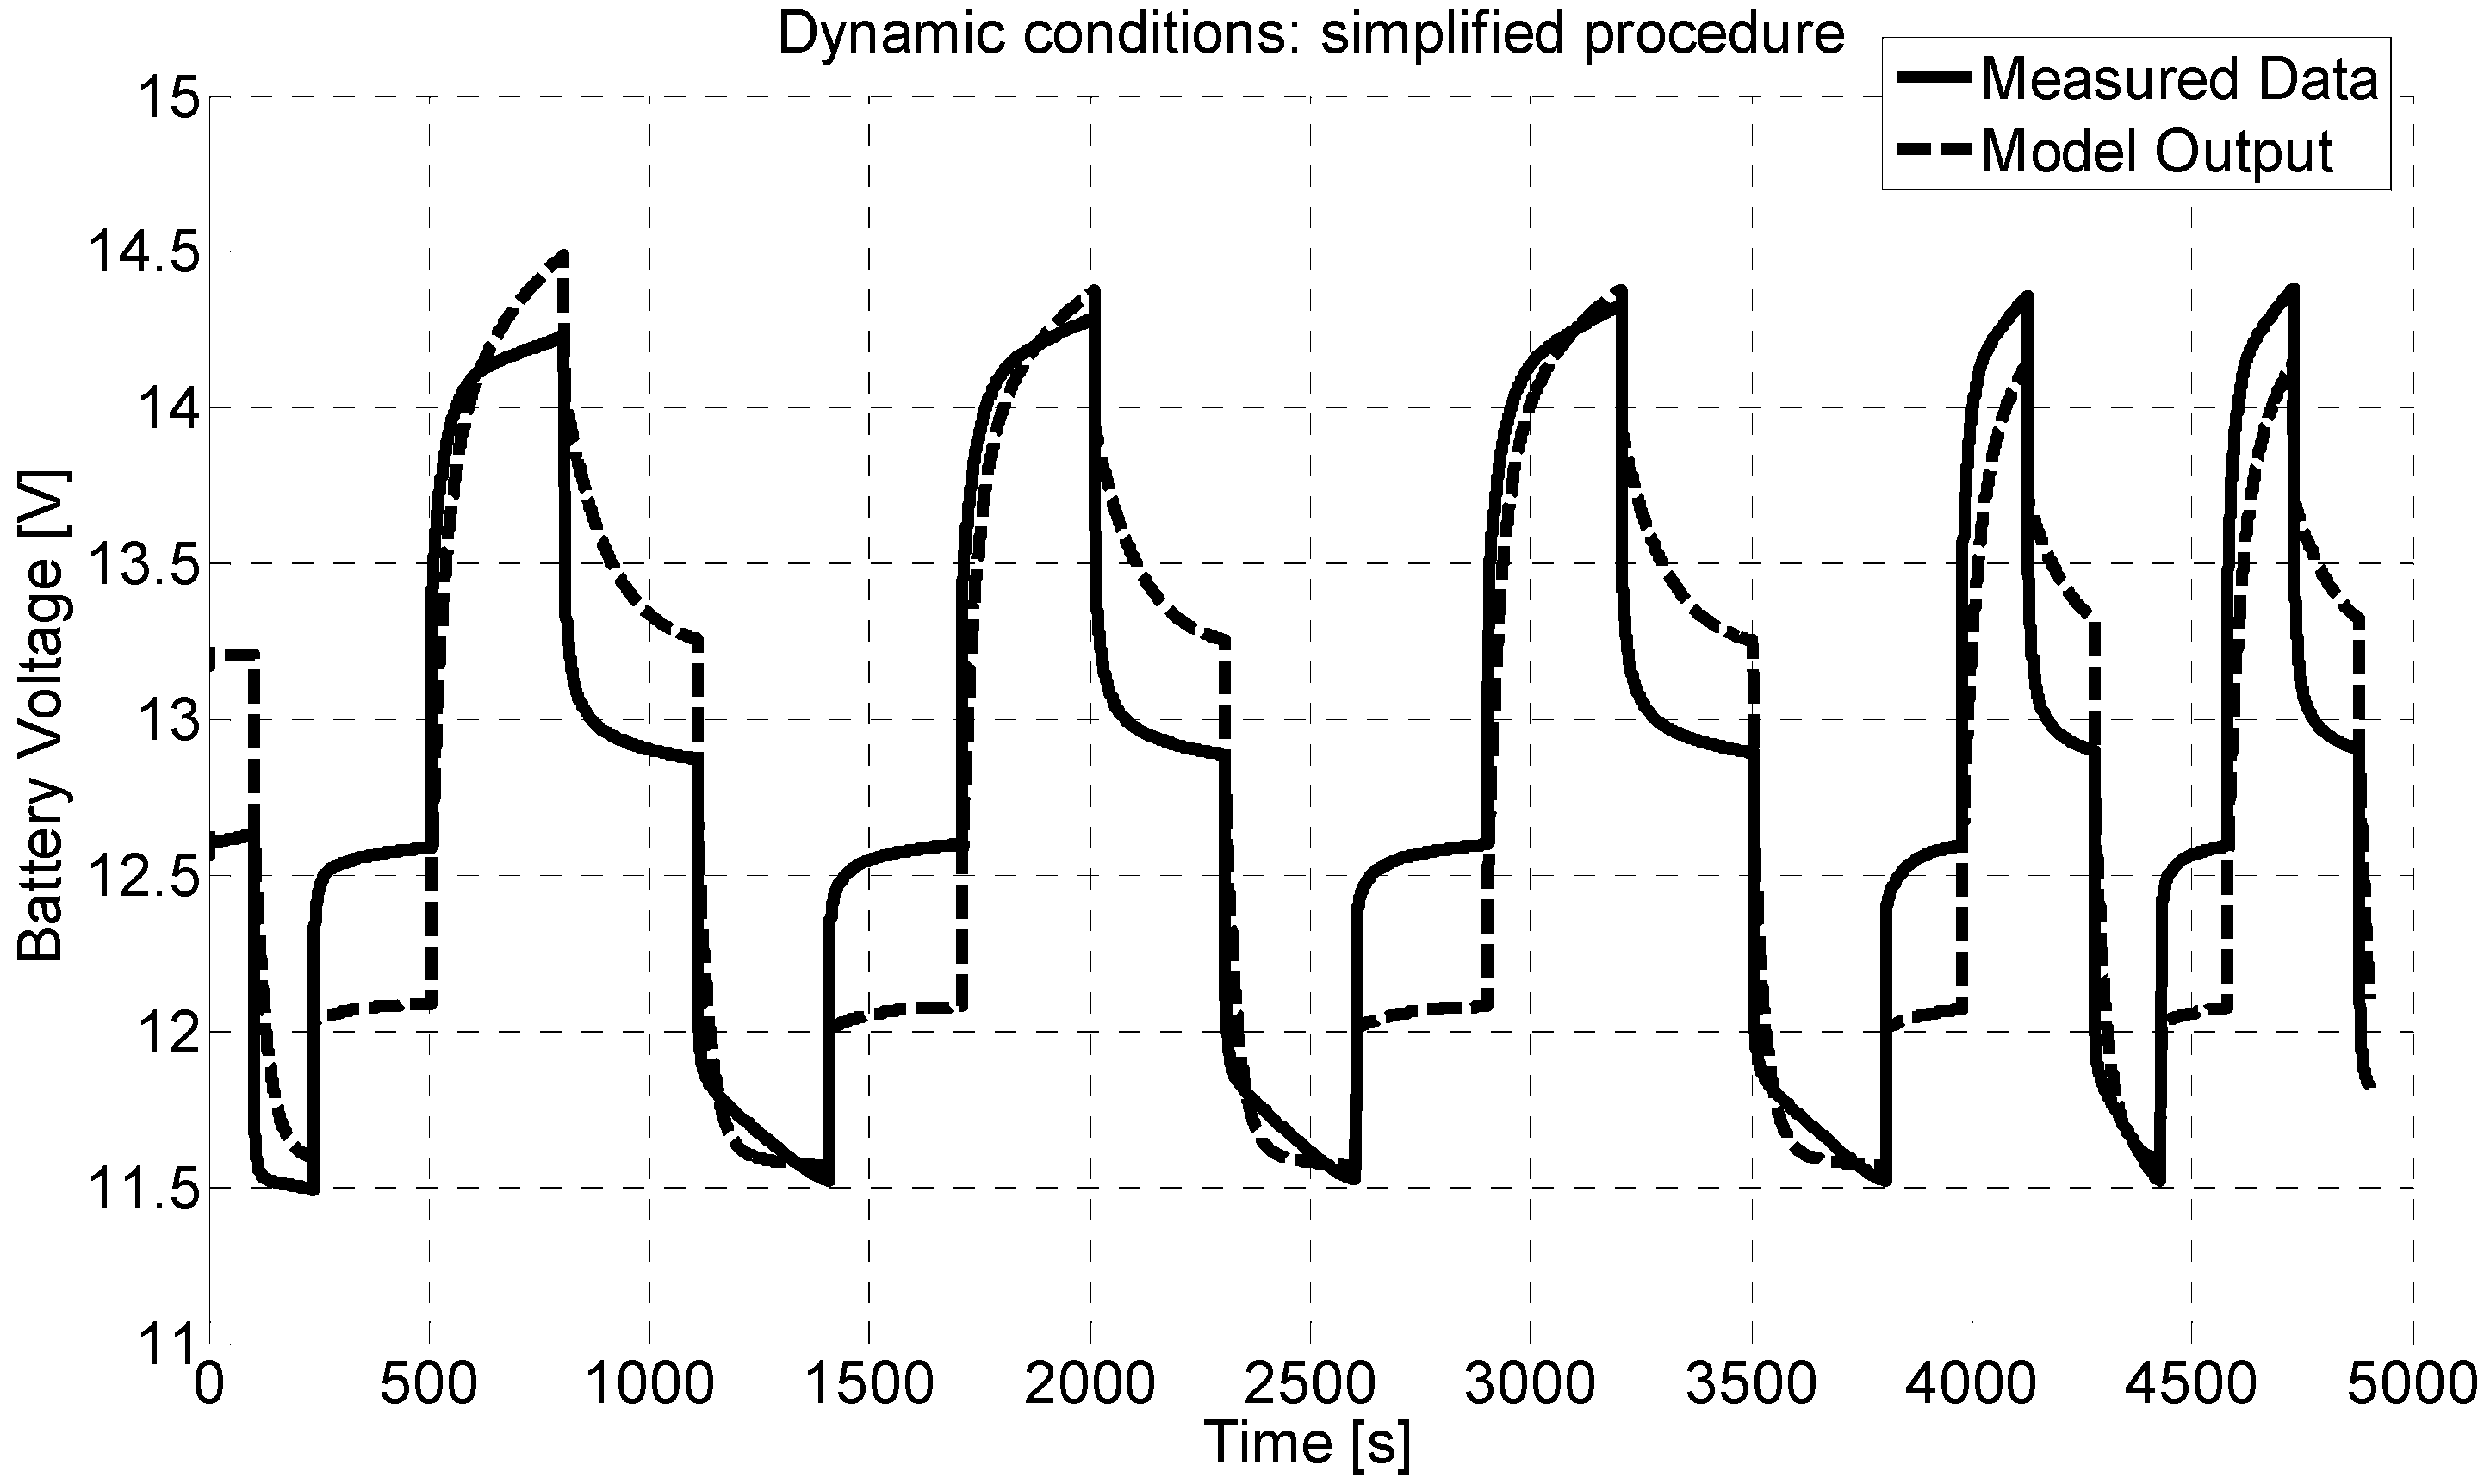
4.2. Experimental Validation in Dynamic Conditions

In the scientific literature some papers propose the identification of the parameter values of the battery model based on an optimisation algorithm. In [23], a method for the parameter extraction for the runtime-based circuit-oriented battery model is presented. It is based on a strategy of minimizing the RMS error between measured and equivalent-circuit-estimated battery terminal voltages; the estimated battery voltage is considered as a function of the battery circuit parameter. The obtained results under static conditions are quite good, but no validation of the model under dynamic conditions is presented; moreover, it is said that such a method is computationally expensive. In [50], a model of the battery and a methodology for determining the parameters of a battery model using the catalog data of the batteries and Multiobjective Optimisation Genetic Algorithm is proposed. The technique is applied to different battery types. The presented experimental results refer only to static conditions. Moreover, since the method is not based on experimental data for the parameter identification, but rather on data taken from a battery datasheet, it cannot account for fabrication tolerances, the battery’s state of health, etc.
In order to validate the proposed procedure, the battery has been subject to a test under dynamic conditions. A current pattern such as that in Figure 8 has been used: the period is a variable from 20 min to 10 min, while the value is 8.8 A (i.e., a charge current) for a quarter of a period, zero for a quarter of a period, −8.8 A (i.e., a discharge current) for a quarter of a period and then zero for the last quarter of a period. The period has been chosen as a variable in order to test the battery with variable input situations.
Figure 8. Current pattern used for test in dynamic conditions.
Energies 06 04572 g008
Figure 9 shows the measured battery voltage and the model output, where the parameters are those obtained with the simplified procedure; Figure 10 shows the relative deviation. Figure 11 shows the measured battery voltage and the model output, where parameters are those obtained with the proposed procedure; Figure 12 shows the relative deviation. As for test under static conditions, also under dynamic conditions, some comments are merited.
Figure 9. Test in dynamic conditions: measured battery voltage and model output with parameters from simplified procedure.
Energies 06 04572 g009
Figure 10. Test in dynamic conditions: relative deviation among measured data and model output (simplified procedure).
Energies 06 04572 g010
With the simplified procedure, the maximum deviation is about 8% while root mean squared deviation is about 3.5%. With the proposed procedure, the maximum deviation is lower than 4% and the root mean squared deviation is about 1.5%. This means that the deviations obtained with the proposed procedure are lower than the half of the deviations obtained by means of the simplified procedure.
Figure 11. Test in dynamic conditions: measured battery voltage and model output with parameters from proposed procedure.
Energies 06 04572 g011
Figure 12. Test in dynamic conditions: relative deviation among measured data and model output (proposed procedure).
Energies 06 04572 g012
The importance of the model validation under dynamic conditions is evident: a storage system designed and realized for a smart grid, always operates under dynamic conditions. In fact, both the energy generation, which tends to charge the batteries of the storage system, as well as the energy consumption, which tends to discharge the batteries of the storage system, are strongly time varying, especially in the smart grid scenario. Therefore, there could be situations in which a large portion of the power network has to be supplied only with energy stored into storage systems: in these cases, having a model with low deviation allows the network operators to best choose the size of the storage system, and not to oversize it, with consequent great economic advantages. In this contest, the adoption of the proposed procedure to model the storage systems allows to predict with better accuracy the battery operation and, thus, to simplify the network management from a technical and economical point of view.
Compared to other methods for identification of parameter values for the battery model, such as [23] and [50], the proposed technique allows for a description of the battery operation even under dynamic conditions, starting from experimental battery characterisation under static conditions. Even if the model does not account for some parameters affecting its accuracy, such as State-of-Health of the battery, the proposed procedure can be repeated over time; in this way, new parameter values, describing the mutated battery operation, can be used in order to obtain a new accurate model.

5. Conclusions

In this paper a technique for optimisation of the extraction of model parameters for energy storage systems in Smart Grids, based on experimental data, has been presented. The method could help in performing an accurate modeling for storage systems, in order to achieve robust real-time control of the network, from the point of view of stability and energy supply assurance. Apart from the many techniques presented in the literature, the proposed method is based on experimental data and could be applied to continuous re-estimation and updating of model parameters. In this framework, this paper proposes a procedure that allows a continuous updating of model parameters, even taking information from charge and discharge that apply during normal battery operations, to obtain reliable results over time. The parameter extraction is performed with a low computational burden with a hybrid optimisation procedure. The performance of the proposed procedure has been validated under dynamic conditions and compared with techniques present in literature showing a better accuracy.

Conflicts of Interest

The authors declare no conflict of interest.

References

  1. Ipakchi, A.; Albuyeh, F. Grid of the future. IEEE Power Energy Mag. 2009, 7, 52–62. [Google Scholar]
  2. Moslehi, K.; Kumar, R. A reliability perspective of the smart grid. IEEE Trans. Smart Grid 2010, 1, 57–64. [Google Scholar] [CrossRef]
  3. Baker, J.N.; Collinson, A. Electrical energy storage at the turn of the Millennium. Power Eng. J. 1999, 13, 107–112. [Google Scholar] [CrossRef]
  4. Divya, K.C.; Østergaard, J. Battery energy storage technology for power systems—An overview. Electr. Power Syst. Res. 2009, 79, 511–520. [Google Scholar] [CrossRef]
  5. Barton, J.P.; Infield, D.G. Energy storage and its use with intermittent renewable energy. IEEE Trans. Energy Convers. 2004, 19, 441–448. [Google Scholar] [CrossRef]
  6. Dell, R.M.; Rand, D.A.J. Energy storage—A key technology for global energy sustainability. J. Power Sources 2001, 100, 2–17. [Google Scholar] [CrossRef]
  7. Sparacino, A.R.; Reed, G.F.; Kerestes, R.J.; Grainger, B.M.; Smith, Z.T. Survey of Battery Energy Storage Systems and Modeling Techniques. In Proceedings of the IEEE Power and Energy Society General Meeting, San Diego, CA, USA, 22–26 July 2012; pp. 1–8.
  8. Dell, R.; Rand, D.A.J. Understanding Batteries; Royal Society of Chemistry: Cambridge, UK, 2001. [Google Scholar]
  9. Linden, D.; Reddy, T.B. Handbook of Batteries, 3rd ed.; McGraw-Hill: Whitby, ON, Canada, 2001. [Google Scholar]
  10. Gallo, D.; Landi, C.; Luiso, M. Real time digital compensation of current transformers over a wide frequency range. IEEE Trans. Instrum. Meas. 2010, 59, 1119–1126. [Google Scholar] [CrossRef]
  11. Landi, C.; Luiso, M.; Pasquino, N. A remotely controlled on-board measurement system for optimization of energy consumption of electrical trains. IEEE Trans. Instrum. Meas. 2008, 57, 2250–2256. [Google Scholar] [CrossRef]
  12. Acampora, G.; Landi, C.; Luiso, M.; Pasquino, N. Optimization of Energy Consumption in a Railway Traction System. In Proceedings of the IEEE International Symposium on Power Electronics, Electrical Drives, Automation and Motion SPEEDAM 2006, Taormina, Italy, 23–26 May 2006; pp. 5–16.
  13. Gallo, D.; Landi, C.; Luiso, M. Compensation of current transformers by means of field programmable gate array. Metrol. Meas. Syst. 2009, 2, 279–288. [Google Scholar]
  14. Gallo, D.; Landi, C.; Luiso, M. Power quality monitoring instrument with fpga transducer compensation. IEEE Trans. Instrum. Meas. 2009, 58, 3149–3158. [Google Scholar] [CrossRef]
  15. Delle-Femine, A.; Gallo, D.; Landi, C.; Luiso, M.A. Technique for Real-Time Correction of Measurement Instrument Transducers Frequency Responses. In Proceedings of the IEEE International Instrumentation and Measurement Technology Conference (IMTC), Victoria, BC, Canada, 12–15 May 2008.
  16. Landi, C.; Noviello, E.I. Architecture of a Microprogrammed Measurement System to Test Batteries for Vehicular Applications. In Proceedings of the Drive Electric’85, Sorrento, Italy, 1–3 October 1985.
  17. Yuan, S.; Wu, H.; Yin, C. State of charge estimation using the extended kalman filter for battery management systems based on the arx battery model. Energies 2013, 6, 444–470. [Google Scholar] [CrossRef]
  18. Nguyen, M.Y.; Nguyen, D.H.; Yoon, Y.T. A new battery energy storage charging/discharging scheme for wind power producers in real-time markets. Energies 2012, 5, 5439–5452. [Google Scholar] [CrossRef]
  19. Omar, N.; Daowd, M.; Bossche, P.; Hegazy, O.; Smekens, J.; Coosemans, T.; Mierlo, J. Rechargeable energy storage systems for plug-in hybrid electric vehicles—Assessment of electrical characteristics. Energies 2012, 5, 2952–2988. [Google Scholar] [CrossRef]
  20. He, H.; Xiong, R.; Fan, J. Evaluation of lithium-ion battery equivalent circuit models for state of charge estimation by an experimental approach. Energies 2011, 4, 582–598. [Google Scholar] [CrossRef]
  21. Ardito, L.; Procaccianti, G.; Menga, G.; Morisio, M. Smart grid technologies in Europe: An overview. Energies 2013, 6, 251–281. [Google Scholar] [CrossRef]
  22. Yoo, J.; Park, B.; An, K.; Al-Ammar, E.A.; Khan, Y.; Hur, K.; Kim, J.H. Look-Ahead energy management of a grid-connected residential pv system with energy storage under time-based rate programs. Energies 2012, 5, 1116–1134. [Google Scholar] [CrossRef]
  23. Li, S.H.; Ke, B. Study of Battery Modeling Using Mathematical and Circuit Oriented Approaches. In Proceedings of the 2011 IEEE Power and Energy Society General Meeting, Detroit, MI, USA, 24–28 July 2011.
  24. Dessaint, L.A.; Tremblay, O. Experimental validation of a battery dynamic model for EV applications. World Electr. Veh. J. 2009, 3, 1–10. [Google Scholar]
  25. Gomadam, P.M.; Weidner, J.W.; Dougal, R.A.; White, R.E. Mathematical modeling of lithium-ion and nickel battery systems. J. Power Sources 2002, 110, 267–284. [Google Scholar] [CrossRef]
  26. Shepherd, C.M. Design of primary and secondary cells. J. Electrochem. Soc. 1965, 112, 657–664. [Google Scholar] [CrossRef]
  27. Cherif, A.; Jraidi, M.; Dhouib, A. A battery aging model used in standalone PV system. J. Power Sources 2002, 112, 49–53. [Google Scholar] [CrossRef]
  28. Ross, M.M.D. A Simple but Comprehensive Lead-Acid Battery Model for Hybrid System Simulation. In Proceedings of the PV Horizon: Workshop on Photovoltaic Hybrid Systems, Montreal, QC, Canada, 10 September 2001.
  29. Chen, M.; Rincon-Mora, G.A. Accurate electrical battery model capable of predicting runtime and I–V performance. IEEE Trans. Energy Convers. 2006, 21, 504–511. [Google Scholar] [CrossRef]
  30. Salameh, Z.M.; Casacca, M.A.; Lynch, W.A. A mathematical model for lead-acid batteries. IEEE Trans. Energy Convers. 1992, 7, 93–98. [Google Scholar] [CrossRef]
  31. Valvo, M.; Wicks, F.E.; Robertson, D.; Rudin, S. Development and Application of an Improved Equivalent Circuit Model of a Lead Acid Battery. In Proceedings of the 31st Intersociety Energy Conversion Engineering Conference, Washington, DC, USA, 11–16 August 1996; pp. 1159–1163.
  32. Ceraolo, M. New dynamical models of lead-acid batteries. IEEE Trans. Power Syst. 2000, 15, 1184–1190. [Google Scholar] [CrossRef]
  33. Barsali, S.; Ceraolo, M. Dynamical models of lead-acid batteries: Implementation issues. IEEE Trans. Energy Convers. 2002, 17, 16–23. [Google Scholar] [CrossRef]
  34. Benini, L.; Castelli, G.; Macci, A.; Macci, E.; Poncino, M.; Scarsi, R. Discrete-time battery models for system-level low-power design. IEEE Trans. VLSI Syst. 2001, 9, 630–640. [Google Scholar] [CrossRef]
  35. Schweighofer, B.; Raab, K.M.; Brasseur, G. Modeling of high power automotive batteries by the use of an automated test system. IEEE Trans. Instrum. Meas. 2003, 52, 1087–1091. [Google Scholar] [CrossRef]
  36. Gao, L.; Liu, S.; Dougal, R.A. Dynamic lithium-ion battery model for system simulation. IEEE Trans. Compon. Packag. Technol. 2002, 25, 495–505. [Google Scholar] [CrossRef]
  37. Buller, S.; Thele, M.; Doncker, R.W.D.; Karden, E. Impedance based simulation models of supercapacitors and Li-ion batteries for power electronic applications. IEEE Trans. Ind. Appl. 2005, 41, 742–747. [Google Scholar] [CrossRef]
  38. Baudry, P.; Neri, M.; Gueguen, M.; Lonchampt, G. Electro-thermal modeling of polymer lithium batteries for starting period and pulse power. J. Power Sources 1995, 54, 393–396. [Google Scholar] [CrossRef]
  39. Zhang, H.; Chow, M.Y. Comprehensive Dynamic Battery Modeling for PHEV Applications. In Proceedings of the 2010 IEEE PES General Meeting, Minneapolis, MN, USA, 26–29 July 2010.
  40. Bindner, H.; Cronin, T.; Lundsager, P.; Manwell, J.F.; Abdulwahid, U.; Baring-Gould, I. Lifetime Modelling of Lead Acid Batteries; Risø National Laboratory: Roskilde, Denmark, 2005. [Google Scholar]
  41. Feng, X.; Sun, Z. A Battery Model Including Hysteresis for State-of-Charge estimation in Ni-MH Battery. In Proceedings of the IEEE Vehicle Power and Propulsion Conference (VPPC), Harbin, China, 3–5 September 2008.
  42. Langella, R.; Testa, A. Analysis of the Cost of Electric Energy Discharged to the Grid by Some Energy Storage Systems. In Proceedings of the 2012 IEEE International Energy Conference and Exhibition, Florence, Italy, 9–12 September 2012.
  43. Carpentiero, V.; Langella, R.; Testa, A. Hybrid wind-diesel stand-alone system sizing accounting for component expected life and fuel price uncertainty. Electr. Power Syst. Res. 2012, 88, 69–77. [Google Scholar] [CrossRef]
  44. Zenati, A.; Desprez, P.; Razik, H. Estimation of the SOC and the SOH of Li-Ion Batteries, by Combining Impedance Measurements with the Fuzzy Logic Inference. In Proceedings of the 36th Annual Conference on IEEE Industrial Electronics Society, Glendale, AZ, USA, 7–10 November 2010; pp. 1773–1778.
  45. Kaipio, J.; Somersalo, E. Statistical and Computational Inverse Problems; Springer Science + Business Media Inc.: New York, NY, USA, 2005. [Google Scholar]
  46. Deb, K. Multi-Objective Optimization Using Evolutionary Algorithm; Wiley: Chichester, West Sussex, UK, 2001. [Google Scholar]
  47. Coleman, T.F.; Li, Y. An interior, trust region approach for nonlinear minimization subject to bounds. SIAM J. Optim. 1996, 6, 418–445. [Google Scholar] [CrossRef]
  48. Holland, J.H. Genetic algorithms. Sci. Am. 1992, 267, 66–73. [Google Scholar] [CrossRef]
  49. Goldberg, D.E. Genetic Algorithms in Search, Optimization, and Machine Learning; Addison-Wesley Longman Publishing Co., Inc.: Boston, MA, USA, 1989. [Google Scholar]
  50. Kumar, P.; Bauer, P. Parameter Extraction of Battery Models Using Multiobjective Optimization Genetic Algorithms. In Proceedings of the 14th International Power Electronics and Motion Control Conference (EPE/PEMC), Ohrid, Macedonia, 6–8 September 2010; pp. T9:106–T9:110.

