Article

Modeling the Liquid Water Transport in the Gas Diffusion Layer for Polymer Electrolyte Membrane Fuel Cells Using a Water Path Network

Fraunhofer Institute for Solar Energy Systems ISE, Heidenhofstrasse 2, Freiburg 79110, Germany
*
Author to whom correspondence should be addressed.
Energies 2013, 6(9), 4508-4530; https://doi.org/10.3390/en6094508
Submission received: 12 July 2013 / Revised: 15 August 2013 / Accepted: 19 August 2013 / Published: 2 September 2013
(This article belongs to the Special Issue Polymer Electrolyte Membrane Fuel Cells)

Abstract

:
In order to model the liquid water transport in the porous materials used in polymer electrolyte membrane (PEM) fuel cells, the pore network models are often applied. The presented model is a novel approach to further develop these models towards a percolation model that is based on the fiber structure rather than the pore structure. The developed algorithm determines the stable liquid water paths in the gas diffusion layer (GDL) structure and the transitions from the paths to the subsequent paths. The obtained water path network represents the basis for the calculation of the percolation process with low calculation efforts. A good agreement with experimental capillary pressure-saturation curves and synchrotron liquid water visualization data from other literature sources is found. The oxygen diffusivity for the GDL with liquid water saturation at breakthrough reveals that the porosity is not a crucial factor for the limiting current density. An algorithm for condensation is included into the model, which shows that condensing water is redirecting the water path in the GDL, leading to an improved oxygen diffusion by a decreased breakthrough pressure and changed saturation distribution at breakthrough.

1. Introduction

Water management is very important for the efficiency, stability and durability of polymer electrolyte membrane (PEM) fuel cells. On the one hand, the water has to be retained in the ionomer to avoid dehydration and performance loss due to low protonic conductivity. Dehydration also leads to membrane electrode assembly (MEA) degradation due to membrane thinning and pinhole formation [1,2]. On the other hand, the liquid water saturation in the gas diffusion layers (GDLs) must be low enough to sustain the gas transport from the gas channels to the active sites. Flooding can also accelerate degradation of the catalyst layer and the GDL due to polytetrafluoroethylene (PTFE) loss [3,4], and lead to formation of hot spots due to local reactant starvation.
If operating at high currents or in wet conditions, condensation within the GDL or the electrode can not be avoided. Therefore, the liquid water transport in the GDL is a key issue since the liquid water has to be transported efficiently to the gas channels to maintain the reactant gas transport paths to the active sites free of liquid water.
The fragile water balance can be influenced in two different ways: by regulating the operating conditions (gas flow, gas humidity and pressure, cell temperature) or by component design.
Changing the wetting properties of the GDL towards hydrophobic by adding PTFE improves the water management by avoiding water accumulation in the porous structure. The negative aspects of this approach are the reduced pore space for the gas transport by lower porosity, lower electrical conductivity and liquid water accumulation in the electrode due to the increased entry pressure into the GDL. However, different groups have shown that the cell performance and stability increases by adding up to 20 wt% PTFE into the GDL [5,6,7,8,9].
Other approaches involve changing the GDL structure to improve the water management. Adding artificial water transport channels by laser perforation has been shown to improve the water management, which is most likely due to a drainage effect in the GDL [9,10,11,12,13,14,15,16].
Due to the diversity of possible GDL designs, optimization premises the understanding of the complex and highly coupled thermodynamics of the GDL water transport and their influence on fuel cell performance. Convection, diffusion and phase change on the microscale have a significant influence on the relevant parameters and have to be considered. For specific optimization, modeling is fundamental, but simplifications have to be chosen very carefully to identify the relevant influencing factors.
In general, there are two different ways of modeling the liquid water transport in GDLs: continuum modeling and discrete modeling.
In continuum models, the transport and phase change processes in the GDL are represented by differential equations. Since the relevant fuel cell processes are mostly formulated in continuum expressions, these models can directly be combined to whole fuel cell models, including the heat, charge and mass transport, to directly capture the influence of the GDL design on the fuel cell performance.
For discrete models, the coupling to continuum fuel cell models is difficult due to the different formulation of the processes. Discrete models are often pore network models. Pore network models are very helpful for understanding the general dependencies of the liquid water transport phenomena in porous materials for fuel cells [17,18,19,20,21,22,23]. In contrast to continuum models, they are able to capture the complex liquid water fingering transport processes, observed in ex situ experiments for highly porous and hydrophobic materials [10,24]. The GDL is represented by regularly shaped pores, which are interconnected by regularly shaped throats, presuming the connectivity. The network is most often derived by interpreting mercury intrusion experiments using the Young-Laplace equation for cylindrical pores:
p = 2 γ cos Θ r p
This way, the volume of the pores with radius r p can be attributed to the penetration pressure p (with γ as the surface tension of the penetrating fluid and Θ as the contact angle between the fluid and solid). The obtained pore size distributions can easily be used as an input parameter for pore network models, since both approaches apply the same simplified representation of the pore geometry. However, the distribution of the invading fluid cannot be extracted from the measurements, and the influence of structural changes can hardly be predicted.
A step towards more realistic and applied modeling is to extract the pore network from the physical GDL structure instead of generating it by randomized processes. Luo et al. and Thiedman et al. [19,25,26] presented a topologically equivalent pore network model and extracted the network from either a stochastic fiber model or direct visualization of real GDLs. Luo et al. extracted the pore and throat geometry by applying a maximal balls concept according to Dong and Blunt [27], neglecting the influence of the material wetting properties on the network.
In highly porous materials, the breakdown of the structure to a pore space distribution with regularly shaped pores is often problematic due to the inadequate geometrical representation of the void space in-between the solid, as is obvious from the GDL cross-section in Figure 1a. The pore network does not provide a direct geometric representation of a physical porous medium, and the physical consistency is ensured by selecting a throat radii distribution function, such that the capillary pressure matches the measured data [20]. Depending on the structure and filling direction, the shape of the water in the void space can significantly differ from the regular structures in pore network models. Furthermore, each point in space can only be part of one pore or throat, despite that in Figure 1b each point in between the fibers can be part of several menisci between several fiber combinations and can, therefore, have significantly different entrance pressures.
Figure 1. Illustration of the concept of the water path network: (a) a path consists of stable menisci positions between an object pair; (b) each point in space can be part of several paths having different entry pressures (menisci radii).
Energies 06 04508 g001
To examine the influence of the GDL structure and local wetting properties, we developed a percolation model using the GDL design parameters as a direct input. This includes the distributions of fiber contact angle, fiber size and orientation, as well as spatially varying porosities. The presented model is an attempt to bridge the gap and couple the water percolation to the physical structure of the GDL. It is a novel approach to extend present discrete pore network models towards a more realistic description of the liquid water transport in the void structure of the GDL. Instead of pores that are interconnected by throats, the GDL is represented by all its possible stable water paths which are connected by unstable transitions.
The model is designed to be coupled with a continuum model describing the electrochemical and thermodynamic processes in the fuel cell in a later stage. The physics of liquid water movement in highly porous materials is very complex, and the direct discrete simulation of the water movement through the structure can become very time-consuming easily. Since an iterative coupling algorithm would demand the frequent recalculation of the percolation model during iterations, the high calculation effort makes a coupling unrealistic. However, using a network describing the connectivity of water paths dependent on the GDL structure is perfectly suited for the coupling, since the calculation effort is significantly reduced. By creating this network in a one-time computationally intensive pre-processing step, all necessary information is provided for a non-time-consuming simulation of the percolation process.
Furthermore, we developed and included an algorithm describing the discrete liquid water formation and transport due to phase change for modeling the two-phase water transport when coupling to a whole fuel cell model in future work.

2. Model Description

In Figure 2, a schematic of the different modeling steps (GDL structure generation, network generation and percolation calculation) is shown, which is described in detail in the following subsections. The generation of a stochastic GDL model containing two-dimensional (2D) objects is described first. The description of the network generation based on the GDL structure is described in detail in the following section. After defining the initial liquid water position, the network is used as a basis for calculating the water movement and the filling of the GDL, which is described in Section 2.3.
Figure 2. Schematic of the modeling steps.
Energies 06 04508 g002

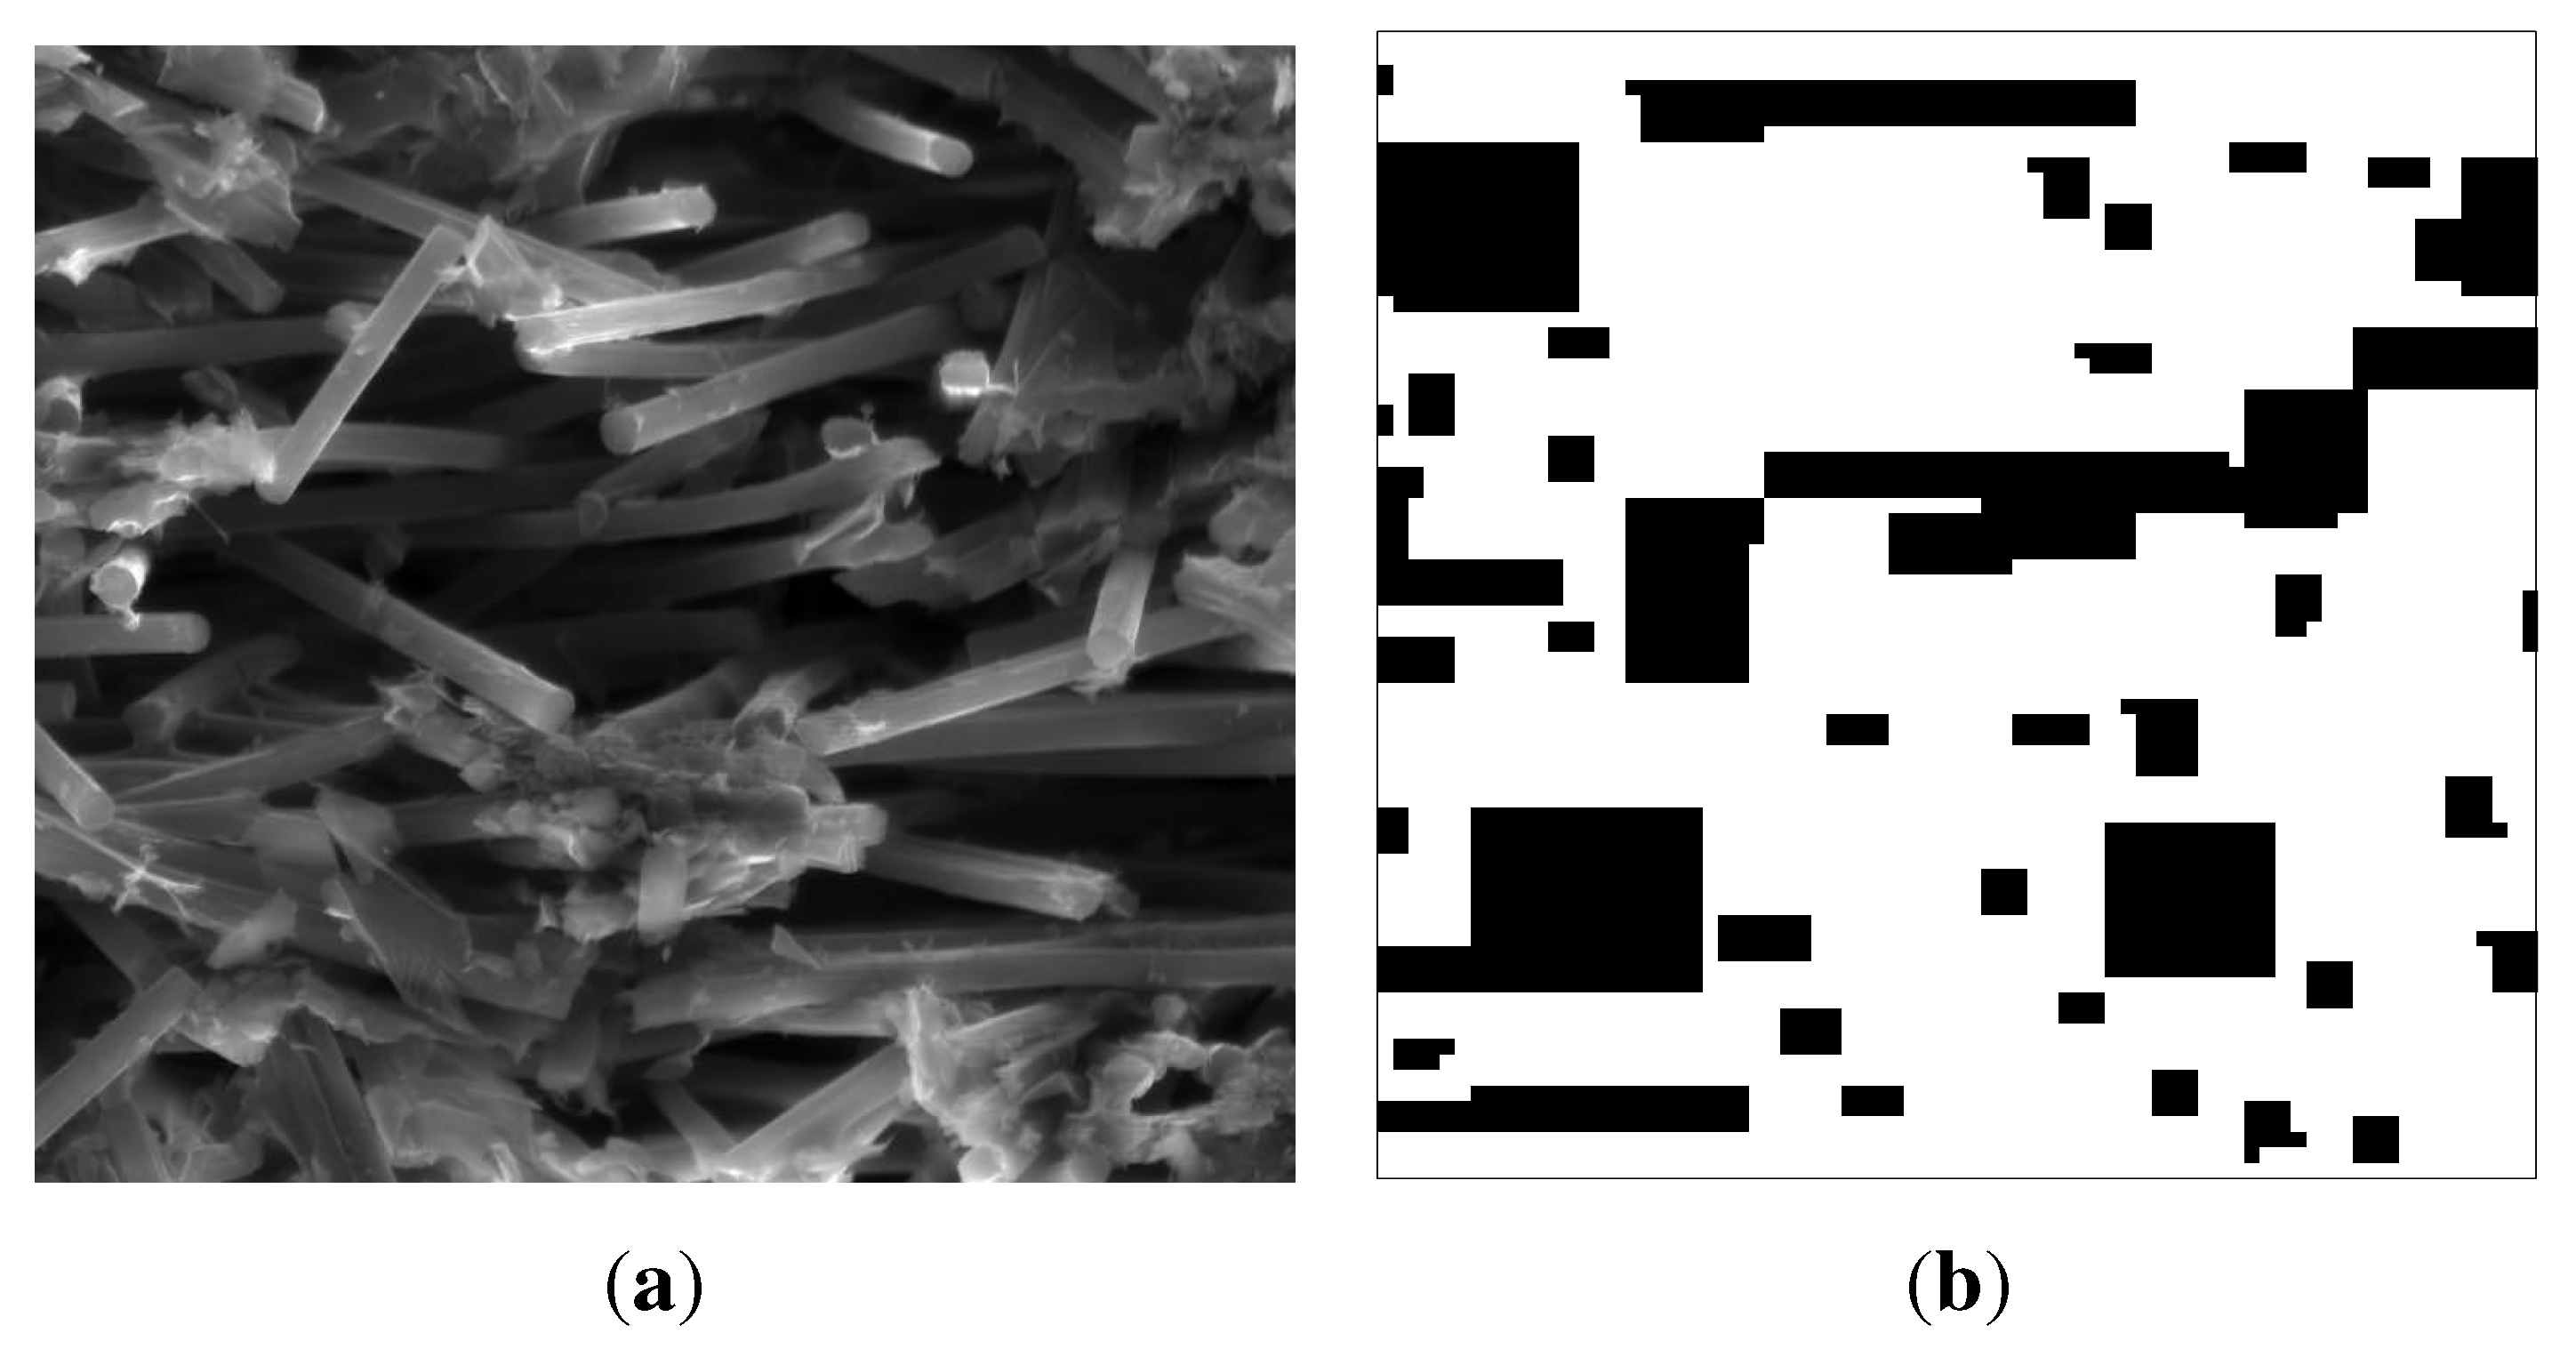
2.1. GDL Structure Generation

To demonstrate the functionality of the percolation model, a simple GDL structure generation algorithm has been developed. Optional to the described algorithm, other three-dimensional (3D) structure modeling approaches [28,29] or X-ray-based reconstructing methods [30] can also be used to generate an input for the percolation model.
The fiber-based network model is based on the 2D structure of a carbon-fiber GDL. The fibers, and PTFE in the GDL structure are represented by 2D, rectangular objects having different sizes and orientations. Even though the cross-section of a round fiber is a rectangle with two round sides, we assume that the effect of neglecting the circular shape on the liquid water transport is negligible.
The length and width of the objects, the contact angle and orientation in the visualized x/z cross-section plane (β, see Figure 1a) are normally distributed. The fibers are placed at random positions that are not occupied until a predefined porosity is reached. Intersecting objects are trimmed from the starting point until the intersection. Since the fibrous materials are produced by laying down a mat of fibers, the mean value of β is set to 0 ° , and the object orientation angle in the z/x plane (γ) is assumed to be uniformly distributed. The cross-section length of an object with width b in the visualized plane is then calculated via b × cos γ , while limited by the actual object length.
As an example for a GDL model generation, Figure 3 shows a cross-section of a Toray TGP-H-060 carbon paper with 20 wt% PTFE (Toray Industries, Inc., Tokyo, Japan; the treatment of PTFE is according to reference [31]) and a 2D representation for a GDL with the respective design parameters (porosity and fiber size/orientation).
Figure 3. (a) Cross-section of a Toray TGP-H-060 with 20 wt% PTFE (edge length is 200 μ m) and (b) the 2D representation for the same type of GDL.
Energies 06 04508 g003
The porosity can be modified locally to capture GDL inhomogeneities, like perforations or different compression levels under the land and the channel. A contact angle can be attributed to all four straight boundaries of the GDL objects separately by specifying its distribution parameters. The boundaries of the model domain are captured by four straight lines having a contact angle of 90 ° .

2.2. Network Generation

The model follows the assumption that each water filled region in the GDL is confined by at least two menisci, which are spanning between object pairs, respectively. The position of a stable meniscus between one pair moves between the pair, dependent on the liquid water pressure. When the meniscus outruns the object pair, additional menisci between further pairs are established. Based on the stable menisci positions between all the possible object pairs and their connectivity, a water path network is obtained. This network contains the information about the location of all stable water paths and their connectivity together with the pressure level, necessary to reach the subsequent path. Each point in space is no longer part of a pore or a throat, but can be part of several paths and transitions.
The presented approach describes the percolation in 2D, but would in theory also be applicable to 3D. Instead of considering menisci with two contact points and a circular meniscus, the 3D approach would have to consider more complex structures and menisci geometries. However, for the 3D approach, further, far reaching considerations are necessary, which will also result in significantly increased calculation efforts.

2.2.1. Stable Water Paths

To minimize the liquid water surface energy, the preferred shape of a free meniscus is circular. Considering a meniscus between two boundaries of an object pair, there are exactly two possible positions for a defined radius, while keeping the conditions of the contact angles in the two contact points. One of these position is for one moving direction between the pair. If neglecting all other forces than the forces by the surface tension γ, the liquid water pressure p for a meniscus with radius r can be calculated according to the Young-Laplace-equation:
p = 2 γ r
Accordingly, the radius and the position of the meniscus will change depending on p. In Figure 1a, the center of the circular meniscus travels along a straight line (path) while changing the curvature of the surface with varying pressure. The orientation of this path ( σ 1 for one moving direction and σ 2 for the other moving direction) depends on the object contact-angles ( Θ 1 , Θ 1 ) and the object surface orientations ( β 1 , β 1 ):
σ 1 = β 1 β 2 2 + β 1 + Θ 1 Θ 2 2
σ 2 = β 2 β 1 2 + β 2 + Θ 2 Θ 1 2
For equal object contact angles, the path is the bisecting line of the object pair in both penetration directions.
Starting from an entering point in a path, the liquid water will fill up the path to the position, with p corresponding to the actual liquid water pressure.

2.2.2. Unstable Menisci Transition

If the liquid water pressure is high enough for the stable meniscus to move to the end of a path, it transfers through several positions into one or several following stable paths. These unstable water transitions are temporary liquid water positions and represent the connections between the stable water paths in the network. The physics behind these transitions is very complex. However, we assume that for the percolation process, the stable positions are the most influencing, and we capture these transitions in a significantly simplified way as described as follows.
At the end of a path, we differentiate between three scenarios (see Figure 4):
  • the touching point of the object pair is reached;
  • a third object interrupts the meniscus in the path;
  • one of the contact points outruns the object.
Figure 4. Illustration of the three different scenarios and the splitting of the stable meniscus in two unstable menisci (UM1 and UM2) at the end of a path: (i) a dead end is reached, and no unstable meniscus (UM) is established; (ii) a third object interrupts the meniscus; and (iii) the meniscus outruns the traversed object, and two different possible scenarios are considered (A and B).
Energies 06 04508 g004
In case (i), no new path is contacted (dead end). In cases (ii) and (iii), one or several following paths are contacted (junction) after the unstable transition has finished. For both cases (ii) and (iii), the starting point for these unstable transitions are two menisci, which span between a new found contact point and the two contact points at the end of the path. If the meniscus is interrupted [case (ii)], the new menisc form between the splitting point and the two old contact points. If the contact point outruns the object [case (iii)], a new contact point for the new menisci can be found using two different approaches. On the one hand, the meniscus can form a bubble with an increasing diameter, while keeping both contact points. In this case, the new contact point is the place where the bubble touches a third object first. On the other hand, the bubble can burst and disperse in the direction of the ending contact point. Then, the new contact point is the intersection point of a straight line through the old contact points with the closest object in the direction of the ending object. In all cases, both scenarios are calculated, and the later scenario is only chosen if the length of the distance between the new contact points is smaller than a threshold value, which is estimated to be 1.4-times the distance between the old contact points.
Since the two new menisci do not necessarily maintain the conditions of contact angle and circular shape, they do not represent stable positions. Thus, the surface tension and the liquid water pressure force the meniscus to change its position and shape until the contact angles with the contacted objects matches the material properties. In the presented model, this movement is represented by rotating the meniscus around one of the contact points. The rotation direction and the rotation point are chosen in a way that the meniscus moves in the direction of the stable position and in the direction of the liquid water movement. If this movement can be executed without interruption until the meniscus turns stable, the position in the new path is the stable position. If the moving contact line is interrupted by a third object before a stable position is reached, the newly contacted object splits the meniscus again, creating two further unstable menisci as in case (ii) in Figure 4. The old meniscus continues rotating around the touching point until it is interrupted again, creating three new unstable menisci. If one of the contact points reaches the end of the object, the rotation direction is turned first, before new unstable menisci are created according to case (ii) in Figure 4, if it is interrupted again.
By this subsequent splitting of the menisci during the unstable meniscus transition, several following paths can be reached at the end of each stable path.

2.3. Liquid Water Percolation

In our model, we simulate the slow invasion of liquid water into the GDL pore structure. Therefore, dynamic effects are neglected and the liquid water pressure is assumed to be uniform throughout the GDL.
In fuel cell operation, the GDL is filled with liquid water generated by the electrochemical reaction from the boundary facing the catalyst layer. Therefore, both fillings during the operation and during an injection experiment are simulated identically, and water is injected through one of the GDL boundaries. At this boundary, a constant pressure boundary condition is applied, and the saturation distribution for an injection pressure is defined by increasing the pressure to the corresponding magnitude. During the percolation process, an increasing number of stable paths are contacted with liquid water, which we denote as “activated”.
If assuming that the liquid water is drained out of the electrode by growing spherical liquid water droplets, the droplets will grow into the GDL pores adjacent to the electrode until they touch the first object. Before an external pressure (over the boundary of the GDL) is necessary for the further percolation, the spheres will grow and move on the electrode surface until they touch a second object. Hence, if assuming a contact angle of 90 ° of water on the electrode surface, semicircles on the electrode surface touching two objects are the starting condition for the percolation process. The water lines between the two contact points on the electrode surface and the two contact points with two objects can be interpreted as three unstable menisci for each semicircle, respectively. Thus, the initially activated paths are found using the algorithm for the unstable menisci transition (Section 2.2.2. ).
As described before, each path can have several transitions and therefore, following stable paths at its end. The criterion for the activation of each following path is that the liquid water pressure is higher than the invading pressure at the end of the old path. If a path is activated, the liquid water pressure defines to which level the path is filled and if its following paths are activated in the case of a complete filling.
When simulating an injection experiment, the liquid water pressure is increased, and the liquid water distribution for a predefined water inlet pressure is reached if no further paths can be activated at this pressure.

2.4. Phase Change

Condensation and evaporation can have a significant influence on the injection process and cannot be neglected when simulating the liquid water distribution during fuel cell operation.
Therefore, condensation can be included in the model via a partly pixel-based algorithm. The input for the condensation algorithm is a dimensionless matrix q ( j , k ) , representing the condensation [ q ( j , k ) > 0 ] and evaporation [ q ( j , k ) < 0 ] source terms at position ( j , k ) . q ( j , k ) depends on a couple of parameters, like the relative humidity, temperature and saturation distribution. However, since these parameters are not considered in the percolation model, we postulate a constant q ( j , k ) that is also independent of the actual liquid water distribution to demonstrate the importance of considering phase change. When coupling the discrete model to a whole fuel cell model in future work, q ( j , k ) is calculated using a continuum approach. Since q ( j , k ) is dependent on the saturation distribution, it will change in the course of an iterative coupling algorithm, since the saturation distribution will, in turn, also change the water vapor distribution.
The translation of the continuum variable q ( j , k ) into the discrete percolation approach is described in the following.
The position of the maximum in q ( j , k ) is assumed to be the condensation nucleus for the condensed water propagation. From this point, water droplet growth starts at the closest object surface until a second object is touched. The two contact points on the two objects represent the contact points of two unstable menisci moving in opposite directions. Using the same algorithm as for the unstable menisci transition, the menisci moves through the GDL until the next stable paths are found. The stable paths are then considered to be the starting condition for a subsequent filling procedure, as described in Section 2.3.
During the filling, the liquid water pressure increases, and the corresponding binary saturation distribution s ( j , k ) is calculated using the percolation algorithm described before. The filling is stopped if the sum of the source terms is equal or lower than the sum of the sink terms in the water filled regions:
j , k q ( j , k ) · s ( j , k ) < = 0
or the liquid water reaches the GDL surface. Subsequently, q ( j , k ) is set to zero in the water filled regions, and the next starting point is the place with the highest source term [ q ( j , k ) > 0 ] again. This procedure is repeated until all entries in q ( j , k ) are equal to or smaller than zero. After the condensation process, evaporation source terms [ q ( j , k ) < 0 ] are only present in regions with no liquid water and are therefore, not considered further.
If considering a region that is filled with condensed water, some of the water will eruptively drain into adjacent regions, if they have a lower entry pressure than the capillary pressure of the filled region. Compared to the percolation during a liquid water injection experiment, condensation fluxes in a fuel cell are rather low and therefore, the flux is not high enough to refill the drained regions with liquid water quickly. Thus, some regions will be filled with liquid water only part of the time even though q ( j , k ) is positive (constant condensation). This behavior of liquid water within hydrophobic materials is also known as Haines jumps [32,33] and is dependent on the entry pressure and capillary pressure distribution. It can have significant influence on the oxygen diffusion in hydrophobic GDLs since without consideration, even a hydrophobic GDL would be fully saturated by condensed water in over-humidified conditions.
To account for these effects, we have to find an estimate for a local saturation that is both dependent on the local entry pressure and the entry pressure in its vicinity. According to Figure 5, the filling level of a region depends on (i) the necessary capillary pressure to hold the water in a region and (ii) the pressure at which the liquid water can be drained into an adjacent region. The higher the necessary capillary pressure to hold the water in a region, the lower is the temporal average saturation in this region.
Figure 5. Illustration of the influence of the capillary pressure distribution p c (represented by the size of the circles in the pores) on the temporal average liquid water saturation (represented by the filling levels of the circles).
Energies 06 04508 g005
Furthermore, if the pressure threshold for draining the water into the adjacent regions is smaller than the necessary capillary pressure to hold the water in this region, a higher difference between this pressure and the threshold results in a lower saturation. The physics and couplings behind this effect are very complex, beyond the scope of the described modeling approach and normally neglected in state-of-the-art condensation models. However, we approximate the general dependencies by setting the local saturation in the water filled regions to the temporal mean value. Therefore, we combine two saturation distributions, s 1 and s 2 , which describe the dependency on both effects. s 1 depends on the minimal capillary pressure p c , m i n to hold the water, which is the lowest capillary pressure of all water filled paths containing this location. s 2 depends on the difference between p c , m i n and the pressure at which the liquid water can be drained into an adjacent region. This drainage pressure p c , t is the lowest pressure at the end of all activated paths containing this location.
s 1 = K T , 1 p c , m i n if   p c , m i n > K T , 1 1 if   p c , m i n < K T , 1
s 2 = p c , t p c , m i n + K T , 2 K T , 2 if   0 > p c , t p c , m i n > K T , 2 1 if   0 < = p c , t p c , m i n 0 if   K T , 2 > = p c , t p c , m i n
The threshold values, K T , 1 and K T , 2 , are set to the values: K T , 1 = 200 Pa, K T , 2 = 1 × 10 4 Pa. Since both the conditions for s 1 and s 2 have to be fulfilled to result in a high final saturation, s 1 and s 2 are combined to a final saturation s g e s by:
s g e s = s 1 · s 2
Considering that liquid water both by condensation and by injection is filling the porous structure, the temporal progression of the processes is a problem. Water cannot condense where liquid water is already present, and water which is forced into the GDL by injection into the GDL will travel preferably along a path where water has already condensed before. In a real fuel cell, both processes will take place more or less simultaneously. The order depends on the history of the fuel cell and how the current and operating conditions are changed during a polarization curve, for example. In our model, we assume that the liquid water distribution by condensation is completed before the injection process takes place. If the liquid water front formed by injection reaches a liquid water region that was formed by condensation, all paths and transitions that were active at the termination of the condensation process are activated. This way, the water movement continues at the boundaries of the condensed region.

3. Results and Discussion

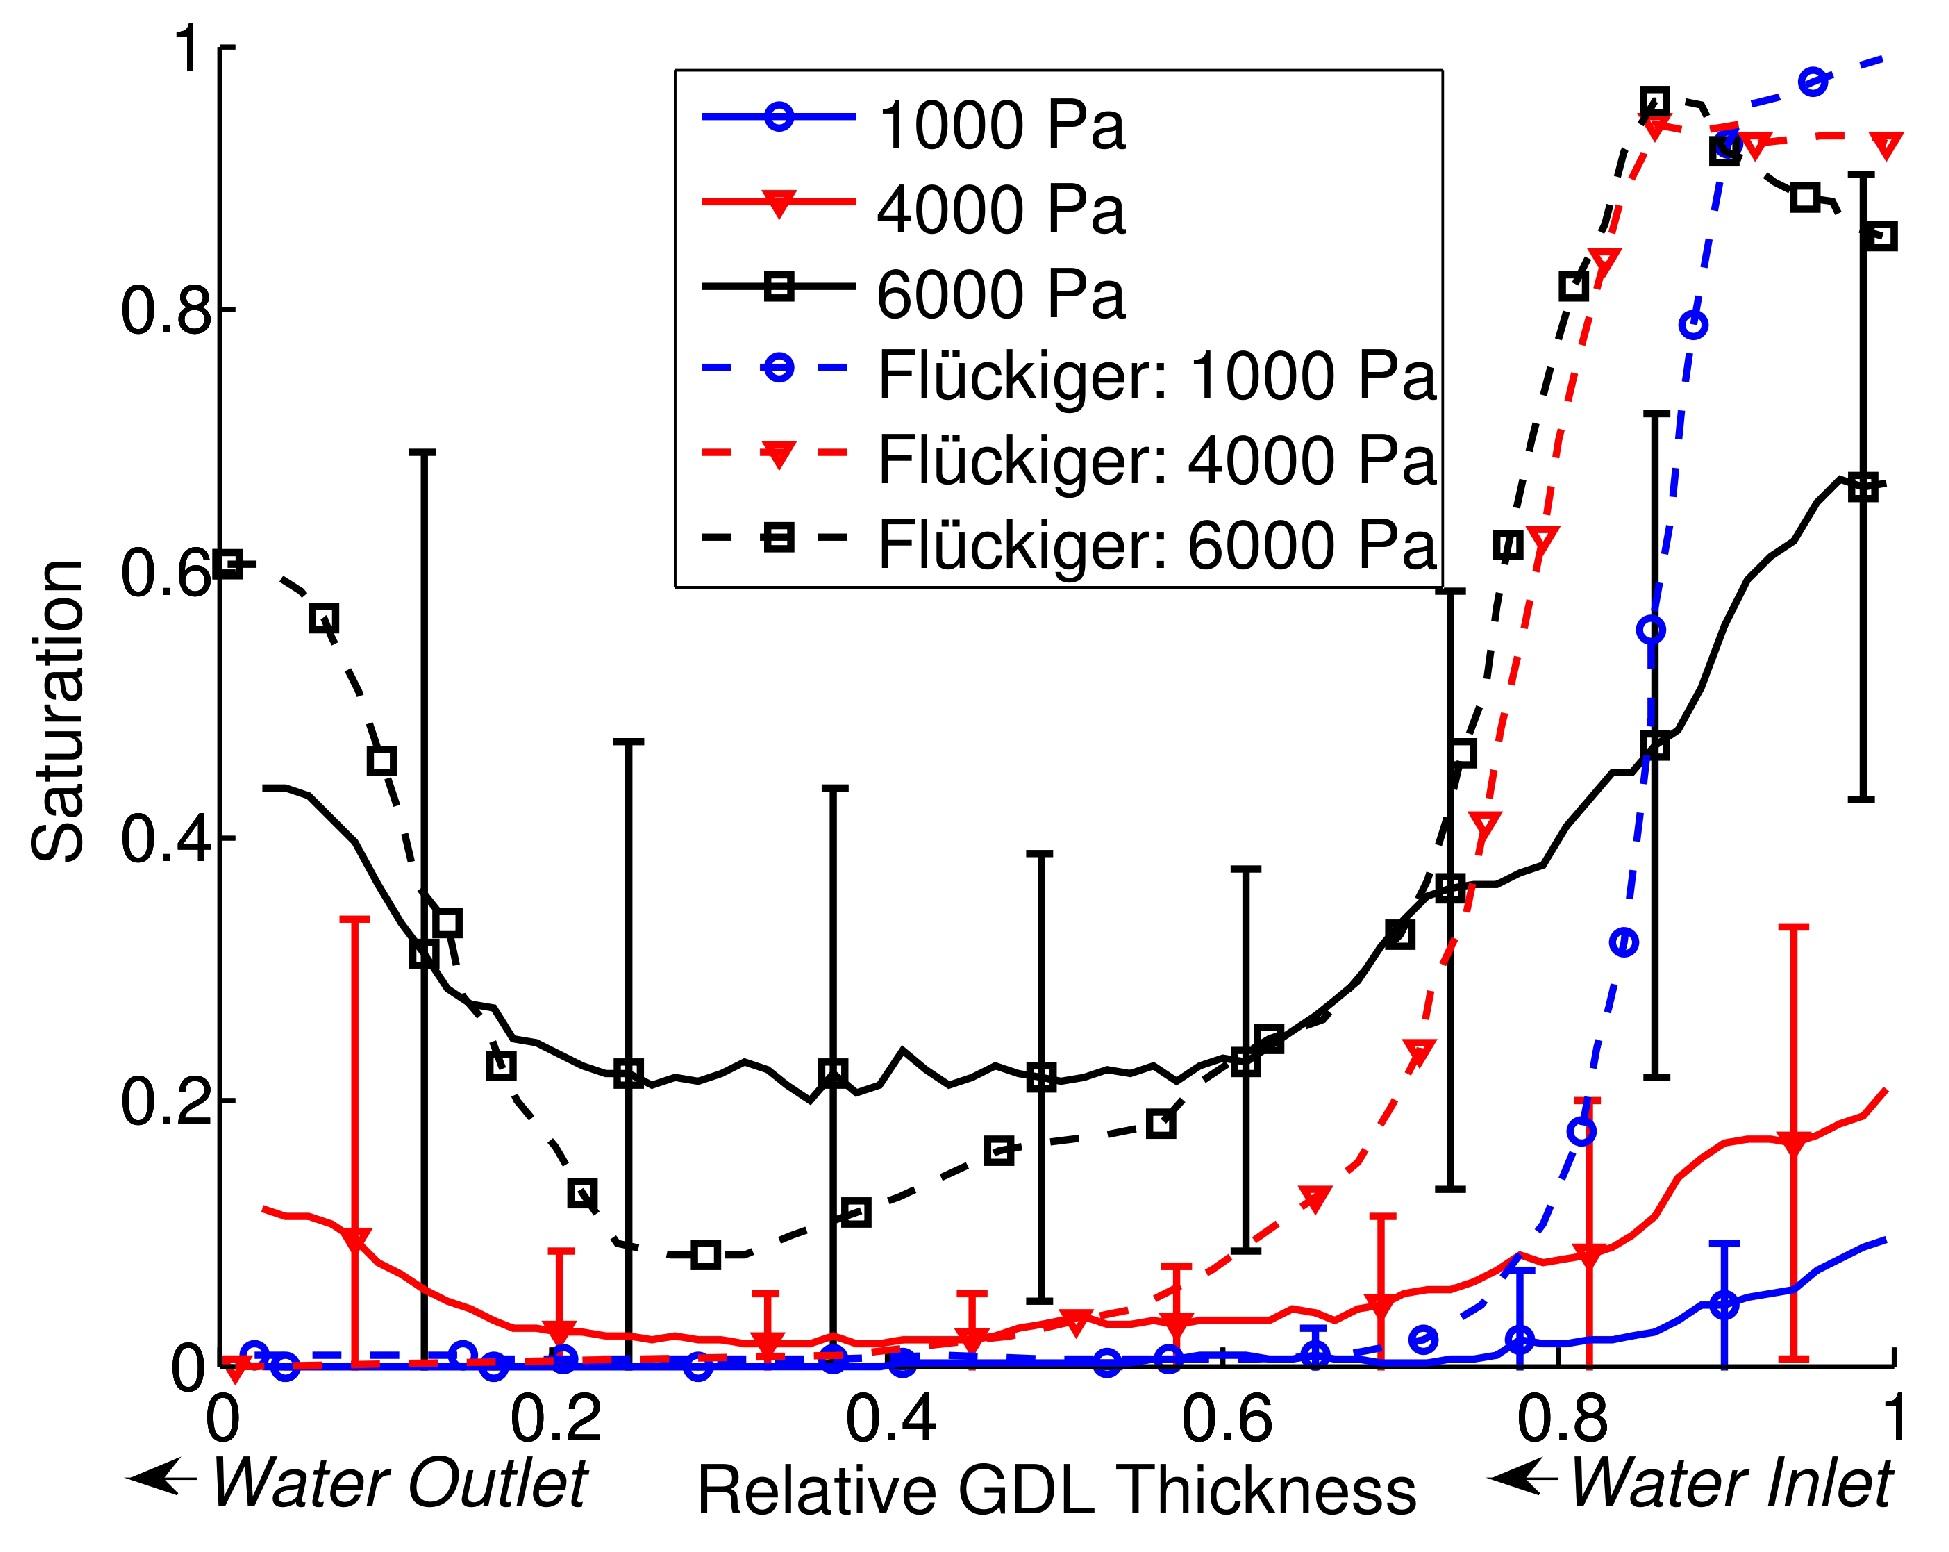
3.1. Saturation Distribution

For the comparison of the water inlet pressure-dependent saturation distribution, only a little experimental data is available in the literature. Flückiger et al., Kim et al. and Utaka et al. [34,35,36] presented saturation distributions in GDLs at different water inlet pressures using X-ray visualization.
In Figure 6, the result of a numerical intrusion without phase change is compared to experimental ex-situ synchrotron visualization data by Flückiger et al. [34]. Shown are the calculated and measured one-dimensional saturation profiles over the thickness of a GDL at three different water injection pressure levels. For the computed data, the mean values and standard deviations of twenty stochastically generated models are shown. The experimentally determined properties of the same carbon paper GDL are used as model input parameters (Table 1, Toray TGP-H-060) and as used in the experiments by Flückiger et al.
For the experimental data, Flückiger et al. could also extract the local porosity by analyzing the 3D X-ray adsorption data. They found that the porosity varied over the GDL thickness and is between 0.8 and 0.6 in the middle of the GDL and increases to 1.0 towards the surfaces of the GDL. They attribute the variation to the production process of the GDL and correspondingly found a significantly increasing saturation towards the GDL surfaces due to the locally reduced capillary pressure. Bending of the GDL due to the water pressure could also have played a role during the experiments. However, we assume that a saturation of 1.0 close to the electrode interface in a fuel cell is not realistic, since this would totally block the oxygen transport to the active area and consequently, stop the current and water generation. For the model data, a homogeneous porosity distribution is used, which results in a lower saturation towards the GDL surfaces. Disregarding the saturation at the GDL surfaces, the saturation profiles show a good correspondence at all pressure levels. The saturation profiles decrease from the inlet surface towards the middle of the GDL with similar shapes. The breakthrough pressure is between 4–6 kPa for the experimental and 4 kPa for model data. Especially towards the outlet, the standard deviations of the model data shown in Figure 6 are rather high. The average standard deviation over the whole GDL is 45% of the mean value at 6 kPa. This shows that especially for the breakthrough pressure, stochastic influences are quite high in the 220 × 1000 μ m domain. The high standard deviation is consistent with confined breakthrough locations caused by regions with lower intrusion pressure. This “fingering effect”was also found in different percolation experiments [10,24].
Figure 6. Saturation profile over the thickness of a Toray TGP-H-060 GDL from the water inlet interface (right) to the water outlet interface (left). The calculated data for three different pressure levels are compared to synchrotron visualization data by Flückiger et al. [34] for the same type of GDL.
Energies 06 04508 g006
Table 1. Model input parameters for Toray paper GDLs with different thicknesses (TGP-H-060 and TGP-H-120) and PTFE contents (0 wt%, 10 wt% and 20 wt%). μ is the mean value; σ is the standard deviation.
Material b / μ m β / ° Θ / ° Domain size/ μ m Porosity
μσμσμσhw
Toray TGP-H-0609[17]202 220[37]1000-
Toray TGP-H-1209[17]202 380[37]1000-
Toray 0 wt%----97[38]20--0.78[38]
Toray 10 wt%----107[38]20--0.76[38]
Toray 20 wt%----109[38]20--0.73[38]

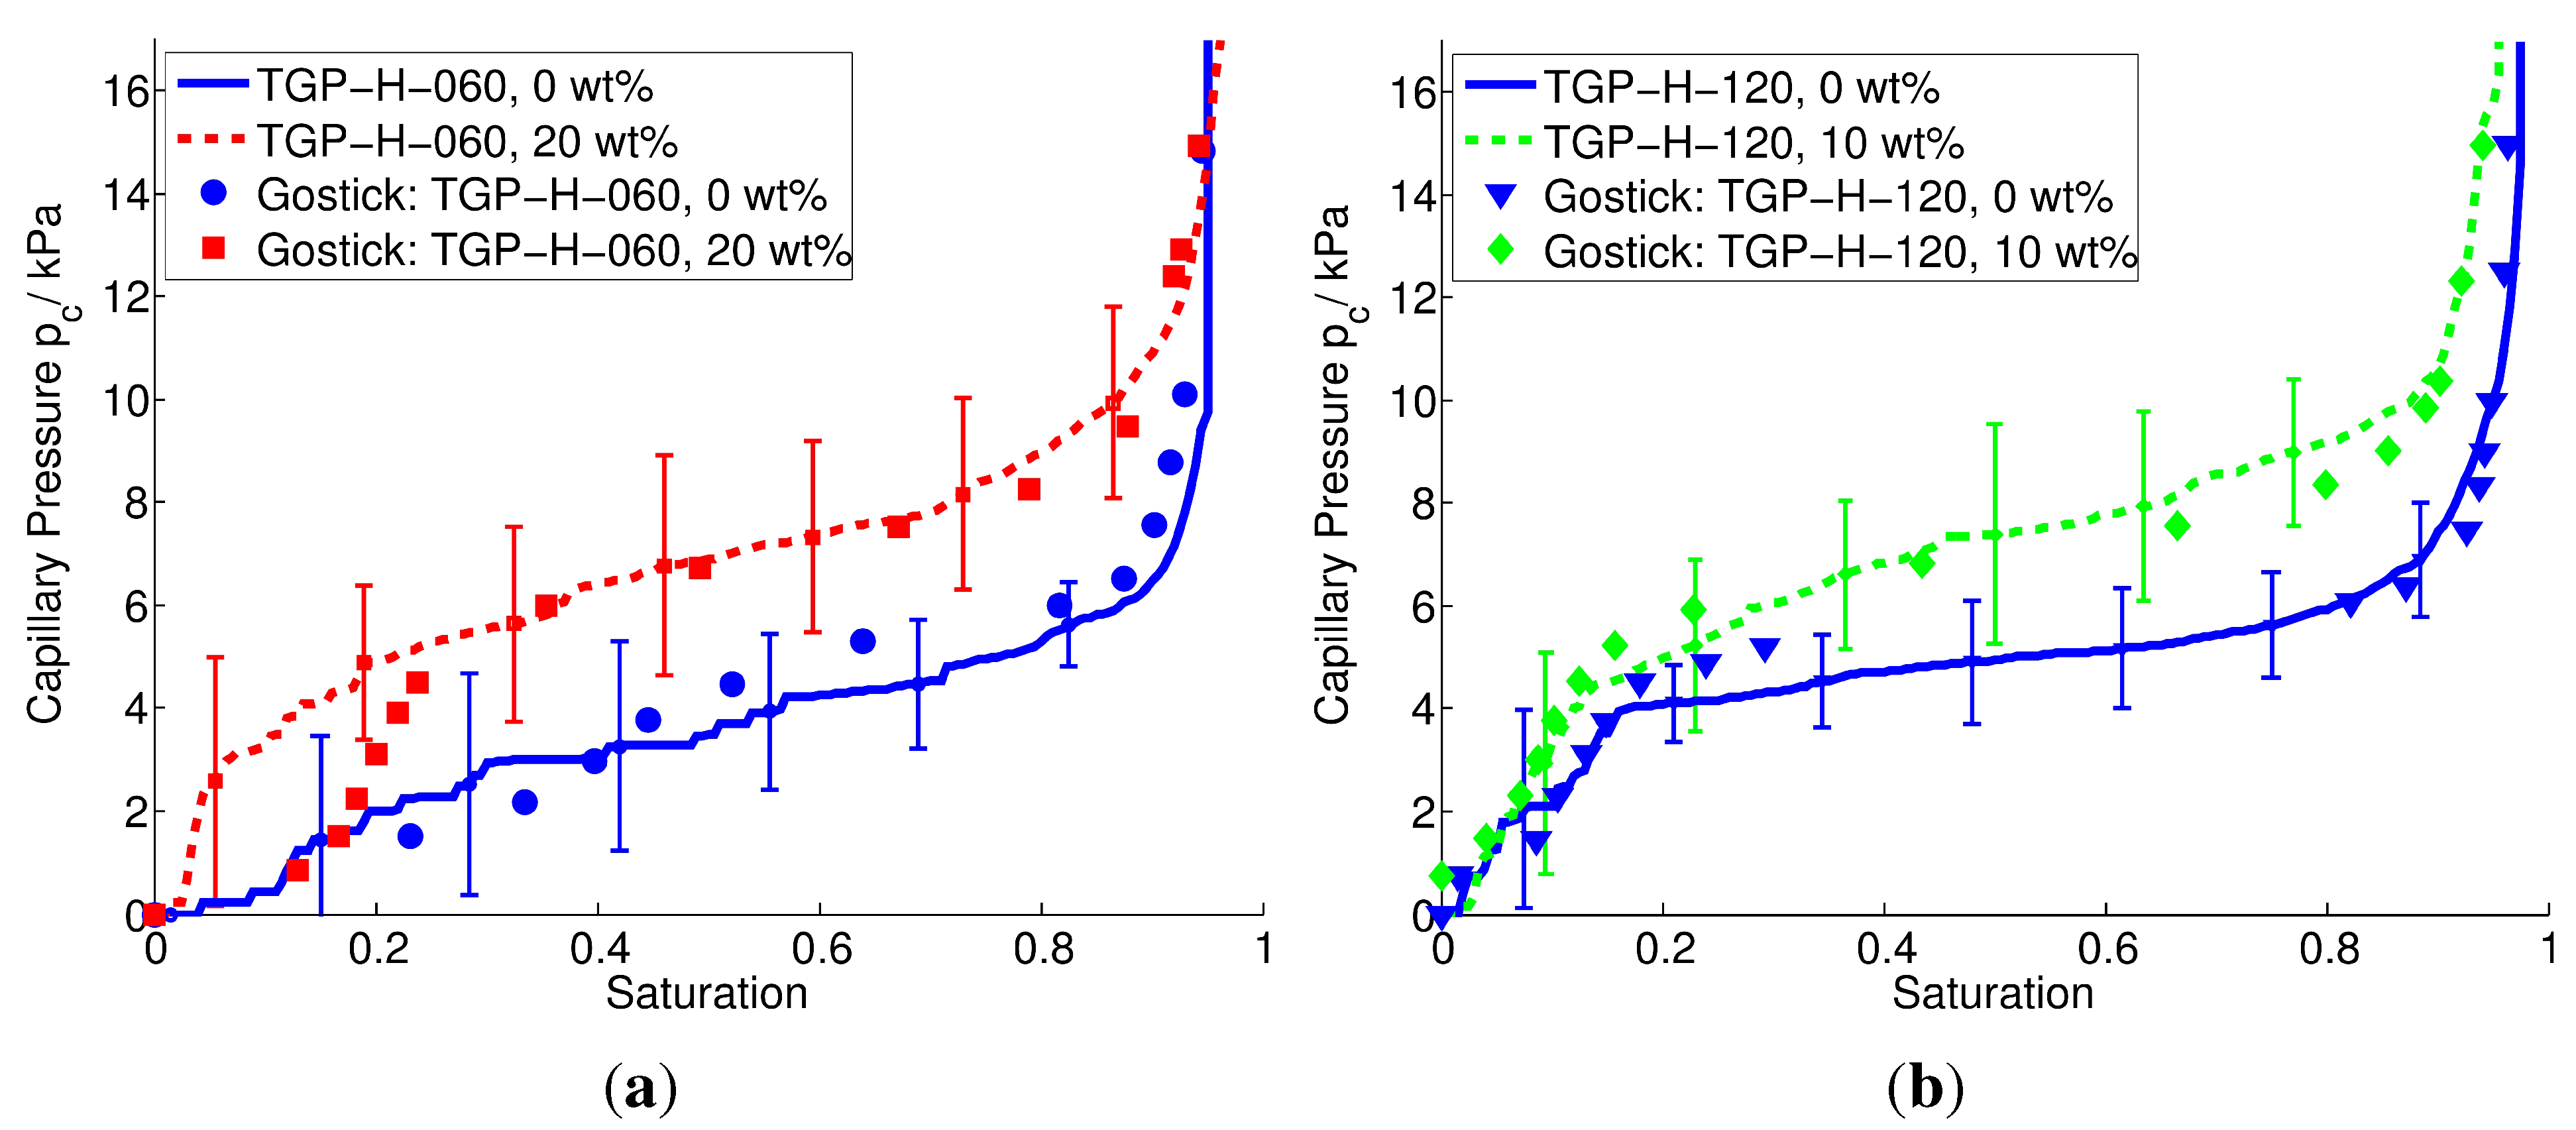
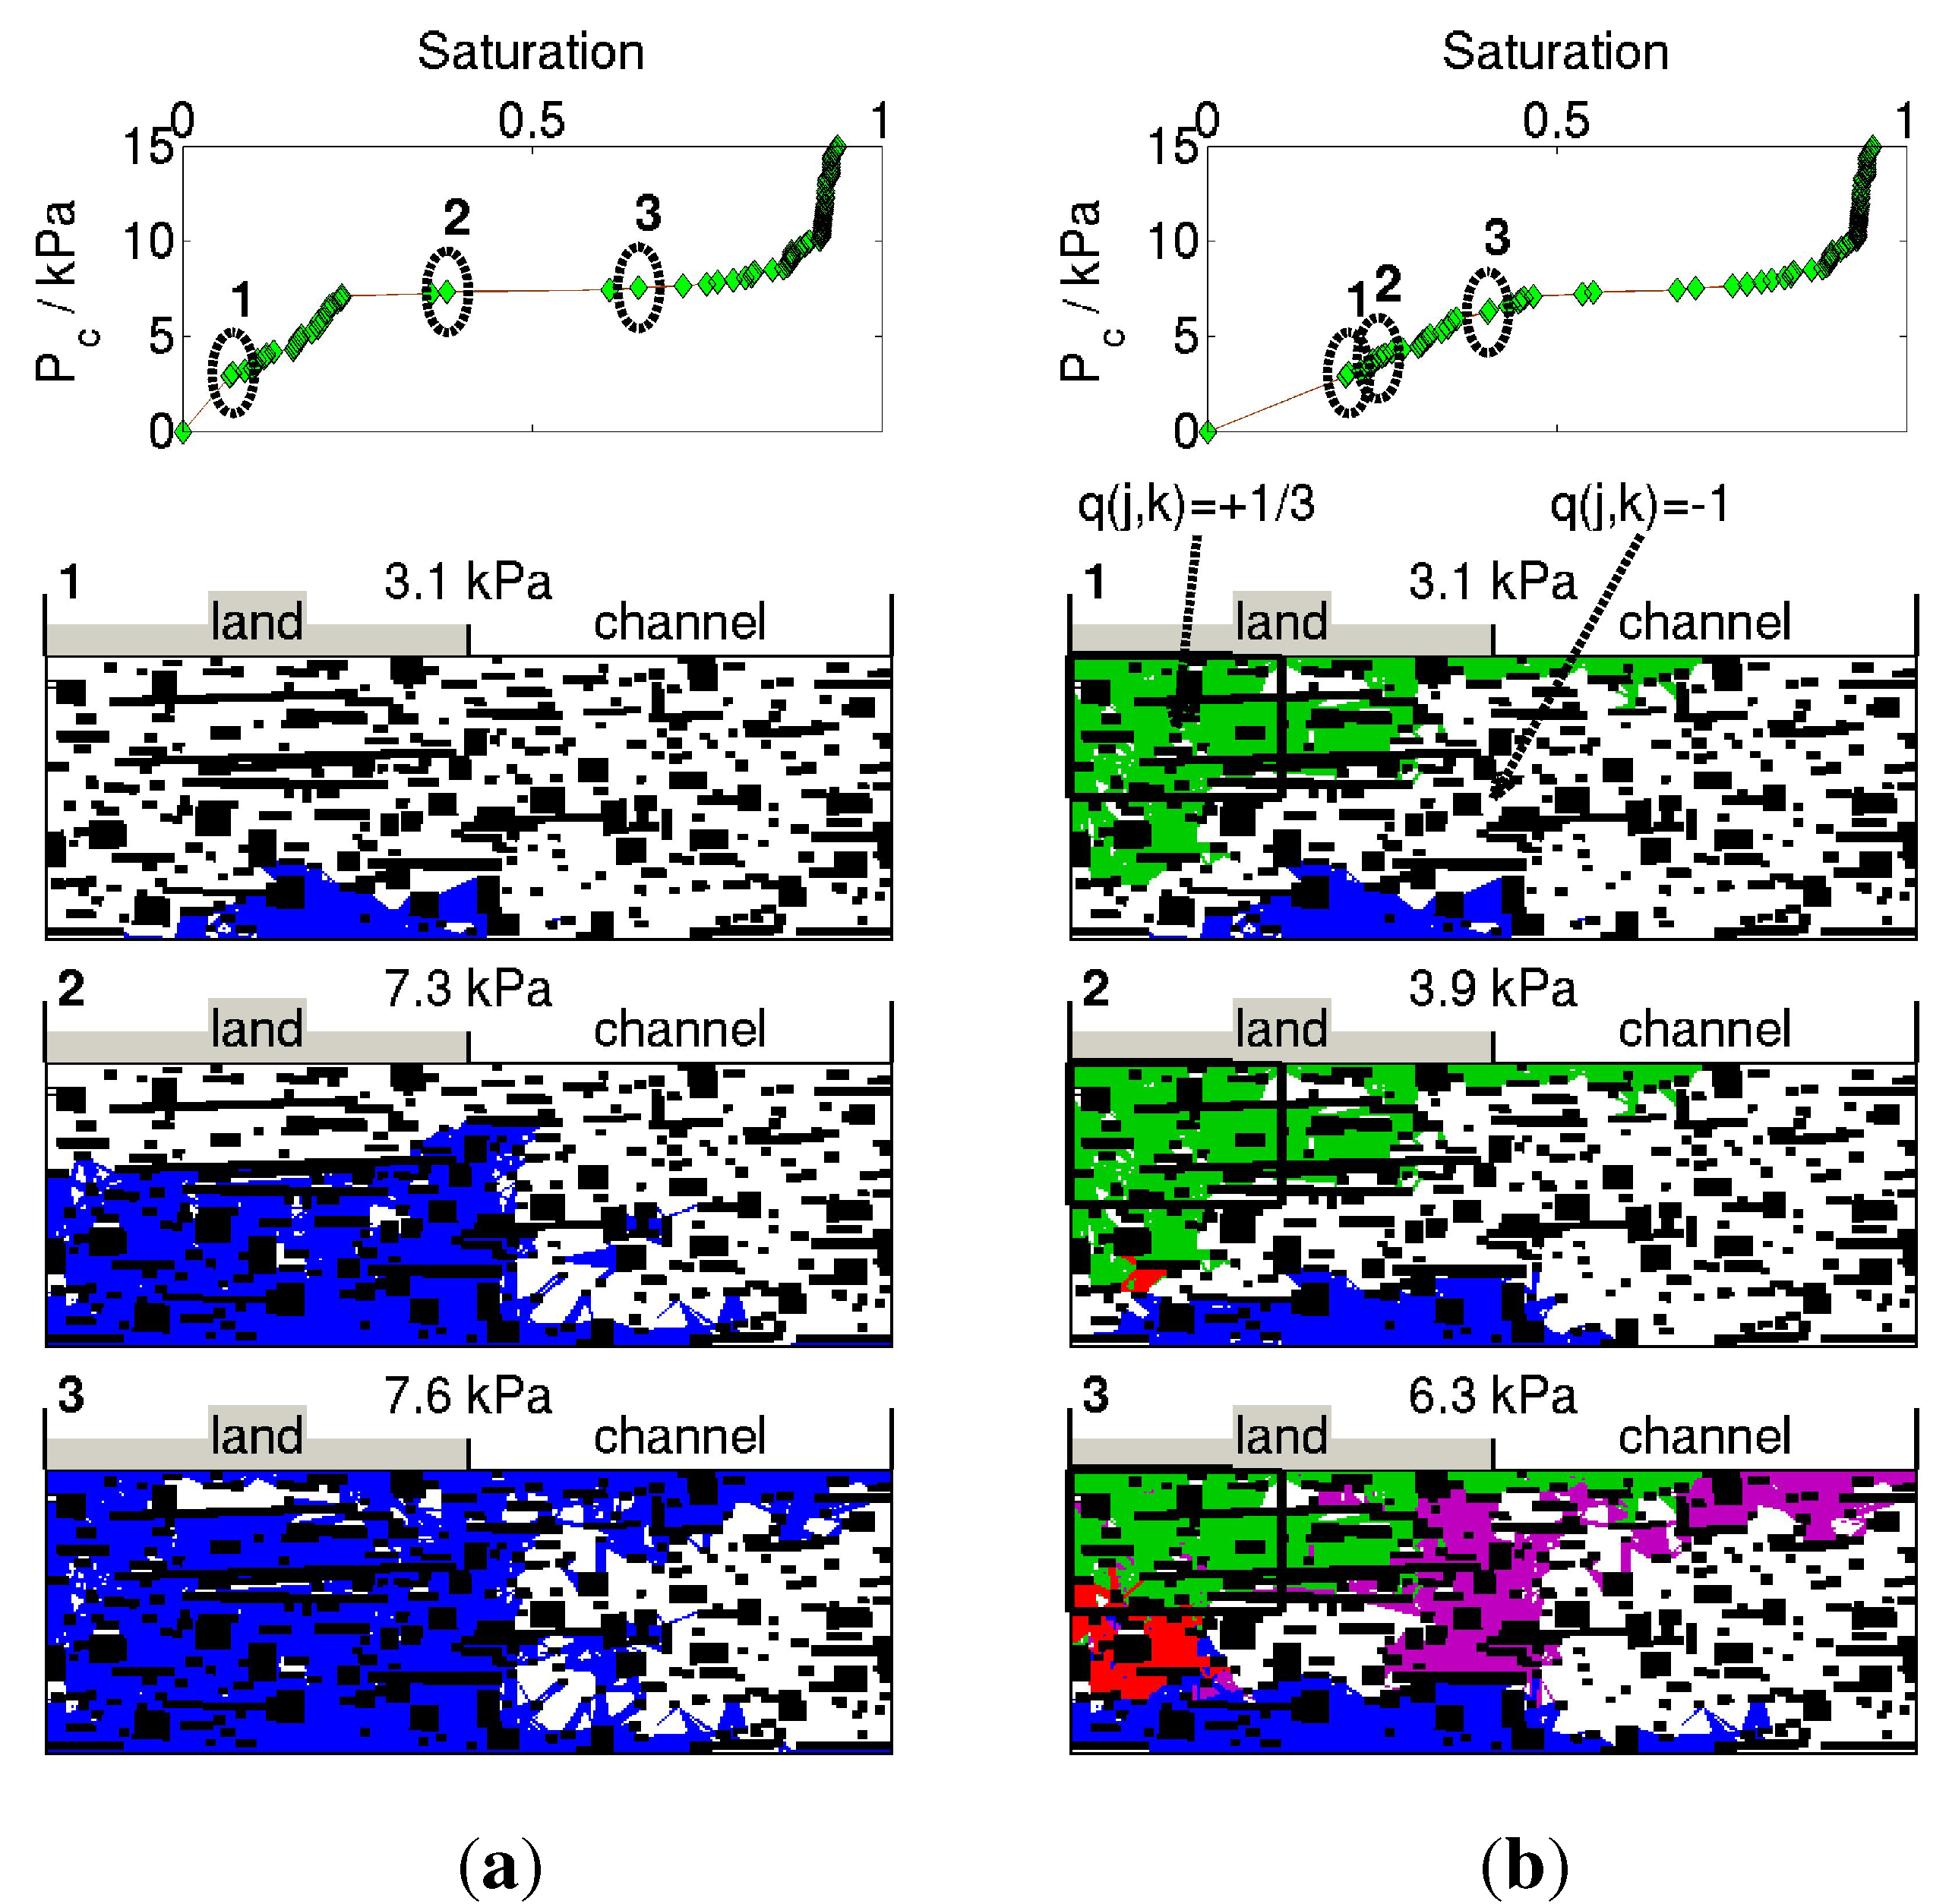
3.2. Capillary Pressure-Saturation

In Figure 7a, the capillary pressure-saturation curves for Toray TGP-H-060 GDLs with 0 wt% and 20 wt% PTFE, and in Figure 7b, the thicker Toray TGP-H-120 GDL with 0 wt% and 10 wt% PTFE, are compared to data from water injection experiments by Gostick et al. [37]. For the model data, the mean values and standard deviations for injection simulations without phase change and twenty different GDL realizations are shown. Even though the data are in good agreement, there is a deviation in the low pressure region of the thinner TGP-H-060 GDL. Since the data for the thicker TGP-H-120 GDL show very good agreement, GDL surface effects either in the modeling or experimental data might be the reason for the deviation, since the impact of these effects is higher at lower thicknesses. However, in the experimental data, the saturation is already 0.15 at p c < 1 kPa, which is rather unlikely for hydrophobic GDLs.
Figure 7. Calculated capillary pressure-saturation curves for (a) Toray TGP-H-060 and (b) Toray TGP-H-120 with different PTFE content. The mean values and standard deviations of twenty GDL realizations are compared to data derived by Gostick et al. [31] for the same type of GDL.
Energies 06 04508 g007
Figure 8a shows the simulated injection process by the liquid water distribution in a Toray TGP-H-120 with 10 wt% PTFE for three different water inlet pressures (Figure 8b is described in the following section).
The reason for the sharp rise in the capillary pressure-saturation curve at low saturation (label 1 in Figure 8a) is two-fold. According to the Young-Laplace equation [Equation (1)], the water can only fill the largest pores at low pressures, which are relatively scarce. Furthermore, only a fraction of the paths are activated and have yet contacted with the injected fluid. If a pressure threshold of about 7 kPa is reached, the slope of the curve drops (label 2 in Figure 8a). Here, both the number of contacted paths and the number of paths with the respective entry pressure (“large pores”) rapidly increase. At a saturation higher than 0.8 (label 3 in Figure 8a), almost all paths are contacted, but with increasing pressure, the number of paths with the respective entry pressure decreases. Furthermore, with increasing entry pressure, the filling volume of the paths and thereby, their potential to increase the saturation, is decreasing.
Figure 8. Capillary pressure-saturation curve and saturation distribution for three pressure levels during the injection process (injection is from the bottom interface), (a) without and (b) with condensation using the same GDL model. For the condensation simulation (b), the saturation distribution at the same pressure level is compared to the distribution without condensation, and the water filled regions are colorized according to the different filling processes—green: by condensation only; blue: by injection without condensation; red: by both the condensation and the injection without condensation; purple: by injection with condensation. The model is generated using the parameters for a Toray TGP-H-120 with 10 wt% PTFE from Table 1.
Energies 06 04508 g008

3.3. Oxygen Diffusivity

The effective oxygen diffusivity for the unsaturated GDLs and for the saturated GDLs at breakthrough are evaluated using a simple 2D continuum diffusion model. The spatial distributed oxygen diffusion coefficient is set according to the distribution of liquid water, solid (fibers) or free pore space. In the place where neither liquid water nor matter is present, the oxygen diffusion coefficient in air D 02 , a i r is set according to the Chapman-Enskog formula [39]:
D O 2 , a i r = 3 . 2 · 10 5 · T 353 1 . 5 · 1 p
In 2D, the diffusion resistance around an object will be overestimated, because the fiber diameter is significantly smaller than the length. To account for this effect, we apply a simple approximation and set the diffusion coefficient in the place of the fibers to a nonzero value, which is approximated with respect to the orientation and size of the fibers. In 3D, the oxygen will mainly diffuse along the shortest path around the circumference of a fiber, and the mean path length can be estimated as 1.5b, with b as the edge length of a quadratic cross-section of the fiber (see Figure 9). In contrast, the mean diffusion path length around a fiber projected into a 2D plane is l / 2 + b , with l as the projected length rectangular to the mean diffusion direction (perpendicular to the GDL thickness). The difference is compensated by allowing a diffusion flux through the solid. A simple flux balance finally results in:
D f = D O 2 , a i r · 2 3 2 b l + 2 b
Figure 9. Schematic of the approximation oft the mean diffusion length around an object with length l and width b. For diffusion around an object, with a quadratic cross-section, one applies l = b.
Energies 06 04508 g009
For accounting effects that result from the transfer of the 3D to a 2D saturation distribution on the oxygen diffusion, a quasi 2+1-dimensional approach is applied, which is described in the following. In a fuel cell running at high current density and high humidity, the product water enters the GDL in the interface towards the electrode mostly in the liquid state due to the low water uptake capacity of the gases. The saturation distribution will be most similar to the saturation distribution at breakthrough. Here, the liquid water flux through the established liquid water path to the GDL surface is high enough to transport the water from the interface to the channel in the liquid state. Regarding the calculated and measured breakthrough-saturation distribution in Figure 6, the liquid water saturation at the electrode interface is the highest and decreases towards the surface facing the channel. Meanwhile, the current production will be almost proportional to the saturation or electrode surface coverage in this interface. Therefore, to account for the reduction from 3D into two, we set the local diffusion coefficient of oxygen D O 2 ( x , y ) , linearly dependent on the mean saturation of multiple realizations s(x,y).
D O 2 ( x , y ) = ( 1 s ( x , y ) ) · D O 2 , a i r
For this purpose, we stochastically generate several model realizations with the same stochastic input parameters, and the local saturation s(x,y) is set to the mean value of the liquid water distribution of the different realizations.
The effective Ficks GDL bulk diffusion coefficient D b is finally calculated via:
D b = j O 2 · h Δ c
where j O 2 is the calculated oxygen flux over the GDL boundaries; h is the GDL height; and Δ c is the predefined average oxygen concentration difference between the inlet- and outlet-boundaries. The oxygen concentration at the interface towards the electrode is set to 0 vol% and 21 vol% at the interface facing the channel. By using Faraday’s law, an upper limit for the limiting current density in a fuel cell, i l corresponding to j O 2 , is calculated:
i l = j O 2 · n · F
with n = 4 as the number of electrons transferred by one oxygen molecule and F as the Faraday constant.
One-hundred twenty GDLs are generated using the parameters shown in Table 1 for a Toray TGP-H-120 paper with 20 wt% PTFE, but with porosity reaching from 0.61 to 0.84 as an input. Then, the models are sorted according to their porosity before the moving average of the saturation distribution at breakthrough and the porosity of a subset of twelve subsequent models is calculated. The local diffusion coefficient is then calculated according to Equation (11).
Figure 10 shows i l and the diffusivity dependent on the mean porosity ϵ of the twelve models for T = 320 K and p = 1 atm. Both i l with the unsaturated GDL and with the saturation at breakthrough with and without condensation under the land is shown. For comparison, i l , according to the Bruggemann correlation:
D f = D O 2 , a i r · ϵ 1 . 5
is also shown which is widely used in fuel cell modeling.
Figure 10. Effective relative diffusivity and corresponding upper limit for the limiting current density dependent on porosity. Results are for unsaturated GDLs and GDLs with saturation at breakthrough (T = 320 K and p = 1 atm), both with and without condensation. For comparison, also the Bruggemann correlation for unsaturated GDLs is shown.
Energies 06 04508 g010
The diffusivity calculated by the model without saturation is slightly lower than predicted by the Bruggemann correlation, but shows a similar trend. Shou et al. [40] compared dry diffusivities found by different research groups and found significant differences between modeling and experimental results. Most diffusivities are lower than the Bruggemann correlation, whereas the measured data can be up to three-times lower than predicted by the simulations. They attribute the difference to binder material that spans between the fibers, which is not included in most models, as in our case. However, in experiments, the porosity is generally varied by changing the compression [41], which may also result in structure deformation and leading to lower diffusivities.
The change of the diffusivity with increasing porosity at breakthrough is smaller than for the unsaturated GDL. The higher saturation at breakthrough for GDLs having a higher porosity compensates for the increasing diffusivity due to the decreasing amount of GDL material. The upper limit for the limiting current density of approximately 3 A cm 2 at a porosity of 0.64 without condensation is in a realistic range. However, the model does not account for the diffusion limitation in the electrode and charge transport. Therefore, the percolation model alone can only give an upper limit for the limiting current density. For predicting the limiting current adequately, the model has to be coupled with a whole fuel cell model, including the electrochemical reaction, charge and mass transport in all layers of the fuel cell.
Figure 10 also shows that by including the condensation algorithm, the limiting current is increased in general.
For the injection with condensation, we assume that there is a constant liquid water connection throughout a condensed region. Accordingly, at steady state, the source and sink terms over the condensed region have to balance, and only the relative distribution of q ( j , k ) influences the condensed water distribution.
For the injection with condensation, the magnitude of the liquid water source by phase change q ( j , k ) in the upper left corner ( y > h G D L / 2 , x < b G D L / 4 ) is set to one third of the magnitude of the sink term in the residual area. In an operated fuel cell, this scenario simulates condensation conditions under the land and evaporation under the channel.
At porosities between 0.75 and 0.8, the diffusivity of both data-sets close up and intersect partly, which is most likely due to high stochastically variations at high porosities. However, the trend lines indicate that there is a positive influence of condensed water under the land on the limiting current density.
To illustrate the reason for the higher current when including condensation, in Figure 11, the mean saturation distribution (a) without and (b) with condensation at a mean porosity of 0.67 and the corresponding oxygen flux through the electrode interface j O 2 is compared.
On the one hand, there is a broad region with high saturation in the corner under the land where the condensation occurs. On the other hand, the saturation under the channel is significantly reduced and also, the saturation adjacent to the injection interface is lower than when no condensation is considered. If the condensation is not included, the oxygen is transported to the interface only in a small region with low saturation under the land. In contrast, the oxygen flux is more homogeneous and higher if the condensation is included, even though the effective saturation is almost the same.
Figure 8b illustrates how the condensation can influence the characteristic injection process. Therefore, the injection process of the same GDL model is shown, both (a) without and (b) with using the condensation algorithm for three different water inlet pressures. For the saturation distribution with condensation, the same distribution of q ( j , k ) as for Figure 10 and Figure 11b is used.
Figure 11. Mean saturation distribution at breakthrough and oxygen flux in the interface towards the electrode [injection (bottom) interface], j O 2 , (a) without and (b) with condensation under the land.
Energies 06 04508 g011
The colors in Figure 8b correspond to liquid water that was formed due to different processes. Therefore, the saturation distribution, including condensation, is compared to the distribution without condensation at the same water injection pressure level [note that in Figure 8, the pressure levels are different for (a) and (b), except for the lowest pressure]. The green region is formed due to the phase change algorithm alone before the injection through the interface has started. This region is constant and does not change throughout the injection process. The blue and red regions are filled by the injection process, whereby the red regions are the overlapped regions with the condensed water. The purple region is water that was formed by the injection, but was not present without the condensation at the same pressure level. The purple region, therefore, represents water that continued filling the GDL at the boundaries of the condensed regions after the injected water reached the condensed regions.
Obviously, the condensed water under the land is redistributing the percolating water towards the regions under the land. The condensed regions are reached already at low pressure (3.8 kPa), and a connection to the GDL surface in the channel is established immediately. The broader percolation front, as for the percolation without condensation at medium pressure (7.3 kPa), will not be established, since the connection is already made at lower pressure. Because the breakthrough is reached already at very low liquid water pressure, less water is accumulating in the GDL/electrode interface. Here, liquid water can directly block the oxygen supply to the active sites and is therefore, directly limiting the current production. By redirecting the flow of liquid water towards the region under the land, the GDL under the channel remains mostly free of liquid water and is available for the oxygen transport. This finding is important, since in a running fuel cell, condensing water can obviously result in a higher limiting current. When including condensation under the land, the theoretical upper limit for the current at a porosity of 0.67 is increased from 4 A cm 2 to 19 A cm 2 , as seen in Figure 10.

4. Conclusions

The presented water path network percolation model is a novel approach to improve the understanding of the liquid water transport mechanisms in GDLs and the influence of GDL design parameters on the mass transport limitation. Therefore, the model bases state-of-the-art pore network models on a more realistic representation of the substrate material and repeals the need to abstract the representation of the GDL on a pore level. The percolation process is directly described by the interaction of the liquid with the fibrous structure. Due to the similarity of GDL design and model input parameters, the model can directly be used for material optimization and can be coupled with a continuum model. The computational efforts for calculating the liquid water distribution are kept low after a preceding network generation step.
In the presented model, capturing the transition between stable paths is the most challenging part. Here, the model applies the most significant simplifications and improvements can further enhance the model quality. However, the results show that the simplifications are applicable and that the most important processes are captured. Since the stable water paths determine the entry pressure and quantity of water filled regions, they are the most decisive for the final saturation distribution and injection pressure dependency. A condensation algorithm is developed and is included into the algorithm to simulate the impact of condensation on the percolation process. The results reveal that condensation can have a significant influence on the liquid water distribution by redirecting the liquid water flow. Phase change should therefore, be considered in two-phase fuel cell models. Dependent on the condensation situation, condensation can have positive impacts on the fuel cell performance by improved oxygen transport.
The saturation-dependent diffusion properties and the capillary pressure saturation curves show a good agreement with experimental data. Comparison of the simulated saturation distribution with recent synchrotron visualizations shows that also the local saturation distribution in the GDL is captured adequately.
The percolation process is dependent on the stochastic distribution of the fibers, and the reduction from 3D into 2D changes these stochastic distributions. The applied 2+1-dimensional approach accounts for these effects for analyzing the effect of the GDL structure on the oxygen diffusion properties. Even though the model obviously captures the most important transport mechanisms, the 2D approach can be further developed in a 3D model for a more sophisticated analysis of the percolation. However, the application of the approach in 3D includes significantly higher computational and adaption efforts and is therefore, hardly suitable for the coupling with a full fuel cell model. For analyzing the fundamental dependencies, the 2D approach already offers a very good basis.

Acknowledgments

The authors thank the German Federal Ministry of Education and Research for the funding of the presented work in the German-Canadian cooperation project PEM-Ca-D, contract No. 03SF0360A.

Conflicts of Interest

The authors declare no conflict of interest.

Symbols:

β
object orientation in x/y plane
γ
surface tension of liquid
ϵ
porosity
Θ
contact angle
μ
mean value
ν
object orientation in x/z plane
σ
path orientation
Δ c
concentration difference
b
object width
h
GDL height
i l
limiting current density
j O 2
oxygen flux over boundary
l
object length
n
number of electrons transferred during reaction
p
pressure
p c
capillary pressure
p c , m i n
minimum path pressure at a location
p c , t
minimum drainage pressure at location
q ( j , k )
evaporation/condensation sink/source term
r
meniscus radius
r p
pore radius
s
saturation
s t d
standard deviation
D b
bulk oxygen diffusion coefficient according to Bruggemann
D f
oxygen diffusion coefficient in an object
D O 2 , a i r
oxygen diffusion coefficient in air
F
faraday constant
K 1 / 2
threshold values
T
temperature
U M
unstable meniscus

References

  1. Vengatesan, S.; Fowler, M.W.; Yuan, X.Z.; Wang, H. Diagnosis of MEA degradation under accelerated relative humidity cycling. J. Power Sources 2011, 196, 5045–5052. [Google Scholar] [CrossRef]
  2. Wu, J.; Yuan, X.Z.; Martin, J.J.; Wang, H.; Zhang, J.; Shen, J.; Wu, S.; Mérida, W. A review of PEM fuel cell durability: Degradation mechanisms and mitigation strategies. J. Power Sources 2008, 184, 104–119. [Google Scholar] [CrossRef]
  3. Borup, R.; Meyers, J.; Pivovar, B.; Kim, Y.S.; Mukundan, R.; Garland, N.; Myers, D.; Wilson, M.; Garzon, F.; Wood, D. Scientific aspects of polymer electrolyte fuel cell durability and degradation. Chem. Rev. 2007, 107, 3904–3951. [Google Scholar] [CrossRef] [PubMed]
  4. Seidenberger, K.; Wilhelm, F.; Schmitt, T.; Lehnert, W.; Scholta, J. Estimation of water distribution and degradation mechanisms in polymer electrolyte membrane fuel cell gas diffusion layers using a 3D Monte Carlo model. J. Power Sources 2011, 196, 5317–5324. [Google Scholar] [CrossRef]
  5. Tsai, J.C.; Lin, C.K. Effect of PTFE content in gas diffusion layer based on Nafion®/PTFE membrane for low humidity proton exchange membrane fuel cell. J. Taiwan Inst. Chem. Eng. 2011, 42, 945–951. [Google Scholar] [CrossRef]
  6. Park, S.; Popov, B.N. Effect of a GDL based on carbon paper or carbon cloth on PEM fuel cell performance. Fuel 2011, 90, 436–440. [Google Scholar] [CrossRef]
  7. Park, J.; Li, X. Multi-phase micro-scale flow simulation in the electrodes of a PEM fuel cell by lattice Boltzmann method. J. Power Sources 2008, 178, 248–257. [Google Scholar] [CrossRef]
  8. Lin, G.Y.; van Nguyen, T. Effect of thickness and hydrophobic polymer content of the gas diffusion layer on electrode flooding level in a PEMFC. J. Electrochem. Soc. 2005, 152, A1942–A1948. [Google Scholar] [CrossRef]
  9. Park, G.G.; Sohn, Y.J.; Yang, T.H.; Yoon, Y.G.; Lee, W.Y.; Kim, C.S. Effect of PTFE contents in the gas diffusion media on the performance of PEMFC. J. Power Sources 2004, 131, 182–187. [Google Scholar] [CrossRef]
  10. Alink, R.; Gerteisen, D.; Mérida, W. Investigating the water transport in porous media for PEMFCs by liquid water visualization in ESEM. Fuel Cells 2011, 11, 481–488. [Google Scholar] [CrossRef]
  11. Gerteisen, D.; Heilmann, T.; Ziegler, C. Enhancing liquid water transport by laser perforation of a GDL in a PEM fuel cell. J. Power Sources 2008, 177, 348–354. [Google Scholar] [CrossRef]
  12. Gerteisen, D.; Sadeler, C. Stability and performance improvement of a polymer electrolyte membrane fuel cell stack by laser perforation of gas diffusion layers. J. Power Sources 2010, 195, 5252–5257. [Google Scholar] [CrossRef]
  13. Manahan, M.P.; Hatzell, M.C.; Kumbur, E.C.; Mench, M.M. Laser perforated fuel cell diffusion media. Part I: Related changes in performance and water content. J. Power Sources 2011, 196, 5573–5582. [Google Scholar] [CrossRef]
  14. Manahan, M.; Mench, M. Increased performance of PEFCs with engineered mass-transport pathways. ECS Trans. 2011, 41, 569–581. [Google Scholar]
  15. Markötter, H.; Manke, I.; Krüger, P.; Arlt, T.; Haussmann, J.; Klages, M.; Riesemeier, H.; Hartnig, C.; Scholta, J.; Banhart, J. Investigation of 3D water transport paths in gas diffusion layers by combined in-situ synchrotron X-ray radiography and tomography. Electrochem. Commun. 2011, 13, 1001–1004. [Google Scholar] [CrossRef]
  16. Alink, R.; Haussmann, J.; Markötter, H.; Schwager, M.; Manke, I.; Gerteisen, D. The influence of porous transport layer modifications on the water management in polymer electrolyte membrane fuel cells. J. Power Sources 2013, 233, 358–368. [Google Scholar] [CrossRef]
  17. Gostick, J.T.; Ioannidis, M.A.; Fowler, M.W.; Pritzker, M.D. Pore network modeling of fibrous gas diffusion layers for polymer electrolyte membrane fuel cells. J. Power Sources 2007, 173, 277–290. [Google Scholar] [CrossRef]
  18. Ji, Y.; Luo, G.; Wang, C.Y. Pore-level liquid water transport through composite diffusion media of PEMFC. J. Electrochem. Soc. 2010, 157, B1753–B1761. [Google Scholar] [CrossRef]
  19. Luo, G.; Ji, Y.; Wang, C.Y.; Sinha, P.K. Modeling liquid water transport in gas diffusion layers by topologically equivalent pore network. Electrochim. Acta 2010, 55, 5332–5341. [Google Scholar] [CrossRef]
  20. Markicevic, B.; Djilali, N. Analysis of liquid water transport in fuel cell gas diffusion media using two-mobile phase pore network simulations. J. Power Sources 2011, 196, 2725–2734. [Google Scholar] [CrossRef]
  21. Nam, J.H.; Kaviany, M. Effective diffusivity and water-saturation distribution in single- and two-layer PEMFC diffusion medium. Int. J. Heat Mass Transf. 2003, 46, 4595–4611. [Google Scholar] [CrossRef]
  22. Sinha, P.K.; Wang, C.Y. Pore-network modeling of liquid water transport in gas diffusion layer of a polymer electrolyte fuel cell. Electrochim. Acta 2007, 52, 7936–7945. [Google Scholar] [CrossRef]
  23. Zhou, P.; Wu, C.W. Liquid water transport mechanism in the gas diffusion layer. J. Power Sources 2010, 195, 1408–1415. [Google Scholar] [CrossRef]
  24. Litster, S.; Sinton, D.; Djilali, N. Ex situ visualization of liquid water transport in PEM fuel cell gas diffusion layers. J. Power Sources 2006, 154, 95–105. [Google Scholar] [CrossRef]
  25. Thiedmann, R.; Manke, I.; Lehnert, W.; Schmidt, V. Random geometric graphs for modelling the pore space of fibre-based materials. J. Mater. Sci. 2011, 46, 7745–7759. [Google Scholar] [CrossRef]
  26. Wu, R.; Zhu, X.; Liao, Q.; Wang, H.; Ding, Y.D.; Li, J.; Ye, D.D. Determination of oxygen effective diffusivity in porous gas diffusion layer using a three-dimensional pore network model. Electrochim. Acta 2010, 55, 7394–7403. [Google Scholar] [CrossRef]
  27. Dong, H.; Blunt, M.J. Pore-network extraction from micro-computerized-tomography images. Phys. Rev. E 2009, 80, 036307:1–036307:11. [Google Scholar] [CrossRef] [PubMed]
  28. Gaiselmann, G.; Froning, D.; Tötzke, C.; Quick, C.; Manke, I.; Lehnert, W.; Schmidt, V. Stochastic 3D modeling of non-woven materials with wet-proofing agent. Int. J. Hydrog. Energy 2013, 38, 8448–8460. [Google Scholar] [CrossRef]
  29. Becker, J.; Wieser, C.; Fell, S.; Steiner, K. A multi-scale approach to material modeling of fuel cell diffusion media. Int. J. Heat Mass Transf. 2011, 54, 1360–1368. [Google Scholar] [CrossRef]
  30. James, J.P.; Choi, H.W.; Pharoah, J.G. X-ray computed tomography reconstruction and analysis of polymer electrolyte membrane fuel cell porous transport layers. Int. J. Hydrog. Energy 2012, 37, 18216–18230. [Google Scholar] [CrossRef]
  31. Bevers, D.; Rogers, R.; von Bradke, M. Examination of the influence of PTFE coating on the properties of carbon paper in polymer electrolyte fuel cells. J. Power Sources 1996, 63, 193–201. [Google Scholar] [CrossRef]
  32. Berning, T.; Odgaard, M.; Kaer, S.K. Percolation theory and network modeling applications in soil physics. J. Power Sources 2011, 196, 6305–6317. [Google Scholar] [CrossRef]
  33. Manke, I.; Hartnig, Ch.; Grunerbel, M.; Lehnert, W.; Kardjilov, N.; Haibel, A.; Hilger, A.; Banhart, J.; Riesemeier, H. Investigation of water evolution and transport in fuel cells with high resolution synchrotron X-ray radiography. Appl. Phys. Lett. 2007, 90, 174105:1–174105:3. [Google Scholar] [CrossRef]
  34. Fluckiger, R.; Marone, F.; Stampanoni, M.; Wokaun, A.; Buchi, F.N. Investigation of liquid water in gas diffusion layers of polymer electrolyte fuel cells using X-ray tomographic microscopy. Electrochim. Acta 2011, 56, 2254–2262. [Google Scholar] [CrossRef]
  35. Kim, J.; Je, J.; Kim, T.; Kaviany, M.; Son, S.Y.; Kim, M. Breakthrough/drainage pressures and X-ray water visualization in gas diffusion layer of PEMFC. Curr. Appl. Phys. 2012, 12, 105–108. [Google Scholar] [CrossRef]
  36. Utaka, Y.; Hirose, I.; Tasaki, Y. Characteristics of oxygen diffusivity and water distribution by X-ray radiography in microporous media in alternate porous layers of different wettability for moisture control in gas diffusion layer of PEFC. Int. J. Hydrog. Energy 2011, 36, 9128–9138. [Google Scholar] [CrossRef]
  37. Gostick, J.T.; Ioannidis, M.A.; Fowler, M.W.; Pritzker, M.D. Wettability and capillary behavior of fibrous gas diffusion media for polymer electrolyte membrane fuel cells. J. Power Sources 2009, 194, 433–444. [Google Scholar] [CrossRef]
  38. Wood, D.L., III; Rulison, C.; Borup, R.L. Surface properties of PEMFC gas diffusion layers. J. Electrochem. Soc. 2010, 157, B195–B206. [Google Scholar] [CrossRef]
  39. Bird, R.B.; Steward, W.E.; Lightfood, E.N. Transport Phenomena; John Wiley and Sons, Inc.: New York, NY, USA, 2002. [Google Scholar]
  40. Shou, D.; Fan, J.; Ding, F. Effective diffusivity of gas diffusion layer in proton exchange membrane fuel cells. J. Power Sources 2013, 225, 179–186. [Google Scholar] [CrossRef]
  41. Flückiger, R.; Freunberger, S.A.; Kramer, D.; Wokaun, A.; Scherer, G.G.; Büchi, F.N. Anisotropic, effective diffusivity of porous gas diffusion layer materials for PEFC. Electrochim. Acta 2008, 54, 551–559. [Google Scholar] [CrossRef]

