Article

Effects of Biomass Feedstocks and Gasification Conditions on the Physiochemical Properties of Char

1
Department of Biosystems and Agricultural Department, and the Biobased Products and Energy Center, Oklahoma State University, Stillwater, OK 74078, USA
2
Department of Biological and Agricultural Engineering, Kansas State University, Manhattan, KS 66506, USA
3
Department of Biological and Agricultural Engineering, North Carolina State University, Raleigh, NC 27695, USA
*
Author to whom correspondence should be addressed.
Energies 2013, 6(8), 3972-3986; https://doi.org/10.3390/en6083972
Submission received: 19 June 2013 / Revised: 11 July 2013 / Accepted: 22 July 2013 / Published: 6 August 2013
(This article belongs to the Special Issue Biomass and Biofuels 2013)

Abstract

:
Char is a low-value byproduct of biomass gasification and pyrolysis with many potential applications, such as soil amendment and the synthesis of activated carbon and carbon-based catalysts. Considering these high-value applications, char could provide economic benefits to a biorefinery utilizing gasification or pyrolysis technologies. However, the properties of char depend heavily on biomass feedstock, gasifier design and operating conditions. This paper reports the effects of biomass type (switchgrass, sorghum straw and red cedar) and equivalence ratio (0.20, 0.25 and 0.28), i.e., the ratio of air supply relative to the air that is required for stoichiometric combustion of biomass, on the physiochemical properties of char derived from gasification. Results show that the Brunauer-Emmett-Teller (BET) surface areas of most of the char were 1–10 m2/g and increased as the equivalence ratio increased. Char moisture and fixed carbon contents decreased while ash content increased as equivalence ratio increased. The corresponding Fourier Transform Infrared spectra showed that the surface functional groups of char differed between biomass types but remained similar with change in equivalence ratio.

1. Introduction

Char (or charcoal) has been used in human history for thousands of years. Char was used as an energy resource for heating and cooking in households and for heating in the iron industry because of reduced smoke release and high temperatures reached during its combustion. Currently, char is being used in several new high-value applications, besides as an energy source. A typical utilization of char (also called biochar) is as a soil amendment [1], which increases soil fertility and agricultural productivity [2] through increasing soil organic matter, utilizing high carbon (C) recalcitrance against microbial decay and providing a habitat for microbes and inorganic matter for crops [3]. Another potential application of char is in the synthesis of activated carbon [4]. Activated carbon is a form of carbon with a high surface area (larger than 300 m2/g) and a high degree of microporosity [5], which make it suitable for chemical catalysis or physical sorption, e.g., purification of waste water [6]. Recently, raw char has been suggested as a promising catalyst for syngas cleaning [7,8].
Char can be produced through several technologies: slow and fast pyrolysis, gasification, or conventional and flash carbonization [9]. Among these technologies, slow pyrolysis has been shown to retain the highest biomass carbon content in the char. Gasification, which is used for syngas production, provides a modest amount of char as a byproduct (about 10%). Generally, the char obtained in gasification is either disposed of as waste or recycled to the gasifier for supplying heat, thus providing little economic benefit to the industry. Therefore, finding a cost-effective approach that can convert the char to a value-added product will greatly benefit the biorefinery and contribute to the commercialization of bioproducts.
The properties of char generated from biomass gasification processes vary widely based on the feedstock used, reactor design, and the operating conditions. Agricultural residues, forestry residues, wood, municipal solid waste and animal manures are all potential feedstocks for gasification [10]. The properties of these feedstocks vary significantly in terms of mineral content, elemental composition and fiber structure, and variation of these properties further impact properties of the char derived. In addition, different reactor designs, such as fluidized beds and fixed beds and their operating conditions (e.g., reaction temperature, equivalence ratio, feeding rate of biomass, flow rate of carrier gas or oxidizing agents and residence time), impact conversion efficiencies of biomass and properties of char [11]. Unfortunately, the gasification derived char has some undesired qualities that may also adversely affect its applications. For example, char with high ash concentration and low porosity may not be suitable for producing activated carbon [12]. Numerous researchers have reported the properties of char obtained from thermochemical conversions of biomass [9,10,13,14]. However, the impacts of feedstock properties and operating conditions on char properties are not well understood. Earlier studies have focused primarily on the char derived from biomass pyrolysis with limited information available on gasification-based char. The objective of this research was to investigate the effects of biomass feedstocks and gasification operating conditions on the properties of char derived from gasification. Three biomass species—switchgrass, forage sorghum and red cedar—representing herbaceous plants, agricultural straw and woody biomass, respectively, were selected as the feedstocks in this study. The physiochemical properties of gasification-derived char were analyzed. Results of this study will provide valuable information on how gasification conditions can be manipulated to produce char with wanted properties, adding value to this bioproduct.

2. Materials and Methods

2.1. Feedstocks Preparation

The Kanlow variety of switchgrass (Panicum virgatum) and forage sorghum (Sorghum spp.) were obtained from the Oklahoma State University Agronomy Research Station. Large round bales of switchgrass and sorghum were chopped by a Haybuster tub grinder (H1000, Duratech Industries International, Inc., Jamestown, ND, USA) with a screen size of 1.25 cm. Red cedar (eastern red cedar, Juniperus virginiana) was obtained locally and chopped with a screen size of 1.25 cm by a local company (Bliss Industries, Ponca City, OK, USA).

2.2. Fluidized Bed Gasification

The gasification experiments were carried out in a lab-scale fluidized bed gasifier at three equivalence ratios (ERs): 0.20, 0.25 and 0.28. ER is defined as the ratio of air supplied into the gasifier to the air required for complete combustion. The gasifier, with designed feedstocks throughput of 2 to 5 kg/h, had dimensions of 102 mm i.d. × 1118 mm height and 250 mm i.d. × 310 mm height in the reactor and disengagement zones, respectively. The gasification bed temperature stabilized at average temperatures was around 700, 780 and 800 °C at ERs of 0.2, 0.25 and 0.28, respectively. The residence time ranged from 5 to 7 s. Biomass feeding rate was 3.9 to 4.2 kg/h. A screw feeder continuously injected the biomass into the gasifier. Silica sand with particle size ranging from 106 to 850 μm was used as the fluidizing agent. The ER was varied by adjusting the air flow rate and biomass feeding rate. The biomass feeding rate was controlled by adjusting the rotational speed of the screw feeder. The relationship between biomass feeding rate and rotational speed of the screw feeder was calibrated before each run. The gasification reactor temperature profile, pressure drop along the gasifier and air flow rate were closely monitored using a LabVIEW system (National Instruments, Austin, TX, USA). Every run lasted approximately 4 h, including preheating. At the conclusion of each run, char was collected from two cyclones. Each experiment has been repeated twice. Detailed information on the configuration of the experimental-setup and procedures for running the gasifier was previously reported [15].

2.3. Property Analysis of Biomass and Char

Biomass feedstocks and resultant char were analyzed for proximate and elemental analyses, BET surface area and FT-IR spectrum. Ultimate analysis (contents of carbon, hydrogen, nitrogen and sulfur) was measured using an elemental analyzer (Perkin Elmer 2400 Series 2, PerkinElmer Inc., Waltham, MA, USA) at Kansas State University. Oxygen content was not determined in char samples due to presence of oxygen in its high ash content. For the proximate analysis, volatile content was determined following ASTM D3175-11 [16]. Char (1 g) was kept in a crucible with the lid on and heated in an oven at a temperature of 950 °C for 7 min. Volatile matter was determined as the mass lost during the process. Moisture content was analyzed by drying the samples at 105 °C according to ASTM D4442-07 [17]. Ash content was determined by combusting the char at 600 °C, based on ASTM E1755 [18]. Fixed carbon content was determined following ASTM D3172 as the difference between 100 and the sum of percentage contents of volatile matter, moisture and ash [19]. Energy content or higher heating value (HHV) was determined using a bomb calorimeter (Parr 6300 Automatic Isoperibol Calorimete, Parr Instrument Co., Moline, IL, USA). Mineral and heavy metal contents of char are important property for soil amendment as minerals are required for plant growth and heavy metal is not desired. Mineral and heavy metal content was determined using an inductively coupled plasma (ICP) analyzer (Spectro Ciros, Kleve, Germany) to determine the concentrations of P, Al, Ca, Cr, Ni, Cu, Fe, K, Mg, Mn, and Na. Surface areas and pore properties were measured via isothermal N2 adsorption at 77 K using a surface area analyzer (Autosorb-1C, Quantachrome, Boynton Beach, FL, USA). Data were analyzed using the Brunauer-Emmett-Teller (BET) theory. The surface area was determined using multilayer adsorption model by measuring the quantity of nitrogen adsorbed onto or desorbed from char sample at different equilibrium vapor pressures. Samples were degassed at 300 °C for 12 h. Char structure and surface morphology were analyzed by a field-Emission Environmental Scanning Electron Microscope (SEM) (FEI Quanta 600, FEI company, Hillsboro, OR, USA). In order to obtain a clear image, the char particles were coated with gold.
Surface functional groups of char were analyzed using Fourier transform infrared spectroscopy (Nicolet FT-IR 6700, Thermo Electron Corporation, Madison, WI, USA) with an attenuated total reflectance (ATR) accessory. The crystal used on the ATR accessory is diamond. Compared with the traditional infrared techniques, the ART-FTIR technique not only shortens the analysis time, but also improves the quality of char spectra. The 256 scans of spectra of samples were obtained at 8 cm−1 resolution from 4000 to 650 cm−1. Ambient air was scanned as background signal before scanning samples. All samples were scanned without pretreatments. The FTIR spectral peaks were analyzed by comparing the peak position with known peaks.
All data were analyzed statistically using Statistical Analysis System (Version 9.2, SAS Institute Inc., Cary, NC, USA). Significant differences between treatments were analyzed using a F-test (p-value < 0.05). Correlations were also developed using the Pearson’s correlation test at a p-value of 0.05. The experiment design used is a factorial design with complete random design. Interaction between biomass type and equivalence ratio was also included in the model. However, the interaction was not found based on the data.

3. Results and Discussion

3.1. Physical and Chemical Properties

3.1.1. Proximate Analysis and Char Yields

The char yield could not be determined in this study because the cyclones were not able to capture all the char. Some char remained in the pipes connecting the cyclones and the reactor, and some char was entrained with the syngas. The char yield was estimated to be approximately 12% based on the mass balance of fluidized bed gasification (by subtracting tar and syngas percentage yields from 100).
The proximate analyses of raw biomass feedstocks and char are shown in Table 1 and Table 2. As the reaction temperature of gasification reached above 700 °C, free moisture should be released during gasification. However, chars did contain some moisture, which could be adsorbed from the atmosphere between gasification and sample analyzing.
Table 1. Proximate analysis and ultimate analysis of feedstocks, wt%.
ContentSwitchgrassSorghumRed cedar
Moisture (w.b.)9.709.398.50
Volatile matter (w.b.)70.3668.171.79
Ash (w.b.)4.625.054.09
Fixed carbon (w.b.)15.0217.4615.62
Nitrogen (d.b.)0.570.510.37
Hydrogen (d.b.)5.746.46.27
Sulfur (d.b.)0.300.201.07
Carbon (d.b.)43.1940.6847.51
Oxygen (d.b.)50.2052.244.79
Notes: w.b. represents wet basis and d.b. represents dry basis. Oxygen content was determined by difference.
Table 2. Proximate analysis, higher heating value (HHV) and BET surface area of char derived from switchgrass, sorghum and red cedar at three equivalence ratios (ER).
FeedstockERMoisture (wt% on w.b.)Volatile (wt% on w.b.)Ash (wt% on w.b.)Fixed carbon (wt% on w.b.)HHV (MJ/Kg)BET surface area (m²/g)Micropore volume (10−3 mL/g)
Switchgrass0.200.69 ± 0.0912.69 ± 1.4851.61 ± 2.2134.99 ± 0.577.401.30.63
0.252.01 ± 0.1816.86 ± 0.8957.70 ± 2.6723.42 ± 1.394.035.22.84
0.281.83 ± 0.3712.11 ± 0.7164.07 ± 1.2921.98 ± 0.676.7020.811.88
Sorghum0.201.99 ± 0.2014.24 ± 0.7150.89 ± 0.5933.76 ± 0.344.181.00.45
0.251.94 ± 0.1320.01 ± 2.1245.94 ± 2.4932.10 ± 0.359.420.70.44
0.281.1 ± 0.1111.36 ± 1.0654.87 ± 1.1732.67 ± 0.164.635.62.14
Red cedar0.203.4 ± 0.2715.72 ± 1.4140.41 ± 1.0040.49 ± 0.109.092.11.57
0.253.1 ± 0.1715.68 ± 0.8143.89 ± 3.6537.33 ± 2.135.8760.831.33
0.282.7 ± 0.1414.14 ± 1.7047.52 ± 0.8135.66 ± 0.894.0730.616.34
The volatile contents of switchgrass char and sorghum chars increased with an increase in ER from 0.2 to 0.25 and decreased with further increase in ER to 0.28. However, the volatile contents of red cedar-derived char at the three ERs were not statistically different. The char ash content derived from switchgrass and red cedar increased from 51.61 wt% to 64.07 wt% and from 40.41 wt% to 47.52 wt%, respectively, with an increase in ER from 0.20 to 0.28. Gasification with increasing ER also decreased the fixed carbon content of each char. The fixed carbon content of switchgrass, sorghum and red cedar decreased from 34.99 wt% to 21.98 wt%, 33.76 wt% to 32.67 wt% and 40.49 wt% to 35.66 wt%, respectively, with increase in ER from 0.20 to 0.28. The variation of ash content and fixed carbon in char can be explained by the variation in carbon conversion during the gasification. When ER is increased, more organic content of the biomass oxidized and converted into the gaseous phase, which leads to the reduction in unconverted carbon that remained in the solid phase. Since most of the minerals (except chemically reactive alkali and alkali earth elements such as potassium and calcium) remained stable during gasification, the total quantity of ash in the solid phase did not change; however, the ash content in char still increased due to mass loss of other solid residues due to carbon conversion.
As expected, the gasification process led to significant differences between compositions of raw biomass feedstocks and resulted char. Moisture content of the raw biomass feedstocks was 8.5 wt%–9.7 wt%, while that of the char was all 0.7 wt%–3.4 wt%. The volatile contents of chars (10 wt%–20 wt%) were much lower than those of the raw biomass the char was derived from (68 wt%–72 wt%). Ash contents of chars were higher (40 wt%–64 wt%) than those of raw biomass the char was derived from (less than 5 wt%), which implied that most of the ash in biomass remained in the char during gasification. On the contrary, fixed carbon content of char was higher than that of raw biomass. Average fixed carbon contents of chars ranged from 22 wt% to 41 wt%, while those of biomass feedstocks ranged from 15 wt% to17 wt%.

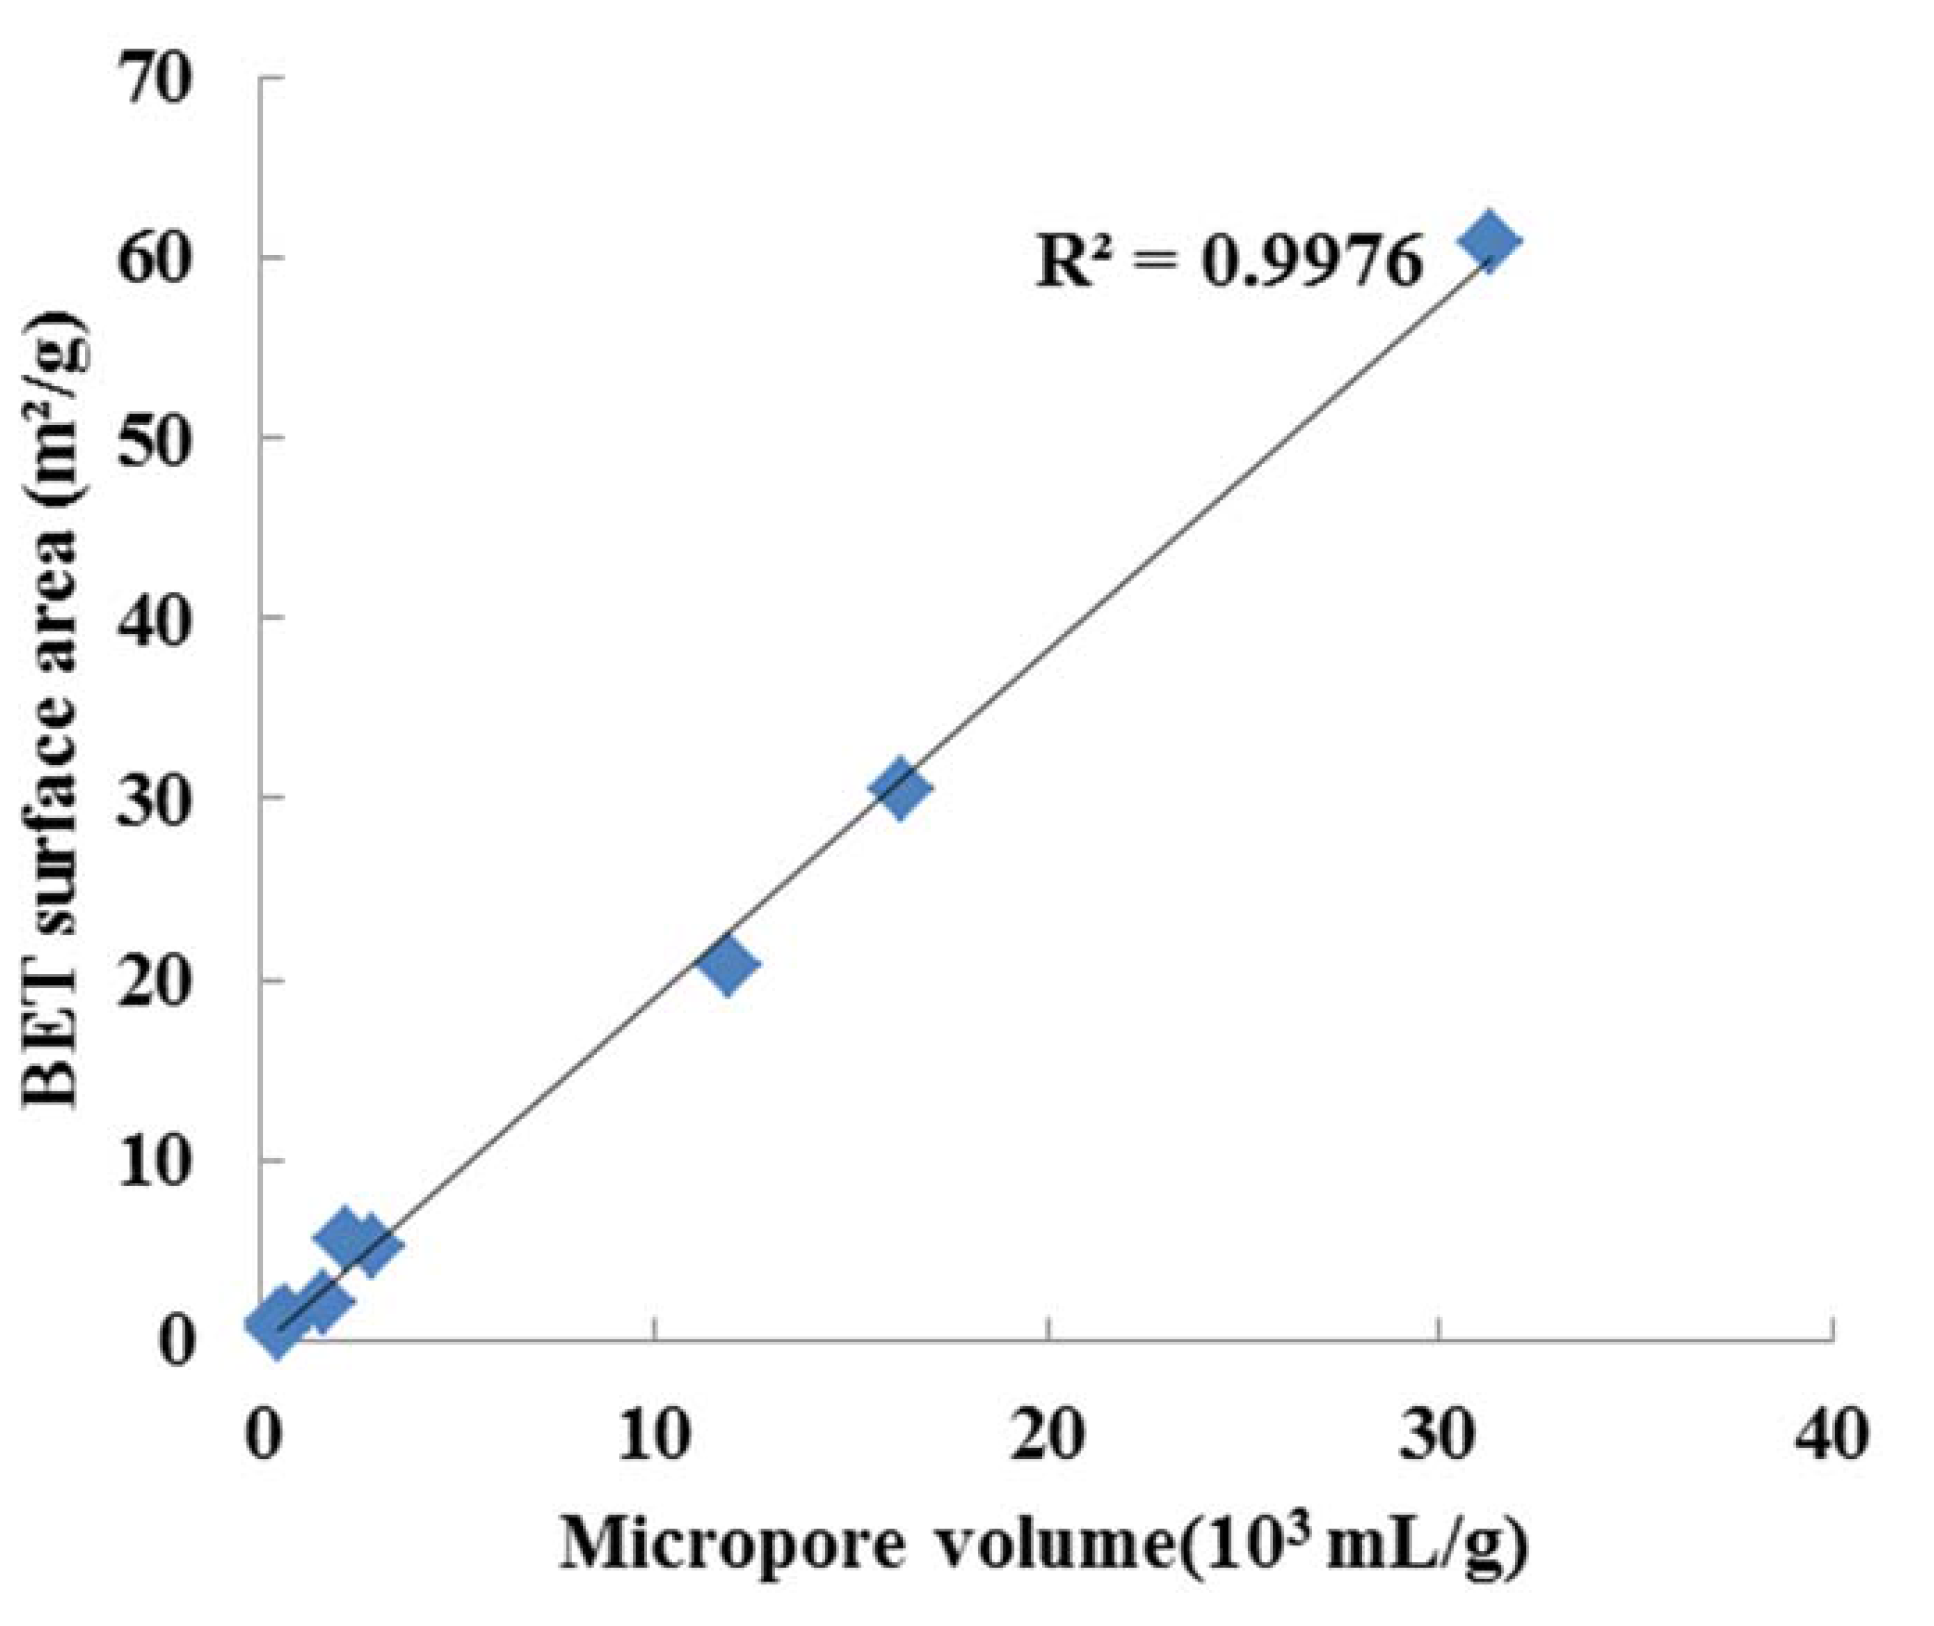
3.1.2. Heating Value and BET Surface Area

The main effect of biomass type on the higher heating value (HHV) of char was not significant (data shown in Table 2). The heating value of the char ranged from 4 to10 MJ/Kg, which was lower than that of raw biomass (typically 15–20 MJ/Kg) or other combustible fuels such as coal (25–35 MJ/Kg). Surface area and microporosity are two of the most relevant properties to evaluate char absorption capacity of minerals and organic matter [20]. ER had a significant effect on the BET surface area of the char. At 0.20 ER, all char had surface areas of 1 to 2 m2/g, while at 0.28 ER, the BET surface areas of char derived from switchgrass and red cedar increased to 20 and 30 m2/g, respectively. Among all char, the red cedar-derived one had the highest BET surface area at each ER. These observations conclude that chars derived from woody biomass tend to have larger surface areas compared to chars derived from herbaceous biomass. Similar observations have been reported by Bruun [20].
This suggests that red cedar may be a better feedstock than switchgrass and sorghum to produce high surface area char. The micropore volume (calculated by Dubinin-Radushkevich method) of char are listed in Table 2. As shown in Figure 1, the micropore volume and surface area of our char samples were linearly correlated with R2 = 0.99.
Figure 1. BET surface areas versus micropore volume of char.
Energies 06 03972 g001
This correlation is supported by earlier study done by Lehmann et al. [21], who compiled surface area data and micropore volume data of chars available in literatures and concluded that micropore volume had a strongly positive correlation with BET surface area.

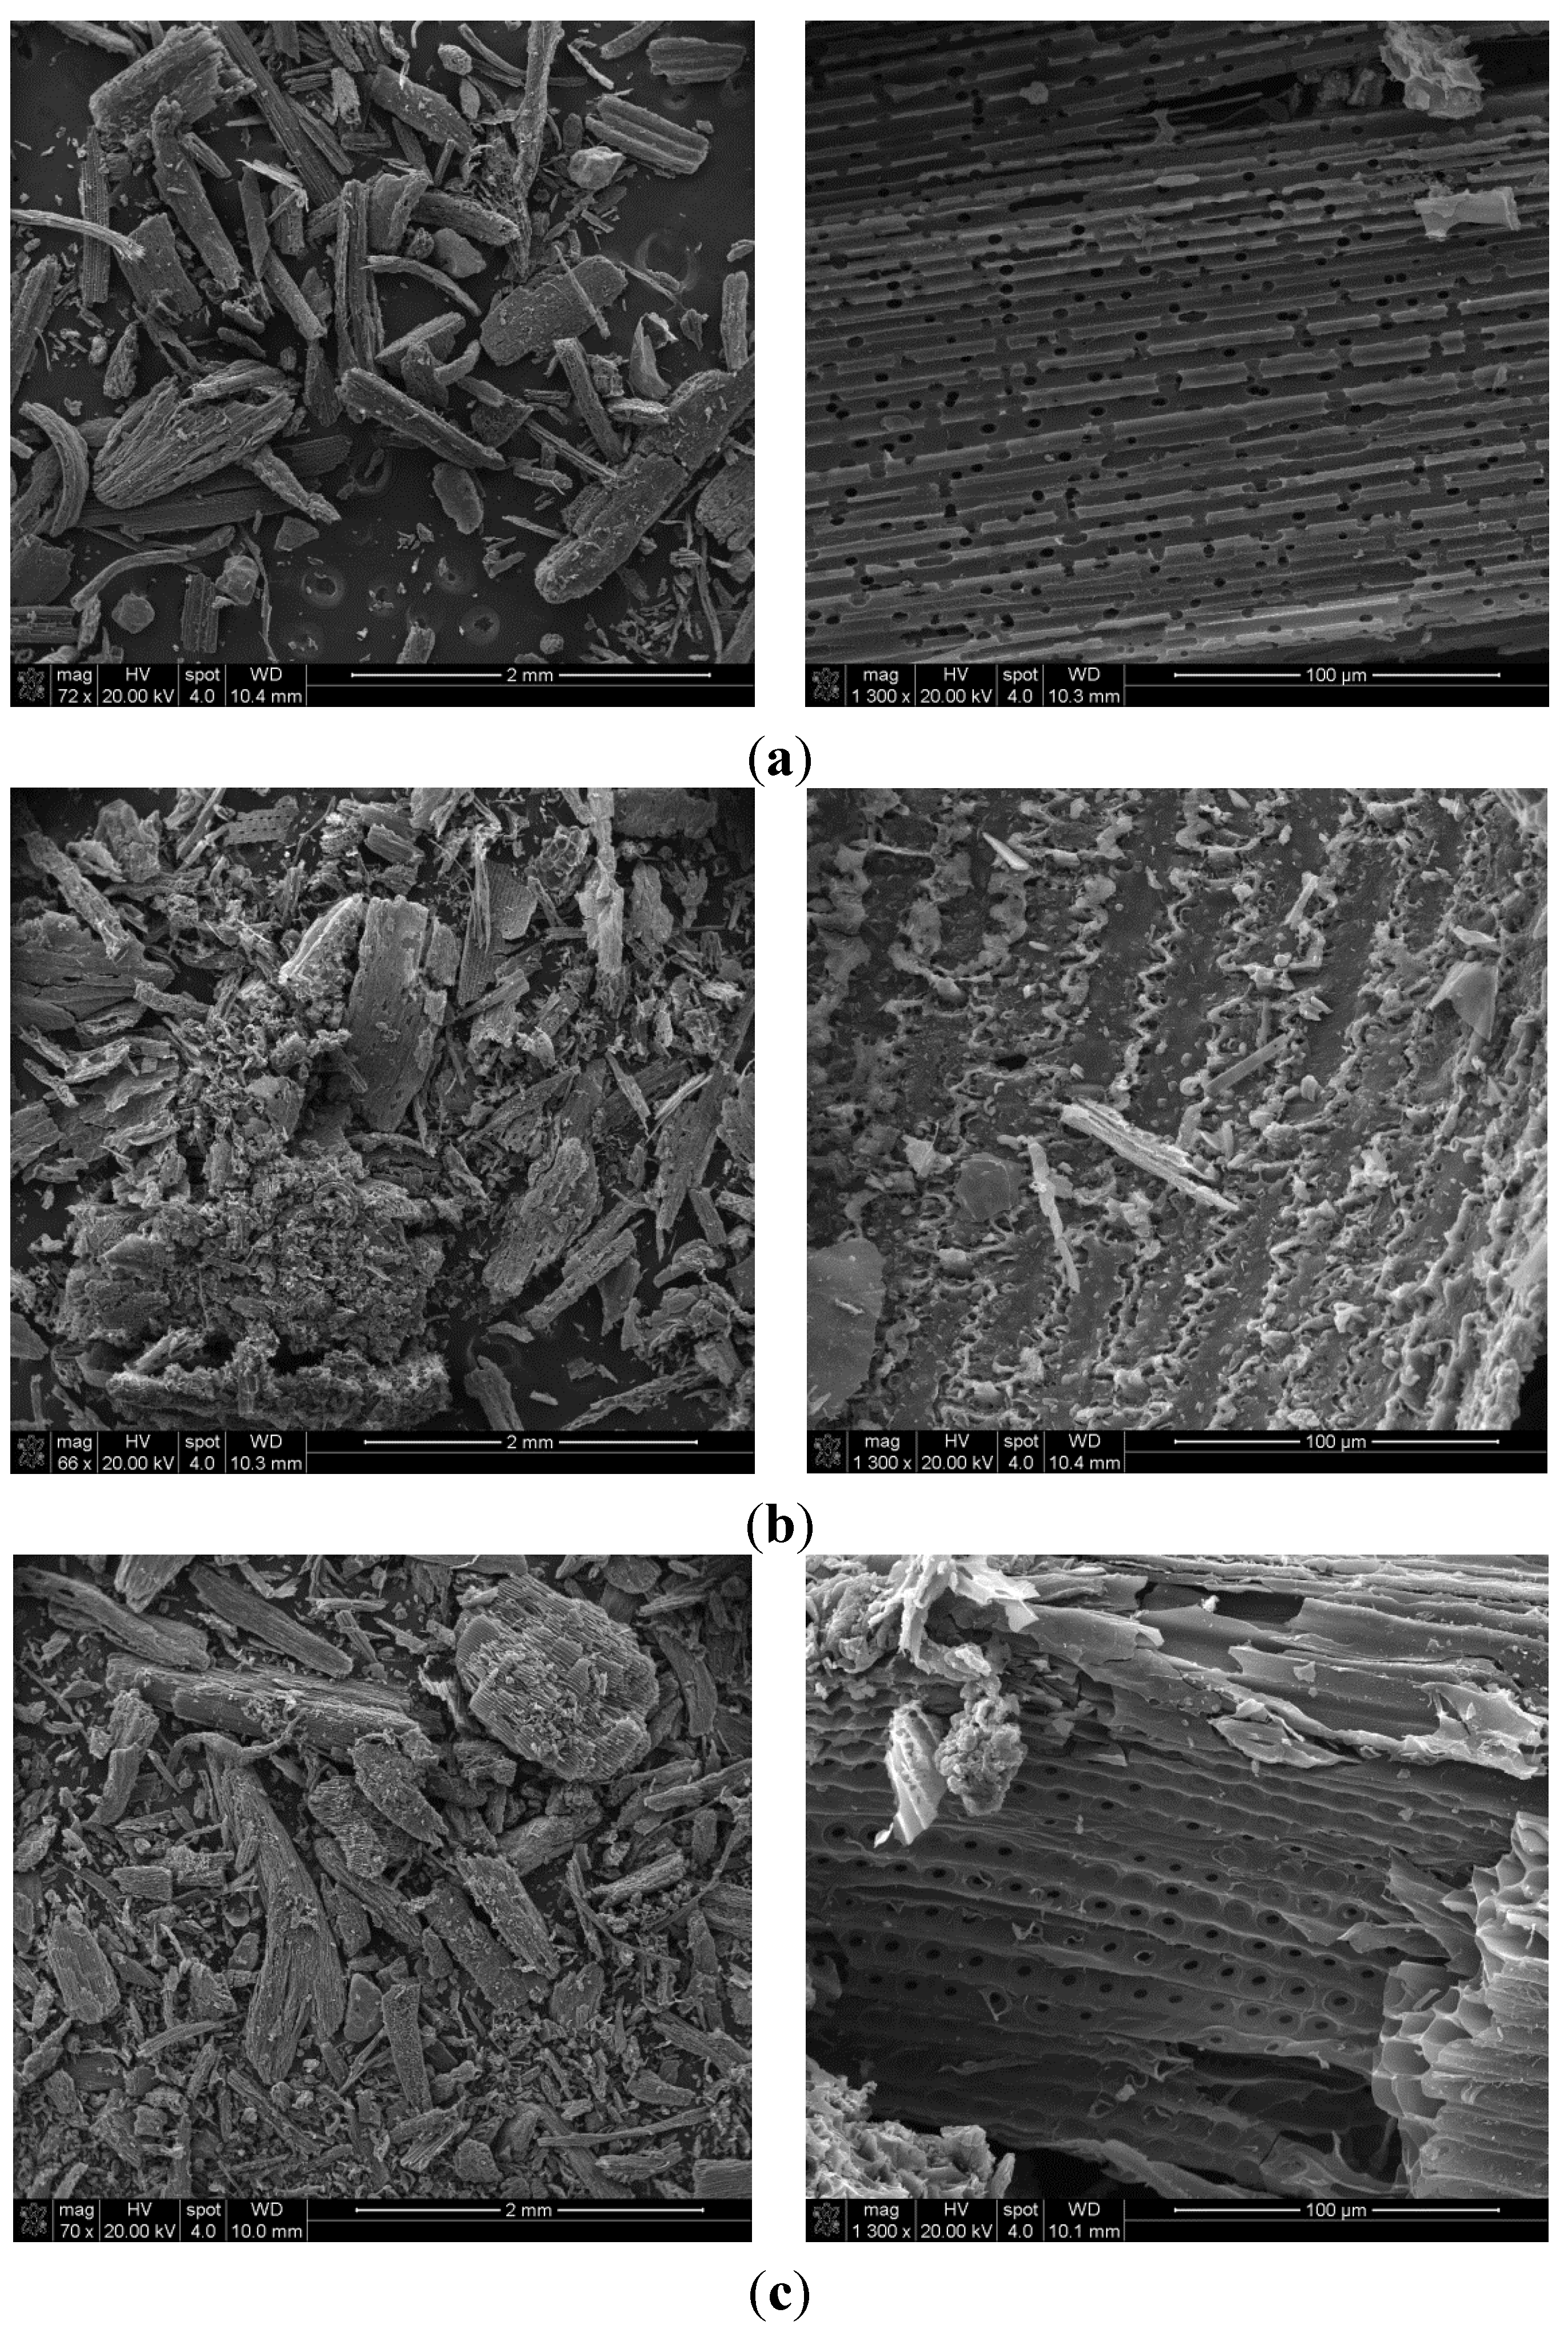
3.1.3. SEM Morphology

Surface morphology of chars obtained from gasification of switchgrass, sorghum and red cedar char at ER 0.28 were studied by SEM (see Figure 2).
Figure 2. Scanning electron graphs of char at 0.28 equivalence ratio. From top to bottom is (a) switchgrass char, (b) sorghum char and (c) red cedar char. Magnifications of 72 and 1300 are shown on left and right, respectively.
Energies 06 03972 g002
It can be observed that the chars maintained part of the biomass fibrous structure. Char also is clearly seen to be porous in all of the SEM images. The porous structure of char could be derived from the porous structure existing in raw biomass or was formed during the devolatilization process of gasification [13]. The appreciable porosity seen in chars derived from switchgrass and red cedar (as illustrated in Figure 2a,c) should result from the process of pit deaspiration that resulted in increases in the sizes of the pits formed.
The surface of the char derived from switchgrass and red cedar showed more pores with regular geometrical morphology. The surface of the char obtained from sorghum, however, exhibited less pores. The difference in char porosity can also be related to the BET surface area as high BET surface is indicative of high porosity. BET surface areas of char derived from switchgrass and red cedar at ER 0.28 were 20.1 and 30.6 m2/g, respectively; which were much higher than the surface area of the char derived from sorghum (5.6 m2/g).

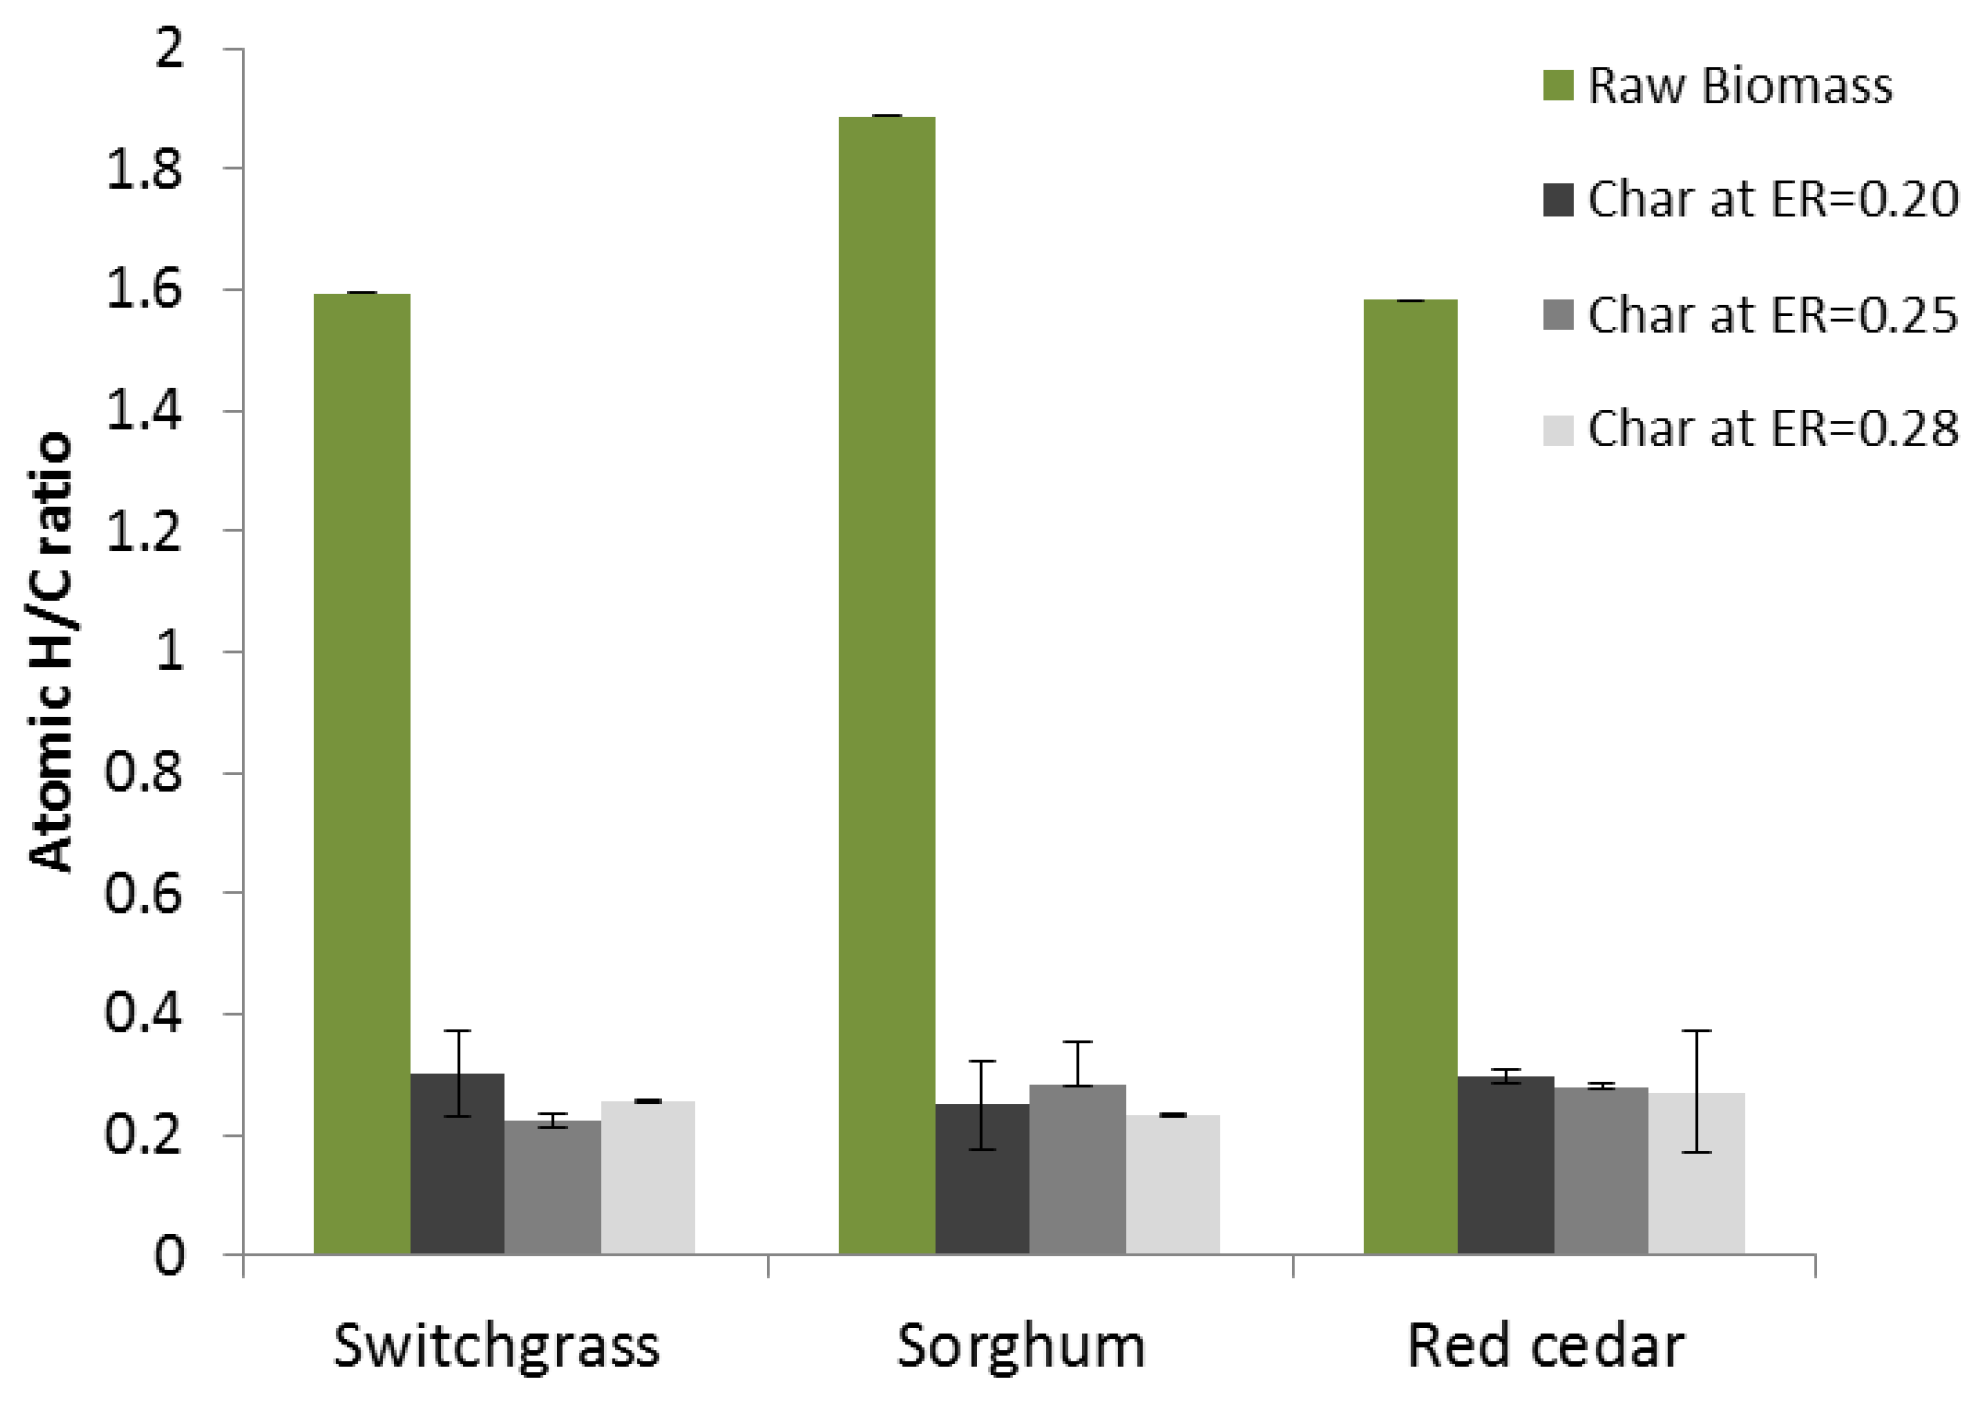
3.2. Elemental (Proximate) Analysis

The elemental compositions of chars are presented in Table 3. Brewer et al. [13] observed that oxygen content could not be determined in their char samples using this method due to high oxygen content in the ash that decomposes during analysis. Our samples also contained high ash and the oxygen present in ash may decompose during analysis. Thus, oxygen contents of chars were not reported in this paper. As expected, the carbon content of gasification-based char (34%–48%) was much lower than pyrolysis-based char (typically > 60%) reported in literature [21].
Table 3. Elemental composition for char derived from switchgrass, sorghum and red cedar at three equivalence ratios (ER).
FeedstockERCarbon (wt%, d.b.)Hydrogen (wt%, d.b.)Nitrogen (wt%, d.b.)Sulfur (wt%, d.b.)
Switchgrass0.2048.29 ± 0.801.21 ± 0.300.67 ± 0.060.22 ± 0.09
0.2534.73 ± 2.350.65 ± 0.010.65 ± 0.050.07 ± 0.01
0.2838.55 ± 1.590.82 ± 0.040.66 ± 0.080.12 ± 0.01
Sorghum0.2038.5 ± 13.130.80 ± 0.051.46 ± 0.170.14 ± 0.01
0.2540.11 ± 0.160.94 ± 0.021.48 ± 0.040.13 ± 0.00
0.2840.69 ± 1.230.79 ± 0.030.92 ± 0.130.10 ± 0.01
Red cedar0.2045.14 ± 0.831.12 ± 0.060.26 ± 0.080.13 ± 0.01
0.2544.89 ± 0.761.05 ± 0.070.51 ± 0.030.20 ± 0.02
0.2843.71 ± 2.400.99 ± 0.420.61 ± 0.150.19 ± 0.07
Note: Values are means of two replicated tests ± standard deviation.
The carbon content of switchgrass-derived char varied from 35 wt% to 48 wt% (d.b.) and decreased with increase in ER. No significant variation in carbon content was found in sorghum and red cedar char with change in ER. The order of average char carbon content from highest to lowest was red cedar > switchgrass > sorghum. This order was consistent with the order of carbon content in raw biomass. The hydrogen content of char was significantly lower (average of 85%) than that of the raw biomass due to gasification. The N content of raw biomass ranged from 0.37%–0.57%, which increased to 0.26%–1.48% of the char due to gasification. The sorghum-derived char had the highest N content (1.48%) among all chars. The increase in N content of char as compared to the raw biomass may be explained by the stability of N-containing compounds such as heterocyclic aromatic compounds during thermal conversion [10]. The char sulfur content was not affected significantly by the equivalence ratio. The sulfur content of char directly corresponded to that of the raw biomass. The order of average sulfur content of char from highest to lowest was the same as that of the raw biomass, i.e., red cedar > switchgrass > sorghum. Generally, during gasification, the biomass sulfur is released in the form of H2S and a small amount of COS, SO2 and thiols, while the remaining sulfur solidifies with the alkali metals in ash [22].
The atomic H/C ratio is usually used to distinguish fuels (e.g., coals, biomass), or fuel-related compounds such as soot [23]. The typical atomic H/C ratio of fuel material composed of lignin and cellulose, such as biomass, is approximately 1.5 [21]. Kuhlbusch et al. [24] observed that the atomic H/C ratio of black carbon was less than 0.2. The soot and lignite often had atomic H/C values less than 0.1. The atomic H/C ratio of most pyrolysis-based char was below 0.5, which depends on feedstock variety and reaction conditions. Normally, atomic H/C ratio of char obtained from high temperature pyrolysis (above 500 °C) is below 0.3 [10,25]. The atomic H/C ratio of gasification-derived char in this study varied from 0.2 to 0.3, which was close to that of high temperature pyrolysis char (<0.3) but higher than soot and lignite. The atomic H/C ratio of raw biomass in this study ranged from 1.5 to 1.8, which was consistent with Lehmann’s conclusion.
As shown in Figure 3, atomic H/C ratios of chars were lower than those of the raw biomass. The decrease in atomic H/C ratio of char during biomass gasification can be attributed to loss of hydrogen caused by dehydration and dehydrogenation reactions, and the cleavage and cracking of weak hydrogen bonds within the char structure, similar to the observations in pyrolysis char [25]. The atomic H/C ratio has also been used to estimate the possibility of bond arrangement [21]. Prior research has confirmed that low atomic H/C ratio in char reflect high contents of aromatic compounds by NMR tests [13]. The low atomic H/C ratio in char and high atomic H/C ratio in the raw biomass suggests that the aliphatic carbon containing compounds decrease and aromatic compounds increase during gasification. The atomic H/C of char derived from switchgrass and red cedar decreased slightly with increase in ER and sorghum-derived char did not show any trend in the atomic H/C with change in ER. Statistical analysis of the data showed that main effect of ER on atomic H/C was not significant. These observations conclude that ER was not the primary factor controlling atomic H/C of char.
Figure 3. Atomic H/C of raw biomass and char obtained at equivalent ratios of 0.2, 0.25 and 0.28.
Energies 06 03972 g003

3.3. Mineral Content

The mineral contents of the raw biomass and char, as determined by ICP analysis, are shown in Table 4. The major minerals included P, Ca, K, and Mg (>0.1 wt%) while the minor (<0.1 wt%) minerals included Na, Fe, Zn, Cu and other heavy metals. Among the major minerals, K was the most abundant component in switchgrass (0.89%) and sorghum (0.42%), while Ca was the highest (0.65%) in red cedar. The order of trace mineral contents in the three feedstocks were the same; Fe was the highest, followed by Mn and Zn.
Table 4. Mineral content of char.
FeedstockERP (%)Ca (%)K (%)Mg (%)Na (%)S (%)Fe (ppm)Zn (ppm)Cu (ppm)Mn (ppm)Ni (ppm)
Switchgrass0*0.100.250.890.260.0020.05134252383
0.200.531.701.520.820.050.0810,6921841560251
0.250.681.902.081.050.060.1024,2921803378556
0.280.290.770.750.400.030.046,83878924827
Sorghum0*0.040.220.420.090.040.05640102381
0.200.471.084.120.810.020.113,19173101618
0.250.711.636.251.340.020.138,207901727811
0.280.561.753.870.690.150.092,2495261077
Red Cedar0*0.020.650.120.040.0020.0329491871
0.200.040.910.220.080.0050.022,5524031439
0.250.122.640.710.260.0180.0735,592593552974
0.280.152.461.360.330.0250.0730,610632149561
Notes: * Equivalence ratio of zero represents raw biomass. All values are on dry weight basis.
When comparing the mineral contents of char and raw feedstocks, it is clear that the concentrations of all mineral in char were higher than that of raw biomass. The contents of K and Ca increased from less than 1% in the raw biomass to 1%–6% in the char. Among the heavy metals, Mn content increased from less than 80 ppm in the raw biomass to 200–700 ppm in the char, indicating that the gasification process enhanced the aggregation of mineral contents in the char. However, the increase in concentration also depended on the biomass variety. For example, Mg content in sorghum-derived char was 10 times higher than that of sorghum, while Mg content in switchgrass-derived char was only 3 times higher than that of the switchgrass. The K content of sorghum-derived char increased by 10 to 20 times as compared that of the raw sorghum, while K content of switchgrass-derived char only doubled as compared to that of the raw switchgrass. The gasification process also did not change the order of individual mineral concentration in char as compared to that in the raw biomass.
The distribution of char mineral content, such as Ca and K, is considered an important characteristic when used as a soil amendment, as they are nutrient elements for plant growth. On the other hand, heavy metals in char are considered hazardous for the environment [26]. Since the gasification process accumulated Ca and K content as well as the heavy metals, use of biomass-based char as a soil amendment may need further investigation. Contents of K and Ca in char were the highest at 0.25 ER (as shown in Table 4), although ash contents of the char obtained at this ER were not the highest. A higher ER usually leads to a higher gasification temperature due to more heat generated from intensified oxidation. The increases in gasification temperature and amount of oxygen in turn increase volatilization of the minerals (K and Ca) [27] and reaction with the carbon during gasification. The intensified oxidation with increase in ER would also consume more biomass carbon, reducing the carbon content of char and thus increasing the mineral contents in the char. For instance, char obtained at 0.20 ER had high carbon content and low K and Ca contents because of low gasification temperature (Table 3).

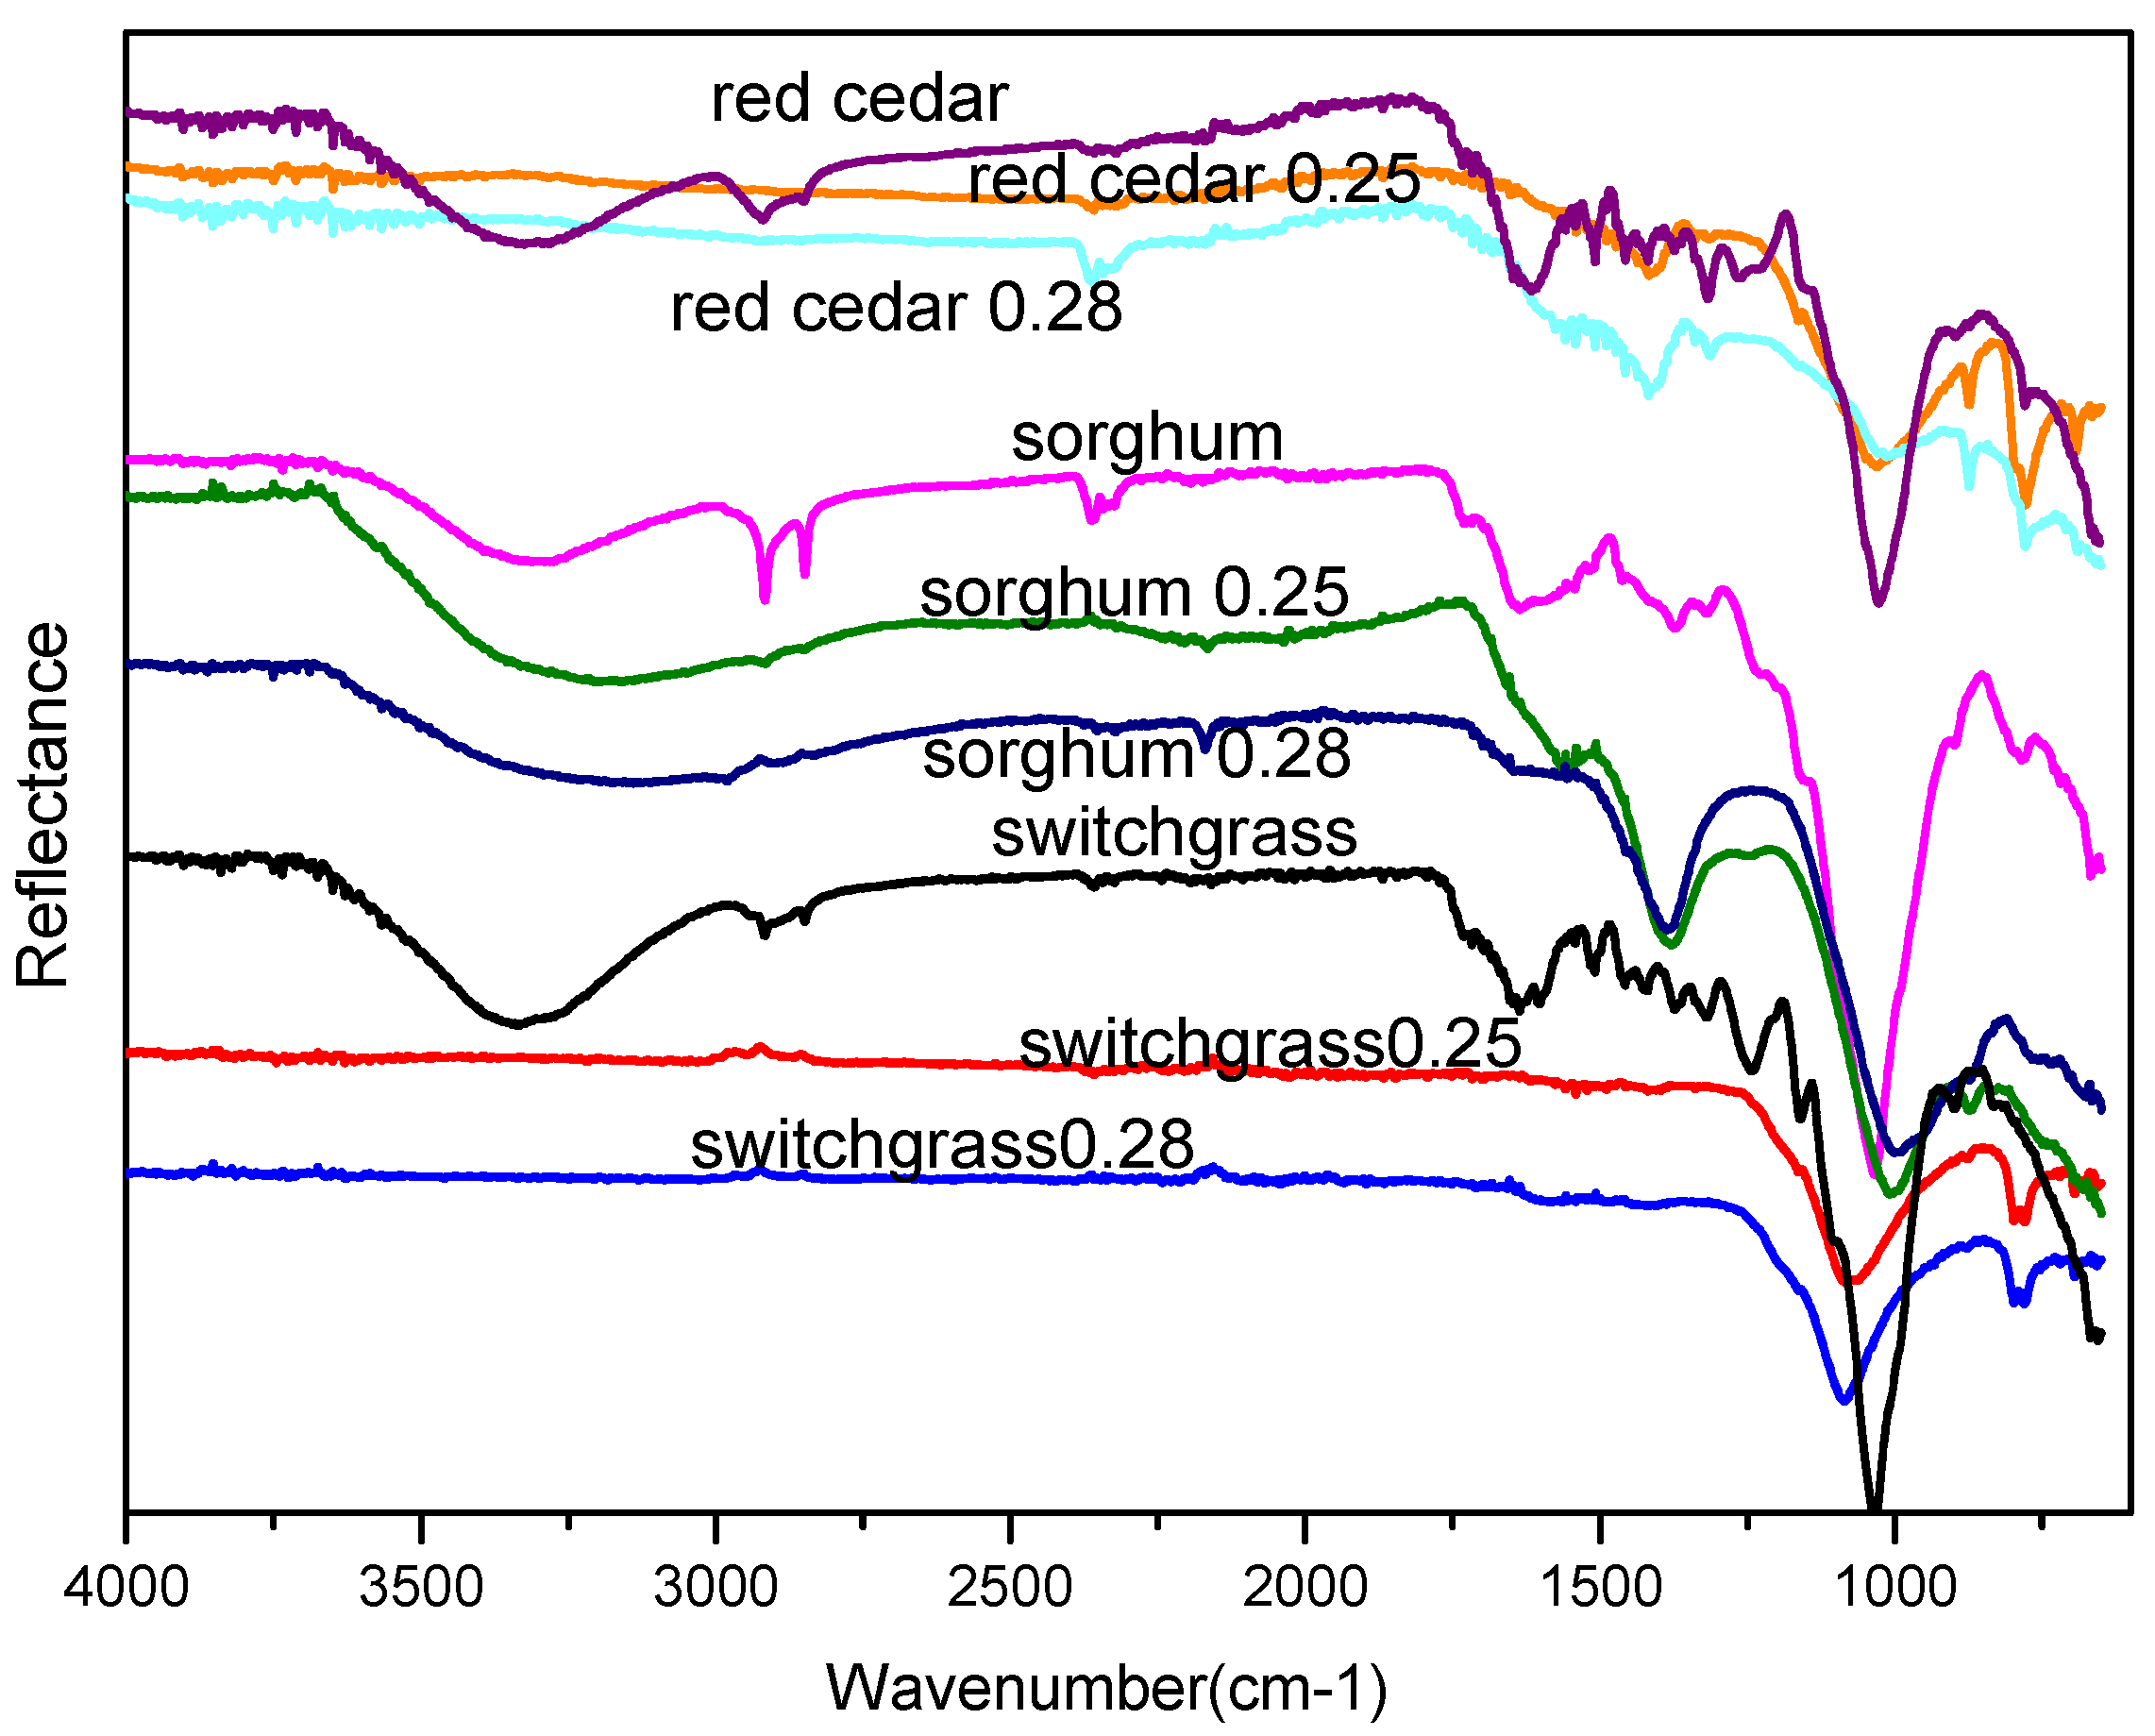
3.4. ATR FT-IR Analysis

The FTIR spectra of biomass and char are illustrated in Figure 2, and Table 5 lists the typical identified FTIR spectrum adsorptions reported in literature [10,28,29].
Table 5. ATR FT-IR characteristic absorption of feedstocks and char.
Functional groupCharacteristic absorption (cm−1)Feedstocks and chars
Alkyl C-H Stretch [28]2950–2850Red cedar, switch grass, sorghum straw, char with 0.2 ER
Aromatic C-H Bending [28]860–680Red cedar, switch grass, sorghum straw and respective chars
Aromatic C=C Bending [28]1600–1500Red cedar, switch grass, sorghum straw
aromatic C, indicative of lignin C=C [29]1440, 1510Red cedar, switchgrass, sorghum straw and sorghum char
Alcohol/Phenol O-H Stretch [28]3550–3200Red cedar, sorghum, sorghum char, switchgrass
Aldehyde, Ketone, Ester, Carboxylic Acid [10]1780–1700Red cedar, switch grass, sorghum straw
Phenol O-H bending [28]1375Raw biomass, switchgrass and sorghum char
C-O stretching C-O-C groups and aryl ethers; phenolic C-O associated with lignin [29]1270–1250Red cedar, switch grass, sorghum straw, switchgrass and sorghum char of ER 0.2
Phosphines and phosphine oxides, Silican oxid, C-O-C stretching [10,30]1100–950All
A broad band was found (see Figure 4) at 3400–3200 cm−1 (O-H stretching) in all the biomass and sorghum-derived char, but not in the char derived from switchgrass and red cedar. This O-H stretching may be attributed to the moisture content, or presence of hydroxyl or phenol groups. The disappearance of the O-H group in char derived from red cedar and switchgrass could be attributed to the removal of moisture and dehydration processes. The peaks in the 2950–2800 cm−1 range, corresponding to aliphatic C-H stretching, were found in all three types of biomass. However, only char derived from sorghum showed a small peak in the 2950–2800 cm−1 region, suggesting that the gasification process might have destroyed aliphatic structures in the biomass. The remaining small peak observed from sorghum-derived char may be due to the existence of a heat-resistant aliphatic structure in sorghum. The peaks around 780 cm−1, corresponding to aromatic C-H bending, were clearly visible in all biomass and char. This implied that aromatic structures existed in both the raw biomass and char, except in char derived from switchgrass. The peaks around 1375 cm−1, corresponding to O-H bending of phenols, were found in all three raw biomasses, and chars derived from red cedar and sorghum (not in switchgrass-derived char). This suggests that the char derived from red cedar and sorghum contained more phenol groups than the char derived from switchgrass. Phenolic groups are usually considered to be related with the lignin content in feedstock. The more phenol groups in char derived from red cedar and sorghum may result from the higher lignin content in raw biomass. Vamsee et al. [31] tested switchgrass and red cedar lignin content and found that the lignin content in red cedar was higher than switchgrass. All of the biomass and char samples showed a strong and broad peak at around 1000 cm−1, which may represent phosphines, phosphine oxides, C-O-C stretching or silicon oxides [10]. Keiluweit et al. [29] also observed the broad peak at around 1000 cm−1 in char obtained at low temperature (less than 500 °C) and they associated this peak to C-O-C stretching in cellulose and hemicellulose. However, they observed that this peak disappears in char obtained at higher temperature (greater than 700 °C), which they attributed to the degradation of cellulose and hemicellulose. In our study, all three biomass showed broad and strong peak at around 1000 cm−1. On the other hand, all biomass-derived char showed much weaker peaks indicating that cellulose and hemicellulose of biomass decomposed during gasification. All biomass also showed peaks near 1250 cm−1, which corresponded to the C-O stretching of aryl ethers and phenolics of lignin-derived compounds, and C-O stretching of pyranone rings and guaiacyl monomers related to cellulose-derived compounds [29]. However, these peaks were not seen in the char indicating the breakage of methoxyl groups during decomposition of lignin and cellulose during biomass gasification.
Figure 4. FT-IR spectra of raw biomass and char obtained at equivalent ratios of 0.25 and 0.2.
Energies 06 03972 g004

4. Conclusions

The effects of three biomass types (switchgrass, sorghum and red cedar) and three equivalence ratios (0.20, 0.25, and 0.28) on properties of char obtained through gasification were studied. The char moisture and fixed carbon contents decreased while ash content increased with increase in equivalence ratio. Surface areas of most of the char samples were 1 to 10 m2/g. The red cedar-derived char had the highest BET surface area of 60.8 m2/g at an equivalence ratio of 0.25. An increase in equivalence ratio increased BET surface area. Ash contents of all char samples were much higher (more than 40 wt%) that those of the corresponding biomass feedstocks (less than 5.05 wt%). The low surface areas and high ash contents of biomass gasification chars may present challenges in their utilization as precursors for activated carbon or as fuel for combustion. The FT-IR spectra showed that during gasification biomass feedstocks lose aliphatic C-H bonds but retain aromatic C-H bonds in the char. In addition, the C-O-C bond of char was weaker than that of biomass, indicating decomposition of cellulose and hemicellulose.

Acknowledgements

This project was funded, in part, by the Oklahoma Agricultural Experiment Station and the South Central Sun Grant Program through USDA-NIFA Award No. 2010-38502-21836.

Conflict of Interest

The authors declare no conflict of interest.

References

  1. Zhang, A.; Bian, R.; Pan, G.; Cui, L.; Hussain, Q.; Li, L.; Zheng, J.; Zheng, J.; Zhang, X.; Han, X.; et al. Effects of biochar amendment on soil quality, crop yield and greenhouse gas emission in a Chinese rice paddy: A field study of 2 consecutive rice growing cycles. Field Crop Res. 2012, 127, 153–160. [Google Scholar]
  2. Meyer, S.; Glaser, B.; Quicker, P. Technical, economical, and climate-related aspects of biochar production technologies: A literature review. Environ. Sci. Technol. 2011, 45, 9473–9483. [Google Scholar]
  3. Lehmann, J.; Rillig, M.C.; Thies, J.; Masiello, C.A.; Hockaday, W.C.; Crowley, D. Biochar effects on soil biota—A review. Soil Biol. Biochem. 2011, 43, 1812–1836. [Google Scholar]
  4. Oleszczuk, P.; Hale, S.E.; Lehmann, J.; Cornelissen, G. Activated carbon and biochar amendments decrease pore-water concentrations of polycyclic aromatic hydrocarbons (PAHs) in sewage sludge. Bioresour. Technol. 2012, 111, 84–91. [Google Scholar]
  5. Azargohar, R.; Dalai, A.K. Steam and KOH activation of biochar: Experimental and modeling studies. Microporous Mesoporous. Mat. 2008, 110, 413–421. [Google Scholar]
  6. Lima, I.M.; Marshall, W.E. Adsorption of selected environmentally important metals by poultry manure-based granular activated carbons. J. Chem. Technol Biotechnol. 2005, 80, 1054–1061. [Google Scholar]
  7. Wang, D.; Yuan, W.; Ji, W. Char and char-supported nickel catalysts for secondary syngas cleanup and conditioning. Appl. Energy 2011, 88, 1656–1663. [Google Scholar]
  8. Abu El-Rub, Z.; Bramer, E.A.; Brem, G. Experimental comparison of biomass chars with other catalysts for tar reduction. Fuel 2008, 87, 2243–2252. [Google Scholar]
  9. Manyà, J.J. Pyrolysis for biochar purposes: A review to establish current knowledge gaps and research needs. Environ. Sci. Technol. 2012, 46, 7939–7954. [Google Scholar]
  10. Cantrell, K.B.; Hunt, P.G.; Uchimiya, M.; Novak, J.M.; Ro, K.S. Impact of pyrolysis temperature and manure source on physicochemical characteristics of biochar. Bioresour. Technol. 2012, 107, 419–428. [Google Scholar]
  11. Kumar, A.; Jones, D.; Hanna, M. Thermochemical biomass gasification: A review of the current status of the technology. Energies 2009, 2, 556–581. [Google Scholar]
  12. Dąbrowski, A.; Podkościelny, P.; Hubicki, Z.; Barczak, M. Adsorption of phenolic compounds by activated carbon—A critical review. Chemosphere 2005, 58, 1049–1070. [Google Scholar]
  13. Brewer, C.E.; Schmidt-Rohr, K.; Satrio, J.A.; Brown, R.C. Characterization of biochar from fast pyrolysis and gasification systems. Environ. Prog. Sustain. 2009, 28, 386–396. [Google Scholar]
  14. Melligan, F.; Auccaise, R.; Novotny, E.H.; Leahy, J.J.; Hayes, M.H.B.; Kwapinski, W. Pressurised pyrolysis of Miscanthus using a fixed bed reactor. Bioresour. Technol. 2011, 102, 3466–3470. [Google Scholar]
  15. Sharma, A.; Kumar, A.; Patil, K.; Huhnke, R. Performance evaluation of a lab-scale fluidized bed gasifier using switchgrass as feedstock. Trans. ASABE 2011, 54, 2259–2266. [Google Scholar]
  16. ASTM International. Standard Test Method for Volatile Matter in the Analysis Sample of Coal and Coke; ASTM Standard D3175-11; ASTM International: West Conshohocken, PA, USA, 2011. [Google Scholar]
  17. ASTM International. Standard Test Methods for Direct Moisture Content Measurement of Wood and Wood-Base Materials; ASTM Standard D4442-07; ASTM International: West Conshohocken, PA, USA, 2007. [Google Scholar]
  18. ASTM International. Standard Test Method for Ash in Biomass; ASTM Standard E1755-01(2007); ASTM International: West Conshohocken, PA, USA, 2007. [Google Scholar]
  19. ASTM International. Standard Practice for Proximate Analysis of Coal and Coke; ASTM Standard D3172-07a; ASTM International: West Conshohocken, PA, USA, 2007. [Google Scholar]
  20. Bruun, E.W. Application of Fast Pyrolysis Biochar to a Loamy Soil-Effects on Carbon and Nitrogen Dynamics and Potential for Carbon Sequestration. Ph.D. Thesis, Technical University of Denmark, Roskilde, Denmark, 2011. [Google Scholar]
  21. Lehmann, J.; Joseph, S. Biochar for Environmental Management: Science and Technology; Earthscan: London, UK, 2009. [Google Scholar]
  22. Gai, C.; Dong, Y.P. Experimental study on non-woody biomass gasification in a downdraft gasifier. Int. J. Hydrog. Energy 2012, 37, 4935–4944. [Google Scholar]
  23. Maroto-Valer, M.M.; Love, G.D.; Snape, C.E. Relationship between carbon aromaticities and HC ratios for bituminous coals. Fuel 1994, 73, 1926–1928. [Google Scholar]
  24. Kuhlbusch, T.A.J.; Crutzen, P.J. Toward a global estimate of black carbon in residues of vegetation fires representing a sink of atmospheric CO2 and a source of O2. Glob. Biogeochem. Cycles 1995, 9, 491–501. [Google Scholar]
  25. Kim, K.H.; Kim, J.-Y.; Cho, T.-S.; Choi, J.W. Influence of pyrolysis temperature on physicochemical properties of biochar obtained from the fast pyrolysis of pitch pine (Pinus rigida). Bioresour. Technol. 2012, 118, 158–162. [Google Scholar]
  26. Tangahu, B.V.; Abdullah, S.; Rozaimah, S.; Basri, H.; Idris, M.; Anuar, N.; Mukhlisin, M. A review on heavy metals (As, Pb, and Hg) uptake by plants through phytoremediation. Int. J. Chem. Eng. 2011, 2011, 939161:1–939161:31. [Google Scholar]
  27. Okuno, T.; Sonoyama, N.; Hayashi, J.; Li, C.Z.; Sathe, C.; Chiba, T. Primary release of alkali and alkaline earth metallic species during the pyrolysis of pulverized biomass. Energy Fuel 2005, 19, 2164–2171. [Google Scholar]
  28. Silverstein, R.M.; Webster, F.X.; Kiemle, D. Spectrometric Identification of Organic Compounds, 7th ed.; John Wiley and Sons: Hoboken, NJ, USA, 2005. [Google Scholar]
  29. Keiluweit, M.; Nico, P.S.; Johnson, M.G.; Kleber, M. Dynamic molecular structure of plant biomass-derived black carbon (biochar). Environ. Sci. Technol. 2010, 44, 1247–1253. [Google Scholar]
  30. Shokri, B.; Firouzjah, M.A.; Hosseini, S.I. FTIR Analysis of Silicon Dioxide Thin Film Deposited by Metal Organic-Based PECVD. In Proceedings of 19th International Symposium on Plasma Chemistry Society, Bochum, Germany, 26–31 August 2009.
  31. Pasangulapati, V.; Ramachandriya, K.D.; Kumar, A.; Wilkins, M.R.; Jones, C.L.; Huhnke, R.L. Effects of cellulose, hemicellulose and lignin on thermochemical conversion characteristics of the selected biomass. Bioresour. Technol. 2012, 114, 663–669. [Google Scholar]

