1. Introduction
In order for wave energy to significantly contribute to the renewable energy share, WECs need to achieve efficient and reliable operation and stable grid connection. On the other hand, reduction in the cost of energy produced from the waves is of fundamental importance to determine the success of the sector and to make it competitive with other renewables. On this respect electric components and subsystems play a relevant role—in fact, about 25% of the costs of energy derived from WECs is associated to the power take-Off (20%) and to the electrical installations (5%), with potential cost savings in the range 35%–65% and 15%–30%, respectively [
1]. The main ways to meet these targets are technological improvements in single devices and rational and efficient design of the overall systems.
Other ways to favour the economic viability of wave energy lie in the possibility to integrate WECs into hybrid systems, coupling them, for example, to wind turbines [
2,
3]. Another option is to apply them in favorable contexts, such as remote locations currently experiencing very high costs of energy. Actually, remote islands represent an ideal scenario for wave energy integration, due to the potential high availability of the primary resource and the high cost of energy, that largely relies on diesel generation. High energy costs in remote communities already encouraged the investigation of a diversified and sustainable energy mix, including renewable sources such as wind and photovoltaic [
4,
5]; however wave energy has not been extensively considered in this context, except for desalination projects [
6,
7].
Isolated networks usually represent very weak grids and accurate power flow control is of paramount importance to ensure the stability of the system. For this purpose energy storage is especially relevant to help match electricity generation and load consumption and to balance the high intermittency of renewable energy sources. The usefulness of energy storage in wave energy applications has already been shown both in strong and in weak electric grids [
8,
9], from the standpoint of power quality improvement and with special focus on short term (
i.e. seconds to minutes) applications. Isolated networks pose additional challenges that call for the consideration of the energy storage option in the long-term timeframe (hours to days) too. Obviously, related cost analyses [
10,
11] are essential to really quantify the advantages of energy storage systems.
The goal of this paper is twofold. It considers the real test case of La Palma, in the Canary Islands and uses the local meteorological data in order to estimate the potential power production from wave energy. Such produced power is quantified using the model of an array of the
Lifesaver WEC designed and produced by Fred Olsen. Then a remote power system based on wave energy + diesel generation is considered and the convenience of integrating an energy storage device in the system for the purpose of energy cost reduction is analyzed. The present study differs from most other contributions on energy storage for wave energy applications because it applies a stochastic approach [
12] to the optimal rating of the energy storage equipment and it provides useful insights on the possible applicable technologies.
The structure of the paper is as follows:
Section 2 offers a general overview of the considered system.
Section 3 presents the approach to diesel generation modeling.
Section 4 describes the target wave energy converter and the procedure to quantify the extractable power.
Section 5 analyzes the potential for wave energy to meet local electricity needs.
Section 6 explains in detail the stochastic method for energy storage sizing and finally
Section 7 presents the simulation results for the considered test case. Discussion and main conclusions follow in
Section 8.
2. Test Case Presentation
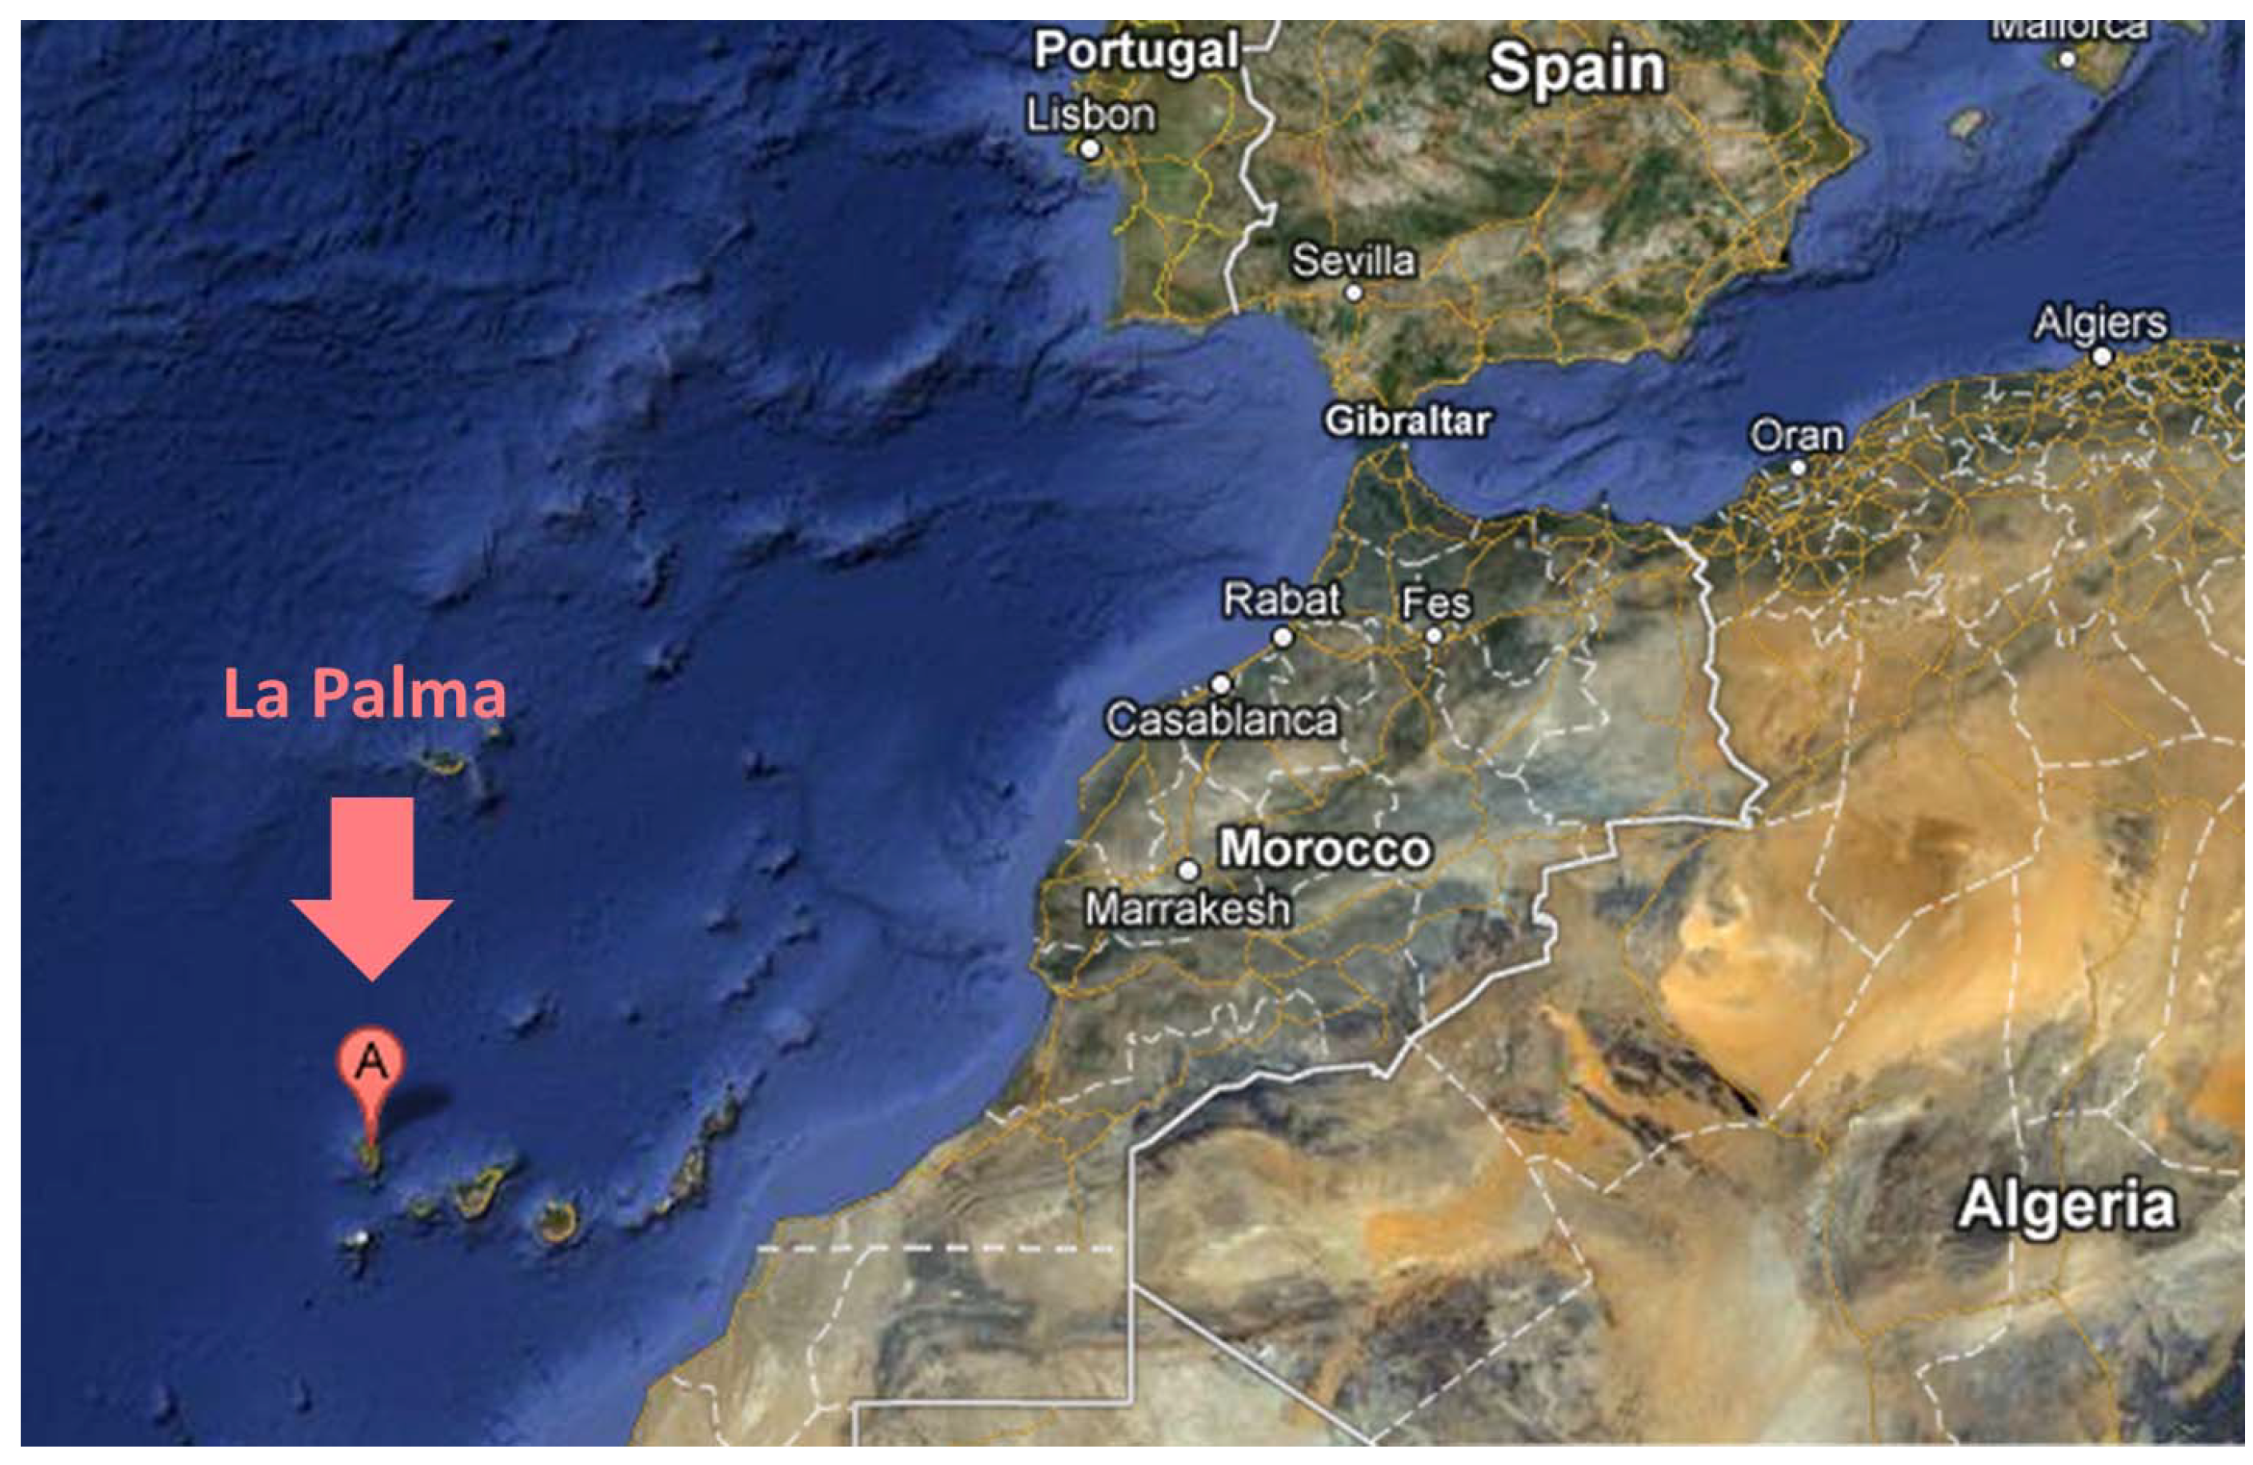
The present paper focuses on the real test case offered by La Palma, the most north-westerly of the Canary Islands, located offshore the coast of Morocco (
Figure 1). La Palma is the third smallest island of the archipelago and it represents an isolated electrical system. Local electricity demand in 2012 oscillated between 9 and 43 MW and it was mostly covered by diesel generation, with a small contribution from wind energy.
Figure 1.
The La Palma Island, in the Canary Island Archipelago.
Figure 1.
The La Palma Island, in the Canary Island Archipelago.
The Canary Islands have a consistent wave energy potential, almost constantly available throughout the year, as it is only marginally affected by seasonal variability. The average power per unit of wave-crest length is around 25–30 kW/m [
13]. The highest wave energy resource is available on the northern coasts of the islands that are directly exposed to the swells coming from the Atlantic Ocean.
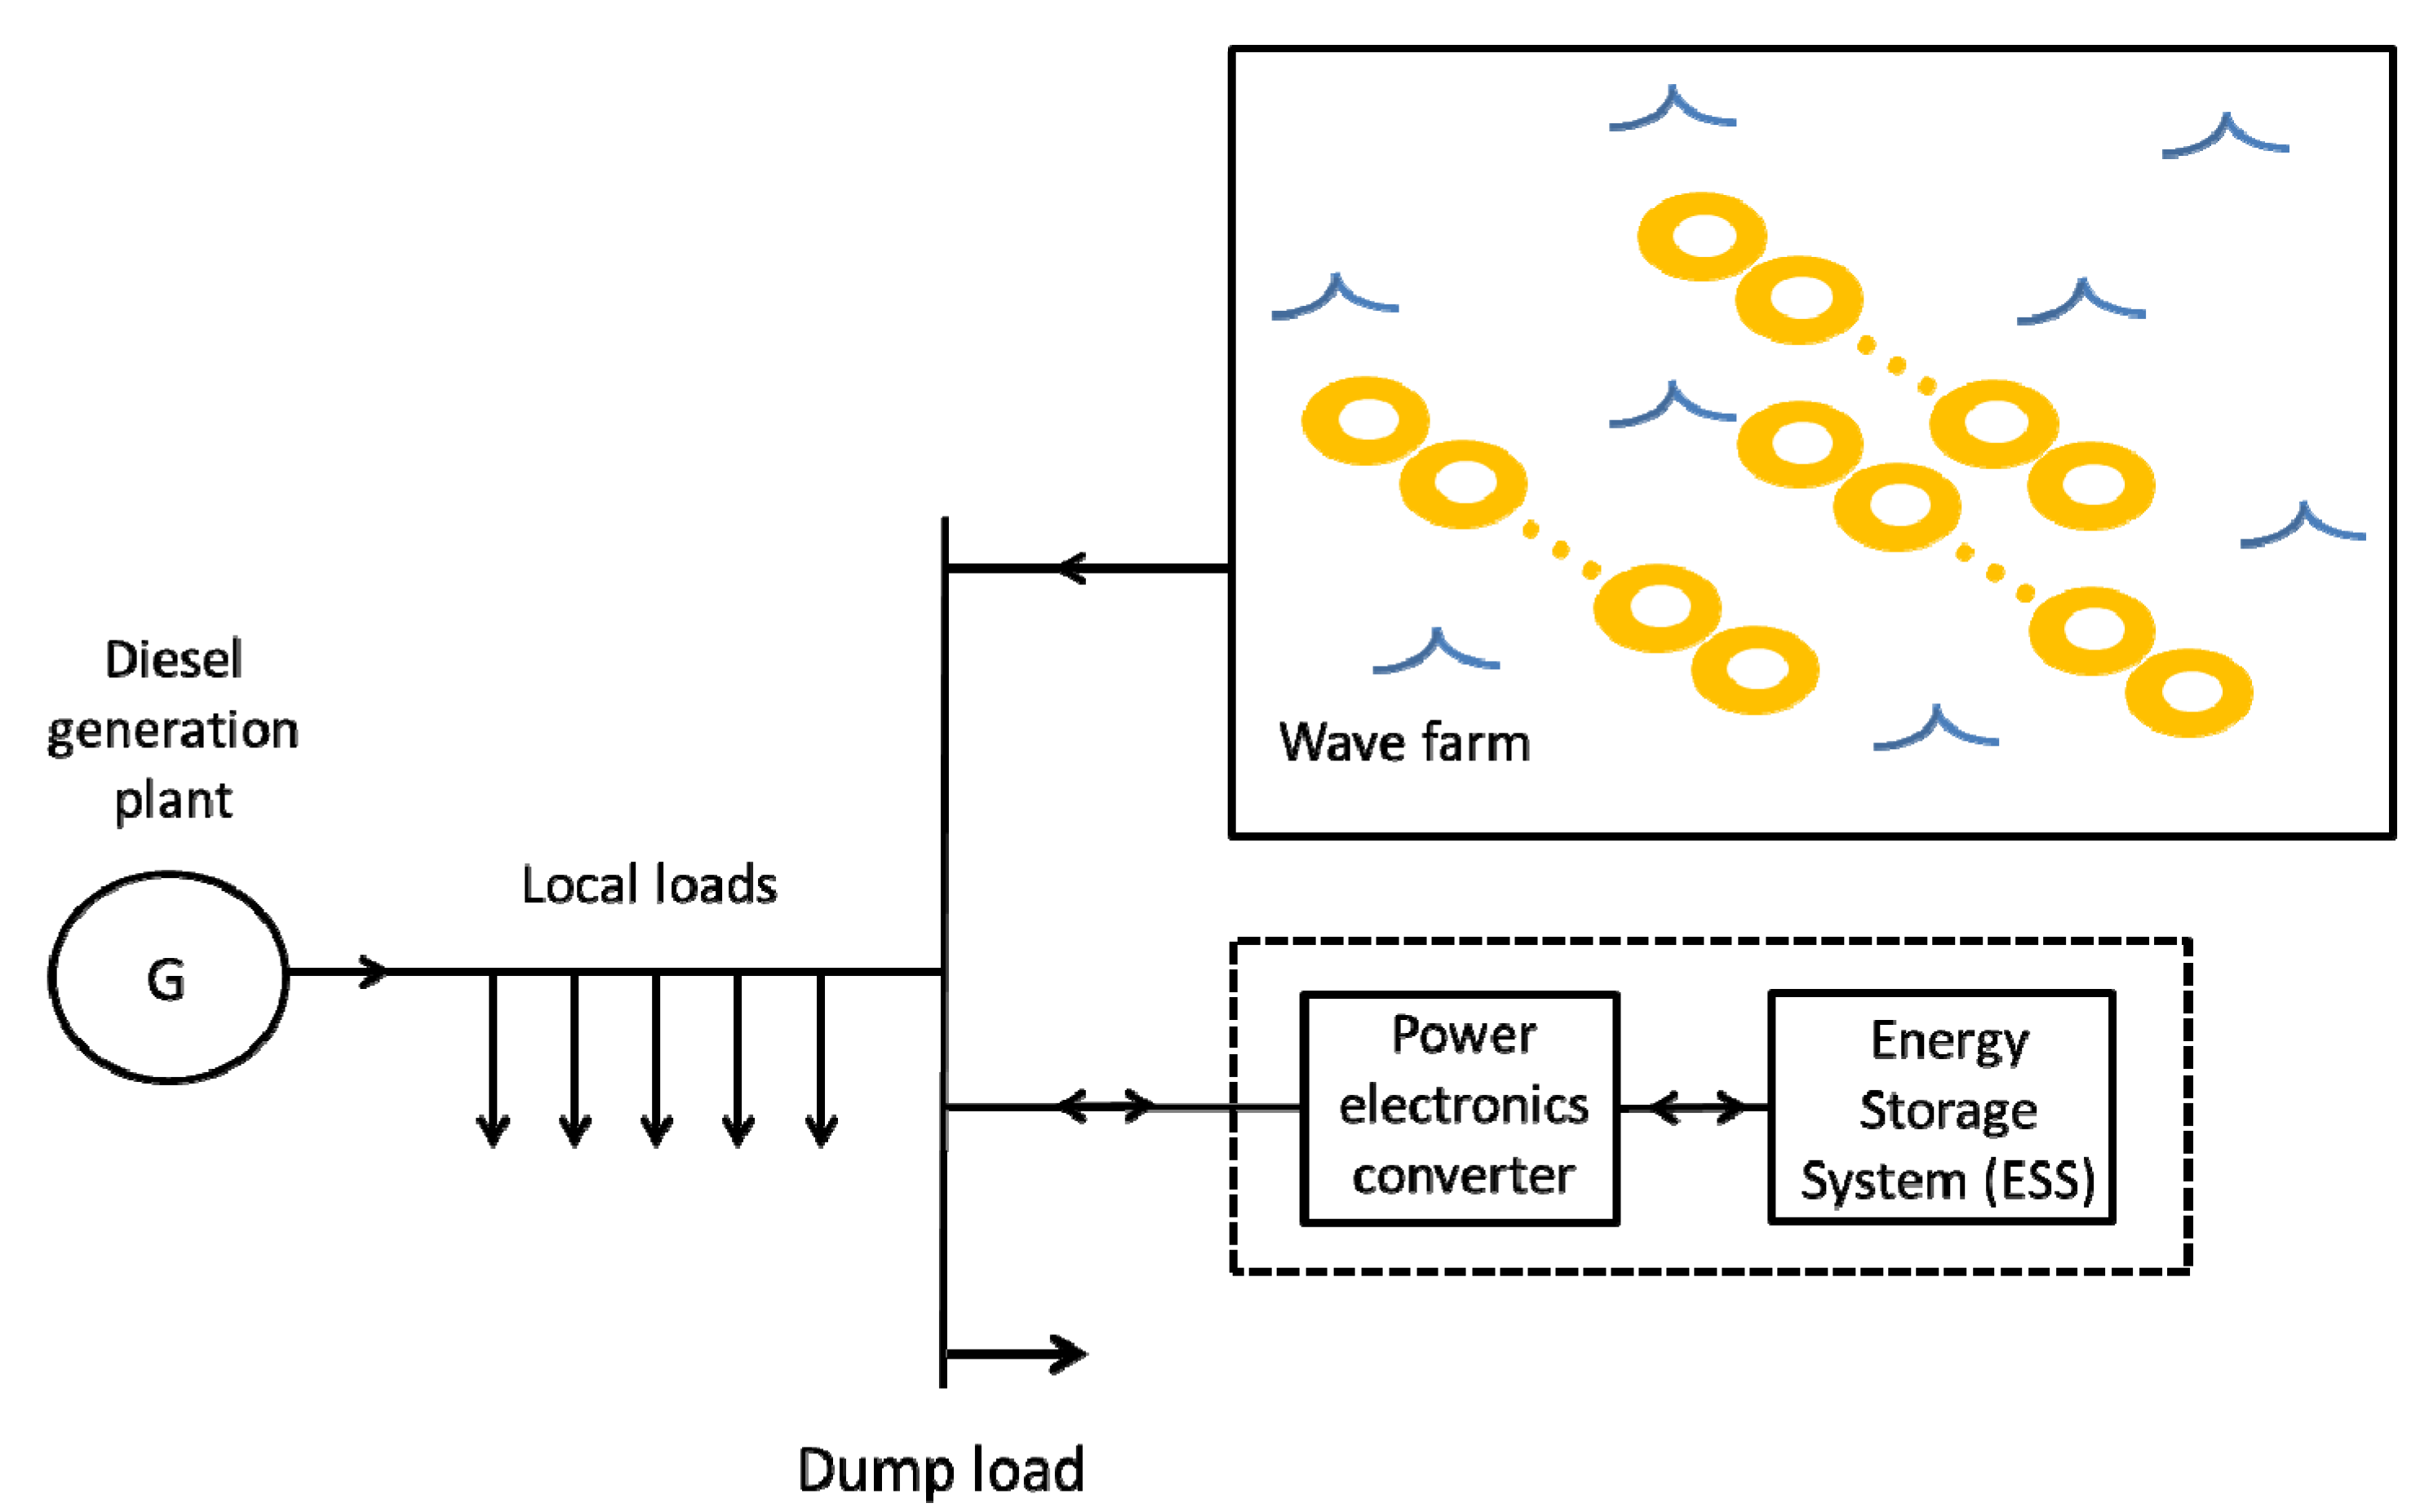
This paper considers the potential for a combined wave/diesel system to meet the local energy demand. The isolated system under investigation is schematically represented in
Figure 2. It is composed of a diesel plant, which supplies most of the electricity and is in charge of the voltage and frequency control in the local weak grid. In the considered test case we assume that a wave farm composed of several WEC arrays contributes to the local power generation. The local electricity consumption can be generically represented by a set of electric loads. An additional dump load is required to balance energy production and consumption whenever an excess of generation occurs.
Figure 2.
Isolated wave/diesel power system, including energy storage device and dump load.
Figure 2.
Isolated wave/diesel power system, including energy storage device and dump load.
In this case, the power balance of the isolated wave/diesel system can be written, in every time instant,
t, as:
In Equation (1) pd represents the power produced by the diesel generator, pfarm the power produced by the wave farm, pL is the total power consumed by the local loads and pdump is the power dissipated by the dump load.
To counteract the intermittency of the renewable source, the isolated wave/diesel system possibly includes an energy storage system (ESS), which contributes to power flow balancing and power quality improvement and can help in energy cost reduction.
In this case the system behavior can be expressed as:
In Equation (2), pES represents the power exchanged by the ESS at time t, which is assumed to be positive during charge intervals and negative during discharge ones.
3. Model of the Diesel Power Generation
Traditional diesel generators need to be operated at or above a minimum loading factor (typically
Pdmin = 0.3 of the rated capacity), in order to maintain a suitable efficiency and avoid lifetime reduction and possible fire hazards [
17]. However, modern diesel generators utilizing electronic fuel injections to maintain suitably high engine temperature can work relatively well below the above mentioned load limit. For the sake of simplicity, in this paper it is considered that the rated capacity of the diesel generation plant equals the yearly peak load and that the diesel generator is always switched on and operates according to the minimum load constraint. This can be mathematically expressed by writing the power produced by the diesel generator in each time instant,
t, as:
Such an operation strategy of the diesel generator requires a dump load to dissipate the power excess, whenever power production exceeds power consumption. The power dissipated by the dump load can be expressed as:
It is here assumed that the corresponding dumped energy is wasted as heat and not used to supply other heating loads.
4. Model of the Wave Power Generation
The power production from the waves is evaluated based on the performance of the WEC
Lifesaver point absorber, developed by Fred. Olsen [
18].
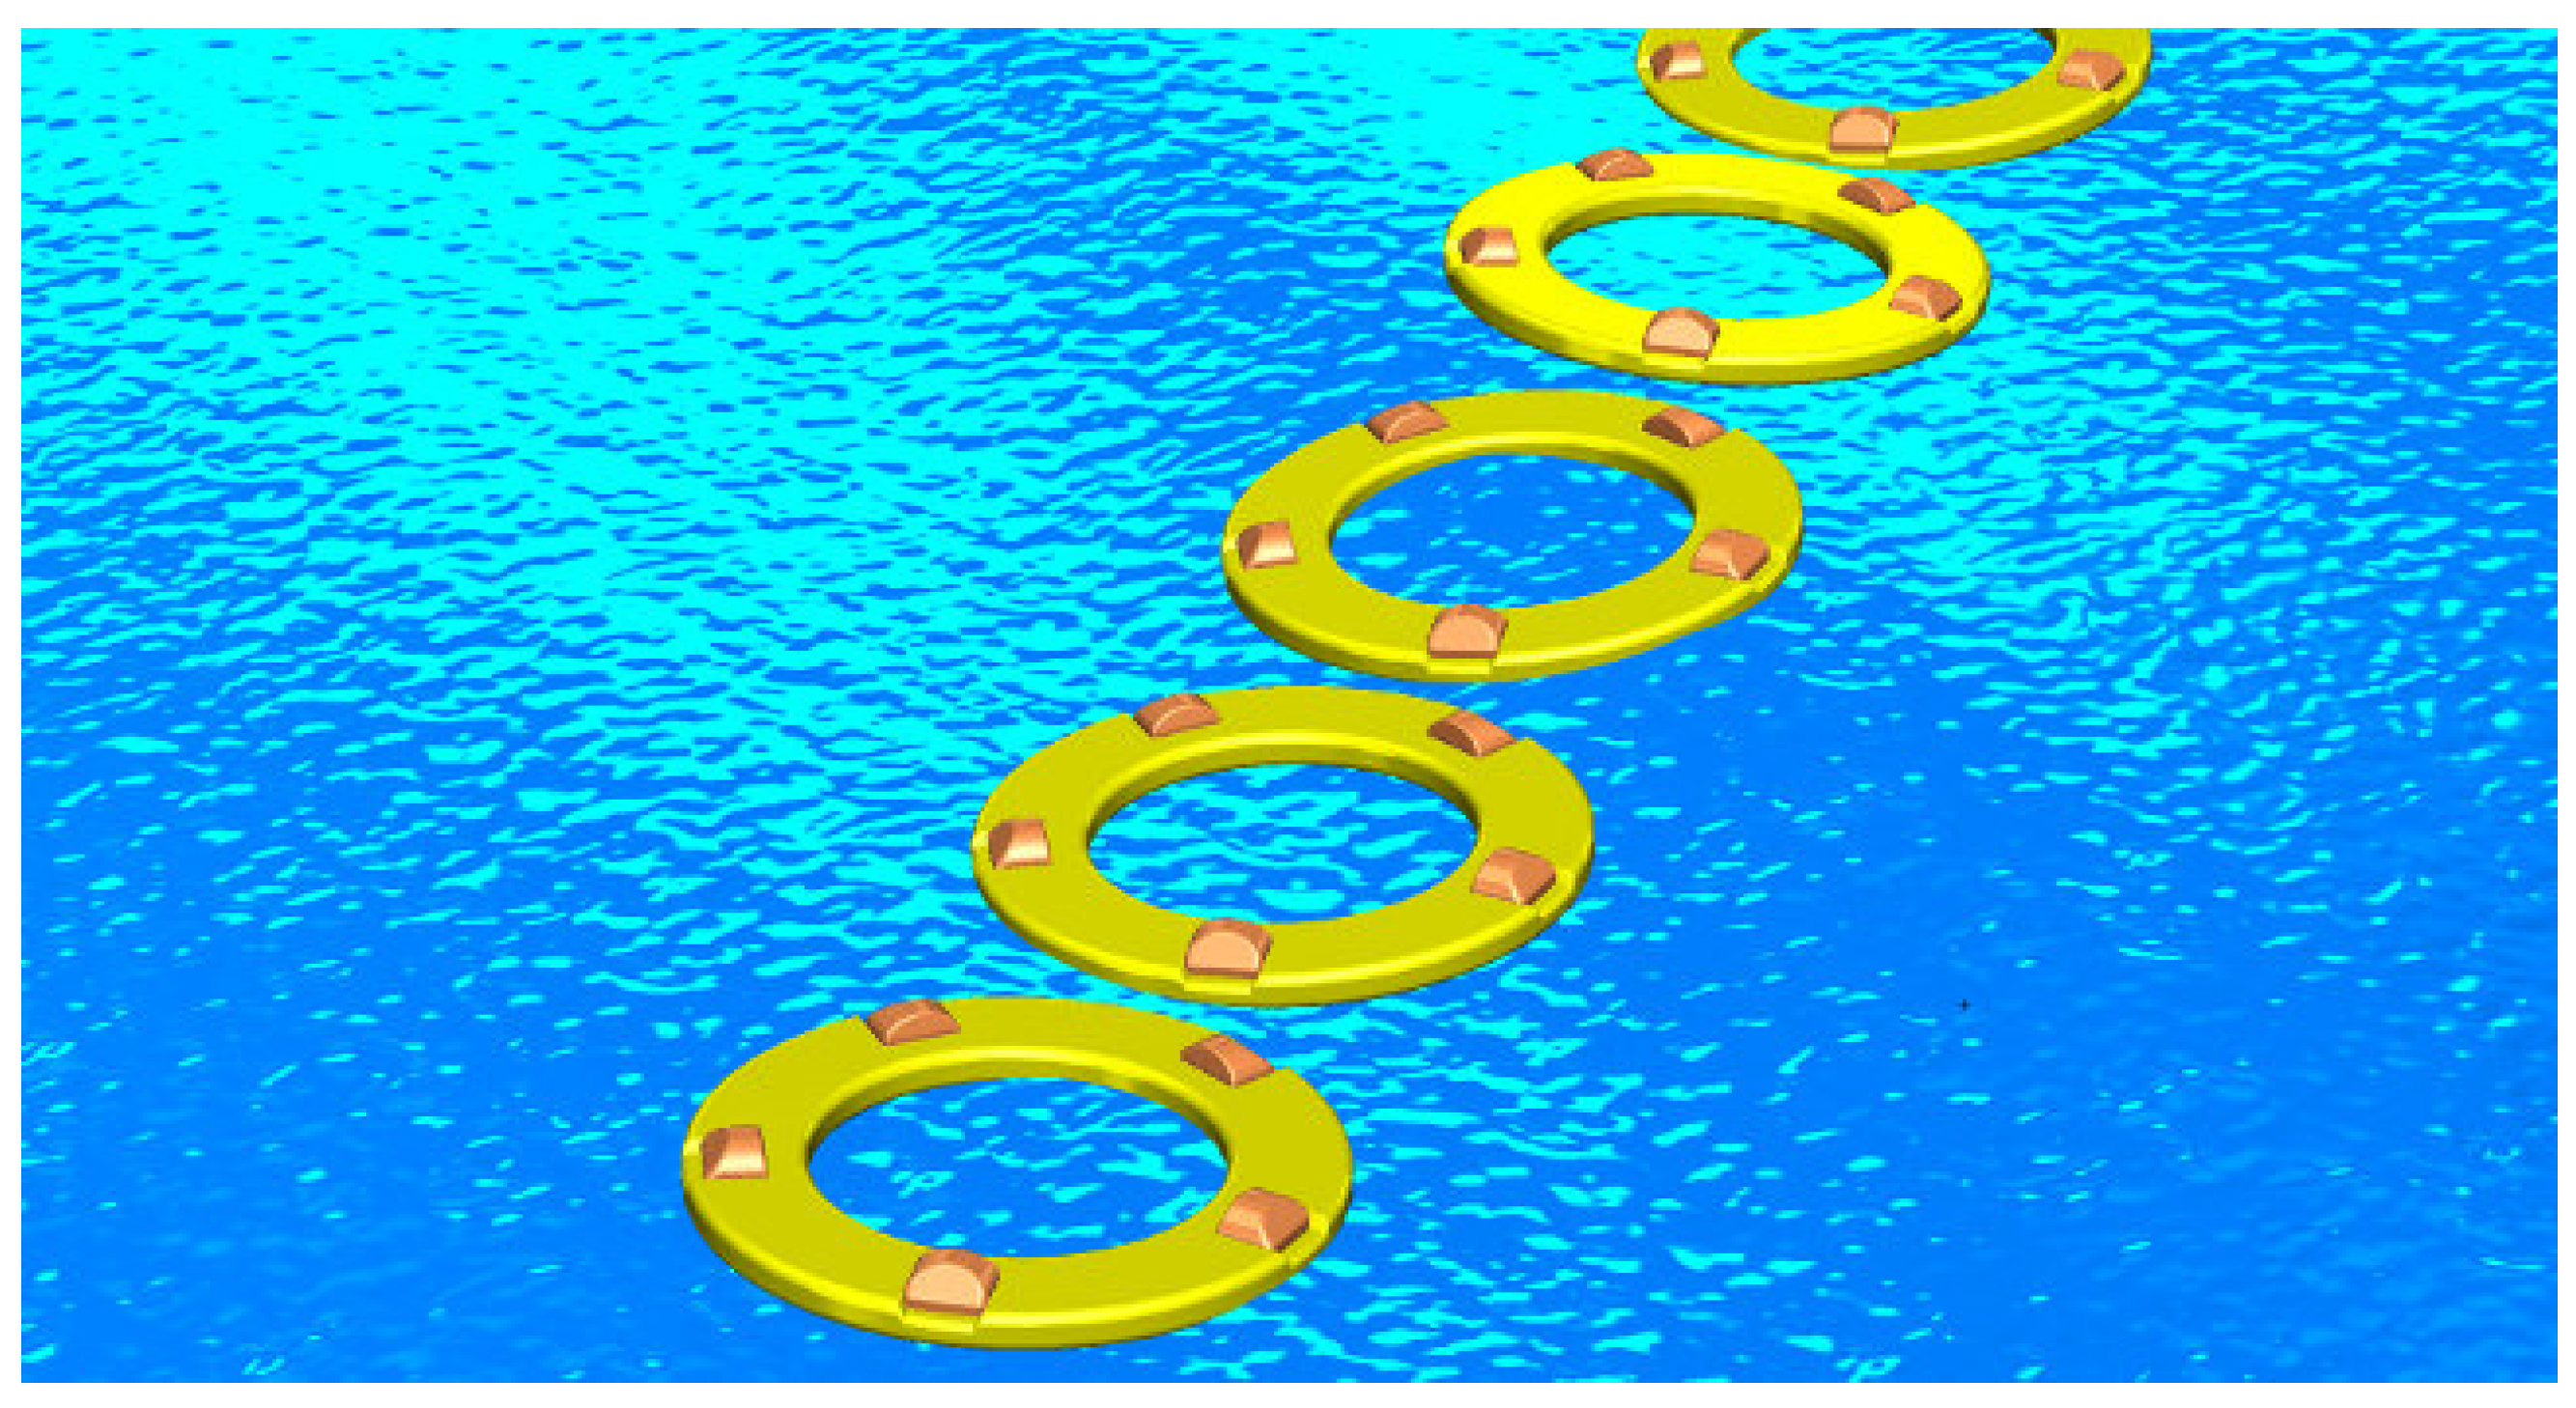
Lifesaver is a toroid shape WEC equipped with five individual all-electric Power Take-Off (PTO) units. The PTOs are tightly moored to the sea floor by a winch and drum system, which directly ties surface movements to the generator through a custom designed transmission system. The generator is controlled by a full-scale converter, which allows for direct torque control at various speeds. An advanced control algorithm that is optimized for maximized power extraction is implemented, but results in high fluctuations and low power quality on the output. The fluctuations are mainly caused by the production cycle within a single wave, and, as a measure both to increase power output and to improve the power quality, multiple devices are configured in an array. The array consists of 5–10 devices so that a full wavelength is covered.
Figure 3 shows an artistic impression of an array of
Lifesavers. A complete wave farm will consist of multiple arrays to meet the demand for the given location. In this study, the farm is scaled to optimize the balance between production and consumption.
Figure 3.
Artistic impression of a WEC energy array based on Lifesaver.
Figure 3.
Artistic impression of a WEC energy array based on Lifesaver.
A detailed simulation model is developed by Fred. Olsen to simulate the performance and output power from the WEC and is described in detail in
Section 4.1 and
Section 4.2. The model outputs a complete output power scatter for all occurring wave heights, periods and wave directions so that the power output can be estimated directly by considering meteorological data.
4.1. Simulation Model of Lifesaver
The model used for the WEC simulation is based on the single absorber model for Bolt2 [
19,
20]. The simulation model solves Equation (5) for
ζ(t) in the time domain, where the index
i denotes the mode of motion, given by the six degrees of freedom (DOF) of motion for the floater. The excitation force matrix
Fe,i is the time dependent force due to incident waves, and
M denotes the mass of the system:
where
FD,i accounts for the sum of all the damping forces in Equation (6). Here,
Fr,i accounts for the time dependent forces on the floater due to radiation of waves. The term
Fd,I accounts for non-linear damping terms, mainly the drag forces.
ζi(t) is the time dependent motion of the floater,
Ci is the restoring force matrix accounting for the hydrostatic pressure acting on the floater, and
FPTO(t) is the time dependent force applied from the PTO. The PTO is modeled as a rope and winch system that is tightly moored to the sea floor.
Since the simulation is based on a detailed 6DOF model for Bolt2, Fred Olsen keeps the simulation model confidential. However, the high level of complexity is not essential for this study and a simplified 1DOF model would produce much the same result. It is therefore possible for a third party to verify the results published here without detailed knowledge about the simulation model used.
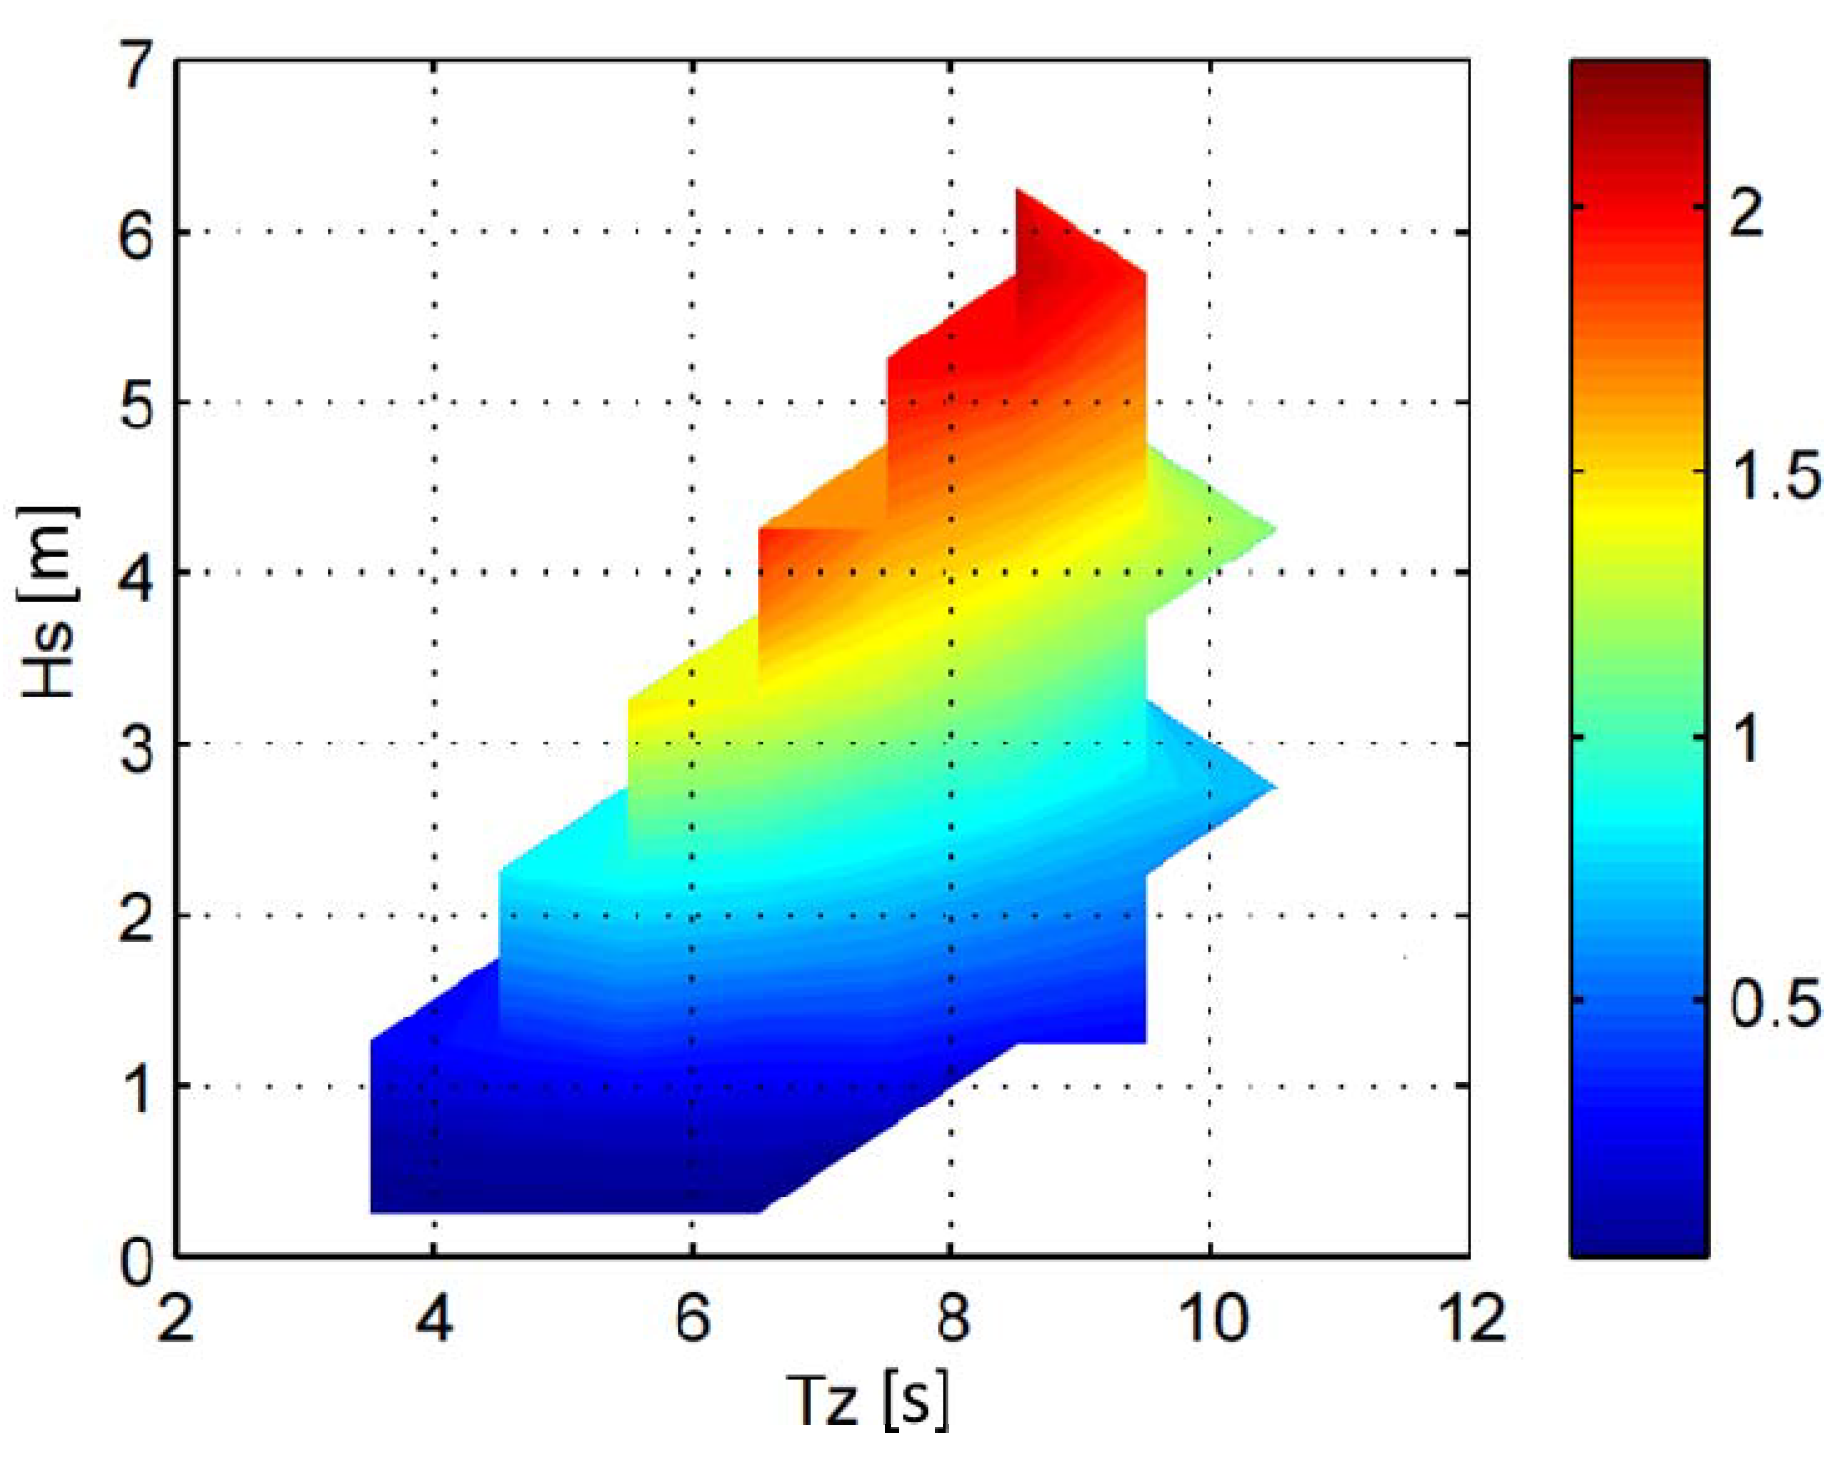
To simulate a wave state, a 20-minute time series of irregular waves is generated based on the JONSWAP spectrum. The subsequent excitation forces are then calculated and the simulation is performed for the full length of the time series. The simulation model also takes into account PTO and generator losses, and the model outputs a 20-minute time series of exported electrical power from the WEC. The simulation model has undergone many years of development and testing, and is verified against real production data from several prototypes, including
Lifesaver. By simulating the power production for all the wave states that occur in the wave scatter for the given site, the complete production scatter plotted in
Figure 4 can be found. The power level is here normalized to the rated power for the device, which occurs at the design wave state
Hs = 2.75 m /
Tz = 6.5 s.
Figure 4.
Scatter diagram of the Lifesaver.
Figure 4.
Scatter diagram of the Lifesaver.
4.2. Simulation for the Array
Array simulations are performed by running the simulation model separately for each absorber in the array. All absorbers are simulated for the same wave, and the actual wave propagation through the array is taken into account.
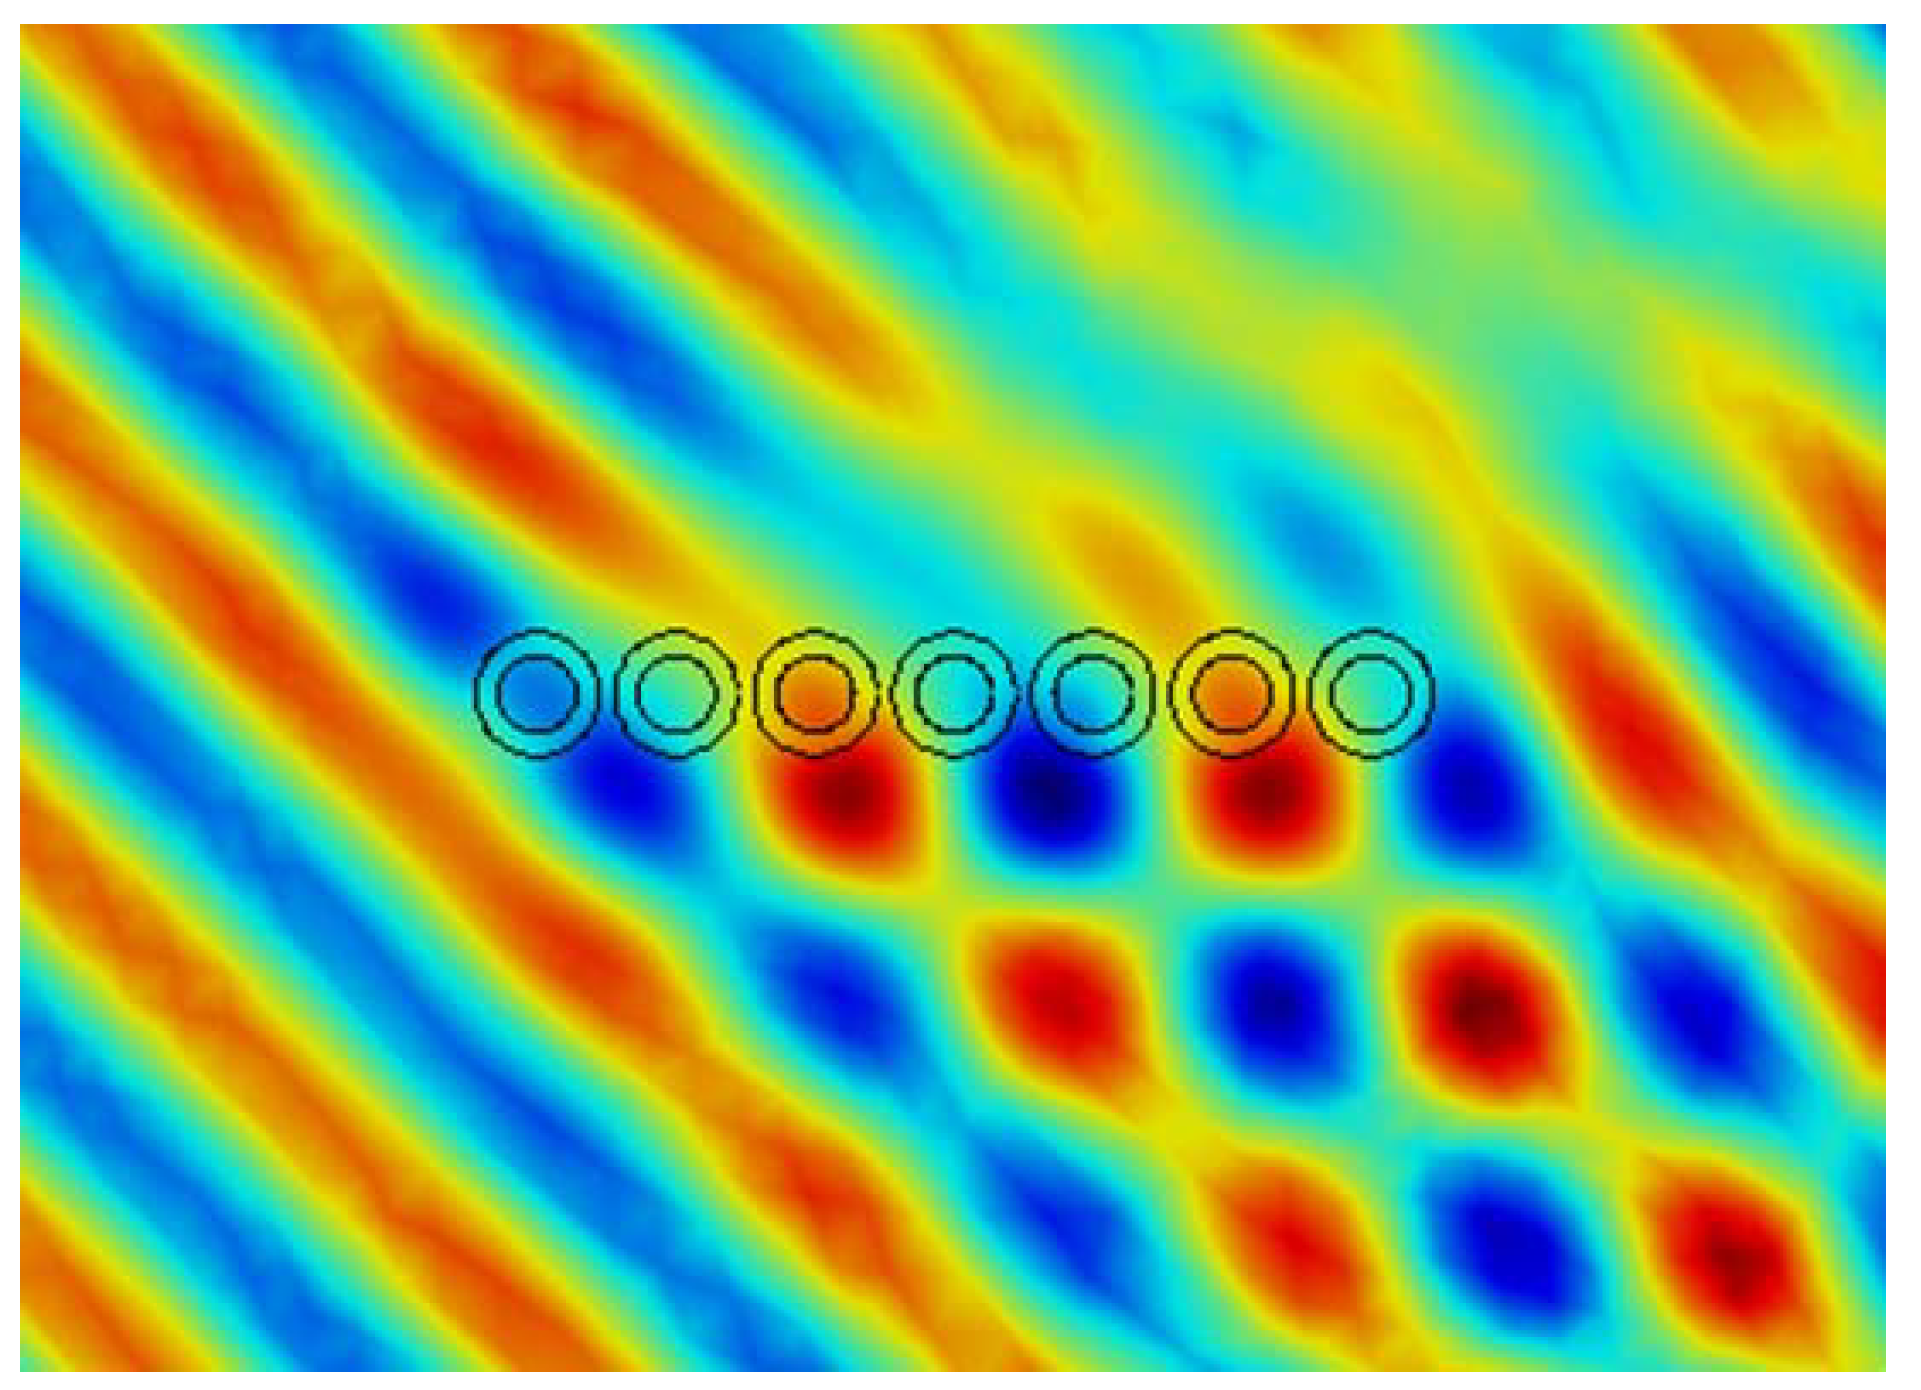
The hydrodynamic problem is solved within the framework of linear potential theory [
21], specifically Laplace’s equation, resulting in the interaction field illustrated in
Figure 5. Since the velocity potential is linear, all contributions to forces and motions are linear. As a result, the principle of superposition applies. Therefore, it is convenient to split the complex problem into a set of simpler problems. The full solution is thus the sum of several simpler solutions.
The potential arising from
NWEC absorbers placed in a string can thus be described as the sum of the contributions given in Equation (7).
The total velocity potential ϕ due to the interaction of NWEC absorbers on a string is the sum of the excitation potential due to incident waves ϕ0 , the diffraction potential due to the interaction of the incident potential with all absorbers at rest ϕD, and the radiation potential ϕR due to the independent motion of every absorber in every mode of motion with no incident waves present.
Figure 5.
Hydrodynamic interactions within the array.
Figure 5.
Hydrodynamic interactions within the array.
The diffraction problem and the radiation problem are solved independently. Thus there are NWEC + 1 independent problems to solve. Further the radiation potential from each absorber is separated in six independent modes of motion. The total potential acting on absorber NWEC in mode i of motion is thus the sum of every other absorbers' radiation and diffraction potential in addition to the diffraction and radiation potential from absorber NWEC acting on itself in mode i of motion. Combining the six modes of motions for each absorber and allowing all absorbers to interact results in a total of NWECx6 independent linear equations to be solved for each wave frequency.
With a full description of the velocity potential, it is possible to integrate solutions in the frequency domain on specific wave climates and optimize the array energy output with respect to array layout angle and power take off damping coefficient.
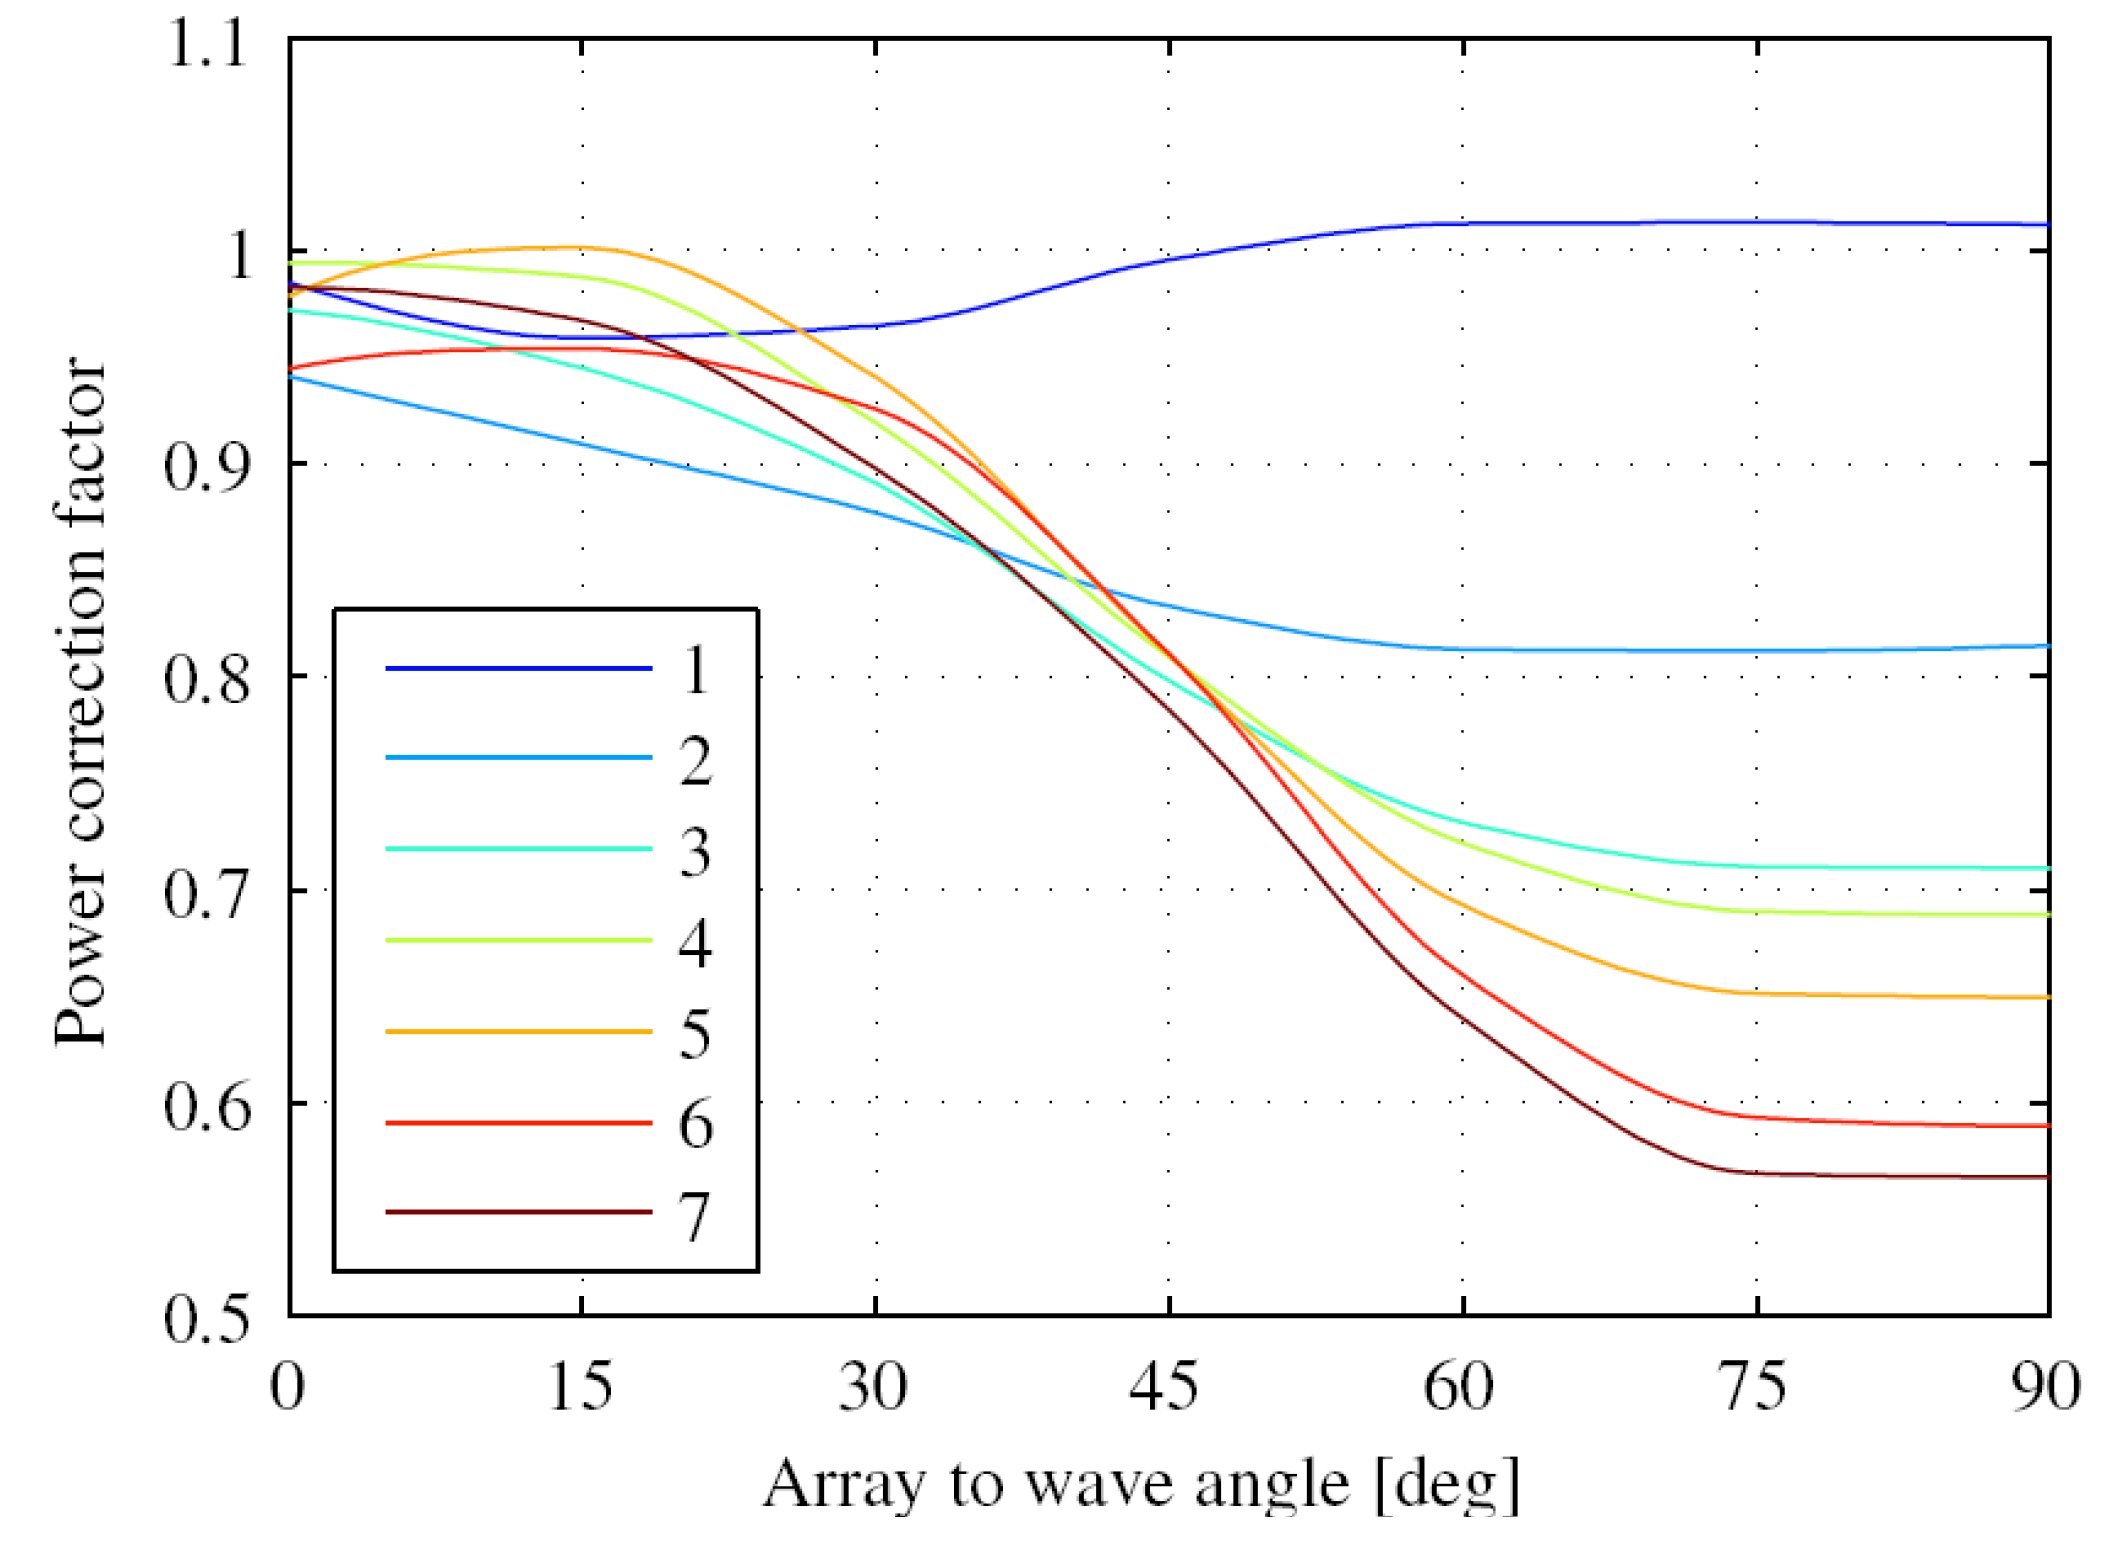
In order to represent the interactions within the array in the time domain model a set of correction factors is applied to the power output from a time domain model of an array without interactions. These are plotted individually for each WEC in the array (in the case of
NWEC = 7) as a function of array angle in
Figure 6. By using the given wave direction as input, the expected array power output can then be found by simply multiplying the power output from each WEC with the corresponding correction factor.
Figure 6.
Correction factors for array as function of wave direction.
Figure 6.
Correction factors for array as function of wave direction.
The production from the farm is computed by multiplying the production of each array by the number of the arrays in the farm. Thus, no smoothing or shadowing effect among the different arrays is considered in this study.
5. Wave Energy Capability to Match Electric Demand
In order to quantify the contribution of wave energy to the electricity balance of the La Palma Island, few metrics must be defined. At first, the wave power penetration,
i.e., the level of penetration of the power generated by the wave farm over the maximum power consumption, is defined as follows:
In Equation (8)
Pfarm is the rated power of the entire wave farm and
PL is the maximum power consumption (load) of La Palma. Once the considered power load is defined from real data, the wave power penetration depends on the number of arrays used for wave power production and is then constant for the considered wave farm. In the following analysis two different cases are considered:
To analyze however the time evolution of generation and consumption, and thus the wave energy contribution on a daily basis, it is worth introducing two additional metrics.
The daily energy penetration is the ratio between the daily amount of energy produced by the wave farm over the corresponding local energy consumption and it can be written as:
The cross-correlation,
c, between the generated power from the farm and the corresponding local power consumption depends on the time evolution of one power profile compared to the other. It can be expressed as:
In Equation (10) T = 24 hours, and denote the daily average value of the farm produced power and power consumption, respectively; and denote standard deviation of the corresponding power. Cross-correlation varies between −1 and 1, and it is desirable for it to be as high as possible, to have a good matching between the power produced by the wave farm and the contemporary power consumption.
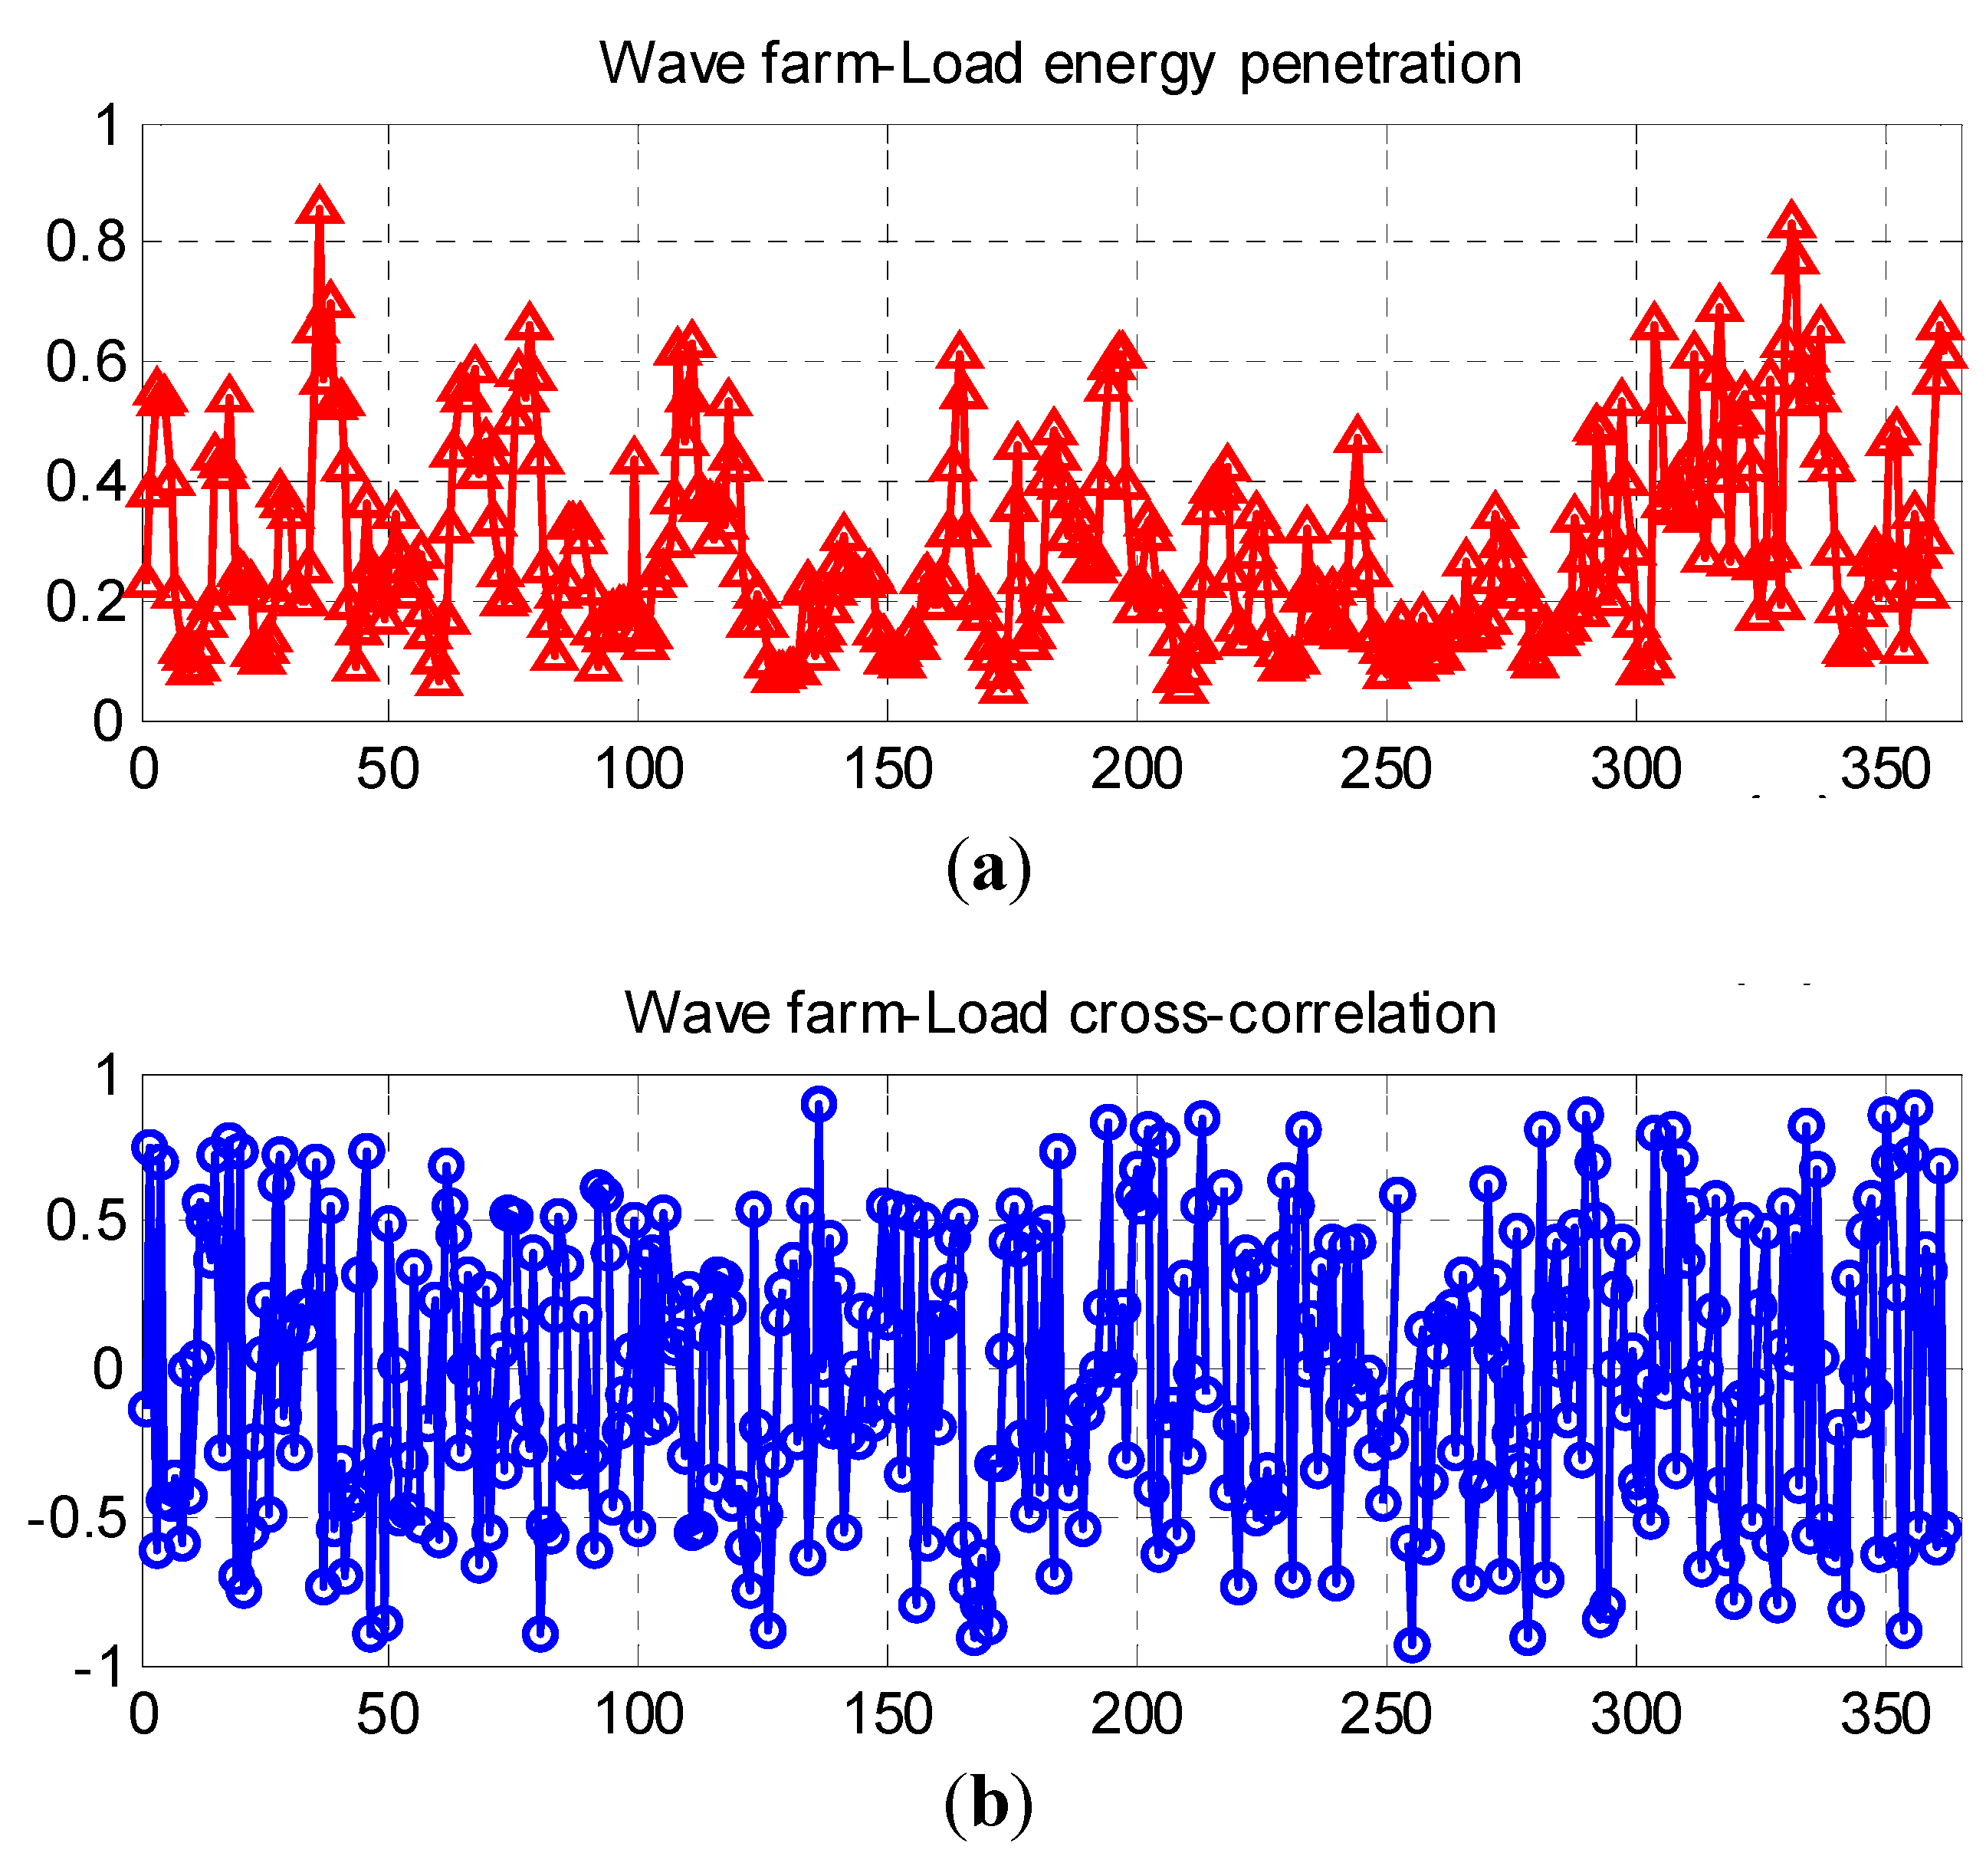
Daily energy penetration and power cross-correlation have been calculated from the available data and they are shown in
Figure 7. The average value of daily power cross-correlation in 2012 for the La Palma location was −0.023, which is indeed very low. The corresponding average wave energy penetration was 0.28 in Case 2. It is worth noting that halving the wave power penetration by reducing the number of arrays (Case 1) does not alter the cross-correlation, but it correspondingly halves all the wave energy penetration values.
Figure 7.
(a) Daily wave energy penetration for considered Case 2; (b) Daily cross-correlation for both considered Case 2 and Case 1.
Figure 7.
(a) Daily wave energy penetration for considered Case 2; (b) Daily cross-correlation for both considered Case 2 and Case 1.
6. Methodology for Energy Storage Sizing
Applying a stochastic optimization to the ESS sizing for a wave/diesel application is similar to the approach presented in [
12] for the wind case and it is here recalled for the sake of completeness.
6.1. Data Preprocessing
Storage sizing procedure requires the characterization of the input daily generated and consumed powers in terms of random variables by considering suitable scenarios.
Each scenario is composed of a 24-hour time series of the wave generated power and the corresponding electric load. Each scenario offers by itself a possible deterministic solution of the energy storage problem. For the stochastic approach, however, each scenario must be weighted based on the probability of its occurrence.
For this purpose a random variable,
z, is associated to each scenario, and assuming that
and
c are independent and uncorrelated, the probability, Pr, that the daily power profiles of wave generation and total consumption have specified energy penetration and correlation can be expressed as follows:
Considering all the 365 scenarios derived from the yearly data and optimizing the storage sizing in a deterministic way, although possible, would imply a high computational effort. It has been shown [
12] that a stochastic approach working on a reduced number of scenarios that keep the probability of the two variables
re and
c, offers similar level of accuracy.
The number,
N, of final scenarios to be considered should be selected as a trade-off between computational complexity and accuracy of the solution. Once
N is established, the
re and
c values calculated from all the data (
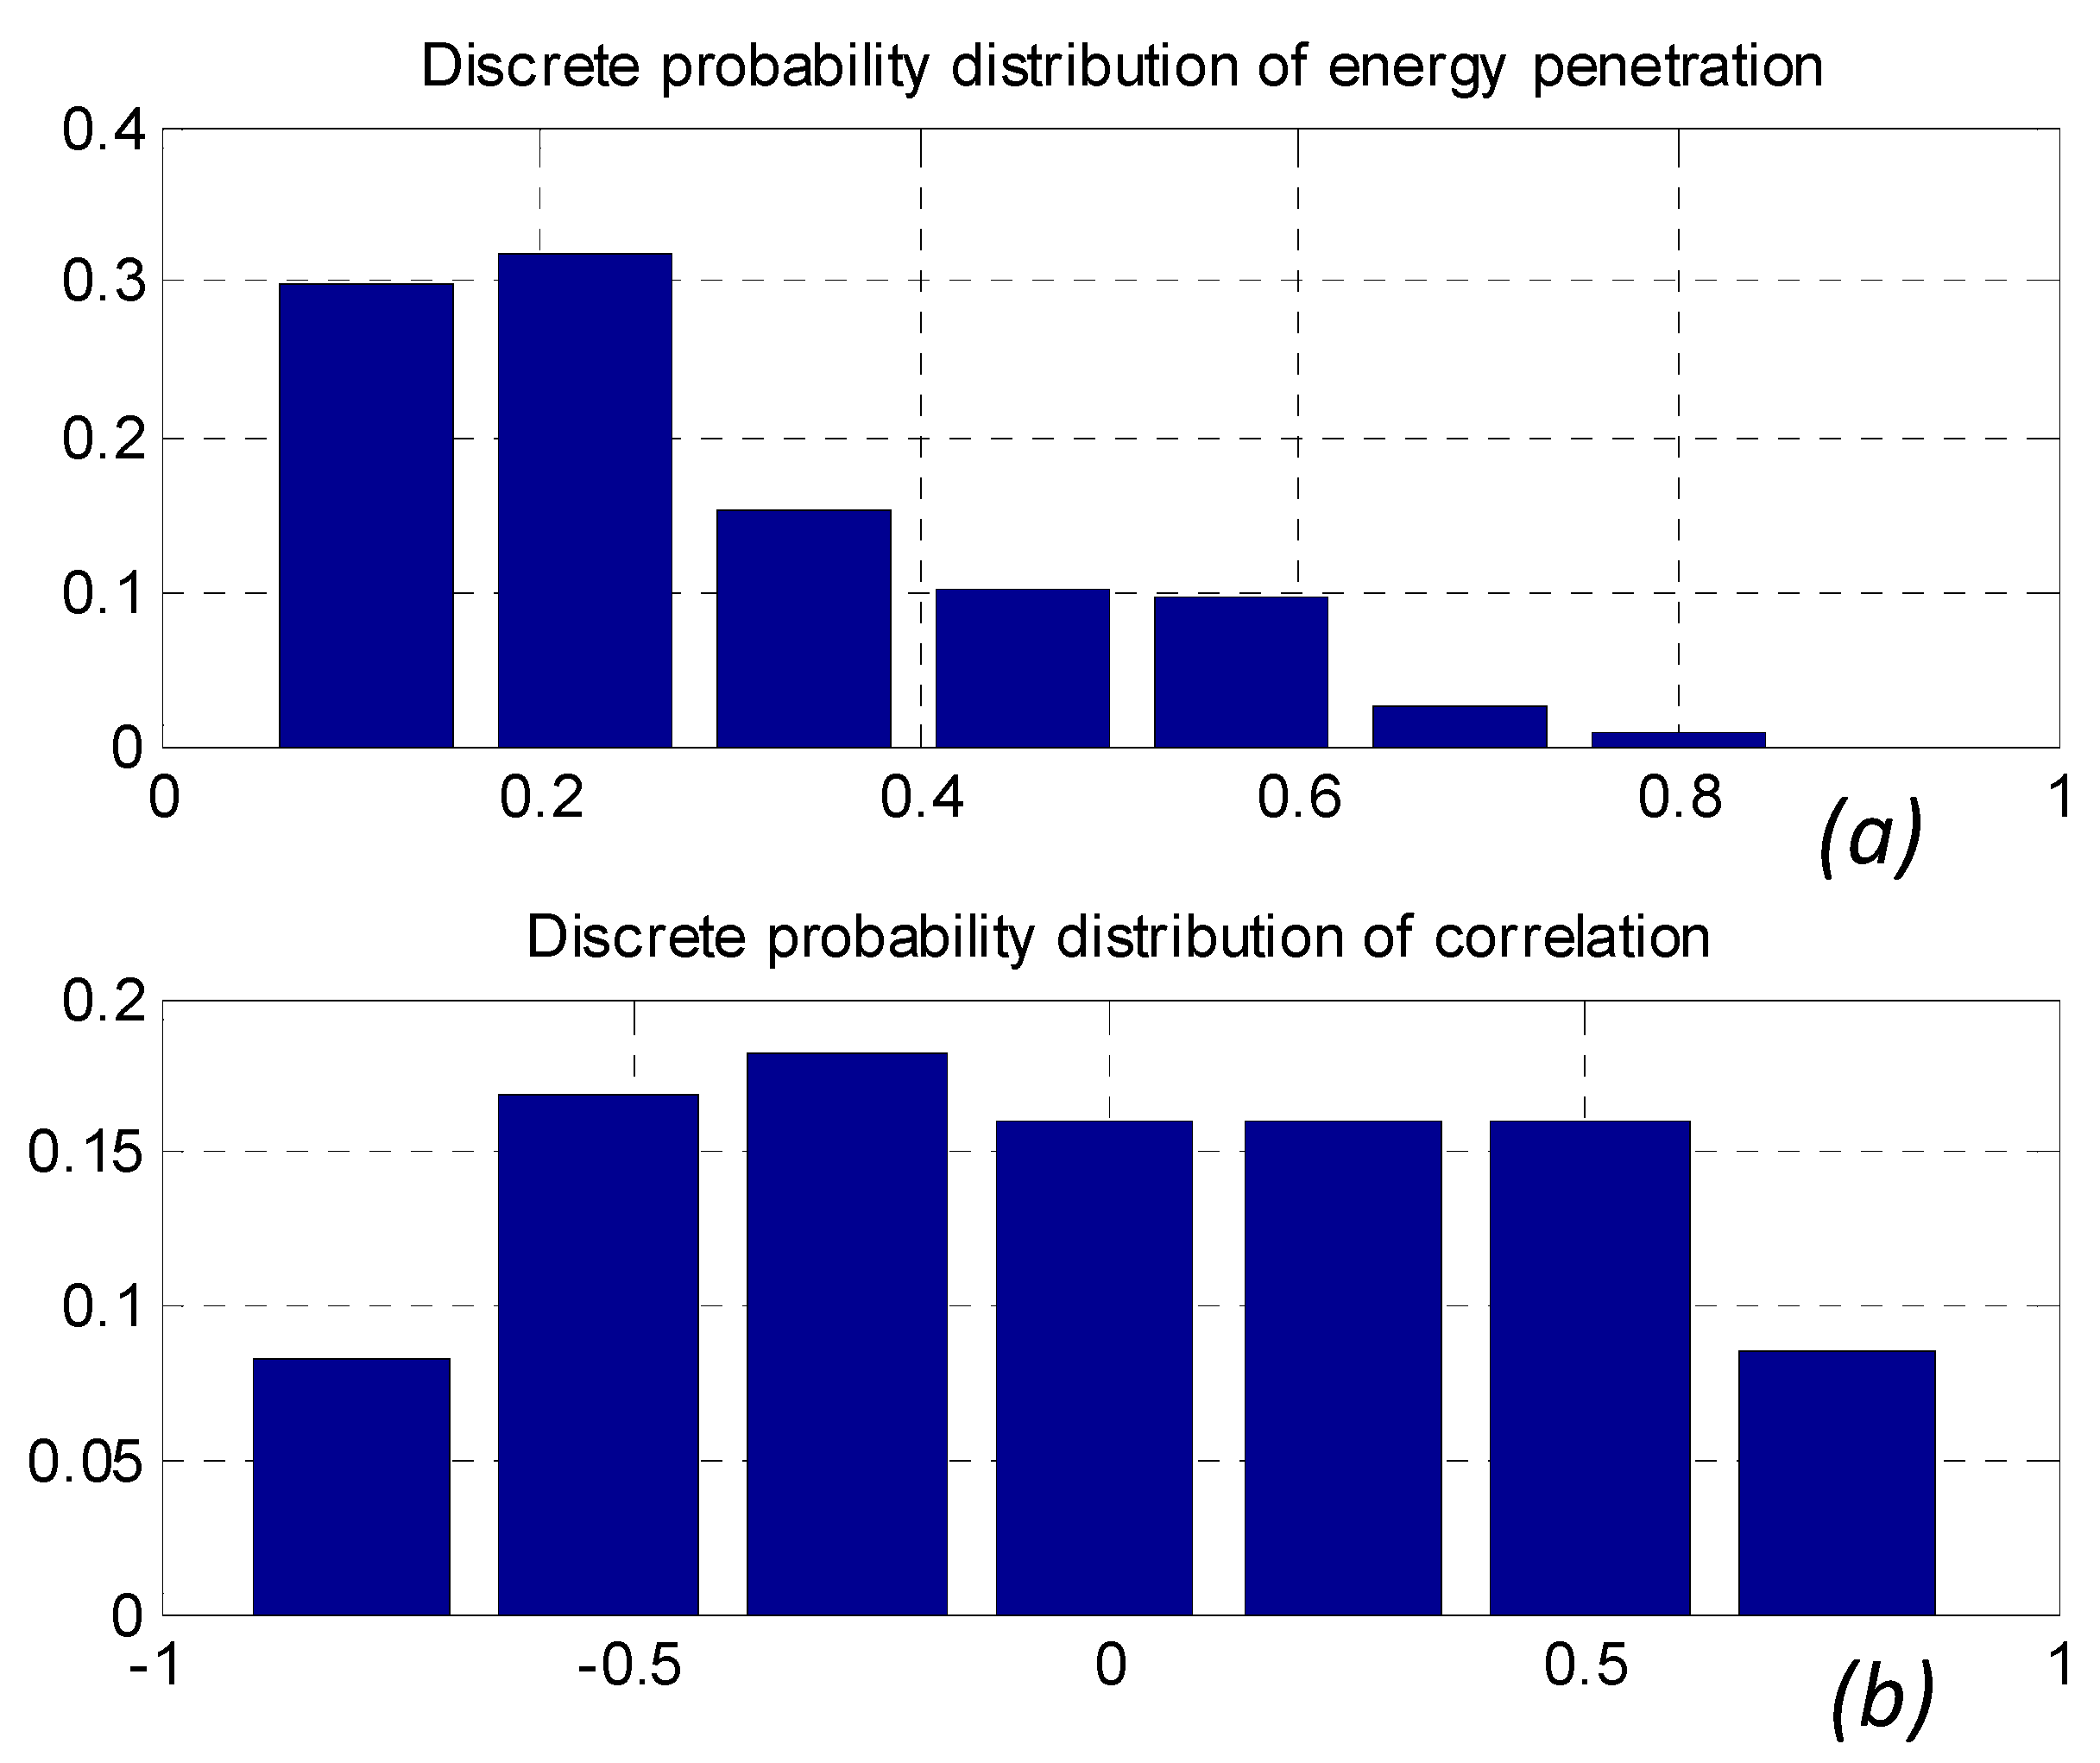
Figure 7) can be divided into a corresponding number of divisions, as shown in
Figure 8 for the case of
N = 49. Then, the actual wave generated power and power consumption profiles, having desired
re and
c must be generated for each scenario. The starting point is considered to be the daily consumption profile with the highest power value in the year and the corresponding wave power profile is generated so that it meets the above requirements. It is worth noting that wave power profiles generated in this way are not unique.
Figure 8.
(a) Discrete probability distribution of daily wave energy penetration, re, for Case 2 (N = 49 scenarios); (b) Discrete probability distribution of daily cross-correlation between wave generated power and power consumption, c, for Case 2 and Case 1 (N = 49 scenarios).
Figure 8.
(a) Discrete probability distribution of daily wave energy penetration, re, for Case 2 (N = 49 scenarios); (b) Discrete probability distribution of daily cross-correlation between wave generated power and power consumption, c, for Case 2 and Case 1 (N = 49 scenarios).
6.2. Storage Sizing Procedure
The stochastic approach to energy storage sizing is based on the minimization of the cost of energy. It provides the optimal values for the energy rating, EES, and power rating, PES, of the ESS based on the daily generation and consumption power profiles of the N scenarios, weighted with their occurrence probability.
This requires at first, to set a financing model for the ESS, which takes into account the fixed energy costs, πe,fix and fixed power cost, πp,fix, associated to the acquisition of the storage device itself.
Amortization of the initial investment can be turn into additional daily costs,
πES,p and
πES,e, by applying the basic formula presented here for the power rating:
In Equation (12) Ypj represents the project period in years, r represents the discount rate and the interest is compounded annually. A similar formula is used for the energy rating.
Regarding the ESS rating optimization, according to the two-stage stochastic formulation of the problem, variable of interests are subdivided into two different sets. The first stage variables are:
EES,
PES and
E0, where
E0 represents the initial energy condition of the storage system. They are common to all the scenarios since the storage rating must be defined before selecting and deploying the device. First stage variables can be represented in vector form as:
Second stage variables are internal to each scenario. In the considered case they are the vectors:
pd,
pdump,
pES and are defined for each time interval of the considered scenario
z. This can be written as:
Their values are independent from one scenario to another, except for the link given by the storage energy status at the end of the scenario, as will be better clarified in the following paragraph.
The optimization storage sizing problem can be formally written as follows:
In Equation (15) the operator Costz calculates the expected operating cost of power generation over the random variable z and over all the time points t. It is worth underlining that the actual cost of the power produced by the wave farm does not affect the result of the minimization process: it is included in the cost function just to obtain as a result a representative cost of the produced energy.
The optimization process is subject to a series of constraints:
Power balance, which corresponds to Equation (2) to be rewritten in vector form in the random variable z;
Diesel operation limit, corresponding to Equation (3) to be rewritten in vector form in the random variable z;
Dumping load constraint, corresponding to Equation (4) to be rewritten in vector form in the random variable z.
Additional constraints directly derive from the mode of operation of the ESS:
- 4.
ESS power rating, which can be expressed as:
- 5.
ESS system operation, which can be expressed as:
where
γ depends on the energy storage efficiency
η according to:
- 6.
ESS energy rating, which can be expressed as:
Then in order for the storage to take into account the energy state at the end of the day,
eT, during the following day, the additional constraint on the final energy state is added as follows:
- 7.
Final ESS energy state, which can be expressed as:
7. Simulation Results for the Considered Test Case
7.1. Technical-Economic Parameters
The main economic parameters used for the considered test case are summarized in
Table 1 and are based on the following assumptions: cost of diesel energy is extremely variable and it can reach very high values in isolated communities [
22,
23]. As a reference value for the following analysis the cost of diesel energy has been set according to [
12].
As regards the cost of energy produced from the wave farm, it has been set considering that wave energy can equal the present cost of offshore wind energy, which is estimated in the range of 140–180 £/MWh, within a few years [
1]. Capital cost for energy storage is strongly dependent on the specific selected technology, which, in turn, depends on the required storage rating. The values of
πefix and
πpfix presented in
Table 1 refer to the best case values for Lead-Acid battery technology according to [
24]. The corresponding storage efficiency has been set to 0.8.
Table 1.
Main technical-economic parameters affecting the energy storage sizing: reference case.
Table 1.
Main technical-economic parameters affecting the energy storage sizing: reference case.
| Type of parameters | Npj (years) | r (%) | πd ($/MWh) | πfarm ($/MWh) | Pdmin | πefix ($/MWh) | πpfix ($/MW) | η |
|---|
| Technical parameters | - | - | - | - | 0.3 | - | - | 0.8 |
| Economic parameters | 20 | 8.5 | 600 | 258 | - | 200 | 300 | - |
7.2. Simulation Results
7.2.1. Reference Case
A Matlab
® code for the implementation of above presented optimization process has been written and run. Corresponding results are reported in
Table 2 for two different levels of wave power penetration. It can be observed that in case of limited wave power penetration (Case 1) introduction of the ESS is not justified by any reduction in the cost of served energy. This is because, despite the constraint on minimum diesel generated power, the limited contribution of wave power to the total generation limits the amount of energy dissipated in the dump load. In turn, the overall cost of served energy is, as expected, intermediate between the cost of diesel and of wave, since wave energy contribution reduces the energy required to the diesel unit, thus lowering the final price. When wave power penetration increases (Case 2) an excess of generation compared to the consumption is experienced more frequently. Being the load consumption the same as in case 1, the cost of energy when no storage is included is increased, due to the cost of the higher amount of energy wasted in the dump load for the low power cross-correlation. As a consequence of this, the introduction of an energy storage system is advisable and would reduce the cost of served energy by 0.32%.
Table 2.
Results of the energy storage optimization considering the standard operation strategy for traditional diesel generators (Pdmin = 0.3) for different levels of wave power penetration.
Table 2.
Results of the energy storage optimization considering the standard operation strategy for traditional diesel generators (Pdmin = 0.3) for different levels of wave power penetration.
| Considered case | EES optimum (MWh) | PES optimum (MW) | Cost of energy with optimum storage ($/MWh) | Cost of energy without storage ($/MWh) |
|---|
| Case 1: rp = 0.5 | - | - | - | 577.8 |
| Case 2: rp = 1 | 33.9 | 7.8 | 577.5 | 579.4 |
7.2.2. Effect of Diesel Operation Strategy
For the sake of comparison the additional case of advanced operation of diesel generators is considered, assuming
Pdmin = 0.2. Corresponding results are reported in
Table 3.
Table 3.
Results of the energy storage optimization considering the advanced operation strategy for diesel generators (Pdmin = 0.2) for different levels of wave power penetration.
Table 3.
Results of the energy storage optimization considering the advanced operation strategy for diesel generators (Pdmin = 0.2) for different levels of wave power penetration.
| Considered case | EES optimum (MWh) | PES optimum (MW) | Cost of energy with optimum storage ($/MWh) | Cost of energy without storage ($/MWh) |
|---|
| Case A: rp = 0.5 | - | - | - | 570.8 |
| Case B: rp = 1 | 25.5 | 6.1 | 560.1 | 560.9 |
It can be observed that the lower value for the minimum diesel constraint reduces the amount of diesel generation and dumped energy in both Case 1 and Case 2, thus consequently reducing the corresponding cost of served energy.
Again it can be noticed that energy storage becomes convenient with the increase of the wave power penetration level, however ESS optimum power and energy rating are lower than in the case of Pdmin = 0.3.
7.2.3. Effect of Generation Cost Variation
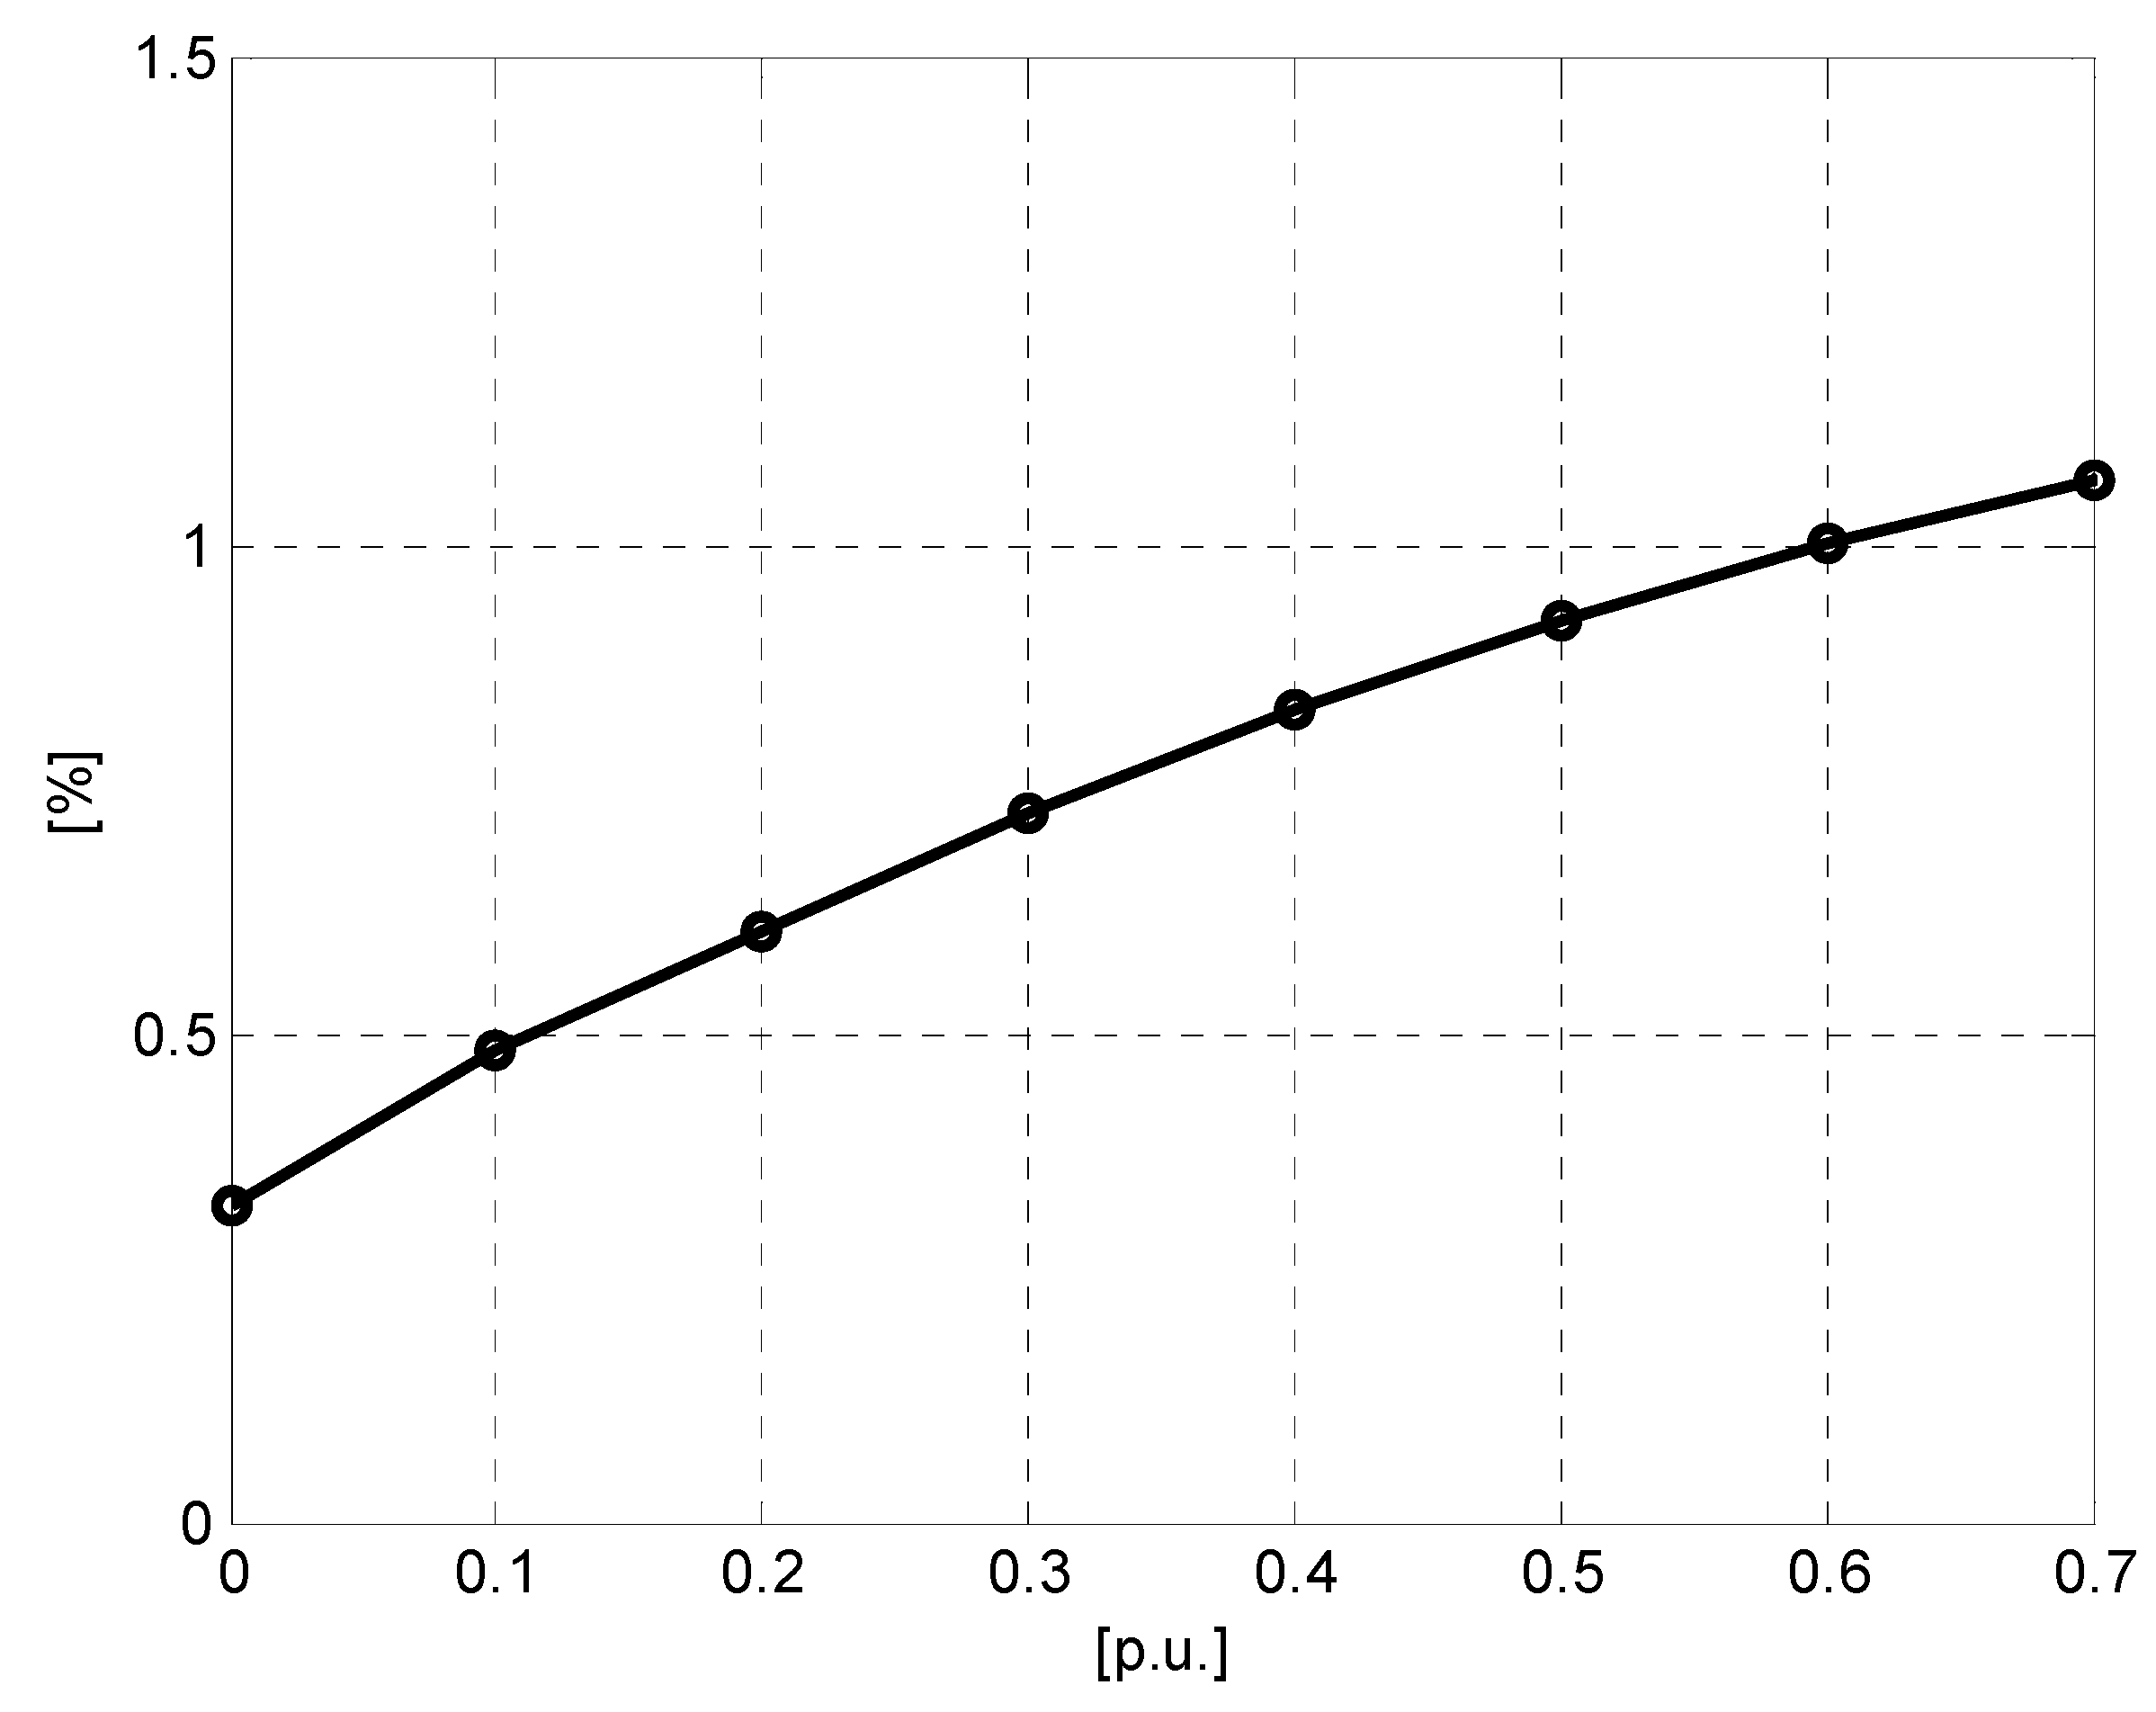
A further analysis has been carried out to quantify the effect of variations in the cost of power generation on the energy storage optimization. It has been assumed that both diesel generation and wave generation undergo contemporary increase in the corresponding generation cost up to 70%. The fixed costs associated to the storage device have been kept constant to the reference values.
Considering the optimal ESS sizing for Case 2, the corresponding reduction in the cost of served energy compared to the cost in case of no energy storage, has been calculated. As shown in
Figure 9 a cost reduction up to 1.1% can be achieved integrating the optimal ESS in the system. This is obtained with ESSs having increasing power and energy rating up to 17 MW and 55 MWh, respectively.
Figure 9.
Reduction in the cost of energy served for the optimal storage solution in the reference Case 2, for increasing values of the generation costs.
Figure 9.
Reduction in the cost of energy served for the optimal storage solution in the reference Case 2, for increasing values of the generation costs.
It is worth noting that the same analysis performed on the corresponding Case 1 shows that, even with the lower power penetration level, energy storage deployment starts being economically convenient for a generation cost increase higher than 40%.
7.2.4. Effect of ESS Cost Variation
At present a large variety of energy storage technologies exist, which differ for maximum energy and power rating, efficiency, cost and, ultimately, range of application.
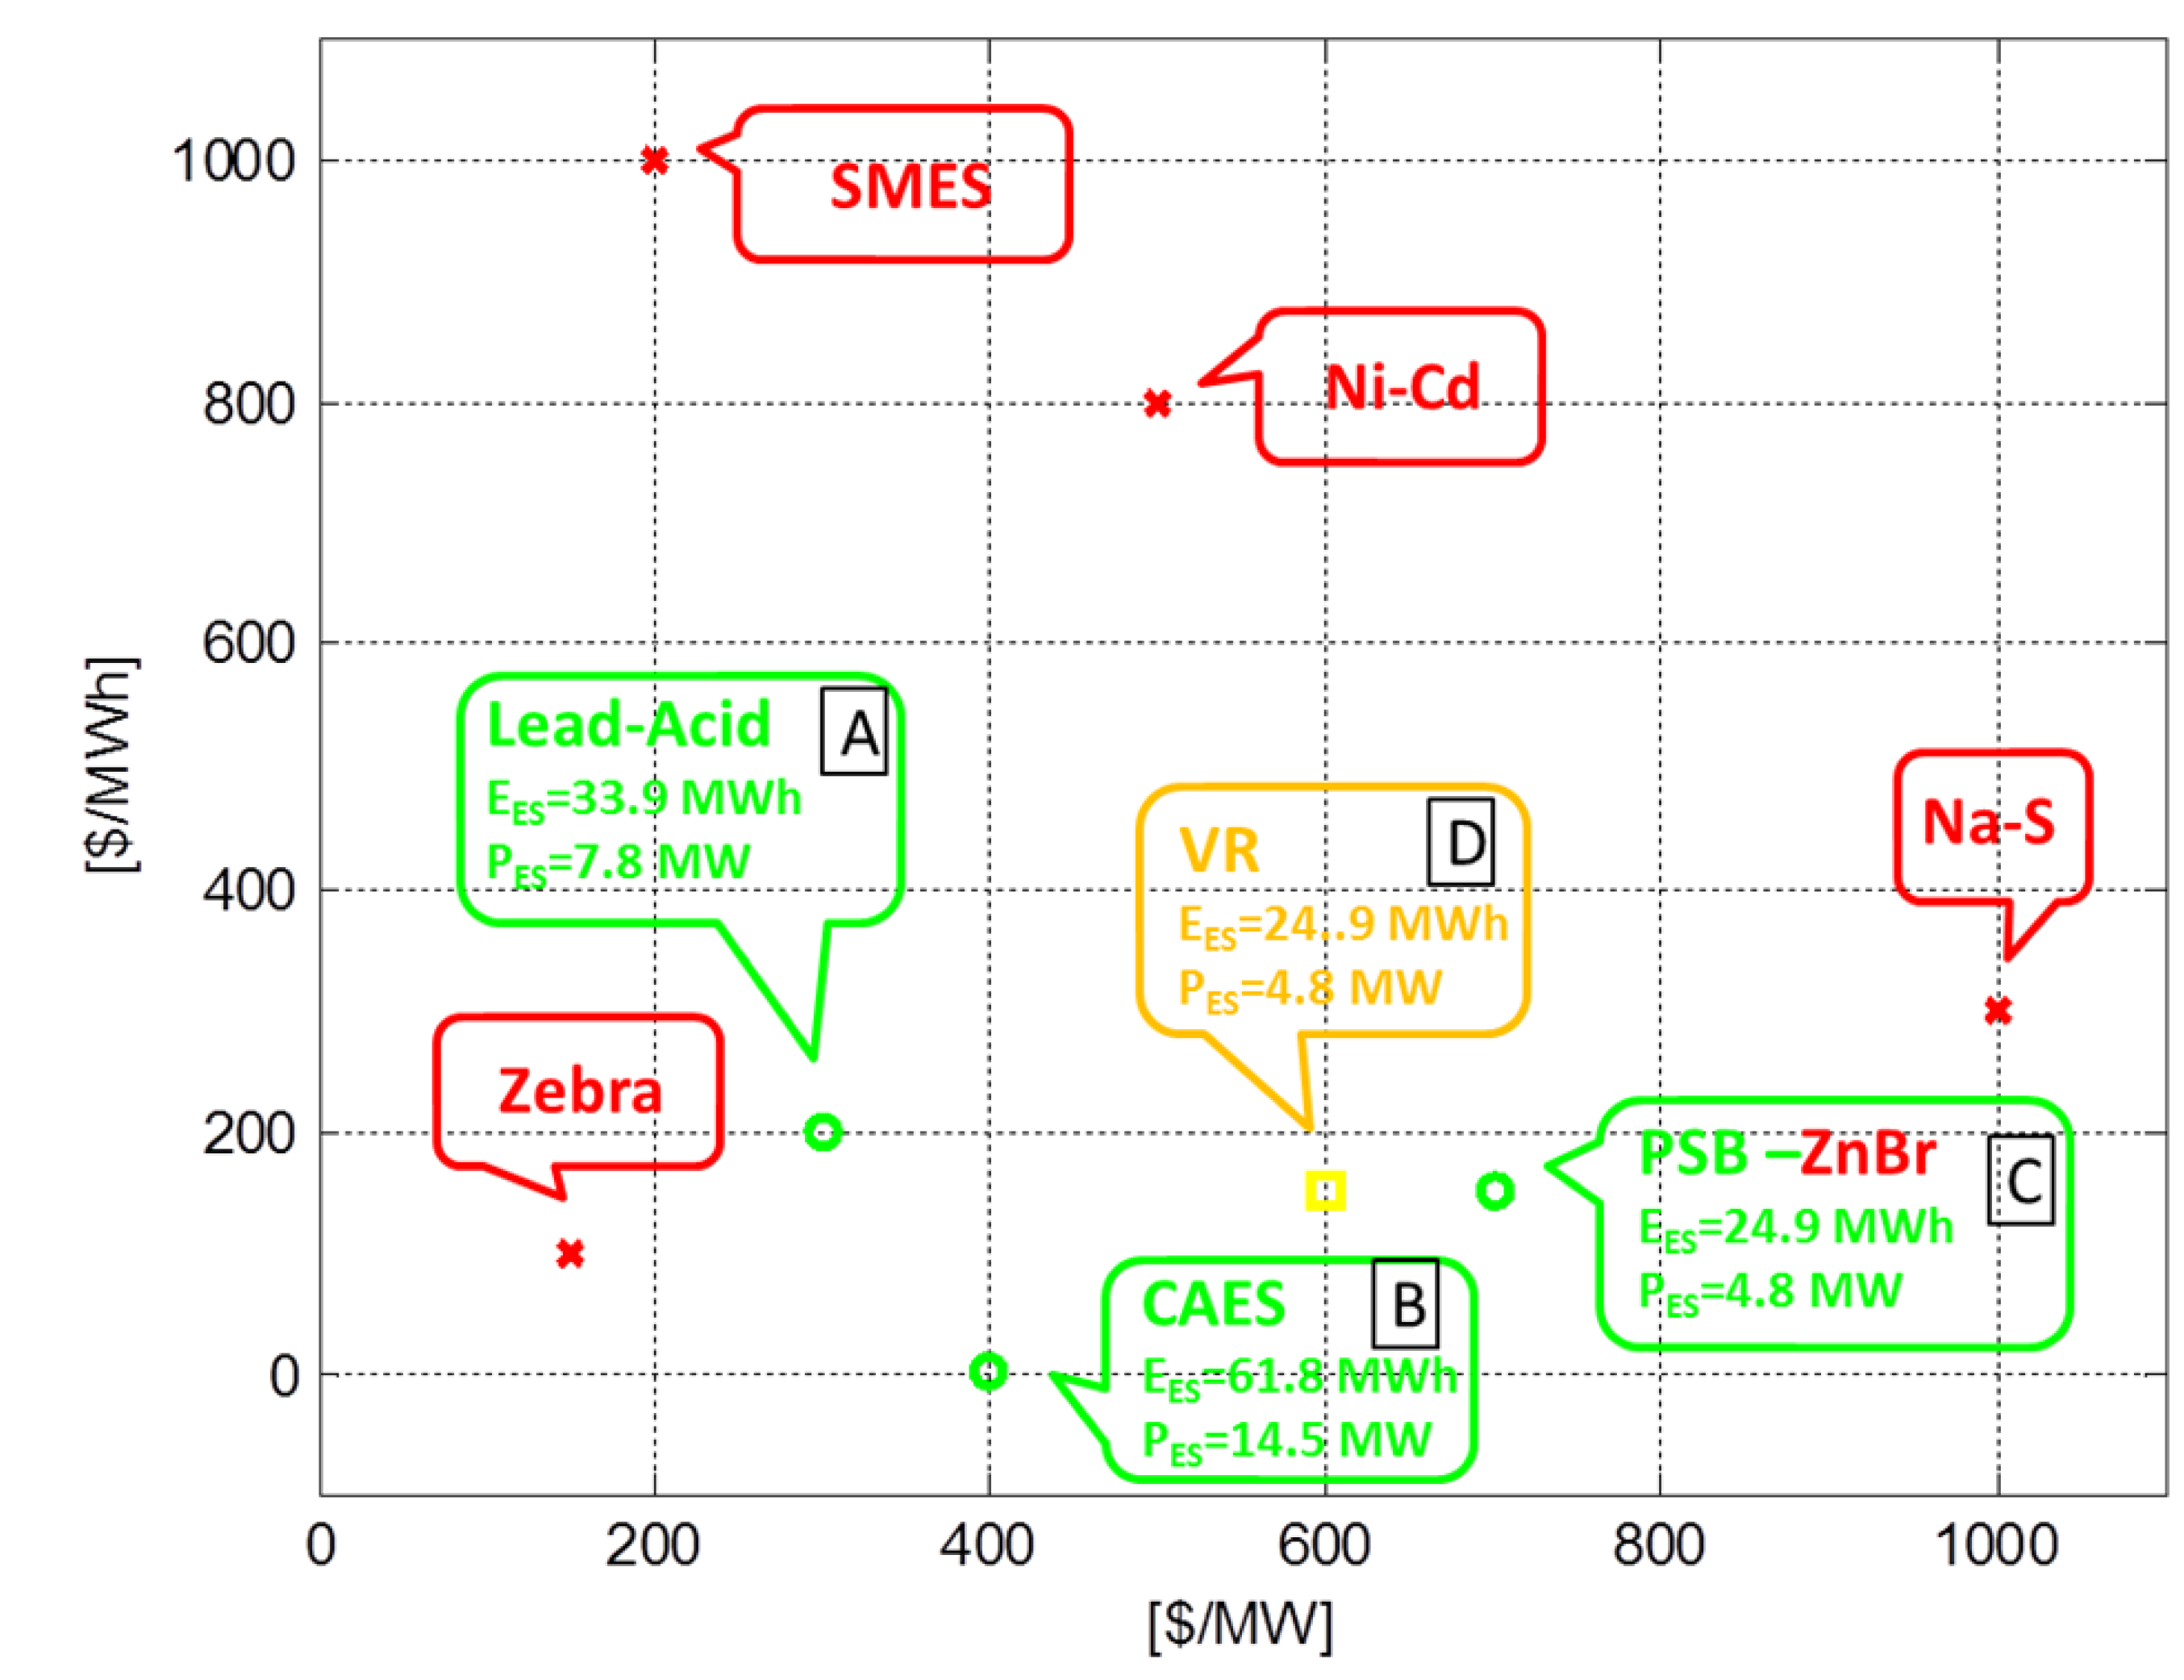
The test-case presented in the previous paragraph considers fixed power and energy cost in line with best lead-acid batteries and that, however, can be considered optimistic compared to different technologies. Both power and energy costs for ESS vary over a wide range, depending on the specific type of storage technology. The goal of the present section is to consider additional pairs πe,fix and πp,fix, corresponding to the state of the art of different storage technologies and to verify, through the above presented optimization process, if they could be a viable solution for the considered wave/diesel test-case.
The values of the eight considered pairs (
πe,fix andπp,fix) are selected according to [
24] and they represent the most optimistic data for each technology. All the simulations have been performed using the same value for the ESS efficiency (
η = 0.8). Results of such analysis are reported in
Figure 10. Red crossed points represent situations where, based on the technical-economic parameters, ESS storage introduction is not convenient or not feasible.
Figure 10.
ESS technology applicability and optimal sizing based on economic parameters from [
24].
Figure 10.
ESS technology applicability and optimal sizing based on economic parameters from [
24].
This can be due to the high technology costs, as for the cases of Superconductive Magnetic Energy Storage (SMES), nickel-cadmium (Ni-Cd) batteries and sodium sulfur (Na-S) batteries, or to the excessive storage rating resulting from the optimization, which exceeds the applicability range of the specific technology, as in the case of Zebra batteries.
It can be also observed that the optimum storage sizing obtained for the reference case (A) fits perfectly the range of applicability of lead-acid batteries, thus confirming the assumptions made in the previous paragraphs.
Compressed Air Energy Storage (CAES), due to its potentially very low πp,fix, results in higher values of the optimum power rating (B), which is in line with the current applications of this technology. Economic parameters potentially corresponding to both polysulfide bromide (PSB) batteries and zinc-bromine (Zn-Br) batteries (C) provide an optimal ESS rating that is achievable with PSB, but not with Zn-Br. Finally the yellow marked solution that has been found for vanadium redox (VR) batteries appears to be at the very limit of applicability of such technology, but it could become feasible with next advances in the state of the applied art.
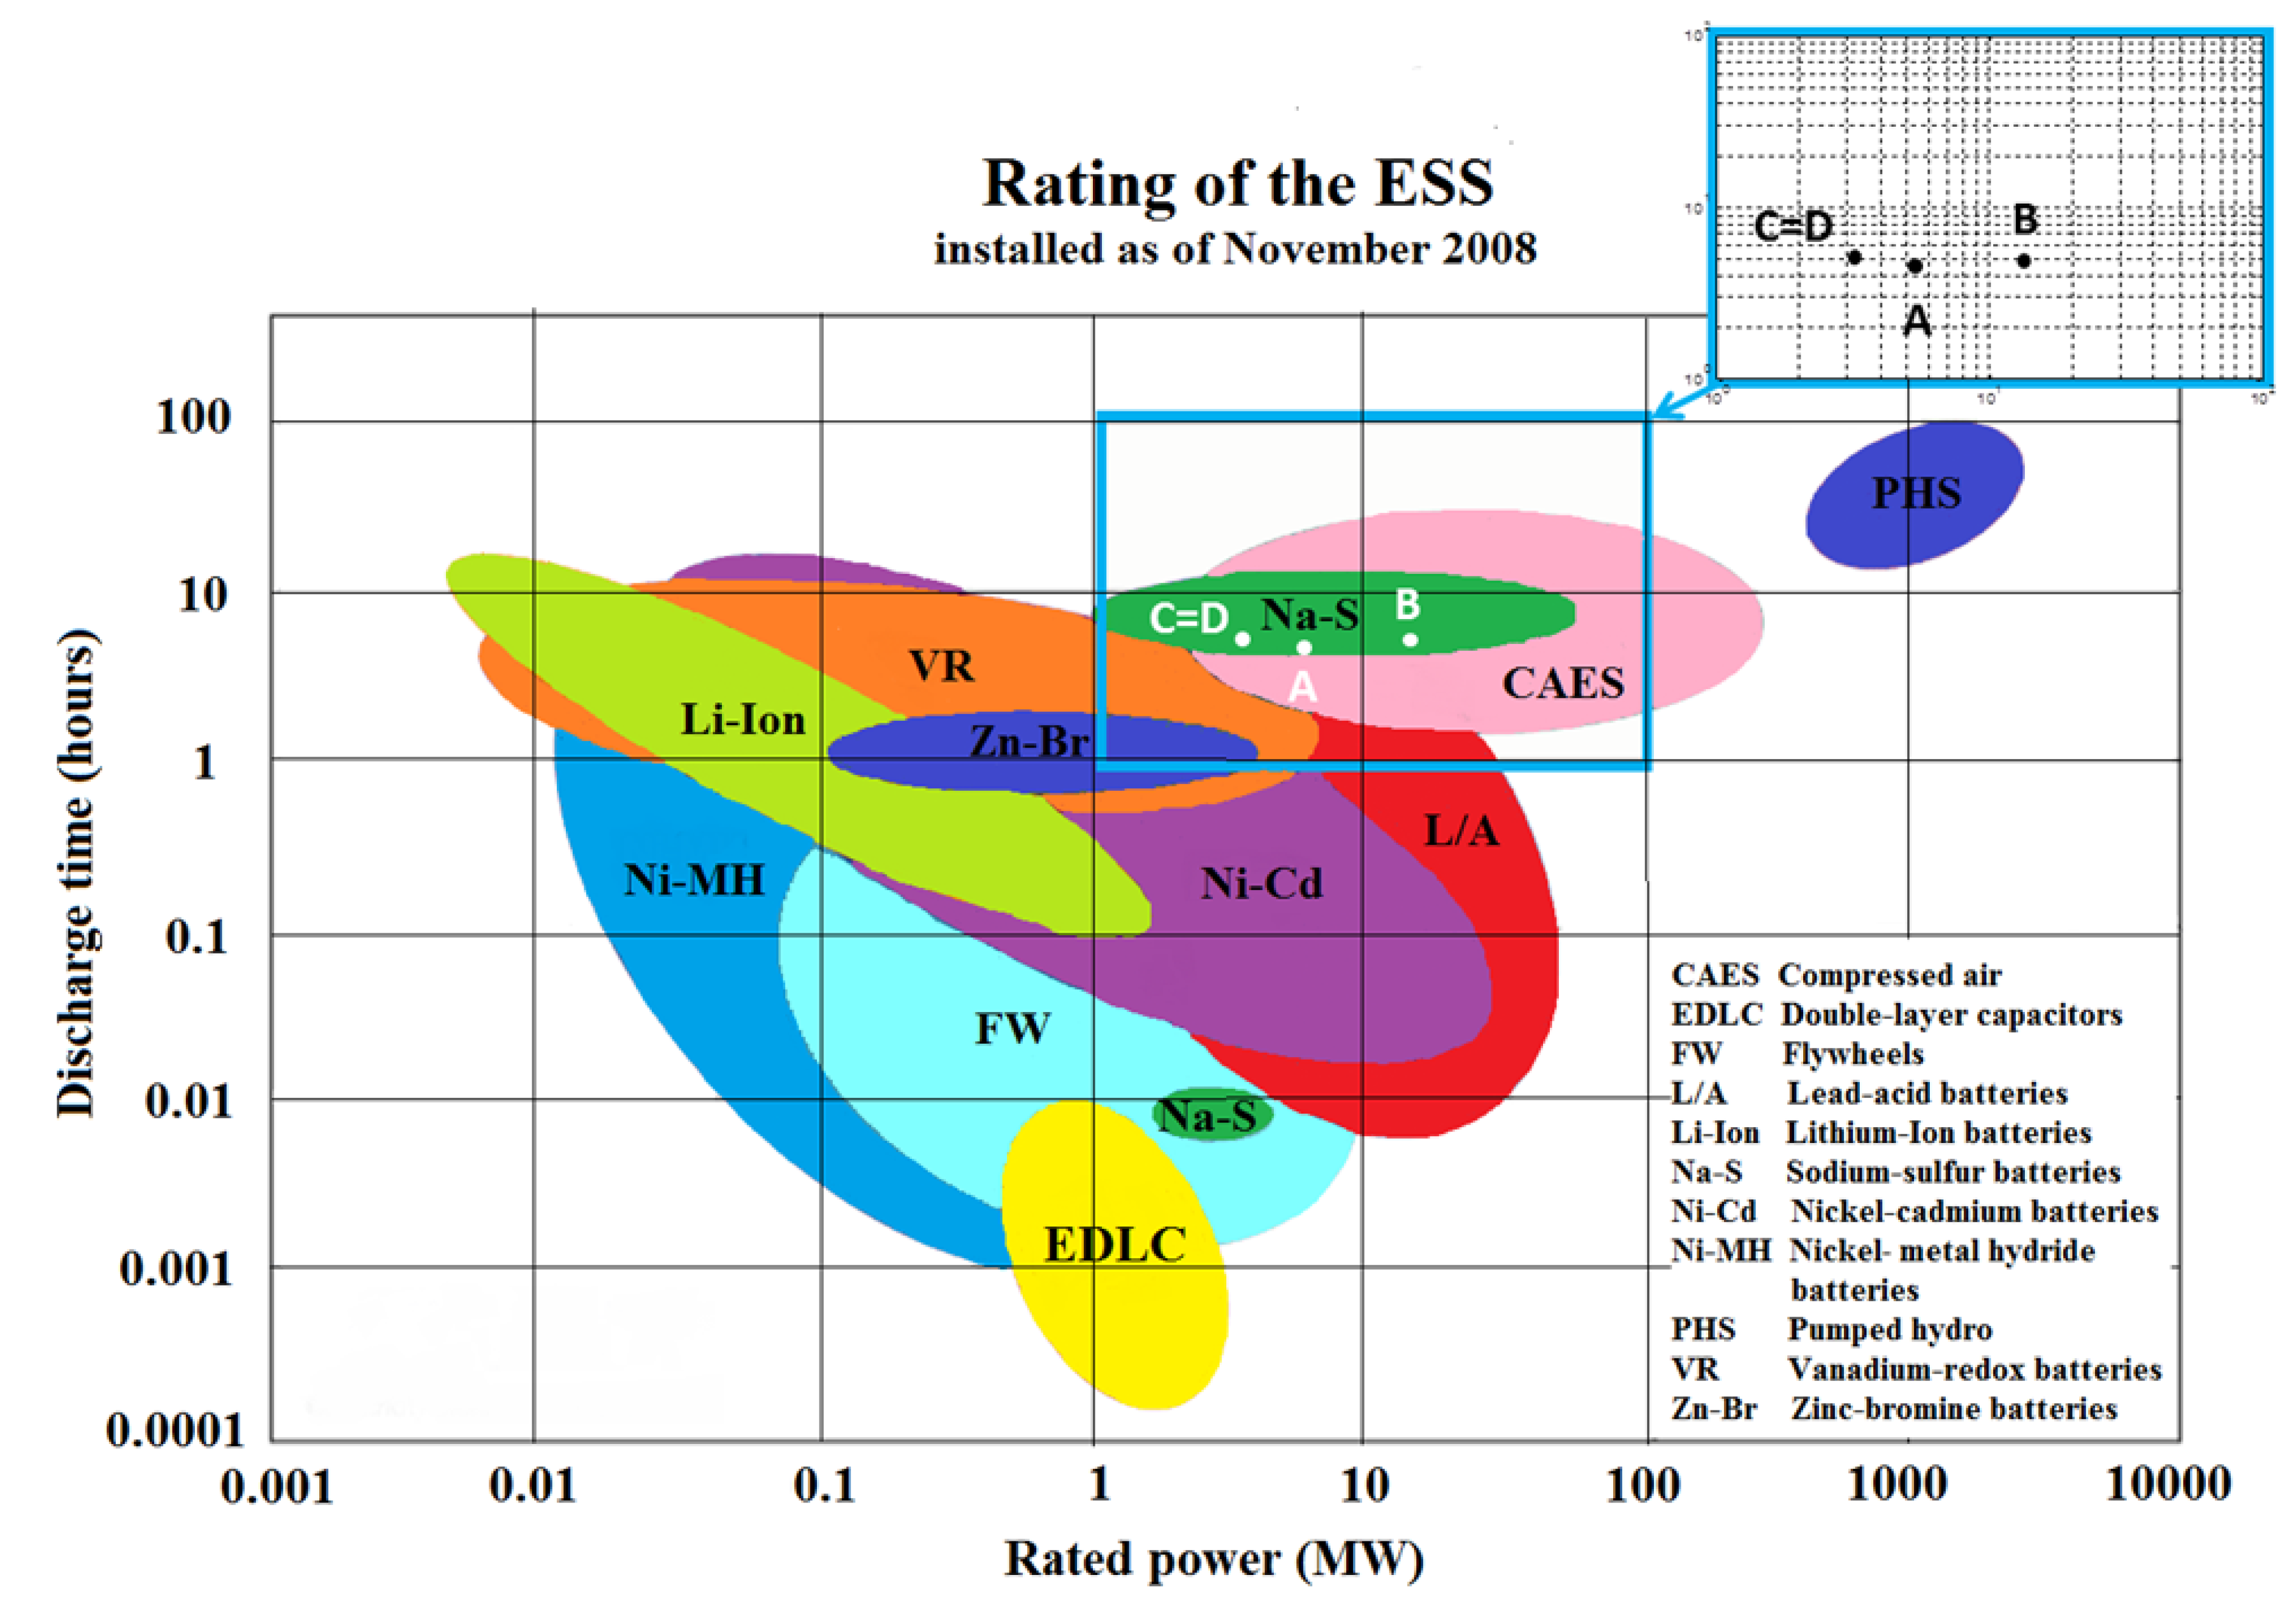
Feasibility of the optimal storage solutions obtained in case A to D based on power and energy rating, or, equivalently, power rating and time of discharge, has been corroborated using [
25], as can be inferred from the corresponding
Figure 11. It should be however kept in mind that remarkable improvements achieved by the energy storage sector in the last 5 years potentially extend the range of application of each technology compared to data of 2008.
Figure 11.
ESS technology applicability based on the state of the applied art (reproduced from [
25]).
Figure 11.
ESS technology applicability based on the state of the applied art (reproduced from [
25]).
8. Discussion and Conclusions
In this paper the real test case of an insulated power system, where most of the electric load is supplied by diesel generation is analyzed. Real meteorological data and data about the electricity consumption of the La Palma Island for the year 2012 have been used as a starting point to evaluate the potential for wave energy generation at the considered location.
Expected power generation has been evaluated for a multi-MW wave farm, based on the actual performance of the Lifesaver wave energy converter developed by Fred Olsen.
Despite the very low correlation between the wave energy and the electricity consumption, the analysis on the potential for energy storage provisions showed that:
Energy storage becomes more and more convenient with the increase of the wave power penetration level in the local power balance;
The less flexible the operation strategy of the main diesel generators is, the more convenient the ESS deployment becomes;
For the considered reference case, the introduction of the optimally sized ESS could lead to a 0.32% reduction on the cost of served energy. Such percentage can increase up to 1.1% if generation costs (from both diesel and wave) increase by 70%, while storage costs are kept constant.
The main goal of this paper was the extension to wave energy applications of a stochastic approach to energy storage sizing. Presented results are however dependent on the specific physical and economic parameters used for the analysis. Moreover, the probability of occurrence of each scenario has been calculated based on data from a single year, while an extended database would be desirable to increase the reliability of the analysis. Finally, the validity of the results is based on the ambitious assumption that wave energy cost equals the cost of offshore wind and on minimum, although reasonable, costs for energy storage.
Based on those assumptions, a preliminary evaluation of the suitable energy storage alternatives for the considered application has been performed, based both on cost and on achievable power and energy limits of each technology. Feasible ESS could be based on lead-acid batteries, PS batteries or a CAES systems, with the optimal rating of the ESS for the considered test case varying approximately in the range 5–15 MW and 25–65 MWh.
Such ESS technology selection is however to be considered as purely indicative, since the ESS efficiency has been kept constant irrespective of the specific technology and the actual life-cycle of each of them has been here neglected. Refined analyses based on the procedure presented above and taking into account, among others, all the above mentioned aspects could be performed for the final selection of the appropriate ESS technology and rating.


