Energy Management and Smart Grids

Department of Electrical, Electronics and Telecommunication Engineering, Chemistry, Automation and Mathematical Modeling, University of Palermo, Viale delle Scienze 90128, Palermo, Italy
Energies 2013, 6(4), 2262-2290; https://doi.org/10.3390/en6042262
Submission received: 14 January 2013
/
Revised: 18 March 2013
/
Accepted: 19 March 2013
/
Published: 22 April 2013
(This article belongs to the Special Issue Smart Grid and the Future Electrical Network)
Abstract
:The paper outlines energy management concepts and the smart grid evolution. The necessity of considering energy management as a crucial innovation in load supplying to permit a more powerful penetration of renewable energy usage at the building and city level and to perform energy savings and CO emissions reduction is pointed out. The driving factors to enhance the current power distribution are presented, and the benefits concerning smart grids are underlined. In the paper, a specific energy management analysis is reported by considering all the electric value chain, and the demand-side management and distributed on site control actions are described. To verify the benefit of energy management control actions, a house simulator and a grid simulator are here presented and the results discussed in three different scenarios. Moreover, in the paper, the evaluation of ecological benefits are reported, and a cost benefit analysis of the energy management system is performed. Results pointed out that with the standard control actions, the system is not economic for the end user, and only by using energy management systems with renewable energy, in site production remunerative energy savings can be reached. Finally the evolution of smart grids is presented, focusing on potential benefits and technical problems. The active grids, micro-grids and virtual utility are described, and final consideration on hypothetical scenarios is presented in the conclusion.
1. Introduction
Efficient energy consumption is a key factor to Europe’s ambitious goals for sustainable development and activities related to air pollution and climate shifting. However, especially during the summer period, the complete electricity distribution network in Southern Europe is working under extremely high loads [1].
Moreover, global climate scenarios show that the average temperature in EU Member States is likely to rise by 0.3–0.7 °C in the next 10 years and will continue to increase until at least the middle of the century. The probability of extreme temperatures will rise accordingly, and there will be corresponding demand from building users for the installation of cooling systems in homes and workplaces, further increasing energy consumption and surcharging the electricity distribution network [1,2,3].
In order to tackle the increasing electricity demand, a number of solutions for efficient energy consumption, generation of energy from renewable sources and new power distribution business models for active energy control have been considered, and some of them have been even pushed via regulations at the national and European level. For example, in Spain, in August 2007, it was decided to replace all electricity meters in order to allow discrimination on the hourly rates of energy in such a way that users could tune their consumption pattern and contracts to the lower rates provided by the utility at given times of the day.
Targeting environmental sustainability, energy efficiency and new power distribution business models have to be evaluated. Moreover, innovative, energy-aware, flexible and user-centric solutions, able to provide interactive energy monitoring, intelligent control and power demand balancing at the home, block and neighbor level are needed. These solutions will interconnect legacy professional/consumer electronic devices with a new generation of energy-aware white-goods in a common network, where multilevel hierarchic metering, control and scheduling will be applied, based on power demand, network conditions and personal preferences. Moreover, renewable energy systems that will optimize and integrate, for example, an innovative combined photovoltaic/solar (CPS) system can be used. These systems will provide hot water for white goods (such as a dishwasher and washing machine) in order to strongly decrease the energy consumption and the CO emissions at home by reducing/removing the heating operational cycles; electrical energy from renewable energy sources (RES), which can be utilized at home and during peak periods, even fed to the electricity network in a reverse power generation/distribution business model.
Information from CPS system will be shared in the management network and used for a new set of energy management rules in order to maximize energy savings and environmental savings at the home, block and neighbor level.
In addiction to the energy management methodology to be used at the load level, they are now emerging in smart grids in the vision of power system innovation [4].
The term "smart grid" is a term used to name an electrical energy delivering system merging both digital technologies and long transmission networks to optimize energy consumption, as well as to open up new processes for energy production and distribution.
The main driving factors to enhance current power distribution grids can be classified into different categories:
- Improving reliability (by decreasing black-out or brown-out risks), efficiency and safety of the distribution grid through actions towards decreasing peak demand;
- Increasing flexibility for power consumption;
- Allowing homes to act either as electrical energy clients (when consuming) or as electrical energy suppliers (when producing); concerning the first driving factor, the total load connected to the grid can fluctuate considerably over time.
The overall load is not stable, and results from the sum of many individual working devices load profiles. For example, if a very popular TV program starts (e.g., the Football World Cup Final), millions of viewers will switch on their TV set nearly at the same moment, and it will result in a rapid increase of power consumption that could generate grid disruption and black-outs. This is the reason why mathematical algorithms have been created to predict power consumption increases, so that corrective actions can be taken.
Power outages and electricity blackouts and brownouts are very costly for energy providers and very uncomfortable for users.
Therefore, it is advantageous for both end-users, as well as for energy suppliers to decrease the number and the duration of high demand periods: grid maintenance costs, energy losses and the need for stand-by generators would be strongly reduced, and a better quality and reliable service would be offered to end-users.
Reliability, efficiency and safety improvements of power distribution networks are accomplished through communication and computing technologies. Smart grids can enhance the energy efficiency of the grid to the benefit of the end-users by both coordinating and scheduling low priority home devices, so that their power consumption takes advantage of the most appropriate energy prices and/or energy sources at a given time.
Furthermore, real-time information transmitted over communication networks will allow power outage anticipation, as well as service perturbation detection. By rapidly detecting and analyzing data coming from the distribution network, the smart grid will be in a position to take corrective actions, so as to restore power stability when needed. Harmonizing local distribution at the house level with energy distribution at a larger level can also reduce grid congestion.
Last, but not least, an enhanced electrical grid is expected to lower CO emissions by reducing end-user energy consumption during peak hours, when electricity is generated through power plants that produce a lot of CO emissions. Concerning the second driving factor, while minimizing operation and maintenance costs, a smart grid can also optimize capital assets: power production from a large number of small power providers using renewable energies (PV panels and small wind turbines) can be synchronized, leading to arrangements at local levels, and power production from centralized power plants can be optimized. End-users can benefit from the lowest-cost generation sources, as well as from centralized renewable energy sources (wind turbines). Harmonizing both ICT (information communication technology) with energy renewable sources can generate new ways for achieving energy savings and lowering CO emissions [5].
Finally, concerning the third driving factor of smart grid implementation aims at encouraging end-users to actively take part in grid operation by promoting incentive methods (real-time consumption information or real-time electricity pricing transported over communication networks) to make them behave as real actors of the entire electricity production and distribution system. Smart grid deployment also aims at changing end-user behavior by providing reliable services during high-demand periods.
Smart grids introduce and gather new actors, such as consumer devices, energy management devices, communication equipments and end-users to achieve a higher level of energy management. As a consequence, smart in-home appliances are connected with energy management devices (that are controlled by the end-users) over communication networks to better monitor energy consumption and production [3,6]. Real-time communication is a fundamental key point in smart grid development, because it allows end-users to get real-time electricity prices and incentive signals, giving them the choice either to consume energy or to sell it to the grid. This allows individual houses, as well as end-users to become real sources of energy production and to also provide effective means for energy savings.
Nowadays, research involving smart grids is widely spreading all over the world and will likely become a very attractive field of investigation, because of all the benefits that can be expected for both the end-users and the energy providers.
Smart grids can also be used to manage home appliance energy consumption. Such service relies on the fact that the frequency of the power grid gives reliable information on the grid congestion: when the grid frequency decreases (something, that usually happens at least once a day), it is likely that the grid is going to face a congestion problem.
By constantly monitoring the frequency of the power grid, individual electricity consuming devices (e.g., appliances) can shut off at relevant times in order to flatten and reduce spikes during peak periods. Because it is possible to measure frequency on the grid from any power sources (i.e., outlets), it is thus possible to incorporate in an appliance a piece of software performing as a real-time frequency meter that will supervise the appliance behavior (turn it on and off). The appliance would respond to the measured signal according to its value. When the grid frequency decreases (the grid faces a congestion problem), the smart appliance would switch off until the frequency will reach the expected threshold again (e.g., 50 Hz in Europe, 60 Hz in the United States of America). Similarly, when the grid frequency increases beyond its standard value, the smart appliance would switch on or would increase its power consumption, taking advantage of a low-power demand period.
Such a process has been experimented in the USA on fridges that shut off their compressor for two minutes in case of a grid frequency decrease, on the condition that the fridge contents are not harmed (the door is not opened during these two minutes, for instance). If at the end of this two-minute period the grid frequency is still under its normal value, the fridge will still stay off for another two-minute period, and so on, until a maximum of ten minutes have elapsed or until the frequency of the grid reaches its normal value again.
In the paper are reported the energy management analysis main goals and the house and grid simulators to determine the benefits, the cost benefit analysis and final results of energy management. In addition, an example of an energy management system is presented. Finally, problems related to smart grids as the next future of electrical distribution systems are presented and discussed.
2. Energy Management Analysis
Energy efficiency is a major concern for sustainable development activities, because increasing energy consumption implies usually increasing CO emissions and a long lasting impact on global warming. The energy demand has been constantly growing over the last few years, partly because of the emergence of new electrical applications, such as new services and new technologies for transportation, requiring increasing investments in the energy producing sector.
Furthermore, during some specific periods, the electricity distribution network can be under stress, because of high power demand. In order to face the rising electricity demand, a number of solutions for efficient energy consumption can be found. Indeed, energy management entails all the actions that could influence the demand for energy, such as actions to suppress ineffective energy consumption and actions to dim energy consumption at a large or medium scale. Energy generation from renewable sources and new power distribution business models for active energy control have been promoted and sometimes have been even legitimized via regulations at the national and European level. Besides, it is often mentioned that energy efficiency and renewable energy are the so-called “twin pillar” of sustainable development. These are fundamental to slow the increasing demand of energy [7].
In this meaning, the energy management analysis main goals are:
- To understand the environmental benefits of energy management through connected household appliances with clear figures—the analysis should take stand-by consumption into account, as well as the fact that it avoids demand peaks, reduces energy losses;
- To quantify the reduction in CO emission enabled by a better consumption and load management;
- To perform a cost benefit analysis of a house energy management system.
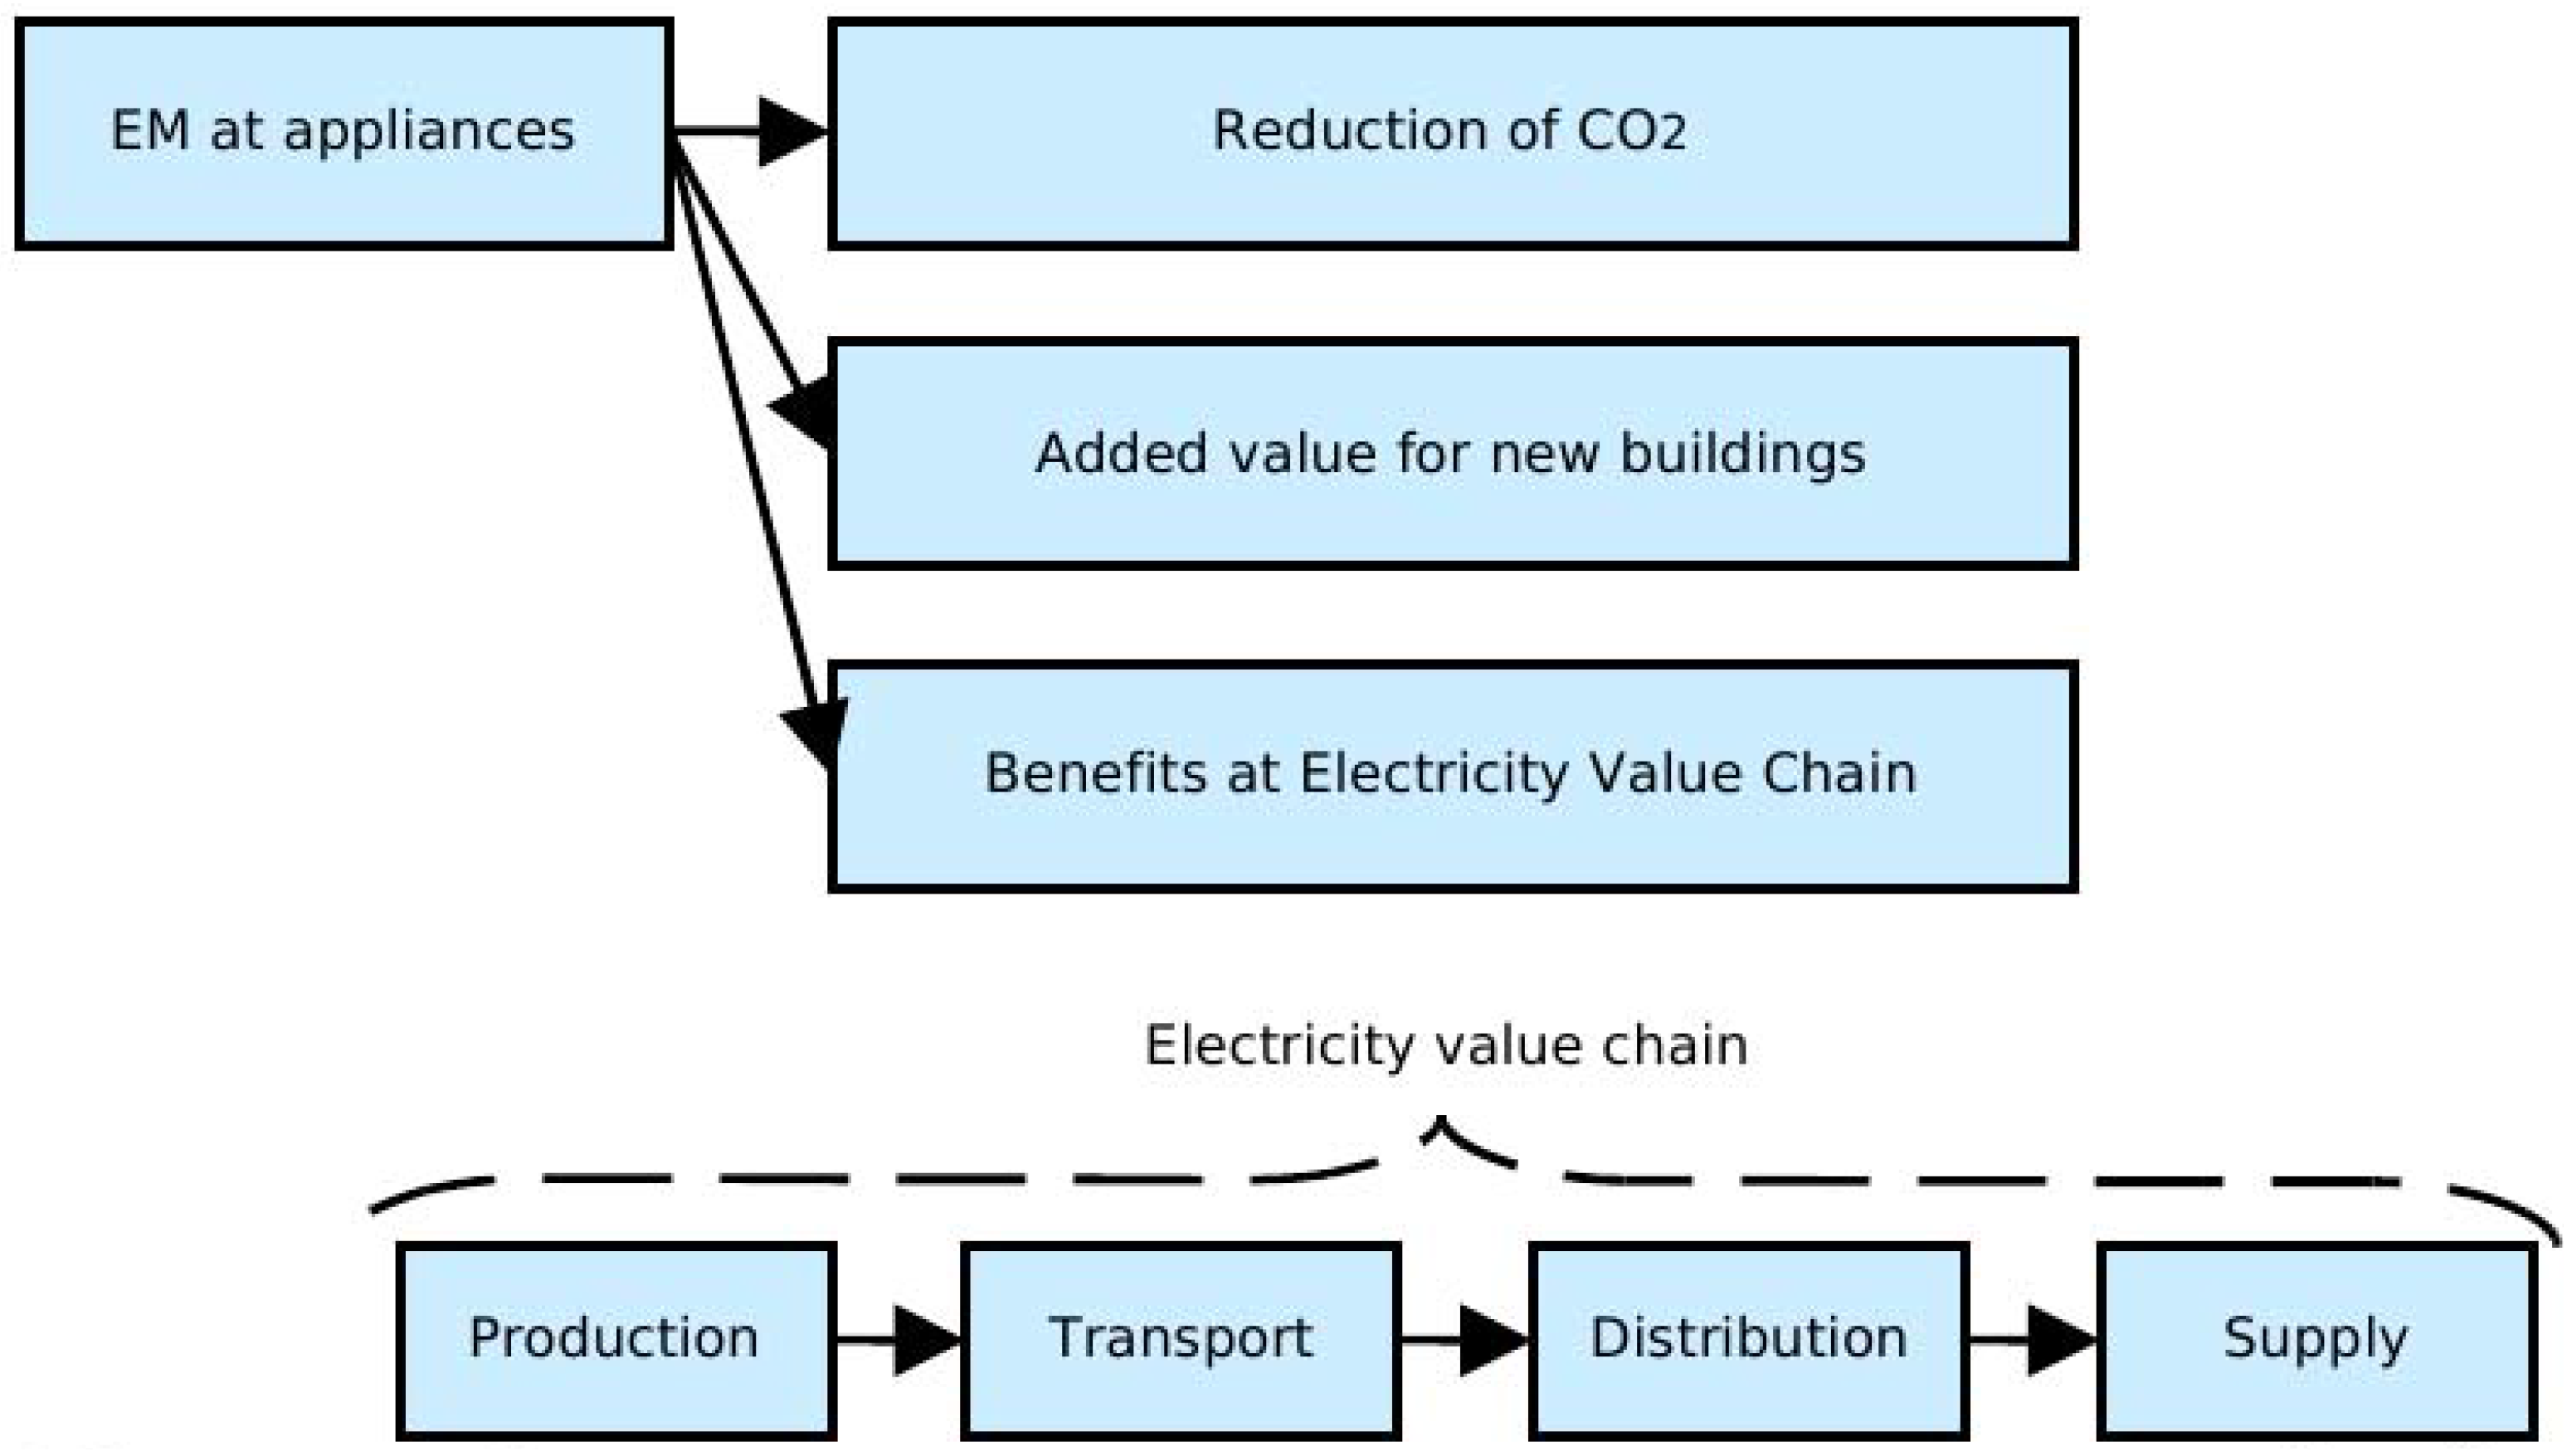
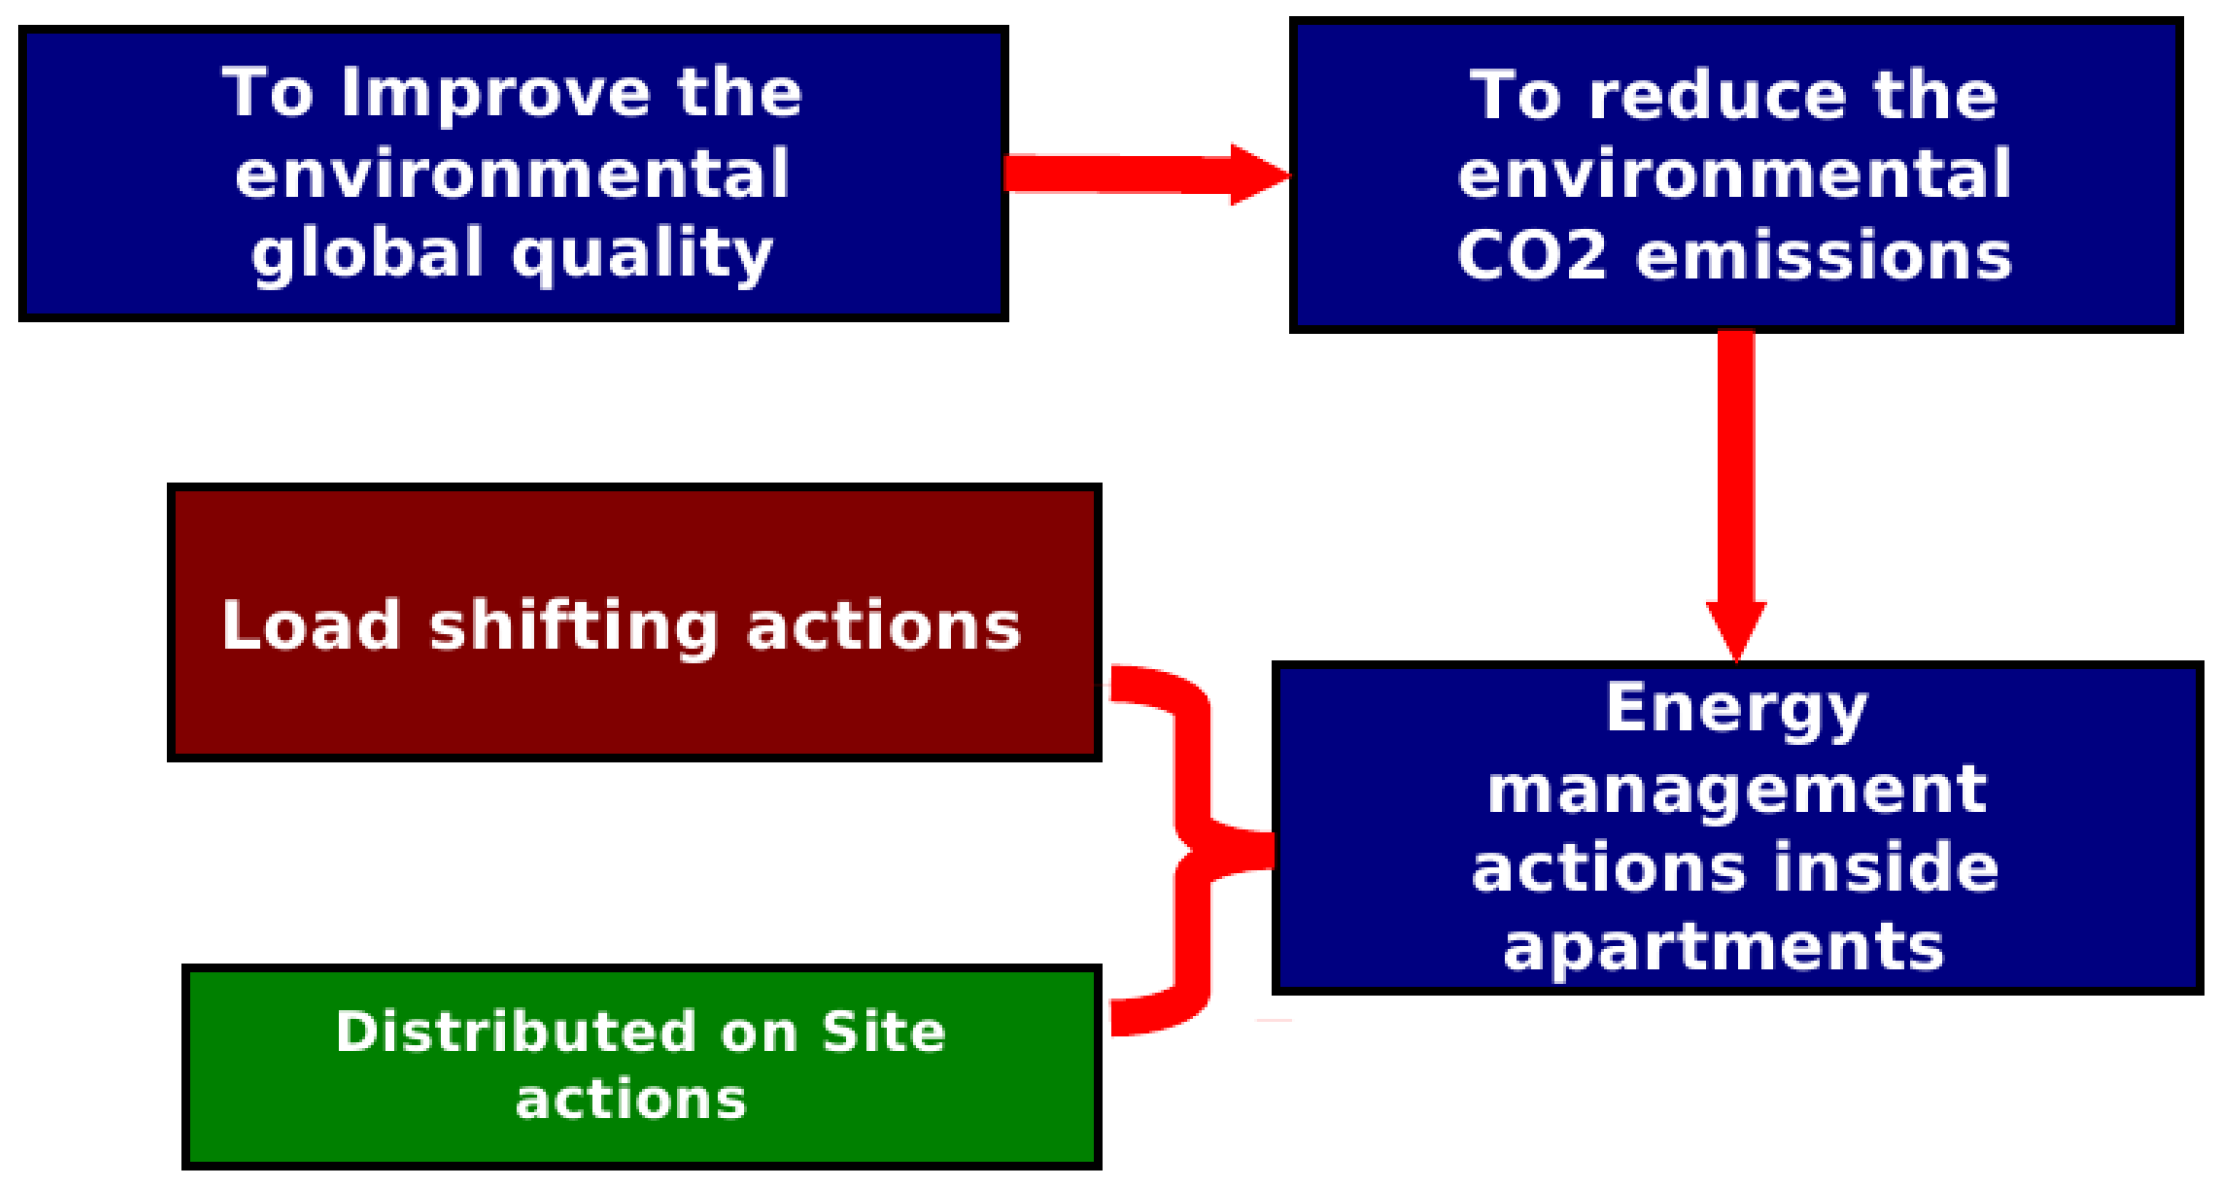
The energy management analysis work approach is presented in Figure 1 in which it is easy to understand that all of the electricity value chain has to be considered.
Figure 1.
Energy management analysis work approach.
Moreover, it is to be considered that common human activities, carried out each day in individual houses, are characterized by quite regular patterns. These patterns significantly affect the usage of electricity, either considering a single house or a number of houses connected to the same power grid.
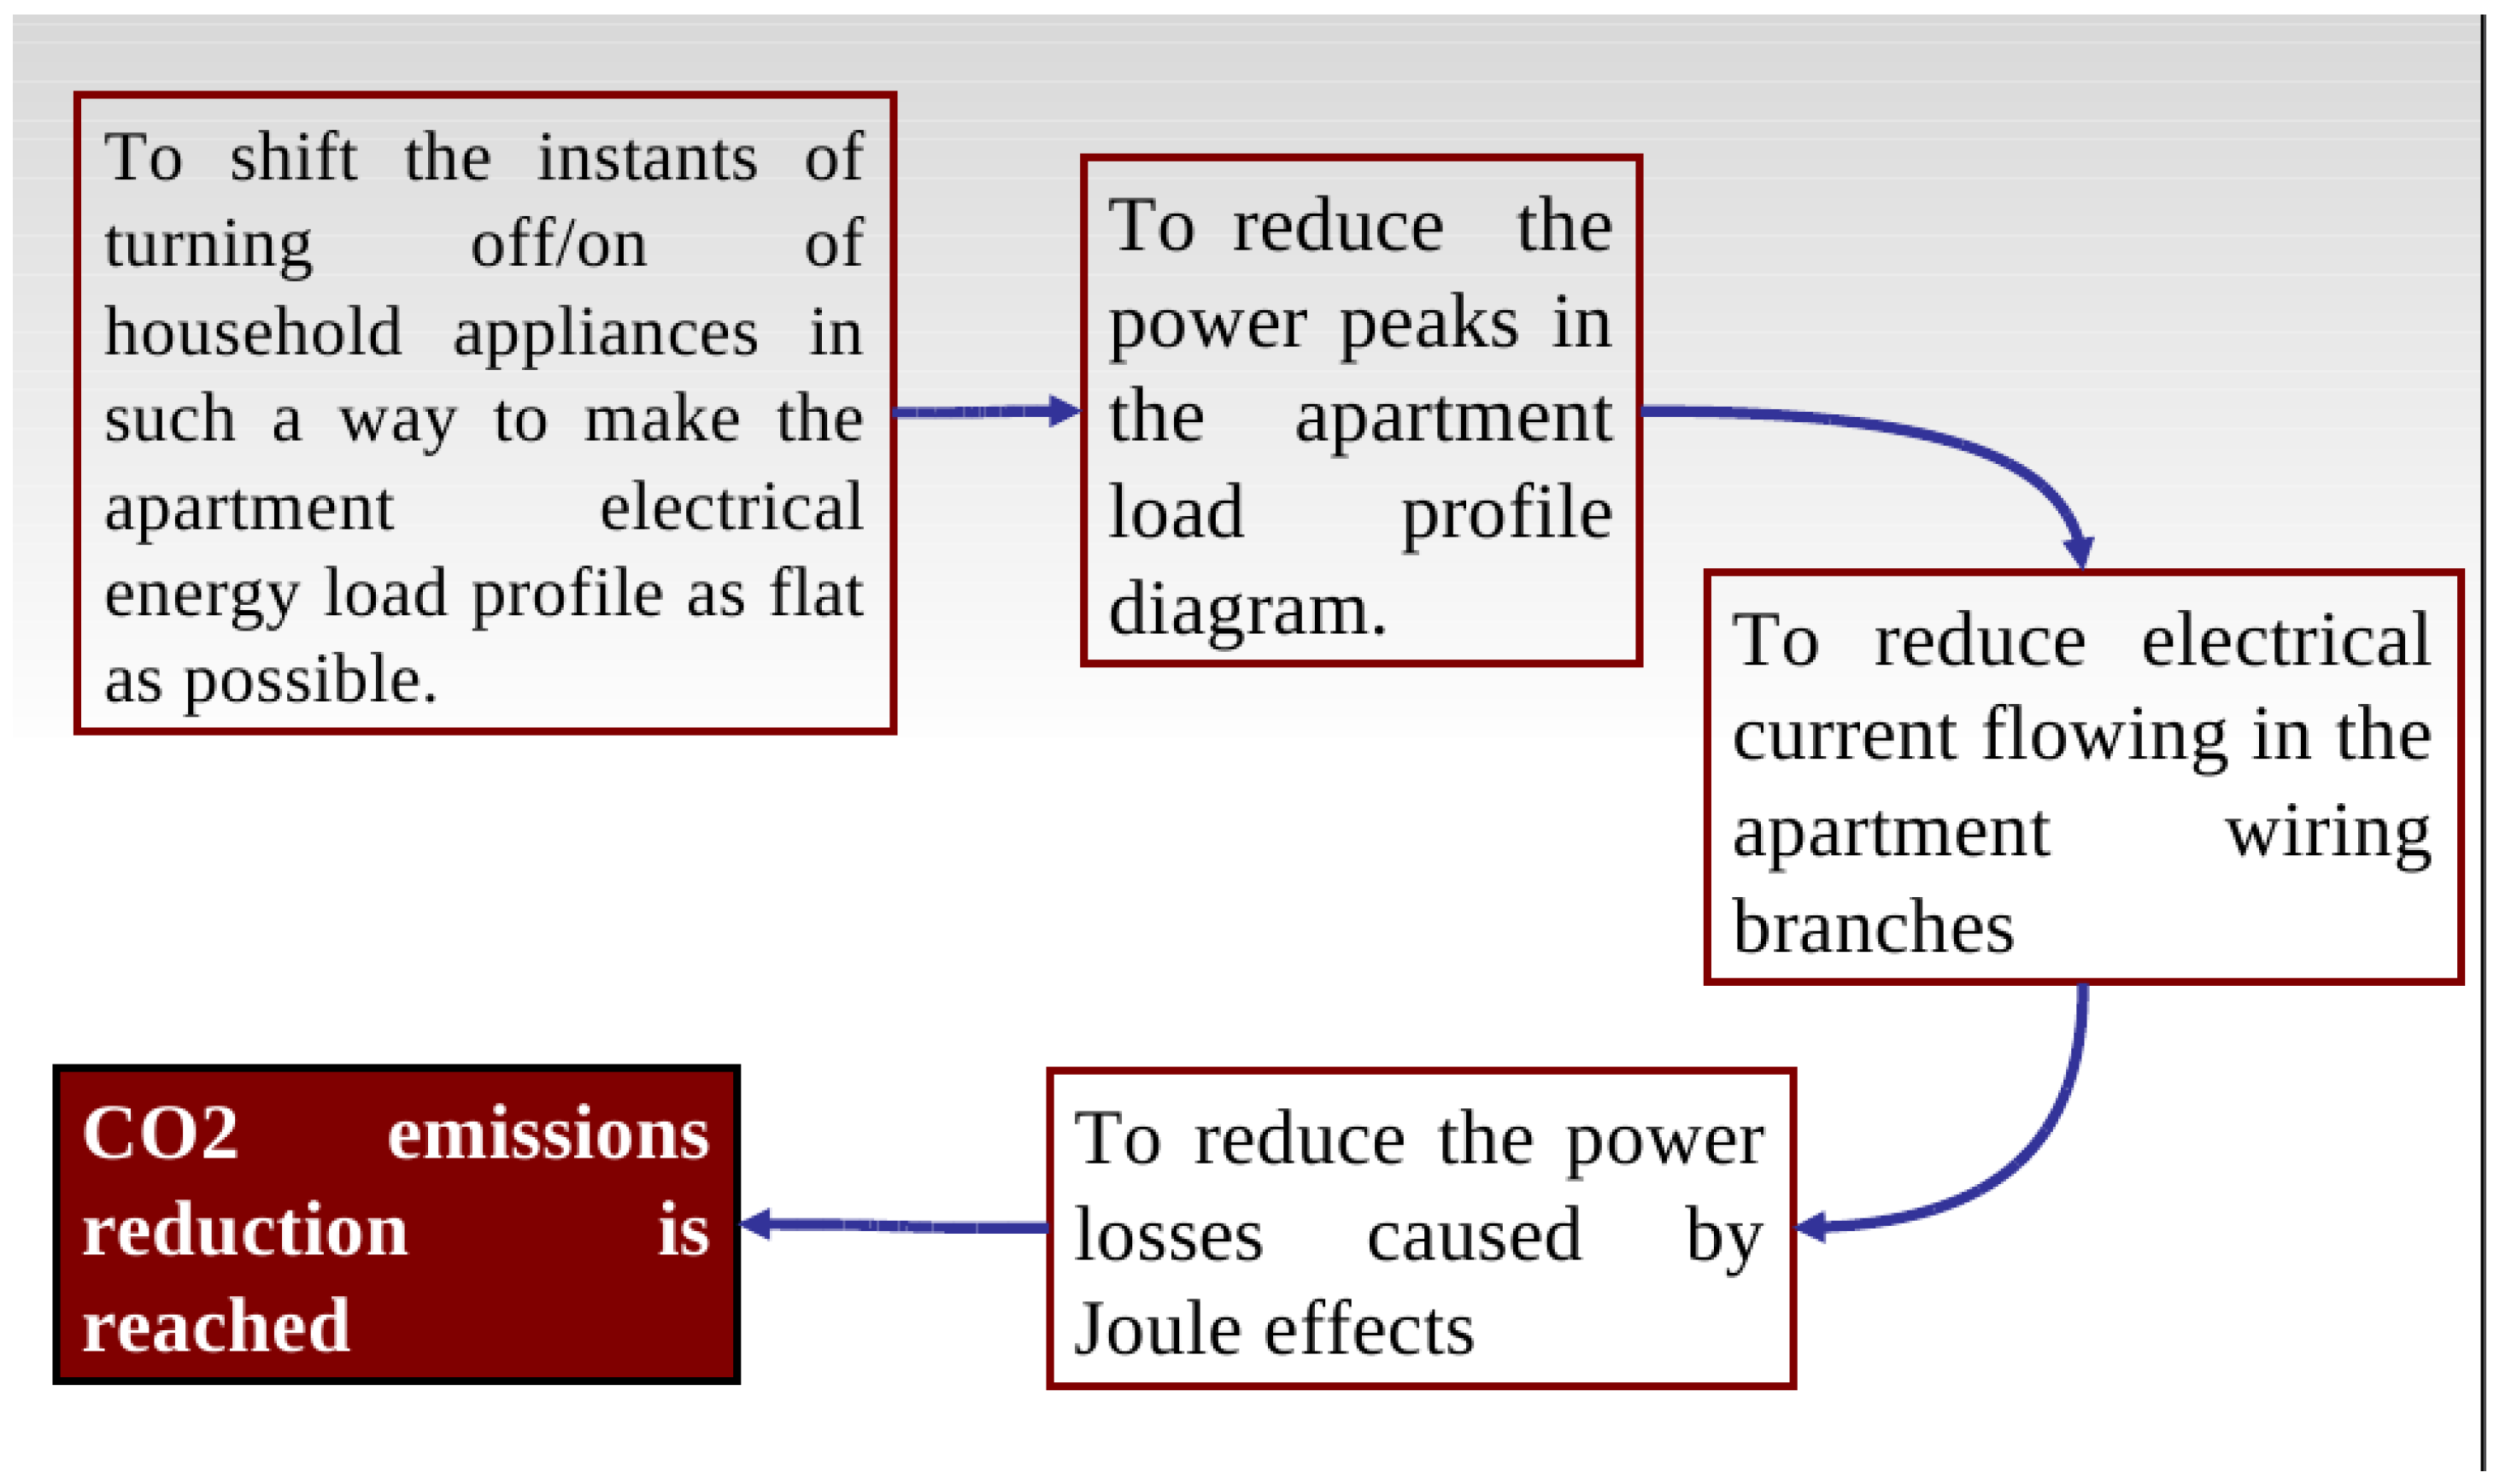
The mentioned patterns and their synchronism make the instantaneous energy demand strongly variable over the day, negatively affecting the overall efficiency of the entire energy supply chain (from an energetic, economic and environmental point of view). This is mainly due to the presence of peak demands, i.e., the synchronous request for energy from multiple house. Peak demands imply a greater current to flow on the power grid and on the house wiring systems, that raises energy waste, due to power losses (e.g., caused by Joule effects). Moreover, energy demand is usually concentrated in the daytime, while it is small during night hours. This is in contrast with the desired flat energy profile provided by power plants. A flat energy demand is needed to achieve a better efficiency in exploitation of primary energy sources.
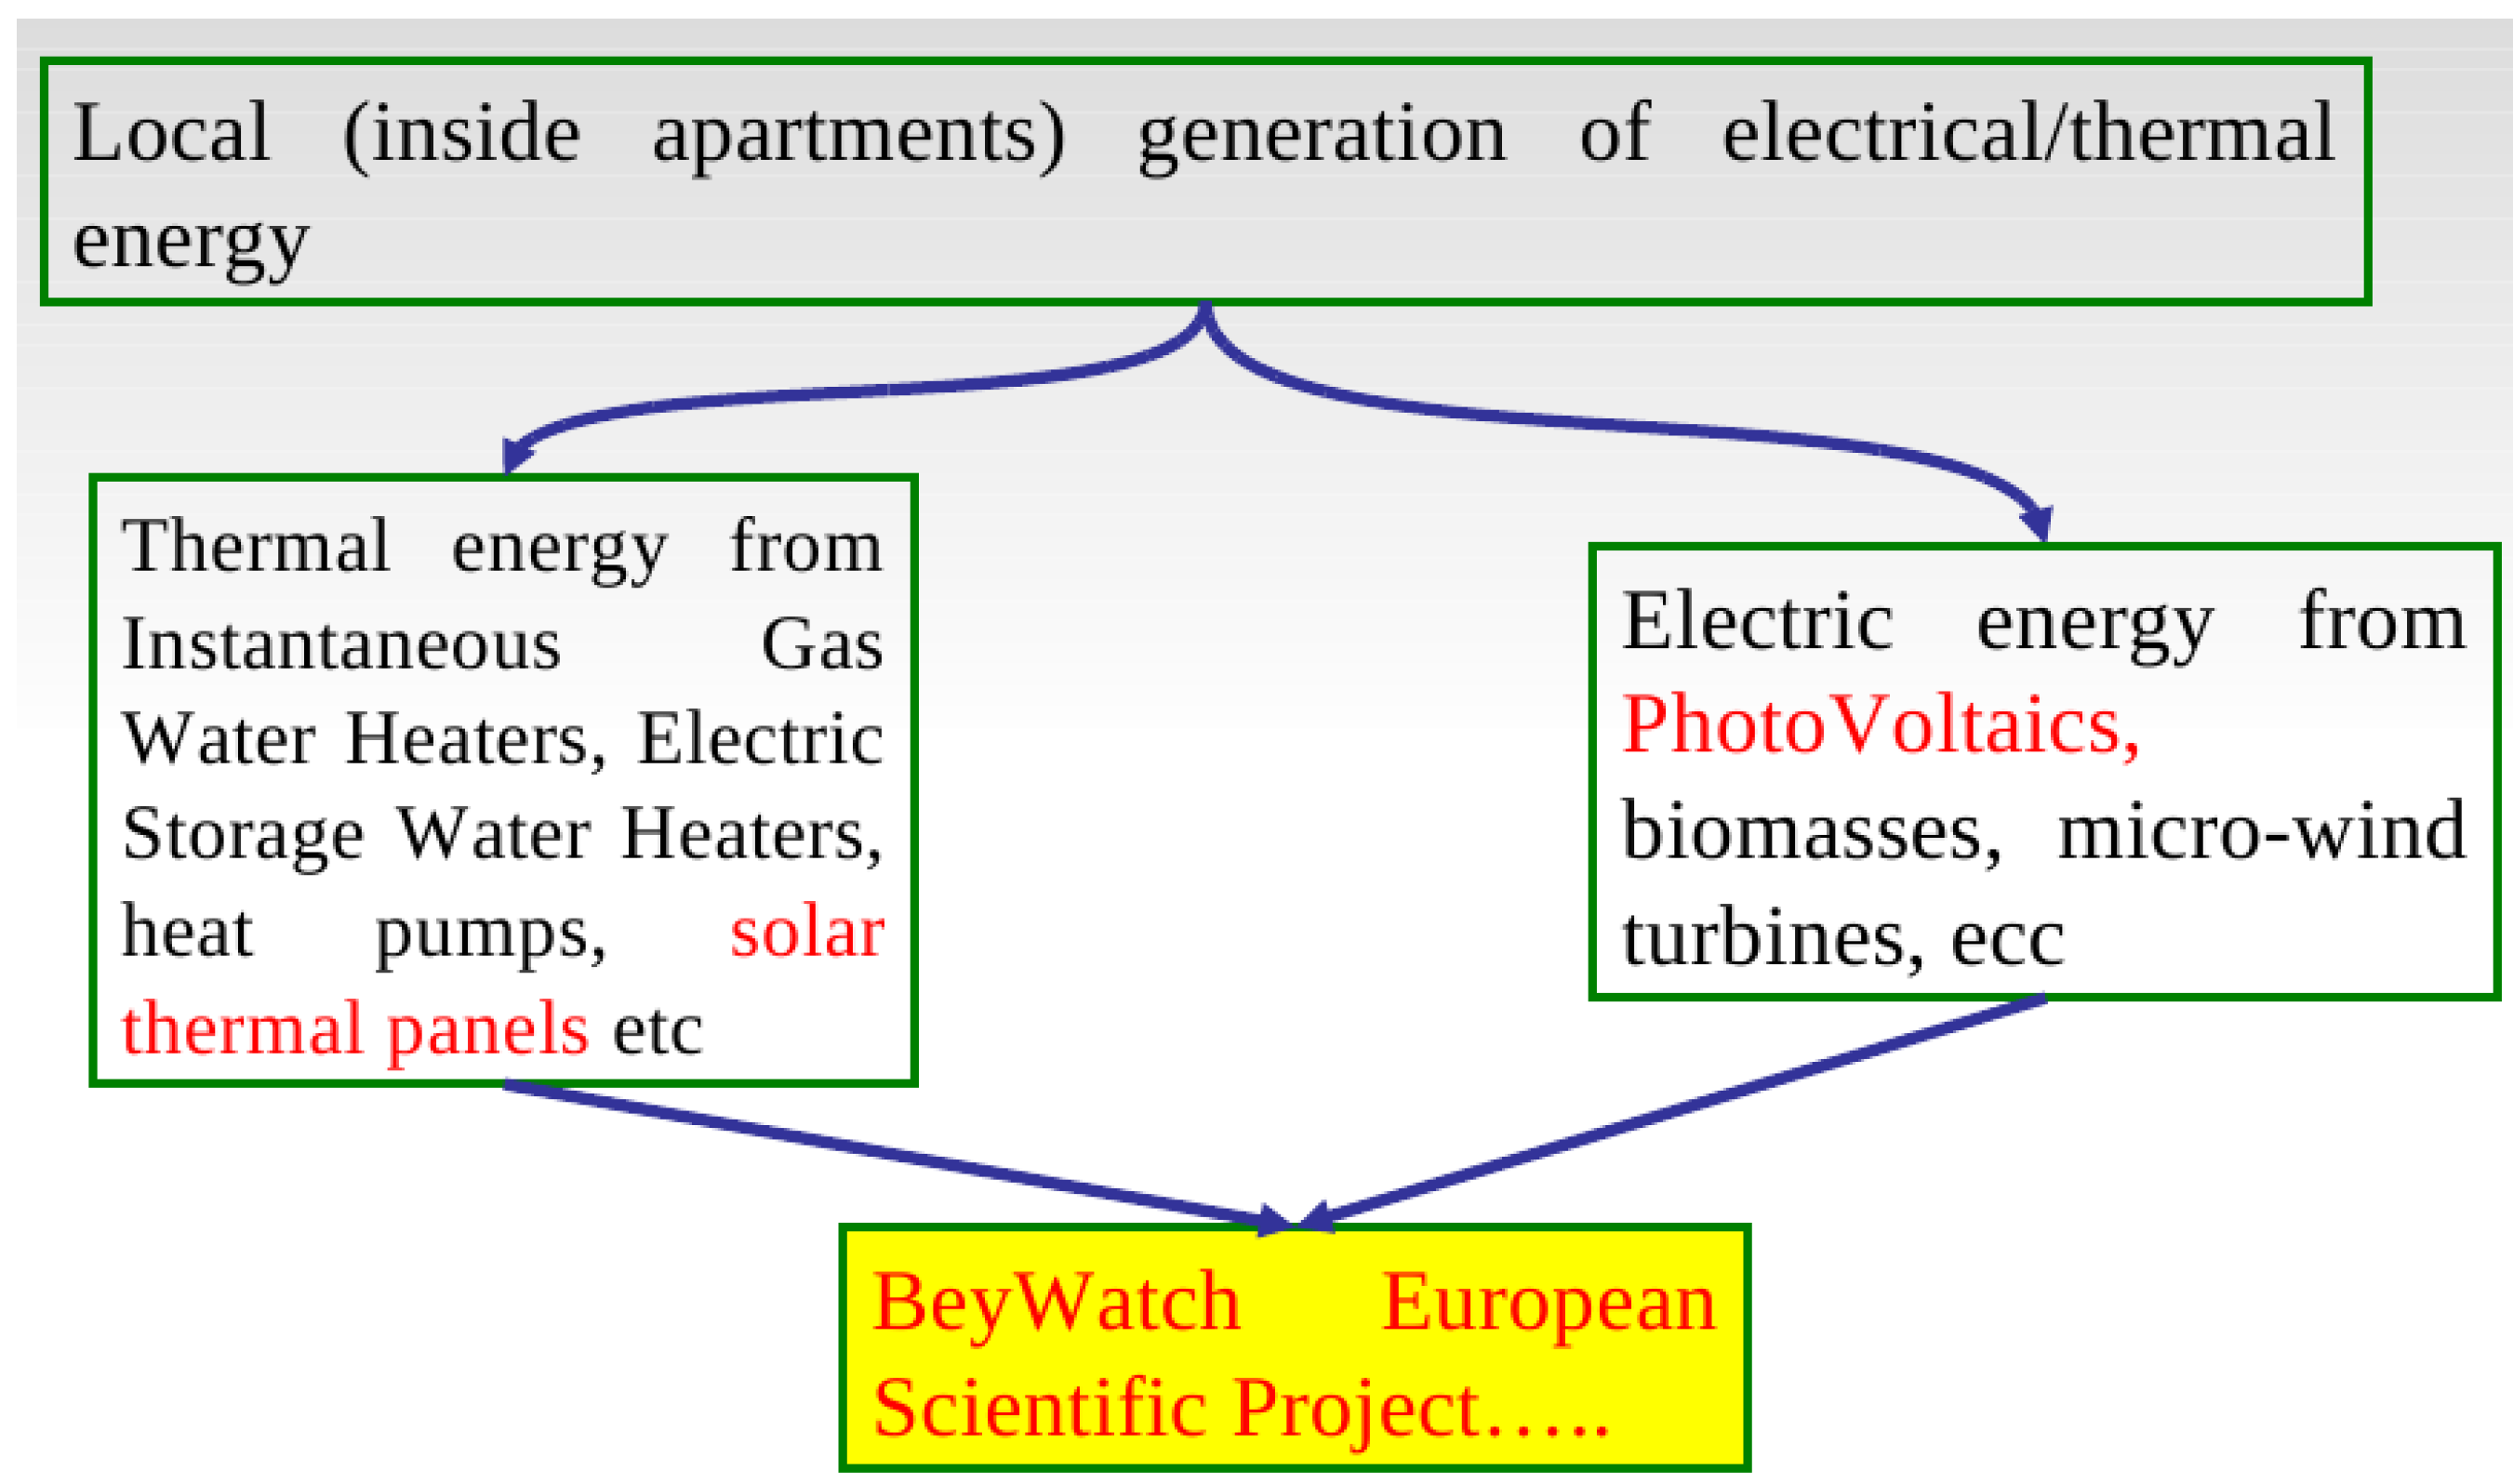
Distributed Side Management (DSM) and Distributed on Site (DoS) control actions are implemented with the aim of reducing peaks in energy demand and to make the energy demand pattern flatter, either at a per-house and at a grid level. This is mainly obtained by avoiding the synchronous activation of appliances or loads and by optimizing their activation in order to achieve the overall better energy efficiency and by doing this in the most transparent way with respect to the end-users. Distributed on Site (DoS) actions (see Figure 2) are complementary to DSM actions and allow one to achieve even better performances by exploiting some form of local energy generation, such as combined heat and power (CHP) systems, solar panels for water heating, photovoltaic panels, and so on. In order to be deployed, these strategies have to be supported by specific appliances or house infrastructures, by suitable control algorithms executed by a centralized device, called “Load/Energy Manager”, that is able to manage communication with the appliances and also with the power grid.
Figure 2.
Distributed on site action.
Residential energy users are interested in having a cheaper energy cost and may be interested in increasing “social” savings in terms of CO emissions reduction and global warming. Both can be achieved by adopting DSM strategies. The Demand Side Management control actions here proposed are realized on the per-house load. These actions perform two objectives:
- Peak shaving, applied on a country-wide level: the utility manages the power consumptions of entire groups of houses (communicating with their residential gateway) with the aim of reducing energy losses in transmission and distribution power systems and avoiding troubles related to power quality and energy production. The utility sends a command to the energy/load manager, which will perform the peak shaving function;
- Power leveling, applied on a per-house level: an energy/load manager in each house takes care of leveling power consumptions below a certain threshold with the aim of minimizing in-house power losses, shifting activation of appliances in periods with cheaper energy costs and maintaining the instantaneous house load under the contractual maximum. The proposed power leveling control actions perform both the load management (direct DSM) and the energy cost management (indirect DSM) functions.
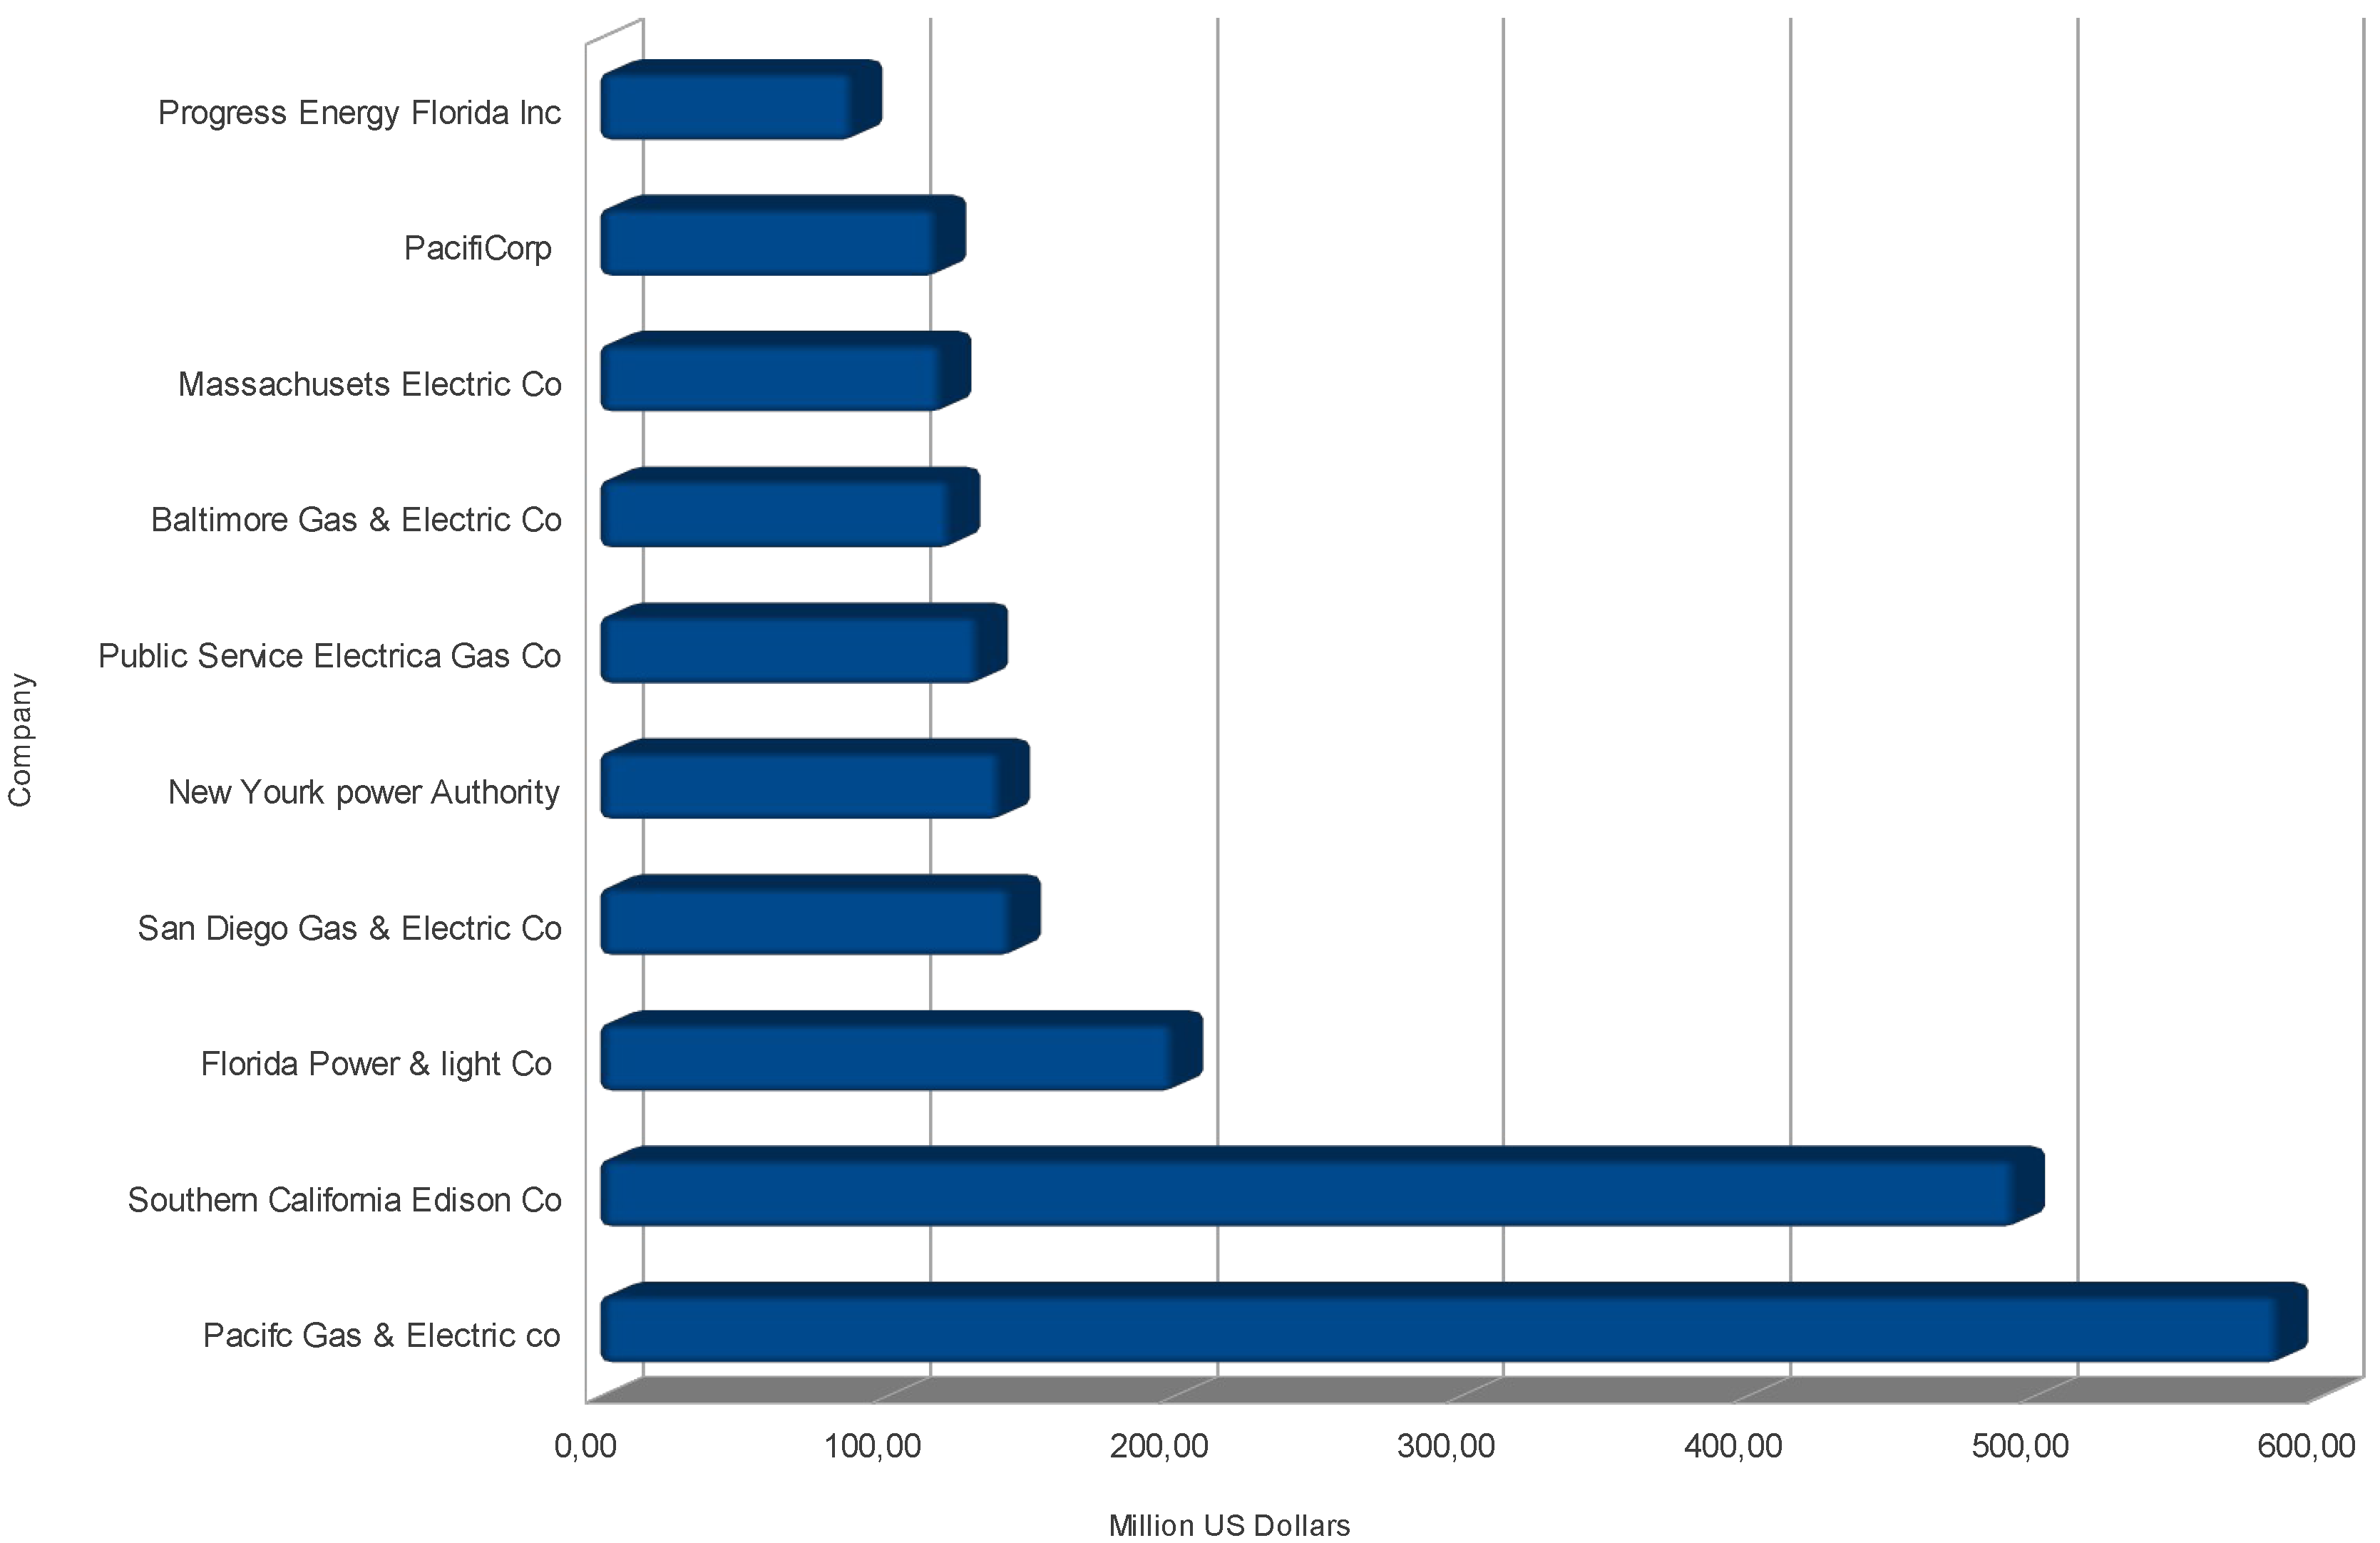
The Demand Side Management is gaining, today, more and more attention from technicians and investors. The Figure 3 shows the recent investment amount by the main energy companies in the USA in millions of US dollars.
Figure 3.
Investments on Demand Side Management (DSM) in the USA.

Each of the these objectives can be fulfilled by using two control strategies [8]:
- Intelligent on/off control;
- Advanced control.
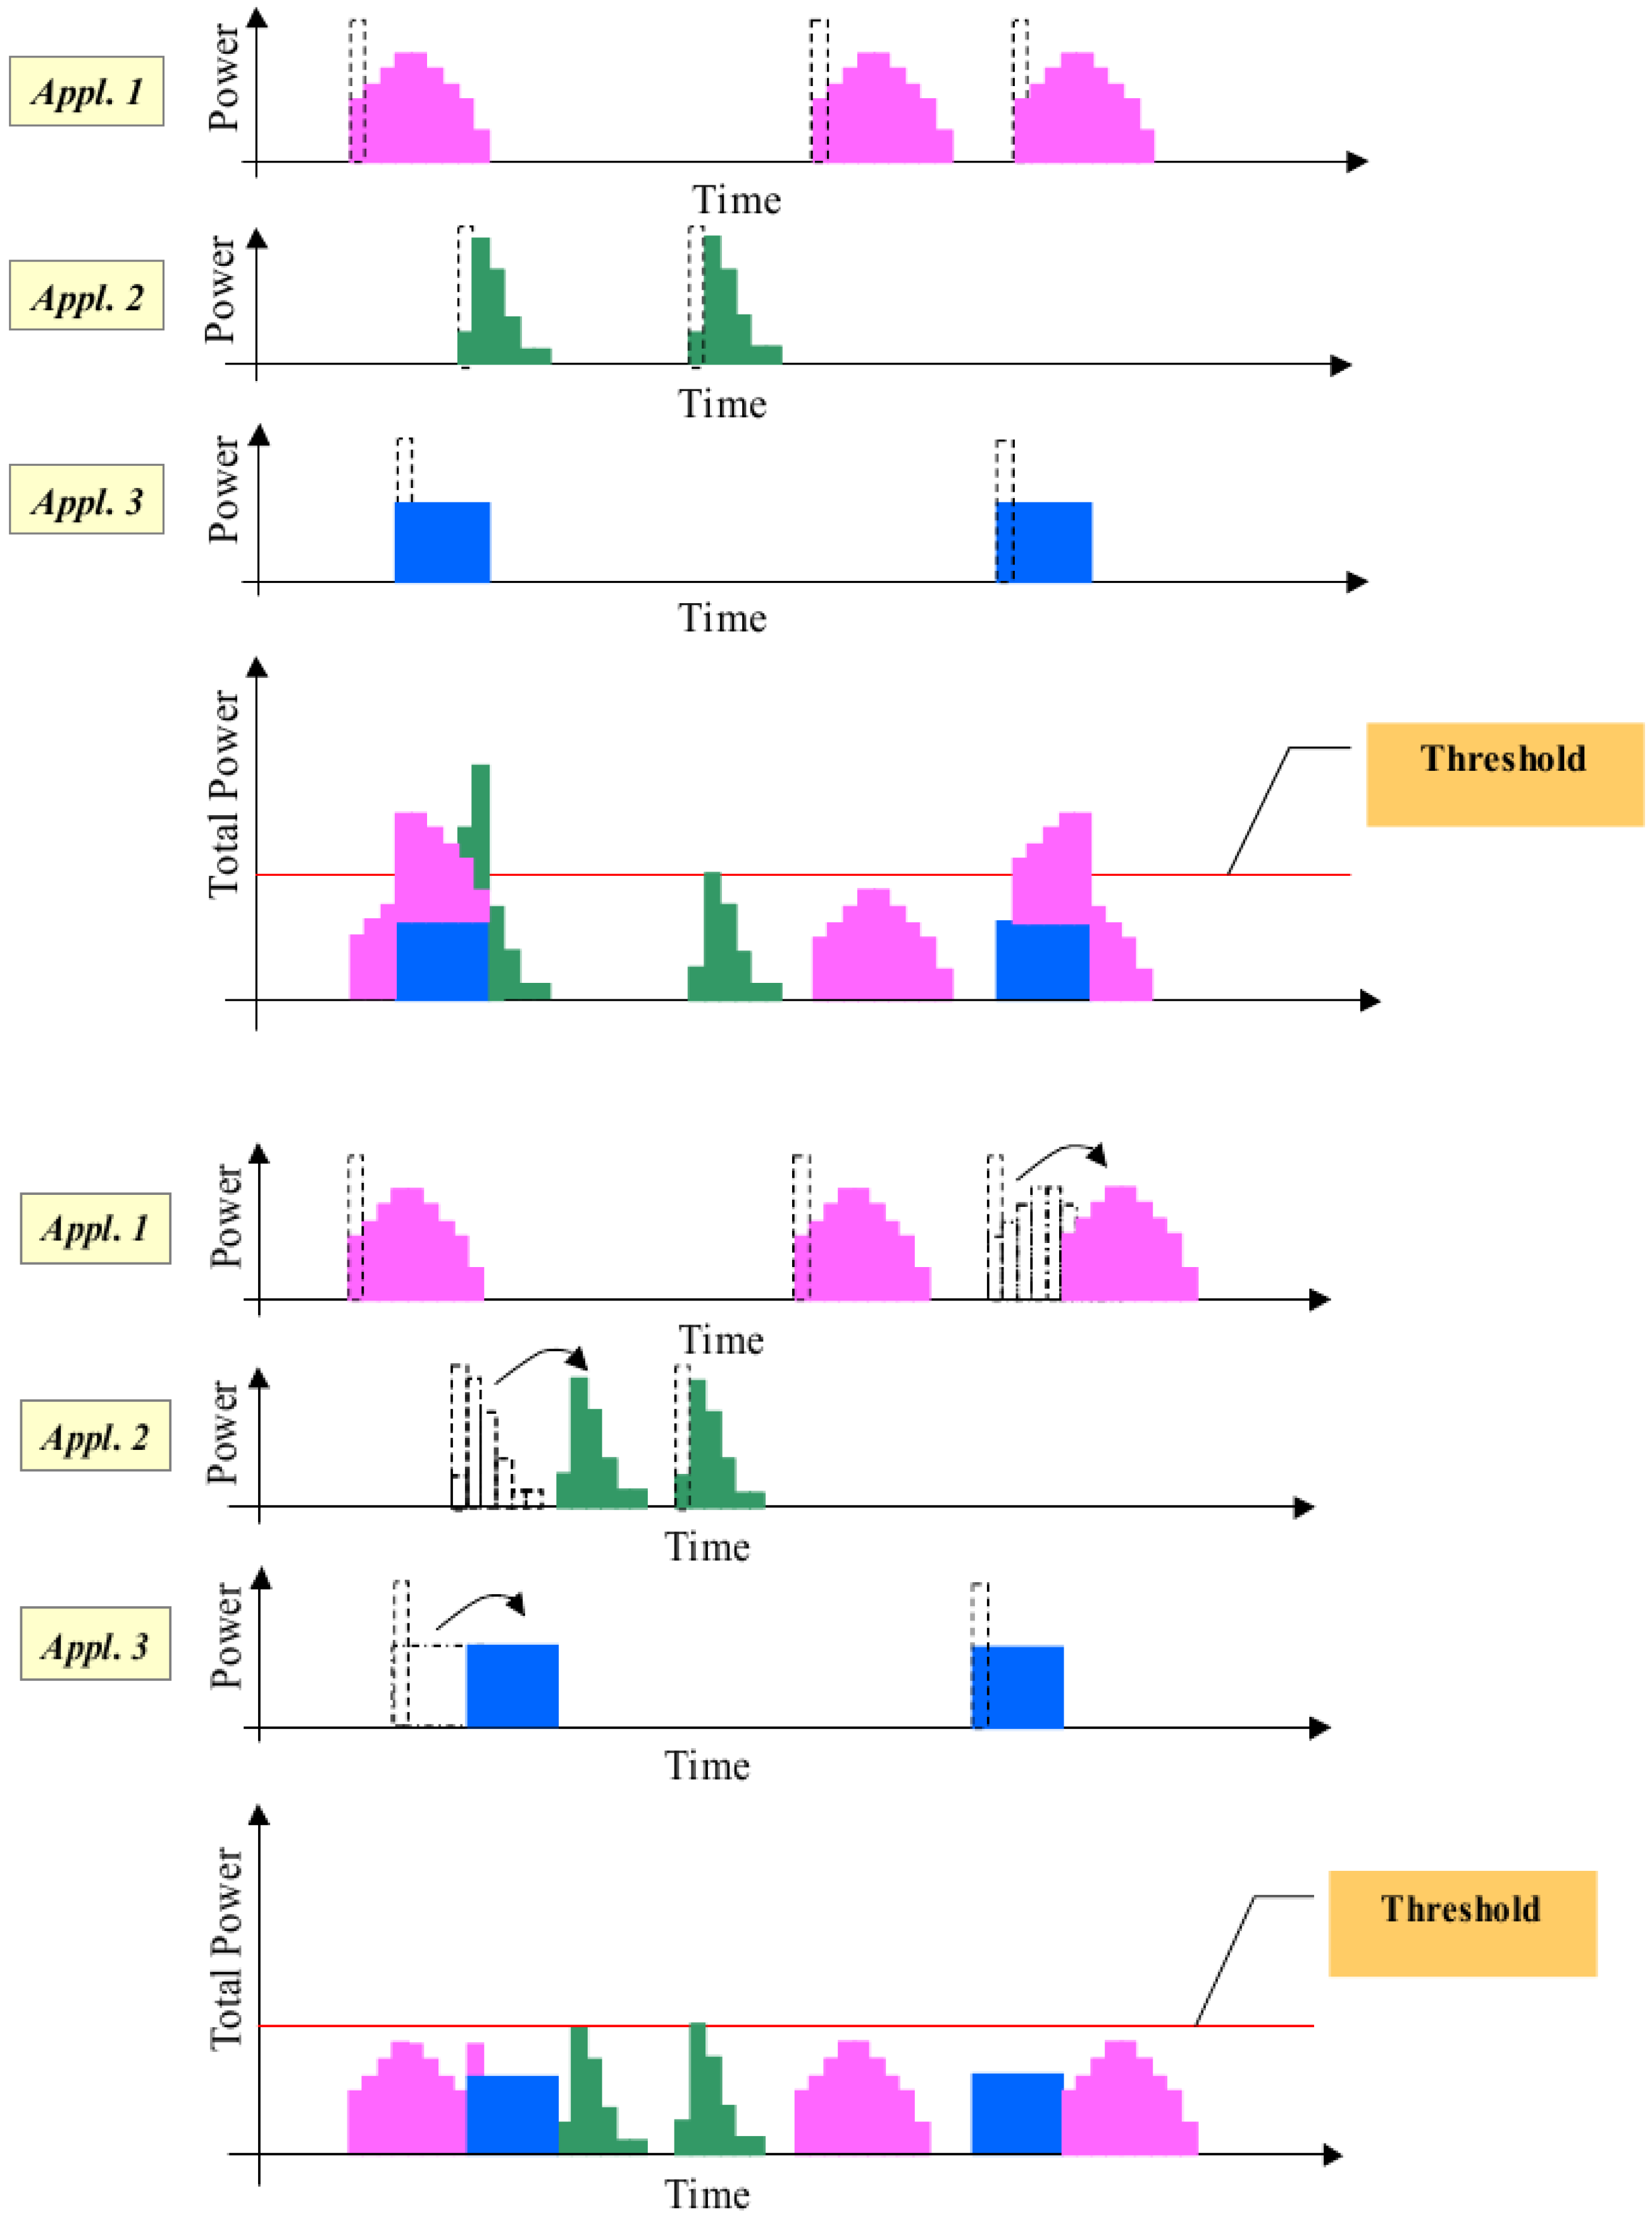
These considerations and the resulting scenario are summarized in Figure 4. It is important to have a global overview of energy management actions inside apartments. In Figure 5, this overview is reported, while in Table 1, the load shifting actions (see also Figure 6) are explained in detail.
Figure 4.
DSM function block diagram.
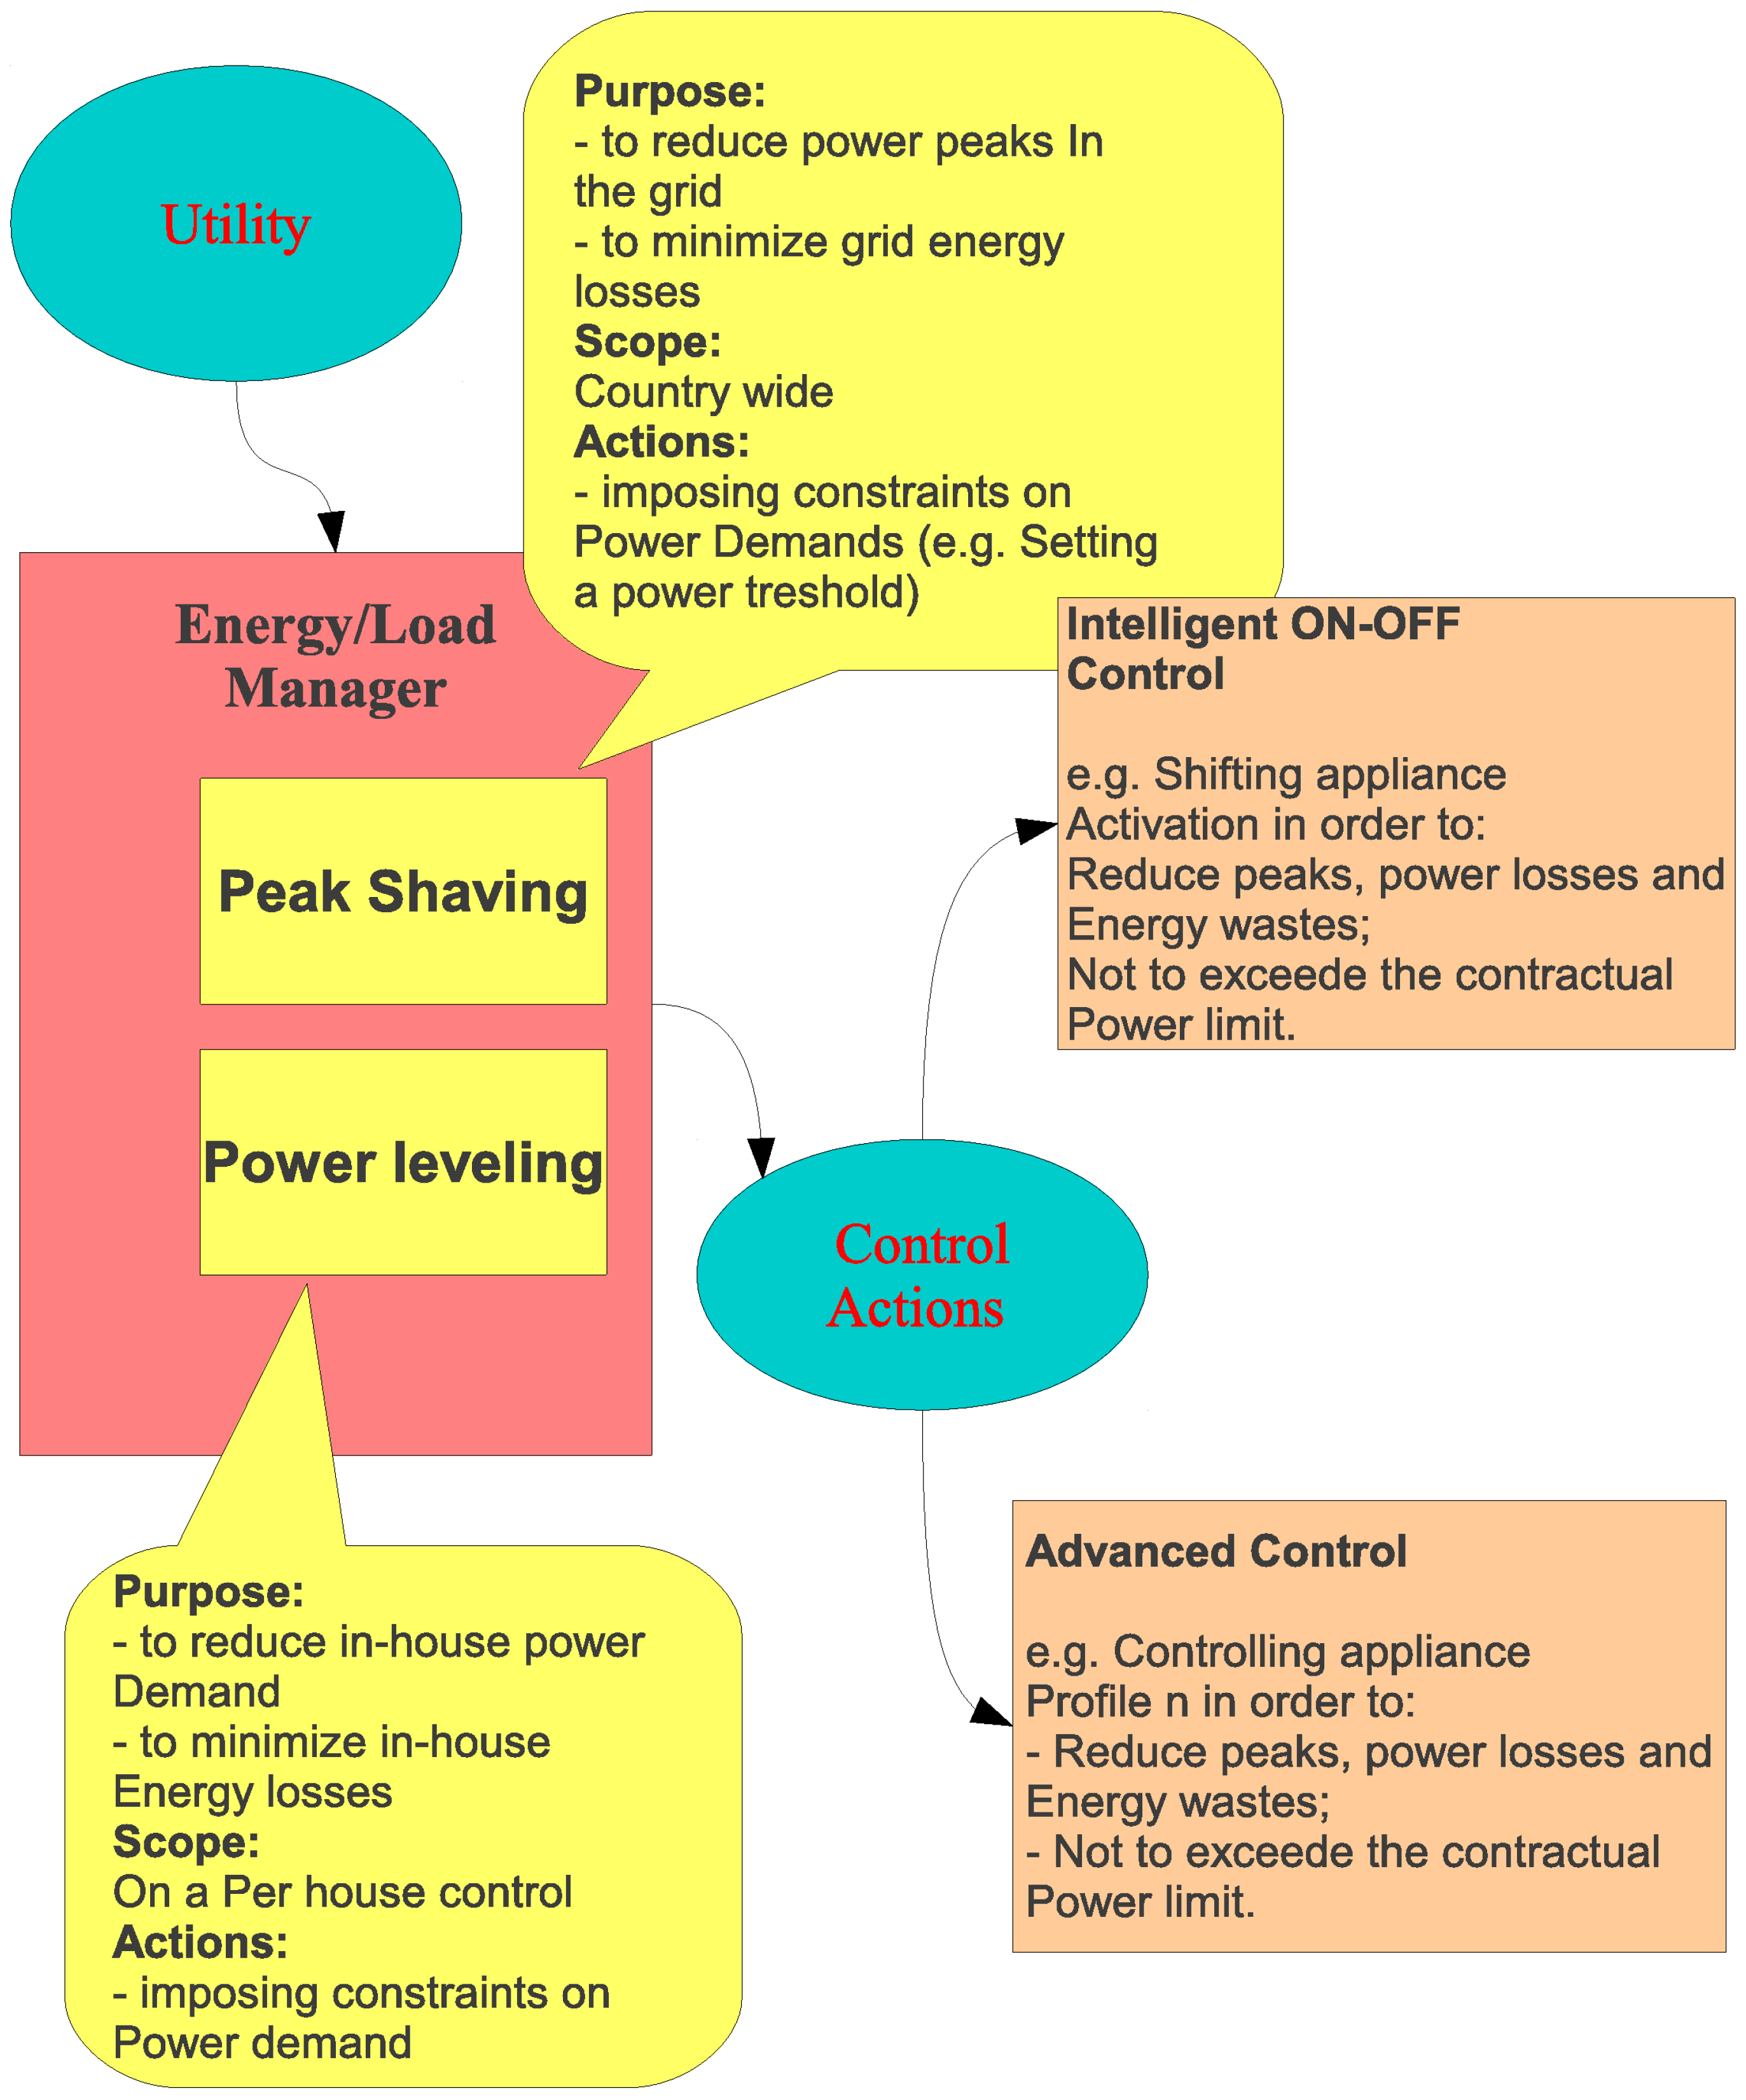
Figure 5.
Global overview.


| Appliance type | Activation priority | De-activation priority | Delay time |
|---|---|---|---|
| Washing Machine | 30’ | ||
| Dish Washer | 30’ | ||
| Dryer | - | ||
| Electric storage water heater | 30’ | ||
| Oven | 30’ | ||
| Hob | - | ||
| Fridge/Freezer | 30’ | ||
| Air Conditioner | 30’ |
Notes: A: Maximum priority; B: Medium priority; C: Minimum priority.
Figure 6.
Load shifting action road map.
For DoS, control action is the intended action of generating electric or thermal energy in the place where it will be absorbed by the final user in order to obtain a better performance of the generating-consuming system; see Figure 7.
DoS control actions include:
- Type 1: production of electric energy from photo-voltaic (PV) systems, biomass, micro-wind turbines, etc.;
- Type 2: production of thermal energy from an instantaneous gas water heater (IGWH), electric storage water heater (ESWH), heat pump, solar panels, etc.;
- Type 3: production of both electric and thermal energy through CHP (combined heat and power) and CHCP (combined heat and cool and power) systems.
The choice of one of these systems significantly affects the daily power profile and the power peak of a given electric installation.
Figure 7.
Power leveling.
The purpose of this analysis is to quantify the effects, in terms of savings or wastes of energy, of the production with generating systems based on renewable technologies and of sanitary domestic hot water (SDHW) for feeding not only the normal domestic users (basin, kitchen sink, shower and bath), but also the dishwasher (DW) and the washing machine (WM) if present in the house. Indeed, this kind of action allows one to eliminate, from the power profile of these two appliances, the part due to the water pre-heating phase, with effects of peak shaving and power leveling on the house daily power profile. On the other side, the generating system requires electric or primary energy for producing the required hot water, and this has an opposite effect on the house daily power profile.
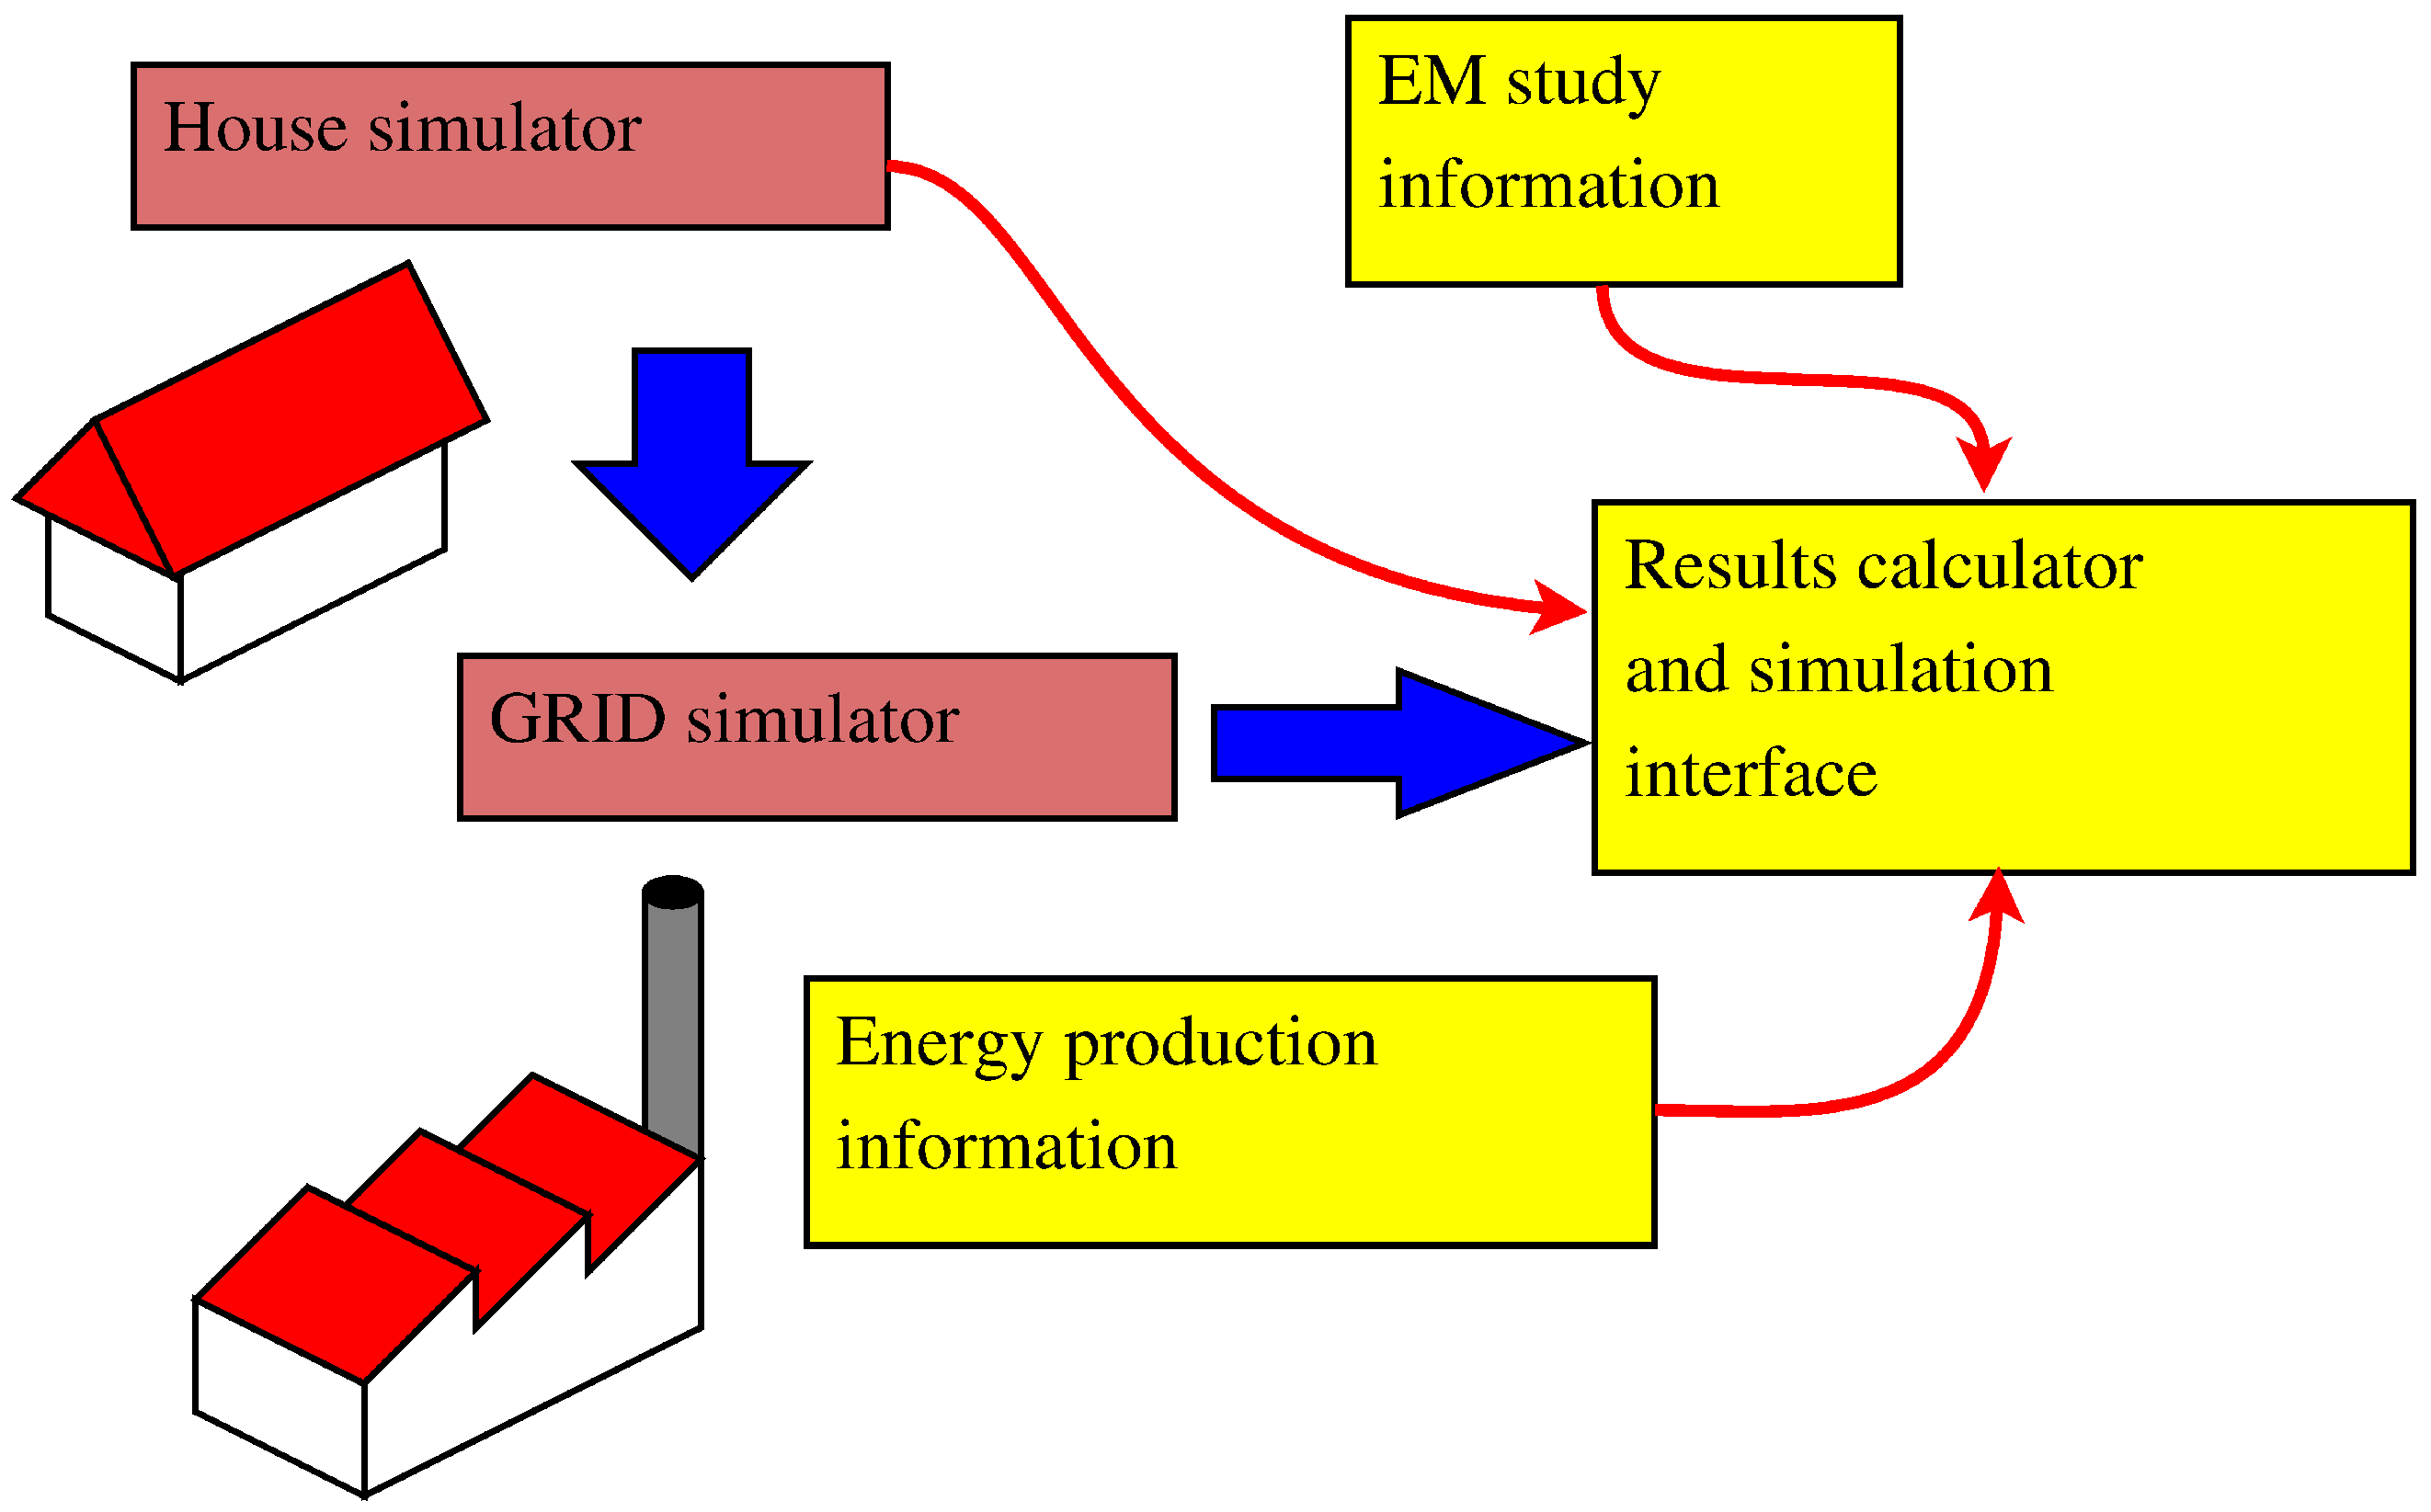
The aim of this analysis is to investigate if these contrasting effects can lead to energy savings for the final user or to a reduction of CO emissions for the whole electric system. To evaluate energy management results, the simulation of the system has been implemented, and the study reported hereafter provides results based on a campaign of simulations conducted on software simulators, as described in the chart of Figure 8.
Figure 8.
Energy management study chart.

Energy savings have been considered both at the house level and at the grid level in four European countries: Italy, France, Germany and the United Kingdom. Four scenarios have been considered, those being:
- Scenario 0: typical house;
- Scenario 1: house with intelligent on/off;
- Scenario 2: house with intelligent on/off plus advanced actions;
- Scenario 3: house with intelligent on/off plus advanced actions plus water heating outside the appliance.
The present study has been made by considering that the energy production along the time horizon of 13 years has the same mix today as present in Europe. This is a kind of starting point, but a more precise analysis should take into account trends of electric energy production [8]. With respect to this, a dynamic model should be implemented for the evaluation of the savings on primary production, on CO emissions and on local impacts [9].
In order to evaluate instantaneous domestic power consumptions and losses, a house simulator has been developed. The simulator is able to deliver accurate numerical data considering a number of different scenarios, e.g., considering houses using traditional appliances, houses with intelligent appliances and a house capable of implementing DoS functionalities. In order to obtain more realistic results, a Montecarlo method was used. This approach is necessary, since different houses (or even the same house in different days) exhibit different usage patterns of appliances and loads. Therefore, in order to calculate in a more realistic way power peaks and losses (one of the key factors in this study) arising from the simultaneous activation of appliances, it is necessary to execute a huge number of simulations using stochastic inputs. These inputs (e.g., usage patterns or numbers of activation per day) can be statistically characterized by means of statistical data or surveys in order to closely reproduce user behavior and customs [8].
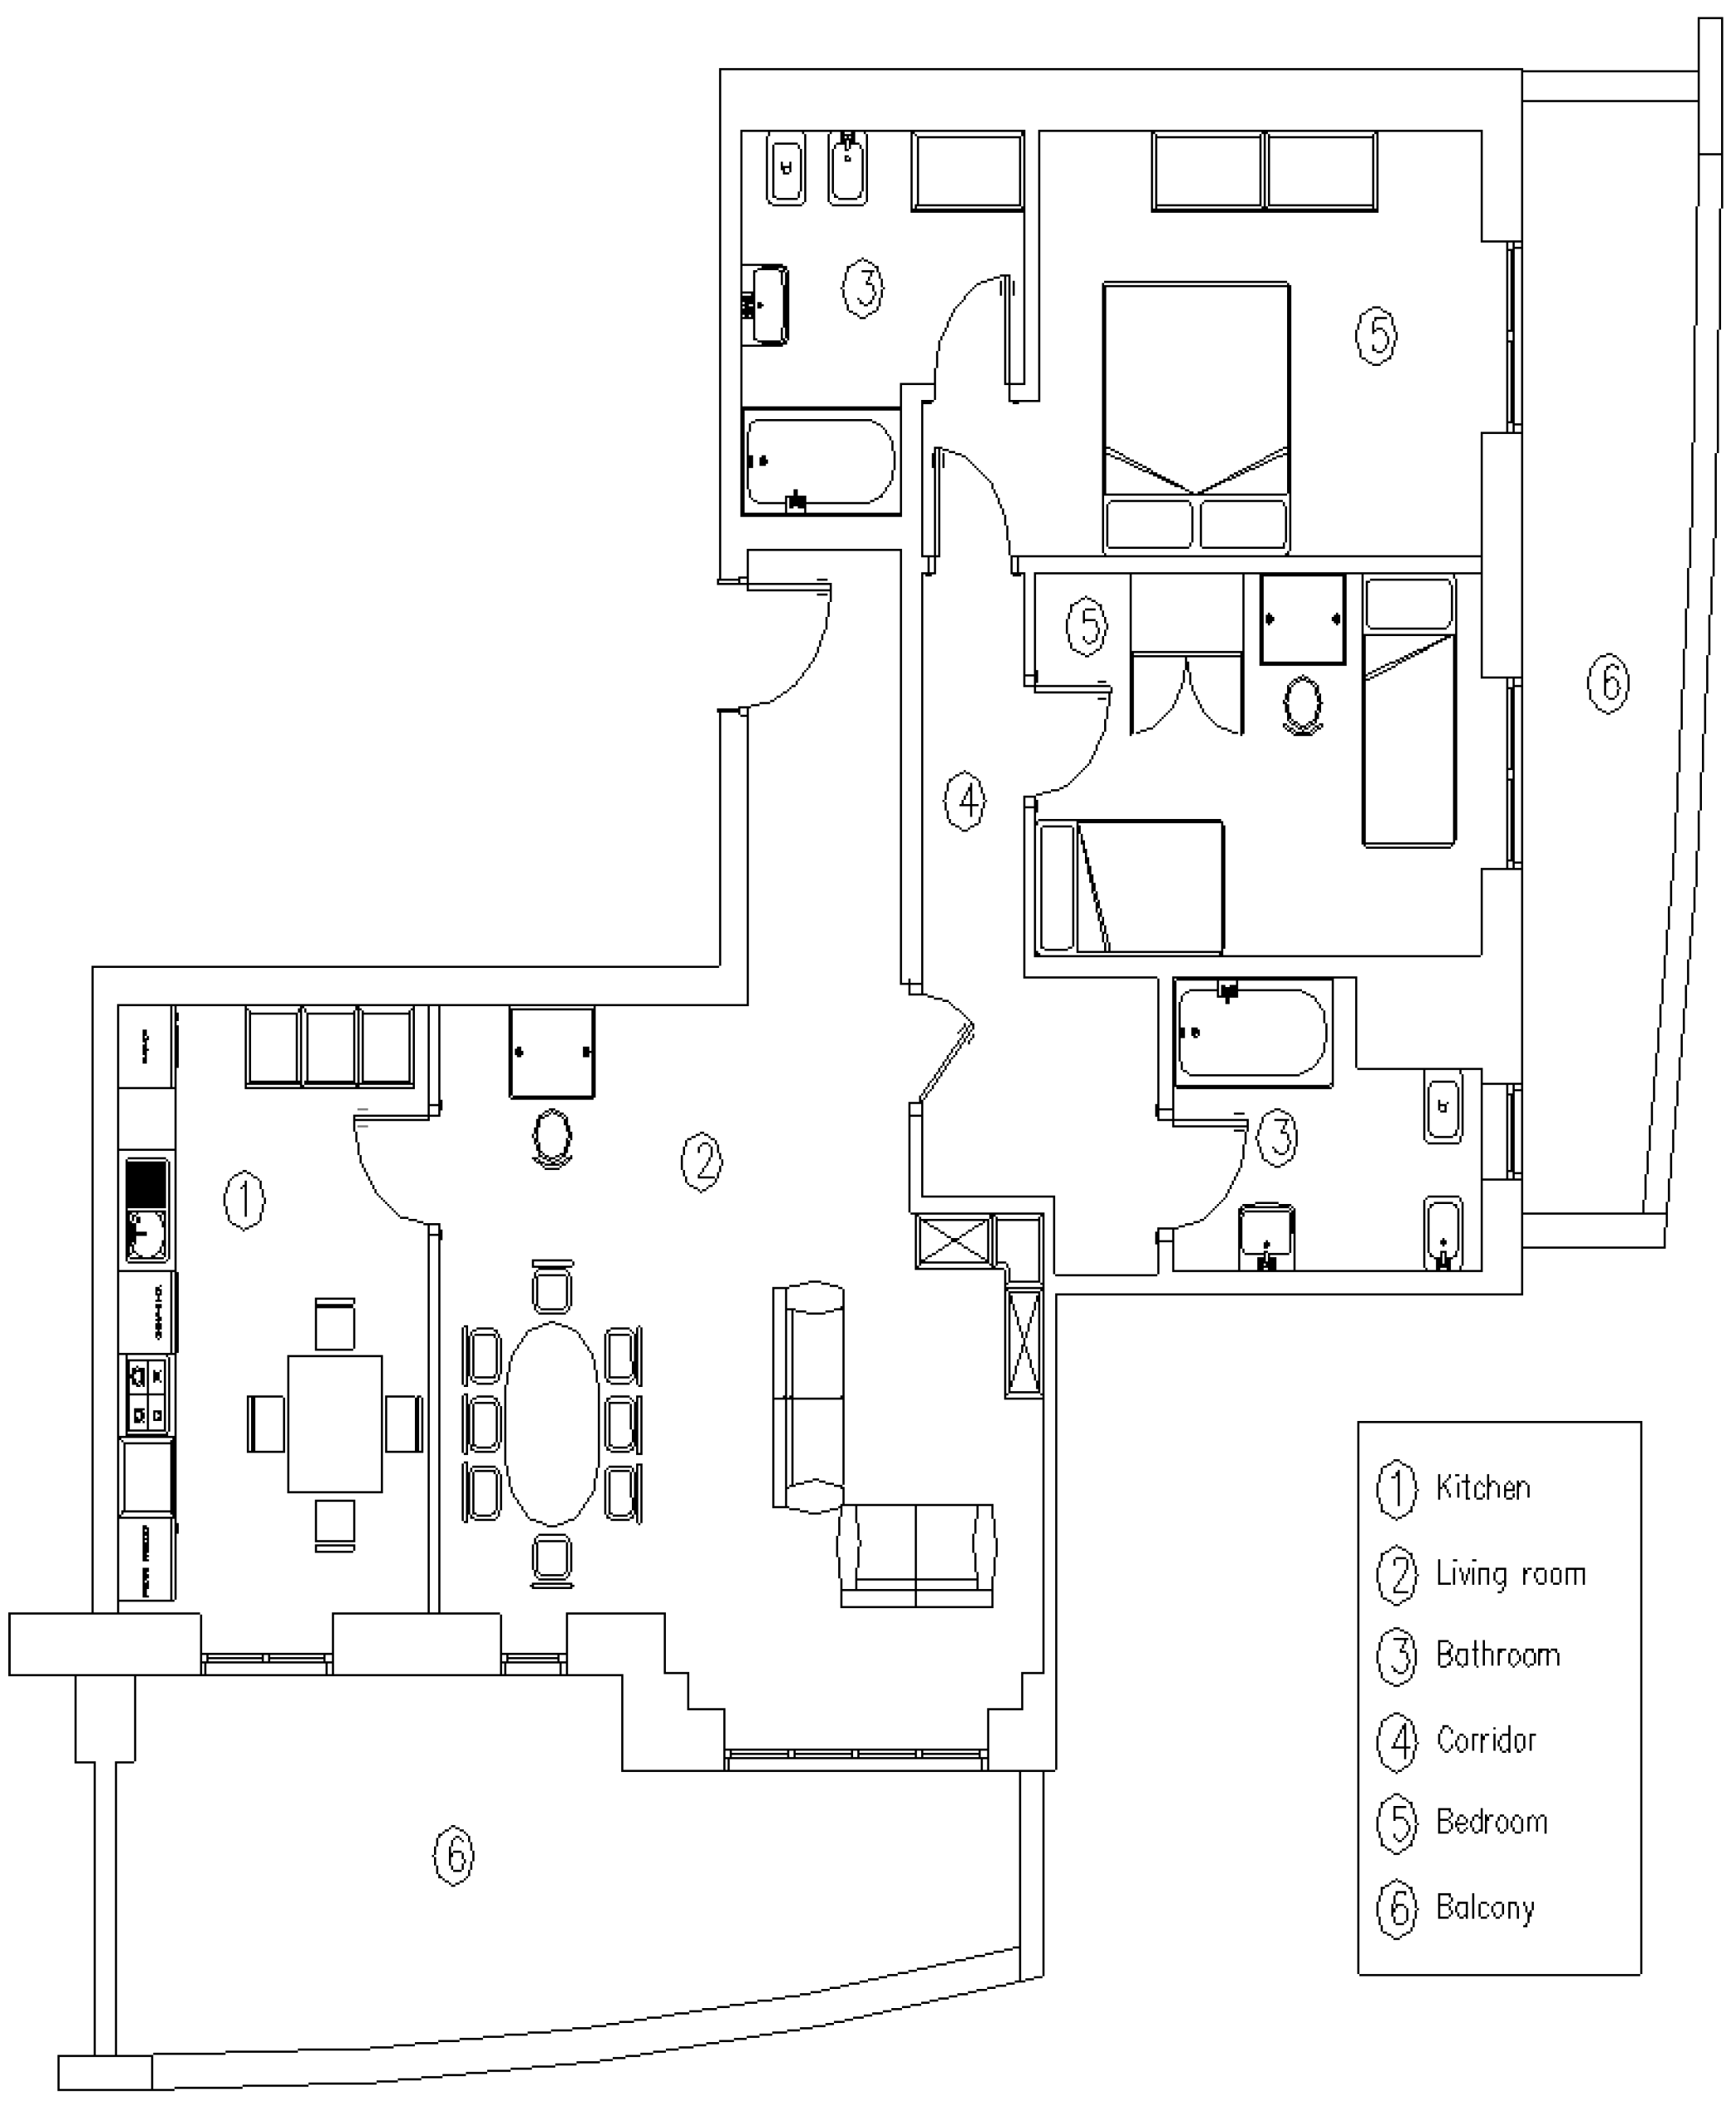
The simulator is able to evaluate, for each 10 min interval in a day, which are the active appliances and loads, their instantaneous power and energy consumptions and the in-house power losses. In order to obtain a satisfactory statistical coverage, a big number of runs (on the order of 5000) have been executed; then, the most frequent values have been gathered. A typical apartment (surface = ; wiring layout: radial with a main feeder starting from the home’s electricity meter and arriving to the main switchboard). From the switchboard, a series of lines and sub-lines supply the electrical defined loads. People living in a family made of four persons (parents and children)) (see Figure 9), four typical days, number of uses per day and usage pattern have been taken into account.
Figure 9.
Typical apartment.

Four typical days have been considered:
- Summer working day;
- Summer non-working day;
- Winter working day;
- Winter non-working day;
- Each typical day has a different presence of inhabitants.
Number of uses per day:
- How many times each electric load is used in the considered typical day;
- Each electric load can be switched on: one time in a day; more than one time in a day; less than seven times in a week.
Italy (examples):
- Washing machine: families with three or more persons -> 5.9 washes a week;
- Air conditioning in the hot season (from June to August) -> seven days a week; Dishwasher: six-times/week.
The use of each electric load depends on non-deterministic factors, such as:
- The inhabitant customs;
- The number of inhabitants in the house;
- The inhabitants’ standard of living;
- The climate conditions;
Only through a probabilistic approach is it possible to take into account all the above-mentioned factors. In order to have the most probable load profile of a given typical house, it has been necessary to execute a big number of simulations (“the great number law”).
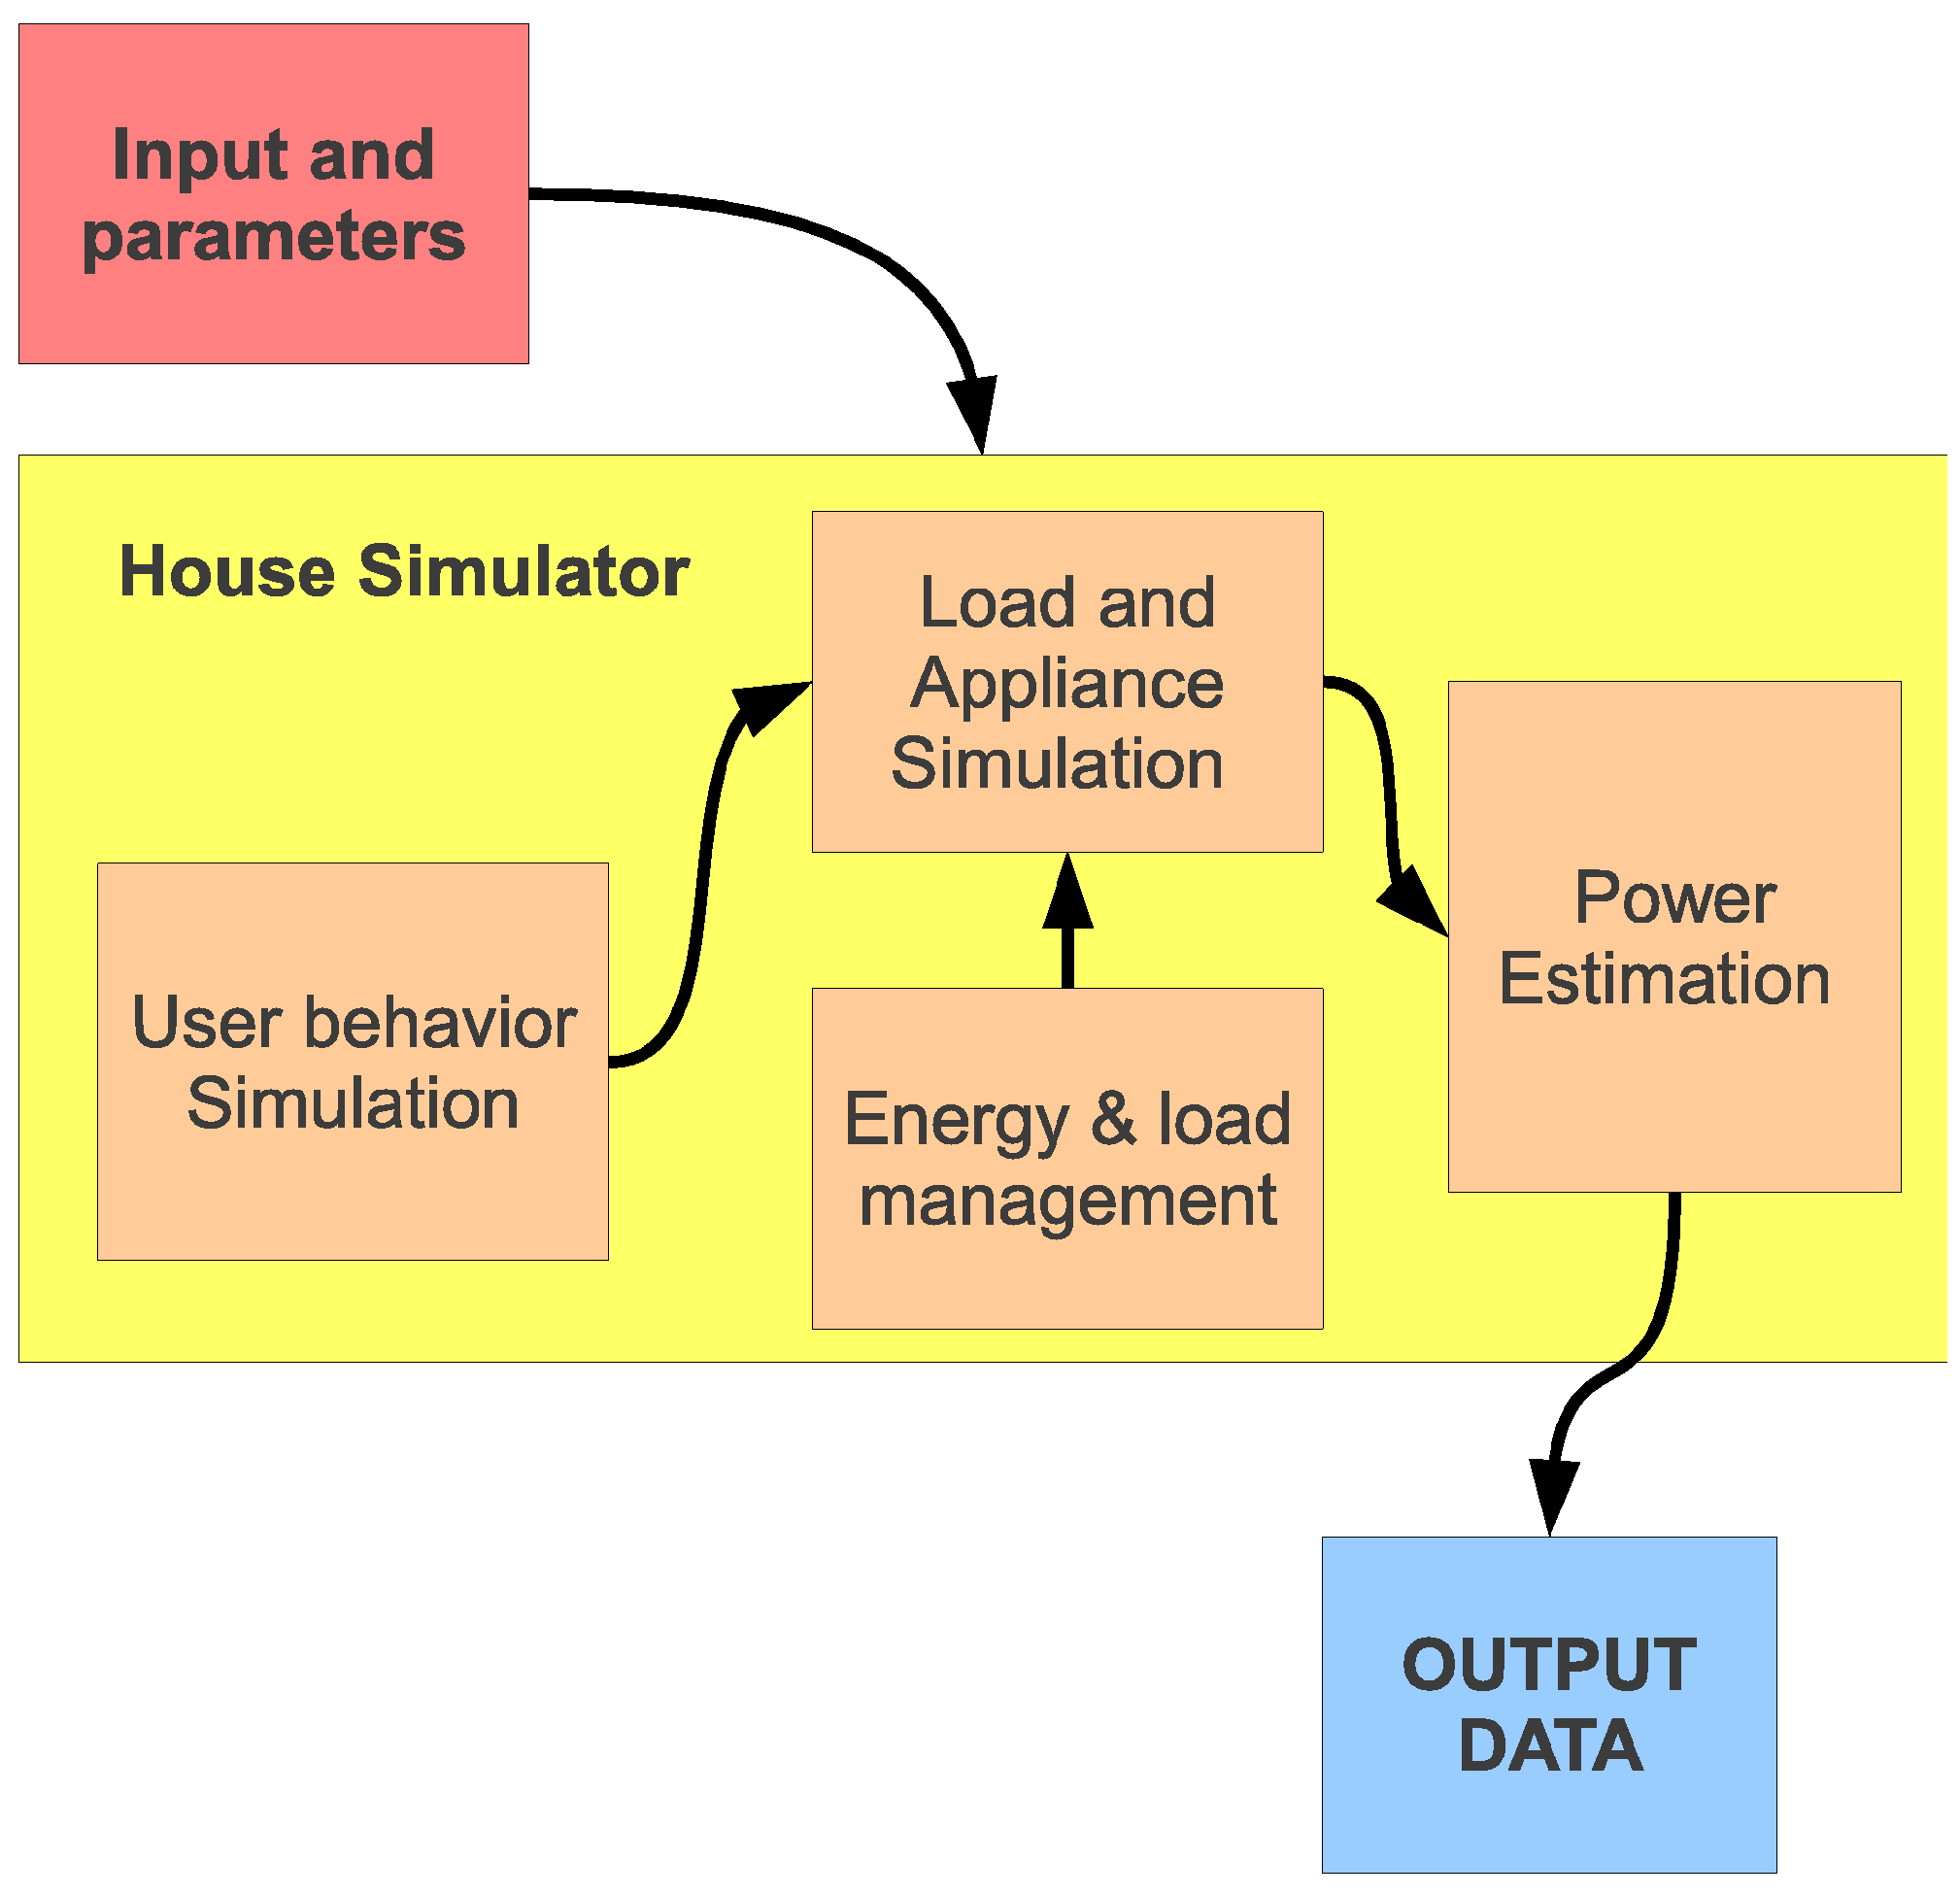
The house simulator is composed of four different functional units:
- “User behavior simulation”, for the stochastic generation of usage patterns;
- “Load and appliance simulation”;
- “Power estimation”, for the evaluation of the power consumption and energy losses;
- “Energy and load management”, for the implementation of Demand Side Management and/or Distributed on Site control actions.
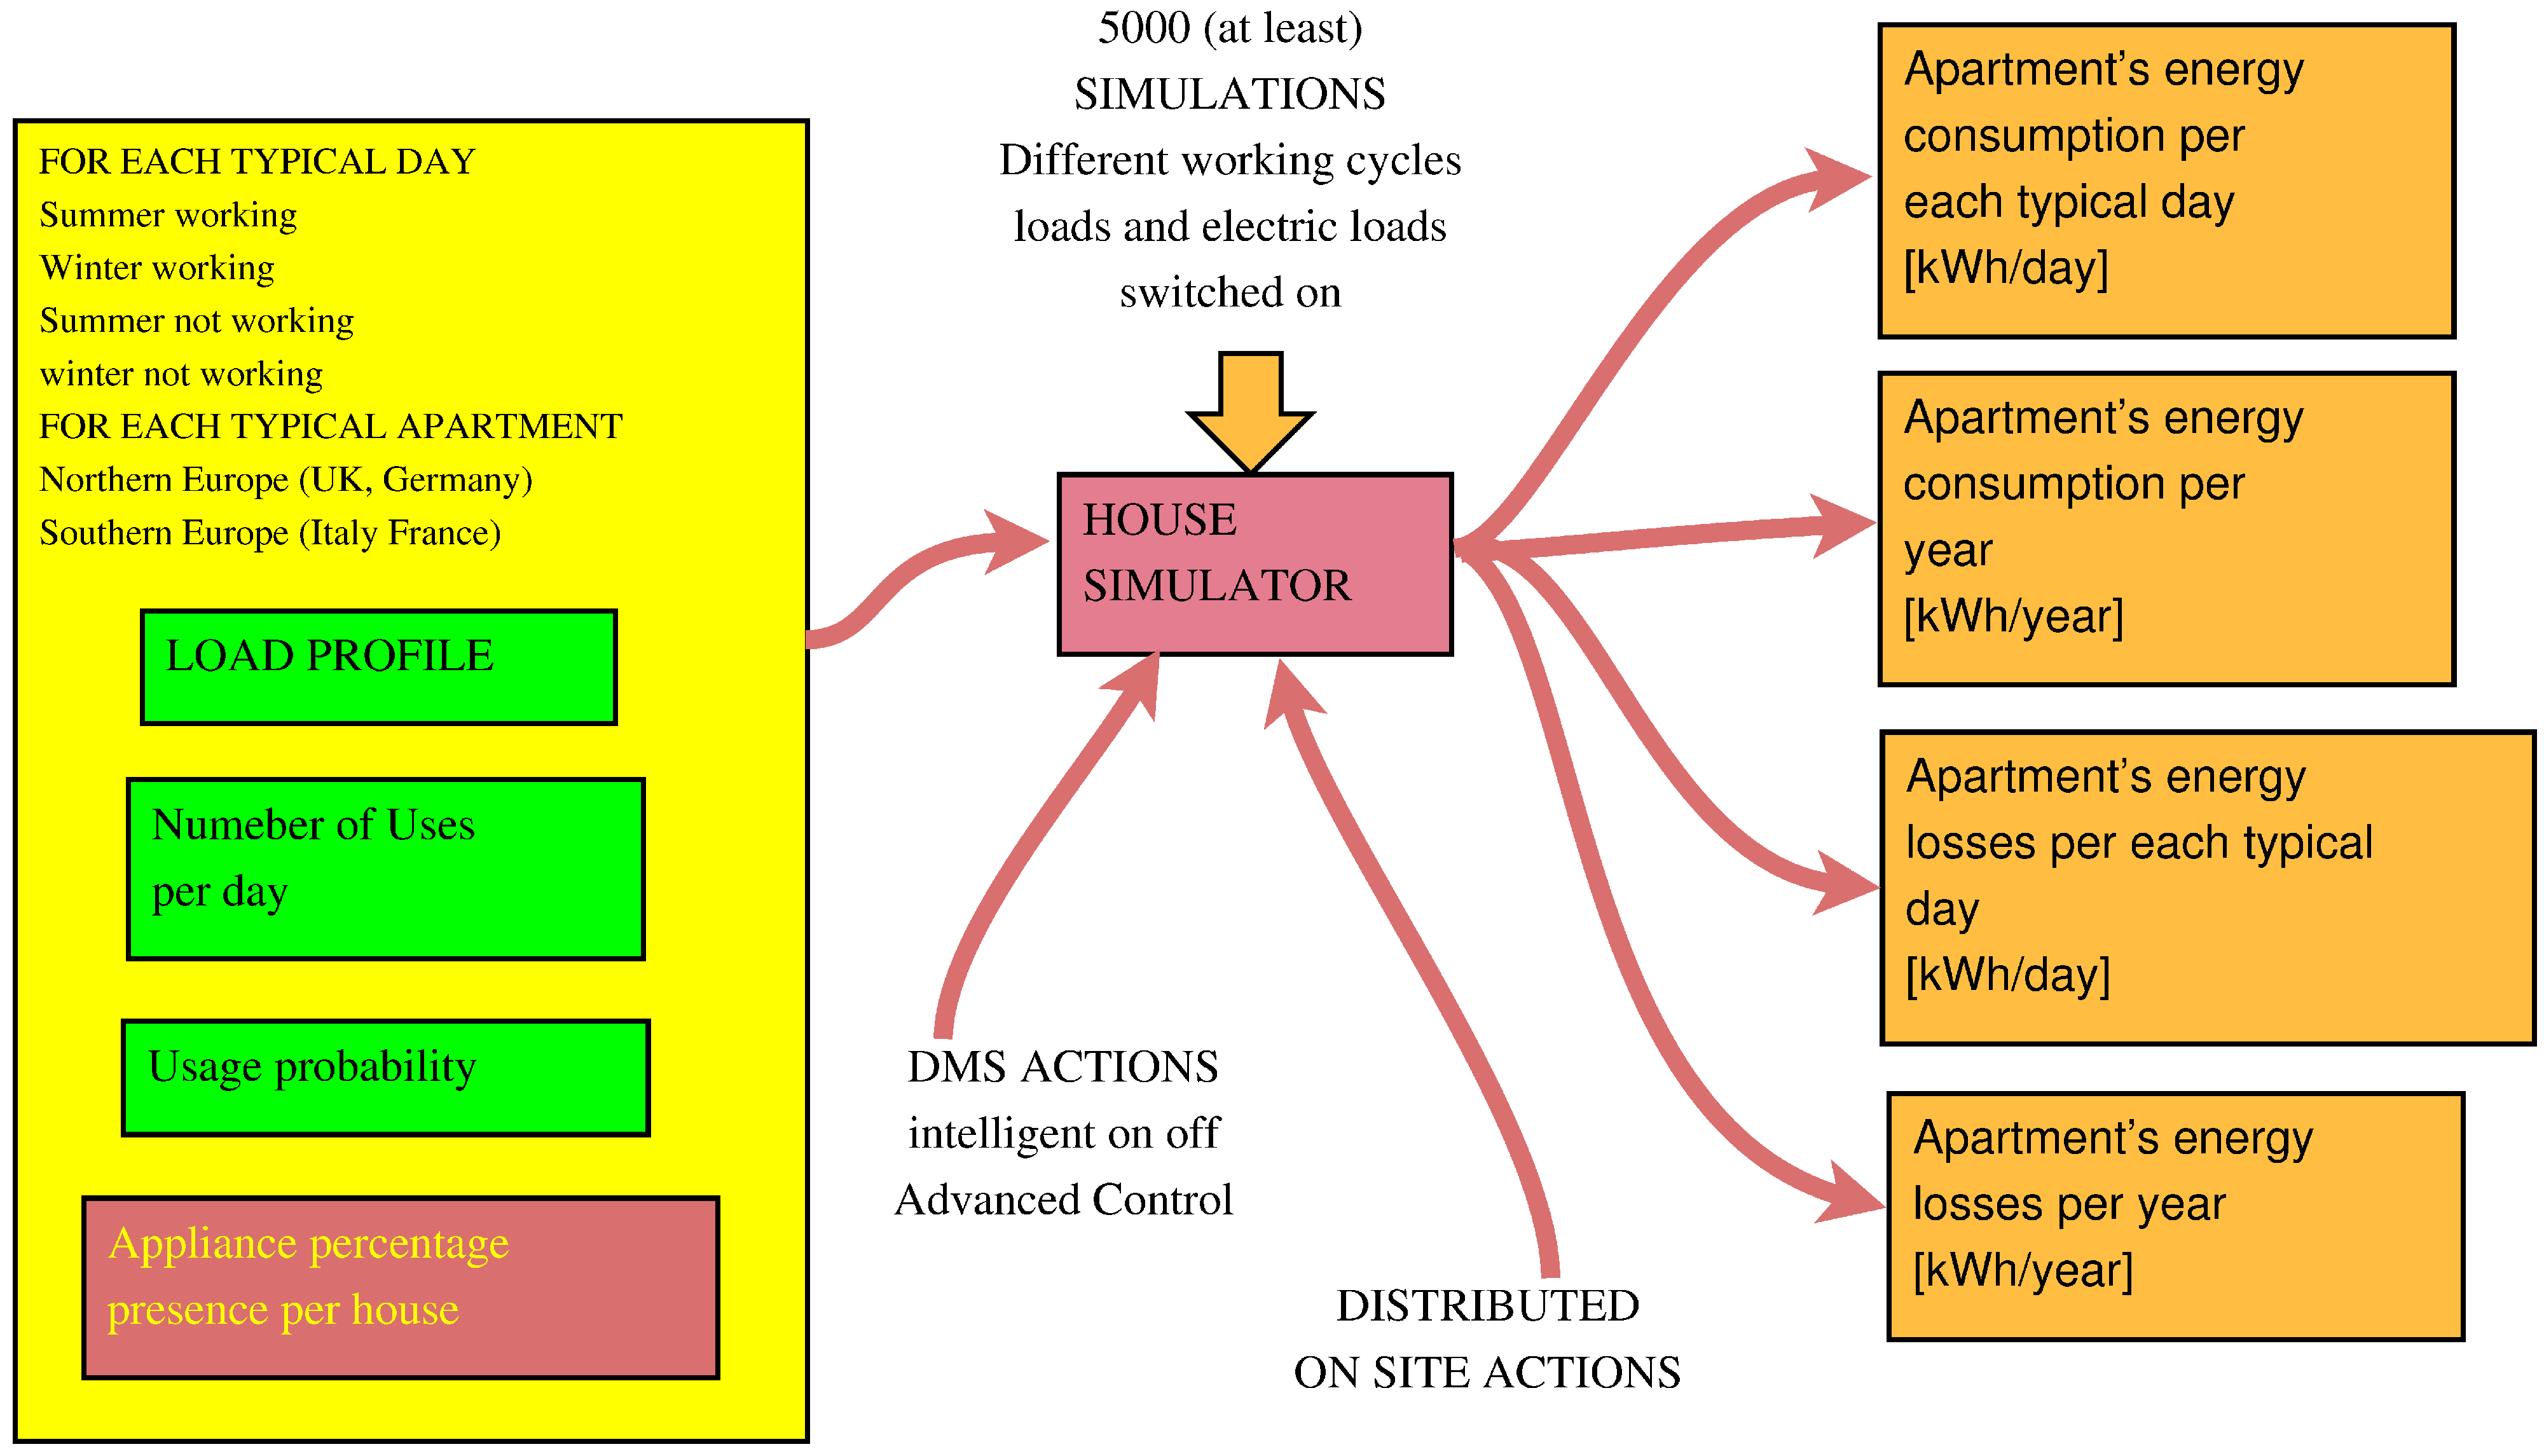
The simulator structure is showed in Figure 10. It takes as input the data of the apartment wiring layout, appliances and their load profiles, statistic appliance usage patterns and presence factors.
In Figure 11, the input and data output of the house simulator are reported.
In order to extract simulation results, the basic simulation routine, which covers a single house and a single day, is iterated from 1000 to 5000 times (until the results converge within the 0.5% of the final value) in order to obtain data for a number of different houses for the same country and a typical day. These data, containing information, such as the peak power consumption and power losses, are automatically analyzed, so to extract the distribution and the most frequent data, as well as some derived figures that are used by the grid simulator. Table 2, Table 3, Table 4 and Table 5 provide house simulator results for the four countries under investigation. Reduction of water heating, either by ESWH and appliances, allows one to significantly reduce the house energy consumption, power peaks and power losses. This scenario guarantees the greatest saving in terms of energy, money and CO emissions. This high reduction in energy consumption and power peaks gives further savings when considering the entire grid and production system.
Figure 10.
House simulator structure.

Figure 11.
Input and data output.
| Country | Day type | Energy consumption (kWh/Day) | Peak power (kW) | Energy losses (Wh) | Number of typical days | Energy losses/year (Wh) |
|---|---|---|---|---|---|---|
| Italy | winter non-working | 10.991 | 3.278 | 118.016 | 78 | 50,080.87 |
| winter working | 10.686 | 3.201 | 114.114 | 194 | ||
| summer non-working | 13.518 | 3.503 | 178.953 | 26 | ||
| summer working | 15.073 | 3.619 | 210.218 | 67 | ||
| France | winter non-working | 12.124 | 3.363 | 167.941 | 78 | 71,825.27 |
| winter working | 12.973 | 3.334 | 189.101 | 194 | ||
| summer non-working | 14.581 | 3.680 | 230.252 | 26 | ||
| summer working | 15.129 | 3.644 | 239.603 | 67 | ||
| Germany | winter non-working | 12.660 | 3.613 | 169.944 | 78 | 63,748.96 |
| winter working | 12.766 | 3.594 | 176.201 | 194 | ||
| summer non-working | 12.521 | 3.492 | 170.173 | 26 | ||
| summer working | 12.757 | 3.624 | 177.397 | 67 | ||
| UK | winter non-working | 13.017 | 3.643 | 201.441 | 78 | 81,778.93 |
| winter working | 14.177 | 3.719 | 230.433 | 194 | ||
| summer non-working | 14.075 | 3.742 | 232.295 | 26 | ||
| summer working | 14.190 | 3.622 | 228.698 | 67 |
| Country | Day type | Energy consumption (kWh/Day) | Peak power (kW) | Energy losses (Wh) | Number of typical days | Energy losses/year (Wh) |
|---|---|---|---|---|---|---|
| Italy | winter non-working | 11.198 | 2.949 | 116.580 | 76 | 47,782.57 |
| winter working | 10.484 | 2.969 | 107.787 | 194 | ||
| summer non-working | 13.311 | 2.958 | 169.761 | 26 | ||
| summer working | 14.922 | 3.018 | 199.474 | 67 | ||
| France | winter non-working | 11.865 | 3.180 | 161.364 | 76 | 66,166.81 |
| winter working | 12.194 | 3.170 | 169.312 | 194 | ||
| summer non-working | 14.342 | 3.311 | 217.483 | 26 | ||
| summer working | 14.839 | 3.353 | 225.107 | 67 | ||
| Germany | winter non-working | 12.637 | 3.338 | 164.021 | 76 | 61,585.36 |
| winter working | 12.746 | 3.336 | 170.433 | 194 | ||
| summer non-working | 12.499 | 3.261 | 164.383 | 26 | ||
| summer working | 12.726 | 3.348 | 170.948 | 67 | ||
| UK | winter non-working | 13.302 | 3.550 | 200.478 | 76 | 78,938.94 |
| winter working | 13.984 | 3.571 | 222.817 | 194 | ||
| summer non-working | 13.575 | 3.527 | 216.129 | 26 | ||
| summer working | 13.798 | 3.525 | 215.756 | 67 |
| Country | Day type | Energy consumption (kWh/Day) | Peak power (kW) | Energy losses (Wh) | Number of typical days | Energy losses/year (Wh) |
|---|---|---|---|---|---|---|
| Italy | winter non-working | 10.847 | 3.131 | 115.062 | 76 | 48,231.74 |
| winter working | 10.604 | 3.127 | 109.082 | 194 | ||
| summer non-working | 13.311 | 3.107 | 169.627 | 26 | ||
| summer working | 15.109 | 3.284 | 204.253 | 67 | ||
| France | winter non-working | 11.971 | 3.323 | 161.598 | 76 | 71,689.49 |
| winter working | 12.730 | 3.312 | 286.749 | 194 | ||
| summer non-working | 14.557 | 3.469 | 227.208 | 26 | ||
| summer working | 15.964 | 3.605 | 252.955 | 67 | ||
| Germany | winter non-working | 12.649 | 3.396 | 167.612 | 76 | 60,574.94 |
| winter working | 12.570 | 3.373 | 165.531 | 194 | ||
| summer non-working | 12.388 | 3.330 | 163.629 | 26 | ||
| summer working | 12.644 | 3.365 | 166.174 | 67 | ||
| UK | winter non-working | 13.735 | 3.503 | 211.508 | 76 | 80,499.82 |
| winter working | 13.822 | 3.618 | 221.341 | 194 | ||
| summer non-working | 13.860 | 3.570 | 223.264 | 26 | ||
| summer working | 14.389 | 3.651 | 227.724 | 67 |
| Country | Day type | Energy consumption (kWh/Day) | Peak power (kW) | Energy losses (Wh) | Number of typical days | Energy losses/year (Wh) |
|---|---|---|---|---|---|---|
| Italy | winter non-working | 8.458 | 2.494 | 69.703 | 76 | 32,423.39 |
| winter working | 8.244 | 2.459 | 67.154 | 194 | ||
| summer non-working | 10.992 | 2.541 | 128.308 | 26 | ||
| summer working | 12.625 | 2.658 | 158.544 | 67 | ||
| France | winter non-working | 11.470 | 3.124 | 154.149 | 76 | 66,424.98 |
| winter working | 12.270 | 3.055 | 172.064 | 194 | ||
| summer non-working | 13.641 | 3.257 | 206.595 | 26 | ||
| summer working | 15.016 | 3.404 | 233.571 | 67 | ||
| Germany | winter non-working | 11.146 | 3.065 | 130.051 | 76 | 48,121.17 |
| winter working | 11.106 | 3.069 | 131.881 | 194 | ||
| summer non-working | 11.094 | 3.001 | 129.437 | 26 | ||
| summer working | 11.270 | 3.112 | 134.726 | 67 | ||
| UK | winter non-working | 12.859 | 3.500 | 196.390 | 76 | 76,062.92 |
| winter working | 13.632 | 3.517 | 214.635 | 194 | ||
| summer non-working | 12.976 | 3.415 | 205.294 | 26 | ||
| summer working | 13.255 | 3.332 | 205.486 | 67 |
It has to be noted, however, that since in this case there are less heavy electrical loads to shift in the house, the DSM actions are relatively ineffective [10].
These results are useful to be inputs for the grid simulator that is needed to evaluate the energy management actions on the entire electric value chain and, so, on the grid, too.
The use of Demand Side Management methodologies, in fact, can slow down the growth rate of the yearly peak load and energy demand; the aim of the analysis is to evaluate the advantages deriving from the application of a set of load-control end-user policies.
The analysis has been performed by considering the preliminary assumption that the entire territory can be divided in areas characterized by a uniform electrical load density (urban with high and low load-density) and is referred to as a square km.
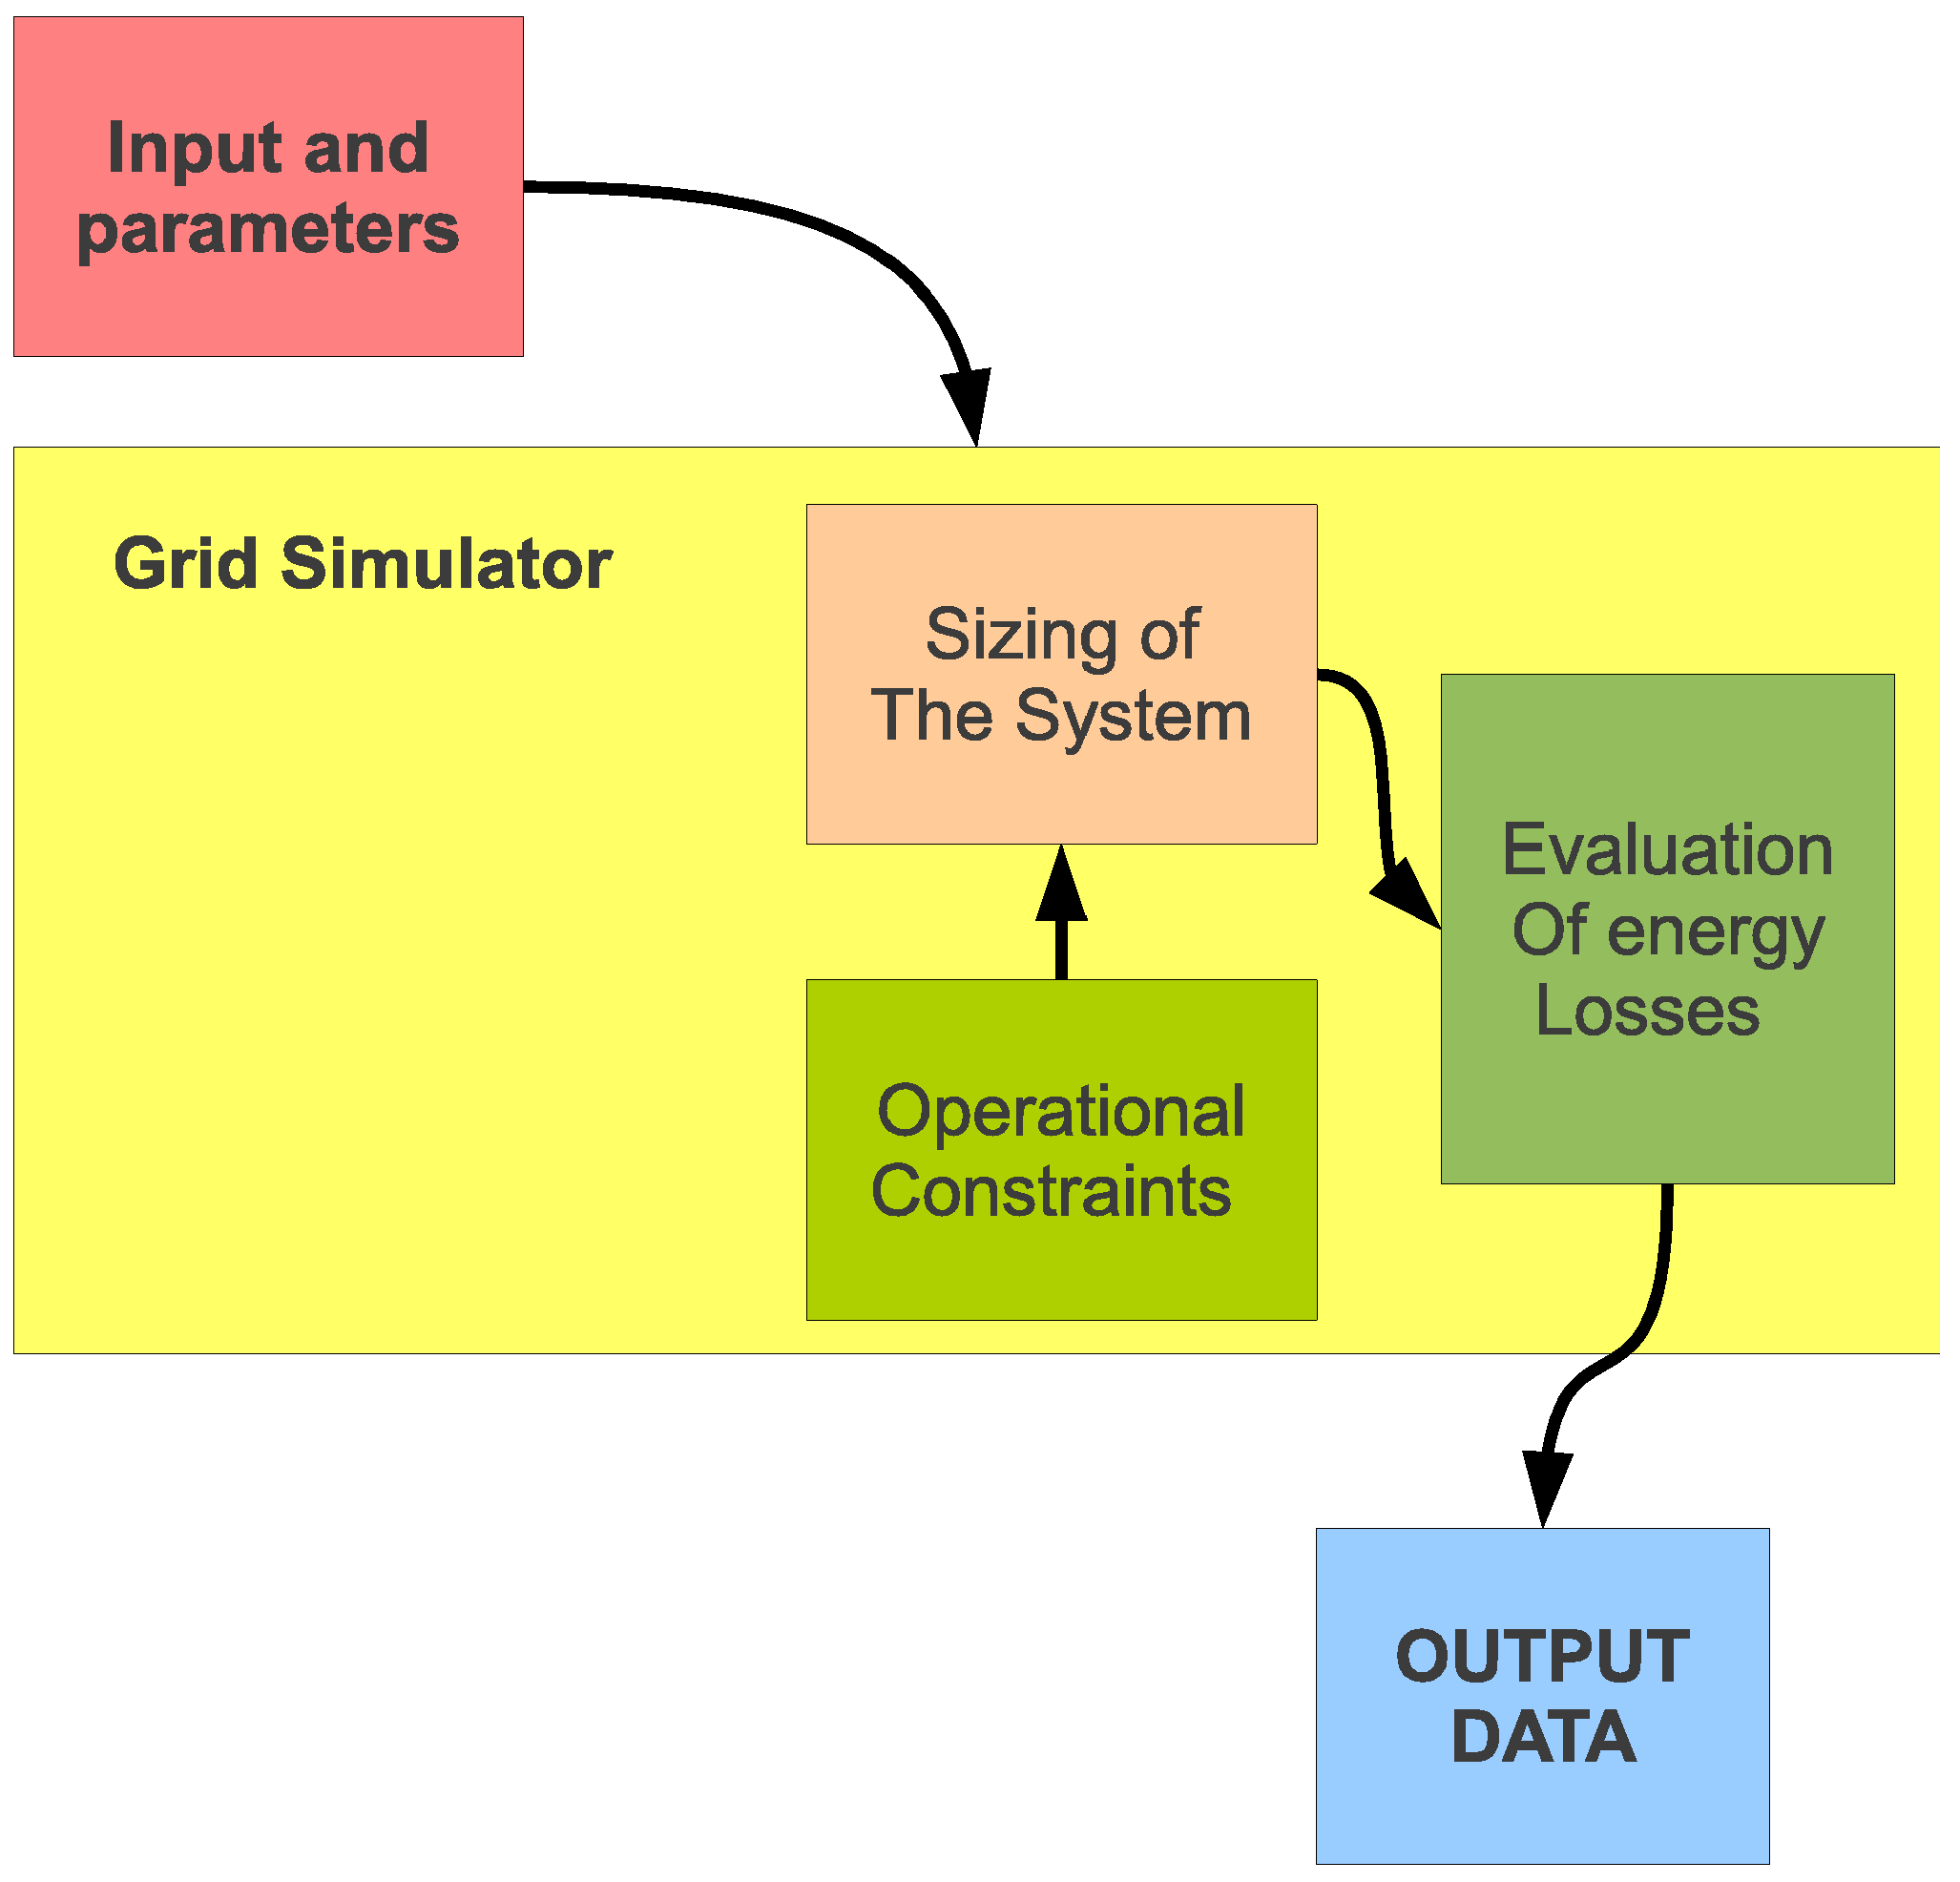
The methodological approach of the modular type, based on the use of functional models and on the modular combination of these models for modeling the distribution system, is shown in Figure 12. In Figure 13, a simplified flow-chart of the grid simulator is presented; it needs four inputs and the choice of some parameters before running. The inputs needed by the simulator are: the most frequent, (peak load); the most frequent yearly energy consumption, ; the equivalent peak load yearly duration, ; and the equivalent maximum losses yearly duration, .
The most frequent house, , is the most frequent peak present in five thousand house load profiles obtained with Montecarlo simulations. The parameters to choose before starting simulations are: structural model for medium voltage (MV) grid; structural model for low voltage (LV) grid; average power factor for MV (0.987); average power factor for LV (0.985); load contemporary factor for feeders (1 for LV, 0.62 for MV); load contemporary factor for transformers (0.76 for LV, 0.72 for MV); distance factor (1.4); and transmission factor (1.3).
Figure 12.
Modular approach to study the distribution system.

Figure 13.
General layout of the grid simulator.
After the sizing of the systems, the evaluation of yearly losses has been calculated in HV/MV and MV/LV transformers and in MV and LV cables. In Table 6, the results are reported. Scenario 0 is the base scenario, and all the results (in percent) obtained are compared to it. The reduction of losses is due to a combination of two factors: variation of peak load and variation of equivalent maximum losses yearly duration, . Usually, the peak load decreases and increases, but the result is a decrease of total losses.
| Country | Scenarios | Losses TR HV/MV | Losses cables MV | Losses TR MV/LV | Losses cables LV | Total losses MV | Total losses LV | Total losses | (1) |
|---|---|---|---|---|---|---|---|---|---|
| Italy | Scenario 0 | 19,048.12 | 45,176.04 | 208,772.2 | 226,662.8 | 64,224 | 435,435 | 499,659 | |
| Scenario 1 | 17,510.22 | 28,319.2 | 196,560 | 203,840 | 45,829 | 400,400 | 446,229 | 10.7% | |
| Scenario 2 | 17,588.48 | 30,177.42 | 189,280 | 189,153 | 47,766 | 378,433 | 426,199 | 14.7% | |
| Scenario 3 | 14,125.02 | 23,690.94 | 185,458 | 187,187 | 37,816 | 372,645 | 410,461 | 17.9% | |
| France | Scenario 0 | 24,349.78 | 44,271.5 | 291,564 | 316,534 | 68,621 | 608,098 | 676,720 | |
| Scenario 1 | 22,524.32 | 50,317.54 | 273,109.2 | 266,102 | 72,842 | 539,211 | 612,053 | 9.6% | |
| Scenario 2 | 21,863.66 | 47,600.28 | 280,826 | 296,660 | 69,464 | 577,486 | 646,950 | 4.4% | |
| Scenario 3 | 23,667.28 | 70,757.96 | 247,520 | 248,976 | 94,425 | 496,496 | 590,921 | 12.7% | |
| Germany | Scenario 0 | 2,575.3 | 20,800.78 | 33,169.5 | 41,647 | 23,376 | 74,817 | 98,193 | |
| Scenario 1 | 2,906.54 | 10,992.8 | 34,913.06 | 44,455 | 13,899 | 79,368 | 93,268 | 5.0% | |
| Scenario 2 | 2,653.56 | 15,098.72 | 33,449.78 | 42,071 | 17,752 | 75,521 | 93,273 | 5.0% | |
| Scenario 3 | 2,628.08 | 22,815.52 | 27,727.7 | 30,986 | 25,444 | 58,713 | 84,157 | 14.3% | |
| UK | Scenario 0 | 4,602.78 | 20,578.74 | 52,612.56 | 63,988 | 25,182 | 116,600 | 141,782 | |
| Scenario 1 | 4,180.54 | 20,809.88 | 44,400.72 | 54,973 | 24,990 | 99,374 | 124,364 | 12.3% | |
| Scenario 2 | 3,670.94 | 8,548.54 | 44,546.32 | 56,668 | 12,219 | 101,214 | 113,433 | 20.0% | |
| Scenario 3 | 3,443.44 | 9,150.96 | 41,306.72 | 50,545 | 12,594 | 91,852 | 104,446 | 26.3% |
| Country | Scenario | Peak load (kW) | (h) |
|---|---|---|---|
| Italy | Scenario 0 | 3.62 | 508 |
| Scenario 1 | 3.01 | 601 | |
| Scenario 2 | 3.28 | 541 | |
| Scenario 3 | 2.65 | 692 | |
| France | Scenario 0 | 3.68 | 715 |
| Scenario 1 | 3.35 | 742 | |
| Scenario 2 | 3.60 | 728 | |
| Scenario 3 | 3.40 | 830 | |
| Germany | Scenario 0 | 3.62 | 513 |
| Scenario 1 | 3.34 | 584 | |
| Scenario 2 | 3.37 | 561 | |
| Scenario 3 | 3.11 | 533 | |
| UK | Scenario 0 | 3.74 | 655 |
| Scenario 1 | 3.57 | 689 | |
| Scenario 2 | 3.65 | 691 | |
| Scenario 3 | 3.51 | 773 |
For example, in Italy, Scenario 1 has a reduction of peak load from 3.62 kW to 3.01 kW (i.e., −17%). with an increase of from 508 h to 601 h (+25%); the total yearly energy losses are reduced from 499.659 to 446.229 (−10.7%). That is possible because the losses are a quadratic function of peak load. All the peak load and for each country and each scenario are reported in Table 7.
3. Evaluation of Ecological Benefits
In this section, the ecological advantages due to application of energy management control actions at home have been evaluated. Different countries and their local power production capacity have been observed. An analysis has been enforced in order to satisfy ecological societal goals. The considered countries are: Italy, the United Kingdom, Germany and France. Each country has its own electrical generating system, which affects the production of carbon dioxide (CO) and other unwanted emissions. The generation of electric power can change year by year; consequently, so do the emissions. The purpose of this section is to find a global carbon dioxide coefficient for each country and, subsequently, to address the correct modification of it, by following the variation of the employed power plants [11,12]. Each type of power plant has an own carbon dioxide coefficient. This coefficient considers energy lifecycle emissions, including emissions associated with the construction of the plant, mining and processing of the fuel, routine operation of the plant, the disposal of used fuel and other waste by-products and, finally, the disposal of the plant. The global emission coefficient here determined is shown in Table 8.
By considering these coefficients and the results of the house and grid simulators, the global (grid + houses) savings and CO emissions reduction can be achieved, and the results are shown in Table 8 and Table 9.
| Countries | Italy | UK | Germany | France |
|---|---|---|---|---|
| CO emissions [g CO] | 465 | 492 | 475 | 89 |
Table 9.
Global (grid + houses) savings in the grid and global reduction of carbon dioxide emissions.
| Country | Scenario | Total savings grid (+ 82%) [kWh/( yr)] | Number of eq | Total savings grid (+ 82%) (kWh/yr) | Savings in CO emissions (103 tons) for the grid | Total savings for house (kWh/yr) |
|---|---|---|---|---|---|---|
| Italy | Scenario 1 | 53,430 | 1,733 | 92,594 | 43.06 | 35,847 |
| Scenario 2 | 73,461 | 1,733 | 127,307 | 59.20 | 28,841 | |
| Scenario 3 | 89,198 | 1,733 | 154,580 | 71.88 | 5,516,361 | |
| UK | Scenario 1 | 17,417 | 12,000 | 209,009 | 102.83 | 42,600 |
| Scenario 2 | 28,348 | 12,000 | 340,180 | 167.37 | 19,187 | |
| Scenario 3 | 37,335 | 12,000 | 448,026 | 220.43 | 5,935,555 | |
| Germany | Scenario 1 | 4,925 | 20,365 | 100,296 | 47.64 | 55,077 |
| Scenario 2 | 4,919 | 20,365 | 100,185 | 47.59 | 80,799 | |
| Scenario 3 | 14,036 | 20,365 | 285,840 | 135.77 | 16,514,671 | |
| France | Scenario 1 | 64,666 | 2,126 | 137,481 | 12.24 | 108,269 |
| Scenario 2 | 29,770 | 2,126 | 63,290 | 5.63 | 2,598 | |
| Scenario 3 | 85,798 | 2,126 | 182,407 | 16.23 | 7,939,982 |
4. Cost-Benefit Analysis
As shown in the previous sections of this paper, the impacts related to the introduction of the DSM and DoS actions are various; they can be summarized as follows:
- Savings on electric energy consumption at the house level;
- Reduction of the electric energy losses at the grid level;
- Environmental impact, due to the reduction of the electric energy demand, which can be quantified with the reduction of the CO emissions, as well as with the reduction of the local impact on air pollution, public health and ecosystem (emissions of particles, SO, NO, CO, etc.).
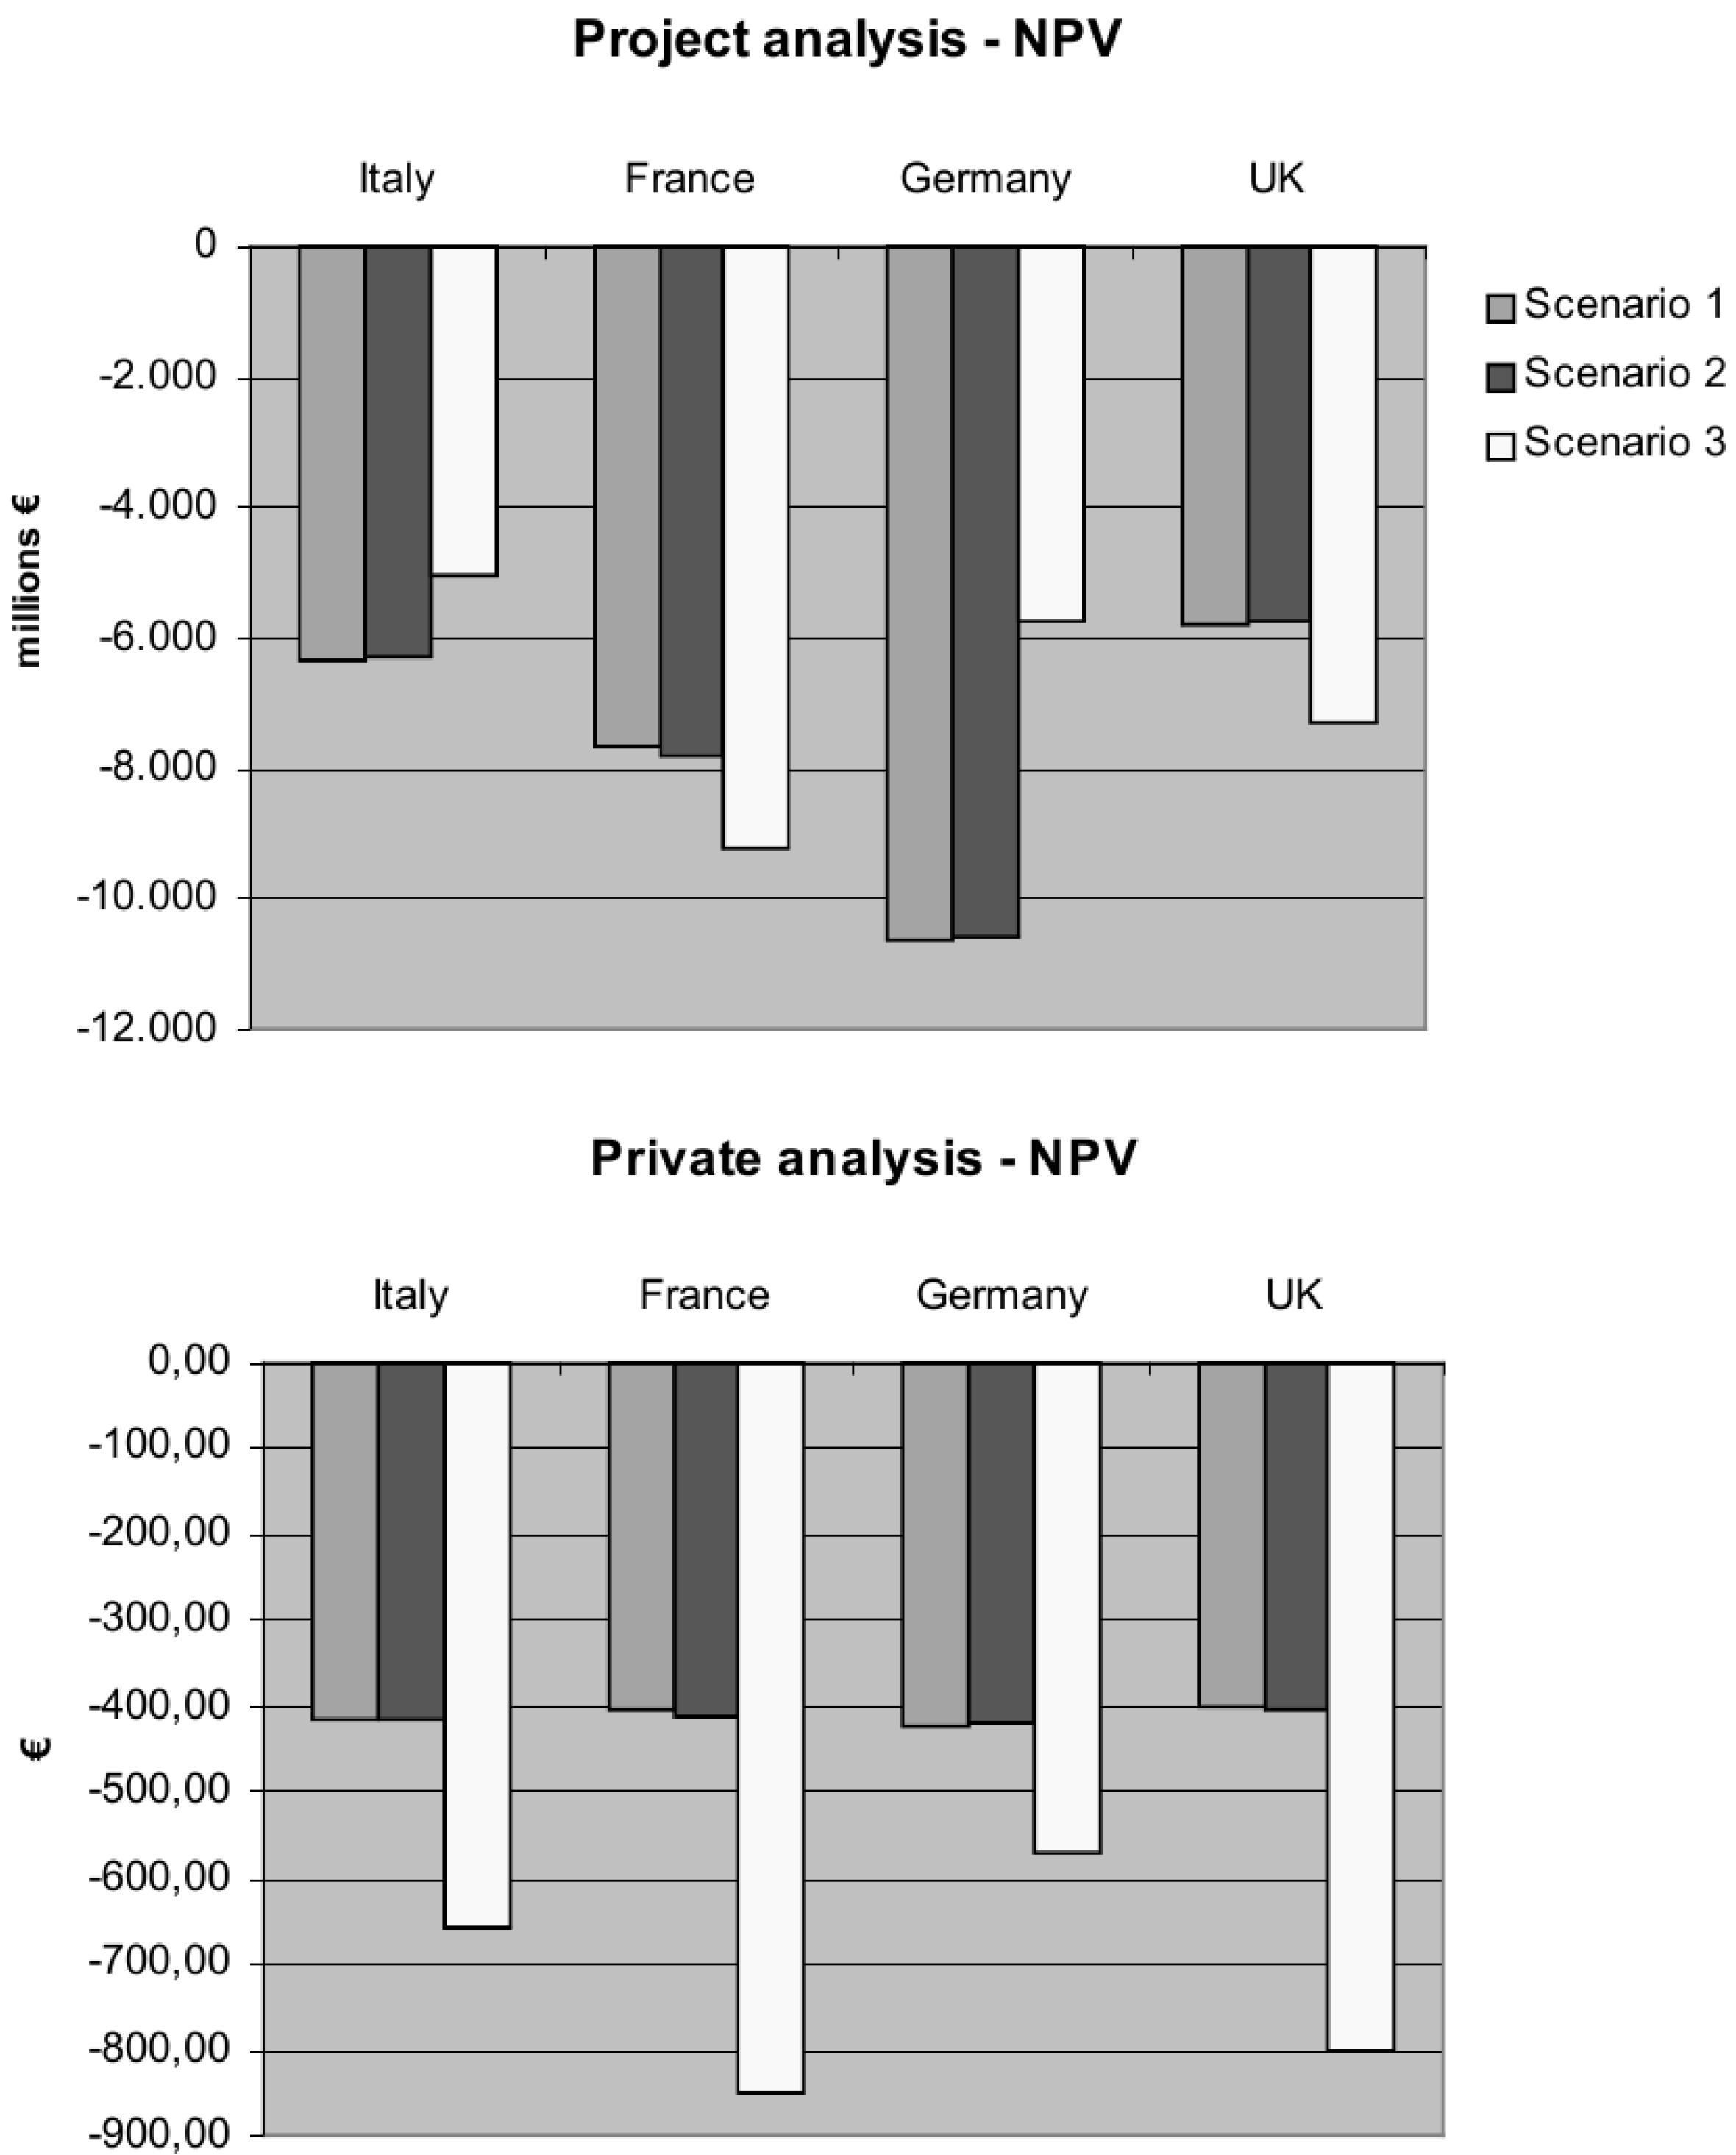
The object of the cost-benefit analysis (CBA) is the economic evaluation of the aforesaid impacts on both the singular households and the community, in comparison with the costs related to the introduction of the DSM and DoS actions [2]. According to this, for each scenario (Scenarios 1, 2 and 3, previously described) and for each country (Italy, France, Germany and the UK), the analysis has been divided into two parts:
- A financial analysis at the house level (private analysis), which takes into account only the costs and benefits for the singular household;
- A socio-economic analysis for the community, at the country level (project analysis), which takes into account all the costs and benefits related to the introduction of the DSM and DoS actions; these costs and benefits involve not only the households, but also the electricity chain (from the production to the distribution) and the environment.
The results of the cost-benefit analysis are reported in Figure 14.
Figure 14.
Cost-benefit analysis (CBA) results.

5. Energy Management with Renewable Energy Application
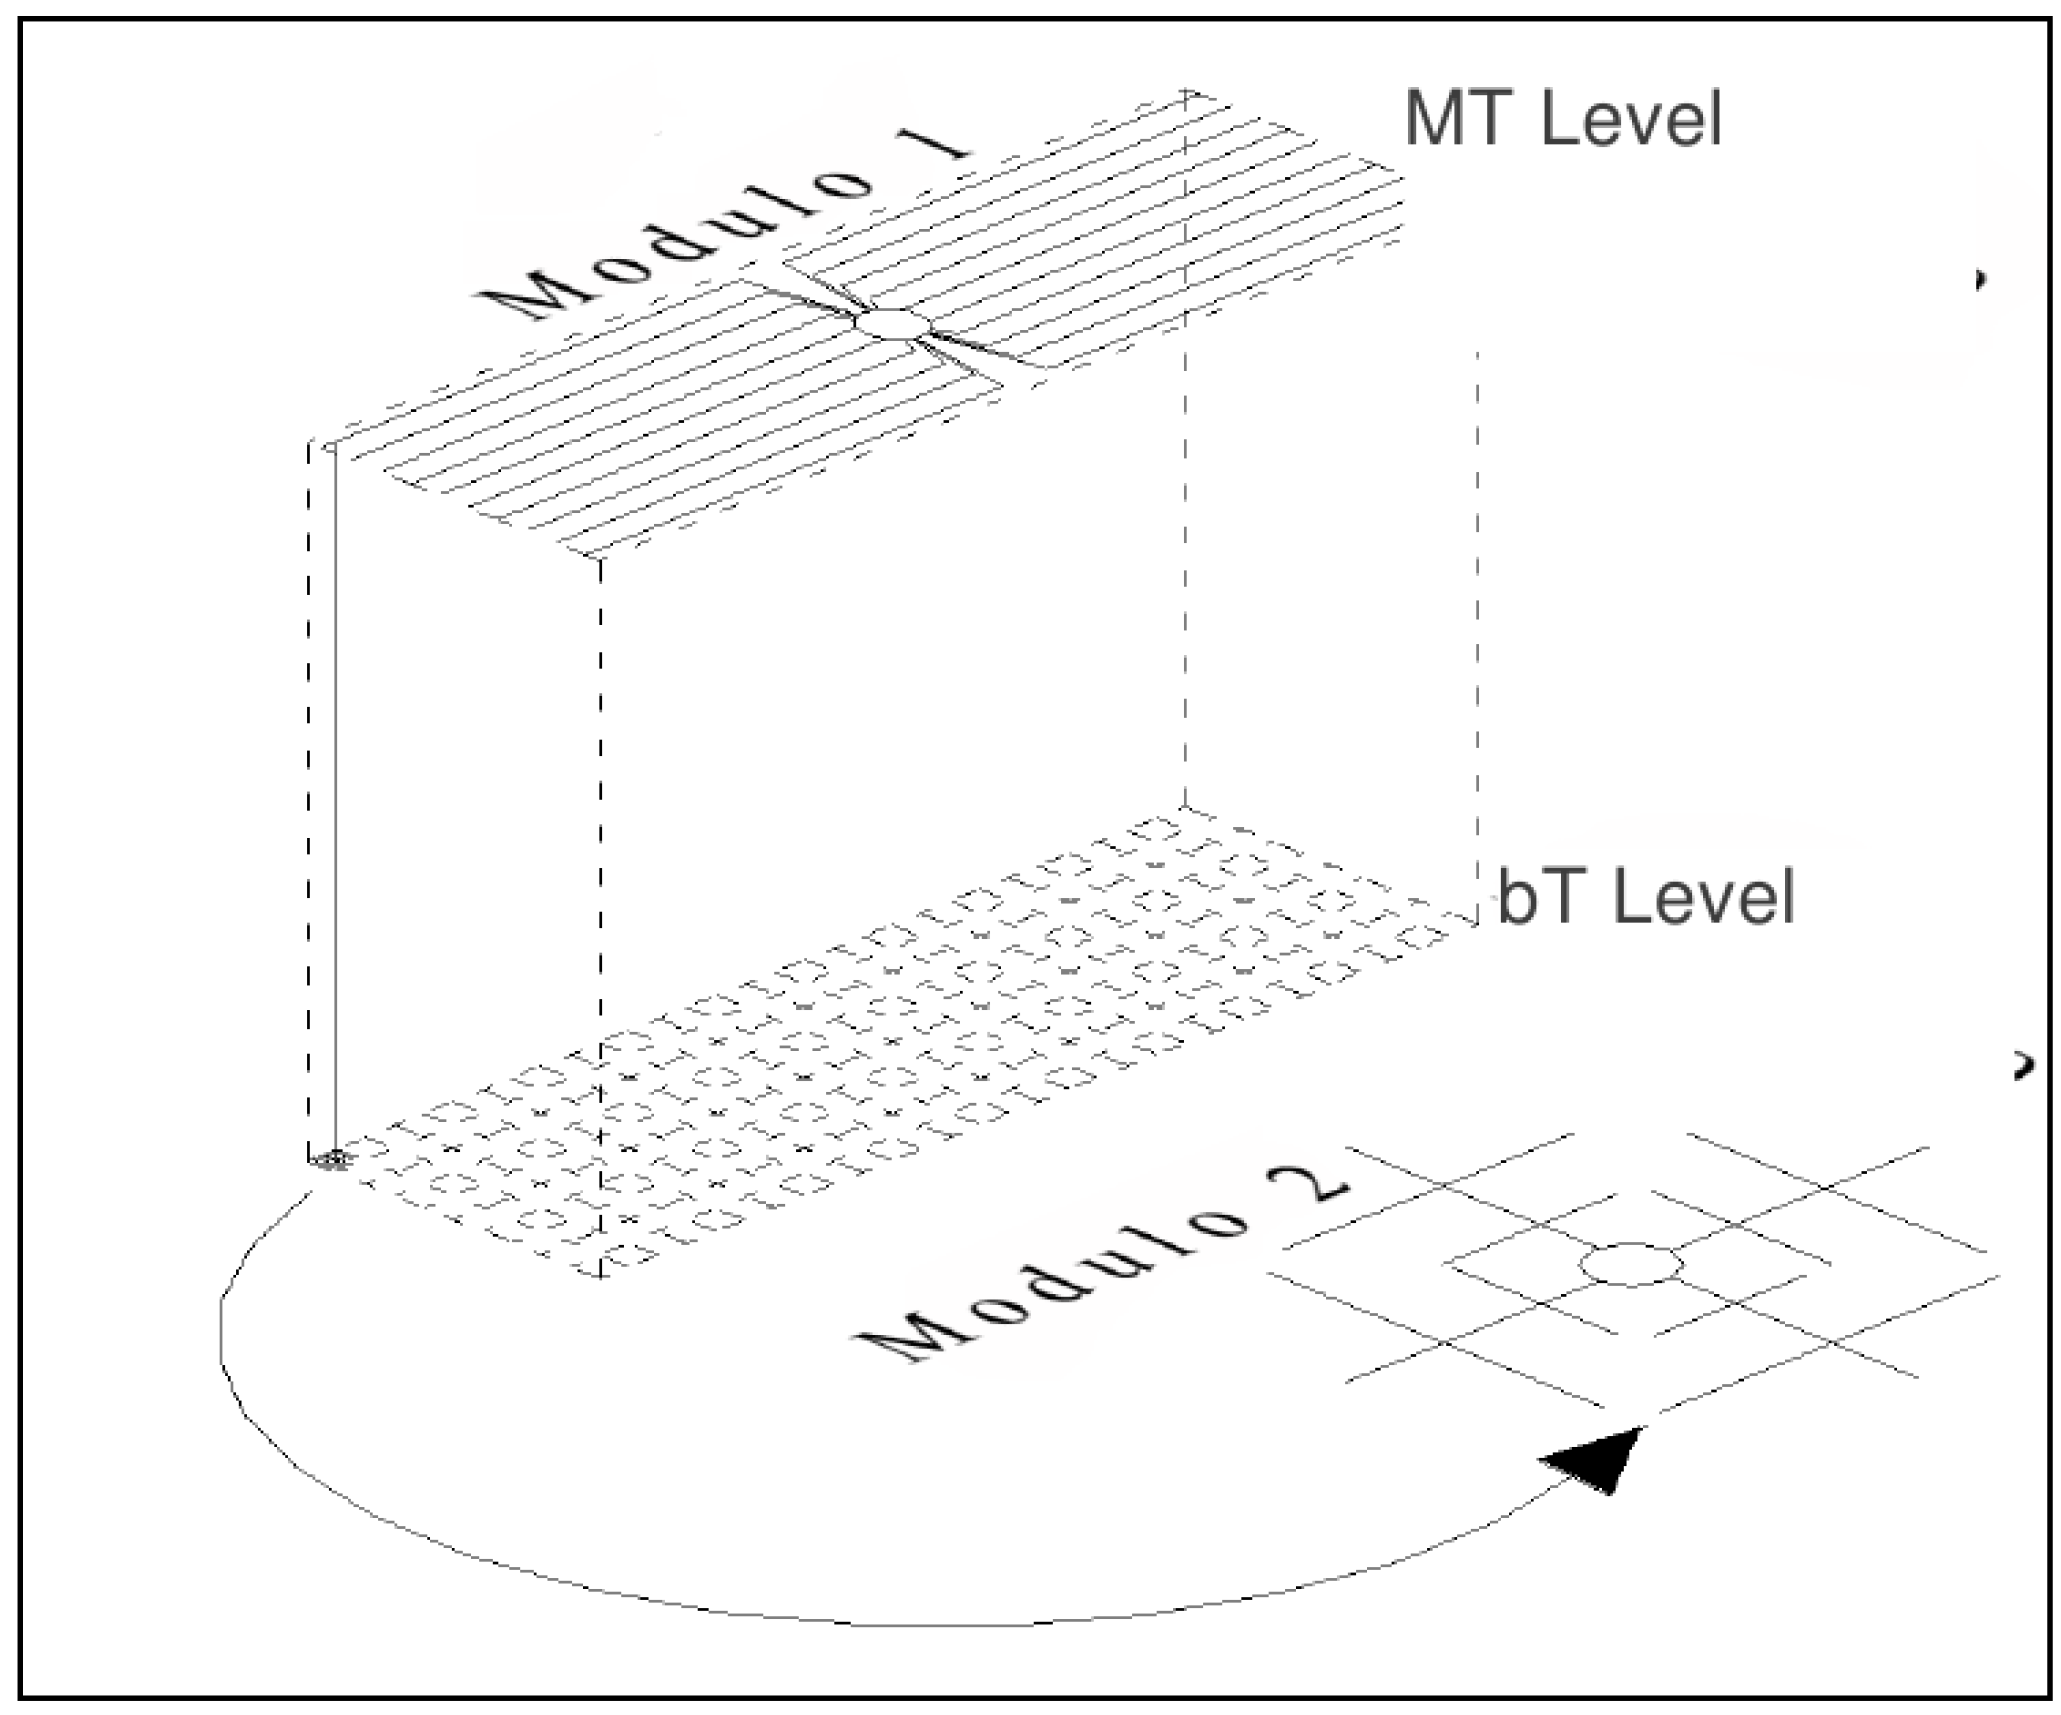
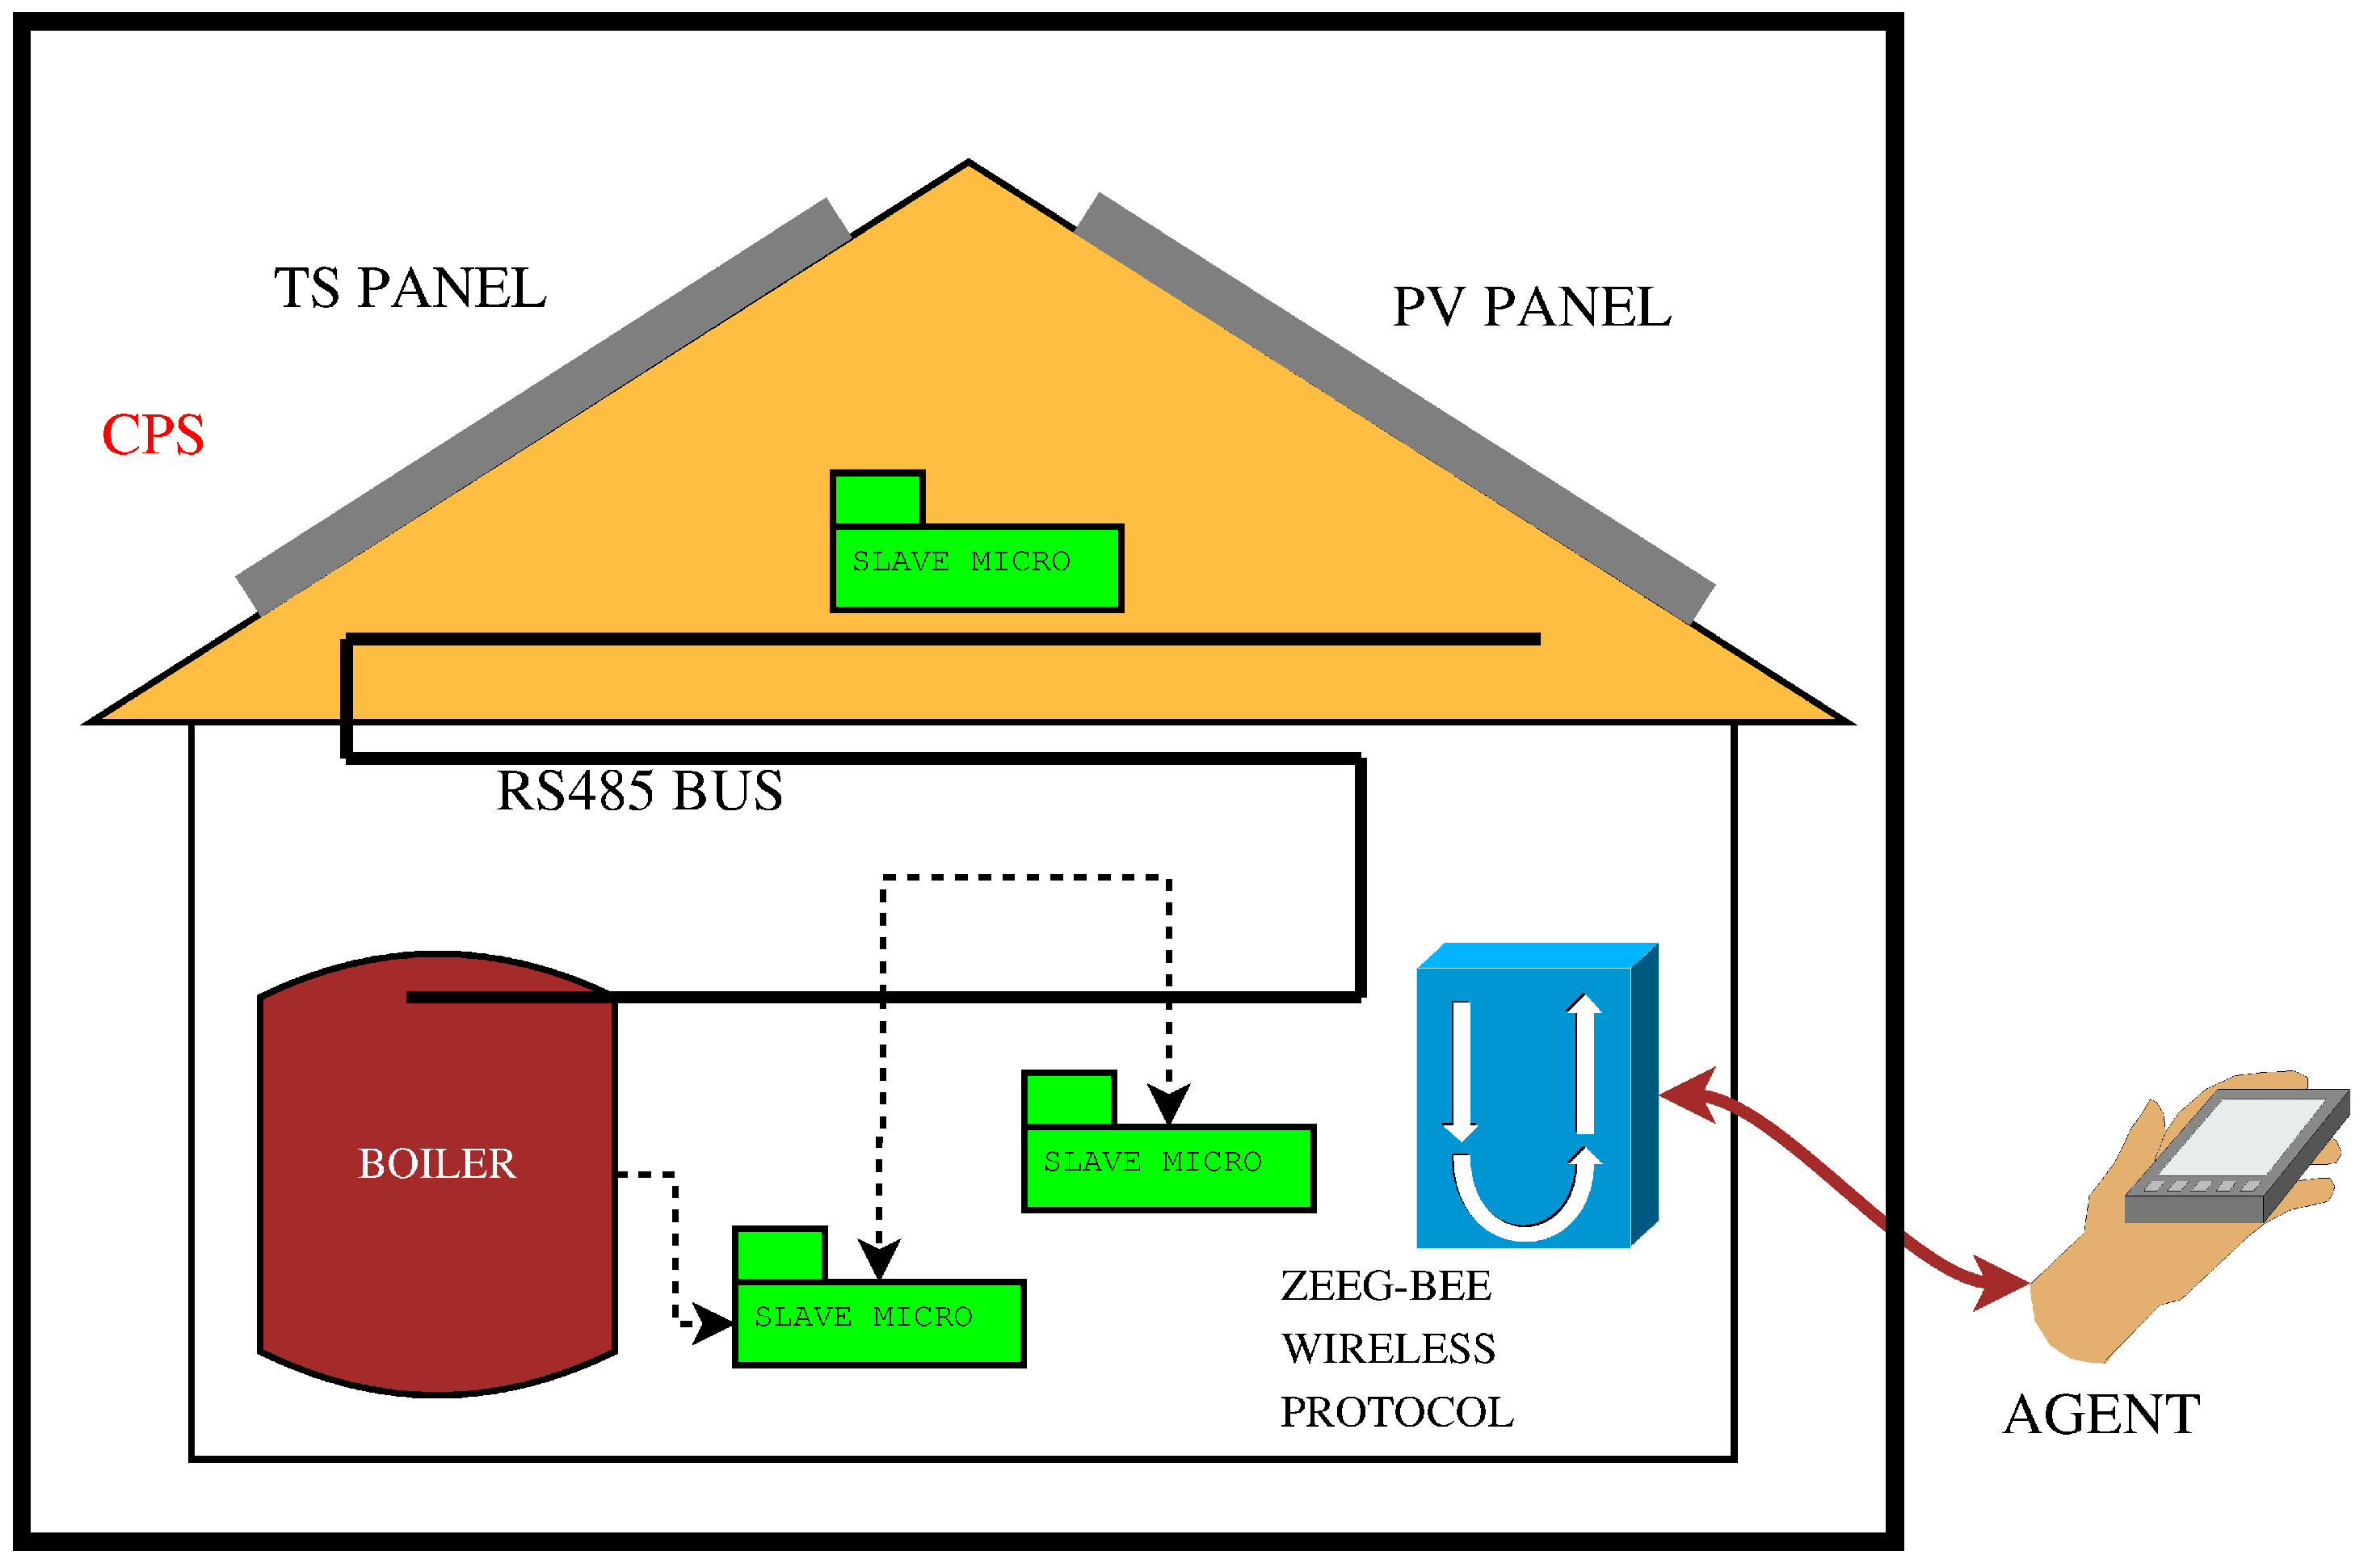
In the ambit of an European research program, the Sdeslab Laboratory of the University of Palermo, has conceived, designed and implemented a complete energy management system of a connected house in which the renewable energy from a photovoltaic system and a solar thermal system coupled by means of an ICT tool in a combined PV and ST system (CPS) is used for the DoS actions.
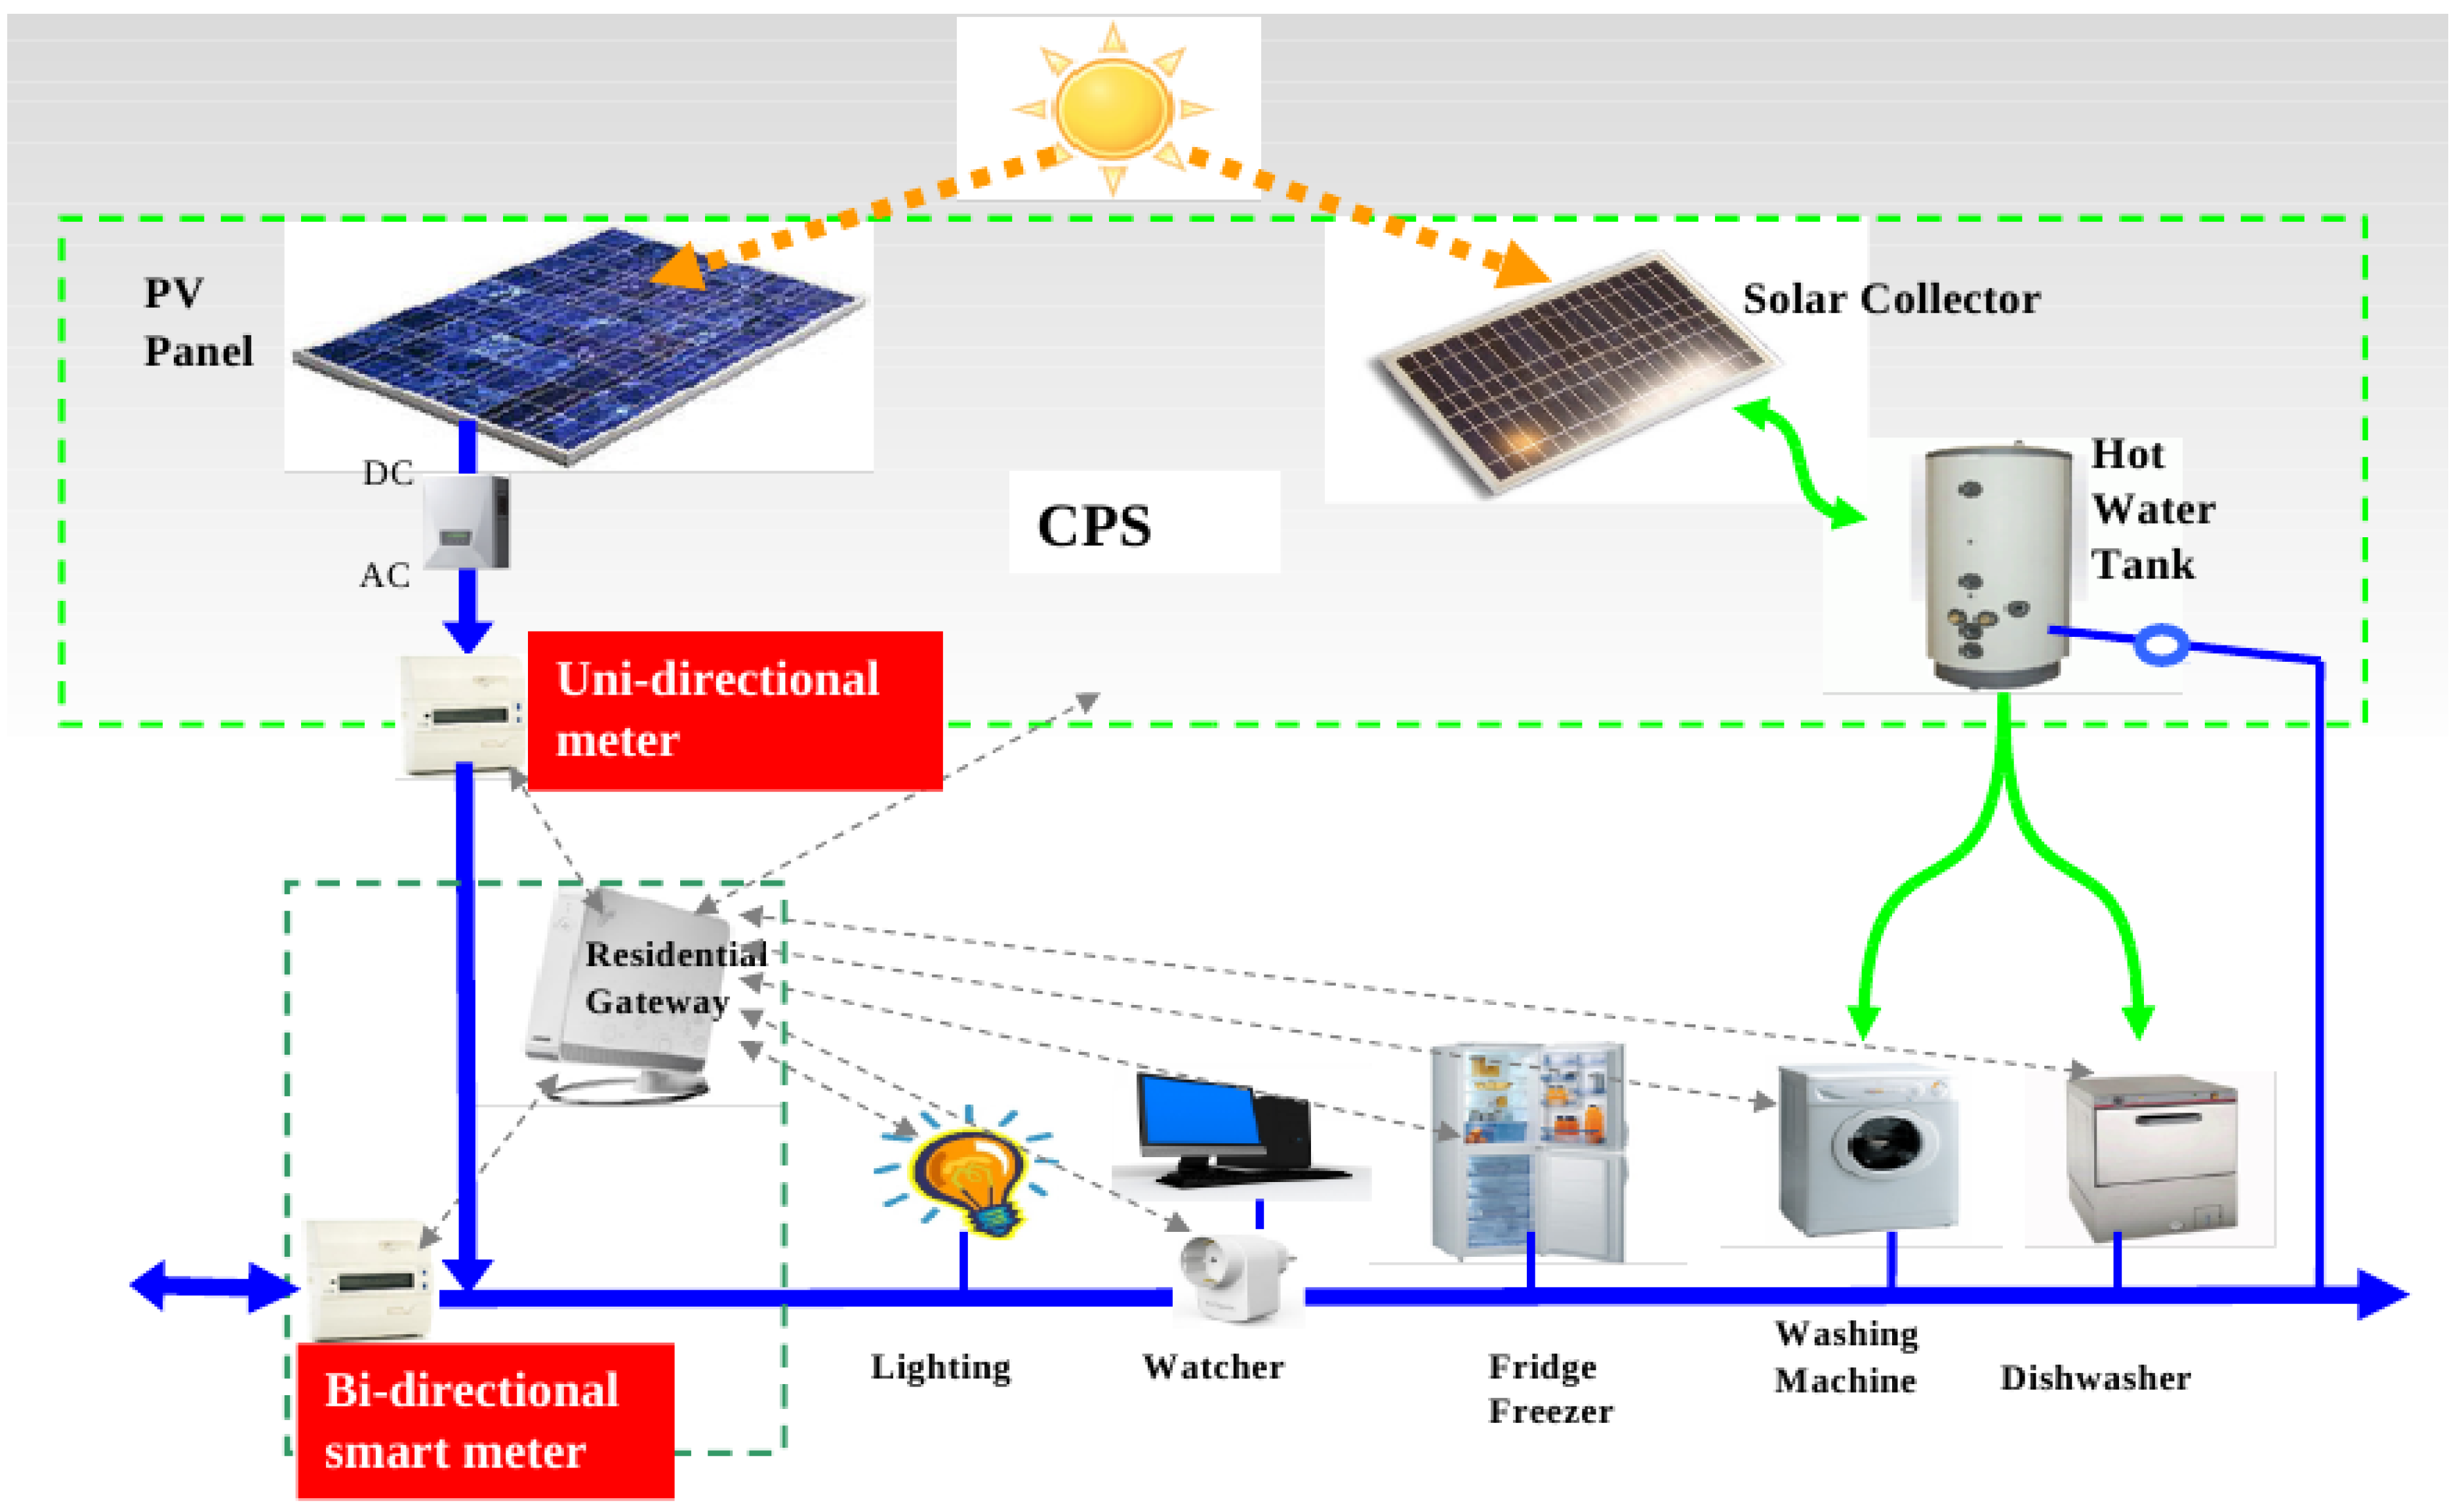
In Figure 15, the CPS architecture is reported, and in Figure 16, the CPS monitoring and control system in a schematic picture is presented.
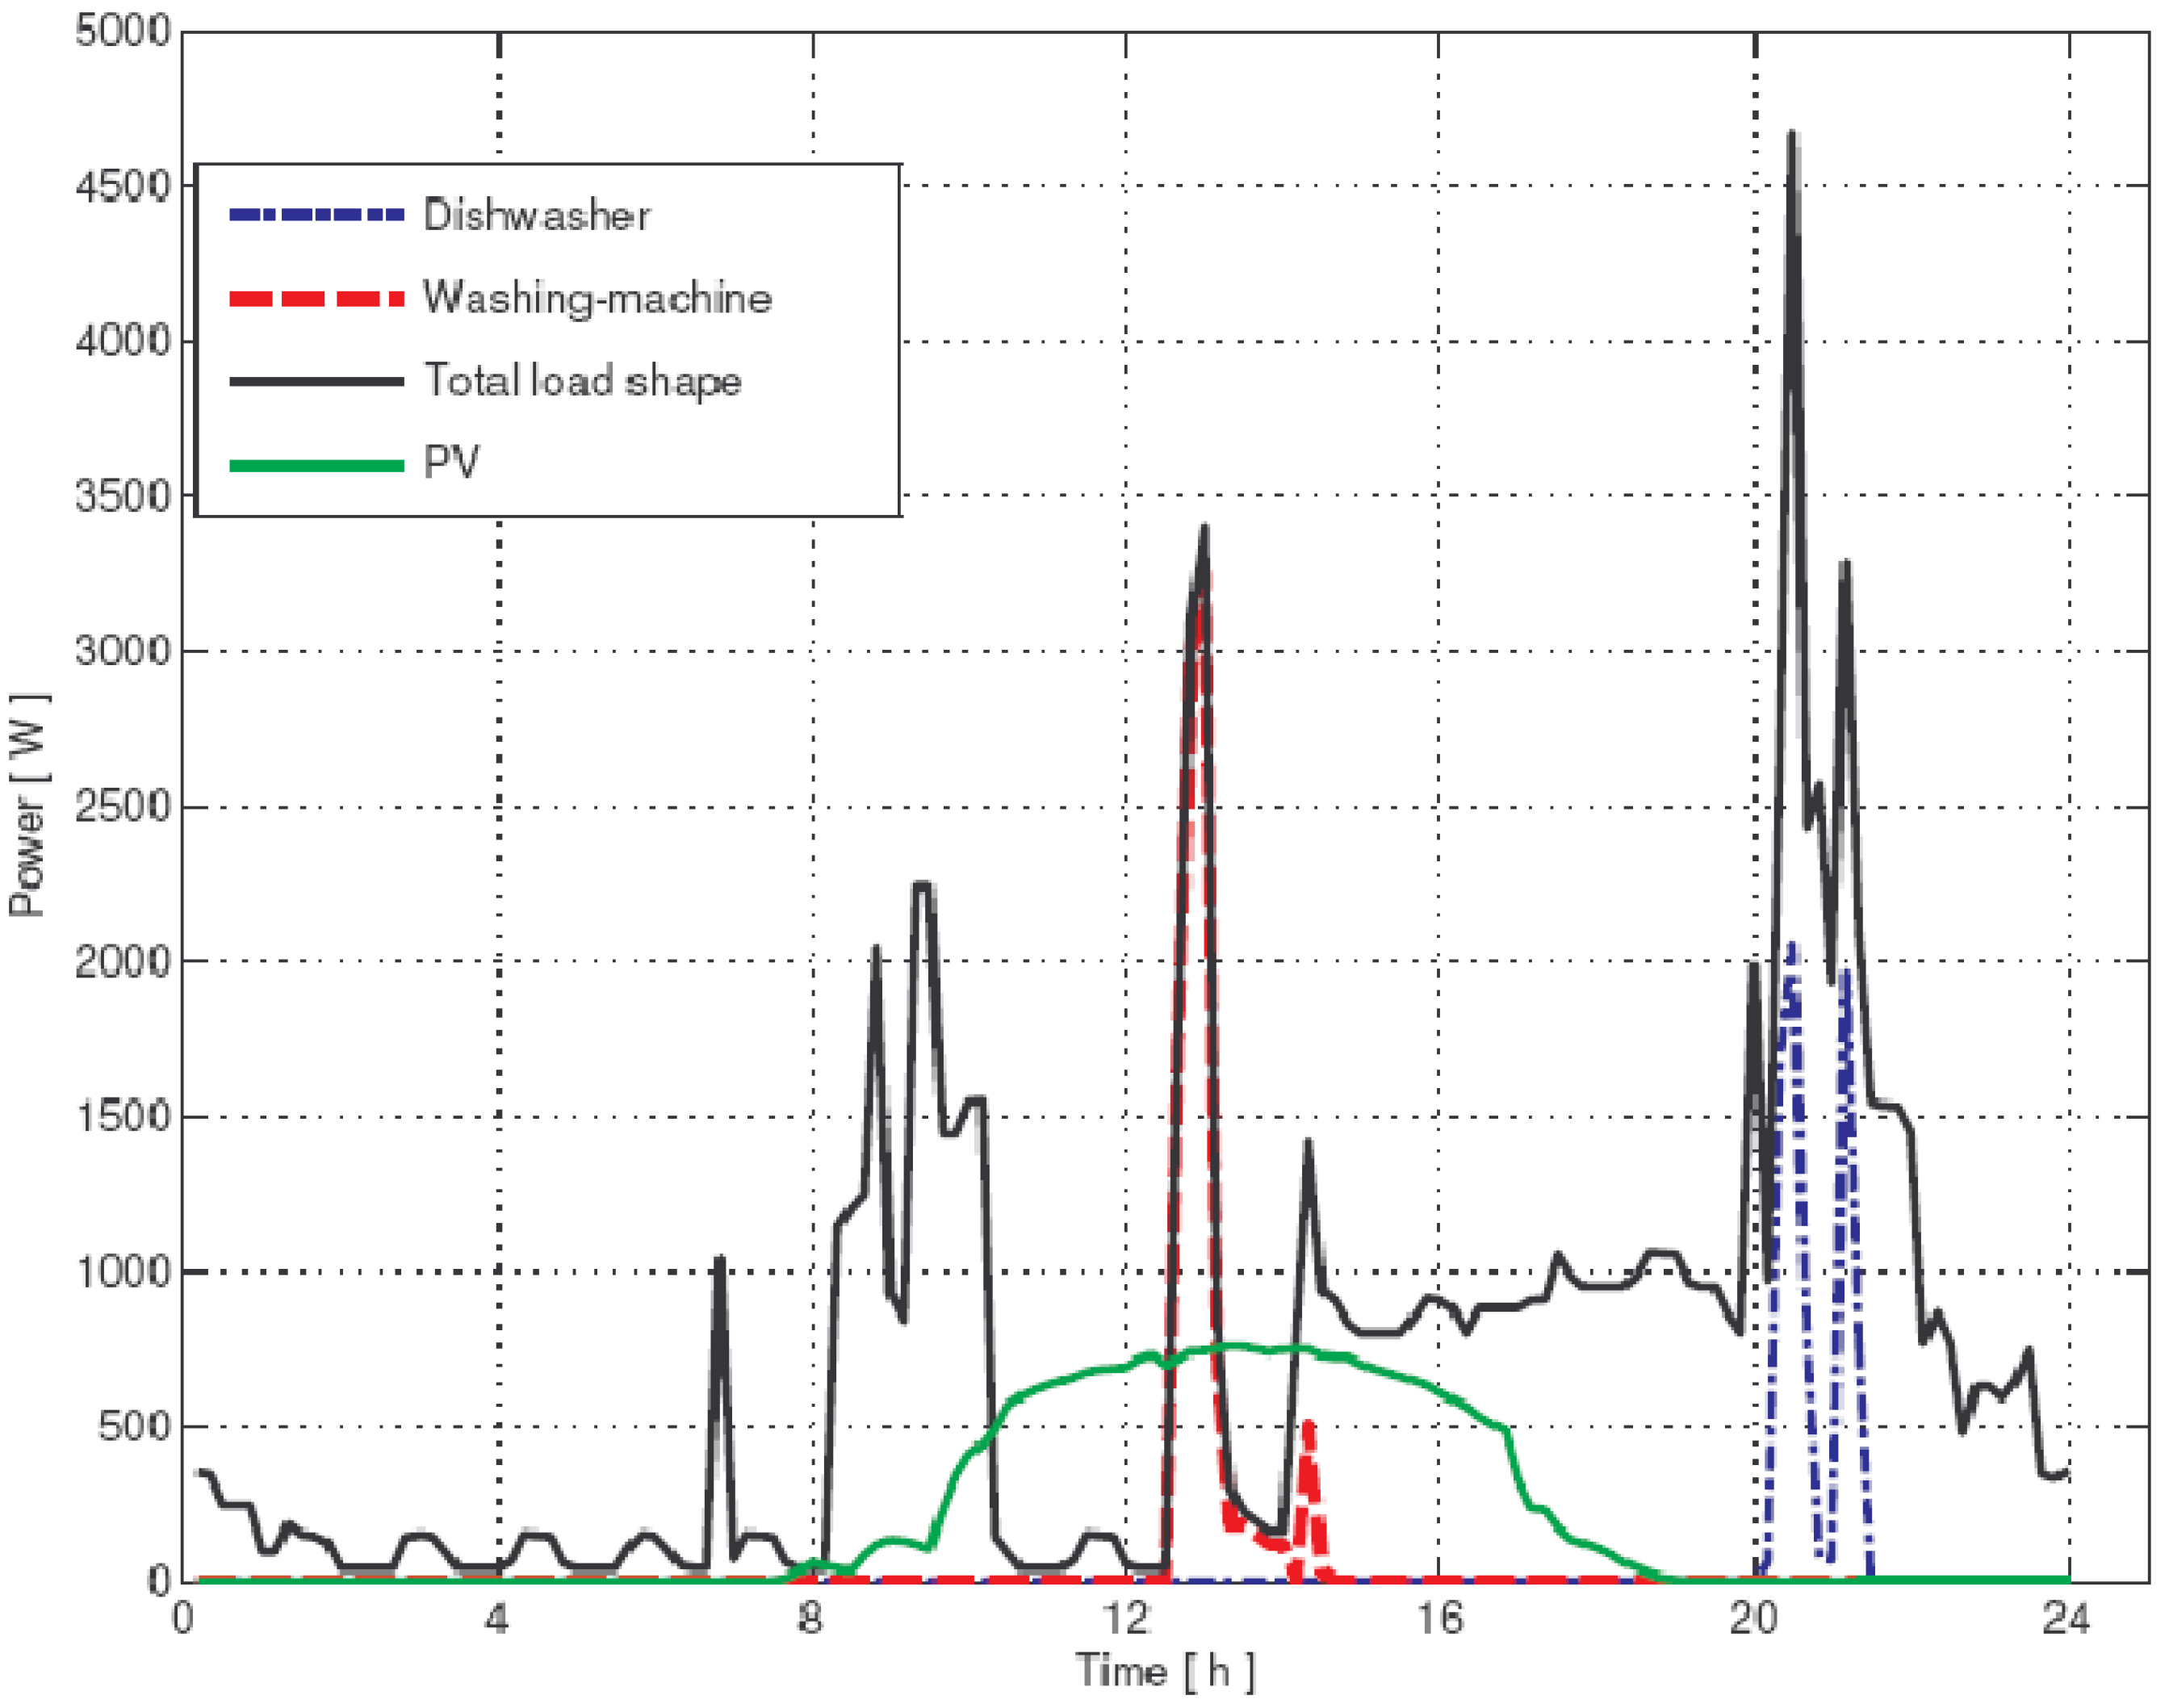
In Figure 17 are presented the results and the energy savings by means of the management system. By considering that the energy consumed in the washing machine is—WM energy = 1.6 kWh— and in the dish washer is—DW energy = 1.2 kWh—and that in the apartment, the total absorbed energy is = 17.2 kWh, it is possible to deduce that the apartment absorbed energy without DW and WM is equal to 14.2 kWh. By the tests, the PV produced electrical energy equal to 5.1 kWh is measured and the balance between PV produced electrical energy and apartment absorbed energy without DW and WM is equal to 9.1 kWh.
It is possible to conclude that with the help of the energy management system here proposed, the energy savings can reach 47% of the total energy consumed in the apartment.
Figure 15.
CPS architecture.

Figure 16.
CPS monitoring and control system.

Figure 17.
Test results.

6. Smart Grid
Actually, the electrical distribution systems, overall medium voltage (MV) ones, and their design and operation criteria are subjected to deep changes, due to different factors. Among these, the main ones concern: the energy market liberalization, the new and complex energy governance policies, the environmental pollution reduction and sustainable development, the renewable development, the increase of energy efficiency, the costs reduction and the growth of the penetration of the so-called distributed generation (DG) [5,13].
In particular, the forthcoming presence of DG in electrical distribution systems has strongly modified the nature of such systems; these systems, in fact, having today a radial topology and managed in a passive way (supplying energy from electrical power plants to end users), are destined to reach an active role by means of the implementation of the typical functions of load management, demand side management, demand response and generation curtailment. However, the DG penetration determines some technical problems in electrical systems that must be faced and solved rapidly to enjoy the potential benefits of DG and to really start the revision process aiming at the implementation of the so-called smart grids. The smart electrical distribution grids represent the needed evolution of the actual networks by means of a deeper implementation of automation functions, with high a level of information and communication technology (ICT) applications in order to increase the power quality and ancillary services guaranteeing the security and economic/energetic efficiency in electric energy supplying.
The distributed generation can introduce some potential benefits in electrical distribution systems, such as:
- Flexibility and electrical load management;
- Coverage of the local load peaks;
- Diversification of the energy resources supply;
- The larger possibility of exploitation of renewable energy resources in favorable locations;
- Time deferral of investments, aimed at the adaptation of transmission and distribution systems, at building new power plants and at the reinforcement of existing power plants and electrical systems;
- Electrical energy loss reduction.
However, the DG presence causes some technical problems that must be rapidly faced and solved, like:
- Increase of short circuit currents;
- Increased complexity of automation and protection systems;
- Increased complexity of voltage regulation, due to a modification of power flows;
- Unwanted possible MV system islanding.
The classical scenario of electrical distribution systems, being the passive termination of the whole electrical system, is characterized by: radial topology; vertically integration with centralized generation, dispatch and control; unidirectional power flows; logical “connect and forget” for the loads; multi-directional power flows in the presence of DG, which is bared, due to the problems mentioned above [3].
The future scenario foresees an active system that guarantees connectivity through an increasing level of interaction with consumers and that will meet the energy needs of the users in terms of flexibility, economy and reliability, making use, at the same time, of the benefits of energy market liberalization. So, it will be characterized by:
- Interconnected and meshed topology;
- Distributed logic;
- Full DG integration;
- Multi-directional power flows;
- The logic of integration of the loads taking on large flexibility.
The major features concern: larger reliability through the implementation of all the most advanced distribution automation functions (for example, integrated volt/VAR control, outage management, reconfiguration); the possibility to integrate the consumers and their behavior within the design and management of the network through the Demand Side Management (DSM); the adoption of advanced communication technologies and automated controls; emergency and market demand response; the self-healing-possibility to detect, analyze and solve problems; the use of different technologies for energy generation and storage; the full usage of the opportunities offered by the electrical market [13].
To realize these goals, it is necessary to apply in electrical distribution systems an advanced distribution automation and, specifically, SCADA (supervisory, control and data acquisition) systems, developing and implementing: a monitoring of the electrical systems through sensors; a data transmission system (optical fibbers, PLC, GSM, WI-FI, etc.); a decision system; and a network automation and remote control [8].
In this way, it will be possible to realize the new electrical smart distribution grids. A smart grid is, in fact, an electrical system able to smartly integrate activities of all connected user-energy producers, consumers, pro-sumers—with the aim of distributing energy in an efficient, sustainable, reliable and economical favorable way.
The most important goal of the smart grids is to transform the functionality of the present electricity transmission and distribution grids, so to provide a more user-oriented service, enabling the achievement of the 20/20/20 targets and guaranteeing, in a competitive market environment, the high security, power quality and economic efficiency of electricity supplying. However, how and in which way will the transition from actual scenario to the new one proceed? It is hard to answer this question. At this moment, it is possible to imagine for the new grids three different models, that would be, also, considered as an integrated part of a smart grid or as an intermediate phase: active grids, micro-grids and virtual utility.
6.1. Active Grids
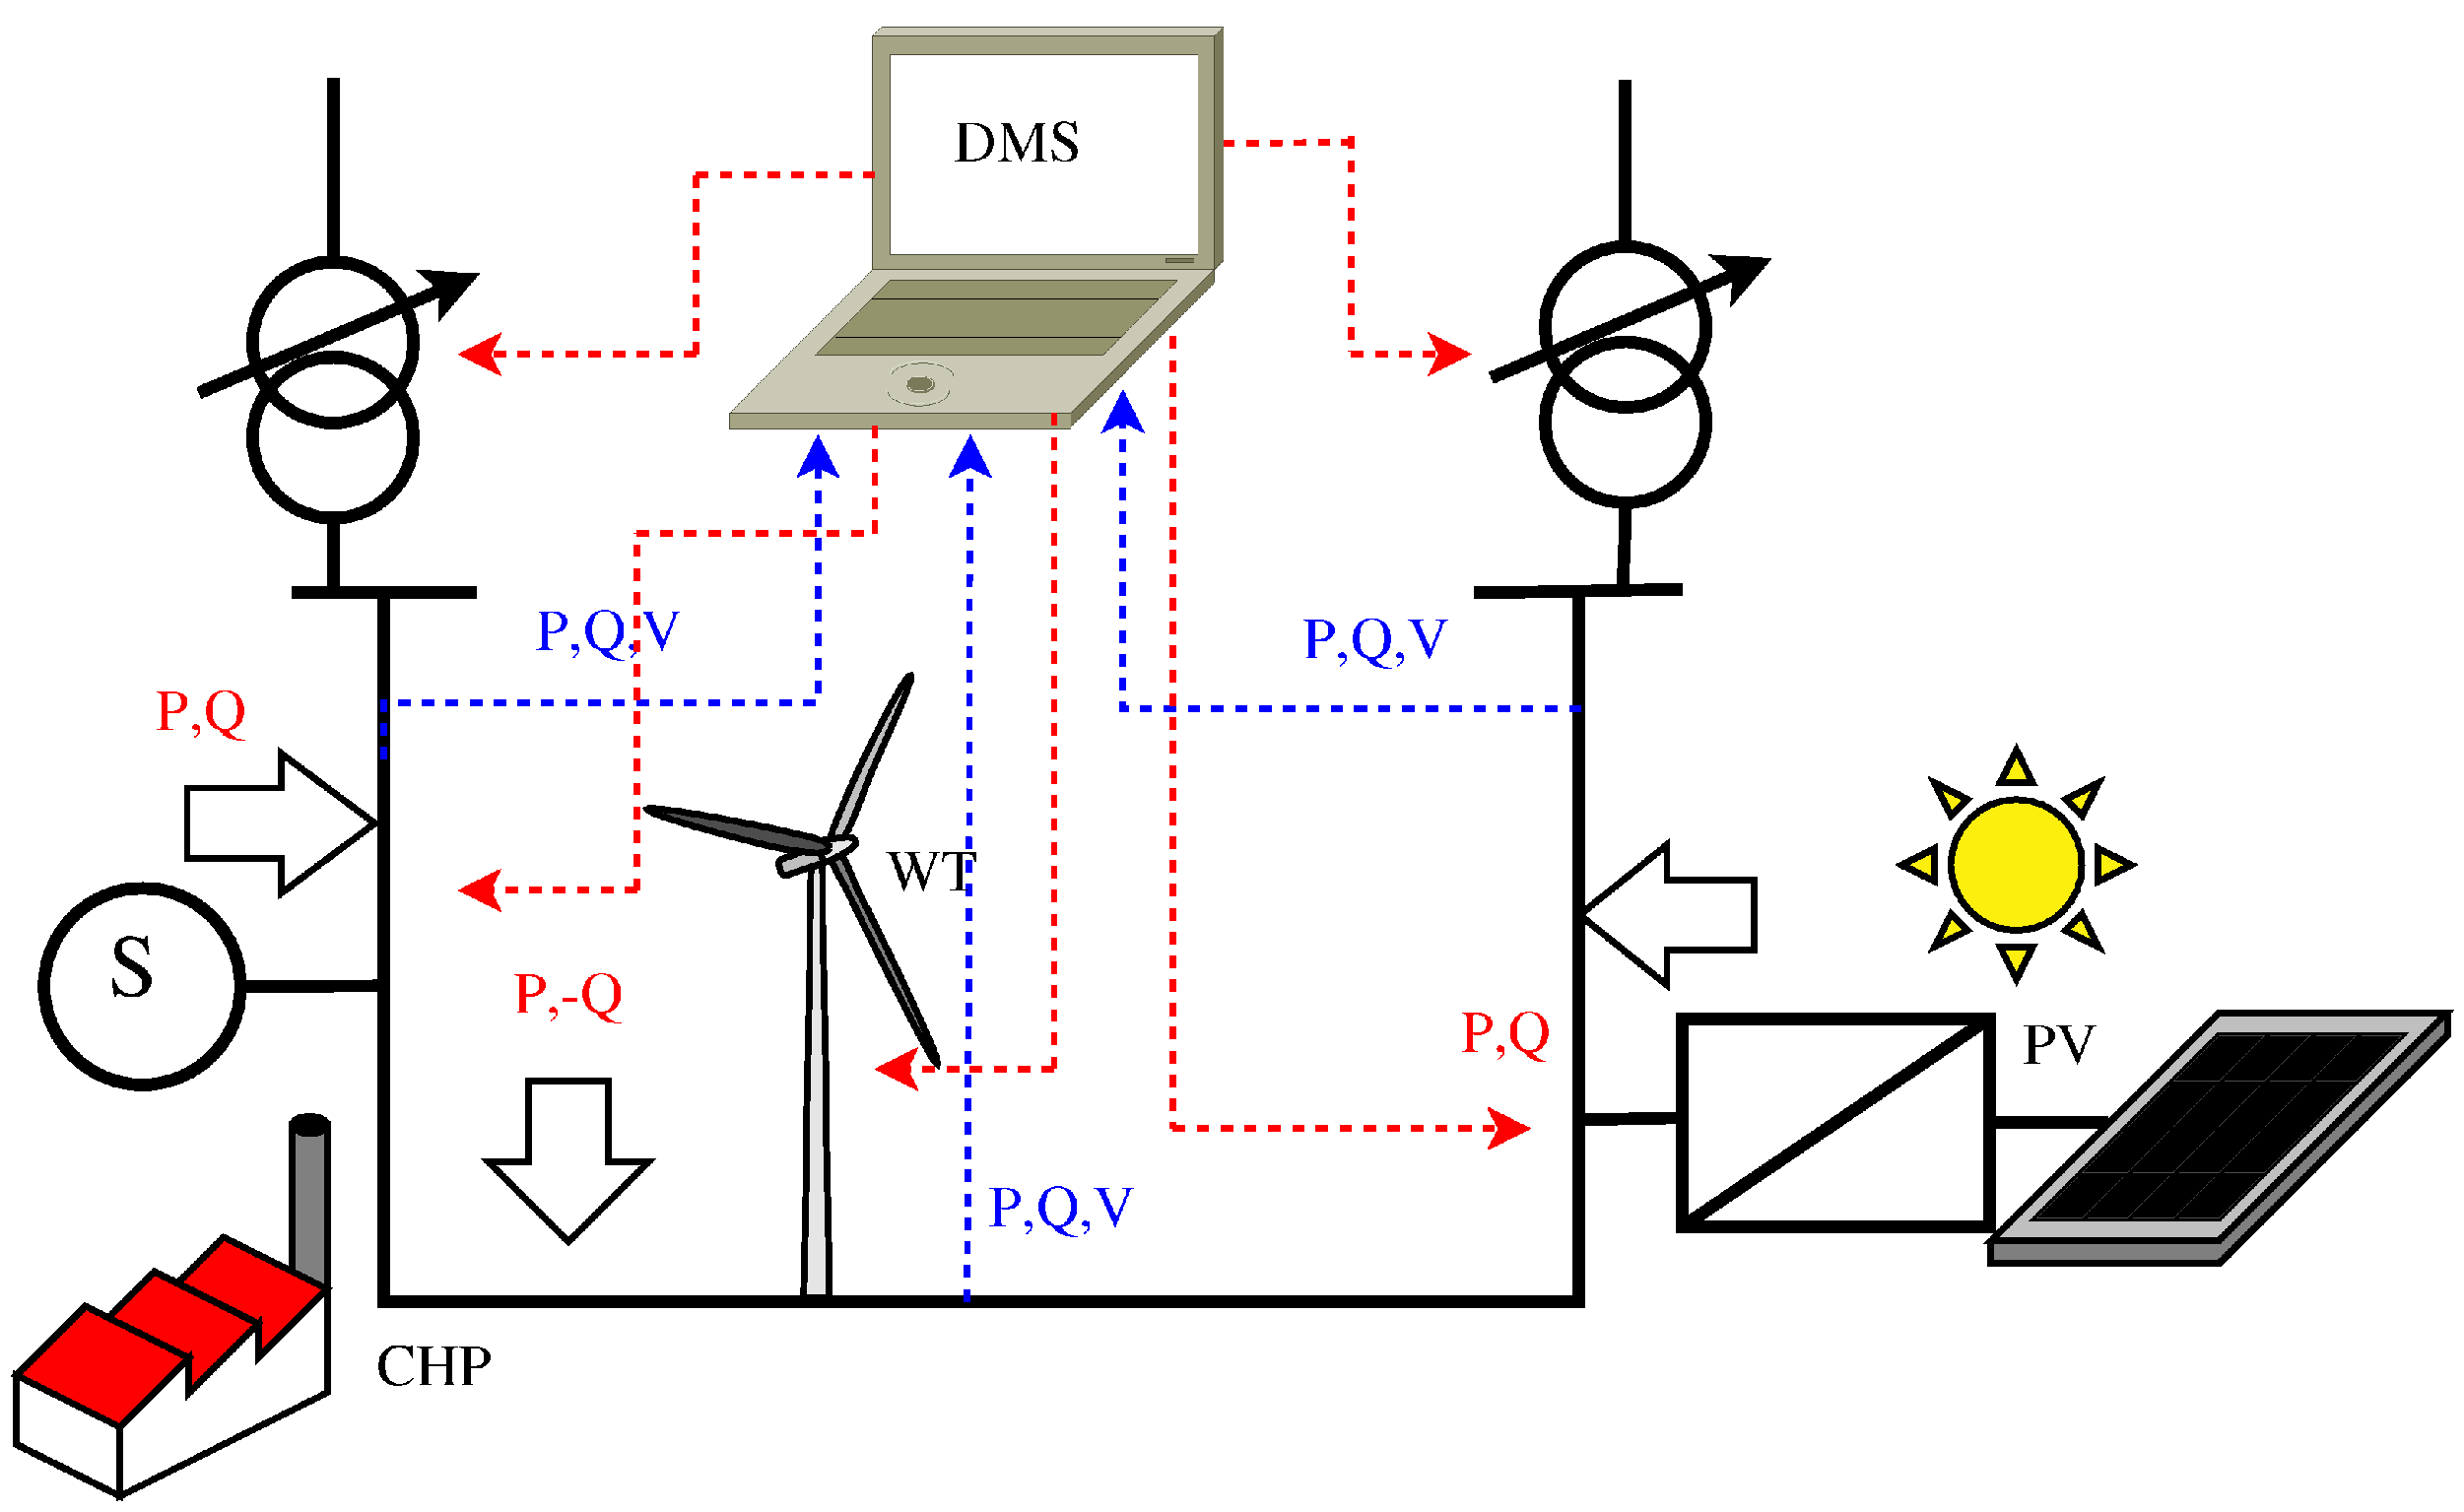
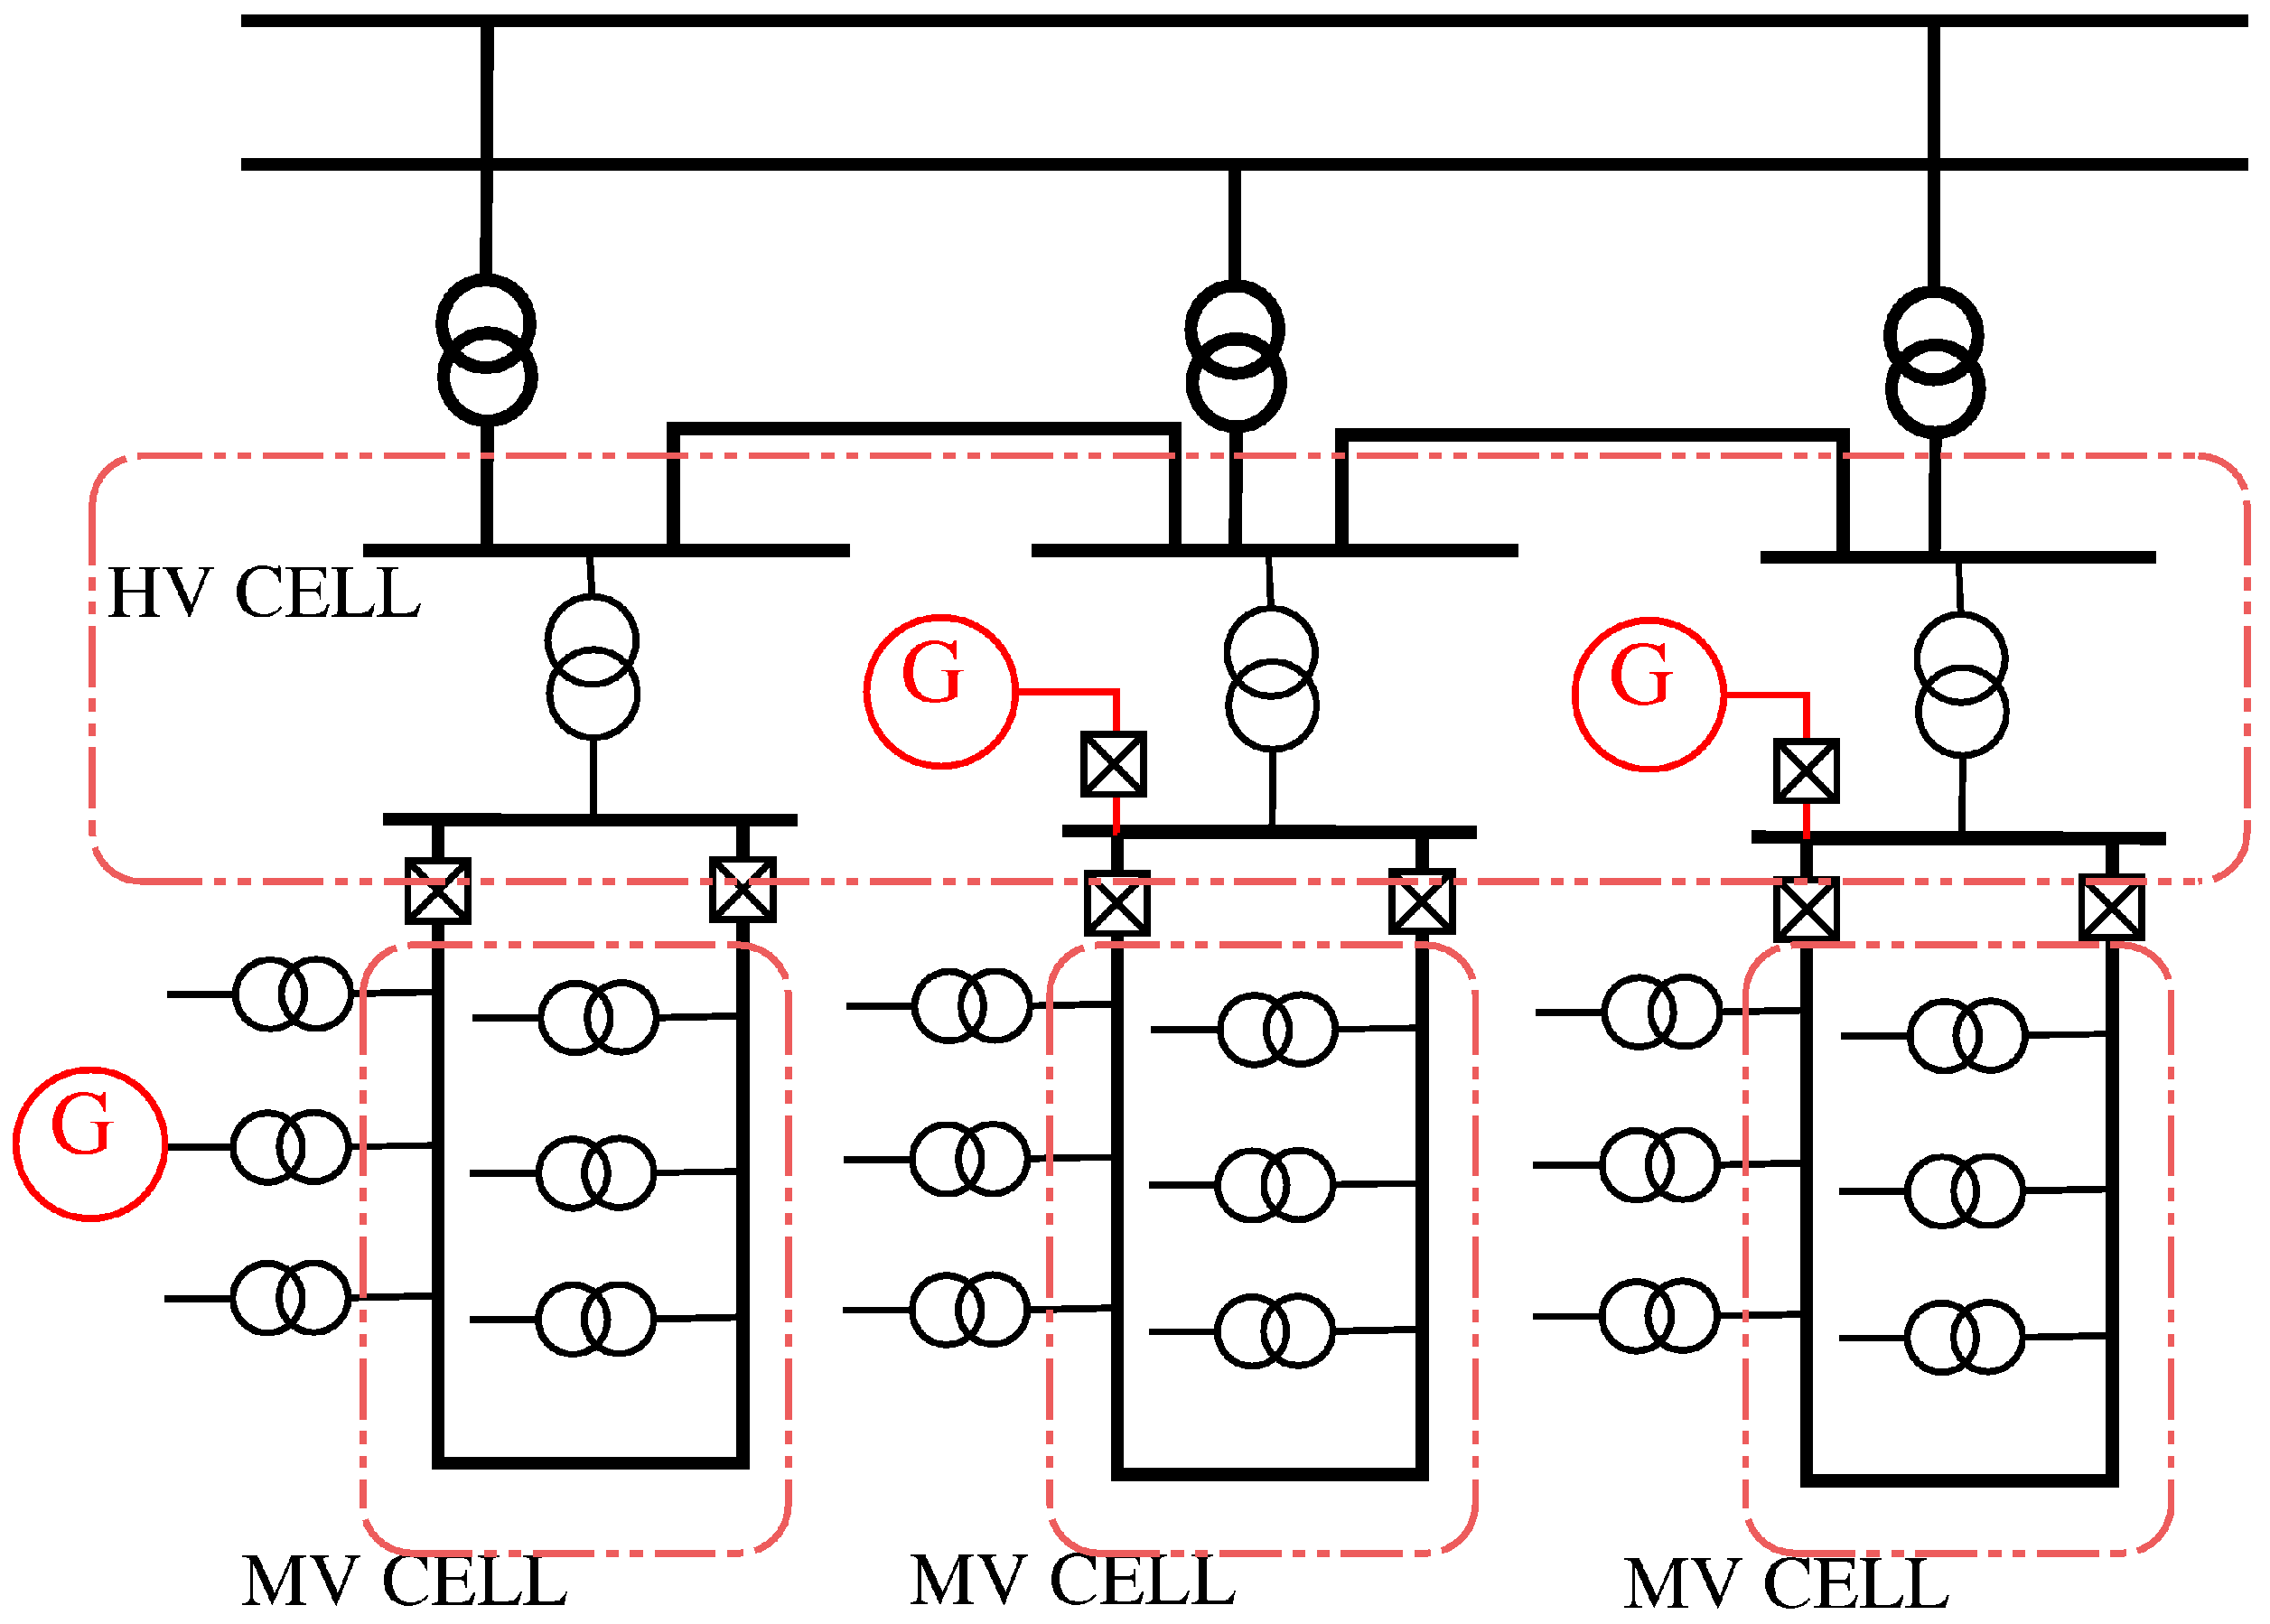
An active grid is a network that does not only play the passive role of supplying final consumers, but also in which the operator controls and/or rules the power required or generated by the loads or the generators, the bus voltages and the branch power flows. It is possible to assume an evolution in three different levels: first level—a simple local control of the generation at the connection point; second level—a complete control system for all the distributed energy resources in the controlled area, realizing a coordinated dispatching and a voltage profile optimization (see Figure 18); third level—creation of a strongly interconnected structure with a subdivision in cells (“local areas”), responsible for their own management (protection, voltage regulation, etc.) that take part in the market, selling or buying energy to/from adjacent cells or from/to the transmission system (see Figure 19).
Figure 18.
Decentralized control: coordinated dispatching and voltage profile optimization.

Figure 19.
Distribution system organized by cells (local areas).

6.2. Micro-Grids
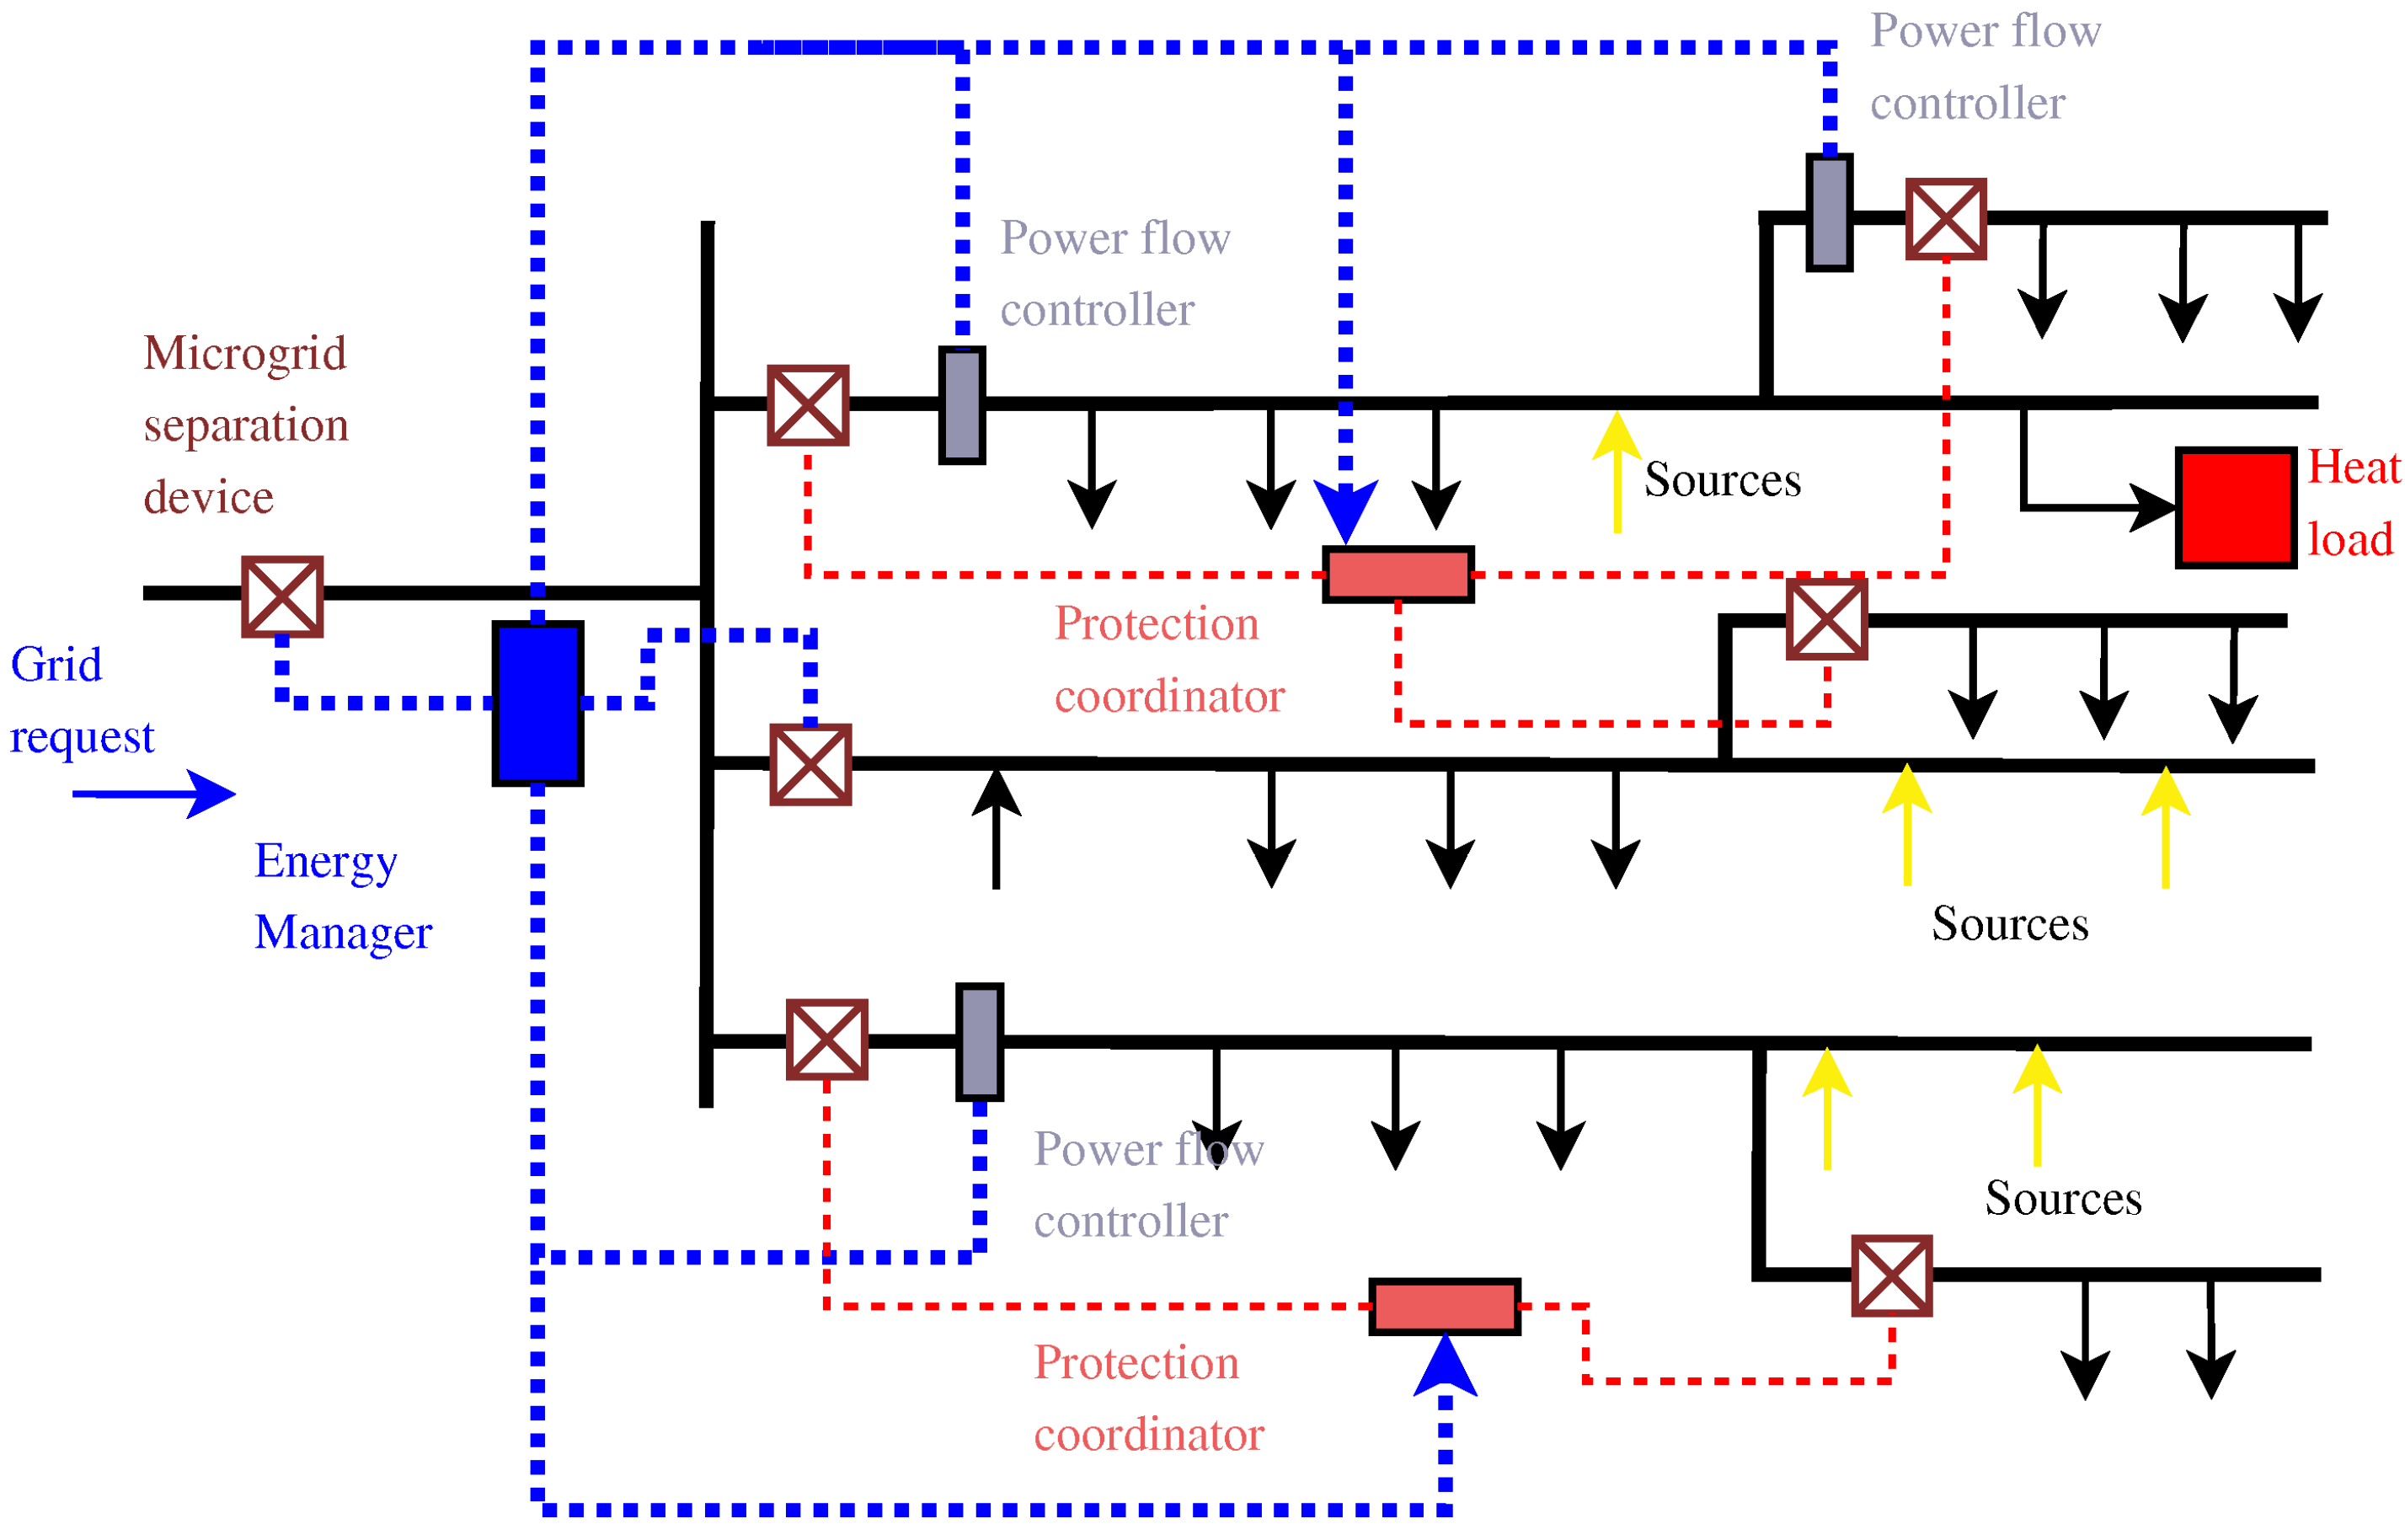
A micro-grid is a set of generators, loads and storage systems connected and able to operate independently from the electrical grid and that internally recreates the energy production and distribution system (see Figure 20). It can be considered similar to the active network cell, since it is provided with a local control system that rules the exchanges of energy among the loads, generators and external network; moreover, it can stay in intentional islanding configuration, disabling the loads that accept to be part of a “load curtailment” program [13,14].
Figure 20.
Example of a micro-grid.

6.3. Virtual Utility
A virtual utility or virtual power plant realizes an optimized management and control of a set of distributed energy resources, in which all distributed generators, loads and storage systems are coordinated, taking into account electric market signals.
Concluding, in all possible scenarios that can be imagined, a very important role will be played by the final users. The key for the development of smart grids concerns the active demand, i.e., the possibility for consumers to actively participate as actors in the electrical system management and control.
7. Conclusions
All the hypothetical scenarios related to smart grids need evolution and development processes involving many aspects, which are today very interesting areas for study and research; in fact, the new challenges that have to be faced concern:
- Technical aspects: new criteria for electrical systems planning, design, control and management;
- Technological aspects: evolution of components, apparatus and systems (both hardware and software);
- Economical and policy-regulatory aspects: free markets, roles and responsibilities of all actors involved, connection rules, load shedding, generation curtailment, etc.;
- Social aspects: energy policies that are really sustainable, environmental impact reduction, energetic resources supplying diversification, the advantage of renewable development, the increase of power and service quality and lower costs for users (real competition).
A real cultural revolution has started, but as already said by Albert Einstein, “We can’t solve problems by using the same kind of thinking we used when we created them”.
Acknowledgments
This work was supported by MIUR (Italian Ministry of University and Research), by the “Sustainable Development and Energy Saving Laboratory” (SDESLAB), part of the UNINETLAB of the University of Palermo, and financially supported by the project BeyWatch IST-223888, funded by the European Community.
References
- European Community. Gas and Electricity Market Statistics-Data 1990–2006; Technical Report; European Community: Luxembourg, 2006. [Google Scholar]
- International Energy Agency Data Services. Guide to Cost-Benefit Analysis of Investment Projects; Technical Report; European Commission: Paris, France, 2002. [Google Scholar]
- TERNA S.P.A. Annual Report 2005; Technical Report; Terna: Roma, Italy, 2005. [Google Scholar]
- Invernizzi, S.; Capasso, W.; Lamedica, A.; Prudenzi, R. Probabilistic Processing of Survey Collected Data in Residential Load Data for Hourly Demand Profile Extimation. In Proceedings of IEEE/TUA Athens Power Conference: “Planning, operation and control of Today’s Electric Power Systems”, Athens, Greece, 5–8 September 1993; pp. 866–870.
- European Commission. European SmartGrids Technology Platform Vision and Strategy for Europe’s Electricity Networks of the Future; Technical Report; European Commission: Louxembourg, 2006. [Google Scholar]
- Capasso, W.; Grattieri, R.; Lamedica, A.; Prudenzi, R. A bottom-up approach to residential load modeling. IEEE Trans. Power Syst. 1994, 9, 957–965. [Google Scholar] [CrossRef]
- Rajan, C. Demand Side Management Using Expert System. In Proceedings of the Conference on Convergent Technologies for Asia-Pacific Region TENCON 2003, Bangalore, India, 15–17 October 2003.
- Miceli, R.; Genduso, F.; La Cascia, D.; Giaconia, C.; Viola, F.; Cosentino, V.; Romano, P.; Ippolito, M.G.; Zizzo, G.; Massaro, F.; Spataro, C.; Di Stefano, A.; Fiscelli, G. Energy Management via Connected Household Appliances; McGraw-Hill: New York, NY, USA, 2008. [Google Scholar]
- Romero, R.; Rocha, R.; Mantovani, M. Analysis of heuristic algorithms for the transportation model in static and multistage planning in network expansion system generation, transmission and distribution. IEE Proc. Gener. Transm. Distrib. 2003, 150, 521–526. [Google Scholar] [CrossRef]
- Miceli, R.; La Cascia, D. Environmental Benefits Through New Distributed on Site Control Actions Inside European Apartments. In Proceedings of the 2008 IEEE 2nd International Power and Energy Conference, Johor Baharu, Malaysia, 1–3 Dececember 2008; pp. 1649–1654. [CrossRef]
- IEEE Distribution Commitee. Planning for effective distribution. IEEE Power Energy Mag. 2003, 3, 54–62. [Google Scholar]
- Newborough, M.; Augood, P. Demand-side management opportunities for the UK domestic sector. IEE Proc. Gener. Transm. Distrib. 1999, 146, 283–293. [Google Scholar] [CrossRef]
- Di Tommaso, A.O.; Favuzza, S.; Genduso, F.; Miceli, R.; Ricco Galluzzo, G. Development of Diagnostic Systems for the Fault Tolerant Operation of Micro-Grids. In Proceedings of the International Symposium on Power Electronics, Electrical Drives, Automation and Motion, Pisa, Italy, 14–16 June 2010. [CrossRef]
- Genduso, F.; Miceli, R.; Favuzza, S. A perspective on the future of distribution: Smart grids, state of the art, benefits and research plans. Energy Power Eng. 2013, 5, 36–42. [Google Scholar] [CrossRef]
© 2013 by the author; licensee MDPI, Basel, Switzerland. This article is an open access article distributed under the terms and conditions of the Creative Commons Attribution license (http://creativecommons.org/licenses/by/3.0/).
Share and Cite
MDPI and ACS Style
Miceli, R. Energy Management and Smart Grids. Energies 2013, 6, 2262-2290. https://doi.org/10.3390/en6042262
AMA Style
Miceli R. Energy Management and Smart Grids. Energies. 2013; 6(4):2262-2290. https://doi.org/10.3390/en6042262
Chicago/Turabian StyleMiceli, Rosario. 2013. "Energy Management and Smart Grids" Energies 6, no. 4: 2262-2290. https://doi.org/10.3390/en6042262